movements and behaviour of yellowfin and bigeye tuna...
TRANSCRIPT

Received: 6 October
IOTC–2017–WPTT19–25
Movements and behaviour of yellowfin and bigeye tuna associated to
oceanic structures in the western Indian Ocean
Philippe S. Sabarros1,*, Evgeny V. Romanov2 and Pascal Bach3
1Institut de Recherche pour le Développement (IRD), UMR 248 Marine Biodiversity, Exploitation
& Conservation (MARBEC), Observatoire des Ecosystèmes Pélagiques Tropicaux Exploités (Ob7),
Avenue Jean Monnet, CS 30171, 34203 Sète Cedex, France
2Centre technique d’Appui à la Pêche Réunionnaise (CAP RUN) – Hydrô Réunion, Magasin n°10,
Darse de pêche hauturière, Port Ouest, 97420 Le Port, Reunion Island
3Institut de Recherche pour le Développement (IRD), UMR 248 Marine Biodiversity, Exploitation
& Conservation (MARBEC), Observatoire des Ecosystèmes Pélagiques Tropicaux Exploités (Ob7),
Seychelles Fisheries Authorities (SFA), BP 570, Victoria, Seychelles
*corresponding author, email [email protected]
ABSTRACT
We present here preliminary results of PSAT tagging experiments conducted on bigeye
tuna Thunnus obesus and yellowfin tuna Thunnus albacares in the western Indian Ocean.
We analysed in this paper the horizontal movements and behaviour of the both tuna species
associated to oceanic structures such as mesoscale eddies and fronts.
KEYWORDS
PSAT tagging | Horizontal movements | Oceanic structures | Fronts | Eddies | Thermocline
| Yellowfin tuna | Bigeye tuna | western Indian Ocean

IOTC–2017–WPTT19–25
Page 2 of 14
1. Introduction
Bigeye tuna Thunnus obesus and yellowfin tuna Thunnus albacares are common tuna species in
tropical regions where they are targeted by various fishing gears, mainly purse-seine and longline.
The regional ecology of yellowfin and bigeye tuna in the Indian Ocean: vertical behavior, habitat
preferences, and migrations, is still poorly known despite previous attempts to deploy pop-up satellite
archival tags (PSATs) on yellowfin tuna at least (in the BIOT: Schallert et al., 2013; in the Arabian
Sea and Bay of Bengal: Premchand et al., 2014, Bright et al. 2017; off Zanzibar and Maldives, IOTC
unpublished data).
Between November 2014 and July 2015, we tagged 32 yellowfin and 15 bigeye tuna with PSATs in
the western Indian Ocean (Reunion Island waters, east coast of Madagascar and Saya-de-Malha Bank)
to study the vertical movements, behavioor, habitat preferences and horizontal migrations of these
two tuna species within the framework of IRD and CAP RUN research project PROSPER
(PROSpection and habitat of large PElagic fish in the EEZ of Réunion Island) funded by EU (Sabarros
et al., 2015).
The vertical behaviour and habitat use of yellowfin and bigeye tuna is described in Sabarros et al.
(2015), and we present here the horizontal movements of both tuna species and associated behaviour
with hydrodynamic structures of the ocean.
2. Material and Methods
2.1. Tags
Two types of PSATs were used in our tagging experiments: miniPAT by Wildlife Computers Inc.
(Seattle, USA) and LAT3400 by Lotek Wireless Inc. (St. John's, Newfoundland, Canada). We present
in this paper data collected by miniPAT tags from which we removed premature releases under 15
days and tags that were predated by sharks (Romanov et al., in prep), leaving a total of 16 available
tags (Table 1).
MiniPAT tags were programmed to record depth, temperature and light for time periods between 90
and 180 days (Table 1). Depth time series (5-min interval for 90 days deployments, 10-min interval
for 180 days) was programmed to be always transmitted by satellite, as well as light levels recorded
during twilight periods (used for geolocation), and summarized data such as histograms of binned
depth (0-10; 10-30; 50 30; 50-100; 100-150; 150-200; 200-250; 250-300; 300-500; 500-800; >800 m;
with 4-hour interval) and binned temperature (0-3; 3-6; 6-9; 9-12; 12-15; 15-18; 18-21; 21-24; 24-27;
27-30; 30-33; >33°C; with 4-hour interval), and profiles of depth and temperature (PDT; 4-hour
interval).

IOTC–2017–WPTT19–25
Page 3 of 14
2.2. Tuna tagging
Among the 27 miniPATs that already transmitted data, 17 were deployed on yellowfin tuna (91-164
cm FL) and 10 on bigeye tuna (101-141 cm FL) at the occasion of 3 tagging cruises carried out by
IRD and CAP RUN (PROSPER research project) in the western Indian Ocean (Saya-de-Malha Bank,
east coast of Madagascar and Reunion Island waters) in 2015 onboard French commercial longline
vessel Le Bigouden (21.4 m LOA) (Fig. 1). Tuna were caught using short longline gear (average 313
hooks, range 278-479 hooks) with squid-baited hooks (in 5 sets we used a mix of squid and mackerel
bait). The longline was deployed in surface layers during crepuscular periods: dusk and dawn. Very
short drifting (period between end of setting and start of hauling, average 3.1 hours, range 1.9-4.0)
and soaking time (average 7.5 hours, range 5.9-10.5) were used to maximize the chance of catching
tuna alive. Also, branchlines were equipped with circle hooks in order to reduce potential hooking
injury. We realized 36 fishing operations over 39 days at sea.
Tuna candidates for tagging were brought onto the deck of the boat using a lifting flexible cradle. To
keep the tuna calm inside the cradle while on vessel deck, the eyes of the fish were covered with wet
soft synthetic cloth. In most cases a hose with running seawater was immediately placed in the tuna's
mouth to ensure gills oxygenation. After removing the hook and ensuring the tuna was in good
condition (active fish, with no gill, mouth or gut bleeding, no serious external or eyes injury, etc.),
we inserted the tag anchor below the base second dorsal fin through the pterygiophores using an
applicator provided by the tag manufacturer. In addition, an IOTC spaghetti tag was placed below the
base of the first dorsal fin. The tagged tuna was then measured and carefully released into the ocean
using the lifting cradle.
2.3. Horizontal movements
Horizontal movements are presented in two ways. First, based on straight distances between tagging
and tag pop-up locations to appreciate the dispersion over the deployment, and secondly as tracks
estimated by Wildlife Computers Global Position Estimator 3 (GPE3) (Table 1; Figure 1). GPE3 is a
state-space model that uses observations of twilight, sea surface temperature and dive depth to
generate time-discrete and gridded probability surfaces from which can be derived the animal most
likely location (Wildlife Computers, 2015). Tracks shown in Figure 1 are the most likely positions
calculated using 3 m.s-1 as the maximum daily speed in the GPE3 model.
Dispersion was defined and calculated as the straight distance between tagging and popup locations
divided by the number of days at sea. Displacement was defined as the total horizontal distance
travelled using GPE3 tracks, and the displacement rate as this total distance divided by the number
of days at sea. Summary results comparing both species are presented in Figure 2.

IOTC–2017–WPTT19–25
Page 4 of 14
2.4. Vertical behaviour
Figure 3 illustrates an individual tag deployment (#142826) including the depth profile time series,
and interpolated temperature time series with day/night discrimination (see details in Sabarros et al.,
2015). Temperature time series (that is not transmitted) was reconstructed by interpolation using
Profile of Depth and Temperature data (PDT provided for 4-hour intervals) and depth time series (5-
min interval).
PDT was also used to display the vertical thermal structure of the water column and to calculate the
isothermal layer depth (ILD = thermocline; Kara et al., 2000) (Figure 4).
2.5. Environmental data
Temperature (at depth) and Sea Surface Height (SSH) data were extracted from Global Ocean Physics
Reanalysis (GLORYS2V4) data product provided by EU Copernicus Marine Environment
Monitoring Service (CMEMS; http://marine.copernicus.eu). GLORYS2V4 contains daily means of
Temperature, Salinity, Currents, SSH, and Sea Ice, at 0.25° horizontal resolution, with 75 vertical
levels, forced by ERA-Interim atmospheric variables and covering the 1993-2015 time period, with
SEEK/IAU data assimilation of Temperature and Salinity profiles as well as Sea Level Anomalies,
Sea Ice Concentration, Sea Surface Temperature and Mixed Layer Depth (CMEMS, 2017).
GLORYS temperature (Tmodel) data were extracted along each individual track integrating the depth
component (no interpolation was made). Tmodel was then compared to Tinsitu that refers the temperature
recorded by the tag itself (Appendix 1). Tinsitu was interpolated from PDT data products as described
in section 2.4. The purpose of this comparison was to validate both the estimated tracks and the overall
GLORYS2V4 dataset that we used.
SSH was extracted along the track with no interpolation and presented in Figure 3.
3. Results
3.1. Horizontal movements: dispersion versus displacement
Tags pop-up locations demonstrate wide dispersion in the western Indian Ocean: from limited
displacements within tagging areas to long-distance migrations towards the South Africa or towards
the equator, Mauritius and Seychelles (Figure 1). The longest distance travelled was observed for a
YFT (#142826): 3414 km in 54 days, i.e., an average speed of about 63 km.d-1. Comparable speeds
were recorded for several other YFT tracked for shorter periods (Table 1). Bigeye tuna also
demonstrated several long-distant movements: 4570 km and 4190 km with average speeds of 51 and
52 km.d-1 respectively (Table 1). Displacement rate, i.e., migratory activity of YFT was more
pronounced but also more variable than for BET (Figure 2). In general, dispersion from
tagging/release locations was reduced in BET compared to YFT (Figure 2; Table 1).
IOTC–2017–WPTT19–25
Page 5 of 14
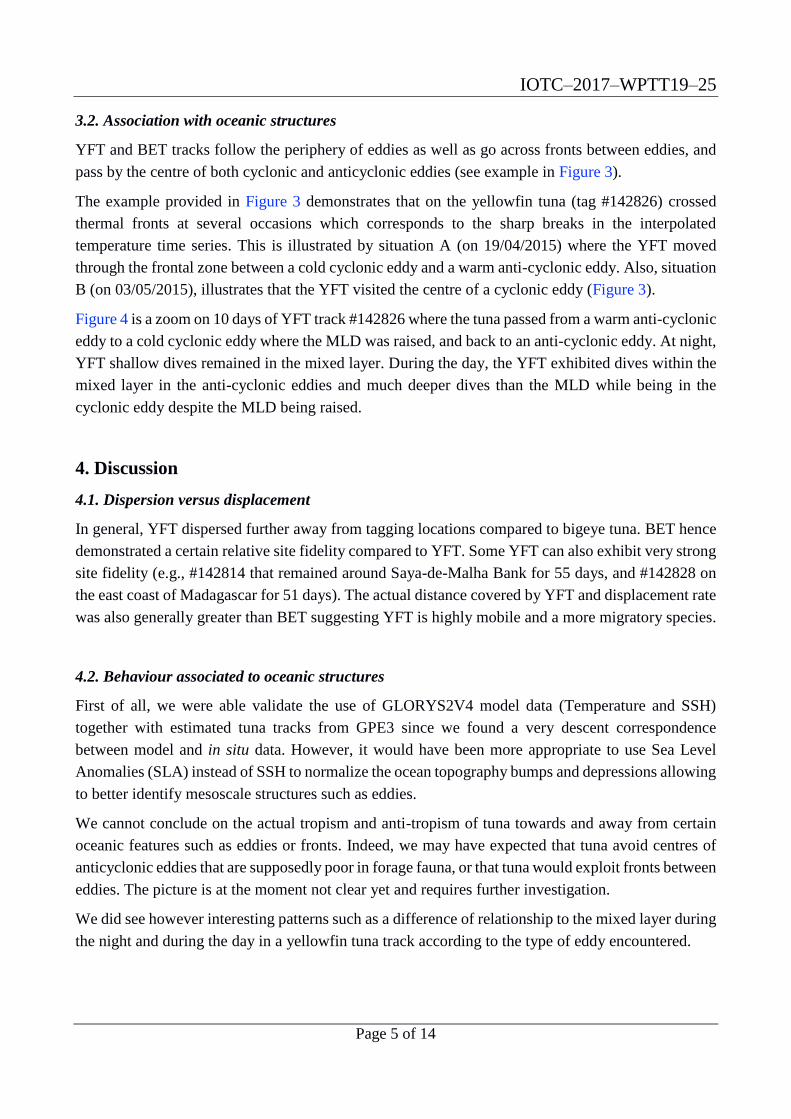
3.2. Association with oceanic structures
YFT and BET tracks follow the periphery of eddies as well as go across fronts between eddies, and
pass by the centre of both cyclonic and anticyclonic eddies (see example in Figure 3).
The example provided in Figure 3 demonstrates that on the yellowfin tuna (tag #142826) crossed
thermal fronts at several occasions which corresponds to the sharp breaks in the interpolated
temperature time series. This is illustrated by situation A (on 19/04/2015) where the YFT moved
through the frontal zone between a cold cyclonic eddy and a warm anti-cyclonic eddy. Also, situation
B (on 03/05/2015), illustrates that the YFT visited the centre of a cyclonic eddy (Figure 3).
Figure 4 is a zoom on 10 days of YFT track #142826 where the tuna passed from a warm anti-cyclonic
eddy to a cold cyclonic eddy where the MLD was raised, and back to an anti-cyclonic eddy. At night,
YFT shallow dives remained in the mixed layer. During the day, the YFT exhibited dives within the
mixed layer in the anti-cyclonic eddies and much deeper dives than the MLD while being in the
cyclonic eddy despite the MLD being raised.
4. Discussion
4.1. Dispersion versus displacement
In general, YFT dispersed further away from tagging locations compared to bigeye tuna. BET hence
demonstrated a certain relative site fidelity compared to YFT. Some YFT can also exhibit very strong
site fidelity (e.g., #142814 that remained around Saya-de-Malha Bank for 55 days, and #142828 on
the east coast of Madagascar for 51 days). The actual distance covered by YFT and displacement rate
was also generally greater than BET suggesting YFT is highly mobile and a more migratory species.
4.2. Behaviour associated to oceanic structures
First of all, we were able validate the use of GLORYS2V4 model data (Temperature and SSH)
together with estimated tuna tracks from GPE3 since we found a very descent correspondence
between model and in situ data. However, it would have been more appropriate to use Sea Level
Anomalies (SLA) instead of SSH to normalize the ocean topography bumps and depressions allowing
to better identify mesoscale structures such as eddies.
We cannot conclude on the actual tropism and anti-tropism of tuna towards and away from certain
oceanic features such as eddies or fronts. Indeed, we may have expected that tuna avoid centres of
anticyclonic eddies that are supposedly poor in forage fauna, or that tuna would exploit fronts between
eddies. The picture is at the moment not clear yet and requires further investigation.
We did see however interesting patterns such as a difference of relationship to the mixed layer during
the night and during the day in a yellowfin tuna track according to the type of eddy encountered.

IOTC–2017–WPTT19–25
Page 6 of 14
4.3. Perspectives
For both species, we will continue investigating possible interactions and/or use of oceanographic
structures such as fronts, eddies, etc., as well as with the mixed layer, and the potential effect of
dissolved oxygen concentration.
5. Acknowledgements
PSS and PB thank EU FEP for funding research project PROSPER 2 including tags and tagging
campaigns. Participation of EVR to tagging cruises was ensured by PELICAN project funded by
Region Reunion. We thank Adrien Chevallier and all boat crews that were involved in tagging cruises.
6. References
Bright, R., Swetha, N., Baliarsingh, S.K., Nimit, K., M, N.K., T, S.K., Dwivedi, R., Shenoi, S.C.,
2017. Satellite telemetry of Yellowfin tuna feeding migration: a case study in southwestern Bay
of Bengal. Marine Geodesy 00–00. doi:10.1080/01490419.2017.1327907
CMEMS, 2017. GLOBAL OCEAN PHYSICS REANALYSIS GLORYS2V4 (1993-2015) Product
data sheet.
Kara, A.B., Rochford, P.A., Hurlburt, H.E., 2000. An optimal definition for ocean mixed layer depth.
Journal of Geophysical Research 105, 16803–16821.
Premchand, M.S., Tiburtius, A., Sanadi, R.B., Tailor, R.B., 2014. India’s National Report to the
Scientific Committee of the Indian Ocean Tuna Commission, 2014, in: IOTC-2014-SC17-
NR09. Presented at the 17th IOTC Scientific Commitee, Victoria, Seychelles.
Romanov, E.V., Sabarros, P.S., Bach, P., in prep. Shark habitat use and behaviour inferred from
predated popup satellite archival tags equipped on tuna.
Sabarros, P.S., Romanov, E.V., Bach, P., 2015. Vertical behavior and habitat preferences of yellowfin
and bigeye tuna in the South West Indian Ocean inferred from PSAT tagging data, in: IOTC–
2015–WPTT17–42 Rev_1. Presented at the 17 th Session of the IOTC Working Party on
Tropical Tunas, Montpellier, France.
Schallert, R., Block, B., Tickler, D., 2013. Tagging of Pelagics - British Indian Ocean Territory.
Foundation Bertarelli, Gstaad, Switzerland.
Wildlife Computers, 2015. Data Portal’s Location Processing (GPE3 & FastLoc-GPS) User Guide.

IOTC–2017–WPTT19–25
Page 7 of 14
7. Tables
Table 1. Summary of tag deployments. FL: fork length in cm. Dispersion rate (km.d-1) is the direct distance between tagging and popup
locations divided by days at sea. Displacement (km) and displacement rate (km.d-1) are the total track distance and average distance per day.
Manufacturer Manufacturer Id PTT Program Anchor Species FL (cm) Tagging date Popup date Days at sea Dispersion (km.d-1) Total distance (km) Displacement rate (km.d-1) Exclusion
Wildlife Computers 14P0458 142807 90d Wilton YFT 162 2015-02-18 2015-02-24 6 - - - Deployment < 15d
Wildlife Computers 14P0417 142808 90d Wilton BET 101 2015-04-02 - - - - - Did not transmit
Wildlife Computers 14P0418 142809 180d Wilton YFT 126 2015-02-18 2015-02-23 5 - - - Deployment < 15d
Wildlife Computers 14P0443 142810 90d Wilton BET 141 2015-02-16 2015-02-20 4 - - - Deployment < 15d
Wildlife Computers 14P0444 142811 180d Wilton YFT 140 2015-02-21 2015-04-09 47 - - - Predated tag
Wildlife Computers 14P0445 142812 90d Wilton YFT 92 2015-02-18 2015-02-25 7 - - - Predated tag
Wildlife Computers 14P0447 142813 90d Wilton YFT 148 2015-02-21 2015-03-03 10 - - - Deployment < 15d
Wildlife Computers 14P0454 142814 90d Wilton YFT 91 2015-02-21 2015-04-17 55 1 1845 34
Wildlife Computers 14P0455 142815 90d Wilton YFT 160 2015-02-18 - - - - - Did not transmit
Wildlife Computers 14P0456 142816 90d Wilton YFT 131 2015-02-17 2015-03-05 16 37 969 61
Wildlife Computers 14P0569 142817 90d Wilton YFT 118 2015-03-29 2015-06-08 71 22 3539 50
Wildlife Computers 14P0571 142818 90d Wilton YFT 107 2015-03-31 2015-05-10 40 4 1498 37
Wildlife Computers 14P0574 142819 90d Wilton YFT 164 2015-03-28 2015-04-05 8 - - - Deployment < 15d
Wildlife Computers 14P0578 142820 90d Wilton BET 126 2015-03-31 - - - - - Did not transmit
Wildlife Computers 14P0581 142821 180d Wilton YFT 95 2015-03-31 2015-04-08 8 - - - Deployment < 15d
Wildlife Computers 14P0583 142822 90d Wilton BET 107 2015-04-02 2015-07-01 90 4 3807 42
Wildlife Computers 14P0584 142823 90d Wilton YFT 154 2015-03-30 2015-04-30 31 22 2024 65
Wildlife Computers 14P0585 142824 90d Domeier BET 104 2015-03-29 2015-06-27 90 4 3949 44
Wildlife Computers 14P0586 142825 90d Wilton BET 119 2015-03-30 2015-06-07 69 2 3296 48
Wildlife Computers 14P0587 142826 180d Wilton YFT 158 2015-03-30 2015-05-23 54 38 3414 63
Wildlife Computers 14P0590 142827 90d Wilton BET 118 2015-03-29 2015-06-02 65 4 2766 43
Wildlife Computers 14P0591 142828 90d Wilton YFT 119 2015-03-29 2015-05-19 51 1 2283 45
Wildlife Computers 14P0598 142829 180d Domeier YFT 151 2015-03-30 2015-05-20 51 2 2223 44
Wildlife Computers 14P0600 142830 180d Domeier BET 141 2015-04-02 2015-07-15 104 - - - Odd behaviour
Wildlife Computers 14P0604 142831 90d Wilton BET 122 2015-04-02 2015-07-01 90 4 4570 51
Wildlife Computers 14P0606 142832 90d Domeier YFT 156 2015-03-29 2015-05-04 36 25 1520 42
Wildlife Computers 14P0745 150814 90d Domeier BET 122 2015-07-12 2015-10-10 90 9 3326 37
Wildlife Computers 14P0797 150815 90d Domeier BET 119 2015-07-16 2015-08-03 18 - - - Predated tag
Wildlife Computers 15P0001 150816 90d Domeier BET 128 2015-07-17 2015-10-06 81 16 4190 52
Wildlife Computers 15P0006 150817 90d Domeier BET 127 2015-07-17 - - - - - Did not transmit

IOTC–2017–WPTT19–25
Page 8 of 14
8. Figures

IOTC–2017–WPTT19–25
Page 9 of 14
Figure 1. Horizontal
movements of yellowfin (YFT)
and bigeye tuna (BET)
estimated using GPE3
developed by Wildlife
Computers. Open circles and
triangles represent tagging and
popup locations respectively.
The dotted line represents the
dispersion from the tagging
location.

IOTC–2017–WPTT19–25
Page 10 of 14
Figure 1 (continued).
Horizontal movements of
yellowfin (YFT) and bigeye
tuna (BET) estimated using
GPE3 developed by Wildlife
Computers. Open circles and
triangles represent tagging and
popup locations respectively.
The dotted line represents the
dispersion from the tagging
location.

IOTC–2017–WPTT19–25
Page 11 of 14
Figure 2. Dispersion rate (km.d-1) and displacement (km.d-1) of yellowfin (YFT; n = 9) and bigeye
tuna (BET; n = 7). White numbers are median values.

IOTC–2017–WPTT19–25
Page 12 of 14
Figure 3. Depth, in situ temperature and sea surface height (SSH) profiles for yellowfin tuna tag
#142826 and horizontal movements at day 21 (19/04/2015; Situation A) and day 35 (03/05/2015;
Situation B). Track for a given day is the solid thick line, while the fine solid line represents the past
track. Red and blue sections on depth and temperature profiles represent respectively day and night.

IOTC–2017–WPTT19–25
Page 13 of 14
Figure 4. Zoom on thermal structure of the water column and associated night dives (upper panel)
and day dives (bottom panel) of yellowfin tuna tag #142826 between 11/05/2015 and 21/05/2015.

IOTC–2017–WPTT19–25
Page 14 of 14
9. Appendices
Appendix 1. Examples of Tinsitu versus Tmodel for YFT #142823 and BET #150816. The broken line
is the theoretical 1:1 regression. The solid line is the linear regression between the two variables for
which parameters are provided in the upper left corner of the plots.