tyrosyl phosphorylation of kras stalls gtpase cycle via
TRANSCRIPT

ARTICLE
Tyrosyl phosphorylation of KRAS stalls GTPasecycle via alteration of switch I and II conformationYoshihito Kano1,2, Teklab Gebregiworgis 3, Christopher B. Marshall3, Nikolina Radulovich4, Betty P.K. Poon1,
Jonathan St-Germain3, Jonathan D. Cook1, Ivette Valencia-Sama1,5, Benjamin M.M. Grant3,
Silvia Gabriela Herrera6, Jinmin Miao7, Brian Raught3, Meredith S. Irwin5, Jeffrey E. Lee1, Jen Jen Yeh6,8,9,
Zhong-Yin Zhang7, Ming-Sound Tsao 4, Mitsuhiko Ikura3 & Michael Ohh 1,2
Deregulation of the RAS GTPase cycle due to mutations in the three RAS genes is commonly
associated with cancer development. Protein tyrosine phosphatase SHP2 promotes RAF-to-
MAPK signaling pathway and is an essential factor in RAS-driven oncogenesis. Despite the
emergence of SHP2 inhibitors for the treatment of cancers harbouring mutant KRAS, the
mechanism underlying SHP2 activation of KRAS signaling remains unclear. Here we report
tyrosyl-phosphorylation of endogenous RAS and demonstrate that KRAS phosphorylation via
Src on Tyr32 and Tyr64 alters the conformation of switch I and II regions, which stalls
multiple steps of the GTPase cycle and impairs binding to effectors. In contrast, SHP2
dephosphorylates KRAS, a process that is required to maintain dynamic canonical KRAS
GTPase cycle. Notably, Src- and SHP2-mediated regulation of KRAS activity extends to
oncogenic KRAS and the inhibition of SHP2 disrupts the phosphorylation cycle, shifting the
equilibrium of the GTPase cycle towards the stalled ‘dark state’.
https://doi.org/10.1038/s41467-018-08115-8 OPEN
1 Department of Laboratory Medicine and Pathobiology, University of Toronto, 661 University Avenue, Toronto, ON M5G 1M1, Canada. 2 Department ofBiochemistry, University of Toronto, 661 University Avenue, Toronto, ON M5G 1M1, Canada. 3 Princess Margaret Cancer Centre, University Health Networkand Department of Medical Biophysics, University of Toronto, 101 College Street, Toronto, ON M5G 1L7, Canada. 4 Princess Margaret Cancer Centre,University Health Network and Department of Pathology, University of Toronto, Toronto, ON M5G 1L7, Canada. 5 Peter Gilgan Centre for Research andLearning, The Hospital for Sick Children, 686 Bay Street, Toronto, ON 5G OA4, Canada. 6 Lineberger Comprehensive Cancer Center, University of NorthCarolina, Chapel Hill, NC 27599, USA. 7Department of Medicinal Chemistry and Molecular Pharmacology, Center for Cancer Research and Institute for DrugDiscovery, Purdue University, 720 Clinic Drive, West Lafayette, IN 47907, USA. 8Department of Surgery, University of North Carolina, Chapel Hill, NC27599, USA. 9 Department of Pharmacology, University of North Carolina, Chapel Hill, NC 27599, USA. These authors contributed equally: Yoshihito Kano,Teklab Gebregiworgis, Christopher B. Marshall. Correspondence and requests for materials should be addressed to M.O. (email: [email protected])
NATURE COMMUNICATIONS | (2019) 10:224 | https://doi.org/10.1038/s41467-018-08115-8 | www.nature.com/naturecommunications 1
1234
5678
90():,;

Deregulation of the RAS GTPase cycle due to mutations inRAS is commonly associated with cancer initiation andprogression and several developmental syndromes,
referred to as “RASopathies”1. While there are three human RASgenes (HRAS, NRAS, and KRAS) that encode highly related188–189 amino acid proteins, KRAS is the most frequentlymutated oncogene in human cancers, accounting for up to 25% oflung, 40% of colorectal, and 95% of pancreatic cancers2. RAS is asmall GTPase protein that cycles between GDP-loaded inactiveand GTP-loaded activated forms, which adopt distinct con-formations at switch I (residues 30–38) and switch II (59–72)regions near the nucleotide-binding site3. RAS is activated byguanine nucleotide-exchange factors (GEFs) and the GTP-boundform binds and activates effector proteins, such as RAF. RASactivation is terminated by hydrolysis of GTP, which is acceler-ated by GTPase-activating proteins (GAPs); however, this step ofthe GTPase cycle is impaired by most oncogenic RAS mutations4.
We previously showed that c-Src (henceforth referred to as Src)binds to and phosphorylates H/NRAS, which was associated withRAF displacement and the attenuation of downstream mitogen-activated extracellular signal-regulated kinase (MEK)-to-extra-cellular signal–regulated kinase (ERK) and phosphoinositide-3kinase-to-AKT signaling5. Conversely tyrosyl-phosphorylated H/NRAS (pH/NRAS) can be dephosphorylated by SHP2 proteintyrosine phosphatase (PTP), which restores H/NRAS binding toRAF and reactivates downstream signaling6. We further showedthat pharmacologic inhibition of SHP2 activity attenuates theprogression of spontaneous glioblastoma in a mutant HRASknock-in glioma mouse model6. These results taken togethersupport the notion that one of the SHP2 functions is as a directactivator of RAS. Subsequently, a recent series of reports havedemonstrated that inhibition of SHP2 suppresses the growth ofmutant KRAS-driven lung cancer7 and pancreatic ductal adeno-carcinoma (PDAC)8,9, as well as gastroesophageal cancer withamplification of otherwise wild-type (WT) KRAS10. Anotherproposed model is that inhibition of SHP2 disrupts GTP loadingof RAS by the GEF Son of Sevenless 1 (SOS1), suggesting thatSHP2 functions by coordinating adaptor proteins on the cellmembrane11. However, it remains unclear how SHP2 preciselyregulates KRAS-to-mitogen-activated protein kinase (MAPK)pathway since oncogenic KRAS mutations confer resistance toGAPs and most would therefore exhibit elevated GTP loadingeven in the absence of SOS activity4,12.
Here, using real-time nuclear magnetic resonance (NMR) andmass spectrometry (MS), we show definitively that KRAS isphosphorylated via Src on Tyr32 and Tyr64, which alters theconformation of switch I and II regions, respectively, negativelyimpacting every step of the GTPase cycle. We show specificallythat tyrosyl phosphorylation of KRAS markedly attenuates itssensitivity to the activities of GEF and GAP and profoundlyimpairs its binding affinity to the effector RAF. Intrinsicnucleotide exchange was however enhanced, thus GTP-loadedphosphorylated KRAS (pKRAS) accumulated in a dark, “ready-to-serve,” state that can be rapidly unleashed via depho-sphorylation by SHP2 PTP. Notably, common oncogenic KRASmutants such as G12V and G12D were not recalcitrant tophosphorylation-mediated regulation, and pharmacologic inhi-bition of SHP2 led to the accumulation of silenced pKRAS,supporting the potential clinical utility of manipulating the Src-and SHP2-mediated phosphorylation cycle of KRAS in themanagement of KRAS-driven cancers.
ResultsPharmacologic inhibition of SHP2 reduces PDAC tumorgrowth. KRAS mutations are detected in >90% of PDAC, one of
the deadliest cancers without cure or effective treatment13, thus ahighly relevant cancer type to evaluate the therapeutic utility ofSHP2 inhibitors. Here we investigated the effectiveness of a next-generation, cell-permeable catalytic inhibitor of SHP2, 11a-114.Notably, a panel of PDAC cell lines, including those harboringthe most frequent mutations G12V or G12D as well as PDACpatient-derived xenograft (PDX) cells were sensitive to 11a-1treatment (Supplementary Fig. 1a, b), which attenuated the levelof epidermal growth factor (EGF)-induced pSHP2, pERK, andpAKT (Supplementary Fig. 1c) while increasing the level ofcleaved PARP and caspase 9 in a dose-dependent manner (Sup-plementary Fig. 1d). In addition, molecular inhibition of SHP2via CRISPR/Cas9-mediated knockout of SHP2 in the PDAC cellline CFPAC1 harboring the KRASG12V mutation markedly atte-nuated its rate of cell proliferation (Supplementary Fig. 1e).Moreover, PDAC cell lines grown in three-dimensional (3D)culture or as organoids exhibited dose-dependent sensitivity to11a-1 as well as an allosteric SHP2 inhibitor SHP09915 (Supple-mentary Fig. 1f, g, h).
We next interrogated the antitumor efficacy of SHP099 in vivo.We first determined the maximum tolerable dose of SHP099 inSCID mice as only nude mice were used in a previous report15.We observed no discernable weight loss in 100 mg/kg treatmentgroup while 150 mg/kg treatment showed slight weight loss and200 and 250 mg/kg treatments were intolerable (SupplementaryFig. 2a, b). SCID mice bearing subcutaneous PDAC xenograftsderived from PDX cells OCIP.343 harboring KRASG12D weretreated with vehicle or SHP099 at 100 mg/kg as well as the MEKinhibitor Trametinib as a positive control, which was previouslydetermined to have a significant antitumor effect in a similar PDXmodel (Supplementary Fig. 2c). SHP099 treatment resulted in asignificant tumor growth inhibition similar to Trametinibcompared to vehicle (Supplementary Fig. 3a). Treatment withSHP099 was also well tolerated with no obvious weight loss overthe course of treatment (Supplementary Fig. 3b). These observa-tions were associated with reduced levels of pERK, pMEK, andpAKT while the level of cleaved Caspase-3 was increased in thetreatment group (Supplementary Fig. 3c, d). Consistent withrecent reports7–11, these results support the potential utility ofSHP2 inhibitors in the treatment of mutant KRAS-driven PDAC.
Src phosphorylates and alters KRAS switch conformation.Phosphorylation of a protein alters the chemical environment andthus the chemical shifts of the modified residue, as well as spa-tially or sequentially adjacent residues. Ultimately, phosphoryla-tion can induce conformational changes that affect proteinfunction16. We first asked whether KRAS is phosphorylated bySrc. In human embryonic kidney epithelial HEK293 cells trans-fected with plasmids encoding Src in combination with HA-tagged HRAS, NRAS, or KRAS WT, pKRAS was detected at levelssimilar to pHRAS and pNRAS, which was abolished when lysateswere treated with calf intestinal alkaline phosphatase (Fig. 1a). Incontrast, another small GTPase protein, RAC2, exhibited negli-gible tyrosyl phosphorylation in the presence of Src (Supple-mentary Fig. 4a). Other tyrosine kinases, focal adhesion kinase(FAK) and SYK failed to phosphorylate KRAS while WT, but notcatalytically impaired, Src effectively phosphorylated KRAS(Supplementary Fig. 4b). The ubiquitin ligase CBL, which hasbeen shown to target Src for ubiquitin-mediated destruction17,had negligible effect on KRAS phosphorylation (SupplementaryFig. 4b). Furthermore, purified KRAS loaded with either GDP orGTP was phosphorylated to a similar extent by recombinant Srccatalytic domain (Srccat) in vitro (Fig. 1b). These results suggestthat KRAS is phosphorylated specifically via Src, which can bereversed by a phosphatase.
ARTICLE NATURE COMMUNICATIONS | https://doi.org/10.1038/s41467-018-08115-8
2 NATURE COMMUNICATIONS | (2019) 10:224 | https://doi.org/10.1038/s41467-018-08115-8 | www.nature.com/naturecommunications

We next used NMR to examine potential conformationalchanges in KRAS induced by phosphorylation by examiningchemical shift perturbations in the 1H-15N heteronuclear singlequantum correlation (HSQC) spectra of isotopically labeled 15NKRAS-GDP in the presence of excess ATP upon addition of asmall amount of catalytically active Srccat (Src to KRAS molarratio of 1:250) (Fig. 1c, d). Phosphorylation induced chemicalshift perturbations on numerous KRAS residues, particularlythose in the two switch regions, of magnitude consistent with Tyrphosphorylation16. The most perturbed residues were Tyr32,
Asp33, Thr35, Ile36, and Glu37 in switch I and Leu56, Asp57,Ala59, Gly60, Tyr64, Met67, and Gly75 in switch II. Notably,Tyr32 and Tyr64 exhibited much larger chemical shift perturba-tions than the other six tyrosine residues in KRAS (Fig. 1e, f). Themass spectrum of intact KRAS following Srccat phosphorylationexhibited a major peak corresponding to singly phosphorylatedKRAS (+80 Da), a smaller peak for doubly phosphorylated KRAS(+160 Da) and a minor peak corresponding to unmodifiedKRAS, independent of the nucleotide bound (Fig. 1g). Otherminor peaks in the mass spectra were assigned to sodium adducts.
Anti-RAS:IPInput
RAS
0 0.5 1.0
GDP-KRAS
0 0.5 1.0
GTP-KRAS
Src μgH
A-H
RA
S
HA
-NR
AS
HA
-KR
AS
Src
CIP − + − + − +
HA(RAS)
Vinculin
pTyr
1 10 20 30 40 50 60 70 80 90 100 110 120 130 140 150 160 1700.00
0.05
0.10
0.15
0.20
ΔσH
N.N
(ppm
)
β1 α1 β2 α2β3 β4 α3 β5 α4 β6 α5
P-loop Switch I Switch II
4 32 40 64 71 96 1371570.00
0.10
0.20
TYR residues
8.3 8.2
121.5
120.0
Y64
Y71
7.6
120.0
119.0
Y96
Y137
121.5
9.06 8.70
121.6
119.5
Y40 Y4
Y157Y32
9.5
125.6
8.7
ΔσH
N.N
(ppm
)
1H (ppm)
15N
(pp
m)
Residue number
d g
e
pTyr
Anti-HA:IPWCE
b ca
0
4
8
Rel
ativ
e in
tens
ity (
×10
00)
KRAS
Counts vs. deconvoluted mass (amu)
4
8
2007
2.32
KR
AS
2001
52.5
4
2007
2.33 +
21.6
5 (N
a+)
+43
.84
(2N
a+)K
RA
S.P
0 3
2023
2.65
+44
.07
(2N
a+)
Counts vs. deconvoluted mass (amu)
KR
AS
.(P
0 3) 2
+21
.8 (
Na+
)
+44
.86(
Na+
+M
g+)
+65
.91(
3Na+
)
0Rel
ativ
e in
tens
ity (
×10
00)
KR
AS
80.21Da 80.11Da 80.06Da 80.22Da
+22
.3(N
a+)
+20
.9 (
Na+
)
2007
2.07
KR
AS
2001
52.0
8
2023
2.3KR
AS
.P0 3
KR
AS
.(P
0 3) 2
0
4
2
Counts vs. deconvoluted mass (amu)
Rel
ativ
e in
tens
ity (
×10
00)
KRAS.GDP
pKRAS.GTPpKRAS.GDP
2007
2.07
KR
AS
+21
.09
(Na+
)
+43
.93
(2N
a+)
Rel
ativ
e in
tens
ity (
×10
00)
KRAS.GTP
0
2
4
6
Counts vs. deconvoluted mass (amu)
Src
Src
Src
10 8 6
130
120
110
L6
D57
E37
L56
D33
K5
A59
E62
K42
D92
G12
G60
G15T35
T74G10
G75
S39
I36
Y32D38
H95
M67
Y64
Red-KRAS
Black-pKRAS
1H (ppm)
15N
(pp
m)
f
20,000 20,100 20,200 20,300 20,000 20,100 20,200 20,300
20,000 20,100 20,200 20,300 20,000 20,100 20,200 20,300
Fig. 1 Src phosphorylation of KRAS alters the structure of the switch regions. a HEK293 cells transfected with the indicated plasmids were lysed, treatedwith (+) or without (−) calf intestinal alkaline phosphatase (CIP), immunoprecipitated, and immunoblotted with the indicated antibodies. b Purifiedrecombinant human GDP- and GTP-bound KRAS protein were subjected to in vitro kinase assay using purified recombinant Srccat kinase and wereimmunoprecipitated and immunoblotted with the indicated antibodies. c An overlay of 2D 1H-15N HSQC spectra of unmodified KRAS-GDP (red) andpKRAS-GDP phosphorylated by Src (black). The labeled residues are residues with notable chemical shift perturbation. d Histogram mapping the backboneNH chemical shift changes caused by Src phosphorylation. Chemical shift changes of the N and NH peaks of the unmodified vs. phosphorylated cross-peaks in the 2D 1H-15N HSQC spectra were calculated using the formula Δδ NH.N(ppm)=√(〖 (ΔH)〗^2+〖(ΔN/5)〗^2) and plotted against residuenumber. e Overlay of 1H-15N HSQC spectra of 15N-KRAS tyrosine peaks before (red) and after (black) phosphorylation. The residue numbers are indicatedin blue and the arrows indicate the direction of the chemical shift change. Full spectra are shown in c. f Chemical shift changes of the KRAS tyrosineresidues induced by phosphorylation. g Upper panel: Mass spectra of unmodified GDP-loaded KRAS (left) and KRAS loaded with the non-hydrolyzable GTPanalog GMPPNP (right). The major peak of KRAS is shaded green, and the higher molecular weight peaks (+22 Da) correspond to sodium adducts (thepredicted molecular mass of 15N-KRAS (residues 1–173 C118S) is 20074.35 Da). Lower panel: Mass spectrum of GDP-loaded pKRAS (left) and GTP-loadedpKRAS (right) following treatment with Src in vitro. The three peaks highlighted in green correspond to unmodified KRAS, KRAS phosphorylated at one site(+80 Da) and KRAS phosphorylated at two sites (+160 Da). The immunoblot data are representative of at least three independent experiments
NATURE COMMUNICATIONS | https://doi.org/10.1038/s41467-018-08115-8 ARTICLE
NATURE COMMUNICATIONS | (2019) 10:224 | https://doi.org/10.1038/s41467-018-08115-8 | www.nature.com/naturecommunications 3
KRAS is phosphorylated via Src on conserved Tyr32 andTyr64. To unambiguously identify the site(s) of phosphorylation,we conducted liquid chromatography (LC)-MS/MS sequencing oftrypsin-digested KRAS following phosphorylation by Src. TheLC-MS/MS data identified a tryptic peptide containing pTyr64 asthe most abundant tyrosyl phosphorylated species, followed byone containing pTyr32, whereas the abundance of other phos-phorylated peptides was negligible (Fig. 2a–c). Mass spectra ofintact KRASY32F and KRASY64F mutants following Srccat phos-phorylation each lacked doubly phosphorylated KRAS, whileY32F exhibited a major peak corresponding to singly phos-phorylated KRAS and Y64F produced two peaks of similarintensity corresponding to un-phosphorylated and singly phos-phorylated species (Fig. 2d). Consistent with these results, thecellular levels of tyrosyl phosphorylation of KRAS co-expressed inHEK293 cells with Src were reduced for Y32F and dramaticallylower for the Y64F mutant in comparison to WT KRAS (Fig. 2e).We further separated and enriched the mono-phosphorylatedand di-phosphorylated forms of KRAS via anion exchangechromatography (Supplementary Fig. 5) and observed usingMn2+-PhosTag sodium dodecyl sulfate-polyacrylamide gel elec-trophoresis (SDS-PAGE)18, two distinct slower migrating bands(i.e., mono- and di-phosphorylated), indicating that the mod-ifications are tyrosyl phosphorylations catalyzed by Src (Fig. 2f).These results unambiguously identify Tyr32 and Tyr64 withinswitch I and II, respectively, as major phosphorylation acceptorsites on KRAS.
SHP2 dephosphorylates KRAS and promotes downstreamsignaling. We showed previously that SHP2 dephosphorylatespH/NRAS6 and that alkaline phosphatase dephosphorylates Src-induced tyrosyl pKRAS (Fig. 1a). Thus we asked whether SHP2dephosphorylates pKRAS. Ectopic Flag-SHP2 expression wasassociated with decreased levels of Src-induced HA-pKRAS,together with increased levels of downstream pERK and pAKTsignals in a dose-dependent manner (Fig. 3a). The constitutivelyactive disease-causing Flag-SHP2E76K mutant markedly reducedthe level of pKRAS WT and G12V, while the catalytically deadSHP2C459S mutant had a negligible effect (Fig. 3b). Further, weinvestigated the dephosphorylation of pKRAS in vitro using NMRand MS. Both approaches demonstrated that SHP2 depho-sphorylates Src-phosphorylated KRAS (Fig. 3c–e). Notably,inhibition of SHP2 using 11a-1 attenuated SHP2-mediateddephosphorylation of pKRAS (Fig. 3f).
Endogenous RAS phosphorylation is regulated by Src andSHP2. We observed tyrosyl phosphorylation of endogenous RASin WT mouse embryonic fibroblasts (MEFs) following platelet-derived growth factor (PDGF) stimulation (Fig. 4a). Furthermore,Src/Fyn/Yes knockout (SYF−/−) MEFs showed negligible levelsof endogenous pRAS while SHP2−/− MEFs displayed markedlyenhanced levels of endogenous pRAS, which was furtherincreased in the presence of PDGF treatment (Fig. 4a). Theamount of RAS phosphorylation was inversely associated withdownstream pERK and pAKT levels (Fig. 4a), supporting thenotion that phosphorylation of RAS impairs downstream sig-naling. Similar results were observed in a reciprocal experiment inwhich the noted lysates were immunoprecipitated with anti-RASantibody followed by anti-pTyr immunoblot (Fig. 4b). Impor-tantly, inhibition of Src using the non-ATP competitive substratepocket-directed Src inhibitor KX2-39119 or Src-specific smallinterfering RNA (siRNA) led to increased levels of pERK in SHP2−/− MEFs (Supplementary Fig. 6a, b), suggesting that theobservation of attenuated downstream of RAS signaling in SHP2−/− MEFs is dependent, at least in part, on Src activity. The
amplitude and duration of endogenous RAS phosphorylation aswell as SHP2 and Src phosphorylation following growth factorstimulation were strongly and rapidly enhanced within 5 min(Fig. 4c). Notably, two slower migrating bands of endogenousRAS (consistent with di- and mono-phosphorylatedforms as shown in Fig. 2f using purified KRAS) were detectedby Mn2+-PhosTag SDS-PAGE in SHP2−/− MEFs, which wereabsent in SYF−/− MEFs (Fig. 4d). Similarly, SHP2−/− CFPAC1harboring KRASG12V mutation showed markedly enhanced levelsof tyrosyl-phosphorylated endogenous RAS in response to EGF(Fig. 4e). Lysates of PDAC tumors treated with SHP099 or vehicleonly (Supplementary Fig. 3) were analyzed by Mn2+-PhosTagSDS-PAGE. The slower migrating RAS band was stronger in theSHP099 treatment group (Fig. 4f), suggesting that the inhibitionof SHP2 via SHP099 curtailed dephosphorylation of pRASin vivo. These results demonstrate that endogenous RAS is singlyor doubly tyrosyl phosphorylated and that the phosphorylation-mediated RAS GTPase cycle is a tightly controlled dynamicprocess.
Tyrosyl phosphorylation of KRAS stalls its GTPase cycle. Tointerrogate the impact of tyrosyl phosphorylation on the KRASGTPase cycle, we used a real-time NMR GTPase assay20,21 tomeasure nucleotide exchange and hydrolysis rates of unmodifiedKRAS and pKRAS. For the exchange assay, GDP-loaded 15NKRAS or pKRAS were mixed with a ten-fold molar excess ofGTPγS in an NMR tube, and consecutive 1H-15N HSQC spectrawere acquired as the exchange reaction proceeded. The intensitiesof peaks from residues whose chemical shifts are sensitive toGDP/GTP binding were used to calculate the rate of thenucleotide exchange (Fig. 5a). Interestingly, phosphorylation ofKRAS increased the intrinsic rate of nucleotide exchange by ~2.6-fold, while reducing the sensitivity of pKRAS to the exchangeactivity of the catalytic domain of the GEF SOS1 (SOScat)22
(Fig. 5b, c and Supplementary Table 1a). Specifically, the additionof recombinant SOScat to unmodified KRAS at a ratio of 1:600accelerated the exchange reaction 17-fold, whereas nucleotideexchange of pKRAS was enhanced by <3-fold (Fig. 5b, c andSupplementary Table 1a). The activation of KRASG12V mutant bySOS was similarly impaired upon phosphorylation (Supplemen-tary Fig. 7a). Thus, while phosphorylation of KRAS by Src mildlyincreases the intrinsic nucleotide exchange rate, these post-translational modifications impair its activation by SOS by almostan order of magnitude.
We next loaded KRAS or pKRAS with GTP and monitored itshydrolysis by real-time NMR. pKRAS exhibited an intrinsic GTPhydrolysis rate that was ~3-fold lower than that of unmodifiedKRAS (Fig. 5d, e and Supplementary Table 1b). In the presence of1:3000 molar ratio of recombinant GAP domain of RASA1, therate of GTP hydrolysis of unmodified KRAS was accelerated by>300% while that of pKRAS increased by <20% (Fig. 5d, e andSupplementary Table 1b). KRASG12V mutant has, however,impaired intrinsic hydrolysis and is insensitive to GAP stimula-tion, thus phosphorylation had little impact on these rates(Supplementary Fig. 7b). These results indicate that phosphor-ylation of KRAS alters its intrinsic nucleotide exchange andhydrolysis rates in a manner that favors accumulation of pKRAS-GTP, while simultaneously rendering it resistant to inactivationby GAP activity and largely insensitive to GEF activity, thusuncoupling pKRAS from upstream regulation.
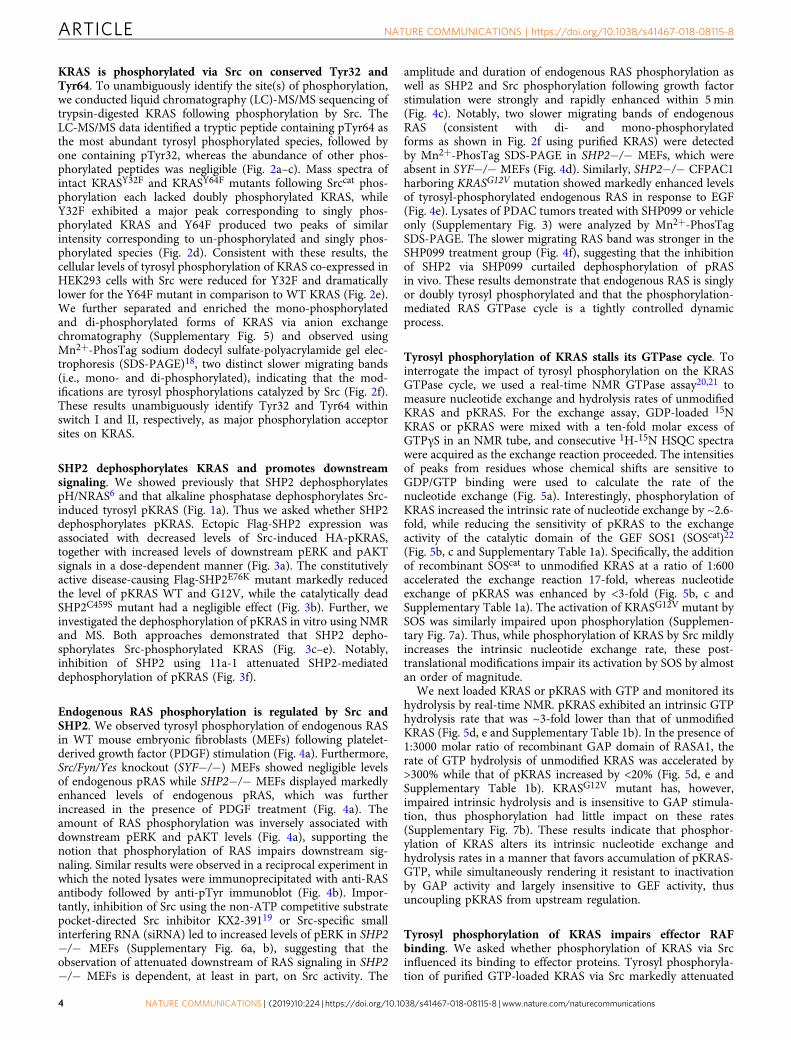
Tyrosyl phosphorylation of KRAS impairs effector RAFbinding. We asked whether phosphorylation of KRAS via Srcinfluenced its binding to effector proteins. Tyrosyl phosphoryla-tion of purified GTP-loaded KRAS via Src markedly attenuated
ARTICLE NATURE COMMUNICATIONS | https://doi.org/10.1038/s41467-018-08115-8
4 NATURE COMMUNICATIONS | (2019) 10:224 | https://doi.org/10.1038/s41467-018-08115-8 | www.nature.com/naturecommunications

d
2005
6.17
2005
6.23
2013
5.98
2005
5.9
2013
5.92
+21
.76
(Na+
)
+22
.32
(Na+
)
0
2
4
6
8
Rel
ativ
e in
tens
ity (
×10
00)
pKRAS Y32F
0
2
4
6
8
Rel
ativ
e in
tens
ity (
×10
00) 10
2005
5.9
+21
.71
(Na+
)
+22
.81
0
4
2
Rel
ativ
e in
tens
ity (
×10
00)
KR
AS K
RA
S.P
0 3
79.75Da
pKRAS Y64F
KR
AS
KR
AS
.P0 3
0
8
4
Rel
ativ
e in
tens
ity (
×10
00) 11
KR
AS
KRAS Y64F
KR
AS
KRAS Y32F
79.75Da
Counts vs. deconvoluted mass (amu)
Counts vs. deconvoluted mass (amu)Counts vs. deconvoluted mass (amu)
Counts vs. deconvoluted mass (amu)
pTyr
HA (KRAS)
Src
Vinculin
WT Y32F Y64F
Anti-HA:IPWCE
Src
− + − + − +
+ − + − + −K295RY527F
WT
KRASe
aR
elat
ive
inte
nsity
Rel
ativ
e in
tens
ity
m/z m/z
Peptide: (K)SALTIQLIQNHFVDEpYDPTIEDSYRKRAS phosphotyrosine residue pY32Precursor ion m/z 1027.44 [M+3H]3+
Spectral count: 15
Peptide: (K)QVVIDGETCLLDILDTAGQEEpYSAMRKRAS Phosphotyrosine residue pY64Precursor ion m/z 1013.09 [M+3H]3+
Spectral count: 250
b c
20,000 20,100 20,200 20,300 20,000 20,100 20,200 20,300
20,000 20,100 20,200 20,30020,020 20,100 20,200 20,300pp-KRAS(Y32 and Y64)
KRAS
p-KRAS(Y32 or Y64)
*
Mn2+-Phos-tag
No Mn2+-Phos-tag
f
KR
AS
KR
AS
.PO
3
KR
AS
.2P
O3
pKR
AS
30005
10152025303540455055 D
y3
b4
b3 y4y5
y6y7
y9
y9y8
y10
y12
y13 y14y3
b2
b3
y4
y5y6
y7
y10y11
b12b10b9
b8b7
b5
y12
y13
y14 y15y16
D Y+80
Y+80S E F Q+G
C+57V I+D G+E
A T
T
D L
L
LDI
E + D
L + D
V FE I T P
6065707580859095
100
05
101520253035404550556065707580859095
100
400 500 600 700 800 900 1000 1100 1200 1300 1400 1500 1600 1700 1800 1900 300 400 500 600 700 800 900 1000 1100 1200 1300 1400 1500 1600 1700 1800 1900
2016
4.19
2021
1.17
2026
7.03
2030
8.38
2023
8.21
2021
2.21
2017
9.19
2015
6.29
2011
8.27
2007
8.24
2021
4.33
2015
2.25
2012
9.29
2007
7.26
2003
8.33
Fig. 2 Src phosphorylates KRAS tyrosine 32 and 64. a–c Two phosphorylated tyrosine residues from the KRAS protein sequence (a) were identified fromin vitro kinase reaction samples that were reduced/alkylated, trypsin-digested, and analyzed by LC-MS. MS/MS spectra matched indicated KRAS trypticpeptides containing residue Y32 (b) and Y64 (c). d Upper panel: Mass spectra of unmodified KRASY32F (left) and KRASY64F (right). Lower panel: Massspectrum of pKRASY32F (left) and pKRASY64F (right). The major peak of KRAS is shaded light green. e HEK293 cells were transfected with the indicatedplasmids. Cells were lysed, immunoprecipitated, and immunoblotted with the indicated antibodies. The immunoblot data are representative of at leastthree separate experiments. f GTP-bound KRAS were subjected to in vitro kinase assay using purified Src kinase (left lane) and were separated into un-phosphorylated (KRAS), mono-phosphorylated (KRAS.PO3), and di-phosphorylated (KRAS.2PO3) forms by anion exchange chromatography. Thesesamples were then analyzed by 50 μM Mn2+-PhosTag SDS-PAGE (upper panel) or conventional SDS-PAGE (lower panel) and immunoblotted with anti-RAS antibody. Asterisk indicates non-specific band. IP immunoprecipitation, WCE whole-cell extract. The immunoblot data are representative of at leastthree independent experiments
NATURE COMMUNICATIONS | https://doi.org/10.1038/s41467-018-08115-8 ARTICLE
NATURE COMMUNICATIONS | (2019) 10:224 | https://doi.org/10.1038/s41467-018-08115-8 | www.nature.com/naturecommunications 5

the interaction with RAF-RBD in pull-down assays (Fig. 6a). Toquantify the effect of phosphorylation on this interaction, weperformed biolayer interferometry using un-phosphorylated,mono-phosphorylated, and di-phosphorylated KRAS, which wereseparated and enriched via anion exchange chromatography(Supplementary Fig. 5). Un-phosphorylated KRAS bound with aKD value of ~ 300 nM, whereas the mono-phosphorylated frac-tion, which contains a mixture of pTyr32 and pTyr64 KRAS,
exhibited ~2-fold weaker binding, and di-phosphorylated KRASexhibited severely impaired binding to BRAF-RBD and muchhigher concentrations were required to detect its binding (Fig. 6band Supplementary Fig. 8a–c). The high protein concentrationspromoted some non-specific interactions that reduced the accu-racy of KD determination; however, di-phosphorylation ofKRAS reduced its affinity for BRAF by at least 15-fold. Notably,the oncogenic KRASG12V and KRASG12D mutants were also
b
HA(KRAS)
Src
Vinculin
Flag (SHP2)
Flag-SHP2
HA-KRAS (WT)
WT
E76
K
C45
9S
WT
E76
K
C45
9S
HA-KRAS (WT) HA-KRAS (12V) f
Anti-HA:IPWCE
Anti-HA:IPWCE
HA(KRAS)
Src
Flag(SHP2)
Vinculin
pTyr
WT K295RY527F
Flag-SHP2
K295RY527F WT
a
SrcSrc
pERK
ERK
pAKT
AKT
Vinculin
Src
SHP2
HA (KRAS)
pTyr
Anti-HA : IPWCE
Flag-SHP211a-1
HA-KRAS
−+ −+
−+
++−
+−−− −− +
Src
K295RY527FWT
Time (min)
I pY/(I Y
+I p
Y)
0.00
0.25
0.50
0.75
1.00
1.25
0.00
0.25
0.50
0.75
1.00
1.25
c
d
KRAS + ATP + Srcadded
Incubate for 2 hat room temp
1.4
1.0
0.6
0.2
20,20020,100
Counts vs. deconvoluted mass (amu)
Rel
ativ
e in
tens
ity ×
100
00
2007
2.45
KRAS
20152.40KRAS.PO3
20232.05
KRAS.(PO3)2
SHP2added
e
2.0
1.0
0.00.0
2007
2.45
KRAS
20,500 20,150
Counts vs. deconvoluted mass (amu)
Rel
ativ
e in
tens
ity ×
100
00
Incubate for 2 hat room temp
1
1
2
2
I pY/(I Y
+I p
Y)
Y32 Y64
Y32 Y64
Y32 Y64Time (min)
Rel
ativ
e ra
te o
fT
yr d
epho
spho
ryla
tion
Rel
ativ
e ra
te o
fT
yr p
hosp
hory
latio
n
0 50 100 150 200 2500.00
0.25
0.50
0.75
1.00
1.25
0 50 100 1500.00
0.25
0.50
0.75
1.00
1.25
1.50
pTyr
Fig. 3 SHP2 dephosphorylates tyrosyl phosphorylated KRAS. a, b HEK293 cells were transfected with the indicated plasmids. Cells were lysed,immunoprecipitated, and immunoblotted with the indicated antibodies. c Phosphorylation was initiated by addition of 2 μM of Src to 250 μM of KRAS in thepresence of 2 mM ATP and 1 mM activated sodium vanadate. Sequential 1H-15N HSQC NMR spectra were collected, and peaks from un-phosphorylatedand phosphorylated Tyr32 (blue) and Tyr64 (red) were integrated from each spectrum to plot curves of the fraction phosphorylated vs. time for each site.The error bars correspond to the noise-to-signal ratio of the respective peaks. The relative rates of phosphorylation of each site determined from arepresentative experiment (performed in duplicate) by curve fitting are shown in histograms on the right. The error bars indicate the standard curve fittingerror obtained from the fitting analysis. d SHP2 (2 μM) was added to Src-phosphorylated KRAS sample purified in the presence of vanadate, and sequential1H-15N NMR spectra were collected to monitor dephosphorylation. Similar to c, the fractions of phosphorylated Tyr32 (blue) and Tyr64 (red) were plottedand rates of dephosphorylation were determined and are shown in the histograms. Rate curves from a representative experiment (performed in duplicate)were fitted to one phase exponential decay/association functions using the GraphPad Prism 4.0 software. Histogram error bars indicate the standard curvefitting error obtained from the fitting analysis. e Top panel; experimental set-up whereby two tubes containing 200 μM of KRAS and 3 μM of Src wereincubated in in the presence of 2 mM ATP for 2 h (in the absence of vanadate). Sample 1 was then snap frozen and stored at −80 °C for MS analysis, and3 μM of SHP2 was added to the remaining tube and incubated for an additional 2 h. Sample 2 was then frozen. Bottom panels; MS spectra of samples 1 and2 with phosphorylation state of each mass indicated. f HEK293 cells transfected with the indicated plasmids were treated with (+) or without (−) 10 μM of11a-1, lysed, immunoprecipitated, and immunoblotted with the indicated antibodies. The immunoblot data are representative of at least three independentexperiments
ARTICLE NATURE COMMUNICATIONS | https://doi.org/10.1038/s41467-018-08115-8
6 NATURE COMMUNICATIONS | (2019) 10:224 | https://doi.org/10.1038/s41467-018-08115-8 | www.nature.com/naturecommunications

phosphorylated by Src in a dose-dependent manner, which wasassociated with markedly attenuated RAF-RBD binding (Fig. 6b,c). Moreover, the dephosphorylation status of KRAS WT or 12Vwas associated with enhanced binding to RAS-binding domain(RBD) of RAF (Fig. 6d). These results demonstrate that phos-phorylation of WT or oncogenic KRAS mutants attenuates itsbinding to effector RAF.
Moreover, our finding that pKRAS has impaired affinity forRAF-RBD has an important implication for the most widely usedassay of RAS activation (i.e., the RBD pull-down assay). It has
been consistently reported that inhibition of SHP2 reduces theamount of RAS-GTP pulled down in such assay, which has beeninterpreted as reduced RAS activation due to impaired SOSactivation or increased GAP activity. However, our resultsdemonstrate that phosphorylation of RAS-GTP upon SHP2inhibition can also contribute to reducing RAS binding to RBD.
DiscussionSHP2 is a well-established major regulator of RAS-to-RAF-to-MAPK signal pathway and somatic gain-of-function SHP2
RAS
RAS
SHP2
Src
pERK
ERK
Vinculin
WT
SY
F–/
–
SH
P2–
/–
WT
SY
F–/
–
SH
P2–
/–
PDGF-BB
WCE
Anti-pTyr : IPControl IgG
WT
− +a
pAKT
AKT
RAS
SHP2
Src
pERK
ERK
Vinculin
RAS
pTyr
SYF–/– SHP2–/–PDGF-BB − − + + − −
Control IgG Control IgG Anti-RAS
WCE
b
WCE
Anti-pTyr
RAS
SHP2
Src
RAS
SHP2
Src
Vinculin
0 0 1 3 5 15 minPDGF-BB
: IPControl IgG
Anti-RAS : IPControl IgG
SY
F–/
–
SH
P2–
/–
SY
F–/
–
p-RAS
RAS*
Anti-RAS : IB
pp-RAS
c
RAS
RAS
SHP2
pERK
ERK
WCE
Anti-pTyr : IP
EGF
Ctrl SHP2–/–
+− +−
Vinculin
Anti-RAS : IPControl IgG
Anti-RAS : IB
Vehicle SHP099
d e f
Fig. 4 Endogenous RAS phosphorylation is regulated temporally by Src and SHP2. a WT, Src/Yes/Fyn (SYF)−/− and CRISPR/Cas9-mediated SHP2−/−MEFs were serum starved and treated with 20 ng/ml of PDGF-BB. Equal amounts of lysates were immunoprecipitated with isotype-matched antibody oranti-pTyr antibody and immunoblotted with the indicated antibodies. b SYF−/− and SHP2−/− MEFs were serum starved and treated with 20 ng/ml ofPDGF-BB. Equal amounts of lysates were immunoprecipitated with isotype matched antibody or anti-RAS antibody and immunoblotted with the indicatedantibodies. c MEFs were serum starved and treated with 20 ng/ml of PDGF-BB or were left untreated for the indicated periods of time. Equal amounts oflysates were immunoprecipitated with isotype-matched antibody or anti-pTyr antibody and immunoblotted with the indicated antibodies. d SYF−/− andSHP2−/− MEF lysates were immunoprecipitated with isotype-matched antibody or anti-RAS antibody and analyzed by 50 μM Mn2+-PhosTag SDS-PAGE.Asterisk indicates non-specific band. e CRISPR/Cas9-mediated non-target (Ctrl) or SHP2−/− CFPAC1 cells were serum starved and treated with (+) orwithout (−) 10 ng/ml of EGF. Equal amounts of lysates were immunoprecipitated and immunoblotted with the indicated antibodies. f OCIP.343 xenografttumor lysates from the indicated treatment groups were immunoprecipitated with isotype-matched antibody or anti-RAS antibody and analyzed byMn2+-PhosTag SDS-PAGE. Arrow indicates a slower migrating band. The immunoblot data are representative of at least three independent experiments
NATURE COMMUNICATIONS | https://doi.org/10.1038/s41467-018-08115-8 ARTICLE
NATURE COMMUNICATIONS | (2019) 10:224 | https://doi.org/10.1038/s41467-018-08115-8 | www.nature.com/naturecommunications 7

mutations or overexpression have also been identified in severalhematologic malignancies as well as solid tumors such as gastric,breast, lung and pancreatic cancers and RASopathies1,2,6,23–25.These observations have led to the notion that SHP2 could beused as prognostic marker and potentially targeted for therapyeven prior to our reporting of its direct involvement in the reg-ulation of RAS6. Although we and others have shown that thetreatment of RAS-dependent cancers can benefit from SHP2inhibition6–11, the molecular mechanisms that relate SHP2 toRAS signaling have remained unclear and controversial10.
SHP2 is a phosphatase containing two SH2 domains, a catalyticPTP domain and a C-terminal regulatory tail with sites of tyrosylphosphorylation. At basal state, SHP2 adopts a closed inactiveconformation in which its SH2 and PTP domains are occluded26.In the activated open state, the PTP domain of SHP2 is exposedto substrates and the SH2 domains are available to interact withpTyr residues. Phosphorylated SHP2 can recruit GRB2 and SOSto phosphorylated receptor tyrosine kinases, and the docking ofSHP2 SH2 domains to substrates may promote the catalyticfunction of the PTP domain27,28. Several lines of evidence suggestthe importance of the catalytic function of SHP2 in regard to itsrole for RAS activation, although the relevant targets are stilldebated29. SHP2 has been implicated as a regulator of RASGTPase cycle by regulating GEF and GAP localization bydephosphorylating the p120 RASGAP docking sites on EGFR andGAB130,31 or GRB2-binding sites on Sprouty, reversing its
negative regulation of GRB2/SOS recruitment32. These models,which are not necessarily mutually exclusive with the presentedmodel, involve SHP2 regulation of the RAS GTPase cycle bymodulation of the regulators of RAS.
Although the biological significance remains unclear, phos-phorylation of the residues homologous to Tyr32 on RHOA(Tyr34), RAB24 (Tyr37), and RAN (Tyr39) has been described33–35
and Src has also been shown to phosphorylate CDC42, R-RAS, andthe heterotrimeric G protein α subunit36–38. There are also exam-ples of phosphorylation affecting the molecular switch function ofRAS. For example, HRAS Tyr137 phosphorylation by Abelsontyrosine protein kinase has been shown to allosterically enhance thebinding of HRAS to effector RAF139 while phosphorylation of aplant GTPase Toc34 is thought to affect its GTPase activity40,41.Here we show that endogenous RAS is tyrosyl phosphorylated andthat KRAS is phosphorylated by Src on Tyr32 and Tyr64 in akinase- and site-specific manner. We show that tyrosyl phosphor-ylation of KRAS alters the conformation of switch I and II,consequently attenuating GEF-mediated nucleotide exchange,GAP-assisted GTP hydrolysis, and the binding affinity of KRAS tothe effector RAF (Fig. 7a). These results demonstrate that phos-phorylation of KRAS stalls the GTPase cycle into a “dark state”while SHP2-mediated dephosphorylation is required to maintaindynamic cycling or to unleash signaling-competent KRAS from thedark state of pKRAS. Importantly, KRAS mutations frequentlyoccur at codon 12 and substitution mutations encoding G12D and
116
115
114
T74 M67
1H (ppm)
8.2 8.17.77.87.9
106
105
KRAS.GDP
pKRAS.GDP
pKRAS.GTP
KRAS.GTP
KRAS.GDP
pKRAS.GDP
pKRAS.GTP
KRAS.GTP
15N
(pp
m)
a b
0 100 200 300 400 5000.00
0.25
0.50
0.75
1.00
pKRAS
pKRAS 1:600 SOS
KRAS
KRAS 1:600 SOS
Time (min)
KRAS
pKRAS
KRAS(GAP1:3000)
pKRAS(GAP1:3000)G
DP
/(G
DP
+G
TP
)
GD
P/(
GD
P+
GT
PγS
)
c d e
SO
S-c
atal
yzed
exc
hang
e ra
te(f
old
incr
ease
rel
ativ
e to
intr
insi
c)
GA
P-c
atal
yzed
hyd
roly
sis
rate
(fol
d in
crea
se r
elat
ive
to in
trin
sic)
0 30 60 90 120 150 180 2100.00
0.25
0.50
0.75
1.00
Time (min)
KRAS pKRAS KRAS pKRAS0
5
10
15
20
25
0
1
2
3
4
Fig. 5 Tyrosyl phosphorylation of KRAS disrupts GTPase cycle. a Overlay of four 1H-15N HSQC spectra of two representative residues T74 and M67, inwhich the four peaks represent GDP-loaded KRAS (black), GTP-loaded KRAS (blue), GDP-loaded Src-phosphorylated (p)KRAS (red), and GTP-loadedpKRAS (green). b Real-time NMR-derived nucleotide exchange curves for unmodified vs. Src-phosphorylated KRAS. A 250μM sample of GDP-loaded 15NKRAS (black) or pKRAS (blue) was incubated with ten-fold molar excess of GTPγS. Each dot represents mean fraction of KRAS that is loaded with GDP onthe basis of peak intensities [IGDP/(IGDP+ IGTPɣS)] from the same three residues of KRAS and pKRAS. SOScat was added at a ratio of 1:600 to KRAS(orange) or pKRAS (red). c Src phosphorylation of KRAS impairs SOScat-assisted nucleotide exchange. Fold increase in the rate of exchange upon additionof SOScat to KRAS or pKRAS. The reaction was performed twice in the absence and twice in the presence of SOScat and four ratios were determined fromeach pairwise comparison. d GTP hydrolysis curves illustrating intrinsic and RASA1 GAP domain (1:3000 ratio) assisted GTP hydrolysis for unmodifiedKRAS and pKRAS. e Src phosphorylation of KRAS reduces sensitivity to GAP activity. Fold increase in the rate of GTP hydrolysis with addition of RASA1GAP domain for KRAS vs. pKRAS. The reaction was performed twice in the absence and twice in the presence of RASA1 GAP domain and four ratios weredetermined from each pairwise comparison. b, d present a single representative experiment that was repeated at least twice. Error bars represent thestandard deviation of the fraction GDP as reported by three pairs of cross-peaks. Error bars in c, e indicate standard deviation of the fold changes
ARTICLE NATURE COMMUNICATIONS | https://doi.org/10.1038/s41467-018-08115-8
8 NATURE COMMUNICATIONS | (2019) 10:224 | https://doi.org/10.1038/s41467-018-08115-8 | www.nature.com/naturecommunications
G12V are among the most prevalent in PDAC tumors2,42. Notably,we show that Src- and SHP2-mediated regulation of KRAS extendsto these common KRAS mutants and that the inhibition of SHP2activity disrupts the phosphorylation cycle, shifting the equilibriumof oncogenic KRAS toward the dark state (Fig. 7a). Although it isformally unknown the stoichiometry of KRAS phosphorylation incells, it appears reasonable that dynamic (de)phosphorylation ofKRAS in the appropriate spatiotemporal context upon externalstimulus would be sufficient to trigger downstream signaling. Srcand SHP2 both have well-established functions at receptor tyrosinekinases and are thus poised to regulate the phosphorylation of thelocal KRAS that is most relevant to signaling (i.e., KRAS with thepotential to become activated by SOS at activated receptors).
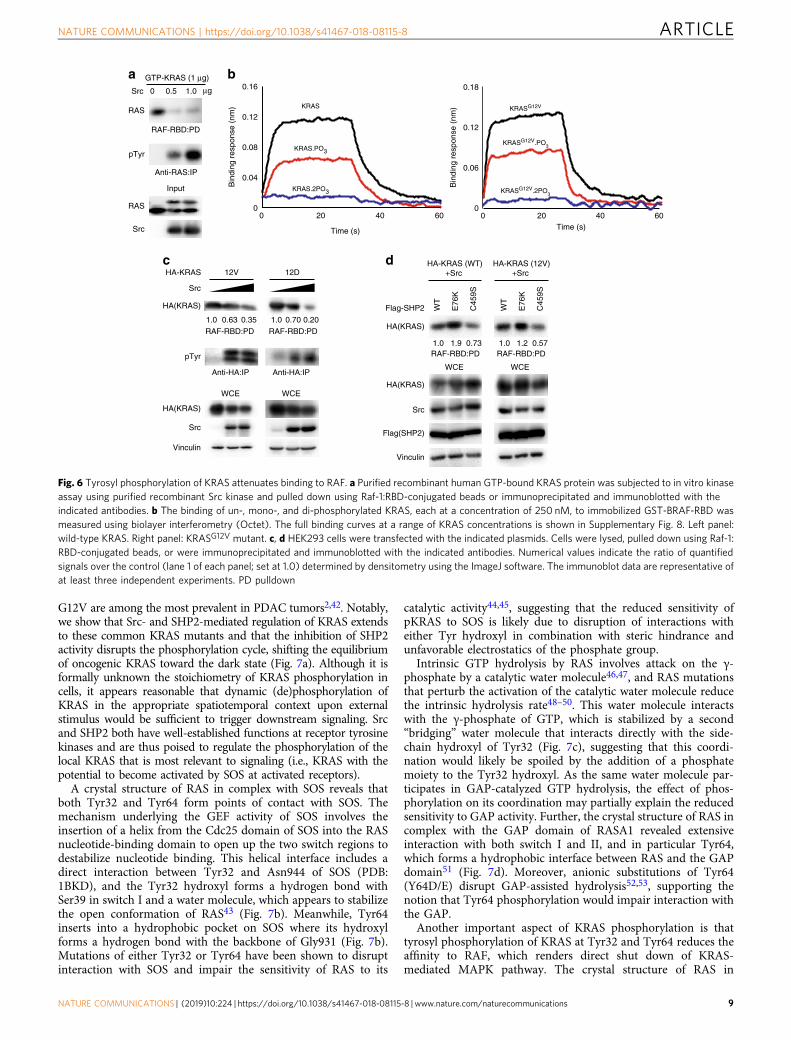
A crystal structure of RAS in complex with SOS reveals thatboth Tyr32 and Tyr64 form points of contact with SOS. Themechanism underlying the GEF activity of SOS involves theinsertion of a helix from the Cdc25 domain of SOS into the RASnucleotide-binding domain to open up the two switch regions todestabilize nucleotide binding. This helical interface includes adirect interaction between Tyr32 and Asn944 of SOS (PDB:1BKD), and the Tyr32 hydroxyl forms a hydrogen bond withSer39 in switch I and a water molecule, which appears to stabilizethe open conformation of RAS43 (Fig. 7b). Meanwhile, Tyr64inserts into a hydrophobic pocket on SOS where its hydroxylforms a hydrogen bond with the backbone of Gly931 (Fig. 7b).Mutations of either Tyr32 or Tyr64 have been shown to disruptinteraction with SOS and impair the sensitivity of RAS to its
catalytic activity44,45, suggesting that the reduced sensitivity ofpKRAS to SOS is likely due to disruption of interactions witheither Tyr hydroxyl in combination with steric hindrance andunfavorable electrostatics of the phosphate group.
Intrinsic GTP hydrolysis by RAS involves attack on the γ-phosphate by a catalytic water molecule46,47, and RAS mutationsthat perturb the activation of the catalytic water molecule reducethe intrinsic hydrolysis rate48–50. This water molecule interactswith the γ-phosphate of GTP, which is stabilized by a second“bridging” water molecule that interacts directly with the side-chain hydroxyl of Tyr32 (Fig. 7c), suggesting that this coordi-nation would likely be spoiled by the addition of a phosphatemoiety to the Tyr32 hydroxyl. As the same water molecule par-ticipates in GAP-catalyzed GTP hydrolysis, the effect of phos-phorylation on its coordination may partially explain the reducedsensitivity to GAP activity. Further, the crystal structure of RAS incomplex with the GAP domain of RASA1 revealed extensiveinteraction with both switch I and II, and in particular Tyr64,which forms a hydrophobic interface between RAS and the GAPdomain51 (Fig. 7d). Moreover, anionic substitutions of Tyr64(Y64D/E) disrupt GAP-assisted hydrolysis52,53, supporting thenotion that Tyr64 phosphorylation would impair interaction withthe GAP.
Another important aspect of KRAS phosphorylation is thattyrosyl phosphorylation of KRAS at Tyr32 and Tyr64 reduces theaffinity to RAF, which renders direct shut down of KRAS-mediated MAPK pathway. The crystal structure of RAS in
a b
Input
Src
RAS
RAS
0 0.5 1.0
GTP-KRAS (1 μg)
Anti-RAS:IP
Src μg
RAF-RBD:PD
c
RAF-RBD:PD RAF-RBD:PD
Anti-HA:IP Anti-HA:IP
WCE WCE
Src
HA-KRAS 12V 12D
HA(KRAS)
Vinculin
HA(KRAS)
Src
pTyr
0
0.04
0.08
0.12
0.16
0 20 40 60
KRAS
KRAS.PO3
KRAS.2PO3
Time (s)B
indi
ng r
espo
nse
(nm
)
1.0 0.63 0.35 1.0 0.70 0.20
0
0.06
0.12
Time (s)0 20 40 60
KRASG12V
KRASG12V.PO3
KRASG12V.2PO3
0.18
Bin
ding
res
pons
e (n
m)
WT
E76
K
C45
9S
WCE
d
HA(KRAS)
Src
Flag(SHP2)
Vinculin
HA(KRAS)
Flag-SHP2 WT
E76
K
C45
9S
WCE
RAF-RBD:PDRAF-RBD:PD1.0 1.9 0.73 1.0 1.2 0.57
HA-KRAS (WT)+Src
HA-KRAS (12V)+Src
pTyr
Fig. 6 Tyrosyl phosphorylation of KRAS attenuates binding to RAF. a Purified recombinant human GTP-bound KRAS protein was subjected to in vitro kinaseassay using purified recombinant Src kinase and pulled down using Raf-1:RBD-conjugated beads or immunoprecipitated and immunoblotted with theindicated antibodies. b The binding of un-, mono-, and di-phosphorylated KRAS, each at a concentration of 250 nM, to immobilized GST-BRAF-RBD wasmeasured using biolayer interferometry (Octet). The full binding curves at a range of KRAS concentrations is shown in Supplementary Fig. 8. Left panel:wild-type KRAS. Right panel: KRASG12V mutant. c, d HEK293 cells were transfected with the indicated plasmids. Cells were lysed, pulled down using Raf-1:RBD-conjugated beads, or were immunoprecipitated and immunoblotted with the indicated antibodies. Numerical values indicate the ratio of quantifiedsignals over the control (lane 1 of each panel; set at 1.0) determined by densitometry using the ImageJ software. The immunoblot data are representative ofat least three independent experiments. PD pulldown
NATURE COMMUNICATIONS | https://doi.org/10.1038/s41467-018-08115-8 ARTICLE
NATURE COMMUNICATIONS | (2019) 10:224 | https://doi.org/10.1038/s41467-018-08115-8 | www.nature.com/naturecommunications 9
complex with RAF demonstrates that switch I forms the core ofthe binding site54. Notably, Tyr32 is found in the middle of theRAS effector-binding site, suggesting how phosphorylation of thisresidue reduces the affinity to RAF, thereby attenuating thedownstream RAF-to-MEK-to-ERK pathway. However, consider-ing that both switch I and II regions are critical for binding
multiple effector proteins, discerning the relative contribution ofTyr32 and/or Tyr64 modification on individual effector recruit-ment will be important for understanding how RAS phosphor-ylation governs the signaling of a myriad of pathways.
Here we show that Src phosphorylation decouples KRAS fromregulation by GEFs and GAPs, leading to the accumulation of a
a
RAS
GAP
RAS
GAP
Y64
L902
b c d
SOS
RAS
Y32
S39
H2O
SOS
RAS
Y64
G931
F930
F929
I932
H2O
Enhanced signaling
GTPGDP
KRAS-GDP
KRAS-GDP
GEFGEF
KRAS-GTP
KRAS-GTP
GAPγPi
SHP2
GTPGDP
KRAS-GDP
KRAS-GDP
GEFGEF
KRAS-GTP
GAP
Src
γPi
P P
P P
P P
PKRAS-GTP
P P
KRAS-GTP
Raf
KRAS-GTP
P P
γPi
GTPGDP
γPi
Raf
Src
Reduced effector binding
GAP insensitivity
GEF insensitivity
Inhibitor
Y32Y32 Y64 Y64
Canonical
P P
ATP
ADP
‘Dark state’
GMPPNP
Y32
Q61
T35
Bridging water
Catalytic water
RASSwitch I
Switch II
GTPGDP
Reduced signaling
ARTICLE NATURE COMMUNICATIONS | https://doi.org/10.1038/s41467-018-08115-8
10 NATURE COMMUNICATIONS | (2019) 10:224 | https://doi.org/10.1038/s41467-018-08115-8 | www.nature.com/naturecommunications

GTP-bound “dark state” that is impaired in its ability to engageand activate RAF kinase. While a large body of work has estab-lished pro-oncogenic roles for Src in tumor development andmetastasis, its phosphorylation of RAS is distinctively a tumor-suppressive function. Although preclinical studies implicated Srcas a therapeutic target for cancer, phase II trials failed todemonstrate a significant clinical benefit of Src inhibitor mono-therapy for metastatic solid tumors including breast, prostate,head and neck, colon, pancreatic, or non-small cell lung can-cers55. These clinical trials, however, were performed in unse-lected patients, lacking effective response biomarkers to guide thedesign of clinical trials, which was partly due to the enormouscomplexity of Src signaling. Recent preclinical data suggest thatcells with elevated Src activity are more likely to respond to Srcinhibition, while tumors with diminished Src signaling resultingfrom alternative oncogenic pathways may contribute to de novoresistance to Src inhibitors56–59. These, albeit limited, studiesdemonstrate that hyperactive Src signaling may potentially serveas a biomarker for successful targeting of Src and clinical efficacy.However, other molecular alterations in cancers may impact onthe response of cancer cells to Src inhibitors. For example, c-METamplification in gastric cancer as well as the autophagy pathwaywere shown to promote resistance to Src inhibitors59,60 whileacquired resistance of ER+ breast cancers to the Src family kinaseinhibitor saracatinib is associated with the reactivation of themammalian target of rapamycin pathway61,62. These resultssuggest that cancer cells can acquire resistance to Src inhibitor viamultiple genetic alterations. Thus further clinical studies areneeded to develop more reliable biomarkers that can guide clin-ical trials. To our knowledge, KRAS mutational status has notbeen evaluated as a biomarker for response to Src inhibitors. Inlight of our present study suggesting tumor-suppressive role ofSrc in the context of oncogenic KRAS as well as recent reportsdemonstrating clinical utility of SHP2 inhibitors in the manage-ment of mutant KRAS-driven cancers7–11, inclusion of KRASmutational status would be prudent for future clinical trials of Srcand SHP2 inhibitors as mono or combination therapies.
MethodsCells. HEK293, MEF, MEF-SYF(−/−), CFPAC1, Capan-1, HPAF-II, SW1990,HUPT3, and MiaPaCa-2 cells were obtained from the American Type CultureCollection. P411T1 and PancT6 were generated from PDAC PDXs42. HEK293,MEF, MEF-SYF(−/−), and MiaPaCa-2 cells were maintained in Dulbecco’smodified Eagle’s medium (DMEM; Invitrogen) supplemented with 10% (v/v) heat-inactivated fetal bovine serum (FBS; Wisent) at 37 °C in a humidified 5% CO2
atmosphere. CFPAC1, Capan-1, HPAF-II, SW1990, HPAC, and HUPT3 cells weremaintained similarly in RPMI-1640 (Wisent) medium supplemented with 10% (v/v) FBS. P411T1 and PancT6 cells were maintained in DMEM/F12 medium(Thermo Fisher Scientific, 11330–032) supplemented with 5 ng/ml EGF (R&DSystems, 236-EG-01M), 10 μg/ml insulin (Thermo Fisher Scientific, 12585–014),and 10% (v/v) FBS.
Plasmids. A plasmid encoding human pBabe-KRAS4B WT was generously pro-vided by Channing Der (University of North Carolina, Chapel Hill), which wassubcloned into pcDNA3 using KpnI and NotI to integrate an N-terminal HA tag.KRAS mutants (G12V, Y32F and Y64F) were generated by site-directed muta-genesis. Human pcDNA3-HA-HRAS, pCGN-HA-NRAS, pcDNA3-Flag-RAC2,
pCDNA-HA-FAK P712/715A, pCDNA-HA-FAK Y576/577F, pMSCV-mCherry-SYK, pCMV5-Src (WT or K295RY527F), and pCMV5-SHP2 (WT, E76K orC459S) were obtained from Addgene. Flag-SHP2 constructs were subcloned intopcDNA3 and a plasmid encoding HA-CBL was subcloned into the pcDNA-DEST4.0 vector using Gateway Cloning technology (Invitrogen). Plasmids wereverified by direct DNA sequencing.
Antibodies. Rabbit polyclonal antibodies against Src (#2109, 1:5000), phos-phorylated (p)Src (#2101, 1:1000), pAKT (#9271, 1:1000), AKT (#9272, 1:1000),ERK (#9102, 1:1000), SYK (#2712, 1:1000), FAK (#3285, 1:1000), pTyr (P-Tyr-1000) (#8954, 1:2000), cleaved caspase-3 (#9664, 1:1000), cleaved PARP (#9541,1:1000), PARP (#9542, 1:1000), cleaved caspase-9 (#9661, 1:1000), caspase-9(#9508, 1:1000), and HA (#3724, 1:5000) were obtained from Cell SignalingTechnologies. Polyclonal IgG (sc-2027), pERK (sc-7383, 1:500), CBL (sc-170,1:500), SHP2 (sc-280, 1:1000), pMEK1/2 (sc-81503, 1:500), and MEK-1 (sc-6250,1:500) were obtained from Santa Cruz Biotechnology. p-SHP2(Y542) (ab62322,1:20,000) was obtained from Abcam. Monoclonal antibodies against Pan-Ras(OP40, 1:500), HA (12CA5, 1:500), and pTyr (4G10) (05–321, 1:1000) wereobtained from Boehringer Ingelheim and Millipore, respectively. MonoclonalFLAG-M2 (F1804, 1:2000) and Vinculin (V9264, 1:2000) were obtained fromSigma.
Chemicals. Compound 11a-1, 6-Hydroxy-3-iodo-1-methyl-2-(3-(2-oxo-2-((4-(thiophen-3-yl)-phenyl)amino)acetamido)phenyl)-1H-indole-5-carboxylic acidwas developed and synthesized using a structure-guided and fragment-basedlibrary approach14. SHP099 was obtained from Novartis. KX2-391 was obtainedfrom Selleck Chemicals. Calf intestinal alkaline phosphatase was obtained fromNew England Biolabs. EGF and PDGF-BB were obtained from R&D Systems.
CRISPR/Cas9-mediated gene editing. pLentiCRISPR (49535) was obtained fromAddgene, and the following sequences derived from exon 1 of the indicated geneswere used to create guides: SHP2 (mouse), 5′-CTGAACCAGTTCAGCCAAAG;SHP2 (human), 5′-GAGACTTCACACTTTCCGTT; and Non Target, 5′-GCGAGGTATTCGGCTCCGCG. The cells were infected with lentivirus asdescribed below.
Lentiviral production and infection of cell lines. HEK293FT cells (Thermo FisherScientific) were transfected with psPAX2, pMDG1.vsvg, and pLentiCRISPRtransfer vector. Lentivirus containing supernatant was collected at 72 h post-transfection. Lentiviral supernatant was filtered and applied to the indicated celllines. MEF and CFPAC1 cells required the addition of 5 μg/ml Polybrene (Milli-pore). Selection was started 24 h after infection using puromycin (5 μg/ml; Wisent).Monoclonal populations were generated and used for experiments.
Src knockdown via siRNA. Endogenous Src in SHP2−/− MEF cells was silencedusing ON-TARGETplus SMARTpool siRNA (Dharmacon) according to themanufacturer’s instructions.
Immunoprecipitation and immunoblotting. Cells were harvested in EBC lysisbuffer (50 mM Tris, pH 8, 120 mM NaCl, 0.5% NP-40) supplemented with pro-tease and phosphatase inhibitors (Roche). Lysates were immunoprecipitated usingthe indicated antibodies along with protein A-Sepharose (Repligen). Bound pro-teins were washed five times in NETN buffer (20 mM Tris, pH 8, 100 mM NaCl, 1mM EDTA, 0.5% NP-40), eluted by boiling in sample buffer, and resolved by SDS-PAGE. Proteins were electrotransferred onto polyvinylidene difluoride membrane(Bio-Rad), blocked, and probed with the indicated antibodies.
Cellular RAS activity assay. RAS activity was assessed using the RAS activationassay kit from Millipore (17–218). Briefly, RAS-GTP from various treated lysateswas pulled-down using an agarose-bound glutathione S-transferase (GST) fusionprotein corresponding to human RBD of RAF-1. The presence of RAS-GTP wasdetected by western blotting using an anti-RAS antibody (Millipore # 05–516,1:2000).
Fig. 7 Model of the impact of phosphorylation on KRAS GTPase cycle and structural rationale. a Phosphorylation decouples KRAS from effectors andGTPase cycle regulation. The GTPase cycle of unmodified KRAS is shown on top. Nucleotide exchange and hydrolysis are accelerated by the activities ofGEFs and GAPs, respectively. GTP-loaded KRAS binds and activates RAF. Src phosphorylation of Tyr32 and Tyr64 of KRAS-GDP or KRAS-GTP alters allsteps in this GTPase cycle (lower part). Upon phosphorylation, KRAS becomes insensitive to regulation by both GEFs and GAPs, whereas intrinsicnucleotide exchange is enhanced and intrinsic GTP hydrolysis is impaired. This leads to the accumulation of phosphorylated KRAS-GTP, which has reducedaffinity for RAF, thus phosphorylation limits KRAS signaling. SHP2 dephosphorylates KRAS and thereby unleashes KRAS-GTP to rapidly activate RAF.Inhibition of SHP2 promotes accumulation of phosphorylated KRAS, dampening RAF signaling and subsequently suppressing oncogenesis. Line thicknessand number of arrowheads represent relative reaction rates of each step. b Ribbon diagram SOS (green) contact with Tyr32 and Tyr64 of RAS (PDB ID1BKD). c Proposed coordination of switch I and switch II RAS residues in intrinsic GTP hydrolysis (PDB ID 4G0N). d Switch I and II (blue) of RAS are themain interaction site with GAP (green) (PDB ID 1WQ1)
NATURE COMMUNICATIONS | https://doi.org/10.1038/s41467-018-08115-8 ARTICLE
NATURE COMMUNICATIONS | (2019) 10:224 | https://doi.org/10.1038/s41467-018-08115-8 | www.nature.com/naturecommunications 11

Cell proliferation assay. Equal numbers of cells were plated in quadruplicate in96-well plates in the presence or absence of the indicated inhibitors and cellularproliferation was assessed using Alamar Blue proliferation assay as per the man-ufacturer’s instructions (Invitrogen).
Recombinant protein expression. The kinase domain from Src was producedrecombinantly in Escherichia coli63. Briefly, DNA corresponding to Src (residues254–536) was subcloned into pET46 Ek/LIC. Additionally, DNA corresponding tofull-length Yersinia pestis YopH phosphatase was subcloned into pRSF Ek/LIC. Inboth constructs, a thrombin protease site was introduced after the vector encodedN-terminal 6-histidine purification tag. Soluble expression of Src was achieved byco-expression of YopH in Rosetta-2 (DE3) E. coli cells. Cell cultures were grown toan OD600= 0.8 at 37 °C and recombinant protein expression was induced with afinal concentration of 0.5 mM IPTG for 20 h at 18 °C. Pelleted cells were resus-pended in 50 mM Tris-HCl pH 8.0, 500 mM NaCl, 25 mM imidazole, and 5% (v/v)glycerol. E. coli cells were lysed using a hydraulic cell disruption system (ConstantSystems) and recombinant protein was purified by standard Ni-NTA affinitychromatography. Pooled elutions containing both Src and YopH were then dia-lyzed overnight against 40 volumes of buffer containing 20 mM Tris-HCl pH 8.0,100 mM NaCl, 5% (v/v) glycerol, and 1 mM dithiothreitol (DTT). Followingovernight dialysis, the protein solution was applied onto an anion exchange col-umn (Mono Q 5/50 GL) equilibrated with 20 mM Tris-HCl pH 8.0, 5% (v/v)glycerol, and 1 mM DTT (Buffer A). Protein bound to the anion exchange columnwas eluted with a 100 CV gradient of 0–50% 20 mM Tris-HCl pH 8.0, 1 M NaCl,5% (v/v) glycerol, and 1 mM DTT (Buffer B). Anion exchange was sufficient for theseparation of recombinant Src kinase from the YopH phosphatase. The elutionscontaining Src kinase were pooled and further purified by size exclusion chro-matography using a custom Superdex-200 10/300 prep grade column equilibratedin 50 mM Tris-HCl, pH 8.0, 100 mM NaCl, 5% (v/v) glycerol, and 1 mM DTT. Allpurification steps were carried out at 4 °C. Protein concentration was determinedby absorbance at λ= 280 nm, and purity was confirmed by SDS-PAGE and MS.
The catalytic regions of Son of Sevenless SOScat (residues 564–1049) and GAPdomain of human RASA1 (residues 715–1074) were subcloned into pET15b(Novagen/EMD Biosciences). RBD of BRAF (residues 150–233) fused with N-terminal GST tag was subcloned into pGEX-4T2 (HE Healthcare). The proteinswere expressed in E. coli BL21 (DE3). GST-RBD was purified using GlutathioneSepharose 4B (GE Healthcare) followed by gel filtration chromatography(Superdex™ S200, GE Healthcare). His-tagged SOScat and RASA1 GAP domainwere purified using Ni-NTA (Qiagen). The His tag was cleaved by thrombinfollowing elution with 250 mM imidazole, and final purification was achieved bygel filtration chromatography (Superdex™ S75, GE Healthcare)64.
Purification of isotopically labeled (15N) KRAS. A synthetic gene (Genscript)encoding the GTPase domain of KRAS4B (residues 1–173, with C118S mutation)was cloned with a thrombin-cleavable His-tag into pET-28 and transformed into E.coli BL21 (DE3). The bacteria were cultured in minimal M9 medium supplementedwith 1 g/l 15N ammonium chloride at 37 °C until the O.D. 600 reached 0.6, theninduced with 0.2 mM IPTG (isopropyl β-D-1-thiogalactopyranoside) at 16 °Covernight. The cells were harvested, resuspended in lysis buffer (50 mM Tris, 150mM NaCl, 0.1% NP-40, 10% Glycerol, 10 mM Imidazole, 5 mM MgCl2, 1 mMphenylmethylsulfonyl fluoride, 10 mM β-mercaptoethanol and lysozyme at pH8.0), and lysed by sonication. The protein was purified using Ni-NTA resin fol-lowed by gel filtration (Superdex™ S75, GE Healthcare) in a buffer containing 20mM HEPES, 100 mM NaCl, 5 mM MgCl2, and 2 mM tris(2-carboxyethyl)phos-phine (TCEP), pH 7.4. KRAS copurifies with E. coli–derived guanosine nucleotide,and upon completion of purification, the WT protein is loaded with GDP. KRASG12V was purified in the same manner; however, it comprises a mixture of GDP-and GTP-bound protein due to its impaired GTP hydrolysis, thus it was incubatedfor several days to allow GTP hydrolysis to proceed to completion.
In vitro kinase assay. Purified recombinant human KRAS WT was incubated withpurified recombinant active His–Src in 100 μl of kinase buffer [50 mM HEPES(pH7.5), 10 mM MgCl2, 1 mM EGTA, 0.01% Brij-35, 200 μM ATP] for 1 h at roomtemperature. Thereafter, 1 ml of binding buffer [50 mM Tris (pH 8), 120 mM NaCl,0.1% Nonidet P-40, 5% (v/v) glycerol] was added along with the indicated anti-bodies and protein A-Sepharose (Repligen). Bound proteins were washed five timesin binding buffer before elution by boiling in sample buffer and resolved by SDS-PAGE.
Real-time NMR GTPase assay. To prepare tyrosyl-phosphorylated KRAS forGTPase assays, a sample of 15N-KRAS was confirmed to be GDP-loaded by col-lecting a 1H-15N HSQC spectrum, then incubated with a catalytic amount ofrecombinant Src (i.e., 1:125 molar ratio) in the presence of 2 mM ATP, 1 mMactivated sodium vanadate, 2 mM imidazole, 1 mM sodium fluoride, and 1.15 mMsodium molybdate. After confirming completion of the phosphorylation reactionby collection of a 1H-15N HSQC spectrum, the Src protein and excess ATP wasremoved from the KRAS sample by gel filtration chromatography (Superdex™ S75GE Healthcare). For nucleotide exchange assays, 40 μl of 250 μM GDP-loaded 15N-KRAS or phosphorylated 15N-KRAS was incubated with 10× molar excess GTPγS
(guanosine 5′-[γ-thio]triphosphate tetralithium salt, Sigma-Aldrich) in a 1.7 mmNMR tube. Sequential 1H-15N HSQC NMR experiments were collected throughoutthe time course of the exchange reaction using a Bruker 600MHz Avance III NMRspectrometer equipped with a 1.7 mm cryogenic TCI MicroCryoProbe. Data wereprocessed using NMRPipe and analyzed using the NMRFAM-SPARKYsoftware65,66. To calculate the nucleotide exchange rate, the fraction of RAS boundto GDP based on the ratio of the peak intensities of three cross-peaks sensitive tonucleotide exchange were plotted vs. time and fit to an exponential associationcurve67 using GraphPad Prism 4. GEF assays were performed in the same manner,with the addition of catalytic domain of Son of Sevenless (residues 564–1049SOScat) at a molar ratio of 1:600 to KRAS. To perform KRAS GTP hydrolysisassays, 15N-KRAS was loaded with GTP by incubation with a 10-fold excess ofGTP in the presence of EDTA, which were removed by gel filtration chromato-graphy (Superdex 75 10/300, GE Healthcare), before collecting sequential HSQCspectra. To perform GAP assays, recombinant GAP domain of RASA1 (a constructknown as GAP-334) was added at a 1:3000 molar ratio to 40 µl of 250 µM 15NKRAS loaded with GTP. The sample was then placed in a 1.7 mm NMR tube toacquire sequential 1H-15N HSQC spectra during the GTP hydrolysis reaction. TheNMR data were processed and analyzed in a manner similar to that describedabove for nucleotide exchange.
Mass analysis of intact pKRAS. KRAS and pKRAS samples in 20 mM HEPES,100 mM NaCl, 5 mM MgCl2, 2 mM TCEP, 1 mM activated sodium vanadate, 2mM imidazole, 1 mM sodium fluoride, and 1.15 mM sodium molybdate at pH 7.4were diluted 1 to 5 with 20 mM Tris-Base, 5 mM MgCl2, 2 mM TCEP, pH 5.5 toobtain a final concentration of 50 µM. The accurate mass of these samples wereobtained using an Agilent 6538 Ultra High Definition (UHD) Quadrupole time-of-flight mass spectrometer run in positive mode with electrospray ionization.
Ion exchange chromatography. The mono-, di-, and un-phosphorylated forms ofKRAS were separated by anion exchange chromatography using a Mono Q 5/50GL column run with 20 mM HEPES pH 7.0, 5 mM MgCl2, and 1 mM TCEP(Buffer A) and 20 mM HEPES pH 7.0, 5 mM MgCl2, 1 mM TCEP, and 1M NaCl(Buffer B). The separation was achieved with an 80 column volume gradient of0–40% buffer B. Both the wash buffer and elution buffer contained phosphataseinhibitors (1 mM activated sodium vanadate, 2 mM imidazole, 1 mM sodiumfluoride, and 1.15 mM sodium molybdate) to stabilize the phosphorylated forms ofKRAS.
Liquid chromatography and MS. Kinase assay samples were reduced with DTT (5mM) and alkylated with iodoacetamide (10 mM) followed by overnight digestionwith trypsin (10 μg/ml in 50 mM NH4HCO3) at 37 °C. The resulting peptides werede-salted using reversed-phase C18 columns and lyophilized in a vacuum cen-trifuge. Samples were reconstituted in 0.1% HCOOH and analyzed by LC-MS.Using an EASY-nLC 1000 pump, samples were loaded in-line on an AcclaimPepMapTM 100 nanoViper pre-column (75 μm×2 cm, 3 μm) and resolved on anAcclaim PepMapTM RSLC nanoViper analytical column (75 μm×50 cm, 3 μm) overa 120-min acetonitrile gradient (0–40%) in a 0.1% HCOOH mobile phase. Positive-mode electrospray ionization was applied and ions were analyzed by MS using a Q-Exactive HF instrument set to perform MS/MS HCD fragmentation scans on up tothe 20 most intense ions (minimum ion count of 1000 for activation) from an MSparent ion scan (390–1800m/z range; 60,000 full-width half-maximum resolution@ 200m/z). Fragmented ions were placed on a dynamic exclusion list for 5 s.Acquired raw files were converted to the.mgf format using Proteowizard(v3.0.10800), then searched using X!Tandem (v2013.06.15.1) against HumanRefSeq Version 45 (36,113 entries). Search parameters specified a parent ion tol-erance of 15 ppm and a fragment ion tolerance of 0.4 Da, with one missed cleavageallowed for trypsin. Carbamidomethylation [C] was set as a fixed modification andoxidation [M], deamidation (N,Q), acetylation (Protein N-term), and phosphor-ylation (STY) were allowed as variable modifications. All data are publicly availableand have been uploaded to the MassIVE archive (https://massive.ucsd.edu).
Biolayer interferometry. The affinity of KRAS and pKRAS was determined usingan Octet RED-384 biolayer interferometry instrument equipped with the OctetData Acquisition 9.0.0.37 and FortéBio Data analysis software (Pall). The assay wasperformed using 96-well plates at 25 °C with 1000 rpm agitation in a buffercomprising 20 mM HEPES, 100 mM NaCl, 5 mM MgCl2, and 2 mM TCEP sup-plemented with 1% BSA and 0.005% Tween-20 to minimize nonspecific bindingand cocktail of phosphatase inhibitors (1 mM activated sodium vanadate, 2 mMimidazole, 1 mM sodium fluoride, and 1.15 mM sodium molybdate). GST-taggedBRAF-RBD (residues 150–233) (2.5 μg/ml) was immobilized to anti-GST-conjugated biosensors (Pall FortéBio), which were then dipped into wells con-taining increasing concentrations of KRAS for 30 s, followed by a dissociation stepin buffer. A sensor with immobilized BRAF-RBD was dipped into buffer only tosubtract instrument drift. The data were analyzed and fitted for global analysis toobtain KD values assuming one-to-one stoichiometry.
3D spheroid assay. In vitro 3D spheroid culture was performed using an Ultra-Low Attachment surface coating 96-well spheroid microplate (Corning). Briefly,
ARTICLE NATURE COMMUNICATIONS | https://doi.org/10.1038/s41467-018-08115-8
12 NATURE COMMUNICATIONS | (2019) 10:224 | https://doi.org/10.1038/s41467-018-08115-8 | www.nature.com/naturecommunications

equal numbers of cells were plated in 96-well spheroid microplates and cultured inthe presence or absence of the indicated inhibitors. Spheroid viability was deter-mined using the CellTiter-Glo 3D Cell viability assay according to the protocolprovided by the manufacturer.
Organoid cultures. PDAC organoid models used in this study were generated bythe Princess Margaret Living Biobank (PMLB) Organoid core facility (https://www.livingbiobank.ca/) from PDX tissues as per the published protocols68. All organoidsused in this study were characterized extensively by PMLB using the followingguidelines. Short tandem repeat (STR) profiling was performed on DNA isolatedfrom the organoid culture and the profile was compared with the STR profile of theprimary patient material. Second, organoid culture was embedded and histo-pathological analysis was performed to assess the morphological features. Immu-nohistochemistry was performed using antibodies that are clinically relevant to theorgan site. The doubling rate of each organoid was determined using short-termviability assays and Cell Titer Glo. Flow analysis using EPCAM antibodies was alsoperformed to ensure the epithelial origin of the organoids. Finally, mycoplasma testwas performed on all the established organoid models.
Organoid drug screening. Organoids were dissociated to single cells and seededon top of a thin layer of Matrigel in 384-well plate (3000/well). Next day, 11a-1 orSHP099 was added in a six-point concentration series to wells in triplicate. Cellviability was assessed by ATP quantification using the CellTiter-Glo 3Dluminescence-based assay. Viability values were normalized to vehicle controlwells. Experiment was repeated three times.
Tumor xenograft experiments. The University Health Network (UHN) AnimalCare Committee approved the animal study protocols. Thirteen male SCID miceaged 4–6 weeks were implanted with treatment-naive tumors generated frompancreatic-derived xenograft model OCIP.343 obtained from the PMLB CoreFacility (Toronto, Canada). When tumor size reached 200 mm3, the mice wererandomized into three treatment groups; control (n= 5), SHP099 (n= 5), andTrametinib (n= 3). SHP099 (100 mg/kg) and Trametinib (1 mg/kg) were admi-nistered via oral gavage daily. Tumor growth was measured twice per week untilthey reached 1.5 cm in diameter. Tumor volume was calculated as follows: length ×width2 × 0.52. At the end of the experiment, mice were sacrificed and tumor tissueswere harvested for either formalin fixation or immediate snap freezing in liquidnitrogen.
Statistical analyses. Unpaired two-tailed Student's t test was used to comparebetween treatment groups and cell types. All statistical analysis was performedusing the GraphPad PRISM 6.0 software unless otherwise stated. P value <0.05 wasconsidered statistically significant.
Reporting summary. Further information on experimental design is available inthe Nature Research Reporting Summary linked to this article.
Data availabilityData supporting the findings of this manuscript are available from the corre-sponding author upon reasonable request. The MS data are publicly available andhave been uploaded to the MassIVE archive (https://massive.ucsd.edu). The SourceData underlying Figs. 1f, 3c, d, 5b–e, and 6b and Supplementary Figs. 1a, b, e, f, h,2b, c, 3a, b, and 7a, b are provided as a Source Data file.
Received: 27 August 2018 Accepted: 17 December 2018
References1. Barbacid, M. ras genes. Annu. Rev. Biochem. 56, 779–827 (1987).2. Kano, Y., Cook, J. D., Lee, J. E. & Ohh, M. New structural and functional
insight into the regulation of Ras. Semin. Cell Dev. Biol. 58, 70–78 (2016).3. Campbell, S. L., Khosravi-Far, R., Rossman, K. L., Clark, G. J. & Der, C. J.
Increasing complexity of Ras signaling. Oncogene 17, 1395–1413 (1998).4. Hunter, J. C. et al. Biochemical and structural analysis of common cancer-
associated KRAS mutations. Mol. Cancer Res. 13, 1325–1335 (2015).5. Bunda, S. et al. Src promotes GTPase activity of Ras via tyrosine 32
phosphorylation. Proc. Natl Acad. Sci. USA 111, E3785–E3794 (2014).6. Bunda, S. et al. Inhibition of SHP2-mediated dephosphorylation of Ras
suppresses oncogenesis. Nat. Commun. 6, 8859 (2015).7. Mainardi, S. et al. SHP2 is required for growth of KRAS-mutant non-small-
cell lung cancer in vivo. Nat. Med. 24, 961–967 (2018).8. Ruess, D. A. et al. Mutant KRAS-driven cancers depend on PTPN11/SHP2
phosphatase. Nat. Med. 24, 954–960 (2018).
9. Fedele, C. et al. SHP2 inhibition prevents adaptive resistance to MEKinhibitors in multiple cancer models. Cancer Discov. 8, 1237–1249 (2018).
10. Wong, G. S. et al. Targeting wild-type KRAS-amplified gastroesophagealcancer through combined MEK and SHP2 inhibition. Nat. Med. 24, 968–977(2018).
11. Nichols, R. J. et al. RAS nucleotide cycling underlies the SHP2 phosphatasedependence of mutant BRAF-, NF1- and RAS-driven cancers. Nat. Cell Biol.20, 1064–1073 (2018).
12. Grewal, T., Koese, M., Tebar, F. & Enrich, C. Differential regulation ofRasGAPs in cancer. Genes Cancer 2, 288–297 (2011).
13. Cox, A. D., Fesik, S. W., Kimmelman, A. C., Luo, J. & Der, C. J. Drugging theundruggable RAS: mission possible? Nat. Rev. Drug Discov. 13, 828–851(2014).
14. Zeng, L. F. et al. Therapeutic potential of targeting the oncogenic SHP2phosphatase. J. Med. Chem. 57, 6594–6609 (2014).
15. Chen, Y. N. et al. Allosteric inhibition of SHP2 phosphatase inhibits cancersdriven by receptor tyrosine kinases. Nature 535, 148–152 (2016).
16. Theillet, F. X. et al. Cell signaling, post-translational protein modifications andNMR spectroscopy. J. Biomol. NMR 54, 217–236 (2012).
17. Bunda, S. et al. Inhibition of SRC corrects GM-CSF hypersensitivity thatunderlies juvenile myelomonocytic leukemia. Cancer Res. 73, 2540–2550(2013).
18. Kinoshita, E., Kinoshita-Kikuta, E. & Koike, T. Separation and detection oflarge phosphoproteins using Phos-tag SDS-PAGE. Nat. Protoc. 4, 1513–1521(2009).
19. Naing, A. et al. A phase I trial of KX2-391, a novel non-ATP competitivesubstrate-pocket- directed SRC inhibitor, in patients with advancedmalignancies. Invest. New Drugs 31, 967–973 (2013).
20. Marshall, C. B. et al. Characterization of the intrinsic and TSC2-GAP-regulated GTPase activity of Rheb by real-time NMR. Sci. Signal. 2, ra3(2009).
21. Smith, M. J., Neel, B. G. & Ikura, M. NMR-based functional profiling ofRASopathies and oncogenic RAS mutations. Proc. Natl Acad. Sci. USA 110,4574–4579 (2013).
22. Vigil, D., Cherfils, J., Rossman, K. L. & Der, C. J. Ras superfamily GEFs andGAPs: validated and tractable targets for cancer therapy? Nat. Rev. Cancer 10,842–857 (2010).
23. Zhang, R. Y. et al. SHP2 phosphatase as a novel therapeutic target formelanoma treatment. Oncotarget 7, 73817–73829 (2016).
24. Zheng, J. et al. Expression and prognosis value of SHP2 in patients withpancreatic ductal adenocarcinoma. Tumour Biol. 37, 7853–7859 (2016).
25. Zheng, J. et al. Pancreatic cancer risk variant in LINC00673 creates a miR-1231 binding site and interferes with PTPN11 degradation. Nat. Genet. 48,747–757 (2016).
26. Mohi, M. G. & Neel, B. G. The role of Shp2 (PTPN11) in cancer. Curr. Opin.Genet. Dev. 17, 23–30 (2007).
27. Bennett, A. M., Tang, T. L., Sugimoto, S., Walsh, C. T. & Neel, B. G. Protein-tyrosine-phosphatase SHPTP2 couples platelet-derived growth factor receptorbeta to Ras. Proc. Natl Acad. Sci. USA 91, 7335–7339 (1994).
28. Li, W. et al. A new function for a phosphotyrosine phosphatase: linkingGRB2-Sos to a receptor tyrosine kinase. Mol. Cell. Biol. 14, 509–517(1994).
29. Dance, M., Montagner, A., Salles, J. P., Yart, A. & Raynal, P. The molecularfunctions of Shp2 in the Ras/Mitogen-activated protein kinase (ERK1/2)pathway. Cell. Signal. 20, 453–459 (2008).
30. Agazie, Y. M. & Hayman, M. J. Molecular mechanism for a role of SHP2 inepidermal growth factor receptor signaling. Mol. Cell. Biol. 23, 7875–7886(2003).
31. Montagner, A. et al. A novel role for Gab1 and SHP2 in epidermal growthfactor-induced Ras activation. J. Biol. Chem. 280, 5350–5360 (2005).
32. Hanafusa, H., Torii, S., Yasunaga, T., Matsumoto, K. & Nishida, E. Shp2, anSH2-containing protein-tyrosine phosphatase, positively regulates receptortyrosine kinase signaling by dephosphorylating and inactivating the inhibitorSprouty. J. Biol. Chem. 279, 22992–22995 (2004).
33. Uezu, A. et al. Modified SH2 domain to phototrap and identifyphosphotyrosine proteins from subcellular sites within cells. Proc. Natl Acad.Sci. USA 109, E2929–E2938 (2012).
34. Ding, J., Soule, G., Overmeyer, J. H. & Maltese, W. A. Tyrosinephosphorylation of the Rab24 GTPase in cultured mammalian cells. Biochem.Biophys. Res. Commun. 312, 670–675 (2003).
35. Brucker, S., Gerwert, K. & Kotting, C. Tyr39 of ran preserves the Ran.GTPgradient by inhibiting GTP hydrolysis. J. Mol. Biol. 401, 1–6 (2010).
36. Tu, S., Wu, W. J., Wang, J. & Cerione, R. A. Epidermal growth factor-dependent regulation of Cdc42 is mediated by the Src tyrosine kinase. J. Biol.Chem. 278, 49293–49300 (2003).
37. Zou, J. X., Liu, Y., Pasquale, E. B. & Ruoslahti, E. Activated SRC oncogenephosphorylates R-ras and suppresses integrin activity. J. Biol. Chem. 277,1824–1827 (2002).
NATURE COMMUNICATIONS | https://doi.org/10.1038/s41467-018-08115-8 ARTICLE
NATURE COMMUNICATIONS | (2019) 10:224 | https://doi.org/10.1038/s41467-018-08115-8 | www.nature.com/naturecommunications 13
38. Hausdorff, W. P. et al. Tyrosine phosphorylation of G protein alpha subunitsby pp60c-src. Proc. Natl Acad. Sci. USA 89, 5720–5724 (1992).
39. Ting, P. Y. et al. Tyrosine phosphorylation of RAS by ABL allostericallyenhances effector binding. FASEB J. 29, 3750–3761 (2015).
40. Sveshnikova, N., Soll, J. & Schleiff, E. Toc34 is a preprotein receptor regulatedby GTP and phosphorylation. Proc. Natl Acad. Sci. USA 97, 4973–4978 (2000).
41. Jelic, M. et al. The chloroplast import receptor Toc34 functions as preprotein-regulated GTPase. Biol. Chem. 383, 1875–1883 (2002).
42. Moffitt, R. A. et al. Virtual microdissection identifies distinct tumor- andstroma-specific subtypes of pancreatic ductal adenocarcinoma. Nat. Genet. 47,1168–1178 (2015).
43. Boriack-Sjodin, P. A., Margarit, S. M., Bar-Sagi, D. & Kuriyan, J. Thestructural basis of the activation of Ras by Sos. Nature 394, 337–343 (1998).
44. Sondermann, H. et al. Structural analysis of autoinhibition in the Ras activatorSon of sevenless. Cell 119, 393–405 (2004).
45. Hall, B. E., Yang, S. S., Boriack-Sjodin, P. A., Kuriyan, J. & Bar-Sagi, D.Structure-based mutagenesis reveals distinct functions for Ras switch 1 andswitch 2 in Sos-catalyzed guanine nucleotide exchange. J. Biol. Chem. 276,27629–27637 (2001).
46. Frech, M. et al. Role of glutamine-61 in the hydrolysis of GTP by p21H-ras: anexperimental and theoretical study. Biochemistry 33, 3237–3244 (1994).
47. Pai, E. F. et al. Refined crystal structure of the triphosphate conformation ofH-ras p21 at 1.35 A resolution: implications for the mechanism of GTPhydrolysis. EMBO J. 9, 2351–2359 (1990).
48. Fetics, S. K. et al. Allosteric effects of the oncogenic RasQ61L mutant on Raf-RBD. Structure 23, 505–516 (2015).
49. Ford, B., Hornak, V., Kleinman, H. & Nassar, N. Structure of a transientintermediate for GTP hydrolysis by ras. Structure 14, 427–436 (2006).
50. Hall, B. E., Bar-Sagi, D. & Nassar, N. The structural basis for the transitionfrom Ras-GTP to Ras-GDP. Proc. Natl Acad. Sci. USA 99, 12138–12142 (2002).
51. Scheffzek, K. et al. The Ras-RasGAP complex: structural basis for GTPaseactivation and its loss in oncogenic Ras mutants. Science 277, 333–338 (1997).
52. Nur, E. K. M. S., Sizeland, A., D’Abaco, G. & Maruta, H. Asparagine 26,glutamic acid 31, valine 45, and tyrosine 64 of Ras proteins are required fortheir oncogenicity. J. Biol. Chem. 267, 1415–1418 (1992).
53. Yamasaki, K. et al. Site-directed mutagenesis, fluorescence, and two-dimensional NMR studies on microenvironments of effector region aromaticresidues of human c-Ha-Ras protein. Biochemistry 33, 65–73 (1994).
54. Buhrman, G., Holzapfel, G., Fetics, S. & Mattos, C. Allosteric modulation ofRas positions Q61 for a direct role in catalysis. Proc. Natl Acad. Sci. USA 107,4931–4936 (2010).
55. Zhang, S. & Yu, D. Targeting Src family kinases in anti-cancer therapies:turning promise into triumph. Trends Pharmacol. Sci. 33, 122–128 (2012).
56. Nagaraj, N. S., Smith, J. J., Revetta, F., Washington, M. K. & Merchant, N. B.Targeted inhibition of SRC kinase signaling attenuates pancreatictumorigenesis. Mol. Cancer Ther. 9, 2322–2332 (2010).
57. Arcaroli, J. J. et al. Gene array and fluorescence in situ hybridizationbiomarkers of activity of saracatinib (AZD0530), a Src inhibitor, in apreclinical model of colorectal cancer. Clin. Cancer Res. 16, 4165–4177 (2010).
58. Suwaki, N. et al. A HIF-regulated VHL-PTP1B-Src signaling axis identifies atherapeutic target in renal cell carcinoma. Sci. Transl Med. 3, 85ra47 (2011).
59. Okamoto, W. et al. Identification of c-Src as a potential therapeutic target forgastric cancer and of MET activation as a cause of resistance to c-Srcinhibition. Mol. Cancer Ther. 9, 1188–1197 (2010).
60. Ahn, J. H. & Lee, M. Suppression of autophagy sensitizes multidrug resistantcells towards Src tyrosine kinase specific inhibitor PP2. Cancer Lett. 310,188–197 (2011).
61. Chen, Y. et al. Combined Src and ER blockade impairs human breast cancerproliferation in vitro and in vivo. Breast Cancer Res. Treat. 128, 69–78 (2011).
62. Chen, Y. et al. Combined Src and aromatase inhibition impairs human breastcancer growth in vivo and bypass pathways are activated in AZD0530-resistant tumors. Clin. Cancer Res. 15, 3396–3405 (2009).
63. Seeliger, M. A. et al. High yield bacterial expression of active c-Abl and c-Srctyrosine kinases. Protein Sci. 14, 3135–3139 (2005).
64. Smith, M. J. & Ikura, M. Integrated RAS signaling defined by parallel NMRdetection of effectors and regulators. Nat. Chem. Biol. 10, 223–230 (2014).
65. Delaglio, F. et al. NMRPipe: a multidimensional spectral processing systembased on UNIX pipes. J. Biomol. NMR 6, 277–293 (1995).
66. Lee, W., Tonelli, M. & Markley, J. L. NMRFAM-SPARKY: enhanced softwarefor biomolecular NMR spectroscopy. Bioinformatics 31, 1325–1327 (2015).
67. Marshall, C. B. et al. Probing the GTPase cycle with real-time NMR: GAP andGEF activities in cell extracts. Methods 57, 473–485 (2012).
68. Boj, S. F. et al. Organoid models of human and mouse ductal pancreaticcancer. Cell 160, 324–338 (2015).
AcknowledgementsWe thank the members of the Ohh and Ikura laboratories for helpful discussions andcritical reading of this manuscript. We thank Jeremy Mogridge and Justin Maede(University of Toronto) for technical assistant with PhosTag SDS-PAGE analysis. Wethank Wenguang He for the purification of recombinant Src and SHP2. We thank G.Gasmi-Seabrook for NMR expertise. This work was supported by funds from theCanadian Institutes of Health Research (FDN-1542284 to M.I. and MOP-119356 to M.O.), Canadian Cancer Society Research Institute (703209 to M.I.), Princess MargaretFoundation (to M.I.), NIH RO1 CA207288 (to Z.-Y.Z.), Program for Advancing StrategicInternational Networks to Accelerate the Circulation of Talented Researchers from JapanSociety for the Promotion of Science and A Long-Term Overseas Research Fellowshipfrom Sumitomo Life Welfare and Culture Foundation (to Y.K.) and Cancer ResearchSociety, George and Helen Vari Foundation (to T.G.). The NMR facility at UHN issupported by Canada Foundation for Innovation.
Author contributionsY.K., T.G., and C.B.M. designed, performed, and interpreted the experiments; con-ceptualized the project; and wrote the manuscript. N.R. designed, performed, andinterpreted the organoid and tumor xenograft study. B.P.K.P. generated and performedexperiments using plasmids encoding KRAS and SHP2 mutants. J.S.-G. designed, per-formed, and interpreted the MS study. J.D.C. designed and purified recombinant Src. I.V.-S. performed and interpreted cell viability experiments. B.M.M.G assisted NMR study.B.R. designed and interpreted the MS study. M.S.I. designed and interpreted cell viabilityexperiments. J.E.L. designed and interpreted experiments involving recombinant Src. S.G.H. and J.J.Y. designed and interpreted PDX cell viability experiments. J.M. and Z.-Y.Z.designed and manufactured 11a-1 and interpreted SHP2 inhibitor study. M.S.T. designedand interpreted the organoid and tumor xenograft study. M.I. designed, interpreted, andwrote the NMR study. M.O. conceptualized the project, interpreted the data, and wrotethe manuscript.
Additional informationSupplementary Information accompanies this paper at https://doi.org/10.1038/s41467-018-08115-8.
Competing interests: The authors declare no competing interests.
Reprints and permission information is available online at http://npg.nature.com/reprintsandpermissions/
Journal peer review information: Nature Communications thanks John Colicelli, HanaAlgül, and the other anonymous reviewer(s) for their contribution to the peer review ofthis work. Peer reviewer reports are available.
Publisher’s note: Springer Nature remains neutral with regard to jurisdictional claims inpublished maps and institutional affiliations.
Open Access This article is licensed under a Creative CommonsAttribution 4.0 International License, which permits use, sharing,
adaptation, distribution and reproduction in any medium or format, as long as you giveappropriate credit to the original author(s) and the source, provide a link to the CreativeCommons license, and indicate if changes were made. The images or other third partymaterial in this article are included in the article’s Creative Commons license, unlessindicated otherwise in a credit line to the material. If material is not included in thearticle’s Creative Commons license and your intended use is not permitted by statutoryregulation or exceeds the permitted use, you will need to obtain permission directly fromthe copyright holder. To view a copy of this license, visit http://creativecommons.org/licenses/by/4.0/.
© The Author(s) 2019
ARTICLE NATURE COMMUNICATIONS | https://doi.org/10.1038/s41467-018-08115-8
14 NATURE COMMUNICATIONS | (2019) 10:224 | https://doi.org/10.1038/s41467-018-08115-8 | www.nature.com/naturecommunications