role of tyrosyl-dna-phosphodiesterase i in mitochondrial ... m... · role of...
TRANSCRIPT
Role of tyrosyl-DNA-phosphodiesterase I
in mitochondrial DNA repair
Martin Meagher
Thesis submitted to Newcastle University in
candidature for the degree of Doctor of Philosophy
Wellcome Trust Centre for Mitochondrial Research
Institute for Ageing and Health
April 2013

i
Abstract
The mechanisms for DNA repair in mitochondria is an area in which there is limited
knowledge in comparison to the DNA repair mechanisms that have been defined in the
nucleus. Although it is understood that mitochondria have less DNA repair mechanisms
than in the nucleus there is still a lot more scope for identifying new proteins involved
in the repair of mitochondrial DNA (mtDNA).
The main focus of this thesis was to attempt to determine whether there was presence
and activity of a DNA repair enzyme in mitochondria, namely tyrosyl-DNA-
phosphodiesterase 1 (TDP1), and if so what is the exact role of this enzyme in mtDNA
repair. This enzyme has already been characterised as an single strand break repair
(SSBR) enzyme in the nucleus, and a mutation in this gene can cause the autosomal
recessive disorder spinocerebellar ataxia with axonal neuropathy 1 (SCAN1).
The data in this thesis provides evidence for the presence and activity of TDP1 in
mitochondria and that the function of this enzyme on mtDNA is most likely limited to
the removal of mitochondrial topoisomerase 1 (TOP1mt). It has also been shown that
phosphorylation of amino acid 81 of TDP1 does not facilitate its interaction with DNA
ligase 3α in mitochondria and that there most probably no direct link between these
enzymes in this organelle, unlike that found in the nucleus.
This data indicates that there is still potential for identification of more enzymes that are
involved in mtDNA repair.

ii
Acknowledgements
To begin I would like to thank my supervisors Professors R.N. Lightowlers and D.M.
Turnbull for giving me the opportunity to take part in this MRes/PhD programme, and
for all their support and advice throughout my time in the group. Gratitude is also
shown to our collaborator Dr. Sherif El-Khamisy for all the help in making this project
possible and providing much needed knowledge on the intricacies of DNA repair. I
would also like to thank Professor Z.M. Chrzanowska-Lightowlers for the influence and
any input she has made with respect to my project in lab meetings etc.
I would also like to show appreciation to Dr K. Krishnan for her supervision of my
project while still in the lab. Thanks are made to Dr H. Tuppen and Mrs C. Alston for
all their help with any sequencing that I required.
Others to mention are the likes of Dr P. Smith and Mr. William ‘Willy’ Wilson for
helping to provide a very pleasant atmosphere to work in, and also as friends outside the
lab. This also includes all the people I have worked with in my time within the group,
which is something I will look back on fondly!
Lastly I would like to thank my parents, other family members, and friends for their
support while carrying out my studies and in helping to remind me that there are things
in the world other than mitochondria and Newcastle United!

iii
Table of contents
Abstract i
Acknowledgements ii
Table of contents iii
List of figures vi
List of tables viii
Abbreviations x
Chapter 1 1
1.1 General aspects of mitochondria 1
1.1.1 Mitochondrial evolution 2
1.1.2 Mitochondrial structure 3
1.1.3 Oxidative phosphorylation 4
1.1.4 Mitochondrial DNA 8
1.1.5 Mitochondrial involvement in disease and ageing 11
1.2 Mitochondrial DNA damage and repair 14
1.2.1 Forms of mitochondrial DNA damage 14
1.2.2 Mitochondrial DNA repair pathways and potential for further identification 16
1.3 Tyrosyl-DNA-phosphodiesterase 1 19
1.3.1 Function of enzyme in nucleus 20
1.3.2 Spinocerebellar ataxia with axonal neuropathy 1 21
1.3.3 Relationship with topoisomerase 1 22
1.3.4 Mitochondrial topoisomerase 1 24
1.4 Overall aims of study 26
Chapter 2. General materials and methods
2.1 Materials 28
2.1.1 Chemicals and reagents 28
2.1.2 Bacterial strains 28
2.1.3 Mammalian cell lines 28
2.1.4 Mouse strains 29
2.1.5 Vectors 30
2.1.6 DNA oligonucleotides 30
2.1.7 siRNA duplexes 31
2.2 General methods 32
2.2.1 Bacterial culture 32
i) Transformation of chemically competent cells 32
ii) Plasmid DNA isolation from bacteria 33
2.2.2 Tissue culture 33
i) Cell storage 33
ii) Cell maintenance 33
iii) Freezing cells for long term storage 34
iv) Thawing cells from long term storage 34
v) Cell counting 35
vi) Mycoplasma testing and treatment 35
vii) Transformation of Flp-InTM
T-RexTM
HEK293 cells 35
viii) Poly-L-ornithine treating flasks 36
2.2.3 Protein manipulation 36
i) Isolation of cytoplasmic protein from human cell lines 36
ii) Isolation of mitochondria from human cell lines 37
iii) Isolation of mitochondria from mouse brain 38

iv
iv) Mitochondrial purification 39
v) Mitochondrial localisation assay 39
vi) Protein quantification through Bradford assay 40
vii) SDS-PAGE 41
viii) Western blotting 43
2.2.4 DNA manipulation 45
i) DNA amplification by polymerase chain reaction 45
ii) Real-time polymerase chain reaction (qRT-PCR) to assess mtDNA copy
number 46
iii) Restriction digests of DNA 47
iv) DNA ligation 48
v) Gel electrophoresis of DNA 48
vi) Phenol/chloroform extraction of DNA constructs from agarose 48
vii) Phenol/chloroform extraction of DNA from mammalian cells in culture
49
viii) DNA quantification 50
ix) DNA sequencing 50
Chapter 3. Is TDP1 present and active in the mitochondrion? 51
3.1 Introduction 51
3.2 Methods 52
3.2.1 In vitro activity assay using mitochondrial extracts 52
3.3 Results 53
3.3.1 TDP1 is present and active in fibroblast mitochondrial extracts 53
3.3.2 TDP1 is active in LCL mitochondrial extracts 55
3.3.3 TDP1 is active in mouse brain mitochondrial extracts 57
3.4 Discussion and conclusions 59
Chapter 4. Is TDP1 essential in mtDNA repair and cell survival? 67
4.1 Introduction 67
4.2 Methods 69
4.2.1 Ionizing radiation treatment of mice 69
4.2.2 Methylmethane sulfonate (MMS) treatment of mice 70
4.2.3 Cytochrome c oxidase (COX)/succinate dehydrogenase (SDH) histochemistry 70
4.2.4 TOP1mt/FLAG and TOP1mtY559A
/FLAG expression experiments 71
4.2.5 siRNA transfection optimisation 73
4.2.6 siRNA transfection of Flp-InTM
T-RexTM
HEK293 74
4.2.7 siRNA transfection with TOP1mt/FLAG and TOP1mtY559A
/FLAG expression
experiment 75
4.3 Results 75
4.3.1 No COX negativity in Tdp1 -/- mouse brain or eye 75
i) No COX negativity in Tdp1 -/- mouse brain 76
ii) No COX negativity in Tdp1 -/- mouse brain following ƴ-irradiation 77
iii) No COX negativity in Tdp1 -/- mouse eye 78
iv) No COX negativity in Tdp1 -/- mouse eye following MMS treatment 79
4.3.2 Expression of TOP1mt/FLAG and TOP1mtY559A
/FLAG following stable
transfection 80
4.3.3 Localisation of TOP1mt/FLAG and TOP1mtY559A
/FLAG to mitochondria 81
4.3.4 No decreased cell growth, reduction of mtDNA encoded proteins, or reduction
in mtDNA copy number upon TOP1mtY559A
/FLAG expression 83
4.3.5 TDP1 siRNA transfection optimisation 85

v
4.3.6 No decreased cell growth, reduction in mtDNA encoded proteins, or reduction
in mtDNA copy number with TDP1 knockdown Flp-InTM
T-RexTM
HEK293 cells
86
4.3.7 Significantly decreased cell growth with TDP1 knockdown and expression of
TOP1mt/FLAG and TOP1mtY559A
/FLAG, but no reduction in mtDNA encoded
proteins, or reduction mtDNA copy number 88
4.4 Discussion 90
Chapter 5. Does next generation sequencing aid in discovering the exact role of
TDP1 in mtDNA repair? 98
5.1 Introduction 98
5.2 Methods 100
5.2.1 mtDNA sequencing using Ion TorrentTM
100
5.3 Results 104
5.3.1 Sequence data from expression/knockdown experiments 105
5.4 Discussion and conclusions 108
Chapter 6. Does phosphorylation of amino acid 81 in TDP1 promote association
with mitochondrial DNA ligase IIIα? 113
6.1 Introduction 113
6.2 Methods 114
6.2.1 Detecting expression of mtTDP1S81E
/FLAG and mtTDP1S81A
/FLAG 114
6.2.2 Protein complex immunoprecipitation (Co-IP) using of mtTDP1S81E
/FLAG and
mtTDP1S81A
/FLAG 115
6.2.3 Silver staining 117
6.2.4 Preparation of samples for mass-spectrometry analysis 118
6.3 Results 119
6.3.1 Expression mtTDP1S81E
/FLAG and mtTDP1S81A
/FLAG following stable
transfection 119
6.3.2 Mitochondrial localisation of mtTDP1S81E
/FLAG and mtTDP1S81A
/FLAG 120
6.3.3 Co-IP using FLAG-tagged expressers 121
i) Silver staining 122
ii) Mass spectrometry data 123
6.4 Discussion and conclusions 125
Chapter 7. Conclusions and future perspectives 136
Appendix 138
References 145

vi
List of figures
Figure Title Page
Number
1.1 Basic structure of mitochondria 3
1.2 A schematic of OXPHOS 5
1.3 Organisation of the human mitochondrial genome 9
1.4 General characterisation of short-patch (SP) and
long-patch (LP) BER mechanisms that repair mtDNA
damage 18
1.5 The mechanism of formation of DNA-TOP1 lesions, and
repair by TDP1 24
1.6 The binding sites of TOP1MT on mtDNA 26
3.1 Activity assay to assess TDP1 presence and activity in
fibroblast mitochondria 54
3.2 Activity assay to assess TDP1 presence and activity in
LCL mitochondria 56
3.3 Activity assay to assess TDP1 presence and activity in
mouse brain mitochondria 58
3.4 The proposed reaction mechanism for TDP1 on DNA-TOP1
cleavage complexes 62
4.1 COX/SDH histochemistry of mouse brain cerebellum 76
4.2 COX/SDH histochemistry of mouse brain cerebellum following
ƴ-irradiation 77
4.3 COX/SDH histochemistry and methyl green counterstaining of
mouse eye retina 78
4.4 COX/SDH histochemistry and methyl green counterstaining of
mouse eye retina following MMS treatment 79
4.5 Analysis of TOP1mt/FLAG and TOP1mtY559A
/FLAG
expression 81
4.6 Analysis of TOP1mt/FLAG and TOP1mtY559A/FLAG
mitochondrial localisation 82
4.7 Expression of TOP1mt/FLAG and TOP1mtY559A
/FLAG
for 6 days 84

vii
4.8 Analysis of TDP1 knockdown in Flp-InTM
T-RexTM
HEK293
cells 86
4.9 Analysis of TDP1 knockdown for 6 days in Flp-InTM
T-RexTM
HEK293 cells 87
4.10 Analysis of TDP1 knockdown and TOP1mt/FLAG and
TOP1mtY559A
/FLAG for 6 days 89
5.1 Detection of an incorporated nucleotide using Ion TorrentTM
technology 100
6.1 Analysis of mtTDP1S81E
/FLAG and mtTDP1S81A
/FLAG
expression 119
6.2 Analysis of mtTDP1S81E
/FLAG and mtTDP1S81A
/FLAG
mitochondrial localisation 121
6.3 Silver staining analysis to detect protein associations of
mtTDP1S81E
/FLAG and mtTDP1S81A
/FLAG 122

viii
List of Tables
Table Title Page
number
1.1 DNA repair mechanisms in the nucleus and mitochondrion 19
2.1 Vectors used and their application in this thesis 30
2.2 DNA oligonucleotides used for various techniques 30
2.3 siRNA duplexes used for siRNA knockdowns in
Flp-InTM
T-RexTM
HEK293 cells 31
2.4 Reaction set up for mitochondrial localisation assay 40
2.5 Reaction set up to make standard curve for Bradford
analysis 41
2.6 4% SDS-PAGE stacking gel reagents and volumes 42
2.7 10% SDS-PAGE resolving gel reagents and volumes 42
2.8 12% SDS-PAGE resolving gel reagents and volumes 42
2.9 Primary antibodies used for western blotting 44
2.10 Secondary antibodies used for western blotting 44
2.11 Reagents of a standard PCR 45
2.12 General PCR programme 46
2.13 Reagents and oligonucleotides used per qRT-PCR reaction 47
2.14 qRT-PCR programme used to determine mtDNA copy
number 47
5.1 LR-PCR reagents and programme used to generate mtDNA
fragments (≈8kb) in preparation for deep sequencing 101
5.2 Components and programme to ligate barcoded adapters to
sheared DNA 103
5.3 Reagents and PCR programme to amplify 150bp DNA
fragments in preparation for deep sequencing 104
5.4 Deep sequencing data of the control mouse mtDNA in pAM1
and human DNA samples following expression of
TOP1mt/FLAG and TOP1mtY559A
/FLAG for six days 106
ix
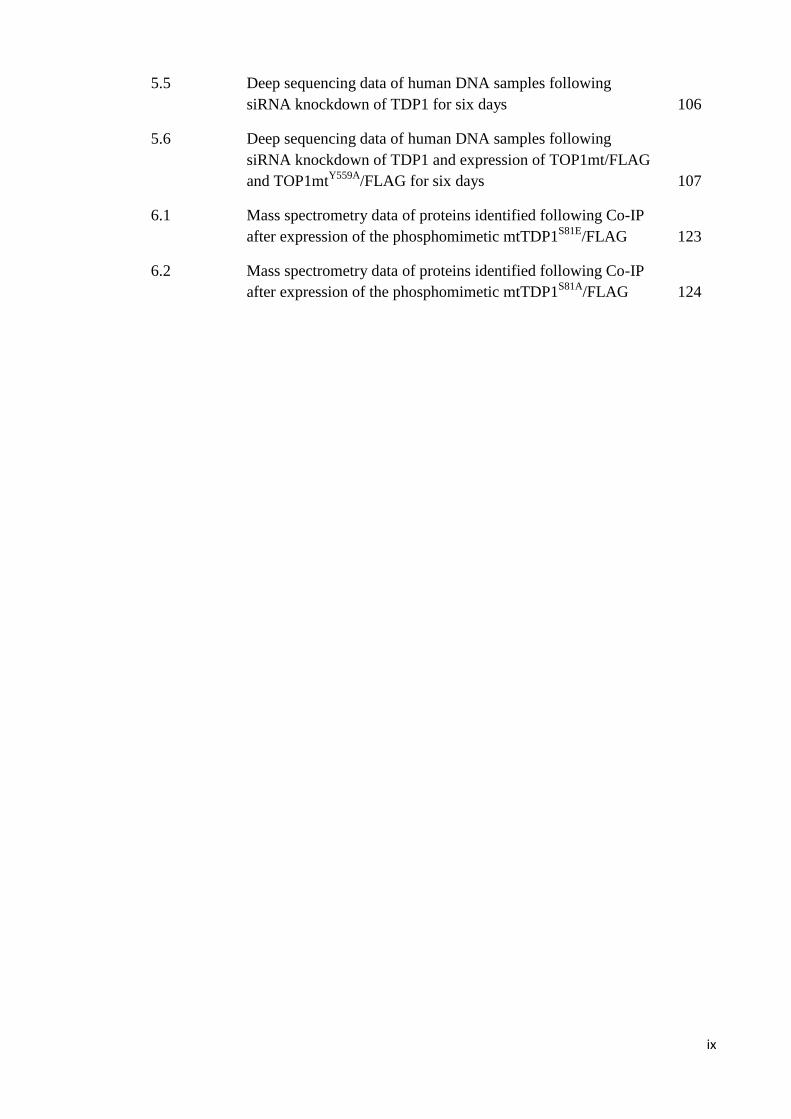
5.5 Deep sequencing data of human DNA samples following
siRNA knockdown of TDP1 for six days 106
5.6 Deep sequencing data of human DNA samples following
siRNA knockdown of TDP1 and expression of TOP1mt/FLAG
and TOP1mtY559A
/FLAG for six days 107
6.1 Mass spectrometry data of proteins identified following Co-IP
after expression of the phosphomimetic mtTDP1S81E
/FLAG 123
6.2 Mass spectrometry data of proteins identified following Co-IP
after expression of the phosphomimetic mtTDP1S81A
/FLAG 124

x
Abbreviations
2D-AGE Two-dimensional agarose gel electrophoresis
A Adenine
AD Alzheimer’s disease
AgNO3 Silver nitrate
AOA1 Ataxia with oculomotor apraxia type 1
APS Ammonium persulphate
ATP Adenosine triphosphate
BER Base excision repair
bp Base pairs
BSA Bovine serum albumin
C Cytosine
Co-IP Protein complex immunoprecipitation
CPEO Chronic progressive external ophthalmoplegia
CPT Camptothecin
D-loop Displacement loop
DAB 3,3'-Diaminobenzidine
DMEM Dulbecco’s modified Eagle’s medium
DMSO Dimethylsulphoxide
DNA Deoxyribonucleic acid
DNase Deoxyribonuclease
dNTP Deoxynucleotide triphosphate
DR Direct repair
DSB Double strand break
DSBR Double strand break repair
DTT Dithiothreitol
EDTA Ethylenediaminetetraacetic acid
EGTA Ethyleneglycoltetraacetic acid

xi
EtBr Ethidium bromide
EthBr/CsCl Ethidium bromide/caesium chloride
EtOH Ethanol
FCS Foetal calf serum
g Relative centrifugal force
G Guanine
Gy Gray
H2O Water
HEK293 Human embryonic kidney 293 cells
HeLa Henrietta Lacks cells
HR Homologous recombination
HSP Heavy strand promoter
IP Immunoprecipitation
kb Kilobases
KCl Potassium chloride
kDa KiloDalton
KSS Kearns-Sayre syndrome
LB Luria-Bertani bacterial medium
LCL Lymphoblastoid cell line
LHON Leber's hereditary optic neuropathy
LR-PCR Long range PCR
LSP Light strand promoter
MgCl2 Magnesium chloride
MMR Mismatch repair
MMS Methyl methane sulfonate
mRNA Messenger RNA
mtBER Mitochondrial BER
mtDNA Mitochondrial DNA

xii
MTS Mitochondrial targeting sequence
NaCl Sodium chloride
NaOAc Sodium acetate
NaOH Sodium hydroxide
NARP Neurogenic ataxia with retinitis pigmentosa
NBT Nitro blue tetrazolium
nDNA Nuclear DNA
NER Nucleotide excision repair
NH4OH Ammonium hydroxide
NHEJ Non-homologous end joining
NP-40 NonidetP-40
NTS Nuclear targeting sequence
Ori H Origin of heavy strand replication
Ori L Origin of light strand replication
OXPHOS Oxidative phosphorylation
PAGE Polyacrylamide gel electrophoresis
PBS Phosphate buffered saline
PCR Polymerase chain reaction
PD Parkinson’s disease
PMS Phenazine methosulfate
PMSF Phenylmethylsulfonyl fluoride
qRT-PCR Quantitative real time PCR
RITOLS Ribonucleotide incorporation throughout the lagging strand
RNA Ribonucleic acid
rRNA Ribosomal RNA
ROS Reactive oxygen species
SCAN1 Spinocerebellar ataxia with axonal neuropathy type 1
SDS Sodium dodecyl sulphate

xiii
siRNA Small interfering RNA
SOC Super Optimal Broth with Catabolite repression
SSB Single strand break
SSBR Single strand break repair
T Thymine
TAE Tris-acetate-EDTA buffer
TEMED N,N,N’,N’- Tetramethylethylendiamine
Tris Trishydroxyaminomethane
tRNA Transfer RNA
TTBS Tween-tris buffered saline
Tween-20 Polyoxyethylene sorbitanmonolaurate
Triton X-100 Polyethylene glycol octylphenyl ether
U Unit
UV Ultraviolet light

1
Chapter 1. Introduction
1.1 General aspects of mitochondria
Mitochondria are organelles present in almost all eukaryotes that have a vital role in
normal cellular functioning (Attardi and Schatz, 1988). One of the main responsibilities
of mitochondria is producing the vast majority of cellular energy in the form of
adenosine-triphosphate (ATP) through oxidative phosphorylation, although
mitochondria have a number of other roles in cells (Bonawitz and Shadel, 2007).
Examples of these include biosynthesis of amino acids, phospholipids, and nucleotides,
which are produced as a result of a close interplay with the nucleus (Attardi and Schatz,
1988).
Aberrant mitochondrial function can cause a wide variety of severe incurable diseases
and is also implicated in the ageing process (Bonawitz and Shadel, 2007). In recent
years the profile of mitochondrial research has been increased significantly due to its
importance in cells and the potential consequences that can occur as a result of
dysfunction in this organelle (Martin, 2012). Mitochondria require precise regulation to
prevent negative effects arising from abnormalities in these highly organised organelles.
Such organisation includes a double membrane structure, a distinct genome from that in
the nucleus (mitochondrial DNA (mtDNA)), as well as a vast proteome that controls an
extensive network of processes occurring in mitochondria (Bonawitz and Shadel, 2007).
Encompassed in this thesis are the findings from a project focussed on the molecular
mechanisms of mtDNA damage and repair, however, it is important to first review
general aspects of mitochondria to provide an understanding of the activities within this
fascinating entity.

2
1.1.1 Mitochondrial evolution
For many years it has been proposed that mitochondria originated in eukaryotes as a
result of endosymbiosis; a theory termed the serial endosymbiosis theory (Gray et al.,
1999). This theory attests that almost all modern day eukaryotic cells were formed when
archaeal and eubacterial cells were unified in anaerobic symbiosis before the
incorporation of mitochondria (Margulis, 1996). An exception to this is Giardia
intestina that does not contain mitochondria, and instead incorporates a less developed
form of mitochondria known as mitosomes (Henze and Martin, 2003, Tovar et al.,
2003). In contrast to mitochondria, mitosomes are not involved in producing ATP, and
instead are relied upon for producing iron-sulfur FeS clusters used in ATP production in
this organism (Henze and Martin, 2003, Tovar et al., 2003). Hydrogenosomes are
another form of mitochondria related organelle (found in Trichomonas vaginalis,
Giardia lamblia, Nyctotherus ovalis, Neocallimastix frontalis, and Psalteriomonas
lantern), which contrast to mitosomes in that they produce ATP through substrate-level
phosphorylation, but they are also similar to mitosomes as they produce FeS clusters
and are less developed than mitochondria (Shiflett and Johnson, 2010). The relevance of
FeS clusters in mitochondria is discussed later when reviewing the process of oxidative
phosphorylation. Returning to the subject of mitochondrial evolution, much support for
the serial endosymbiosis theory has come from the fact that mitochondria contain their
own genome (mtDNA), which is suggestive that this organelle has its own evolutionary
history (Gray et al., 1999). Sequencing the 16s ribosomal RNA (rRNA) gene within the
mitochondrial genome suggested that mitochondria were derived from an ancestor of
the alpha (α) subdivision of proteobacteria (Yang et al., 1985, Gray et al., 1999). The
human mitochondrial genome is relatively small in comparison to its nuclear
counterpart; encoding thirteen proteins involved in oxidative phosphorylation
(Anderson et al., 1981). This suggests that, as part of the evolution of eukaryotic cells,

3
mtDNA has lost the vast majority of its protein encoding regions to the nuclear DNA
(nDNA), as the mitochondrial proteome is far greater than that encoded by mtDNA
(Gray et al., 1999, Henze and Martin, 2003). Despite this loss mitochondria are capable
of performing a wide variety of activities as a result of the close relationship with the
nucleus that ultimately provides a myriad of proteins to give mitochondria the required
factors for these activities.
1.1.2 Mitochondrial structure
Electron microscopy has played a pivotal role in ascertaining the structure of
mitochondria with seminal studies in the 1950s that identified mitochondria as being
enclosed by a membrane, and containing protrusions that were named as cristae (Palade,
1952, Sjostrand, 1953). Soon after these findings a model was developed for
mitochondrial structure that is widely accepted today as being the true basic structure of
mitochondria, which is illustrated in figure 1.2 (Palade, 1953).
Figure 1.1. Basic structure of mitochondria (adapted from Palade, 1953).
From the work carried out by Palade it has since been established that the structure of
mitochondria can impact on metabolism depending on the condensation/swelling of this
organelle that can affect diffusion of metabolites and subsequently production of ATP
from oxidative phosphorylation (Hackenbrock, 1966, Scalettar et al., 1991). It has also
4
been found that mitochondria undergo fusion and fission processes to allow the
transport of energy and metabolites throughout the cell and to ensure that mitochondria
remain functional throughout environmental stresses (Palmer et al., 2011, Youle and
van der Bliek, 2012). The maintenance of this network of mitochondria is vital for
cellular homeostasis as any disruptions to this network can create a variety of
complications to the many important processes within mitochondria, including that of
oxidative phosphorylation (Palmer et al., 2011, Youle and van der Bliek, 2012). The
processes of fission and fusion of mitochondria are mediated by guanosine
triphosphatases (GTPases) that involve proteins such as dynamin related protein1
(DRP1) that functions in fission, whereas the mitofusin’s 1 (Mfn1) and 2 (Mfn2) play a
major role of fusion of mitochondria (Hoppins et al., 2007, Chen and Chan, 2005,
Smirnova et al., 2001). Not surprisingly the structure of cristae in fusion and fission
processes can be highly variable and therefore correct regulation and performance of
these processes is vital in maintaining ATP production through oxidative
phosphorylation (Mannella et al., 2001, Germain et al., 2005).
1.1.3 Oxidative phosphorylation
Oxidative phosphorylation (OXPHOS) is the process by which ATP is produced as a
result of a number of reduction/oxidation (redox) reactions along the electron transport
chain that are vital for cell survival (Papa et al., 2012). In mammalian cells more than
80% of ATP is produced through OXPHOS that is then utilised to drive numerous
processes in cells (Papa et al., 2012). During OXPHOS electrons are passed along the
electron transport chain coupled with transfer of protons from the matrix to the inter-
membrane space that creates an electrochemical gradient that is then used in ATP
production (Lemarie and Grimm, 2011). Figure 1.3 is a schematic of OXPHOS where
movement of electrons and protons ultimately leads to the production of ATP.

5
Figure 1.2. A schematic of OXPHOS, which simply illustrates that electrons are passed
along respiratory chain complexes I to IV whilst protons are moved across the inner
mitochondrial membrane and subsequently used to produce ATP (adapted from
Lemarie and Grimm, 2011).
Figure 1.3 simply demonstrates that the electron transport chain is located on the inner
mitochondrial membrane, however, the processes of electron transport and movement of
protons across the membrane is far more complex than is illustrated in this figure (Papa
et al., 2012, Lemarie and Grimm, 2011).
The process of OXPHOS often begins with the oxidation of NADH to NAD+ with
electrons being donated to flavin mononucleotide (FMN) in complex I (NADH
dehydrogenase) (Hirst, 2005, Sled et al., 1994). Complex I has been established as a
multi-subunit complex that has 14 core subunits that are present in all varieties of this
enzyme, seven of which are encoded in the nucleus and the other seven in the

6
mitochondrial genome (Efremov and Sazanov, 2012, Heide et al., 2012). The subunits
of this complex are assembled by multiple assembly factors (e.g. Acad9 and Ecsit) to
enable adequate function of the complex within the membrane (Heide et al., 2012).
Electron microscopy analysis outlined this complex in eukaryotes as being L-shaped
and within the inner membrane with the protruding arm extending out to the
mitochondrial matrix (Hofhaus et al., 1991). When NADH is oxidised by complex I at
this protruding arm the electrons are passed to FMN that is then reoxidised by an FeS
cluster and passed along eight FeS clusters before being used to reduce ubiquinone to
ubiquinol (Hirst, 2005, Sheftel et al., 2010). These FeS clusters are relevant in many
biochemical processes in the cell most probably due to the ability of the iron component
to accept electrons, which makes these clusters particularly valuable to OXPHOS
(Sheftel et al., 2010). When ubiquinone is reduced protons are translocated across the
inner membrane, thus beginning the accumulation of the electrochemical gradient
required for ATP production (Hirst, 2005). The reduced ubiquinol can then move
through the inner membrane for further redox reactions later in OXPHOS (Hirst, 2005).
In complex II (succinate dehydrogenase (SDH)) succinate from the citric acid cycle is
oxidised to fumarate and the electrons generated from this are passed to flavin adenine
dinucleotide (FAD) to form FADH2 which then passes the electrons through three FeS
clusters (Rutter et al., 2010). The electrons are then used to reduce ubiquinone, but
unlike the other complexes of the electron transport chain there is no transfer of protons
across the inner membrane as a result of activities in SDH (Rutter et al., 2010). This
complex consists of two main domains, one of which extends out into the matrix and
the other bound in the inner membrane (Hagerhall, 1997). The domain extending to the
matrix contains a dicarboxylate binding site for succinate as well as FAD and FeS
clusters for electron transport in this complex (Hagerhall, 1997). These electrons are

7
then used by the membrane bound domain in oxidation and reduction of ubiquinone in
the Quinone pool (Q pool) also present in the membrane (Hagerhall, 1997).
Several redox reactions in complex III (cytochrome bc1 complex) make the process of
electron transfer in this complex arguably the most complicated in the whole electron
transport chain (Cramer et al., 2011). Complex III consists of intertwined dimers with a
catalytic core made up of three subunits; cytochrome b, the FeS Rieske protein, and
cytochrome c1 (Mulkidjanian, 2010). The electron transport in complex III is known as
the Q cycle, which begins with oxidation of ubiquinol from the Q pool to ubiquinone
one electron being passed to the Rieske FeS protein and then on to cytochrome c1 before
being used to reduce the electron carrier cytochrome c (Mitchell, 1975, Mitchell, 1976).
The other electron from the oxidation of ubiquinol reduces cytochrome b that passes
across the membrane and is the used to reduce a molecule of ubiquinone to semiquinone
(Mitchell, 1975, Mitchell, 1976). Another molecule of ubiquinol is then reduced once
more, which passes another electron to the carrier cytochrome ci and then on to
cytochrome c thereby reducing it, while the other electron is used to reduce the
semiquinone molecule to fully reduced ubiquinol that re-enters the Q pool (Mitchell,
1975, Mitchell, 1976). During this process further protons are translocated from the
matrix into the inter-membrane space to increase the electrochemical gradient needed
for the final production of ATP (Mulkidjanian, 2010).
Complex IV, or cytochrome c oxidase, is the terminal oxidase of the electron transport
chain (Yoshikawa et al., 2012). In this complex electron transfer begins with oxidation
of cytochrome c that had been reduced in the Q cycle in complex III (Capaldi, 1990).
Electrons are accepted by heme a and CuA before being used to reduce molecular
oxygen to water in the mitochondrial matrix (Capaldi, 1990). During this process more

8
protons are translocated from the matrix to the inter-membrane space for the final step
of ATP production by complex V (ATP synthase) (Capaldi, 1990).
Generation of ATP by complex V involves the concerted action of two main subunits of
this enzyme, F0 and F1, that function in a fascinating rotary manner to produce the
molecules that are so vital to cells (Kinosita, 2012). The electrochemical gradient
created by the transfer of protons from the matrix to the inter-membrane space, by
complexes I, III, and IV induces flow of protons through F0 subunit of complex V and
results in this subunit rotating in a clockwise manner (Noji et al., 1997). Meanwhile the
F1 subunit rotates anti-clockwise, which causes conformational changes at three sites in
this subunit that ultimately couples proton flow through F0 with production of ATP
from ADP and Pi (Noji et al., 1997).
The production of ATP is essential to cells; therefore production of the complexes that
make up the electron transport chain is vital for cell survival. The vast majority of the
proteins that form these complexes are encoded by nDNA, however, a small number are
encoded by mtDNA and make-up an integral part of producing ATP through OXPHOS.
1.1.4 Mitochondrial DNA
For many years following the discovery and characterisation of DNA in the nucleus,
mitochondria were postulated to contain their own DNA which was finally
demonstrated in avian heart and liver (Rabinowitz et al., 1965). Following this
discovery came great advances in DNA sequencing techniques, namely sequencing with
chain-terminating dideoxynucleotides, which was used to sequence human mtDNA
(Sanger et al., 1977, Anderson et al., 1981). From this Anderson et al reported mtDNA
to contain two rRNA genes, twenty two transfer RNA (tRNA) genes, and five genes
encoding subunits of the electron transport chain with a further eight predicted protein
coding genes (Anderson et al., 1981). Later sequencing of the original placental mtDNA

9
sample used by Anderson et al with newer technology allowed revision of this sequence
to remove any discrepancies that had originally been observed (Andrews et al., 1999,
Anderson et al., 1981). The information provided from these sequencing experiments, in
addition to sequencing of mouse mtDNA by Bibb et al, identified mammalian mtDNA
as being highly organised with almost no non-coding nucleotides between coding
sequences (Anderson et al., 1981, Bibb et al., 1981b). In the time since these
publications it has been possible to establish the exact organisation of human mtDNA
which is illustrated in figure 1.4.
Figure 1.3. Organisation of the human mitochondrial genome (adapted from
http://www.mitomap.org/MITOMAP/mitomapgenome.pdf).
As can be seen in figure 1.4 the human mitochondrial genome is relatively small and it
is also known to be maternally inherited and present in multiple copies in cells
(Krishnan et al., 2007). The genome consists of two strands, the guanine rich heavy (H)
strand and the guanine poor light (L) strand (Kasamatsu et al., 1971). It is understood
that mtDNA molecules are clustered in DNA-protein structures known as nucleoids

10
where 2-10 copies of mtDNA are packaged by proteins (e.g. mitochondrial transcription
factor A (TFAM)) that are also involved in mtDNA maintenance and gene expression
(Spelbrink, 2010). Replication and transcription of mtDNA occurs independently of
nDNA although all of the factors involved in regulating these processes are encoded by
the nuclear genome (Krishnan et al., 2007, Shadel and Clayton, 1997).
Replication of mtDNA was first proposed to occur in a strand uncoupled manner
whereby leading strand replication was initiated from Ori H which continued around the
genome with lagging strand replication initiated when the leading strand reached Ori L
(Robberson et al., 1972). This mode for mtDNA replication was termed the strand-
displacement model and was developed as a result of electron microscopic analysis
showing that replicating molecules of mtDNA had a single-stranded branch (Robberson
et al., 1972). This form of replication was corroborated with the use of ethidium
bromide/caesium chloride (EthBr/CsCl) gradients and in vivo labelling of mtDNA using
radiolabelled thymidine (Berk and Clayton, 1974). These experiments helped to
determine the relative densities of replicating molecules of mtDNA that supported
previous experiments using electron microscopy and suggested mtDNA replication
progressed in an asynchronous manner (Berk and Clayton, 1974). The use of 2-
dimensional agarose gel electrophoresis (2-D AGE) was utilised to contradict the
strand-displacement model, and instead a bidirectional mode of replication from an
origin downstream of Ori H was proposed (Bowmaker et al., 2003, Holt et al., 2000).
However, the argument for unidirectional replication initiation was revitalised with the
discovery of ribonucleotide incorporation throughout the lagging strand (RITOLS) that
was proposed to supersede the bidirectional model (Yasukawa et al., 2006). To date the
exact mechanism by which mtDNA is replicated remains to be elucidated, but work in
the field is on going as is that involving the expression of genes encoded by mtDNA.

11
Transcription of human mtDNA is initiated at three points within the genome; the heavy
strand promoter (HSP) 1 (H1), the HSP promoter 2 (H2), and the light strand promoter
(LSP) (Falkenberg et al., 2007). Transcription from H1 results in the production of a
bicistronic unit of mRNA for two rRNA molecules encoded in the genome (Falkenberg
et al., 2007). Transcription initiation from H2 and LSP results in the production of a
polycistronic mRNA unit from each strand that undergoes cleavage processes to
produce the final mRNA molecules that can be used in translation (Falkenberg et al.,
2007, Montoya et al., 1981, Ojala et al., 1981). These cleavage processes are thought to
take place immediately before and after tRNA sequences in the genome (Ojala et al.,
1981). Transcription initiation of mtDNA is dependent on the interaction of the
mitochondrial RNA polymerase (POLRMT) with TFAM, B1 (TFB1M), and B2
(TFB2M) (Falkenberg et al., 2002, McCulloch et al., 2002). To date the only
transcription termination to be characterised is that from promoter H1 and involves the
mitochondrial transcription termination factor (MTERF) with termination of the other
mRNA units yet to be identified (Falkenberg et al., 2007, Kruse et al., 1989). Current
knowledge of the processing of mitochondrial mRNA transcripts includes
polyadenylation by the mitochondrial poly-A-polymerase (MTPAP) before synthesis of
each of the 13 OXPHOS proteins encoded by mtDNA is performed on the inner
mitochondrial membrane by the mitoribosome (Crosby et al., 2010, Sharma et al.,
2003).
As mentioned earlier it has been established that there are multiple copies of mtDNA
molecules in cells and that these are packaged in ‘nucleoids’ that can comprise many
mtDNA molecules as well as proteins; most notably the TFAM (Kukat et al., 2011,
Hallberg and Larsson, 2011). Despite mtDNA appearing to be very well organised,
mitochondria still rely heavily on the nuclear encoded proteins and, as with all

12
biological systems, errors can be made and damage can develop in a variety forms that
lead to an abundance of diseases as a result of mitochondrial dysfunction.
1.1.5 Mitochondrial involvement in disease and ageing
With mitochondria having a critical role in cells any dysfunction in this organelle can
present in a number of diseases. These can be caused by mutations in mtDNA (primary
causes), mutations in nuclear genes can also impact on many mitochondrial processes
(secondary causes), and somatic damage to DNA/proteins during ageing can influence
mitochondrial function (Schapira, 2012). Common mitochondrial diseases that result
from mutations in mtDNA include neurogenic ataxia with retinitis pigmentosa (NARP)
and Leber's hereditary optic neuropathy (LHON) whilst mutations in nuclear genes
encoding proteins such as the mitochondrial DNA polymerase ƴ (POLG) and the
mtDNA helicase twinkle can also cause mitochondrial disease in the form of chronic
progressive external opthalmoplegia (CPEO) (Schapira, 2012). Mutations in either
mtDNA or nDNA that affect components of the electron transport chain often present in
infancy or early childhood and are frequently fatal, thus emphasising the importance of
OXPHOS to cells and the whole body (Schapira, 2012). Mutations in the genes
encoding Parkin and PTEN-induced putative kinase 1 (PINK1) are known to affect
mitochondrial function which is related to the neurodegenerative disorder, Parkinson’s
disease (PD) (Gegg and Schapira, 2011). Mitochondrial dysfunction has also been
observed in patients with Alzheimer’s disease (AD) although a causative role for
mitochondria in this disease has yet to be proven unequivocally (Howell et al., 2005).
The diseases outlined are just a small collection of multiple disorders that involve
mitochondrial dysfunction, but the exact role of mitochondria in ageing has yet to be
fully established.

13
In the 1950s it was proposed that oxidative damage caused by reactive oxygen species
(ROS) accumulates in cells over time and that this results in impaired cell function
which will eventually lead to death (Harman, 1956). This appears to be an attractive
explanation for ageing with respect to mitochondria as increased ROS can be generated
as a result of electron leakage from the electron transport chain (Lemarie and Grimm,
2011). The increased levels of ROS could cause more damage to mitochondrial
components that in turn could generate more ROS and therefore further damage that
increases with time; a phenomenon described as the vicious cycle (Jang and Remmen,
2009). However, mouse models in which mtDNA point mutations are greatly increased
and lead to early onset of an ageing phenotype do not display increased ROS
production, which provides evidence to contradict the vicious cycle of damage proposed
for mitochondria (Trifunovic et al., 2004, Trifunovic et al., 2005, Park and Larsson,
2011). Although this evidence would suggest that this vicious cycle of damage in
mitochondria does not cause ageing it is clear that there are many negative effects that
have been observed in mitochondria with increasing age, such as increased mtDNA
mutation load and mtDNA deletion levels (Bender et al., 2006, Krishnan et al., 2007).
These mtDNA mutations and deletions clonally expand with age, but whether this is
just a sign of ageing or actually contributes to the ageing phenotype is unknown
(Krishnan et al., 2007). An alternative hypothesis is that mtDNA mutations occur as a
result of replication errors during embryogenesis, and subsequently expand during
ageing suggesting that oxidative damage does not have a leading role in mtDNA
mutation formation (Larsson, 2010). Even with this in mind it would be naïve to assume
that oxidative damage does not affect the ability of mtDNA to provide subunits of the
electron transport chain as there are a number of mechanisms by which mtDNA can be
damaged (Boesch et al., 2011). The study of mtDNA damage is the main theme of this
thesis and will be discussed in greater detail in the following sections.

14
1.2 Mitochondrial DNA damage and repair
Damage to mtDNA can occur in a variety of forms and potentially have devastating
effects in cells (Cline, 2012, Boesch et al., 2011). While knowledge for the potential
mechanisms of mtDNA damage is well known, the actual study of how damaging
agents affect mtDNA and its consequences in disease and ageing is much less
characterised in comparison to the nucleus (Boesch et al., 2011). Although a significant
proportion of research funding is directed to the study of nDNA damage and repair in
comparison to the same subject for mtDNA there is a relative lack of knowledge in this
field considering the advances that have been made in researching other areas of
mitochondrial biology. Much attention in the area of mitochondrial damage has been
devoted to studying the effects of ROS that can damage proteins and DNA within
mitochondria (Roede and Jones, 2010). In this section attention will be given to known
forms of mtDNA damage as well as the current knowledge surrounding repair of this
damage and potential for further findings.
1.2.1 Forms of mitochondrial DNA damage
There are a number of agents that can cause DNA damage and with mitochondria
producing a considerable amount of ROS this will be reviewed first with respect to
mtDNA damage. As discussed previously ROS can be generated endogenously, but
they can also be formed from exogenous factors such as pollution and ultra violet (UV)
radiation (Boesch et al., 2011). As wells as generating ROS, UV radiation can cause
DNA damage as the absorption spectrum of DNA matches the wavelength of UV
radiation (100-400nm), which can lead to direct excitation of DNA and form pyrimidine
dimers (Batista et al., 2009). This alteration can cause instability of DNA and/or

15
mutations in the nucleotide sequence (Boesch et al., 2011). Exogenously or
endogenously generated ROS include superoxide (O2-), hydroxyl radicals (
.OH), and
hydrogen peroxide (H2O2) (Boesch et al., 2011). The .OH radical is highly reactive
towards DNA and can form damage as well as causing oxidation of unsaturated bonds
in polyunsaturated fatty acids (PUFAs) present in the inner mitochondrial membrane
(Halliwell and Gutteridge, 1984, Colbeau et al., 1971). The oxidation of PUFAs
produces aldehyde products that are usually neutralised by enzymes such as aldehyde
dehydrogenase and cause no problem (Esterbauer et al., 1991). However, in
circumstances of increased ROS this neutralisation may not occur meaning that these
reactive aldehydes are capable of damaging mtDNA (Schlame et al., 2005, Voulgaridou
et al., 2011). In the case of O2- approximately 0.15% of oxygen consumed by
mitochondria forms this radical with complexes I and III being the main sites for its
production (St-Pierre et al., 2002, Brand, 2010). ROS can damage mtDNA by forming
adducts such as thymine glycol and the well studied 8-hydroxyguanine (8-oxo-G), as
well as forming strand breaks and abasic sites in mtDNA (Boesch et al., 2011, Ohno et
al., 2009, Evans et al., 2004, Dizdaroglu et al., 2002). In addition to modifying bases
within the backbone of mtDNA, oxidation of nucleotides in the deoxynucleotide
triphosphate (dNTP) pool can occur which may then become incorporated within
mtDNA by POLG upon replication (Boesch et al., 2011, Kamiya and Kasai, 1995). In
addition to ROS reactive nitrogen species (RNS) can be formed as a result of a
combination of O2- and nitric oxide (NO
.) which forms peroxynitrite (ONOO
-) and is
highly reactive, potentially being very damaging to mtDNA by oxidising bases and also
generating abasic sites (Boesch et al., 2011, Burney et al., 1999). As well as adducts
being formed in mtDNA by ROS and RNS it is also possible for adducts to be derived
from alkylating agents produced endogenously and also from ultra violet (UV) light,

16
which forms thymine dimers within the DNA backbone (Boesch et al., 2011, Xiao and
Samson, 1993).
The various lesions described here are just some examples that can potentially be very
detrimental to the cell and so mitochondria possess repair mechanisms to reverse these
forms of mtDNA damage.
1.2.2 Mitochondrial DNA repair pathways and potential for further identification
In the mid-1970s a study was carried out to assess the capability of mitochondria to
repair UV induced mtDNA damage in the form of pyrimidine dimers that would require
the repair mechanism nucleotide excision repair (NER), but it was found that
mitochondria did not have this capability (Clayton et al., 1974). From this many
concluded that mitochondria did not contain any DNA repair capabilities for some time
until this was disproven by demonstrating the existence of base excision repair (BER) in
mitochondria (Bogenhagen, 1999, Mason et al., 2003). From this it has been found that
mitochondria are able to repair various lesions in mtDNA, which is more than was
initially anticipated (Yakes and Van Houten, 1997, Liu and Demple, 2010, Mason and
Lightowlers, 2003).
As described in the previous section ROS can be generated from exogenous factors such
as pollution or endogenously from processes such as OXPHOS, which can result in
many forms of DNA damage (Boesch et al., 2011). Defence against such damaging
agents can come in the form of antioxidants such as superoxide dismutases and
peroxidases that act to detoxify ROS before damage can occur (Foyer and Noctor, 2009,
Turrens, 2003, Chaudiere and Ferrari-Iliou, 1999) However, there are occasions when

17
damaging ROS escape detoxification and cause a wide variety of DNA lesions that
require various repair mechanisms to restore DNA to its original form and avoid any
negative impact as a result of this damage (Boesch et al., 2011).
Of the DNA repair pathways in mitochondria BER has been the most studied and was
demonstrated to exist for both short-patch and long-patch versions of this pathway
(Stierum et al., 1999, Liu et al., 2008). Figure 1.5 illustrates how both these forms of
BER operate to repair damage that occurs in vivo, and the enzymes that are involved in
these processes.

18
Figure 1.4. General characterisation of short-patch (SP) and long-patch (LP) BER
mechanisms that repair mtDNA damage. The process is initiated when a damaged base
is excised from the DNA backbone by a DNA glycosylase leaving an abasic (AP) site.
The DNA backbone is then cleaved by an AP endonuclease followed by infilling of the
abasic site by DNA polymerase in SP-BER. In some circumstances the 3’ end at the
abasic site does not consist of OH following cleavage by the AP endonuclease, which
then requires a flap endonuclease to remove 2-10 bases of DNA before infilling can be
carried out by the DNA polymerase. Once the correct bases have been replaced a DNA
ligase then restores the DNA backbone to its original form (adapted from Boesch et al.,
2011).
Along with BER in mitochondria other repair mechanisms have been reported in
mitochondria such as mismatch repair (MMR), and removal of oxidised dATP and
dGTP from the dNTP pool (Mason et al., 2003, Nakabeppu, 2001b). Removal of these
oxidised dNTPs (8-oxo-2′-dATP and 8-oxo-dGTP) is performed by MutT homolog 1
(MTH1) as a protection of oxidised bases being incorporated within replicating mtDNA
(Kang et al., 1995, Nakabeppu, 2001a). In cases where oxidised bases are incorporated
during replication or when errors are made in this process MMR serves to remove errors

19
made in the nascent strand of replicating mtDNA by the enzyme YB-1 (Hsieh and
Yamane, 2008, Mason et al., 2003, de Souza-Pinto et al., 2009). Direct repair (DR) of
DNA without any cleavage of the DNA backbone has also been demonstrated to exist in
mitochondria mediated by O6-methylguanine-DNA methyltransferase (MGMT), which
removes methyl groups from modified guanine bases (Myers et al., 1988). Further
repair mechanisms have been proposed to be present in mitochondria, such as double
strand break repair (DSBR) by non-homologous end joining (NHEJ) and homologous
recombination (HR); however these processes have not yet been unequivocally
demonstrated in this organelle (Thyagarajan et al., 1996, Bacman et al., 2009,
Lakshmipathy and Campbell, 1999a, Fukui and Moraes, 2009). Despite this
mitochondria potentially have a more developed repair network than initially anticipated
and by turning to repair mechanisms for nDNA it was hoped that more information
could be found for the repair capabilities for mtDNA.
1.3 Tyrosyl-DNA-phosphodiesterase 1
Tyrosyl-DNA-phosphodiesterase 1 (TDP1) is an enzyme involved in DNA repair in the
nucleus (Yang et al., 1996). The repair of nDNA has been well studied when compared
to that for mtDNA, and therefore repair in the nucleus is relatively well characterised in
comparison to the mitochondrion (Boesch et al., 2011). Table 1.1 shows the DNA repair
mechanisms that are known to exist in the nuclear and mitochondrial compartments of
the cell.
Table 1.1. DNA repair mechanisms in the nucleus and mitochondrion (adapted from
Boesch et al., 2011).
Nucleus
Mitochondrion
BER NER MMR DSBR DR SSBR BER MMR DSBR SSBR DR
20
Of the repair mechanisms in mitochondria single strand break repair (SSBR) had yet to
be characterised at the beginning of this project. Experiments to determine whether
SSBR existed in mitochondria were to be carried out by investigating the function of
TDP1, which is involved in SSBR in the nucleus.
1.3.1 Function of TDP1 enzyme in nucleus
The discovery of TDP1 came in 1996 when it was found that cleavage complexes
formed from type I topoisomerases could be resolved by the activity of TDP1 (Yang et
al., 1996). This was established using cell extracts from Saccharomyces cerevisiae and a
radiolabelled oligonucleotide with a 3’ phosphotyrosine to mimic the DNA-
topoisomerase 1 (TOP1) lesion that forms in vivo (Yang et al., 1996). Following this
discovery a plethora of publications has arisen that provide further information on
classification of this enzyme and the exact function of TDP1 in repairing DNA-TOP1
lesions in the nucleus. Sequence comparison studies identified TDP1 as a member of
phospholipase D (PLD) superfamily due to the presence of two histidine-lysine-aspartic
acid (HKD) signature motifs that are characteristic of members of this family (Interthal
et al., 2001). The HKD motifs in TDP1 are unusual in that they do not contain the
aspartic acid (D) and in place there is an asparagine (N) that categorises TDP1 in a
distinct class within the PLD family (Interthal et al., 2001). Other notable findings
regarding TDP1 include the discovery that this enzyme can resolve other substrates than
3’ phosphotyrosine, such as 3’ phosphoglycolate and 3’ phosphohistidine, which
suggests an important role for TDP1 in cells (Interthal et al., 2005, Inamdar et al.,
2002). Also, it was found that in repairing DNA-TOP1 SSBs TDP1 acts in concert with
other proteins including X-ray repair cross-complementing protein 1 (XRCC1),
polynucleotide kinase (PNK), and DNA ligase IIIα (LIG3α) (Plo et al., 2003, El-

21
Khamisy et al., 2005, Debethune et al., 2002). However, arguably the most important
finding came with the identification that mutations in TDP1 (A1478G) are the causative
factor in the autosomal recessive disorder spinocerebellar ataxia with axonal neuropathy
1 (SCAN1) (Takashima et al., 2002). It was found that this mutation in TDP1 caused a
change in the active site of the enzyme resulting in a loss of function that produces
SCAN1 (Takashima et al., 2002, Raymond et al., 2004).
1.3.2 Spinocerebellar ataxia with axonal neuropathy 1
Identification of SCAN1 was established with the mutational analysis that characterised
the A1478G mutation in TDP1 as being responsible for causing this disease in a large
Saudi Arabian family (Takashima et al., 2002). Discovery of this mutation in TDP1
came as a result of members of this family displaying a co-occurrence of
spinocerebellar ataxia and peripheral neuropathy, but no indication of mutations in
genes that had already been associated with ataxia and neuropathy (Takashima et al.,
2002). All members of the family with this disease had normal intelligence, but
accompanying the ataxia and neuropathy was mild cerebellar atrophy with
hypercholesterolemia and hypoalbuminemia (Takashima et al., 2002). As the number of
diagnosed individuals was relatively low further studies surrounding this disease were
limited, therefore when a Tdp1 -/- mouse was developed the opportunity for greater
insight into the role of TDP1 in vivo was presented (Katyal et al., 2007). In these mice a
mutation in the Tdp1 gene caused the subsequent protein to be unstable which
effectively resulted in a loss of function (Katyal et al., 2007). Although the mutation in
these mice was not exactly the same as in the SCAN1 patients the phenotype of these
animals was very similar (ataxia, hypoalbuminemia etc.), which made them the ideal
model for studying the role of TDP1 in vivo (Katyal et al., 2007). It was found that in

22
cerebellar neurons and primary astrocytes in these mice SSBs persisted and were
unrepaired in comparison to wild type controls, which led to an age-dependent
cerebellar atrophy as a consequence (Katyal et al., 2007). This demonstrates
significance of DNA repair enzymes in normal cellular functioning and how a slight
alteration in the interactions between enzymes associated with DNA can have drastic
effects on the whole body level.
1.3.3 Relationship with topoisomerase 1
Although the function of TDP1 has been discussed the mechanism of formation of the
DNA-TOP1 lesions has yet to be explained as has the history behind the identification
of topoisomerases. The first topoisomerase, named protein ω at the time, was identified
in Escherichia coli and was found to relax DNA from its superhelical structure in these
organisms (Wang, 1971). From this a variety of topoisomerases have been characterised
with several functions that alter the structure of DNA in preparation for transcription
and replication (Vos et al., 2011). Although many different topoisomerases have been
identified one characteristic that remains for all is that scission of DNA by these
enzymes is mediated by a nucleophilic tyrosine (Vos et al., 2011). Furthermore, all
topoisomerases are classified within two groups, type I and type II, and are subdivided
within these groups into subtypes A, B, and C depending on sequence similarity
between different topoisomerases and/or structural similarities that may exist between
proteins (Vos et al., 2011).
For type IA topoisomerases DNA is incised on one strand and the second strand is
passed through the gap of this intermediate before the first strand is resealed, which
altogether relaxes supercoiled DNA (Tse et al., 1980). In contrast type IB, in which

23
TOP1 belongs, and IC topoisomerases nick a strand of DNA and rotate this strand
around the other before resealing takes place (Koster et al., 2005). The difference
between type IB and IC topoisomerases comes in the structure of these enzymes and
that type IC topoisomerases are not found in eukaryotes (Slesarev et al., 1993). Type
IIA topoisomerases function in a similar way to type IA topoisomerases with the most
notable difference being that in type IIA both strands of DNA are cleaved whereas in
type IA only one strand is broken (Liu et al., 1980). A second class of type II
topoisomerases exists (type IIB), however the exact mechanism by which this group of
topoisomerases functions remains to be elucidated (Vos et al., 2011).
The focus of this thesis involves TOP1, which has a relationship with TDP1 in that it is
removed from DNA by this enzyme, as discussed earlier (Yang et al., 1996). Lesions
where TOP1 becomes covalently bound to DNA can occur when TOP1 collides with
DNA or RNA polymerases or when TOP1 incises DNA in close proximity to another
form of DNA damage; resulting in this enzyme being covalently linked to the 3’ end of
the DNA substrate (Caldecott, 2008). Figure 1.6 illustrates one mechanism by which
these DNA-TOP1 lesions are formed and how TDP1 acts to repair these lesions.

24
Figure 1.5. The mechanism of formation of DNA-TOP1 lesions, and repair by TDP1.
(A) DNA or RNA polymerases can collide with TOP1 resulting in the protein being
covalently bound to the 3’ end of the DNA by a phosphotyrosine bond, which requires
TDP1 to act in cleaving this bond seen in (B). Once the topoisomerase has been
removed by TDP1 the status of the 3’ end of DNA at the (SSB) is 3’ phosphate, which
requires action of a phosphatase (C) to restore the 3’ end to OH in preparation for re-
ligation by a DNA ligase (D) (adapted from Caldecott. 2008).
Figure 1.6 demonstrates the importance of TDP1 to repair of DNA-TOP1 lesions and
with the identification of a mitochondrial form of TOP1 (TOP1MT) the possibility that
TDP1 may function in the mitochondrion was implied (Zhang et al., 2001).
1.3.4 Mitochondrial topoisomerase 1
The first indication of topoisomerase activity in mitochondria was discovered in rat
liver mitochondria and the enzyme activity was found to be distinct from the activity of
nuclear TOP1 (Fairfield et al., 1979). However, it was not for another twenty years
before the actual gene encoding TOP1MT was found, which was established as a
paralog of the nuclear TOP1 and contained a mitochondrial targeting sequence (Zhang
et al., 2001, Zhang et al., 2007). With this finding it may have been assumed that much
of the substrate specificity and mode of activity characteristics for TOP1MT were the
same as for the nuclear TOP1; however this was proposed not to be true with a study
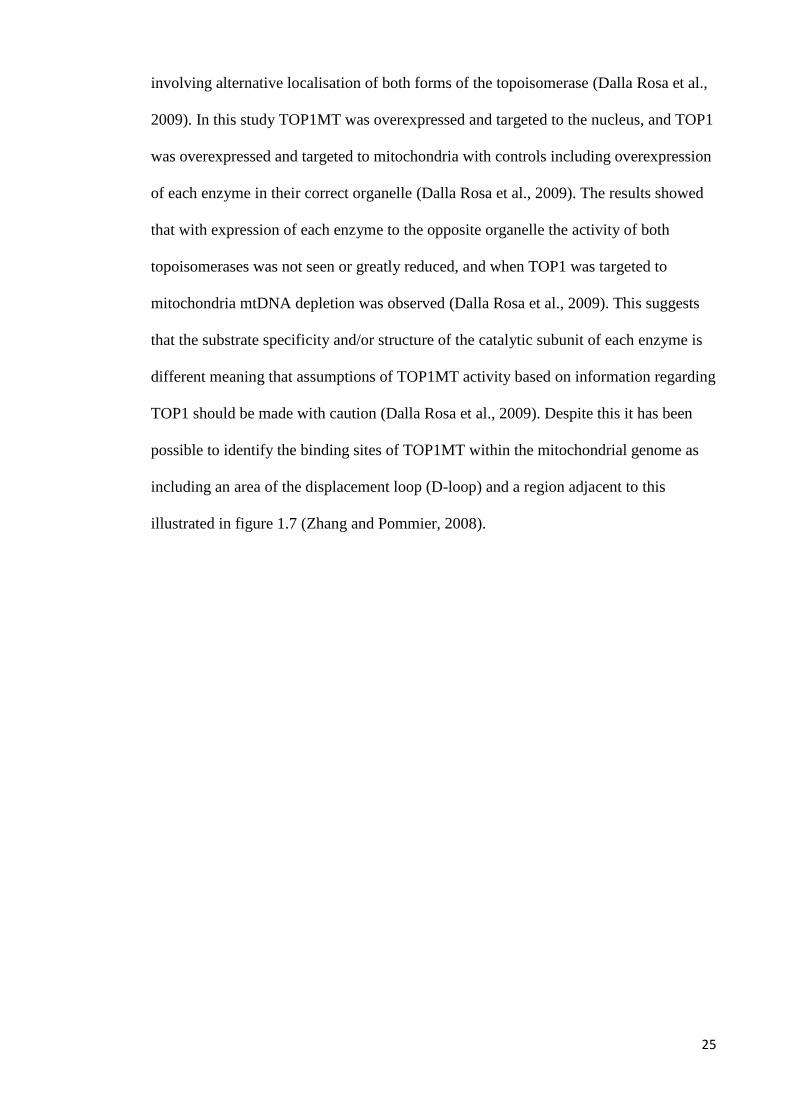
25
involving alternative localisation of both forms of the topoisomerase (Dalla Rosa et al.,
2009). In this study TOP1MT was overexpressed and targeted to the nucleus, and TOP1
was overexpressed and targeted to mitochondria with controls including overexpression
of each enzyme in their correct organelle (Dalla Rosa et al., 2009). The results showed
that with expression of each enzyme to the opposite organelle the activity of both
topoisomerases was not seen or greatly reduced, and when TOP1 was targeted to
mitochondria mtDNA depletion was observed (Dalla Rosa et al., 2009). This suggests
that the substrate specificity and/or structure of the catalytic subunit of each enzyme is
different meaning that assumptions of TOP1MT activity based on information regarding
TOP1 should be made with caution (Dalla Rosa et al., 2009). Despite this it has been
possible to identify the binding sites of TOP1MT within the mitochondrial genome as
including an area of the displacement loop (D-loop) and a region adjacent to this
illustrated in figure 1.7 (Zhang and Pommier, 2008).
26
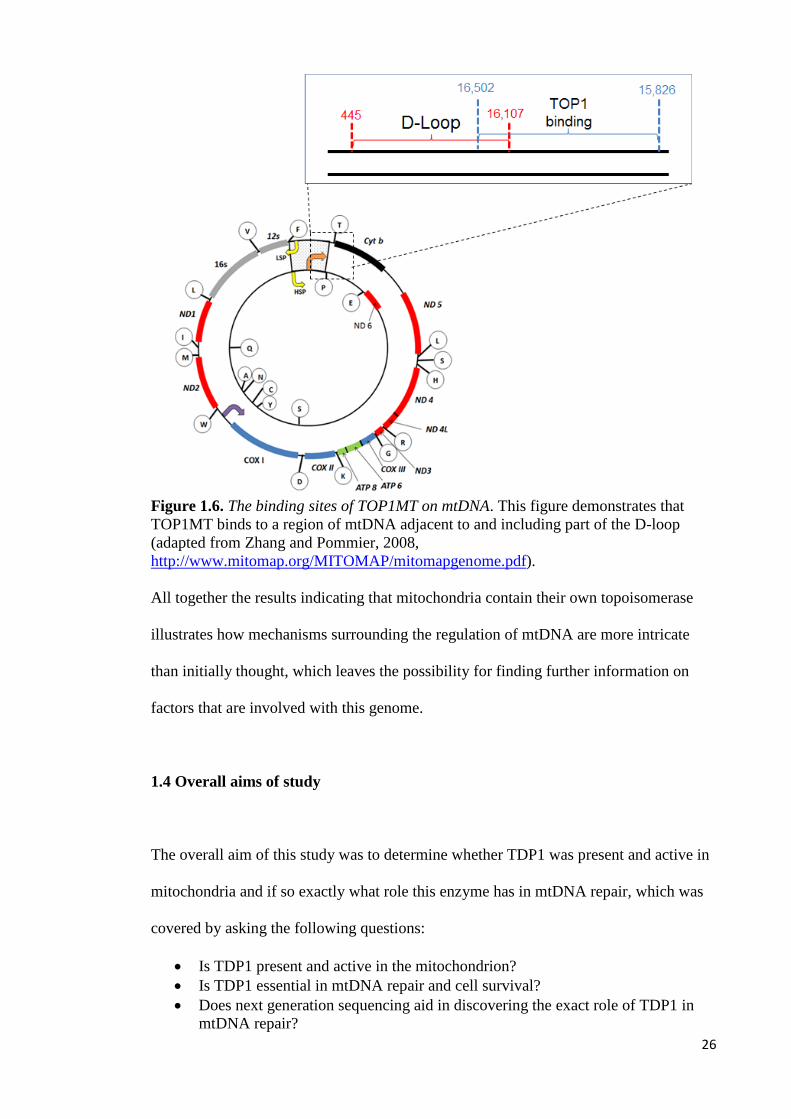
Figure 1.6. The binding sites of TOP1MT on mtDNA. This figure demonstrates that
TOP1MT binds to a region of mtDNA adjacent to and including part of the D-loop
(adapted from Zhang and Pommier, 2008,
http://www.mitomap.org/MITOMAP/mitomapgenome.pdf).
All together the results indicating that mitochondria contain their own topoisomerase
illustrates how mechanisms surrounding the regulation of mtDNA are more intricate
than initially thought, which leaves the possibility for finding further information on
factors that are involved with this genome.
1.4 Overall aims of study
The overall aim of this study was to determine whether TDP1 was present and active in
mitochondria and if so exactly what role this enzyme has in mtDNA repair, which was
covered by asking the following questions:
Is TDP1 present and active in the mitochondrion?
Is TDP1 essential in mtDNA repair and cell survival?
Does next generation sequencing aid in discovering the exact role of TDP1 in
mtDNA repair?

27
It was also determined that if TDP1 was found to be present and active in mitochondria
the protein associations of this enzyme would be assessed by asking:
Does phosphorylation of amino acid 81 in TDP1 promote association with
mitochondrial DNA ligase IIIα?
It was anticipated that by using these questions as a basis to study TDP1 it would be
possible to delineate the role of this enzyme in mitochondria, providing greater insight
as to the organisation of the DNA repair machinery of this organelle.

28
Chapter 2. General materials and methods
2.1 Materials
2.1.1 Chemicals and reagents
All reagents used for the experiments presented in this thesis were supplied by Sigma-
Aldrich®, unless stated otherwise.
2.1.2 Bacterial strains
α-Select Competent Cells (Bioline):
Bacterial strain used to transform cloned DNA into bacteria in preparation for
experiments with mammalian cell lines.
2.1.3 Mammalian cell lines
Flp-InTM
T-RexTM
HEK293 cells (life technologies):
Mammalian cell line containing a Tet repressor and Flp Recombination Target (FRT)
site that allows stable integration and tetracycline-inducible expression of a gene of
interest, from a specific locus within the genome of the host. Stable integration of the
gene of interest within the Flp-InTM
T-RexTM
HEK293 host genome at the same location
ensures homogenous expression of the desired protein upon expression with
tetracycline.

29
FD105 M21 fibroblasts
These cells were derived from an ataxia oculomotor apraxia-1 (AOA1) patient and
immortalised using human telomerase reverse transcriptase (hTERT). The cells were
then stably transfected with a plasmid encoding and expressing aprataxin (APTX); the
protein involved in causing AOA1 when its function is compromised as a result of
mutated APTX (El-Khamisy et al., 2009).
SCAN1 lymphoblastoids
These cells were taken from a SCAN1 patient and immortalised using Epstein-Bar virus
(EBV) (performed by Dr El-Khamisy). These cells contained the A1478G mutation in
TDP1 that causes SCAN1 (Takashima et al., 2002).
2.1.4 Mouse strains
Tdp1 -/- mice
These mice were generated from C57 black 6 (C57BL/6) mice and contained a single
substitution at nucleotide 1369 in Tdp1 causing premature termination of transcription
and loss of stability of TDP1. Heterozygous Tdp1 +/- mice were kept on an outbred
129Ola and C57BL6 mouse background (Katyal et al., 2007).

30
2.1.5 Vectors
Table 2.1. Vectors used and their application in this thesis.
Name Application
pEGFP-NI
(Clontech Laboratories Inc.)
Contained the TOP1mt and TOP1mtY559A
genes to be
used for transfecting Flp-InTM
T-RexTM
HEK293 cells.
Vector contained gene for resistance to Kanamycin.
pCI-neo (Promega) Contained the mtTDP1S81E
/FLAG and
mtTDP1S81A
/FLAG genes for transfecting Flp-InTM
T-
RexTM
HEK293 cells. Vector contained a gene for
resistance to Ampicillin.
pcDNA5/FRT/TO
(life technologies)
Vector was used for cloning with TOP1mt and
TOP1mtY559A
genes for subsequent transfection into Flp-
InTM
T-RexTM
HEK293 cells. Vector contained a gene
for resistance to Ampicillin.
pOG44
(life technologies)
Vector used in co-transfection of Flp-InTM
T-RexTM
HEK293 cells along with pcDNA5/FRT/TO and desired
construct. Vector contained a gene for resistance to
Ampicillin.
pcDNA5/FRT/TO/mtPARN
Vector contained a gene for mitochondrially targeted
PARN. The PARN gene was removed by restriction
digest, leaving the mitochondrial presequence from
ATP9 of Neurospora crassa behind. This would then be
used for cloning with the mtTDP1S81E
/FLAG and
mtTDP1S81A
/FLAG genes for transfecting Flp-InTM
T-
RexTM
HEK293 cells. The vector also contained a gene
for resistance to Ampicillin.
2.1.6 DNA oligonucleotides
Table 2.2. DNA oligonucleotides used in this thesis.
Name and
orientation
Sequence (5’ to 3’) Restriction
site
Application
TOP1mt (F) CACACAGGATCCTGGCAGATGCGCGTGGT
G
BamHI Molecular
cloning
TOP1mt (R) ACTCGACTCGAGCTACTTATCGTCGTCAT
CCTTGTAATCGAATTCAAAGTCTTCTCCTG
C
XhoI Molecular
cloning
TDP1 (F) ACAAGCGCGCCTACTCTTCCCAGGAAGGC
GATTATGGG
BssHII Molecular
cloning
TDP1 (R) ACTCGAGCGGCCGCTACTTATCGTCGTCA
TCCTTGTAATCGGAGGGCACCCACATGTTC
NotI Molecular
cloning
pcDNA5 (F) GTTTAGTGAACCGTCAGATCG N/A Plasmid
sequencing
pcDNA5 (R) CCTACTCAGACAATGCGATGC N/A Plasmid
sequencing
31
B2M (F) CCAGCAGAGAATGGAAAGTCAA N/A qRT-PCR
B2M (R) TCTCTCTCCATTCTTCAGTAAGTCAACT N/A qRT-PCR
B2M FAM
probe (life
technologies)
ATGTGTCTGGGTTTCATCCATCCGACA
N/A
qRT-PCR
ND1 (F) CCCTAAAACCCGCCACATCT N/A qRT-PCR
ND1 (R) GAGCGATGGTGAGAGCTAAGGT N/A qRT-PCR
ND1 VIC
probe (life
technologies)
CCATCACCCTCTACATCACCGCCC
N/A
qRT-PCR
Human
mtDNA A
(F) 550bp-570bp
AACCAAACCCCAAAGACACCC
N/A
Deep
sequencing
Human
mtDNA A
(R) 9839bp-9819bp
CCTGAAGTGCAGTAATAACC
N/A
Deep
sequencing
Human
mtDNA B
(F) 9592bp-9611bp
TCCCACTCCTAAACACATCC
N/A
Deep
sequencing
Human
mtDNA B
(R) 646bp-625bp
CCCGAGTGTAGTGGGGTATTTG
N/A
Deep
sequencing
Mouse
mtDNA A
(F) 2665bp-2684bp
AGAGAAGGTTATTAGGGTGG
N/A
Deep
sequencing
Mouse
mtDNA A
(R) 10756bp-10737bp
CATGAAGCGTCTAAGGTGTG
N/A
Deep
sequencing
Mouse
mtDNA B
(F) 9822bp-9844bp
AAAAAAATTAATGATTTCGACTC
N/A
Deep
sequencing
Mouse
mtDNA B
(R) 2335bp-2315bp
ACTTTGACTTGTAAGTCTAGG
N/A
Deep
sequencing
*Bases in bold represent restriction sites introduced by the primers into each gene. With exception to
probes for qRT-PCR all oligonucleotides were supplied by Eurogentec.
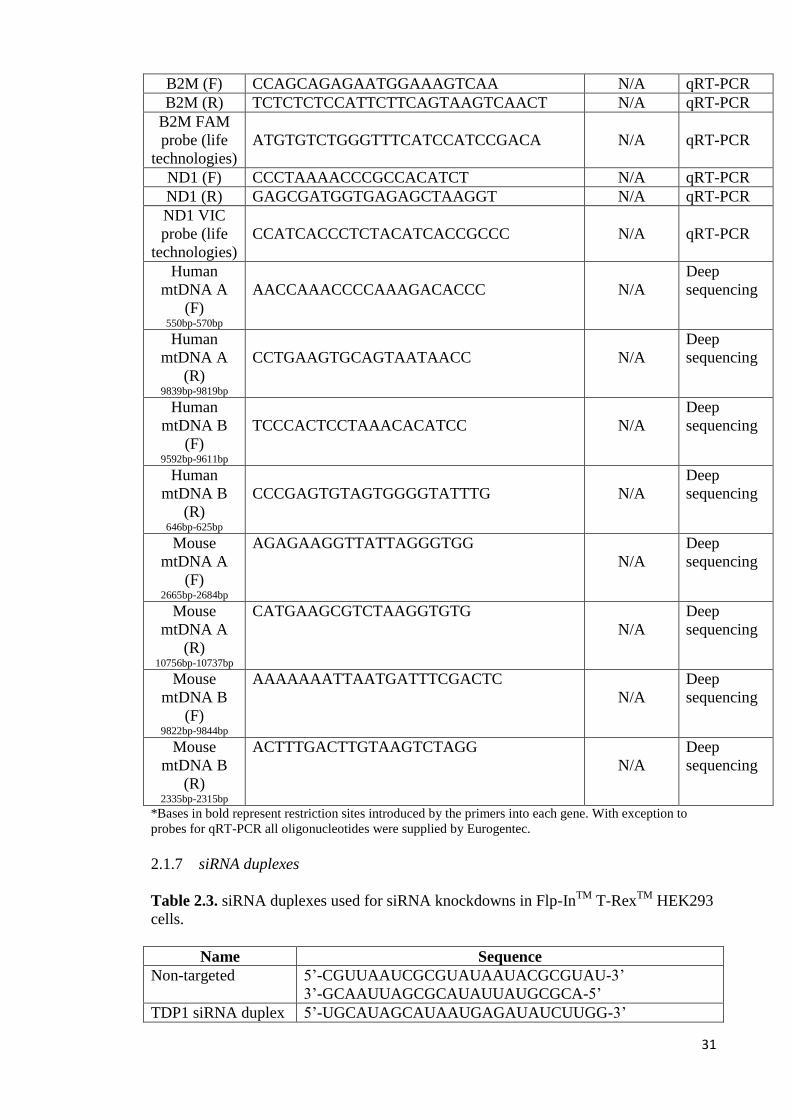
2.1.7 siRNA duplexes
Table 2.3. siRNA duplexes used for siRNA knockdowns in Flp-InTM
T-RexTM
HEK293
cells.
Name Sequence
Non-targeted 5’-CGUUAAUCGCGUAUAAUACGCGUAU-3’
3’-GCAAUUAGCGCAUAUUAUGCGCA-5’
TDP1 siRNA duplex 5’-UGCAUAGCAUAAUGAGAUAUCUUGG-3’

32
A 3’-ACGUAUCGUAUUACUCUAUAGAA-5’
TDP1 siRNA duplex
B
5’-GGAUAGAUGUCAUUCACAAGCACGA-3’
3’-CCUAUCUACAGUAAGUGUUCGUG-5’
TDP1 siRNA duplex
C
5’-CGAUGAAUCAAAGUGGUUAUGUUCT-3’
3’-GCUAVUUAGUUUCACCAAUACAA-5’ *Supplied by OriGene. All contained 2x dT 3’ end overhangs.
2.2 General methods
2.2.1 Bacterial culture
i) Transformation of chemically competent cells
α-select bacterial cells (Bioline Reagents Ltd.), kept in 200µl aliquots at -80oC, were
thawed on ice and 40µl was transferred to pre-chilled 1.5ml reaction tubes per
transformation reaction. Any remaining cells from the aliquot were replaced at -80oC,
but freeze-thaw cycles never exceeded more than 1 per aliquot. Between 1-4µl of
ligation reaction for molecular cloning, or 10ng for purified plasmid DNA was added to
40µl α-select bacterial cells for each sample and incubated on ice for 30 mins. During
this time Super Optimal Broth with Catabolite repression (SOC) media was pre-warmed
to 37oC. Cells were heat pulsed at 42
oC for 45 secs before being incubated on ice for 2
mins, followed by addition of 900µl SOC to each sample and incubation for 1 hour at
37oC with rotary shaking. The cell suspension was then plated on agar plates with the
desired antibiotic resistance and incubated overnight at 37oC. Plates displaying colonies
following this incubation were stored at 4oC.
SOC media
10mM NaCl
2.5mM KCl
10mM MgCl2
10mM MgSO4
20mM Glucose
0.5% Yeast Extract
2% Tryptone

33
ii) Plasmid DNA isolation from bacteria
Bacterial cells containing a desired plasmid for purification were grown overnight at
37oC in 5ml Luria Bertani broth (LB) medium containing the correct antibiotic
resistance. Cells suspensions were centrifuged at 1500xg for 15 mins and supernatant
discarded before plasmid purification was performed using the GeneJET™ Plasmid
Miniprep Kit (Fermentas) and the manufacturer’s instructions.
LB medium
1.0% NaCl
1.0% Tryptone
0.5% Yeast Extract
Adjust to pH 7.0 with NaOH
2.2.2 Tissue culture
i) Cell storage
Cells were incubated at 37oC with humidified 5% CO2 in sterile conditions in filter-
topped flasks or 6-well plates.
ii) Cell maintenance
When cells reached 80-90% confluence during general culturing (i.e. not an experiment
to gather data) growth media was removed and cells were removed from their 75cm2
flask using 5ml PBS/1mM EDTA, or 5ml PBS/1mM EDTA+1x trypsin in the case of
fibroblasts. The cell suspension was neutralised with an equal volume of pre-warmed
supplemented growth media before being centrifuged at 260xg for 4 mins. The
supernatant was discarded and the cell pellet was resuspended in 1ml pre-warmed
supplemented growth media before 100µl (at least 200µl for fibroblasts) of the
suspension was replaced in its original flask with 15ml supplemented growth media.
34
Once split three times cells were placed in a fresh 75cm2 flask and for cell lines of, or
generated from Flp-InTM
T-RexTM
HEK293 cells the correct concentrations of
hygromycin (life technologies) and/or blasticidin (Melford) were added.
iii) Freezing cells for long term storage
To freeze cells for long term storage cell lines were grown to 70-80% confluence in
75cm2 flasks and harvested using 5ml PBS/1mM EDTA or 5ml PBS/1mM EDTA+1x
trypsin for fibroblasts. The cell suspension was neutralised using and equal volume of
supplemented growth media before being centrifuged at 260xg for 4 mins. The
supernatant was discarded and the cell pellet carefully resuspended in 1ml 10% DMSO
in FBS before being transferred to a 2ml cryovial and placed a -80oC in a freezing
container with isopropanol for 24 hours. After this time the cells could be transferred to
a container with liquid nitrogen.
iv) Thawing cells from long term storage
Cells stored in liquid nitrogen were removed and thawed in their cryovials in a 37oC
water bath. The 1ml cell suspension was then transferred to 5ml pre-warmed
supplemented growth media and centrifuged at 260xg for 4 mins. The cell pellet was
then resuspended in 1ml pre-warmed supplemented growth media and transferred to a
75cm2 flask with 15ml pre-warmed supplemented growth media. Cells were incubated
as in 2.2.2 (i) for 5 hours before the media was replaced and cells placed back in the
incubator.
35
v) Cell counting
Cell counting was performed using an improved Neubauer Haemocytometer
(Hawksley) using 100µl cell suspension mixed with 100µl 50% Trypan Blue/PBS. Cells
that were unstained by the Trypan Blue were counted in each quadrant of one side of the
cell counter. The total number was then divided by 4 (for each quadrant) and then
multiplied by 2 (to account for dilution in 50% Trypan Blue/PBS). This number was
then multiplied by 10000 to give the total number of cells per ml of cell suspension. The
process of counting was then repeated using the quadrants on the opposite side of the
cell counter to verify that the number of cells were the same on either side.
vi) Mycoplasma testing and treatment
Every 6 weeks mycoplasma testing was carried out using MycoAlert™ Mycoplasma
Detection Kit (Lonza) as per the manufacturer’s guidelines. If mycoplasma was present
treatment with PlasmocinTM
(InvivoGen) was carried out for 2 weeks or until
undetectable.
vii) Transformation of Flp-InTM
T-RexTM
HEK293 cells
To generate stable cell lines with inducible expression of desired proteins for this thesis
the Flp-InTM
T-RexTM
HEK293 system (life technologies) was used. Cells were seeded
at 3x10⁵ cells in wells of a 6-well plate in 2ml supplemented DMEM for the desired
plasmid, and a negative and positive control (pcDNA5/FRT/TO without any gene
integration through cloning). Once cells were adhered to the well surface 500µl DMEM
was mixed carefully with 1µl pOG44 (1µg), 1µl of the desired plasmid (100ng), and
36
10µl SuperFect Transfection Reagent (Qiagen) in 1.5ml reaction tubes. The same
reaction was also set up with pcDNA5/FRT/TO alone as a positive control, and another
reaction without any pcDNA5/FRT/TO vector was also set up. The reactions were
incubated at room temperature for 10 mins before being applied to the cell containing
wells once the 2ml supplemented DMEM had been removed. Cells were incubated as in
2.2.2 (i) for 2.5 hours before the vector/DMEM mix was removed and replaced with
2ml supplemented DMEM. Cells were then incubated for 48 hours before selection of
successfully transformed cells began with the use of hygromycin B (life technologies) at
100ng/ml final concentration and blasticidin S (Melford) at 10ng/ml final concentration.
viii) Poly-L-ornithine treating flasks
To aid in adhering cells the surfaces of 25cm2 flasks for use in transient siRNA
transfections 1.5ml Poly-L-ornithine was added to each flask required for the
experiment and then incubated as in 2.2.2 (i) for 30 mins. After this time the Poly-L-
ornithine was removed and flask surfaces were washed with 2ml PBS before 5ml
supplemented growth media was added along with the desired cell number.
2.2.3 Protein manipulation
i) Isolation of cytoplasmic protein from human cell lines
Cells grown in 6-well plates or 25cm2 flasks were harvested using 0.5ml and 2ml
PBS/EDTA, respectively, before being neutralised in an equal volume of supplemented
growth media. Cells were centrifuged at 260xg for 4 mins and the resulting supernatant
was discarded. Cell pellets from 6-well plates were resuspended in 50µl pre-chilled lysis

37
buffer, and cell pellets from 25cm2 flasks were resuspended in 150µl pre-chilled lysis
buffer. Samples were then vortexed for 30 secs and centrifuged at 2000xg for 4 mins at
4oC. The supernatant was then transferred to fresh pre-chilled 1.5ml reaction tubes and
used to quantify protein concentration by Bradford analysis, or snap frozen in liquid
nitrogen and stored at -80oC.
Lysis buffer
50mM Tris-HCl pH 7.5
0.15M NaCl
2mM MgCl2
1mM PMSF
1% NP-40
1x Protease inhibitor mix (Roche Applied Science)*
* Diluted to 1x concentration from 7x stock solution depending on volume of lysis
buffer required.
ii) Isolation of mitochondria from human cell lines
Cells were grown in 300cm2 flasks (1-6 flasks depending on quantity of mitochondria
required) until 80-90% confluent, and were harvested by removing growth media
followed by addition of 15ml 1mM EDTA/PBS or 15ml 1mM EDTA/PBS+1x trypsin
for fibroblast cells. The cell suspension was neutralised with supplemented growth
media and centrifuged at 260xg for 4 mins before the subsequent pellet was
resuspended in 2ml ice cold homogenisation buffer. All steps from this point were
carried out at 4oC. The cell suspension was then transferred to a 2ml glass/teflon
homogeniser (Glas-Col) for HEK293 cells or glass/glass homogeniser for fibroblast
cells. The cell suspension was subjected to 20 homogenisation passes before being
centrifuged at 400xg for 10 mins. The supernatant was transferred to a new tube and the
pellet was resuspended in 2ml homogenisation buffer for the homogenisation and

38
centrifugation steps to be repeated twice more. All supernatants were centrifuged at
12000xg for 10 mins and supernatants discarded. Pellets were combined in 100µl
homogenisation buffer and centrifuged at 12000xg once again. This pellet was
resuspended in 500µl homogenisation buffer to wash and centrifuged at 12000xg for
another 10 mins. The pellet could then be snap frozen in liquid nitrogen and stored at -
80oC, or resuspended in 100-500µl homogenisation buffer (without BSA or PMSF) if
purification was desired.
Homogenisation buffer
0.6M Mannitol
10mM Tris-HCl pH 7.4
1mM EGTA
1mM PMSF
0.1% BSA
iii) Isolation of mitochondria from mouse brain
Once the mouse brain was harvested it was placed immediately in a beaker containing
20ml isolation medium. Using pre-chilled scissors the brain was cut into small pieces
that were then washed by carefully decanting the isolation medium followed by addition
of another 10ml isolation medium. The brain suspension was then transferred to a 40ml
Dounce homogeniser (Fisher Scientific) and subjected to 8 homogenisation passes
before being transferred to a pre-chilled SS34 centrifuge tube and centrifuged for 3 mins
at 2000xg using the Sorvall RC-5C. The supernatant was decanted into a clean pre-
chilled SS34 tube and centrifuged at 12500xg for 10 mins. The supernatant was
removed and the pellet resuspended in 1ml 3% ficoll medium using a pre-chilled glass
rod being careful not to disturb any blood spot in the pellet. The suspension was then
carefully layered onto 10ml 6% ficoll medium and centrifuged at 11500xg for 15 mins.
The supernatant was decanted sharply and the remaining pellet was resuspended in
10ml isolation medium before being centrifuged at 11500xg for a further 10mins. The

39
pellet could then be snap frozen in liquid nitrogen and stored at -80oC or could be
purified if desired.
Isolation medium Ficoll medium
250mM Sucrose 240mM Mannitol
10mM Tris-HCl pH 7.4 60mM Sucrose
0.5mM EDTA 50µM EDTA
10mM Tris-HCl pH 7.4
6% or 3% Ficoll (added immediately
before use)
iv) Mitochondrial purification
Mitochondrial purification was carried out in order to remove any nuclear and/or
cytosolic contaminants following mitochondrial isolation from human cells or from
mouse brain. This was performed by initially treating with 1U RNase free DNaseI
(Epicentre®) per 5mg mitochondrial protein at room temperature for 15 mins
supplemented with 10mM MgCl2. Following this 20µg RNase free Proteinase K (Life
Technologies) was added per 5mg mitochondrial protein and incubated on ice for 30
mins. The reaction was stopped with addition of 1mM PMSF (final concentration)
before being centrifuged at 12000xg for 10 mins. Mitochondria were washed with 500µl
homogenisation buffer containing 1mM PMSF and centrifuged as previous.
v) Mitochondrial localisation assay
To ensure that expressed proteins using the Flp-InTM
T-RexTM
HEK293 system (life
technologies) were localised to mitochondria a localisation assay was performed using
Proteinase K (life technologies). Mitochondria that had been isolated from appropriate
cell lines as described in 2.2.3 (ii) were quantified by Bradford analysis as in 2.2.3 (vi)
and transferred in homogenisation buffer to 3 1.5ml reaction tubes for each cell line in
100µg per tube. The following reactions were set up with a total volume of 50µl:

40
Table 2.4. Reaction set up for mitochondrial localisation assay.
Untreated Proteinase K
alone
Proteinase K + Triton X-
100
Mitochondria 100µg 100µg 100µg
Proteinase K - 4µg 4µg
Triton X-100 - - 1%
The Proteinase K was stopped using 5µl 10mM PMSF and then mixed with an equal
volume of 2x dissociation buffer, snap frozen in liquid nitrogen, and stored at -80oC to
be used for SDS-PAGE and western blot analysis. The use of 4µg Proteinase K would
prove to be too much and so this experiment was repeated for the
HEK293/TOP1mt/FLAG and HEK293/TOP1mtY559A
/FLAG cell lines with 0.5µg and
2µg Proteinase K It was found that 2µg was sufficient and so this was used for the
HEK293/mtTDP1S81E
/FLAG, and HEK293/mtTDP1S81A
/FLAG cell lines.
2x dissociation buffer
0.125M Tris-HCl, pH 6.8
4% SDS
0.15M DTT
15% Glycerol
0.01% Bromophenol blue
0.01% Benzonase (Novagen)
vi) Protein quantification through Bradford assay
The Bradford assay was used to quantify protein within samples and this was performed
by firstly setting up the following reactions in 1.5ml reaction tubes to set the standard
curve:

41
Table 2.5. Reaction set up to make standard curve for Bradford analysis on the
microplate reader Elx 800 (BIO-TEK).
BSA (µg)
0 2 5 10 15 20
H2O 800µl 798µl 795µl 790µl 785µl 780µl
Bradford
reagent
(Bio-Rad)
200µl 200µl 200µl 200µl 200µl 200µl
BSA
(1µg/µl)
- 2µl 5µl 10µl 15µl 20µl
Once this had been set up, 1µl of each sample for protein quantification was then mixed
in 799µl H2O and 200µl Bradford reagent before 200µl of all reactions were added to
two wells of a 96-well plate for each sample. The plate was then put into the microplate
reader Elx 800 (BIO-TEK) set at a wavelength of 595nm for protein quantification.
vii) SDS-PAGE
To prepare samples for western blotting protein was separated by SDS-PAGE. Protein
samples were transferred to 1.5ml reaction tubes in the desired concentration and then
mixed with and equal volume of 2x dissociation buffer. Each reaction was then heated
at 95oC for 3 mins before being centrifuged at 12000xg for 2 mins and loaded onto the
gel. For the results outlined in this thesis either 10% or 12% polyacrylamide resolving
gels were used along with a 4% stacking gel in every case. The following tables
demonstrate the reagents used to cast these gels:
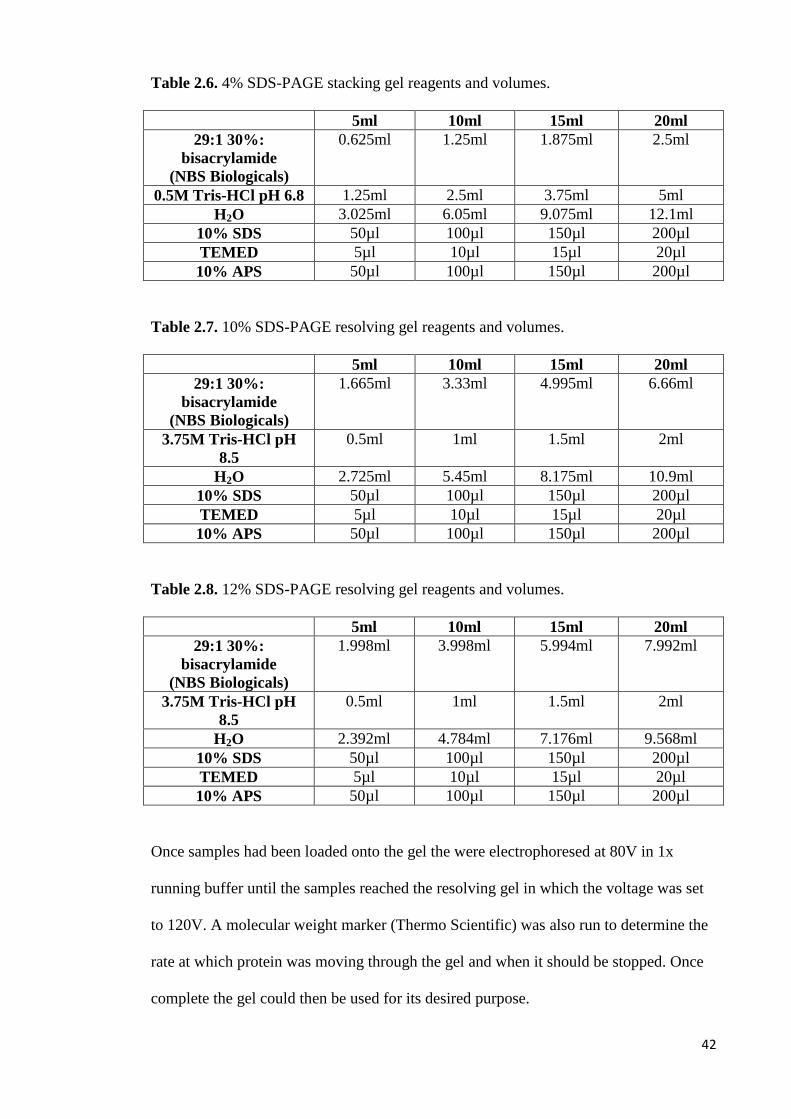
42
Table 2.6. 4% SDS-PAGE stacking gel reagents and volumes.
5ml 10ml 15ml 20ml
29:1 30%:
bisacrylamide
(NBS Biologicals)
0.625ml 1.25ml 1.875ml 2.5ml
0.5M Tris-HCl pH 6.8 1.25ml 2.5ml 3.75ml 5ml
H2O 3.025ml 6.05ml 9.075ml 12.1ml
10% SDS 50µl 100µl 150µl 200µl
TEMED 5µl 10µl 15µl 20µl
10% APS 50µl 100µl 150µl 200µl
Table 2.7. 10% SDS-PAGE resolving gel reagents and volumes.
5ml 10ml 15ml 20ml
29:1 30%:
bisacrylamide
(NBS Biologicals)
1.665ml 3.33ml 4.995ml 6.66ml
3.75M Tris-HCl pH
8.5
0.5ml 1ml 1.5ml 2ml
H2O 2.725ml 5.45ml 8.175ml 10.9ml
10% SDS 50µl 100µl 150µl 200µl
TEMED 5µl 10µl 15µl 20µl
10% APS 50µl 100µl 150µl 200µl
Table 2.8. 12% SDS-PAGE resolving gel reagents and volumes.
5ml 10ml 15ml 20ml
29:1 30%:
bisacrylamide
(NBS Biologicals)
1.998ml 3.998ml 5.994ml 7.992ml
3.75M Tris-HCl pH
8.5
0.5ml 1ml 1.5ml 2ml
H2O 2.392ml 4.784ml 7.176ml 9.568ml
10% SDS 50µl 100µl 150µl 200µl
TEMED 5µl 10µl 15µl 20µl
10% APS 50µl 100µl 150µl 200µl
Once samples had been loaded onto the gel the were electrophoresed at 80V in 1x
running buffer until the samples reached the resolving gel in which the voltage was set
to 120V. A molecular weight marker (Thermo Scientific) was also run to determine the
rate at which protein was moving through the gel and when it should be stopped. Once
complete the gel could then be used for its desired purpose.

43
2x dissociation buffer 1x running buffer
125mM Tris-HCl, pH 6.8 192mM Glycine
4% SDS 25mM Tris-HCl pH 7
0.15M DTT 0.1% SDS
15% Glycerol
0.01% Bromophenol blue
0.01% Benzonase (Novagen)
viii) Western blotting
Once SDS-PAGE was complete the gel was removed and transferred to 20ml 1x
transfer buffer and incubated at room temperature with rocking for 10 mins to
equilibrate. During this time a section of Immobilon transfer membrane (Millipore) was
cut to an appropriate size to cover the SDS-PAGE gel, and then activated with
incubation in 15ml Methanol for 30 secs with agitation. Once activated the membrane
was placed in 20ml 1x transfer buffer and incubated with rocking until the 10 min
incubation for the SDS-PAGE gel was complete. At this point 2 sections of 3mm
chromatography paper (WhatmanTM
) were cut to an appropriate size in comparison to
the gel/membrane and placed in a transfer cassette, followed by addition of the gel on
top, then the transfer membrane, and lastly 2 more sections of 3mm chromatography
paper. The cassette was then closed and placed into the transfer unit (Hoefer® or Bio-
Rad), making sure the gel end of the cassette was closest to the cathode, and ≈1.5L 1x
transfer buffer was added. The transfer unit was then placed in 4oC with a magnetic
stirrer to aid circulation of the buffer before the transfer from gel to membrane was
mediated at 100V or 500mA for 1.5 hours, or if 2 gels were run, 2 hours. Once the
transfer was complete the membrane the membrane was washed in 1x TTBS for 10
mins at room temperature with rocking before being blocked in 5% milk/TTBS for 1
hour or overnight at 4oC with rocking. After blocking, membranes were washed 3 times
in 1x TTBS and then exposed to the primary antibody, washed 3 times in 1x TTBS, and

44
then secondary antibodies (after another washing step) at the indicated concentration
and indicated times as shown in tables 2.7 and 2.8.
Table 2.9. Primary antibodies used for western blotting.
Antibody Source Dilution in 5%
milk/TTBS
(µl antibody:
µl milk)
Incubation
time
(hours)
Incubation
temperature
(oC)
Expected
size ≈:
western blot
(kDa)
α β-Actin Mouse 1:10,000 1 20 42
α COX I
(Abcam)
Mouse 1:1000 1 20 40
α COX II
(Abcam)
Mouse 1:1000 1 20 24
α FLAG Mouse 1:1000 1 20 Dependant
on protein
α Lamin
(Cell
Signalling)
Rabbit 1:1000 overnight 4 51
α NDUFA9
(Abcam)
Mouse 1:1000 1 20 35
α Neu N
(Cell
Signalling)
Rabbit 1:1000 overnight 4 46
α TDP1
(Abcam)
Rabbit 1:1000 overnight 4 70
α TOM 20
(Santa Cruz
Biotechnology)
Rabbit 1:750 overnight 4 17
α Porin
(Abcam)
Mouse 1:10,000 1 20 39
α XRCC1
(Cell
Signalling)
Rabbit 1:1000 overnight 4 82
Table 2.10. Secondary antibodies used for western blotting.
Antibody Source Dilution in 5%
milk/TTBS
(µl antibody:
µl milk)
Incubation
time (hours)
Incubation
temperature
(oC)
α mouse
(Dako)
Rabbit 1: 2000 1 20
α rabbit
(Dako)
Swine 1: 3000 1 20
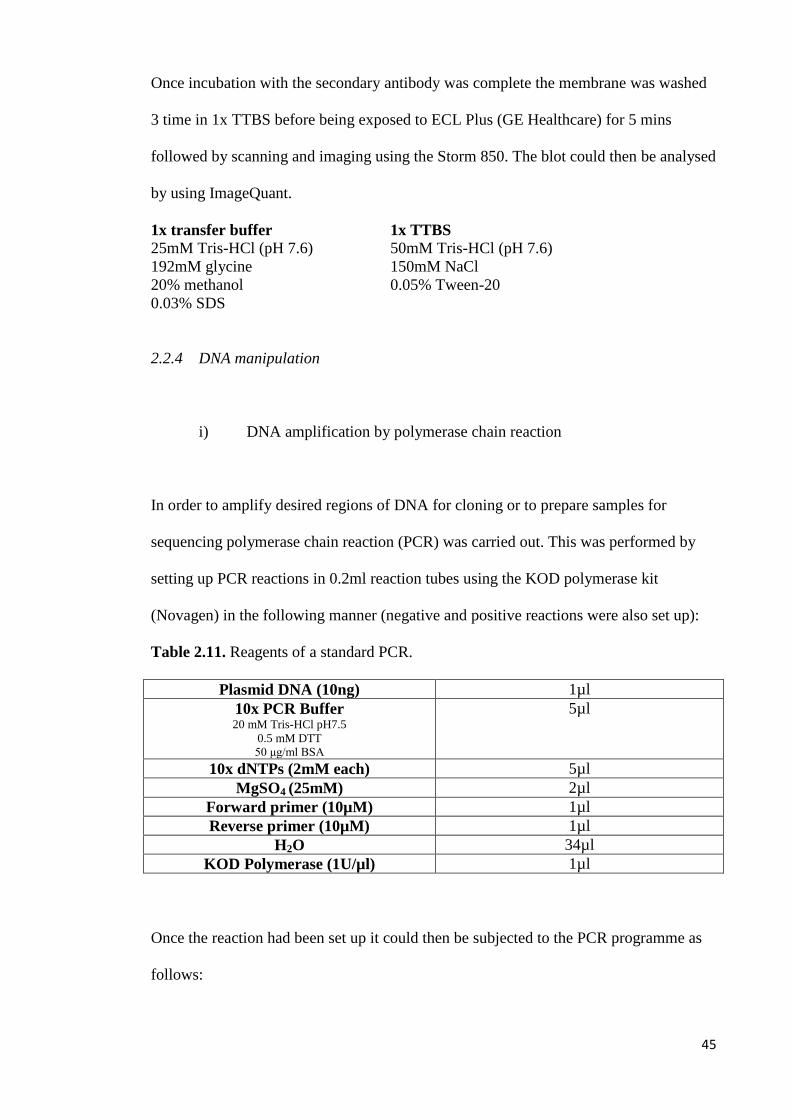
45
Once incubation with the secondary antibody was complete the membrane was washed
3 time in 1x TTBS before being exposed to ECL Plus (GE Healthcare) for 5 mins
followed by scanning and imaging using the Storm 850. The blot could then be analysed
by using ImageQuant.
1x transfer buffer 1x TTBS
25mM Tris-HCl (pH 7.6) 50mM Tris-HCl (pH 7.6)
192mM glycine 150mM NaCl
20% methanol 0.05% Tween-20
0.03% SDS
2.2.4 DNA manipulation
i) DNA amplification by polymerase chain reaction
In order to amplify desired regions of DNA for cloning or to prepare samples for
sequencing polymerase chain reaction (PCR) was carried out. This was performed by
setting up PCR reactions in 0.2ml reaction tubes using the KOD polymerase kit
(Novagen) in the following manner (negative and positive reactions were also set up):
Table 2.11. Reagents of a standard PCR.
Plasmid DNA (10ng) 1µl
10x PCR Buffer 20 mM Tris-HCl pH7.5
0.5 mM DTT
50 μg/ml BSA
5µl
10x dNTPs (2mM each) 5µl
MgSO4 (25mM) 2µl
Forward primer (10µM) 1µl
Reverse primer (10µM) 1µl
H2O 34µl
KOD Polymerase (1U/µl) 1µl
Once the reaction had been set up it could then be subjected to the PCR programme as
follows:

46
Table 2.12. General PCR programme.
Step Time Temperature (oC) Cycle number
Initial denaturation 2 mins 94 1
Denaturation
Annealing
Extension
30 secs
30 secs
1-3 mins*
94
50-65*
70
35
Final extension 10 mins 70 1 *annealing temperatures and extension times depended on primers and length of DNA fragment to be
analysed
Once the PCR programme was complete the samples could then be subjected to gel
electrophoresis as described in 2.2.4. (iv).
ii) Real-time polymerase chain reaction (qRT-PCR) to assess mtDNA copy
number
The copy number of mtDNA was assessed using qRT-PCR following
expression/knockdown experiments in mammalian cells as described in chapter 4. In
order to attain this data 10ng whole cell DNA from each experiment was mixed with the
following reagents and oligonucleotides (table 2.13) in a 96-well plate in triplicate, and
subjected to the qRT-PCR programme (table 2.14) in the StepOnePlus™ Real-Time
PCR System. For validity of results samples using 100ng, 10ng, 1ng, 100pg, and 10pg
DNA were also added to the reagents in table 2.13 in triplicate so that a standard curve
could be made on final analysis for validity of results.

47
Table 2.13. Reagents and oligonucleotides used per qRT-PCR reaction.
Reagent Volume (µl)
Taqman® Universal Master Mix II (life
technologies)
10
B2M (F) primer (10µm) (Eurogentec) 0.6
B2M (R) primer (10µm) (Eurogentec) 0.6
ND1 (F) primer (10µm) (Eurogentec) 0.6
ND1 (R) primer (10µm) (Eurogentec) 0.6
B2M FAM probe (life technologies) 0.4
ND1 VIC probe (life technologies) 0.4
H2O 4.8
Table 2.14. qRT-PCR programme used to determine mtDNA copy number.
Temperature (oC) Time Cycle number
50 2 mins 1
95 10 mins 1
95
60
15 secs
1 min
45
Once the data had been gathered by the StepOnePlus™ Real-Time PCR System it was
transferred to a Microsoft Excel 2010 folder where the critical threshold (CT) values
from ND1 were subtracted by the CT value from B2M. The relative number of reads of
ND1 to B2M could then be assessed by using 2ΔΔCT
on the ND1 minus B2M value.
iii) Restriction digests of DNA
Restriction digests were performed in molecular cloning to prepare PCR amplified
regions of DNA for ligation with digested vectors in preparation for transfection into
Flp-InTM
T-RexTM
HEK293 cells. Restriction digests for experiments in this thesis were
conducted using 1U BamHI, XhoI, NotI, and BssHII (all from New England Biolabs),
which were incubated at 37oC overnight with the appropriate vector/DNA fragment.

48
Enzymes were inactivated by heat treating reactions at 70oC for 15 mins once digest
was complete.
iv) DNA ligation
For ligation of vectors with these specific inserts ligation was carried out in 10µl
reactions containing 50ng vector: 100ng insert. In these 1µl T4 DNA Ligase (New
England Biolabs) was used with 1µl 10x ligase buffer (50mM Tris-HCl pH 7.5, 10mM
MgCl2, 1mM ATP, 10mM DTT) and reactions were incubated overnight at 16oC.
v) Gel electrophoresis of DNA
To separate products of DNA to determine whether PCR or restriction digest reactions
were successful, samples were subjected to gel electrophoresis. For this gels were cast
at 0.8% molecular grade agarose (Bioline) in 1x TAE containing 50ng/ml ethidium
bromide. When DNA was to be extracted from the gel following electrophoresis, gels
were cast at 1% NuSieve® GTG
® agarose (Lonza) in 1x TAE containing 50ng/ml
ethidium bromide. Samples were then loaded onto the appropriate gel with 5µl 1kb
DNA ladder (New England Biolabs) and electrophoresis was carried out by applying
70V for 45 mins. Images of the gel could then be taken and any further manipulations
were then performed.
1x TAE
40mM Tris-acetate
1mM EDTA
pH 8.3
vi) Phenol/chloroform extraction of DNA constructs from agarose
Following some PCR and restriction digest reactions it was necessary to remove DNA
of the correct molecular weight for further experiments. This was achieved by cutting
the desired DNA from the NuSieve® GTG
® agarose (Lonza) (described above),

49
transferring it to a 1.5ml reaction tube, and melting it a 68oC. An equal volume of TE
buffer was then added followed by addition of an equal volume of phenol pH 7.9 and
vortexing for 30 secs. The sample was then centrifuged at maximum speed in a
microcentrifuge for 3mins before the upper aqueous phase was transferred to a fresh
1.5ml reaction tube. An equal volume of phenol was added and the vortexing/centrifuge
step was repeated with the upper aqueous phase being transferred to a new 1.5ml
reaction tube again. An equal volume of 1:1 phenol: chloroform (24 parts chloroform, 1
part isoamyl alcohol) was then added and the vortexing/centrifuge step was repeated
before an equal volume of chloroform was added followed by vortexing/centrifuging
once more. The upper aqueous phase was taken and placed into a fresh 1.5ml reaction
tube and incubated on ice for 15 mins, and then centrifuged at 16,000xg for 15 mins at
4oC. The upper aqueous phase was transferred to a new 1.5ml reaction tube with 10%
3M NaOAc, 1µl linear acrylamide, and 2 volumes of 100% ethanol. This reaction was
then incubated overnight at -20oC before being centrifuged at 16,000xg for 30 mins, the
supernatant discarded and tube air dried, followed by the DNA being resuspended in
20µl H2O.
TE buffer
10mM Tris-HCl pH 8
1mM EDTA
vii) Phenol/chloroform extraction of DNA from mammalian cells in culture
To extract DNA from mammalian cells in culture the cells were harvested with
PBS/EDTA and centrifuged at 260xg before the supernatant was discarded. The cell
pellet was then resuspended in 200µl TE buffer, 20µl 20% SDS, and 25µl Proteinase K
(20µg/µl) (life technologies). The reaction was then incubated overnight at 37oC with
shaking, followed by addition of 245µl phenol pH 7.9, vortexing for 30 secs and
centrifuging at maximum speed in a microcentrifuge for 3 mins. The upper aqueous
50
phase was transferred to a fresh 1.5ml reaction tube and an equal volume of phenol was
added and the vortexing/centrifuge step was repeated with the upper aqueous phase
being transferred to a new 1.5ml reaction tube again. An equal volume of 1:1 phenol:
chloroform (24 parts chloroform, 1 part isoamyl alcohol) was then added and the
vortexing/centrifuge step was repeated before an equal volume of chloroform was added
followed by vortexing/centrifuging once more. The upper aqueous phase was taken and
placed into a fresh 1.5ml reaction tube and 10% 3M NaOAc, 1µl linear acrylamide, and
2 volumes of 100% ethanol were added. This reaction was then incubated overnight at -
20oC before being centrifuged at 16,000xg for 30 mins, the supernatant discarded and
tube air dried, followed by the DNA being resuspended in 20µl H2O.
viii) Nucleic acid quantification
Quantification of DNA was performed using a ND1000 spectrophotometer (Labtech) at
OD260 for duplex DNA (50µg/OD260) following the manufacturer’s guidelines. Using
mM extinction coefficients of 50 for dsDNA, 33 for ssDNA, and 40 for RNA.
ix) DNA sequencing
In order to confirm that plasmid DNA had the correct sequence for transfection into Flp-
InTM
T-RexTM
HEK293, sequencing was carried out. This service was kindly provided
by members of the Mitochondrial Diagnostic Service within the Mitochondrial
Research Group.

51
Chapter 3. Is TDP1 present and active in the mitochondrion?
3.1 Introduction
As outlined in 1.3.2 the mutation in TDP1 (A1478G) causes a conversion of amino acid
493 from histidine to arginine, thus modifying the active site of TDP1 resulting in a
loss-of-function (Takashima et al., 2002). This mutation affects cerebellar neurons
which is manifested in SCAN1; a rare autosomal recessive neurodegenerative disorder
(Takashima et al., 2002). A common feature of mitochondrial disorders is
spinocerebellar ataxia, alluding to the possibility that a loss of function mutation in
TDP1 could have an effect in mtDNA repair and contribute to the phenotype observed
in patients (Stumpf and Copeland, 2011).
The observation that TDP1 resolves DNA-TOP1 complexes independently of DNA
replication demonstrated the importance of TDP1 in neurons as they are post-mitotic
(El-Khamisy et al., 2005). Generation of Tdp1 -/- mice showed that TDP1 was required
in neural homeostasis and that these mice displayed a very similar phenotype to that
observed in SCAN1 patients (Katyal et al., 2007). In order to investigate whether TDP1
was present and active in mitochondria a collaboration was set up between our own
group and a group leader at the University of Sussex; Dr SF El-Khamisy. Being an
author on several papers regarding TDP1, and having access to SCAN1 patient cell
lines as well as the Tdp1 -/- mice, it was anticipated that this collaboration would help in
our shared objective.
Activity assays were used as a means to determine whether TDP1 was present and
active in mitochondria from fibroblasts, a SCAN1 patient cell line, and from Tdp1 -/-
mouse brain. Once these experiments had been conducted it was hoped that a sound
conclusion could be made to the question:

52
Is TDP1 present and active in the mitochondrion?
3.2 Methods
3.2.1 In vitro activity assay using mitochondrial extracts
To determine whether TDP1 was active in mitochondria an in vitro assay was used with
mitochondrial extracts from both human cells and mouse brain. The assay employs a
duplex DNA substrate composed of three oligonucleotides of which one (18mer) is
radiolabelled and has a 3’ phosphotyrosine. This phosphotyrosine is intended to mimic
the covalent bond in vivo that is formed between DNA and TOP1. Under this
circumstance TDP1 cleaves the phosphotyrosine bond, thus removing TOP1 from the 3’
end of DNA allowing further processing by a phosphatase before re-ligation can
commence. In this in vitro assay the phosphotyrosine bond of the 18mer is cleaved,
removing tyrosine and resulting in a 3’ phosphate. If the duplex substrate is then
subjected to denaturing gel electrophoresis the radiolabelled 18mer oligonucleotide
without tyrosine has increased electrophoretic mobility, which then allows exposure to a
phosphorscreen and scanning by Storm 8500 to confirm this result. Therefore, if TDP1
is present and active within a sample the tyrosine should be cleaved which lowers the
molecular weight of the substrate resulting in further migration on the denaturing gel.
Mitochondria from human cells were isolated as described in 2.2.3 (ii), and from mouse
brain as in 2.2.3 (iii). Both human and mouse mitochondrial extracts were purified as in
2.2.3 (iv) before the activity assay was performed. Three oligonucleotides were used for
this assay:
18-mer 5’-TCCGTTGAAGCCTGCTTT-P-Y-3’
25-mer 5’-GACATACTAACTTGAGCGAAACGGT-3’
43-mer 3’-TAGGCAACTTCGGACGAAACTGTATGATTGAACTCGCTTTGCC-5’
(25-mer complimentary to nucleotides 18-43 of 43-mer, and 18-mer complimentary to nucleotides 1-18 of 43-
mer. See figure 3.1 A)

53
The 18-mer (Midland Scientific), with a 3’-phosphotyrosine terminus (18-Y) to imitate
DNA lesion in vivo, was radiolabelled by phosphorylation using T4 PNK (New England
Biolabs) in 25µl reactions containing 5µCi (γ-32
P) ATP at 7000Ci/mM for 1 hour at
37oC. T4 PNK was inactivated by incubation at 68
oC for 10 mins. Following removal of
unincorporated nucleotides the three oligonucleotides were annealed in equimolar
concentrations at 55oC and then kept on ice. Mitochondrial samples were lysed using 1x
lysis buffer on ice for 15 mins before being centrifuged at 10,000xg for 5 mins at 2oC
before the supernatant was transferred to a clean reaction tube. Mitochondria and
control whole cell extract containing nuclear protein were quantified by Bradford
analysis as described in 2.2.3 (vi). In 10µl reactions the desired amount of protein
extract was incubated with 25nM substrate for 1 hour at 37oC in 1x reaction buffer.
Reactions were stopped with addition of 1x loading buffer before being heated at 90oC
for 10 mins and fractionated by denaturing electrophoresis. Once ran, the gel was
exposed to a phosphorscreen and results visualised using the Storm 8500 and
ImageQuant to assess relative conversion rates of 3’-phosphotyrosine to 3’-phosphate.
1x lysis buffer 1x reaction buffer 1x loading buffer
20mM Tris-HCl pH7.5 25mM Hepes pH8 44% deionized formamide
10mM EDTA 130mM KCl 2.25mM Tris-borate
1mM EGTA 1mM DTT 0.05mM ETDA
100mM NaCl 0.01% xylene cyanol
1% Triton X-100 1% bromophenol blue
protease inhibitors (Roche)
3.3 Results
3.3.1 TDP1 is present and active in fibroblast mitochondrial extracts
Mitochondria isolated from FD105 M21 fibroblasts were used for the activity assay
described in 3.2.1 as well as whole cell extract containing nuclear protein as a control.
Reasons for using this cell line are outlined in the discussion of this chapter. The results
from this experiment are illustrated in figure 1 (performed by Dr. El-Khamisy).

54
Figure 3.1. Activity assay to assess TDP1 presence and activity in fibroblast
mitochondria. Mitochondria were prepared from FD105 M21 fibroblasts as described in
2.2.3 (ii) and purified as in 2.2.3 (iv), and whole cell protein was isolated as in 2.2.1 (i).
Whole cell lysate containing nuclear protein (CL) and mitochondrial protein (M)
(10µg) were incubated with radiolabeled duplex substrate and subsequent repair
products fractionated by denaturing electrophoresis then exposed to phosphorscreen as
described in 3.2.3. Duplex substrate without any protein addition (-) was also
fractionated as a control. (A) Schematic to demonstrate the radiolabeled duplex
substrate used in the assay as described in 3.2.3. (B) Substrate following denaturing
electrophoresis to indicate whether TDP1 is active in both mitochondrial and nuclear
protein. The 18-Y and 18-P to the right of B describe 18-mer with 3’-phosphotyrosine
terminus and 3’-phosphate terminus, respectively.
The results shown in figure 3.1 B demonstrate TDP1 presence and activity in
mitochondria, which can be seen in lane 3 by the increased electrophoretic mobility of
the 18mer oligonucleotide after incubation with mitochondrial extracts from FD105
M21 fibroblasts. This result is verified in lane 2 as there is similar migration of the
substrate following incubation with control whole cell lysate containing nuclear protein
in which TDP1 is certainly present. In lane 1, substrate without any protein addition was
also fractionated on the gel to illustrate the electrophoretic mobility of the 18mer
oligonucleotide without removal of tyrosine.

55
3.3.2 TDP1 is active in LCL mitochondrial extracts
Having established TDP1 was present and active in FD105 M21 fibroblasts it was then
decided to repeat the same activity assay using extracts from wild type and SCAN1
patient lymphoblastoid cell lines. The aim of this experiment was to determine the
relative activity of TDP1 in mitochondria in comparison to whole cell lysate and to also
confirm that the A1478G mutation in TDP1 affected activity in mitochondria; thus
demonstrating TDP1 in mitochondria is encoded by the same gene as TDP1 in the
nucleus. As earlier the same activity assay was carried out (described in 3.2.1) using the
same duplex substrate, which is illustrated in figure 3.2 A. Mitochondrial and whole cell
lysate containing nuclear protein were isolated for this experiment with the results being
shown in figure 3.2 B, C, and D (performed by Dr. El-Khamisy).

56
Figure 3.2. Activity assay to assess TDP1 presence and activity in LCL mitochondria.
Mitochondrial protein was prepared as described in 2.2.3 (ii) from SCAN1 patient and
wild type lymphoblastoid cell lines. Following purification as described in 2.2.3 (iv)
mitochondrial and whole cell lysate containing nuclear protein (10µg) were incubated
with radiolabeled duplex substrate and subsequent repair products were fractionated by
denaturing electrophoresis then exposed to phosphorscreen as described in 3.2.3. (A)
Schematic to demonstrate the radiolabeled duplex substrate used in the assay as
described in 3.2.3. (B) Substrate following denaturing electrophoresis to indicate
whether TDP1 is active in both mitochondrial and nuclear protein. The 18-Y and 18-P
to the right of B represent 18-mer with 3’-phosphotyrosine terminus and 3’-phosphate
terminus respectively. (C) Percentage conversion of 3’-phosphotyrosine to 3’-phosphate
from both mitochondrial (M) and whole cell lysate containing nuclear protein (CL)
from lanes 2 and 4 of B, as determined by ImageQuant. Error bars represent the
difference observed from two independent experiments for the activity assay. (D)
Whole cell and mitochondrial protein (20µg) separated by SDS-PAGE as described in
2.2.3 (vii) followed by western blot analysis as in 2.2.3 (viii) to determine purity of
mitochondrial protein used in the assay.
Figure 3.2 B confirms TDP1 presence and activity in human mitochondria similar to
that observed in 3.3.1. In B lanes 2 and 4 suggest cleavage of tyrosine from the
radiolabelled 18mer constituent of the duplex substrate resulting in further migration on
electrophoresis. Extracts from the SCAN1 patient cell line show no TDP1 activity in
lanes 3 and 5 of B, consistent with the control reaction in lane 1 without any protein
addition to the duplex substrate. The graph in C illustrates the relative conversion of 3’
phosphotyrosine to 3’ phosphate from lanes 2 and 4 of B. The graph demonstrates that

57
there is greater cleavage of tyrosine using whole cell lysate (column 2) in comparison to
mitochondrial extract alone (column 1). Western blot analysis in D demonstrates that
there was no nuclear contamination in the mitochondrial extract used in the assay as the
nuclear protein XRCC1 is detected in whole cell extract (lane 1), but not in
mitochondrial extract (lane 2).
3.3.3 TDP1 is active in mouse brain mitochondrial extracts
Having demonstrated TDP1 presence and activity in in mitochondria from human cell
lines in 3.3.1 and 3.3.2, it was decided to determine whether this was also true in mouse
mitochondria. Using mitochondria isolated from wild type and Tdp1 -/- mouse brain
mitochondria the activity assay described in 3.2.1 was performed with the duplex
substrate illustrated in figure 3.3 A. Whole cell lysate containing nuclear protein was
also prepared and used in the assay for which the results are shown in figure 3.3 B, C,
and D (performed with Dr. El-Khamisy).

58
Figure 3.3. Activity assay to assess TDP1 presence and activity in mouse brain
mitochondria. Mitochondrial protein was isolated from Tdp1 -/- and Tdp1 +/+ mouse
brain as described in 2.2.3 (iii) and purified as in 2.2.3 (iv). Once purified,
mitochondrial and whole cell lysate containing nuclear protein (5µg and 10µg) were
incubated with the radiolabelled duplex substrate followed by fractionation using
denaturing electrophoresis and exposure to phosphorscreen as described in 3.2.3. (A)
Schematic to demonstrate the radiolabeled duplex substrate used in the assay as
described in 3.2.3. (B) Substrate following denaturing electrophoresis to indicate
whether TDP1 is active in both mitochondrial and whole cell lysate containing nuclear
protein. The 18-Y and 18-P to the right of B represent 18-mer with 3’-phosphotyrosine
terminus and 3’-phosphate terminus respectively. (C) Percentage conversion of 3’-
phosphotyrosine to 3’-phosphate using mitochondrial (M) and whole cell lysate (CL)
from mouse brain at both 5µg and 10µg concentration. These conversion are with
reference to those observed in lanes 2, 3, 6, and 7 of B and were calculated using
ImageQuant. Error bars represent the difference observed from two independent
experiments for the activity assay. (D) Whole cell (lanes 1) and mitochondrial (lanes 2)
protein (20µg) from Tdp1 +/+ and Tdp1 -/- mouse brain separated by SDS-PAGE as
described in 2.2.3 (vii) followed by western blot analysis as in 2.2.3 (viii) to determine
purity of mitochondrial protein used in the assay.
Figure 3.3 B demonstrates TDP1 presence and activity in mouse brain mitochondria by
the increased electrophoretic mobility of the radiolabelled 18mer component of the
duplex substrate used for this assay. This indicates that the tyrosine from the substrate
was cleaved by TDP1 using 5µg and 10µg mitochondrial and whole cell extract
containing nuclear protein from wild type mouse brain (shown in lanes 2, 3, 6, and 7).
Activity was not observed in mitochondrial and whole cell extract from Tdp1 -/- mouse

59
brain (shown in lanes 4, 5, 8, and 9). In C the percentage conversion from 3’
phosphotyrosine to 3’ phosphate is shown for each amount of protein (5µg and 10µg)
for both mitochondrial (M) and whole cell lysate (CL). This result shows that using 5µg
whole cell lysate on 25nM of substrate for the assay was almost enough to cause
complete conversion from 3’ phosphotyrosine to 3’ phosphate, which was in contrast to
the mitochondrial extract where only ≈40% conversion was observed at the same
concentration. This suggests that the amount of TDP1 in the whole cell lysate is
considerably higher than in the mitochondrial extract alone. A consideration for future
could be to increase the concentration of substrate used in the assay so that similar
increases in conversion may be seen on doubling the concentration of protein used in
the assay for both whole cell lysate and mitochondrial extract. Western blot analysis,
shown in D, excludes nuclear contamination of mitochondrial extracts used in the assay
by the absence of Lamin and NeuN in mitochondrial protein (lanes 2) in contrast to
whole cell protein (lanes 1) for wild type and Tdp1 -/- mice. Equal loading was
demonstrated using antibodies to the mitochondrial proteins porin and NDUFA9.
3.4 Discussion and conclusions
In assessing the role of TDP1 in mtDNA repair, it was necessary to establish that TDP1
was present and active in mitochondria. At this stage of the project there had been no
previous reports of TDP1 in mitochondria, and therefore the decision to investigate
TDP1 presence and activity in mitochondria was based on three basic principles, which
are that:
Mammalian mitochondria have their own DNA (Anderson et al., 1981, Bibb et
al., 1981a)
Mitochondria have mechanisms to repair their DNA (Boesch et al., 2011), and

60
Mutations in TDP1 can cause cerebellar ataxia; a common feature of
mitochondrial disease (Takashima et al., 2002, Stumpf and Copeland, 2011)
With this in mind the assays undertaken in this chapter to examine TDP1 presence and
activity in the mitochondrion has provided convincing data from which a sound
conclusion can be drawn.
Presence and activity of TDP1 in human mitochondria
Activity of TDP1 in mitochondrial samples from human cell lines was first
demonstrated using FD105 M21 fibroblasts. These cells had been isolated from an
ataxia with oculomotor apraxia type 1 (AOA1) patient and been immortalised by our
collaborators who also stably transformed these cells with a plasmid encoding and
expressing aprataxin (APTX). Mutations in APTX are responsible for causing AOA1
and these ‘corrected’ cells were originally intended to aid in determining whether APTX
was present and active in mitochondria. This project was discontinued when another
group reported presence and activity of APTX in mitochondria; thus explaining the lack
of any data regarding APTX in this thesis (Sykora et al., 2011). Despite mitochondria
from FD105 M21 fibroblasts originally intended for experiments investigating APTX,
some of the mitochondrial extract could also be used to determine whether TDP1 was
present and active in mitochondria as there were no mutations in the TDP1 gene in these
cells. Figure 3.1 shows TDP1 activity in mitochondrial extract from FD105 M21
fibroblasts as there is increased electrophoretic mobility of the radiolabelled 18mer
component of the duplex substrate used in the assay. This increased electrophoretic
mobility was generated as a result of TDP1 removing tyrosine from the DNA substrate
as it would in vivo where the phosphodiester linkage between DNA and TOP1MT is

61
broken allowing re-ligation of DNA to its normal conformation (Zhang et al., 2001).
The activity seen from mitochondria is similar to that from whole cell extract containing
nuclear protein in which TDP1 activity has already been characterised (Yang et al.,
1996). This provided preliminary data supporting the hypothesis that TDP1 is present
and active in mitochondria, and once this had been established a more comprehensive
investigation into TDP1 presence and activity in human and mouse mitochondria was
begun.
With the data in figure 3.1 suggesting TDP1 presence and activity in fibroblast
mitochondria it was decided to assess whether this was also true in lymphoblasts. Our
collaborators had a SCAN1 patient lymphoblast cell line as well as wild type control
cells that were used in the same in vitro assay as earlier. Figure 3.2 demonstrates that
the tyrosine was cleaved from the DNA substrate and increased its electrophoretic
mobility as a result of TDP1 activity in mitochondrial extract from wild type cells
similar to whole cell extract containing nuclear protein from the same cell line. In the
SCAN1 patient cell line the A1478G mutation in TDP1 causes a change in the active
site of the protein converting amino acid 493 from histidine to arginine, which disrupts
the symmetrical arrangement of the active site and results in a loss-of-function
(Takashima et al., 2002). Crystal structure characterisation of TDP1 identified the
histidine at amino acid residue 493 as a vital component of two symmetrical domains in
the active site of the enzyme, which explains why there is no detectable activity from
either mitochondrial or whole cell extracts from the SCAN1 cell line (Davies et al.,
2002b). Figure 3.4 illustrates the proposed reaction mechanism for TDP1 when
processing DNA-TOP1 cleavage complexes, and demonstrates the importance of
His493 in TDP1 (Davies et al., 2002a).

62
Figure 3.4. Proposed mechanism for TDP1 activity on mtDNA-TOP1MT substrate in
(A), which leads to its conversion to 3’ phosphate seen in (B). The process of removing
TOP1MT from the 3’ end of mtDNA begins with nucleophilic attack from His 263 of
TDP1 as in (C) leading to covalent attachment of this amino acid to the mtDNA
molecule and release of TOP1MT that is also protonated by His 493 of TDP1 as
illustrated in (D). In (E) His 493 activates a water molecule that then hydrolyses the 3’
phosphohistidine thus releasing and regenerating the active site of TDP1 and leaving
behind 3’ phosphate (F) for further processing by a phosphatase (adapted from Davies
et al., 2002a).
The His493 residue is conserved between species which highlights its importance for
normal enzyme function and offers an explanation as to the lack of cleavage of tyrosine
from the DNA substrate used in the activity assays in this chapter (Davies et al., 2002b,
Interthal et al., 2001). This result also demonstrates that the mutation in TDP1 in
SCAN1 patients affects function in the mitochondria as well the nucleus, which
suggests that TDP1 is encoded by the same gene for activity on nDNA and mtDNA
(Takashima et al., 2002, El-Khamisy et al., 2005).

63
Possible mechanisms for TDP1 import into mitochondria
Based on the data in this chapter that appears to suggest TDP1 is encoded by the same
gene, it is therefore necessary to discuss some the possible mechanisms by which TDP1
gains entry to the mitochondrion. For many years import into mitochondria was thought
to be carried out through two general pathways involving a mitochondrial targeting
sequence (MTS) (Becker et al., 2012). Many proteins have an N-terminal mitochondrial
targeting sequence (MTS) that is usually cleaved by mitochondrial processing peptidase
(MPP) upon entry into the mitochondrion (Bolender et al., 2008, Zhang et al., 2001). An
example of a protein of significance to TDP1 that enters mitochondria by this
mechanism is TOP1MT, where the mitochondrial isoform is encoded by a separate gene
to the nuclear TOP1 (Zhang et al., 2001). In other instances, such as for several inner
mitochondrial membrane proteins, there is no N-terminal targeting sequence, and
alternatively there are internal targeting sequences throughout the polypeptide chain
(Becker et al., 2012). In these cases the mitochondrial proteins are bound to cytosolic
chaperones, which are recognised by the outer membrane protein, Tom70, and passed
across the membrane on the way to their final destination (Becker et al., 2012).
However, TDP1 does not appear to contain a predicted MTS which opens the
possibility that it is transported into mitochondria through an alternative mechanism
(Das et al., 2010).
In some other cases, such as for 8-oxoG DNA glycosylase (OGG1) and 2-OH-
A/adenine DNA glycosylase (MYH), proteins are encoded in the same genes as their
nuclear counterpart and are instead spliced for localisation to mitochondria (Nakabeppu,
2001b, Zhang et al., 2001). Another well characterised example where alternative
splicing acts as the mechanism for targeting a DNA repair enzyme to mitochondria is
64
that of uracil-DNA glycosylase (UNG) (Nilsen et al., 1997, Otterlei et al., 1998). This
protein has two isoforms UNG1 (mitochondrial) and UNG2 (nuclear) are transcribed
from distinct transcription initiation sites and are spliced for targeting to their chosen
organelle (Nilsen et al., 1997). Each isoform has a targeting sequence, which is a classic
strong mitochondrial targeting sequence for UNG1, whereas the nuclear targeting
sequence (NTS) for UNG2 was found to be unusually long and complex (Otterlei et al.,
1998). Although such mechanisms for import exist for some mtDNA repair enzymes
there are no such alternatively spliced isoforms found for TDP1 (Das et al., 2010).
In more rare circumstances, as for the mitochondrial DNA ligase (LIG3α), an upstream
initiation site for translation controls targeting to mitochondria where the targeting
sequence is then cleaved meaning that the resulting polypeptide in mitochondria has
approximately the same molecular weight as LIG3α in the nucleus (Lakshmipathy and
Campbell, 1999b). However, TDP1 does not contian an upstream translation initiation
site and so it is unlikely that this mechanism causes its localisation to mitochondria, but
it is important to consider these more rare targeting mechanisms in relation to TDP1
(Das et al., 2010). Another interesting observation was made in yeast (Saccharomyces
cerevisiae) where an uncharaterised protein (Pir1p) interacts with the C-terminal end of
AP endonuclease 1 (Apn1p) to initiate localisation to mitochondria (Vongsamphanh et
al., 2001). Although this mechanism for import has yet to be identified in humans it acts
to demonstrate the variety of possible mechanisms for protein entry into mitochondria.
Despite not comprehending the exact way in which TDP1 is imported into
mitochondria, an interesting point from the data presented in this chapter is that TDP1 is
present and active in mitochondria in unstressed conditions, whereas many dual
localised repair proteins (e.g. AP-endonuclease 1 (APE1)) are recruited to mitochondria

65
upon stress (Mitra et al., 2007, Boesch et al., 2011). This would suggest that TDP1 is
continuously localised to mitochondria due to DNA-TOP1MT lesions occuring on a
regular basis during initiation of mtDNA replication and transcription (Zhang et al.,
2001). While the data in figures 3.1 and 3.2 show clear actvity of TDP1 in
mitochondrial extracts from human cells, this protein had not yet been identified in
mitochondria of other mammalian organisms; therefore this was to be evaluated.
Presence and activity of TDP1 in mouse mitochondria
Our collaborators developed a Tdp1 -/- mouse for use in their own research, which has
been shown to exhibit a very similar phenotype (e.g. cerebellar atrophy and ataxia) to
that observed in SCAN1 patients (Katyal et al., 2007). The Tdp1 -/- mice were
generated using a mutated form of Tdp1 which contained a single substitution at
nucleotide 1369 causing premature termination of transcription (Katyal et al., 2007).
The resulting polypeptide is unstable and its function is therefore lost as it lacks a
significant section of TDP1 including the His493 residue vital to the active site of the
protein (Katyal et al., 2007). These mice with wild type controls were utilised to detect
TDP1 presence and activity in mouse mitochondria, and to determine whether the Tdp1
gene encoded nuclear and mitochondrial forms of TDP1 as in humans. Figure 3.3 shows
increased electrophoretic mobility of the DNA substrate following treatment with
mitochondrial and whole cell protein from wild type mouse brain, suggesting that the
tyrosine was cleaved from the substrate similar to previous experiments. However,
mitochondrial and whole cell extracts from Tdp1 -/- mouse brain did not cleave the
tyrosine from the DNA substrate suggesting that TDP1 in mice is encoded by the same
gene for nuclear and mitochondrial localisation similar to in humans. This provides

66
further evidence of TDP1 presence and activity in mitochondria of higher eukaryotes; a
phenomenon yet to be reported at the time of these experiments.
Discovery of this novel mtDNA repair enzyme has many interesting implications for
discerning the extent of the mtDNA repair machinery and how much disrupting this
contributes to ageing and disease. It could be postulated that impaired mtDNA repair
due to the loss of function of TDP1 is a contributing factor to progression of SCAN1
along with dysfunctional nDNA repair; although unequivocal experimental data for this
does not exist and would be very difficult to attain (Takashima et al., 2002). However,
in discovering that this enzyme is present and active in mitochondria as well as
previously identified repair proteins, there is confirmation that mtDNA repair
mechanisms do exist and may be more intricate than initially thought (Cline, 2012,
Boesch et al., 2011, Clayton et al., 1974). Delineating the involvement and role of more
repair enzymes and more repair mechanisms in mitochondria may prove difficult.
Despite this, the identification of more enzymes involved in mtDNA repair is increasing
and so it was decided to perform more experiments relating to this field of
mitochondrial research for which there is relatively little known (Boesch et al., 2011,
Cline, 2012). The focus of this thesis was to determine the extent to which DNA-
TOP1MT lesions form and what role TDP1 has in repairing this damage.
Altogether, the data shown in this chapter provide compelling evidence of TDP1
presence and activity in the mitochondrion. This was demonstrated using a variety of
human and mouse samples, therefore strengthening this conclusion and developing a
base to further investigate the specifics behind the role of TDP1 in mtDNA repair.

67
Chapter 4. Is TDP1 essential in mtDNA repair and cell survival?
4.1 Introduction
The results in chapter 3 provide very strong evidence that TDP1 is present and active in
human and mouse mitochondria. The next step in investigation was to answer the
question:
Is TDP1 essential in mtDNA repair and cell survival?
While attempting to address this question another group reported the presence and
activity of TDP1 in mitochondria. In this publication the group used
immunofluorescence on cells (MCF-7 breast carcinoma cells), and subcellular
fractionation with a Proteinase K protection assay to demonstrate TDP1 presence in
mitochondria. Mouse embryonic fibroblasts (MEFs) with Tdp1 knockout were also used
to demonstrate absence of TDP1 activity in comparison to controls similar to the
experiments conducted in chapter 3 using Tdp1 -/- mice and SCAN1 patient cells. An in
vitro repair assay was also utilised to show an association between TDP1 and DNA
Ligase IIIα (LIG3α), and to show that TDP1 can remove 3’ phosphoglycolate using
mitochondrial lysates in contrast to those with TDP1 immunodepletion. Further
investigation into the involvement of TDP1 in mtDNA repair was carried out using a
long-range quantitative PCR based assay following hydrogen peroxide (H2O2) treatment
in cells with or without Tdp1 knockout. The data from this suggested the loss of TDP1
caused dramatically more mtDNA damage with H2O2 treatment in comparison to
controls. From this the group concluded that mitochondrial base excision repair

68
(mtBER) was dependent on TDP1, implying that this enzyme was a critical member of
the mtDNA repair network (Das et al., 2010).
Although the data from this paper shows clearly that TDP1 is present and active in
mitochondria, similar to our previous observations, the conclusion that mtBER depends
on this enzyme is a conclusion that does not appear to be true based on our own
observations (Das et al., 2010). If mtBER depended on TDP1 it would be reasonable to
assume the mtDNA mutation rate would be relatively high, yet the phenotype of
SCAN1 patients and Tdp1 -/- mice is relatively mild in comparison to patients and mice
with high mtDNA mutation load (Stumpf and Copeland, 2011, Trifunovic et al., 2004).
It has also been shown that other enzymes involved in mtBER, namely LIG3, play a
critical role in maintaining the integrity of mtDNA and also show very severe
phenotypes in mice, which contrasts to Tdp1 -/- mice (Simsek et al., 2011, Gao et al.,
2011). Also, demonstrating that TDP1 can resolve 3’ phosphoglycolate in mitochondria
corroborates that already observed in the nucleus, but this in itself does not demonstrate
that TDP1 can resolve all DNA lesions involved in BER (Das et al., 2010, Interthal et
al., 2005). The authors neglected the possibility that other 3’ damaged termini are likely
to exist in mtDNA other than 3’ phosphotyrosine and 3’ phosphoglycolate; not to
mention 5’ damaged termini that require repair such as 5’ adenine monophosphate and
5’ hydroxyl, to name just two (Caldecott, 2008). Experience of the principal supervisor
of this project (Professor R.N.Lightowlers), with regard to the long range quantitative
PCR assay used to assess mtDNA damage in the publication, revealed that this assay
can be highly variable and any results provided using this should be viewed with
caution. With this in mind it was decided to continue with the aim of trying to determine
whether TDP1 was essential for mtDNA repair and cell survival to either confirm or
contradict the conclusion that mtBER depends on TDP1 (Das et al., 2010).

69
Approaching this began with analysis of Tdp1 -/- mouse brain to determine whether
there was any mitochondrial dysfunction detectable through COX/SDH histochemistry.
This would determine whether there is any severe mtDNA damage resulting in COX
deficiency in the cerebellum of these mice. Our collaborators had also observed
increased retinal degeneration in Tdp1 -/- mice with methylmethane sulfonate (MMS)
treatment, and so it was intended to assess mitochondrial involvement in this as there is
mounting evidence for mitochondrial dysfunction in retinal diseases (Barot et al., 2011).
Experiments were also conducted using mammalian cells in culture. Some of these
included transient siRNA transfections to knockdown TDP1 and determine whether this
provided any data on the involvement of TDP1 in mtDNA repair. Our collaborators had
also generated a mutant form of the mitochondrial topoisomerase (TOP1mtY559A
) to be
used in the cell culture experiments. This construct contains a mutation changing amino
acid 559 from tyrosine to alanine (Y559A), thus affecting the active site of the enzyme
causing it to remain covalently bound to mtDNA upon nicking (Redinbo et al., 1998,
Zhang et al., 2001). This would then require TDP1 for removal, therefore expressing
TOP1mtY559A
in cells in culture was intended to provide more information on the role of
TDP1 in mtDNA repair.
4.2 Methods
4.2.1 Ionizing radiation treatment of mice
In order to generate mtDNA damage in the brain that would require TDP1 for repair
mice were treated with ionizing radiation (IR). This was achieved in a 7 day experiment
by dosing 1.5 years Tdp1 -/- and wild type mice with 3Gy caesium 137 on day 1 and
day 4, and 10Gy on day 7 with brain being harvested 3 hours after the last exposure.

70
This dose is similar to that given to human patients receiving radiotherapy in treatment
of brain tumours (10Gy/week). Radiation was delivered using a Cammael 1000 source.
4.2.2 Methylmethane sulfonate (MMS) treatment of mice
Treatment using MMS was carried out to stall mtDNA replication forks in Tdp1 -/- and
wild type mice that may then require TDP1 for repair, with particular focus being on the
retina of these mice. This was undertaken by intraperitoneal injection of 6-8 week-old
mice with 75mg/kg MMS and collecting tissue after 5 days. Mice were kept under daily
observation following MMS treatment and were culled humanely if found to be in any
discomfort.
4.2.3 Cytochrome c oxidase (COX)/succinate dehydrogenase (SDH) histochemistry
To assess whether significant mtDNA damage was occurring in mice dual COX/SDH
histochemistry was performed. The principal behind using this technique is that there
are three subunits of COX encoded in the mitochondrial genome and therefore damage
to mtDNA may cause reduced expression of these proteins, which consequently affects
the activity of COX. In contrast SDH is fully encoded in nDNA and its activity should
not be affected by mtDNA damage. This technique uses cytochrome c which is reduced
when mixed with DAB, but is then oxidised when placed on the tissue section if COX is
active. A brown colour is then produced as DAB donates more electrons to cytochrome
c as it is oxidised by COX. A second reaction medium is then used on the section of
tissue which contains sodium succinate, sodium azide, NBT and PMS. The NBT acts as
a final electron acceptor following dehydrogenation of sodium succinate by SDH
followed by transport of electrons by PMS to NBT, and the sodium azide inhibits COX
to ensure no further activity is seen from this complex. As the NBT is reduced it
produces a blue colour that will only be seen if there is reduced COX activity from the
previous staining procedure (Old and Johnson, 1989).

71
For this thesis sections of mouse brain and eye that had been cut to 10µm using a
cryostat (Leica Biosystems) were firstly incubated in 100µl COX reaction medium for
the following times for each tissue type at 37oC (See appendix for optimisation of
incubation times):
Mouse brain – 35 mins
Mouse eye – 30 mins
Following this incubation sections were washed three times in 100µl PBS for 5 mins
each time and then incubated in 100µl SDH reaction medium for the following time at
37oC:
Mouse brain – 40 mins
Mouse eye – 35 mins
Washing was repeated a further three times using 100µl PBS for 5 mins each time. For
mouse eye sections counterstaining with 100µl Vector Methyl Green (Vector
laboratories) was carried out for 10 mins at 65oC to help distinguish retinal morphology
before sections were washed three times in 100µl PBS for 5 mins each time and then
dehydrated in the following percentages of EtOH in H2O for the indicated times:
70% EtOH – 5 mins
95% EtOH – 5 mins
100% EtOH – 5 mins
100% EtOH – 10 mins
Sections were allowed to air dry for 5 mins before being mounted using DPXTM
and a
coverslip, followed by image acquisition using a light microscope (Zeiss).
COX reaction medium SDH reaction medium
100µM Cytochrome c 1.3M Sodium succinate
4mM DAB 1.875mM NBT
0.2M Phosphate buffer pH 7 2mM PMS
100mM Sodium azide
0.2M Phosphate buffer pH 7
4.2.4 TOP1mt/FLAG and TOP1mtY559A
/FLAG expression experiments
Following stable transfection of TOP1mt/FLAG and TOP1mtY559A
/FLAG into Flp-InTM
T-RexTM
HEK293 cells as described in 2.2.2. (vii) it was necessary to determine

72
whether clones exhibiting resistance to antibiotics blasticidin S and hygromycin B
expressed the desired proteins upon induction. This was accomplished by seeding 5x10⁵
cells in 2ml supplemented DMEM in 2 wells of a 6-well plate for each clone of both
HEK293/TOP1mt/FLAG and HEK293/TOP1mtY559A
/FLAG and adding 1µg/ml (final
concentration) tetracycline in one well for each clone leaving the other without
tetracycline as a control. Cells were incubated as outlined in 2.2.2 (i) for 18 hours before
cytoplasmic protein was isolated as described in 2.2.3 (i). In order to determine whether
expression of TOP1mt/FLAG and TOP1mtY559A
/FLAG was successful in each clone
SDS-PAGE (2.2.3 (vii)) and western blotting (2.2.3 (viii)) were performed using the
cytoplasmic isolate for each sample.
Once successful expression of each protein had been established (figure 4.5), clone D
for HEK293/TOP1mt/FLAG and clone A for HEK293/TOP1mtY559A
/FLAG were
selected for further experimentation as these clones appeared to produce the strongest
signal on western blot analysis using the M2 anti-FLAG antibody in comparison to
other clones for each cell line. Expressing both proteins for 6 days would enable
analysis of whether TOP1mtY559A
/FLAG had any significant effect on cell growth,
mtDNA encoded protein levels, or levels of mtDNA copy number in comparison to
TOP1mt/FLAG. To facilitate this each cell line was seeded in triplicate at 5x10⁴ cells in
2 poly-L-ornithine treated 25cm2 flasks with 5ml supplemented DMEM to allow
unrestricted growth. Tetracycline at 1µg/ml final concentration was added to one flask
for both cell lines in each of the three replicates and incubated as described in 2.2.2 (i)
for 72 hours. After this period media was removed from each flask and replaced with
fresh supplemented DMEM containing 1µg/ml tetracycline and incubated for a further
72 hours as in 2.2.2 (i).

73
Cells were harvested using 1ml PBS/1mM EDTA, transferred to a 2ml reaction tube,
and neutralised using 1ml supplemented DMEM. Samples were centrifuged at 260xg
for 4mins, supernatant discarded, and cells carefully re-suspended in 1ml PBS. From
this 100µl cell suspension was mixed with 100µl 50% Trypan Blue/PBS and used for
cell counting with an improved Neubauer Haemocytometer (Hawksley) to determine
any impact on cell growth. The remaining cell suspension was centrifuged once more at
260xg for 4mins, supernatant discarded, and cytoplasmic protein isolated as described
in 2.2.3 (i) before SDS-PAGE (2.2.3 (vii)) and western blotting (2.2.3 (viii)) were
carried out to detect levels of mtDNA encoded proteins (COXI and COXII) in the
absence of TDP1 compared to controls.
This experiment was repeated with exception to the cytoplasmic protein isolation
followed by SDS-PAGE and western blotting. On this occasion the remaining cell
suspension was used for whole cell DNA extraction as described in 2.2.4 (vii) and used
for qRTPCR analysis as in 2.2.4 (ii).
4.2.5 siRNA transfection optimisation
With the intention of performing TDP1 knockdown experiments it was necessary to
determine if the Trisilencer-27 siRNA kit (OriGene) was capable of reducing the levels
of TDP1 that would then be undetectable by western blot analysis. If TDP1 was not
detected by western blot analysis then it could be assumed that the protein was no
longer present in these cells. To assess this, 3 concentrations (0.1nM, 1nM, and 10nM
final) of each siRNA construct provided in the kit were used including a negative
control (non-targeted) to determine whether the highest concentration of a non-specific
siRNA had any impact on the levels of TDP1. In 1.5ml reaction tubes 4µl lipofectamine
(life technologies) was mixed with 500µl Opti-MEM RNAiMAX (life technologies)

74
and 1.25µl stock siRNA. For each siRNA construct used, including the negative control,
3 stocks had been prepared for each final concentration desired:
Stock 0.2µM 2µM 20µM
Final concentration 0.1nM 1nM 10nM
An untransfected control reaction was also prepared using the same reagents with
exception to addition of any siRNA construct. Each reaction was incubated for 15mins
at room temperature before being added to 1x10⁵ Flp-In
TM T-Rex
TM HEK293 cells in 6-
well plates with 2ml supplemented DMEM and incubated for 72 hours as described in
2.2.2 (i). Cytoplasmic protein was then isolated as described in 2.2.3 (i) and TDP1
levels determined by SDS-PAGE (2.2.3 (vii)) and western blotting (2.2.3 (viii)).
4.2.6 siRNA transfection of Flp-InTM
T-RexTM
HEK293
With siRNA transfection optimisation completed as described in 4.2.4 it was concluded
that siRNA would be used at 10nM final concentration with constructs B and C
reducing the levels of TDP1 to the extent that it was not detectable by western blot
analysis (figure 4.6). Knockdown of TDP1 was then performed over 6 days in Flp-InTM
T-RexTM
HEK293 cells to determine whether there were any effects on cell growth,
mtDNA encoded protein levels, or mtDNA copy number in the absence of TDP1. This
was undertaken by mixing 8µl lipofectamine (life technologies) with 1ml Opti-MEM
RNAiMAX (life technologies) and 2.5µl 20µM construct C siRNA in a 1.5ml reaction
tube. The same reaction was set up replacing construct C siRNA with 2.5µl 20µM non-
targeted siRNA as a negative control. A reaction without any siRNA was also prepared
and all reactions were made in triplicate. Reactions were incubated for 15mins at room
temperature before being added to 5x10⁴ Flp-In
TM T-Rex
TM HEK293 cells in poly-L-

75
ornithine treated 25cm2 flasks with 4ml supplemented DMEM to allow for unrestricted
cell growth. Cells were incubated for 72 hours as described in 2.2.2 (i) before the
siRNA transfection was repeated and cells incubated for a further 72 hours.
Cells were counted, and protein and DNA extracted and analysed as in 4.2.3. This
experiment was also repeated for further cell counting and isolation of DNA.
4.2.7 siRNA transfection with TOP1mt/FLAG and TOP1mtY559A
/FLAG expression
experiment
In an attempt to generate a greater degree of mtDNA-TOP1 lesions to investigate TDP1
function in mtDNA repair an experiment combining TDP1 knockdown with expression
of TOP1mt/FLAG and TOP1mtY559A
/FLAG was conducted. From this it would be
possible to observe whether there was a greater impact on cell growth, levels of mtDNA
encoded proteins, or mtDNA copy number when the specific damage that TDP1 is
responsible for repairing was being generated in the absence of this enzyme. Using
HEK293/TOP1mt/FLAG clone D and HEK293/TOP1mtY559A
/FLAG clone A cell lines
cells were seeded at 5x10⁴ in poly-L-ornithine treated 25cm
2 flasks in 5ml
supplemented DMEM for unrestricted growth. The same siRNA transfection as in 4.2.5
was carried out for each cell line in triplicate and cells had expression of
TOP1mt/FLAG and TOP1mtY559A
/FLAG induced as in 4.2.3.
After the experiment was complete cells were counted, and protein and DNA extracted
and analysed as in 4.2.3. This experiment was repeated to increase validity of results.
4.3 Results
4.3.1 No COX negativity in Tdp1 -/- mouse brain or eye

76
In order to determine whether there was severe mtDNA damage occurring in Tdp1 -/-
mice COX/SDH histochemistry was carried out on mouse brain and eye. The rationale
for using this technique was that severe mtDNA damage can cause reduced production
of mRNA encoding COX proteins and thus reduce COX activity, which can be detected
upon histochemical analysis.
i) No COX negativity in Tdp1 -/- mouse brain
Dual COX/SDH histochemistry was performed on wild type and Tdp1 -/- mouse brain
sections with particular attention to the granule and Purkinje cell layers of the
cerebellum. The reason for this was that SCAN1 causes defects in the cerebellum in
patients which is also observed in Tdp1 -/- mice (Katyal et al. 2007). The results from
this method of analysis are illustrated in figure 4.1.
Figure 4.1. COX/SDH histochemistry (described in 4.2.3) of mouse brain cerebellum.
Sections cut to 10µm.
GCL – Granule cell layer
PCL – Purkinje cell layer
(A and B) Tdp1 +/+
(C and D) Tdp1 -/-

77
The images in figure 4.1 C and D show no sign of COX deficiency and therefore
demonstrate that there was no severe mtDNA damage occurring in Tdp1 -/- mouse brain
cerebellum. There are no blue coloured cells visible in C or D similar to that in the wild
type mouse brain in A and B, suggesting that any mtDNA damage in cells without
TDP1 was not enough to cause a biochemical defect.
ii) No COX negativity in Tdp1 -/- mouse brain following ƴ-irradiation
Following the results observed in 4.3.1 (i) ƴ-irradiation was used as a means to generate
increased mtDNA damage that would potentially have a greater impact in Tdp1 -/- mice.
Once this had been performed COX/SDH histochemistry was carried out on wild type
and Tdp1 -/- mouse brain sections to determine whether there were any COX deficient
cells in any sections that would suggest severe mtDNA damage. Results for this
experiment are shown in figure 4.2.
Figure 4.2. COX/SDH histochemistry (described in 4.2.3) of mouse brain cerebellum
following ƴ-irradiation (described in 4.2.1). Sections cut to 10µm.
GCL – Granule cell layer
PCL – Purkinje cell layer
(A and B) Tdp1 +/+
(C and D) Tdp1 -/-

78
Images C and D in figure 4.2 demonstrate that in the absence of TDP1 there is no
severe mtDNA damage that is visible by COX/SDH histochemistry in the cerebellum
following ƴ-irradiation. These images are similar to those observed in A and B for the
wild type control. However, Tdp1 -/- mice did show an early onset of ataxia following
γ-irradiation, which would suggest that this treatment did have an effect in mice lacking
TDP1.
iii) No COX negativity in Tdp1 -/- mouse eye
Analysis by COX/SDH histochemistry was carried out in wild type and Tdp1 -/- mouse
eye sections as our collaborators had observed greater retinal degeneration under a
particular treatment (MMS), and mitochondrial involvement in this was to be
investigated. Firstly, COX/SDH histochemistry was performed on eye sections taken
from wild type and Tdp1 -/- mice without any treatment. The results from this are
illustrated in figure 4.3.
Figure 4.3. COX/SDH histochemistry and methyl green counterstaining (described in
4.2.3) of mouse eye retina. Sections cut to 10µm.
R - Retina
(A and B) Tdp1 +/+
(C and D) Tdp1 -/-

79
The images shown in figure 4.3 demonstrate that without stress there is no severe
mtDNA damage in the absence of TDP1 that would cause a biochemical defect leading
to blue coloured cells following COX/SDH histochemistry (C and D). These results are
the same as for eye sections taken from wild type mice with the blue layer of cells
(photoreceptors) visible in all images being as a result of counterstaining with methyl
green to aid in determining eye morphology. There is also no noticeable retinal
degeneration in sections from Tdp1 -/- mice, similar to that in sections from the wild
type control.
iv) No COX negativity in Tdp1 -/- mouse eye following MMS treatment
Using MMS to stall replication forks in mice and thus potentially cause severe mtDNA
damage leading to COX deficiency was the next step in analysing the role for TDP1 in
mtDNA repair. Treatment using MMS was carried out in wild type and Tdp1 -/- mice
before COX/SDH histochemistry was performed to determine whether there was
increased retinal degeneration and/or COX deficiency in mice lacking TDP1. Results
from this experiment are shown in figure 4.4.
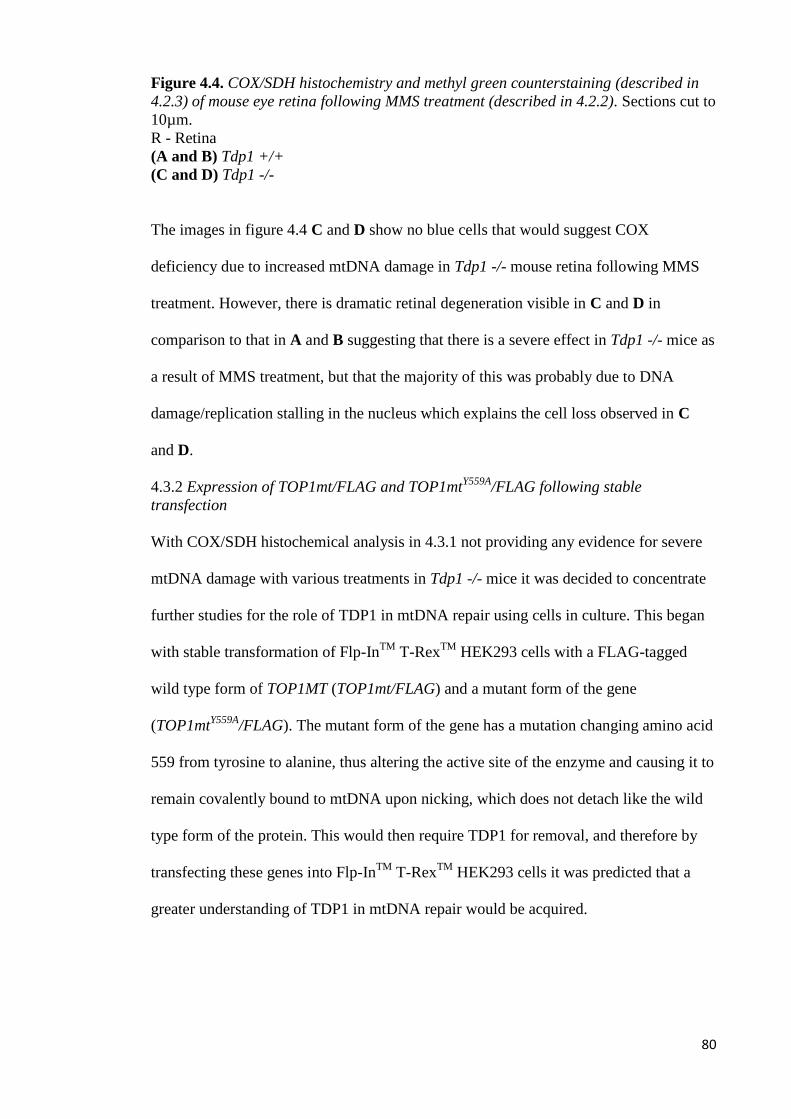
80
Figure 4.4. COX/SDH histochemistry and methyl green counterstaining (described in
4.2.3) of mouse eye retina following MMS treatment (described in 4.2.2). Sections cut to
10µm.
R - Retina
(A and B) Tdp1 +/+
(C and D) Tdp1 -/-
The images in figure 4.4 C and D show no blue cells that would suggest COX
deficiency due to increased mtDNA damage in Tdp1 -/- mouse retina following MMS
treatment. However, there is dramatic retinal degeneration visible in C and D in
comparison to that in A and B suggesting that there is a severe effect in Tdp1 -/- mice as
a result of MMS treatment, but that the majority of this was probably due to DNA
damage/replication stalling in the nucleus which explains the cell loss observed in C
and D.
4.3.2 Expression of TOP1mt/FLAG and TOP1mtY559A
/FLAG following stable
transfection
With COX/SDH histochemical analysis in 4.3.1 not providing any evidence for severe
mtDNA damage with various treatments in Tdp1 -/- mice it was decided to concentrate
further studies for the role of TDP1 in mtDNA repair using cells in culture. This began
with stable transformation of Flp-InTM
T-RexTM
HEK293 cells with a FLAG-tagged
wild type form of TOP1MT (TOP1mt/FLAG) and a mutant form of the gene
(TOP1mtY559A
/FLAG). The mutant form of the gene has a mutation changing amino acid
559 from tyrosine to alanine, thus altering the active site of the enzyme and causing it to
remain covalently bound to mtDNA upon nicking, which does not detach like the wild
type form of the protein. This would then require TDP1 for removal, and therefore by
transfecting these genes into Flp-InTM
T-RexTM
HEK293 cells it was predicted that a
greater understanding of TDP1 in mtDNA repair would be acquired.

81
Transfection of TOP1mt/FLAG and TOP1mtY559A
/FLAG into Flp-InTM
T-RexTM
HEK293 cells was completed and results for successfully expressing clones are shown
in figure 4.5.
A
B
Figure 4.5. Analysis of TOP1mt/FLAG and TOP1mtY559A/FLAG expression. Western
blot analysis as described 2.2.4 (viii) using 20µg cytoplasmic protein isolated as
described in 2.2.4 (i) to determine expression of desired protein following stable
transfection of Flp-InTM
T-RexTM
HEK293 cells as described in 2.2.2 (vii). Expression
of each protein was induced with addition of 1µg/ml (final concentration) tetracycline
from 5x10⁵ cells in 2ml supplemented DMEM in 6-well plates, followed by incubation
for 18 hours in conditions outlined in 2.2.2 (i). A separate well containing 5x10⁵ cells
for each clone in 2ml supplemented DMEM was left without tetracycline as controls
(A) Analysis of 4 clones following transfection of TOP1mt/FLAG. (B) Analysis of 6
clones following transfection of TOP1mtY559A
/FLAG.
Western blot analysis in figure 4.5 A shows successful expression of TOP1mt/FLAG in
4 clones following the transfection and induction with tetracycline (lanes 2, 4, 6, and 8).
The uninduced controls (lanes 1, 3, 5, and 7) show no signal as anticipated. Also,
western blot analysis in B illustrates successful expression of TOP1mtY559A
/FLAG from
6 clones following transfection and induction with tetracycline (lanes 2, 4, 6, 8, 10, and
12); whereas the uninduced controls (lanes 1, 3, 5, 7, 9, and 11) show no signal. Equal
loading for each western blot was proven using α-porin antibody. Following this it was
concluded that clone D for HEK293/TOP1mt/FLAG and clone A for HEK293/

82
TOP1mtY559A
/FLAG would be used for further experiments as they appeared to show the
strongest expression based on the western blots in figure 4.5.
4.3.3 Localisation of TOP1mt/FLAG and TOP1mtY559A
/FLAG to mitochondria
Once successful expression of TOP1mt/FLAG and TOP1mtY559A
/FLAG had been
established in 4.3.2, it was necessary to confirm that each of the clones selected for
further experiments (clone D for HEK293/TOP1mt/FLAG and clone A for HEK293/
TOP1mtY559A
/FLAG) had expression of their respective proteins targeted to
mitochondria. This was achieved using a Proteinase K (life technologies) protection
assay described in 2.2.3 (v) for which the results are shown in figure 4.6.
A
B
Figure 4.6. Analysis of TOP1mt/FLAG and TOP1mtY559A/FLAG mitochondrial
localisation. Western blot analysis as described 2.2.3 (ix) using 10µg mitochondrial
protein isolated as described in 2.2.3 (ii) to determine mitochondrial localisation of both
TOP1mt/FLAG and TOP1mtY559A
/FLAG following stable transfection of Flp-InTM
T-
RexTM
HEK293 cells as described in 2.2.2 (vii). Expression of each protein was induced
in each cell line with addition of 1µg/ml (final concentration) tetracycline followed by
incubation for 18 hours in conditions outlined in 2.2.2 (i). Localisation of both proteins
was assessed by addition of 0.5µg, 2µg, and 4µg Proteinase K (life technologies) with
or without Triton X-100 as described in 2.2.3 (v). (A) Analysis of TOP1mt/FLAG clone
D (B) Analysis of TOP1mtY559A
/FLAG clone A.
Successful localisation of both proteins is demonstrated in figure 4.6. In A and B 2µg
was the optimal concentration of Proteinase K (life technologies) to show that both
TOP1mt/FLAG and TOP1mtY559A
/FLAG were protected by the mitochondrial outer
membrane in samples without Triton X-100 (lanes 5 in A and B), whereas those

83
samples with this detergent added showed no signal for the expressed protein using the
M2 α-FLAG antibody (lanes 6 in A and B). It was found in optimising this assay that
0.5µg Proteinase K was not enough to cause degradation of either TOP1mt/FLAG or
TOP1mtY559A
/FLAG with Triton X-100 addition (lanes 3 in A and B), and that 4µg was
too much and caused widespread degradation of proteins including porin (lane 8 in A
and lanes 8 and 9 in B). Nevertheless, based on the results using 2µg Proteinase K it
was concluded that on expression of TOP1mt/FLAG or TOP1mtY559A
/FLAG these
proteins were both localised to mitochondria, and could then be used in further
experiments.
4.3.4 No decreased cell growth, reduction of mtDNA encoded proteins, or reduction in
mtDNA copy number upon TOP1mtY559A
/FLAG expression
With the knowledge that TOP1mt/FLAG or TOP1mtY559A
/FLAG were expressed and
localised to mitochondria in HEK293/TOP1mt/FLAG and HEK293/
TOP1mtY559A
/FLAG, respectively, it was decided to express each protein within their
cell line for 6 days to determine whether this had any impact on cell growth, levels of
mtDNA encoded proteins, or mtDNA copy number in comparison to uninduced
controls. The results from this experiment are outlined in figure 4.7.

84
Figure 4.7. Expression of TOP1mt/FLAG and TOP1mtY559A
/FLAG for 6 days by
addition of 1µg/ml (final concentration) tetracycline at the 0 hours and 72 hours of
experiment start. Both cell lines were seeded at 5x10⁴ in 25cm
2 flasks in triplicate in
5ml supplemented DMEM without any limiting factors on cell growth. (A) Cell counts
(mean +/- SEM from each triplicate) performed using an improved Neubauer
Haemocytometer (Hawksley) upon expression (+) of both TOP1mt/FLAG (wt) and
TOP1mtY559A
/FLAG (mut) in comparison to non-expressed (-) controls. Dashed line
indicates approximate starting number of cells (5x10⁴ cells). (B) Real-time PCR (qRT-
PCR) as described in 2.2.4 (ii) to determine mtDNA copy number by the ratio of ND1
reads in comparison to reads of a nuclear control B2M (mean +/- SEM from each
triplicate). For this, whole cell DNA extraction as described in 2.2.5 (x) was performed
following expression (+) of both TOP1mt/FLAG (wt) and TOP1mtY559A
/FLAG (mut) in
comparison to non-expressed (-) controls. (C) Western blot analysis as described 2.2.3
(viii) using 20µg cytoplasmic protein isolated as described in 2.2.3 (i) to determine
levels of mtDNA encoded proteins (COXI and COXII) upon expression (+) of both
TOP1mt/FLAG (wt) and TOP1mtY559A
/FLAG (mut) in comparison to non-expressed (-)
controls.
The graph in figure 4.7 A shows that there was no significant decrease in cell growth
with expression of TOP1mtY559A
/FLAG for 6 days in comparison to uninduced controls.
As expected, the results upon expression of TOP1mt/FLAG for the same time period
showed no reduction in cell growth. When analysis by qRT-PCR was carried out using
DNA isolated from these cells there was no significant reduction in mtDNA copy
number with expression of TOP1mtY559A
/FLAG in comparison to controls. Not
surprisingly, when cytoplasmic protein was isolated and western blotting performed in

85
C, there was no reduction in the levels of mtDNA encoded proteins (COXI and COXII)
with expression of TOP1mtY559A
/FLAG (lanes 4, 8, and 12) in comparison to expression
of TOP1mt/FLAG and uninduced controls. Both COXI and COXII have a half-life of
six days and so it may have been expected that if this treatment caused severe mtDNA
damage the transcript levels of corresponding mRNAs could have been reduced
resulting in 50% reduction of signal on western blot analysis, but this was not observed.
This suggested that expression of TOP1mtY559A
/FLAG alone over 6 days was not
enough to cause severe mtDNA damage and affect cell growth, mtDNA encoded
protein levels, or mtDNA copy number.
4.3.5 TDP1 siRNA transfection optimisation
With expression of TOP1mtY559A
/FLAG alone not leading to any detectable mtDNA
damage or negative effect in cells, alternative methods for evaluating the role of TDP1
in mtDNA repair were considered. One of these was to knock down TDP1 in Flp-InTM
T-RexTM
HEK293 cells using siRNA and evaluate its effect in a similar way as in 4.3.4.
To begin this line of experiments the TDP1 siRNA constructs (OriGene) were required
to be tested to measure their effectiveness at different concentrations. This was
implemented with a 3 day knockdown using siRNA constructs A, B, and C at 0.1nM,
1nM, and 10nM final concentration whilst also using a non-targeted siRNA control at
the same concentration to determine whether there was any off target knockdown of
TDP1 using this construct. The results from this knockdown are shown in figure 4.8.
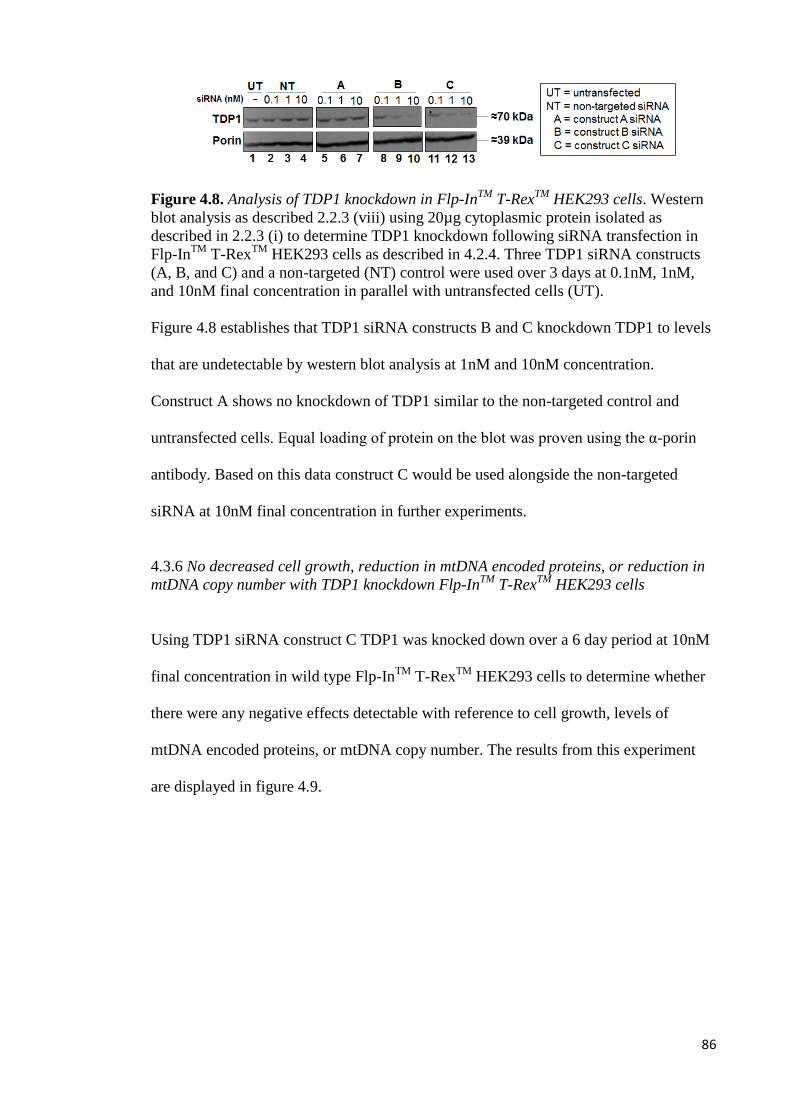
86
Figure 4.8. Analysis of TDP1 knockdown in Flp-InTM
T-RexTM
HEK293 cells. Western
blot analysis as described 2.2.3 (viii) using 20µg cytoplasmic protein isolated as
described in 2.2.3 (i) to determine TDP1 knockdown following siRNA transfection in
Flp-InTM
T-RexTM
HEK293 cells as described in 4.2.4. Three TDP1 siRNA constructs
(A, B, and C) and a non-targeted (NT) control were used over 3 days at 0.1nM, 1nM,
and 10nM final concentration in parallel with untransfected cells (UT).
Figure 4.8 establishes that TDP1 siRNA constructs B and C knockdown TDP1 to levels
that are undetectable by western blot analysis at 1nM and 10nM concentration.
Construct A shows no knockdown of TDP1 similar to the non-targeted control and
untransfected cells. Equal loading of protein on the blot was proven using the α-porin
antibody. Based on this data construct C would be used alongside the non-targeted
siRNA at 10nM final concentration in further experiments.
4.3.6 No decreased cell growth, reduction in mtDNA encoded proteins, or reduction in
mtDNA copy number with TDP1 knockdown Flp-InTM
T-RexTM
HEK293 cells
Using TDP1 siRNA construct C TDP1 was knocked down over a 6 day period at 10nM
final concentration in wild type Flp-InTM
T-RexTM
HEK293 cells to determine whether
there were any negative effects detectable with reference to cell growth, levels of
mtDNA encoded proteins, or mtDNA copy number. The results from this experiment
are displayed in figure 4.9.
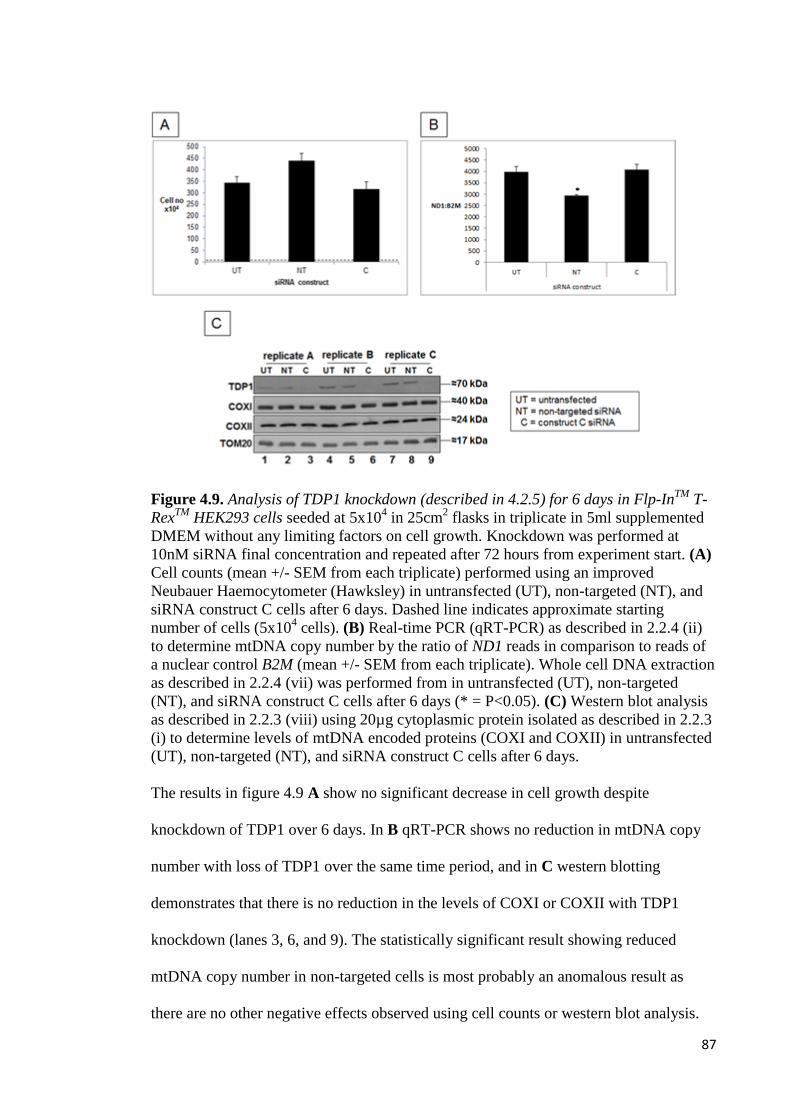
87
Figure 4.9. Analysis of TDP1 knockdown (described in 4.2.5) for 6 days in Flp-InTM
T-
RexTM
HEK293 cells seeded at 5x10⁴ in 25cm
2 flasks in triplicate in 5ml supplemented
DMEM without any limiting factors on cell growth. Knockdown was performed at
10nM siRNA final concentration and repeated after 72 hours from experiment start. (A)
Cell counts (mean +/- SEM from each triplicate) performed using an improved
Neubauer Haemocytometer (Hawksley) in untransfected (UT), non-targeted (NT), and
siRNA construct C cells after 6 days. Dashed line indicates approximate starting
number of cells (5x10⁴ cells). (B) Real-time PCR (qRT-PCR) as described in 2.2.4 (ii)
to determine mtDNA copy number by the ratio of ND1 reads in comparison to reads of
a nuclear control B2M (mean +/- SEM from each triplicate). Whole cell DNA extraction
as described in 2.2.4 (vii) was performed from in untransfected (UT), non-targeted
(NT), and siRNA construct C cells after 6 days (* = P<0.05). (C) Western blot analysis
as described in 2.2.3 (viii) using 20µg cytoplasmic protein isolated as described in 2.2.3
(i) to determine levels of mtDNA encoded proteins (COXI and COXII) in untransfected
(UT), non-targeted (NT), and siRNA construct C cells after 6 days.
The results in figure 4.9 A show no significant decrease in cell growth despite
knockdown of TDP1 over 6 days. In B qRT-PCR shows no reduction in mtDNA copy
number with loss of TDP1 over the same time period, and in C western blotting
demonstrates that there is no reduction in the levels of COXI or COXII with TDP1
knockdown (lanes 3, 6, and 9). The statistically significant result showing reduced
mtDNA copy number in non-targeted cells is most probably an anomalous result as
there are no other negative effects observed using cell counts or western blot analysis.
*

88
4.3.7 Significantly decreased cell growth with TDP1 knockdown and expression of
TOP1mt/FLAG and TOP1mtY559A
/FLAG, but no reduction in mtDNA encoded proteins,
or reduction mtDNA copy number
The experiments conducted in 4.3.4 and 4.3.6 indicate that expressing
TOP1mtY559A
/FLAG and knocking down TDP1, as separate treatments, are not enough
to cause severe mtDNA damage that presents in decreased cell growth, reduction in
levels of mtDNA encoded proteins, or lowered mtDNA copy number. With this in mind
it was decided to knockdown TDP1 and express TOP1mtY559A
/FLAG for 6 days to
determine whether combining these treatments had a negative impact on cells, which
may aid in realising the exact role for TDP1 in mtDNA repair. Knockdown of TDP1
with expression of TOP1mt/FLAG was also performed as a control, as well as cells
without TDP1 knockdown but expression of both TOP1mt/FLAG and
TOP1mtY559A
/FLAG. Results from this experiment are shown in figure 4.10.

89
Figure 4.10. Analysis of TDP1 knockdown and TOP1mt/FLAG and TOP1mtY559A
/FLAG
for 6 days. siRNA transfection at 10 nm (final concentration) and expression of
TOP1mt/FLAG and TOP1mtY559A
/FLAG by addition of 1µg/ml (final concentration)
tetracycline over 6 days in HEK293/TOP1mt/FLAG and HEK293/TOP1mtY559A
/FLAG
cells. Cells were seeded at 5x10⁴ in 25cm
2 flasks in triplicate. The siRNA transfection
and addition of tetracycline was repeated after 72 hours from experiment start. (A) Cell
counts (mean +/- SEM from each triplicate) performed using an improved Neubauer
Haemocytometer (Hawksley) for untransfected (UT), non-targeted (NT), and siRNA
construct C cells with expression of both TOP1mt/FLAG (wt) and TOP1mtY559A
/FLAG
(mut) after 6 days. Dashed line indicates approximate starting number of cells (5x10⁴)
(* = P<0.05). (UT/NT vs C) (B) Real-time PCR (qRT-PCR) as described in 2.2.4 (ii)
measuring the ratio of ND1 reads in comparison to reads of the nuclear control B2M to
determine mtDNA copy number (mean +/- SEM from each triplicate). Whole cell DNA
extraction as described in 2.2.4 (vii) was performed from untransfected (UT), non-
targeted (NT), and siRNA construct C cells with expression of both TOP1mt/FLAG
(wt) and TOP1mtY559A
/FLAG (mut) after 6 days. (C) Western blot analysis as described
2.2.3 (viii) using 20µg cytoplasmic protein isolated as described in 2.2.3 (i) to determine
levels of mtDNA encoded proteins (COXI and COXII) in untransfected (UT), non-
targeted (NT), and siRNA construct C cells with expression of both TOP1mt/FLAG
(wt) and TOP1mtY559A
/FLAG (mut) after 6 days.
In figure 4.10 A cell counting revealed that over 6 days there was significantly less cell
growth in cells that had TDP1 knocked down, and TOP1mt/FLAG and
TOP1mtY559A
/FLAG expressed. This suggests that there is sufficient mtDNA damage
occurring in these cells to have a negative impact on cell proliferation, which is not

90
observed in control cells for the experiment. This was unexpected for cells expressing
TOP1mt/FLAG, but it must be that lesions occur more often than originally thought
when TOP1mt/FLAG is expressed and TDP1 would then be required for repair.
Western blotting in B indicates that in spite of the decreased cell growth there was no
reduction in either COXI or COXII in protein from cells that had TDP1 knocked down,
and that were expressing TOP1mt/FLAG or TOP1mtY559A
/FLAG (lanes 3, 6, 9, 12, 15,
and 18). Similarly there was no decrease in mtDNA copy number in these cells (C),
suggesting that the damage to mtDNA was not enough to cause a reduction in mtDNA
levels or the levels of mtDNA encoded proteins despite a reduction in cell growth.
There was a slight increase in mtDNA copy number in cells that had been transformed
with TOP1mtY559A
/FLAG in comparison to cells with the wild type form of this protein.
However when comparing mtDNA copy number in HEK293/TOP1mtY559A
/FLAG cells
between the TDP1 knockdown, and non-targeted and untreated controls there does not
appear to be any discernible cause for this with regard to mtDNA damage as a result of
these treatments. Therefore no conclusions can be drawn from the result in this instance.
4.4 Discussion
With TDP1 presence and activity being demonstrated in chapter 3 and verified by
another group, the experiments in this chapter were designed to assess whether TDP1 is
essential to mtDNA repair and cell survival (Das et al., 2010). By using Tdp1 -/- mice
and mammalian cell lines it was anticipated our experiments would aid in confirming or
counteracting the argument that:
Mitochondrial base excision repair is dependent on TDP1 (Das et al., 2010)

91
If this was true TDP1 would be a significant member of the mtDNA repair network, and
therefore our line of experiments would help to interpret how essential TDP1 is to
mitochondria.
Impact of TDP1 loss in mice
From their inception Tdp1 -/- mice have been utilised to study the impact of TDP1 loss
with regard to nDNA. It was established that these mice were very similar in phenotype
to SCAN1 patients in terms of their neurological (e.g. cerebellar atrophy and ataxia) and
extraneurological (e.g. hypoalbuminemia) symptoms. Therefore using various
mechanisms to generate specific TOP1-DNA damage through camptothecin (CPT) and
topotecan (TPT), as well as more general single strand break (SSB) and double strand
break (DSB) damage using γ-irradiation, it was possible to find that TDP1 was crucial
to SSB repair (SSBR) of nDNA in primary neural cells. From this the cerebellar atrophy
observed in the mice and patients was attributed to the unrepaired SSBs as a result of
loss of function of TDP1 (Katyal et al., 2007).
In light of these findings and the claim that mtBER is dependent on TDP1 it is
important to make clear the distinction between SSBR and BER (Katyal et al., 2007,
Das et al., 2010). In SSBR the DNA backbone can be broken and form a lesion (e.g. 3’
phosphotyrosine and 5’ AMP) but the base at that particular position may or may not be
damaged in addition (Caldecott, 2008). This is different to BER that has many steps
including one for SSBR (Boesch et al., 2011). In brief, the process begins with the
removal of a damaged base by a DNA glycosylase, incision of the DNA backbone by an
apurinic/apyrimidinic (AP) endonuclease, infilling of the abasic site by a DNA
polymerase, before DNA is finally restored to its original conformation with ligation of
the backbone by a DNA ligase (Boesch et al., 2011). Although the final ligation step in
this process involves SSBR by a DNA ligase, it does not necessarily involve the activity
of TDP1 as the specific substrate required for this enzyme (3’ phosphotyrosine) does

92
not match the 3’ hydroxyl present before the final ligation takes place (Boesch et al.,
2011, Caldecott, 2008). By researching previous studies performed in mice that
investigated mtDNA repair, it may be possible to determine the some of the expected
outcomes of our own experiments if mtBER depends on TDP1.
Mouse knockouts of enzymes with specific involvement to mtBER (e.g. oxoguanine
DNA glycosylase (OGG1) and thymine glycol-DNA glycosylase (NTH1)) have shown
relatively mild to no observable phenotype, but have reduced mtDNA repair capacity
(de Souza-Pinto et al., 2001, Karahalil et al., 2003). The phenotype observed in Tdp1 -/-
mice, in comparison, is more severe and based on this it would appear that this would
support the argument that mtBER depends on TDP1 (Katyal et al., 2007). However,
when Tdp1 -/- mice are compared to other mouse models with knock-outs for enzymes
that are known to be involved in all mtBER, the consequences of TDP1 loss appear to
be relatively mild. The mitochondrial DNA ligase (LIG3α) is involved in all mtBER
and mitochondrial SSBR, and in this case Lig3α -/- mice displayed a very severe
phenotype including mtDNA loss and debilitating ataxia (Gao et al., 2011). Although
TDP1 does not have the same function as LIG3α there would surely be a more
significant phenotype in Tdp1 -/- mice and SCAN1 patients if mtBER was dependent on
TDP1 as the mutation rate of mtDNA would be relatively high, which can have a
dramatic effect at the molecular and whole organism level (Hirano, 2008, Trifunovic et
al., 2004). In the case of the well reported mtDNA mutator mouse, an alteration in the
mitochondrial DNA polymerase ƴ (POLG) to affect the proof reading capability of the
enzyme caused increased mtDNA mutation rate and early ageing onset (Trifunovic et
al., 2004). Such dramatic changes on the whole organism level are not seen in Tdp1-/-
mice, which potentially questions the dependency of mtBER on TDP1. However, data
was required to illustrate this so by assessing the activity of complexes of the electron

93
transport chain, with subunits encoded in mtDNA, it was hoped that more information
could be provided on the role of TDP1 in mtDNA repair.
The results in figure 4.1 and 4.2 show no sign of severe mtDNA damage in the
cerebellum of Tdp1 -/- mice in comparison to wild type controls despite introducing
more DNA damage through γ-irradiation. Although γ-irradiation is used to generate
DSBs in DNA, the vast majority (>95%) of DNA damage using this technique is SSBs
(Katyal et al., 2007). This does not necessarily cause the specific DNA-TOP1 lesion,
but it should lead to these lesions as they can be formed when TOP1 incises DNA at the
site of an already damaged nucleotide (Caldecott, 2008). In the absence of TDP1 the
delivery of DNA damage through γ-irradiation has already been shown to have an effect
in mice with regard to nDNA, and so it was believed that lesions of DNA-TOP1MT
would occur in the mitochondrion using this method (Katyal et al., 2007). However,
with COX/SDH histochemistry there is no evidence to suggest that there is severe
mtDNA damage in the cerebellum of Tdp1 -/- mice indicating that any mtDNA damage
is not occurring at a high enough rate in the absence of TDP1 to have an effect on the
expression of COX subunits encoded in this genome. This suggests that TDP1 is not
critical to general SSB repair of mtDNA as a result of γ-irradiation.
Studies using Tdp1 -/- mice were continued with investigation using COX/SDH
histochemistry in the retina as our collaborators observed retinal degeneration with a
particular treatment, and mitochondrial dysfunction has been associated with retinal
diseases (Barot et al., 2011). In unstressed conditions there did not appear to be any
retinal degeneration or mitochondrial dysfunction in Tdp1 -/- mice as a result of
increased mtDNA damage due to TDP1 loss; as was expected. Further experiments
were carried out using the alkylating agent methylmethane sulfonate (MMS) that adds
methyl groups to DNA bases, which would then require BER enzymes for repair (Wyatt

94
and Pittman, 2006). If mtBER was dependent on TDP1 it may be the case that mtDNA
damage would be severe enough to be detected by COX/SDH histochemistry in Tdp1 -/-
mice. However, there is quite dramatic retinal degeneration in Tdp1 -/- mice that can be
seen in figure 4.4 with no sign of mitochondrial dysfunction. One possible explanation
for this could be that the DNA damage occurring in these mice in the absence of TDP1
is mainly within the nucleus, thus accounting for the cell loss observed in figure 4.4.
This method of generating DNA damage is most probably not the best mechanism to
investigate mtDNA repair and so no definitive conclusions could be made.
One criticism of using COX/SDH histochemistry to detect mtDNA damage is that it
may not be very sensitive to observe this phenomenon in mice. In humans it has been
shown that immunohistochemistry using antibodies against subunits of complex I of the
respiratory chain allows for a more sensitive analysis of respiratory chain defects (Lax
et al., 2012). With many complex I subunits in mtDNA it would appear as though this
would be perfect for analysis of mtDNA damage in mice. However, this was attempted
in relation to a separate project by a member of the Mitochondrial Research Group
(Dr.N.Lax) with much experience in immunohistochemistry, and unfortunately it was
not possible to optimise this technique for mouse brain as there was too much
background signal produced when using this tissue. Investigating the involvement of
TDP1 in mtDNA was then continued with further experiments using mammalian cells
in culture.
Investigations in mammalian cell lines
In order to attempt to delineate the exact role of TDP1 in mtDNA repair, mammalian
cells (HEK293) were manipulated to gain a greater understanding of the importance of
TDP1 on the molecular level. Using cells in culture has many practical advantages over
experiments involving mice and so this would aid in producing more data for analysis.

95
One of the challenges of studying mtDNA damage in cells in culture and in mice is to
generate DNA damage that is specific to the mitochondrial genome as many other
methods (e.g. γ-irradiation, MMS, and H2O2) impact on nDNA as well as mtDNA. In
these instances damage to nDNA may affect any results observed, and so to overcome
this the Flp-InTM
T-RexTM
system (life technologies) was utilised in order to gain cell
lines that had been transformed with a wild type form of TOP1MT (TOP1mt/FLAG)
and a mutant form (TOP1mtY559A
/FLAG). The mutant form of the protein has an altered
active site, which causes it to remain covalently bound to mtDNA upon nicking and
does not become detached as the wild type form would; meaning that TDP1 is then
required for removal. This mutant was designed based on previously studied mutants for
the nuclear TOP1, and in consideration of this the active amino acid residue at position
559 in the mitochondrial topoisomerase was changed from tyrosine to alanine to cause
altered function (Redinbo et al., 1998, Zhang and Pommier, 2008). Expressing the
FLAG-tagged TOP1mtY559A
was intended to increase DNA damage specific to mtDNA
that would then require TDP1 for repair, and help to understand the exact role of this
repair enzyme in mtDNA repair. However, when this mutant was expressed for a six
day period there was no indication of a negative impact in cells as a result, which can be
seen in figure 4.7. This may not be too surprising given that TDP1 was still present and
active in the mitochondria of these cells meaning that it could repair any damage formed
as a result of this expression. Knockdown of TDP1 was also performed to determine
whether there would be any negative effects on cells with the loss of TDP1. Figure 4.9
demonstrates that there was no negative impact in cells with the loss of TDP1.
Although the cells with TDP1 knockdown were not stressed, mtDNA damage would
likely still occur in these cells suggesting that TDP1 is not a critical member of mtDNA
repair as when vital mtDNA repair enzymes are lost, such as the mitochondrial DNA
ligase (LIG3α), cells cannot survive (Simsek et al., 2011). This is also similar for other

96
enzymes specific to mtBER, such as apurinic/apyrimidinic endonuclease 1 (APE1),
which causes apoptosis when the enzyme is lost, but when overexpressed to
mitochondria apoptosis is reduced (Hegde et al., 2012, Li et al., 2008). Only when
combining TDP1 knockdown with expression of either TOP1mt/FLAG or
TOP1mtY559A
/FLAG was any impact in cells seen. The reduction in cell number in
figure 4.10 indicates that there was reduced cell growth due to TOP1MT being bound to
mtDNA in the absence of TDP1, but interestingly this did not have any impact on the
levels of mtDNA encoded proteins or mtDNA copy number. This implies that mtDNA
integrity is still maintained and can produce mtDNA encoded proteins over a six day
period despite these lesions occurring and causing a reduction in cell growth. The
reduced cell growth with TDP1 knockdown and TOP1mt/FLAG expression was slightly
unexpected in this experiment, but it must be the case that expression of this protein
caused these lesions occur more often than initially expected in the absence of TDP1
which resulted in less cell growth. The presence of TDP1 in mitochondria in unstressed
conditions, as demonstrated in chapter 3, also supports the assumption that these lesions
occur within mitochondria under normal circumstances that requires TDP1 for repair,
and would help explain the unexpected result in this case.
The significance of these findings is that TDP1 is confirmed to be involved in mtDNA
repair, but based on this data it would be careless to assume that mtBER is dependent on
this enzyme or that it is essential for cell survival. It may have been possible to observe
reduction in the levels of mtDNA encoded proteins or mtDNA copy number if the
length of experiments had been longer, but these data do still show that TDP1 is in some
part involved in mtDNA repair. Further analysis of exact mtDNA mutation load through
deep sequencing would provide a greater depth of analysis to assess the consequences
of losing TDP1. Using DNA samples from the expression/knockdown experiments
would help to determine whether mtDNA mutation load was increased with TDP1 loss

97
as would be expected if mtBER was dependent on this enzyme (Boesch et al., 2011,
Das et al., 2010).

98
Chapter 5. Does next generation sequencing aid in discovering the
exact role of TDP1 in mtDNA repair?
5.1 Introduction
The results presented in chapters 3 and 4 suggest that TDP1 is present and active in
mitochondria, but the exact role of TDP1 in mtDNA repair remained unclear although it
is unlikely that mtBER is dependent on this enzyme as Das et al concluded (Das et al.,
2010). In order to delineate the role of TDP1 in mtDNA repair next generation
sequencing was utilised as it was anticipated this would provide insight into the exact
mutation rate in mtDNA as a result of the expression/knockdown experiments described
in chapter 4.
For this Ion TorrentTM
technology (life technologies) was used to sequence mtDNA
using DNA samples from the experiments described in chapter 4. One of the main
advantages of Ion TorrentTM
technology is the ability to perform sequencing at a
relatively low cost in comparison to traditional Sanger sequencing methods and
machines that are typically used in this line of experimentation. Although the coverage
of DNA using Ion TorrentTM
technology is not as extensive as with other Next-
Generation sequencing platforms (≤1Gb compared to ≤120Gb using SOLiDTM
technology previously used for sequencing mtDNA) it was decided that this was not an
issue for the study of the mitochondrial genome as it is relatively small and would allow
for sufficient coverage to detect significant mutation levels in mtDNA if the mutations
were present (Rothberg et al., 2011, Ameur et al., 2011, Liu et al., 2012).
The principle behind this form of sequencing technology is that pH changes can be
measured and used to determine the sequence of DNA as a result of proton release
following incorporation of nucleotides by a DNA polymerase in a growing nucleotide

99
chain. More specifically, when a nucleotide is incorporated into a nascent strand of
DNA by polymerase a single proton is released as a result of hydrolysis of the entering
dNTP. For sequencing using Ion TorrentTM
technology the DNA sample is loaded onto
a chip that is then flooded sequentially with the four dNTPs that, when incorporated into
DNA, release a proton that alters the pH in the solution surrounding that particular area.
The change in pH is then detected by the chip, converted to a voltage, and processed so
that it is recorded by the software. This allowed for the sequencing of mtDNA in a
library following a library preparation protocol that briefly consisted of an initial long-
range PCR (LR-PCR) to generate two ≈8kb regions of mtDNA that were combined,
fragmented into smaller sections, ligated to adapters, and then clonally amplified onto
beads. Once this had been complete the samples could be analysed by loading the
clonally amplified libraries on beads onto a chip that contained wells for each bead to
lie in whilst the chip was flooded with each dNTP. Figure 5.1 illustrates how flooding
of a chip with a dNTP leads to incorporation of a nucleotide into nascent DNA that is
attached to a bead (Rothberg et al., 2011).

100
Figure 5.1. Detection of an incorporated nucleotide using Ion TorrentTM
technology.
The chip is flooded with a dNTP that passes over wells and is incorporated into a
nascent strand of DNA on a bead if complementary to the parental strand. This
incorporation causes the release of a proton that is detected by the chip and recorded by
the machine to determine the sequence of the parental strand of DNA (adapted from
Rothberg et al., 2011).
It was anticipated that using this form of sequencing technology that it would be
possible to determine:
The exact role of TDP1 in mtDNA repair.
Sequencing mtDNA in this manner would be combined with analysis using NextGENe®
software (Softgenetics®) that was designed for sequencing analysis from the Ion
TorrentTM
and would provide data on the number of mtDNA mutations generated as a
result of the expression/knockdown experiments described in chapter 4.
5.2 Methods
5.2.1 mtDNA sequencing using Ion TorrentTM
In order to determine the mutation rate in mtDNA following the expression/knockdown
experiments conducted in chapter 4, it was necessary to perform deep sequencing. This
was accomplished using Ion TorrentTM
technology (life technologies) with sequencing
data being analysed using NextGENe® software (Softgenetics
®).
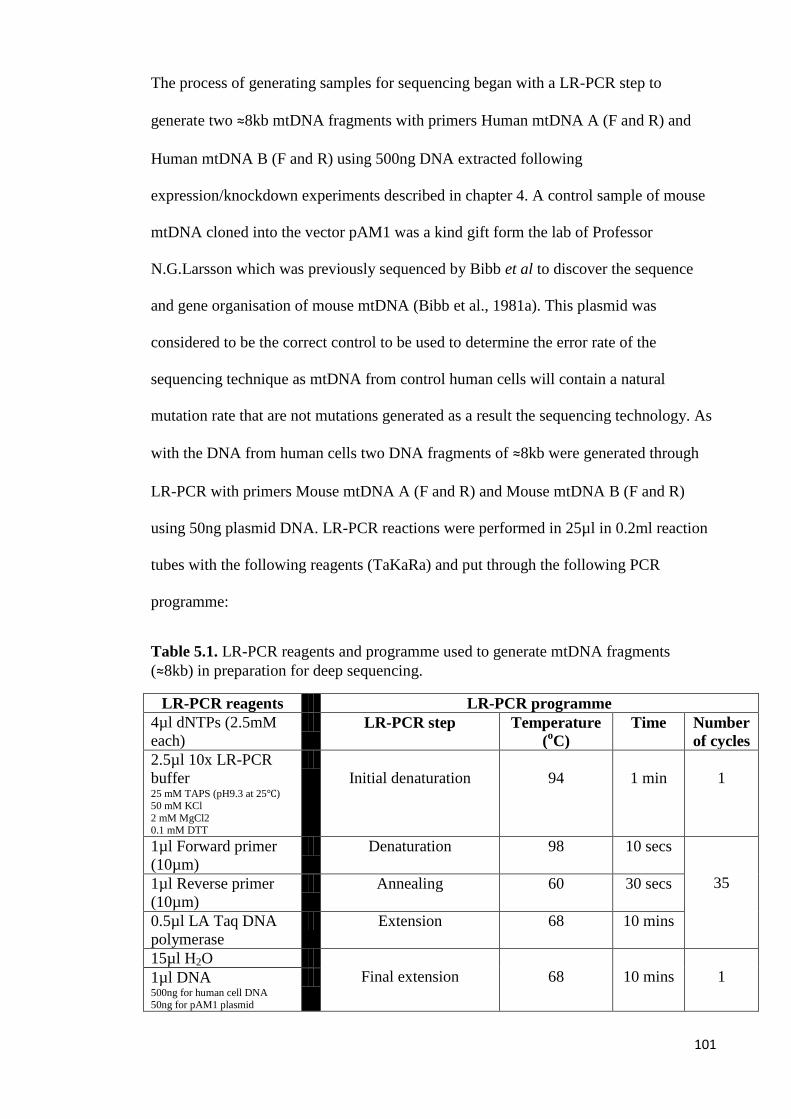
101
The process of generating samples for sequencing began with a LR-PCR step to
generate two ≈8kb mtDNA fragments with primers Human mtDNA A (F and R) and
Human mtDNA B (F and R) using 500ng DNA extracted following
expression/knockdown experiments described in chapter 4. A control sample of mouse
mtDNA cloned into the vector pAM1 was a kind gift form the lab of Professor
N.G.Larsson which was previously sequenced by Bibb et al to discover the sequence
and gene organisation of mouse mtDNA (Bibb et al., 1981a). This plasmid was
considered to be the correct control to be used to determine the error rate of the
sequencing technique as mtDNA from control human cells will contain a natural
mutation rate that are not mutations generated as a result the sequencing technology. As
with the DNA from human cells two DNA fragments of ≈8kb were generated through
LR-PCR with primers Mouse mtDNA A (F and R) and Mouse mtDNA B (F and R)
using 50ng plasmid DNA. LR-PCR reactions were performed in 25µl in 0.2ml reaction
tubes with the following reagents (TaKaRa) and put through the following PCR
programme:
Table 5.1. LR-PCR reagents and programme used to generate mtDNA fragments
(≈8kb) in preparation for deep sequencing.
LR-PCR reagents LR-PCR programme
4µl dNTPs (2.5mM
each) LR-PCR step Temperature
(oC)
Time Number
of cycles
2.5µl 10x LR-PCR
buffer 25 mM TAPS (pH9.3 at 25℃) 50 mM KCl
2 mM MgCl2 0.1 mM DTT
Initial denaturation
94
1 min
1
1µl Forward primer
(10µm) Denaturation
98 10 secs
35 1µl Reverse primer
(10µm)
Annealing
60 30 secs
0.5µl LA Taq DNA
polymerase Extension 68 10 mins
15µl H2O
Final extension
68
10 mins
1 1µl DNA 500ng for human cell DNA 50ng for pAM1 plasmid

102
Once the LR-PCR was complete samples were electrophoresed on a 1% NuSieve®
GTG® agarose gel (Lonza) for 45 mins at 70V. Following this mtDNA fragments at the
correct molecular weight (≈8kb) were excised from the gel and mtDNA was purified by
phenol/chloroform extraction as described in 2.2.4 (vi). Quantification of DNA
concentration was then determined as described in 2.2.4 (viii) and then 50ng of each
mtDNA fragment (A and B from the LR-PCR) were combined at equal molarity in 35µl
H2O in 1.5ml LoBind® reaction tubes (eppendorf).
Samples were then incubated at 37oC for 40 mins after 5µl Ion Shear
TM Plus 10x
Reaction Buffer (life technologies) had been added. Once complete samples were then
purified by firstly transferring them to 2ml LoBind® reaction tubes (eppendorf) for
better fitting with the DynaMag™-2 magnetic rack (life technologies). To purify 99µl
Agencourt® AMPure
® XP Reagent (Beckman Coulter) were added to each sample
followed by a pulse spin and incubation at room temperature for 5 mins. Samples were
then subjected to another pulse spin before being placed in the DynaMag™-2 magnetic
rack (life technologies) and incubated for 3 mins. The supernatant was then discarded
and 500µl freshly prepared 70% EtOH was added in each tube whilst still in the rack.
Samples were incubated for 30 secs and each reaction tube was turned twice in the rack
during this time. The supernatant was then discarded and this wash step was repeated.
To remove residual EtOH samples were subjected to a pulse spin and replaced in the
magnetic rack for 30 secs before any leftover EtOH was removed and samples
incubated with open lids for ≥5 mins. Once this incubation was complete 25µl Low TE
(life technologies) was added to each pellet and samples were then vortexed for 10 secs
before being subjected to a pulse spin and incubated in the magnetic rack for 1 min.
Each supernatant was then transferred to 0.2ml reaction tubes in preparation for ligation
of adapters.

103
In order for final sequencing in later stages it was necessary to ligate barcoded adapters
for identification of each sample when final analysis of the sequencing data was
required. To ligate barcoded adapters the following reactions were set up with different
barcode numbers, and subjected to the following programme:
Table 5.2. Components and programme to ligate barcoded adapters to sheared DNA.
All reagents were supplied by life technologies.
Ligation reaction component Volume Ligation programme
Sheared DNA 25µl Temperature
(oC)
Time (mins)
10x ligation buffer 10µl 25 15
Ion P1 adapter 2µl
Ion Xpress™ Barcode (x) 2µl
72
5 dNTP mix 2µl
H2O 49µl
DNA ligase 2µl
Nick Repair Polymerase 8µl
Once the ligation programme was complete reactions were transferred to 2ml LoBind®
reaction tubes (eppendorf) and 180µl AMPure® XP Reagent (Beckman Coulter) was
added before purification was carried out as described earlier. The purified DNA (now
in 20µl Low TE (life technologies)) was then used for size selection of DNA of 150bp
length as per the manufacturer’s instructions using the E-Gel® iBase™ unit and E-Gel
®
Safe Imager™ transilluminator combo kit with a 2% E-Gel® SizeSelect™ 2% Agarose
Gel.
Once DNA fragments of the correct length had been selected it was then necessary to
amplify these in preparation for sequencing. This was performed by setting up the
following amplification reaction and subjecting samples to the following PCR
programme:

104
Table 5.3. Reagents and PCR programme to amplify 150bp DNA fragments in
preparation for deep sequencing. All reagents were supplied by life technologies.
Amplification
reaction component
Volume PCR programme
Size-selected DNA 25µl Step Temperature
(oC)
Time Number
of
cycles
Library amplification
mix
5µl Denaturation 95 5 mins 1
Platinum® PCR
SuperMix High
Fidelity
100µl Denaturation
Annealing
Extension
95
58
70
15 secs
15 secs
1 min
8
Once the PCR programme was complete samples were transferred to 2ml LoBind
reaction tubes (eppendorf) and DNA was purified using 195µl AMPure® XP Reagent
(Beckman Coulter) as described earlier. Following purification the DNA was quantified
using the 2100 Bioanalyzer (Agilent Technologies) as per the manufacturer’s
instructions, and then DNA from all samples were combined to 26pM concentration to
form a combined library for the final sequencing steps. This was kindly performed by
Dr. Helen Tuppen. Briefly, the combined library was subjected to another PCR step to
enrich the samples using the Ion OneTouchTM
system (life technologies) before the
library was loaded onto the Ion Personal Genome MachineTM
(PGMTM
) sequencer (life
technologies) for sequencing analysis. Final sequencing data was then analysed using
NextGENe® software (Softgenetics
®) with insertion/deletion (INDEL) mutations
discounted from analysis as the Ion TorrentTM
is prone to generating these mutations
during sequencing.
5.3 Results
The results in chapter 4 demonstrate that cell growth was reduced as a result of
expression of both TOP1mt/FLAG and TOP1mtY559A
/FLAG with knockdown of TDP1.
However, the levels of mtDNA encoded proteins and mtDNA copy number were not

105
affected; therefore it was decided to perform deep sequencing to determine whether
there was an increase mtDNA mutation load with this treatment. As a control to
determine the error rate of the sequencing procedure mouse mtDNA was used. This had
been cloned into pAM1 and originally used to sequence the mitochondrial genome of
the house mouse (Mus musculus), and therefore the resulting data should have been
exactly the same as the reference sequence available on GenBank (accession number
J01420.1) that had been published from this paper (Bibb et al., 1981a). Using this as a
control would help to distinguish errors made as a result of the sequencing procedure,
and those resulting from a natural mtDNA mutation load that would have occurred
when the HEK293/TOP1mt/FLAG and HEK293/TOP1mtY559A
/FLAG cells were being
cultured in normal conditions. The reference sequence used for human mtDNA was
provided by Andrews et al (accession number NC 012920) (Andrews et al., 1999).
Completion of this sequencing was anticipated to aid in determining whether mtBER
was dependent on TDP1.
5.3.1 Sequence data from expression/knockdown experiments
As described in chapter 4 the expression/knockdown experiments had provided little
data on the molecular level that could help to provide information of the exact role of
TDP1 in mtDNA repair. Deep sequencing data is provided for the
expression/knockdown experiments, which to remind included expression of
TOP1mt/FLAG and TOP1mtY559A
/FLAG for six days (results shown in table 5.2),
siRNA knockdown of TDP1 in Flp-InTM
T-RexTM
HEK293 cells for six days (results
shown in table 5.3), and expression of TOP1mt/FLAG and TOP1mtY559A
/FLAG with
siRNA knockdown of TDP1 for six days (results shown in table 5.4). Insertion/deletion
(INDELs) mutations were discounted from the analysis as the Ion PGMTM
sequencer

106
(life technologies) is prone to introducing these mutations. Explanations for headings in
the tables are as follows:
Sample = DNA sample from each of the expression/knockdown experiments
Number of matched bases = Number of bases from sequencing data that were aligned to the
reference sequence
Number of unmatched bases = Number of bases that were considered mutations by the
NextGENe® software (Softgenetics)
Ratio matched bases: unmatched bases = Ratio of number of matched bases to number of
mutations detected
Reference length (bp) = Length of the reference sequence in base pairs
Number of bases covered from reference (bp) = Number of bases from the reference sequence
that were read during sequencing (slightly less for the control mouse mtDNA due to the
availability of primers that did not include any of the pAM1 vector DNA).
Table 5.4. Deep sequencing data of the control mouse mtDNA in pAM1 and human
DNA samples following expression of TOP1mt/FLAG and TOP1mtY559A
/FLAG for six
days as in chapter 4.
Sample Number of
matched
bases
Number of
unmatched
bases
(mutations)
Ratio bases
read:
unmatched
bases (x10-3
)
Reference
length (bp)
Number of
bases
covered from
reference
(bp)
Mouse mtDNA 3115820 11520 3.697261 16295 16023
WT - 4094734 24478 5.977922 16569 16569
WT + 3563289 21643 6.073883 16569 16569
MUT - 4065604 24109 5.929992 16569 16569
MUT + 3034723 20325 6.697481 16569 16569
*Sequencing was carried out as described in 5.2.1 with sample labelling’s as follows:
Mouse mtDNA = mouse mtDNA cloned into pAM1 (control)
WT - = HEK293/TOP1mt/FLAG cells without expression of TOP1mt/FLAG
WT + = HEK293/TOP1mt/FLAG cells with expression of TOP1mt/FLAG
MUT - = HEK293/TOP1mtY559A
/FLAG cells without expression of TOP1mtY559A
/FLAG
MUT + = HEK293/TOP1mtY559A
/FLAG cells with expression of TOP1mtY559A
/FLAG
Table 5.5. Deep sequencing data of human DNA samples following siRNA knockdown
of TDP1 for six days as in chapter 4.
Sample Number of
matched
bases
Number of
unmatched
bases
(mutations)
Ratio bases
read:
unmatched
bases (x10-3
)
Reference
length (bp)
Number of
bases
covered from
reference
(bp)
UT 5245914 28766 5.483506 16569 16569
NT 3964357 23429 5.909912 16569 16569
C 4713751 27560 5.846724 16569 16569
*Sequencing was carried out as described in 5.2.1 with sample labelling’s as follows:
UT = untransfected
NT = non-targeted siRNA
C = siRNA construct

107
Table 5.6. Deep sequencing data of human DNA samples following siRNA knockdown
of TDP1 and expression of TOP1mt/FLAG and TOP1mtY559A
/FLAG for six days as in
chapter 4.
Sample Number of
matched
bases
Number of
unmatched
bases
(mutations)
Ratio bases
read:
unmatched
bases (x10-3
)
Reference
length (bp)
Number of
bases
covered from
reference
(bp)
WT-UT 4572540 25401 5.555118 16569 16569
WT-NT 5145911 30055 5.84056 16569 16569
WT-C 6623268 34649 5.231405 16569 16569
MUT-UT 5209559 29125 5.590684 16569 16569
MUT-NT 4753097 25922 5.453707 16569 16569
MUT-C 4798886 26657 5.554831 16569 16569
*Sequencing was carried out as described in 5.2.1 with sample labelling’s as follows:
WT-UT = Expression of TOP1mt/FLAG without any siRNA transfection
WT-NT = Expression of TOP1mt/FLAG with transfection using non-targeted siRNA
WT-C = Expression of TOP1mt/FLAG siRNA with transfection using construct C
MUT-UT = Expression of TOP1mtY559A
/FLAG without any siRNA transfection
MUT-NT = Expression of TOP1mtY559A
/FLAG with transfection using non-targeted siRNA
MUT-C = Expression of TOP1mtY559A
/FLAG with transfection using siRNA construct C
The data in tables 5.4, 5.5, and 5.6 do not appear to indicate a higher mutation load with
any of the treatments in the cell lines used for these experiments as described earlier.
Even in cells that displayed reduced cell growth with knockdown of TDP1 and
expression of TOP1mt/FLAG and TOP1mtY559A
/FLAG for six days there was no
indication of a significant increase in mtDNA mutation load in comparison to controls.
One observation to note in table 5.4 is that the overall mutation ratio (ratio bases read:
unmatched bases) is lower for the control mouse mtDNA than the controls from the
human cell lines when compared to the reference sequence. Although there is a
difference in the levels of mutations between the control mouse mtDNA and the other
samples the difference is not so high and raises questions as to the sensitivity of using
this sequencing technology for our purposes, which is reviewed in the discussion of this
chapter.
108
5.4 Discussion and conclusions
The data outlined in this chapter does not appear to show an increased mtDNA mutation
load with the expression/knockdown experiments described in chapter 4. This
information has aided in the attempt to determine:
The exact role of TDP1 in mtDNA repair.
Although the data indicates that there are no significant changes in mtDNA mutation
load from cells that had shown decreased growth with knockdown of TDP1 and
expression of TOP1mt it is possible to make assertions as to the exact function of this
enzyme in mtDNA repair. However, a critical discussion of the techniques used to
assess mtDNA mutation load must first be carried out before any definitive conclusions
about the role of TDP1 in mtDNA repair will be made.
Next generation sequencing to assess de novo mtDNA mutations
The decision to use next generation sequencing to assess mtDNA mutations was taken
as the experiments in chapter 4 suggested a negative impact on cell growth with TDP1
knockdown and expression of TOP1mt, but western blot analysis and qRT-PCR did not
suggest a severe impact in these cells with this treatment. It was anticipated that using
Ion TorrentTM
technology (life technologies) would provide a more sensitive
mechanism to determine the exact effect of this treatment as increased mtDNA mutation
load would potentially be detected. However, before samples could be sequenced they
firstly underwent a preparation phase. This began with a LR-PCR step to amplify two
≈8kb regions so that full coverage of the mitochondrial genome was achieved. There
were two additional PCR steps in this protocol when fragmented DNA with ligated
adapters is amplified, and when these products are then clonally amplified onto beads
before being loaded onto a chip for sequencing. These PCR steps all have the potential
109
to introduce mutations into DNA that may then be recorded as mutations that had
occurred due to knockdown of TDP1 and expression of TOP1mt/FLAG
TOP1mtY559A
/FLAG. Despite this all samples were treated with the same library
preparation protocol and so any mutations arising from this preparation would have
occurred in a similar amount in all samples and would have been taken into account in
the analysis of final mutation numbers.
Ultra-deep sequencing of the mtDNA mutator mouse using the SOLiDTM
sequencing
platform (life technologies) indicated that there were significant increases in mtDNA
mutations in the homozygous PolgAmut
/PolgAmut
in comparison to heterozygous and
wild type controls (a total of 10 samples were loaded onto the chip for sequencing in
this instance) (Ameur et al., 2011). Although this may have been expected for the
homozygous mutant, the heterozygous mice also displayed a higher ratio of mutations
despite being phenotypically similar to wild type mice (Ameur et al., 2011, Trifunovic
et al., 2004). This suggests that even under circumstances where a strong phenotype is
not seen mutation levels are increased and detectable using deep sequencing technology
(Ameur et al., 2011). This relates to our own studies as the deep sequencing of mtDNA
from cells that showed a decreased growth rate would surely have produced detectable
levels of mtDNA mutations using Ion TorrentTM
technology. However, this was not the
case and there did not appear to be any notable differences in mutation levels in mtDNA
from the cells used in the expression/knockdown experiments. It could be argued that
the error rate generated from the library preparation and sequencing using the Ion
TorrentTM
was too high to detect any mutations arising in mtDNA as a result of TDP1
knockdown and expression of TOP1mt/FLAG and TOP1mtY559A
/FLAG. Although the
mutation rate is lower in the control mtDNA (≈3.7x10⁻³
) than in the samples from
expression/knockdown experiments (≈5.2-6.7-3
) these differences are not significant

110
enough to suggest that they are a result of a natural mutation rate occurring in the cells
as part of culturing; a frequency that is argued to be between 1x10⁻⁴
and 1x10⁻⁹
(Larsson, 2010, Vermulst et al., 2007, Vermulst et al., 2008). This suggests that Ion
TorrentTM
technology and/or the NextGENe® may not be capable of detecting high
levels of random mtDNA mutations that may have occurred as a result of the
expression/knockdown experiments. Mutations in the PolgAmut
/PolgAmut
mutator mouse
were reported to be ≈1.1-1.3x10⁻³
using SOLiDTM
sequencing platform, mentioned
earlier, which adds to the argument that the Ion TorrentTM
was not sensitive enough for
our purposes (Ameur et al., 2011). These mice accumulate a greater number of mtDNA
mutations due to their proof-reading deficient form of PolgA (Trifunovic et al., 2004).
In our experiments even the control mtDNA sample had a mutation rate higher than that
of the mutator mouse suggesting a very high error rate of the Ion TorrentTM
sequencing
platform (Ameur et al., 2011). Despite this, the data provided in previous chapters offers
the potential for further discussion of the role of TDP1 in mtDNA repair.
Although the data presented in this chapter does not provide any conclusive data the
results in chapter 4 suggest it would be fair to conclude that mtBER is not dependent on
TDP1 as Das et al (Das et al., 2010) suggested for the following reasons:
Tdp1 -/- mice did not show signs of mtDNA damage despite various treatments
to induce this.
There were no signs of severe mtDNA damage with knockdown of TDP1 in
human cells.
There are a wide variety of DNA lesions that can occur within the mitochondrial
genome that TDP1 is not capable of repairing (e.g. 5’ adenine monophosphate
repaired by APTX).
Therefore, what role does TDP1 have in mtDNA repair? The observation in chapter 4
that there was no decrease in mtDNA copy number or levels of mtDNA encoded

111
proteins with TDP1 knockdown and expression of TOP1mt/FLAG and
TOP1mtY559A
/FLAG may suggest that either TDP1 is not involved in mtDNA to a great
degree or that there are mechanisms present that can compensate for this loss. The
reduction in cell growth with TDP1 knockdown and expression of TOP1mt/FLAG and
TOP1mtY559A
/FLAG would imply that there is some negative impact in mitochondria in
these cells such as reduced levels of mitochondrial mRNA transcripts that could then
affect ATP production from OXPHOS resulting in reduced cell growth. Another
possibility could be that this treatment stalled mtDNA replication that then affected cell
growth also, but which was not accompanied by mtDNA depletion in 6 days of this
treatment as our results demonstrated in chapter 4. However, these theories are purely
speculative at this point and it is necessary to discuss further how this treatment may
have been detrimental in cells on the molecular level and whether there are other means
of repairing any damage caused by this treatment.
The first inference that other repair mechanisms existed to compensate for the loss of
TDP1 was made in S. cerevisiae where RAD1 and MUS81 were able to repair DNA-
TOP1 lesions in the nucleus in the absence of TDP1 (Liu et al., 2002). It was proposed
that these enzymes excised a section of DNA surrounding the CPT generated DNA-
TOP1 lesion, which acted as a compensatory mechanism for repairing this type of
damage without the preferred TDP1 (Liu et al., 2002). Another study that involved our
collaborators identified tyrosyl-DNA-phosphodiesterase 2 (TDP2) to be involved in
repairing DNA-TOP1 lesions in the absence of TDP1 (Zeng et al., 2012). Despite the
main function of TDP2 being repair of lesions involving double strand breaks where
topoisomerase 2 (TOP2) is covalently bound to the 5’ end of DNA at this lesion it can
still function to repair TOP1 mediated damage (Cortes Ledesma et al., 2009, Zeng et al.,
2012). The data presented in this thesis suggests that there is some detrimental impact
with loss of TDP1 and expression of TOP1mt/FLAG or TOP1mtY559A
/FLAG shown by

112
a reduction in cell growth. However, mtDNA depletion and a reduction in the levels of
mtDNA encoded proteins may have been prevented with compensatory repair of these
lesions by TDP2. Although TOP2 and TDP2 have yet to be identified in mitochondria
this evidence demonstrates that there are alternative mechanisms that could exist to
repair mtDNA-TOPMT lesions when TDP1 is not present. This could explain why the
impact of losing TDP1 in mice and in human cells is not so severe on the molecular
level as claimed previously (Das et al., 2010).
This leads to the conclusion that mtBER is not dependent on TDP1 as proposed by Das
et al using H2O2 treatment and a questionable semi-quantitative PCR based assay, and
that this enzyme is predominantly responsible in repairing lesions involving TOP1MT
bound to mtDNA in mitochondria (Das et al., 2010). The potential for this enzyme to be
involved in other repair pathways as with TDP2 cannot be determined based on the data
presented in this thesis, but it can be concluded that TDP1 is not essential for mtDNA
repair based on our observations. Although TDP1 may not be essential to mtDNA repair
it may be possible that the DNA repair machinery in mitochondria is more intricate than
we think. This then leads us to ask whether there are more proteins involved in DNA
repair in mitochondria, and what associations do current proteins involved in this
subject have with each other and how are these associations mediated? The latter
question is reviewed in the next chapter with reference to TDP1 and the mitochondrial
DNA ligase.

113
Chapter 6. Does phosphorylation of amino acid 81 in TDP1 promote
association with mitochondrial DNA ligase IIIα?
6.1 Introduction
The data previously described within this thesis has identified TDP1 as a novel DNA
repair enzyme in mitochondria. Whilst investigating the exact role of TDP1 in mtDNA
repair it was also decided to explore some other factors that may influence TDP1
function in mitochondria, and/or provide a greater comprehension of how the mtDNA
repair network operates to protect against mtDNA damage. More specifically, the
association between TDP1 and another protein involved in mtDNA repair, namely DNA
ligase IIIα (LIG3α), would be scrutinised to determine whether these two proteins have
a direct link with each other in mitochondria, and if so the exact mechanism that
facilitates their association.
Our collaborators reported that the association between TDP1 and LIG3α in the nucleus
was mediated by phosphorylation of amino acid 81 in TDP1 using both yeast
(Saccharomyces cerevisiae) and MEFs. Phosphorylation of this amino acid (serine,
S81) was shown to promote the association between TDP1 and LIG3α in A549 cells by
using expression of a mutant form of TDP1 with a change in amino acid 81 from serine
to alanine. This change prevented phosphorylation at this site, which inhibited the
interaction between TDP1 and LIG3α. This inhibition of interaction between the two
proteins reduces the stability of TDP1 which could be as a result of either a
conformational change in TDP1 that affects its tertiary structure rendering it unstable, or
more simply, a need for LIG3α association for stability and function. Subsequently cell
survival was reduced when DNA-TOP1 lesions were induced using camptothecin

114
(CPT), which suggests the interaction of TDP1 with LIG3α is important to repair of
these specific lesions in the nucleus. This data provides an intriguing example of the
intricacies underlying post-translational modifications in relation to DNA repair in the
nucleus, and based on this it was decided to try and find whether a similar association
existed in mitochondria (Chiang et al., 2010).
In consideration of this and given that TDP1 had been identified in having a role in
mtDNA repair, this strand of the project was set about to determine whether:
Phosphorylation of amino acid 81 in TDP1 promotes the association with
mitochondrial DNA ligase IIIα.
This was accomplished by using protein complex immunoprecipitation (Co-IP) with
two mitochondrially targeted variants of TDP1; a phosphomimetic version
(mtTDP1S81E
/FLAG) and a non-phosphorylatable form (mtTDP1S81A
/FLAG). If this
association was found it would open many possibilities as to the depth of the mtDNA
repair network in terms of post-translational modifications and protein-protein
interactions.
6.2 Methods
6.2.1 Detecting expression of mtTDP1S81E
/FLAG and mtTDP1S81A
/FLAG
Once stable transformation of Flp-InTM
T-RexTM
HEK293 cells with both
HEK293/mtTDP1S81E
/FLAG and HEK293/mtTDP1S81A
/FLAG had been completed (as
described in 2.2.2 (vii) it was necessary to determine whether clones for each cell line

115
that resisted the antibiotics blasticidin S and hygromycin B expressed either
mtTDP1S81E
/FLAG or mtTDP1S81A
/FLAG upon induction. This was carried out by
seeding 5x10⁵ cells for each cell line in 2ml supplemented DMEM in 2 wells of a 6-well
plate for each clone. Tetracycline was then added at 1µg/ml final concentration in 1 well
for each clone and all cells were incubated as described in 2.2.2 (i) for 18 hours before
being harvested with 0.5ml PBS/1mM EDTA, neutralised in 0.5ml supplemented
DMEM, and centrifuged for 4 mins at 200xg. Cytoplasmic protein was then isolated as
described in 2.2.3 (i) to allow analysis by SDS-PAGE as in 2.2.3 (vii) and western
blotting as in 2.2.3 (viii) to determine which clones for each cell line expressed their
respective protein.
6.2.2 Protein complex immunoprecipitation (Co-IP) using of mtTDP1S81E
/FLAG and
mtTDP1S81A
/FLAG
To assess the association between the mitochondrial DNA ligase (LIG3α) and TDP1 a
Co-IP was carried out following expression of a phosphomimetic form of TDP1
(mtTDP1S81E
/FLAG) and a non-phosphorylatable form (mtTDP1S81A
/FLAG), as well as
a control for the Flp-InTM
T-RexTM
expression system (life technologies); a
mitochondrially targeted FLAG-tagged luciferase (mtLUC/FLAG). This mtLUC/FLAG
should not associate with LIG3α and would act as a control by helping to rule out any
artefacts that may have been observed when using this Flp-InTM
T-RexTM
expression
system in HEK293 cells. The resulting samples would then analysed by mass
spectrometry to determine whether phosphorylation of amino acid 81 of TDP1 was
responsible for its association with LIG3α in the mitochondrion similar to that observed
in the nucleus (Chiang et al., 2010).

116
The cell lines HEK293/mtLUC/FLAG, HEK293/mtTDP1S81E
/FLAG, and
HEK293/mtTDP1S81A
/FLAG were grown in 3x 300cm2 flasks each with 50ml
supplemented DMEM. Expression of each protein was induced with addition of 1µg/ml
tetracycline and cells were incubated as described in 2.2.2 (i) for 48 hours. Cells were
harvested using 20ml PBS/1mM EDTA and neutralised in 20ml supplemented DMEM
before being centrifuged at 200xg for 4 mins followed by mitochondrial isolation and
purified as in 2.2.3 (ii) and 2.2.3 (iv), respectively. Mitochondrial protein was quantified
by Bradford analysis and up to 5mg mitochondrial protein from each cell line was
resuspended in 500µl lysis buffer in separate 1.5ml reaction tubes. Each sample was
incubated at 4oC while being rotated for 30 mins before samples were centrifuged at
12000xg for 10 mins at 4oC. The supernatant from each sample was then transferred to
new 1.5ml reaction tubes and protein quantified by Bradford analysis as in 2.2.3 (vi).
Then up to 3mg of each sample was transferred to separate 1.5ml hydrophobic reaction
tubes with 40µl ANTI-FLAG M2 affinity gel that had already been washed 3x in 1x
washing buffer, and samples were then incubated with rotation at 4oC for 3 hours. Each
sample was then centrifuged at 5000xg for 30 secs before the supernatant was removed
and discarded. Each sample was washed 3x using 1ml 1x washing buffer and
centrifuging at 5000xg for 30 secs for each wash. Once the supernatant had been
discarded following the final wash step 5µl of 3xFLAG peptide (5µg/µl) was added
with 100µl 1x washing buffer and added to the ANTI-FLAG M2 affinity gel now
encompassing bound protein from each sample. Samples were then incubated at 4oC for
45 mins with rotation. Once incubation was complete the supernatant from each sample
was carefully removed and transferred to fresh 1.5ml reaction tubes for analysis of
protein associations by silver staining and mass-spectrometry. The beads were also
retained for further analysis by silver staining.

117
Lysis buffer 10x washing buffer
50mM Tris HCl, pH 7.4, 0.5M Tris HCl, pH 7.4
150mM NaCl 1.5M NaCl
1mM EDTA 10mM MgCl2
10mM MgCl2 1mM PMSF
1mM PMSF 10U SUPERase•In™ (life
technologies)
60U SUPERase•In™ (life technologies) 1 protease inhibitor tablet* (Roche)
1% Triton X-100
*Added at the time of dilution of 1ml 10x washing buffer with 9ml DEPC treated H2O
6.2.3 Silver staining
Silver staining was carried out in order to confirm presence of mtLUC/FLAG,
mtTDP1S81E
/FLAG, and mtTDP1S81A
/FLAG following Co-IP and to provide some
preliminary data as to the association of TDP1 with LIG3 and/or any other proteins in
the mitochondrion. This was performed by first mixing 5µl of each elution sample with
5µl 2x dissociation buffer, and 2µl each beads sample with 2µl 2x dissociation buffer.
Each sample was then denatured at 95oC for 3 mins before being run on a 10% SDS-
PAGE as described in 2.2.3 (vii). Once molecular weight marker 40kDa subunit had
reached the bottom of the gel the gel was carefully removed and washed for 1 hour in
50% NaOH. Both TDP1 (≈70kDa) and LIG3α (≈113kDa) should still be in the gel at
this point so any association should be seen, and any other proteins would be identified
on mass-spec analysis. During this time the silver stain was prepared. After 1 hour the
50% NaOH was discarded and the gel was stained with the silver stain solution with
rocking for 15mins. The silver stain was then discarded and the gel was washed 3x for 5
mins in H2O before being developed with 50ml developer solution with agitation until
protein bands could be seen (≈ 3 mins). The gel was then fixed in fixing solution
overnight before being washed for 10 mins in 30% EtOH followed by washing for 10
mins in H2O and an image taken.

118
2x dissociation buffer Silver stain (100ml) Developer solution
(200ml)
0.125M tris-HCl, pH 6.8 21ml 0.36% NaOH 1ml 1% citric acid
4% SDS 1.4ml NH4OH 300µl 37% formaldehyde
0.15M DTT 77.6ml H2O 198.7ml H2O
15% glycerol 0.8g AgNO3 in 4ml H2O*
0.01% bromophenol blue
0.01% benzonase
*Added last in a drop by drop manner with agitation until liquid becomes slightly darker
6.2.4 Preparation of samples for mass-spectrometry analysis
In order for Co-IP samples to be analysed by mass-spectrometry the samples needed to
be prepared by SDS-PAGE. For this 80µl of each sample from the Co-IPs of
mtLUC/FLAG, mtTDP1S81E
/FLAG and mtTDP1S81A
/FLAG as described in 6.2.2 were
mixed with 20µl 4x dissociation buffer. Each sample was denatured at 95oC for 3 mins
and samples were separated on a 12% SDS-PAGE as described in 2.2.3 (vii) at 60V
until ≈1cm into the resolving gel. The gel was then removed and each lane for each
sample was cut out and transferred to separate 1.5ml reaction tubes before 1ml
acetonitrile was added in each tube and incubated for 30 mins at room temperature. The
acetonitrile was removed and a small hole was created in the lid of each reaction tube
before the lid was closed and samples incubated overnight at room temperature to allow
the acetonitrile to evaporate. Each sample was then sent for mass-spectrometry analysis
at:
Nijmegen Proteomics Facility/Nijmegen Centre for Mitochondrial Disorders
Department of Laboratory Medicine
Radboud University Nijmegen Medical Centre
4X Dissociation buffer
0.25M tris-HCl, pH 6.8
8% SDS
0.3M DTT
30% glycerol
0.02% bromophenol blue
0.01% benzonase

119
6.3 Results
6.3.1 Expression mtTDP1S81E
/FLAG and mtTDP1S81A
/FLAG following stable
transfection
Following stable transfection of mtTDP1S81E
/FLAG and mtTDP1S81A
/FLAG into Flp-
InTM
T-RexTM
HEK293 cells as described in 2.2.2 (vii) and the expression experiments
as in 6.2.1 had been completed, it was necessary to confirm that both
mtTDP1S81E
/FLAG and mtTDP1S81A
/FLAG were being expressed in their cell lines.
Figure 6.1 illustrates the results from expression of each protein.
A
B
Figure 6.1. Analysis of mtTDP1
S81E/FLAG and mtTDP1
S81A/FLAG expression. Western
blot analysis as described 2.2.3 (viii) using 20µg cytoplasmic protein isolated as
described in 2.2.3 (i) to determine expression of desired protein following stable
transfection of Flp-InTM
T-RexTM
HEK293 cells as described in 2.2.2 (vii). Expression
of each protein was induced with addition of 1µg/ml (final concentration) tetracycline
from 5x10⁵ cells in 2ml supplemented DMEM in 6-well plates, followed by incubation
for 18 hours in conditions outlined in 2.2.2 (i). A separate well containing 5x10⁵ cells
for each clone in 2ml supplemented DMEM was left without tetracycline as controls
(A) Analysis of 3 clones following transfection of mtTDP1S81E
/FLAG. (B) Analysis of 4
clones following transfection of mtTDP1S81A
/FLAG.
The results in figure 6.1 show that both mtTDP1S81E
/FLAG and mtTDP1S81A
/FLAG
were successfully expressed in each of the clones that had survived treatment with the
antibiotics blasticidin S and hygromycin B. In A expression of mtTDP1S81E
/FLAG can
be seen in three different clones of HEK293/mtTDP1S81E
/FLAG in lanes 2, 4, and 6

120
whereas the uninduced samples in lanes 1, 3, and 5 show no expression. Similarly in B
successful expression of mtTDP1S81A
/FLAG can be seen from four different clones of
HEK293/mtTDP1S81A
/FLAG in lanes 2, 4, 6, and 8 whereas in induced samples there is
no expression seen in lanes 1, 3, 5, or 7. Equal loading of the western blot was proven
using the α-porin antibody. For further experiments clone A for both
HEK293/mtTDP1S81E
/FLAG and HEK293/mtTDP1S81A
/FLAG would be used as they
appeared to show the strongest signal on western blotting, which at the time was
thought to be the best criterion for selection.
6.3.2 Mitochondrial localisation of mtTDP1S81E
/FLAG and mtTDP1S81A
/FLAG
In order to confirm that mtTDP1S81E
/FLAG and mtTDP1S81A
/FLAG were localised to
mitochondria upon expression in respective clones A a Proteinase K (life technologies)
protection assay was performed. This assay, described in 2.2.3 (v), had already been
used to show localisation of TOP1mt/FLAG and TOP1mtY559A
/FLAG to mitochondria
in chapter 4 (figure 4.6) and so this procedure had been optimised from earlier
experiments; i.e. 2µg Proteinase K (life technologies) was required to show protection
of internalised protein. Figure 6.2 demonstrates this result.

121
A
B
Figure 6.2. Analysis of mtTDP1
S81E/FLAG and mtTDP1
S81A/FLAG mitochondrial
localisation. Western blot analysis as described 2.2.3 (viii) using 10µg mitochondrial
protein isolated as described in 2.2.3 (iii) to determine mitochondrial localisation of
both mtTDP1S81E
/FLAG and mtTDP1S81A
/FLAG following stable transfection of Flp-
InTM
T-RexTM
HEK293 cells as described in 2.2.2 (vii). Expression of each protein was
induced in each cell line with addition of 1µg/ml (final concentration) tetracycline
followed by incubation for 18 hours in conditions outlined in 2.2.2 (i). Localisation of
both proteins was assessed by addition of 2µg Proteinase K (life technologies) with or
without Triton X-100 as described in 2.2.3 (v) and optimised from chapter 4 (figure 4.6)
(A) Analysis of mtTDP1S81E
/FLAG clone A (B) Analysis of mtTDP1S81A
/FLAG clone
A.
The results presented here show that with 2µg Proteinase K (life technologies) in the
presence on Triton X-100 was sufficient to degrade each expressed protein (lane 3 in
both A and B). Lane 2 of A and B illustrates that both mtTDP1S81E
/FLAG and
mtTDP1S81A
/FLAG were protected by the outer mitochondrial membrane despite
addition of 2µg Proteinase K (life technologies), similar to the untreated control in lane
1 of A and B. This suggests that mtTDP1S81E
/FLAG and mtTDP1S81A
/FLAG are in fact
imported to mitochondria in their respective cell lines.
6.3.3 Co-IP using FLAG-tagged expressers
Once the Co-IP of mtLUC/FLAG, mtTDP1S81E
/FLAG, and mtTDP1S81A
/FLAG was
complete as described in 6.2.2, analysis of the binding affinities of each protein could

122
then be assessed. This was carried out to determine whether phosphorylation of amino
acid residue 81 in TDP1 is responsible for its association with LIG3α in mitochondria,
providing this association exists. Two methods for assessing this association were
performed and the results from these are outlined as follows.
i) Silver staining
This was carried out in order to verify that each of the proteins mtLUC/FLAG,
mtTDP1S81E
/FLAG, and mtTDP1S81A
/FLAG were expressed and present following the
Co-IP, but in the main to provide preliminary data as to whether LIG3α was associated
with any of these proteins. Results from silver staining as outlined in 6.2.3 are shown in
figure 6.3.
Figure 6.3. Silver staining analysis to detect protein associations of mtTDP1
S81E/FLAG
and mtTDP1S81A
/FLAG. Silver staining as described in 6.2.3 following Co-IP as
described in 6.2.2 to detect expression of mtLUC/FLAG, mtTDP1S81E
/FLAG, and
mtTDP1S81A
/FLAG with associated proteins from beads (B) and elution (E) from the
Co-IP. Of each sample 10µl was separated by SDS-PAGE as described in 2.2.3 (vii)
before silver staining was carried out. Lane 1 (also L) represents the molecular weight
marker used for the gel.
The image produced from silver staining showed that mtLUC/FLAG,
mtTDP1S81E
/FLAG, and mtTDP1S81A
/FLAG were present following the Co-IP by strong

123
bands being present at a the correct molecular weight for each protein (≈70kDa, lanes 2-
7), but that there was no obvious presence of LIG3α (expected size ≈113kDa).
ii) Mass spectrometry data
Following the data provided in figure 6.3 that shows no obvious sign that a protein of
the molecular weight of LIG3α (≈113kDa) was present, samples were prepared as
described in 6.2.4 and sent for mass-spectrometry analysis. Table 6.1 lists the proteins
that were associated with mtTDP1S81E
/FLAG from the Co-IP that were different to the
proteins associated with the control mtLUC/FLAG. Table 6.2 lists the proteins
associated with mtTDP1S81A
/FLAG that were different to the control also.
Table 6.1. Mass spectrometry data of proteins identified following Co-IP (described in
6.2.2) after expression of the phosphomimetic mtTDP1S81E
/FLAG.
Protein GI Protein Gene emPAI
83715985 3-hydroxyacyl-CoA dehydrogenase type-2 isoform 2
HSD17B10
0.318256739
32483377
thioredoxin-dependent peroxide reductase, mitochondrial isoform b
PRDX3
0.258925412
4504897 importin subunit alpha-2 KPNA2 0.637893707
4507231
single-stranded DNA-binding protein, mitochondrial precursor SSBP1
0.165914401
*The proteins identified are those that were found to be different to those from the control expression and
Co-IP using mtLUC/FLAG. For full table including those for mtLUC/FLAG see appendix.

124
Table 6.2. Mass spectrometry data of proteins identified following Co-IP (described in
6.2.2) after expression of the phosphomimetic mtTDP1S81A
/FLAG.
Protein GI Protein Gene emPAI
83715985
3-hydroxyacyl-CoA dehydrogenase type-2 isoform 2
HSD17B10
0.737800829
91199540
dihydrolipoyl dehydrogenase, mitochondrial precursor
DLD
0.333521432
32483377
thioredoxin-dependent peroxide reductase, mitochondrial isoform b
PRDX3
0.258925412
4504897 importin subunit alpha-2 KPNA2 0.245197085
15277342 estradiol 17-beta-dehydrogenase 8 HSD17B8
0.232846739
8923421
seryl-tRNA synthetase, mitochondrial isoform b precursor SARS2
0.193776642
188528628
Polyribonucleotide nucleotidyltransferase 1, mitochondrial precursor
PNPT1
0.14504757
81295407
acyl-coenzyme A thioesterase 9, mitochondrial isoform a precursor
ACOT9
0.113042193
193082993
tRNA modification GTPase GTPBP3, mitochondrial isoform III
GTPBP3
0.068000433
4503943
glutaryl-CoA dehydrogenase, mitochondrial isoform a precursor
GCDH
0.064209244
*The proteins characterised in this table are those that were found to be different to those from expression
of mtLUC/FLAG as a control. For full table including those for mtLUC/FLAG see appendix.
The data in table 6.2 demonstrates that there is no association between
mtTDP1S81A
/FLAG and LIG3α; however this is also the case for mtTDP1S81E
/FLAG
which can be seen in table 6.1. Full data including all associated proteins from the Co-
IP of mtLUC/FLAG, mtTDP1S81E
/FLAG, and mtTDP1S81A
/FLAG can be seen in the
appendix, but this also confirms that LIG3α is not associated with mtLUC/FLAG and
subsequently does not explain the absence of LIG3α from either table 6.1 or 6.2. This
data suggests that phosphorylation of amino acid 81 of TDP1does not affect its
association with LIG3α in the mitochondrion, and also raises the possibility that these
two proteins are not directly associated in mitochondria as is discussed in 6.4.

125
6.4 Discussion and conclusions
The data presented in this chapter was performed in order to try and determine whether
the association of TDP1 and LIG3α was present in mitochondria, and if so whether:
Phosphorylation of amino acid 81 in TDP1 promotes the association with LIG3α
Although the data provided here does not demonstrate that there is an association
between TDP1 and LIG3α, it is still relevant to discuss the details underlying this kind
of association in mitochondria, some of the potential reasons for our own observations,
and consideration of some future perspectives regarding our results.
Phosphorylation in mitochondria
Phosphorylation of proteins is one form of post-translational modification that can
affect the activity of enzymes in a regulatory manner, with other examples including
modifications that incorporate nitric oxide (nitrosylation) and/or introduce acetyl groups
(acetylation) into proteins to alter their function (O'Rourke et al., 2011). These examples
are just a small group of a huge collection of post-translation modifications that have
been reported to modify the function of an enzyme in regulated cellular processes, and
conversely, as for oxidative damage, affect the ability of enzymes to fulfil their
requirements (O'Rourke et al., 2011). Although post-translation modifications have a
wide variety of purposes in cells it is important to discuss how these modifications
impact on DNA repair to remain focussed on the theme of this thesis.

126
Phosphorylation of proteins by kinases is a relatively undefined in mitochondria when
compared with the knowledge accrued for nuclear kinases and their role in DNA repair.
Therefore, findings of nuclear mechanisms for DNA damage responses provided a basis
for the experiments outlined in this chapter of my thesis (Chiang et al., 2010, Shiloh,
2006). As discussed earlier, our collaborators previously reported that phosphorylation
of TDP1 at serine 81 mediated its association with LIG3α in the nucleus; thus
demonstrating that factors other than the actual enzyme activity of TDP1 affected the
DNA damage response (Chiang et al., 2010). This discovery resulted from previous
reports that the checkpoint kinases Ataxia Telangiectasia-mutated (ATM) and ATM-
Rad3-related (ATR) that phosphorylate proteins at serine-threonine-glutamine (S/TQ)
sites, phosphorylate TDP1, and that TDP1 contains five S/TQ sites also (Zhou et al.,
2005, Mu et al., 2007). There has recently been 77 phosphoproteins identified in
mitochondria from human skeletal muscle by mass spectrometry, and ATM was also
shown to have a role in phosphorylation of some of these (Zhao et al., 2011, O'Rourke
et al., 2011). Although TDP1 was not included in these findings the method for
interpreting mitochondrial and non-mitochondrial proteins was based on the known
mitochondrial proteins at the time of the publication (Zhao et al., 2011). At that time
TDP1 had not been reported to be present in mitochondria and would not have been
considered in the investigations of this group (Zhao et al., 2011). Therefore, our own
aim to study the interaction between TDP1 and LIG3α was valid as work is on-going to
identify more mitochondrial proteins that have various functions in the organelle.

127
Phosphorylation of amino acid 81 in TDP1 did not promote the association with
LIG3α
The data presented in table 6.1 demonstrates that despite the phosphomimetic amino
acid at position 81 in TDP1, there is no observable association with LIG3α using this
system. With this in mind the potential reasons for this result will be explored to try and
determine whether there is no association between TDP1 and LIG3α in the
mitochondrion, or whether the system and methods used to detect this association were
not adequate for this purpose.
The majority of support for conducting the experiments outlined in this chapter came
from published work performed by our collaborators. However, in this publication the
phosphomimetic TDP1S81E
form of TDP1 was not used to demonstrate that LIG3α still
associated with this enzyme containing this amino acid substitution (Chiang et al.,
2010). This amino acid substitution to glutamic acid mimics the structure of
phosphorylated serine and should form normal associations with other proteins similar
to the wild type. But with our collaborators not using this form of TDP1 in their work
the question was raised as to whether the association with LIG3α was ever likely to
occur in mitochondria with the change in amino acid 81. Although the phosphomimetic
form of TDP1 was not used in our collaborators study, previous work using this tool to
assess phosphorylation has been carried out with success which would suggest that it
was an acceptable method for our own purposes (Farah et al., 2012, Pepio and Sossin,
2001).
Another possibility in failing to detect the association between TDP1 and LIG3α in this
case may have been the expression system used for the experiments, namely the Flp-

128
InTM
T-RexTM
system. Expressing a mitochondrially targeted form of TDP1 in HEK239
cells using this system is not exactly equivalent to the levels of expression normally
observed in vivo, which may have caused disruption of the protein complexes in
mitochondria in these experiments. However, this strategy of expression in HEK293
cells has been employed in our lab with great success when expression of protein using
this system matched that of the endogenous levels of the protein that was being studied
(Richter et al., 2010, Rorbach et al., 2008, Temperley et al., 2010). When the
experiments outlined in this thesis were carried out this was not taken into consideration
when expressing TDP1 in these cells which may have saturated binding with LIG3α,
thus accounting for the absence of any detectable association. Another point for
consideration is that the constructs used to transform wild type Flp-InTM
T-RexTM
HEK293 cells contained the Su9 presequence from N. crassa, which would likely alter
the mode of transport into mitochondria than that of the TDP1 proteins without this
presequence. This may have affected the association with LIG3α, but given that
mtTDP1S81E
/FLAG and mtTDP1S81A
/FLAG were both successfully localised to
mitochondria and were detected at the correct molecular weight (i.e. without the
mitochondrial presequence that would add ≈7kDa) it is unlikely that this would have
affected any potential affinity of these proteins with LIG3α once in the mitochondrion.
Also, the exact mechanism of TDP1 entry into mitochondria is currently unknown and
so transforming HEK293 cells with FLAG-tagged forms of TDP1 without the
presequence may have prevented successful entry into the mitochondrion. Other
possibilities for not detecting an association between TDP1S81E
/FLAG and LIG3α could
be that any association between the two proteins is transient and that crosslinking may
have been required before the Co-IP was performed. This could have been carried out
using paraformaldehyde, however, it is likely that many other proteins that do not
normally associate with TDP1 would have been found from the Co-IP and this step was
129
not required for previous experiments in our lab (Richter et al., 2010, Rorbach et al.,
2008, Temperley et al., 2010).
Based on the data presented in this chapter and considering the limitations of some of
the methods used, it has not been possible to come to a firm conclusion on whether
phosphorylation of amino acid 81 of TDP1 promotes the association with LIG3α in the
mitochondrion.
Notable proteins that associated with TDP1S81E
and TDP1S81A
Although the association between TDP1 and LIG3α was not detected in these
experiments it is worthwhile discussing some of the proteins that were found to be
associated with TDP1 using these methods. The first protein for discussion was
associated with both forms of TDP1 and was identified as 3-hydroxyacyl-CoA
dehydrogenase type-2 isoform 2, which is known to be an RNase P enzyme (Holzmann
et al., 2008). These enzymes are involved in the maturation of tRNAs by cleavage of
nucleotides from the 5’ end to form the correct sequence once processing of the 3’ end
has also taken place by tRNase Z (Robertson et al., 1972, Ceballos and Vioque, 2007).
A mitochondrial form of human RNase P (mtRNase P) has previously been identified
suggesting a role of this enzyme in the maturation of tRNAs in mitochondria
(Rossmanith et al., 1995, Holzmann et al., 2008). In most cases RNase P enzymes
consist of an RNA component with one or more proteins that act together to perform
their desired role (Evans et al., 2006). However, it was identified that mtRNase P
consisted only of protein subunits and did not require an RNA component for activity,
which was the first occasion that this had been demonstrated for any RNase P
(Holzmann et al., 2008). This was accomplished with tRNA maturation activity assays

130
that involved using reconstituted mtRNase P made with three affinity-purified proteins
that established function of this enzyme without the need for an RNA subunit
(Holzmann et al., 2008). The association of this protein with both forms of TDP1 may
suggest that TDP1 is somehow involved in maturation of tRNA in mitochondria, but
this is highly speculative as to date TDP1 has only been identified in repair of DNA.
Other proteins that were identified from the Co-IP with TDP1S81A
that are also involved
in RNA processing include polynucleotide nucleotidyltransferase 1 (PNPase) and tRNA
modification GTPase (GTPBP3). PNPase was found to be involved in degradation of
mRNA transcripts in the mitochondrion in cooperation with human SUV3 (hSUV3);
another protein involved in mRNA degradation (Szczesny et al., 2013). Degradation by
these proteins occurs in specific areas of the mitochondrial network (degradosome-foci,
or D-foci) and from this it has been suggested that mRNA degradation in mitochondria
by PNPase and hSUV3 is spatially organised, but further information on this has yet to
be elucidated (Szczesny et al., 2013). As for GTPBP3, this protein has been found to be
involved in maturation of mitochondrial tRNAs (Villarroya et al., 2008). More
specifically, the protein has two isoforms in humans that have different length domains
(G-domains) that are responsible for hydrolysing GTP from mRNA transcripts
(Villarroya et al., 2008). Although in vitro assays performed by Villarroya et al using
synthesised tRNAs and purified protein for each isoform of GTPBP3 the exact reasons
for the existence of two isoforms of this protein were not found and have yet to be
described (Villarroya et al., 2008). Another protein that was found from the Co-IP and
is involved in maturation of tRNA is the mitochondrial seryl-tRNA synthetase
(SARS2). Aminoacyl-tRNA synthetases are responsible for charging tRNAs with the
correct amino acid, and in the case of SARS2 this enzyme is responsible for charging
tRNASer
with L-serine (Konovalova and Tyynismaa, 2013). Mutations in SARS2 have

131
been linked with a disease presenting with primary pulmonary hypertension,
progressive renal failure, and OXPHOS deficiency with patients dying before 14
months of life (Konovalova and Tyynismaa, 2013). This highlights the importance of
correct mitochondrial RNA processing as the damaging effects caused by the loss of
just one amino acid can be potentially fatal. The presence PNPase, GTPBP3, and
SARS2 in mass-spec data from the Co-IP with TDP1S81A
similar to 3-hydroxyacyl-CoA
dehydrogenase type-2 isoform 2 may further implicate TDP1 in RNA maturation
processes. However, to date there have been no data described on this and PNPase,
GTPBP3, and SARS2 were only found in the Co-IP with TDP1S81A
, which may suggest
that these findings are as a result of this form of the protein being non-phosphorylatable
or potentially as a result of structural changes caused by this amino acid substitution.
An interesting protein association identified from the Co-IP of both forms of TDP1 is
that involving thioredoxin-dependent peroxide reductase, mitochondrial isoform b
(commonly known as peroxiredoxin 3, Prx3), which is involved in the antioxidant
system within mitochondria (Watabe et al., 1997). Peroxiredoxins are a group of
enzymes responsible for catalysing the reduction of hydrogen peroxide (H2O2) to water
(H2O) with a conserved cysteine being the residue at which reduction takes place (Kil et
al., 2012, Yang et al., 2002). The majority of peroxiredoxins are functional in the
cytosol, however Prx3 is known to localise to mitochondria and act with its electron
donors thioredoxin 2 (Trx2) and thioredoxin reductase 2 (TrxR2) to reduce H2O2 (Chae
et al., 1999, Lee et al., 1999, Spyrou et al., 1997). On occasion incomplete reduction of
oxygen (O2) to H2O can lead to the formation of reactive superoxide (O2-) anions that is
converted to the less harmful H2O2 by superoxide dismutase (SOD) (Rhee et al., 2001).
Although H2O2 on its own is not particularly reactive under certain circumstances it can
be reduced to form the highly damaging hydroxyl radical (.OH) (Rhee et al., 2001). It is

132
therefore the function of peroxiredoxins to prevent this by reducing H2O2 to water,
which will lessen the potential for damage to mtDNA in the case of Prx3 (Rhee et al.,
2001). A study using siRNA was conducted and demonstrated that the loss of Prx3 led
to an increase in the levels of H2O2 which caused a reduction in the levels of
mitochondrial mRNA transcripts most probably because of an increased level of
mtDNA damage (Chang et al., 2004). It was also found that apoptosis was increased in
HeLa cells with Prx3 knockdown due to release of cytochrome c into the cytosol and an
increased rate of cleavage of procaspases-3 and -9 (Chang et al., 2004). These results
suggest that Prx3 is very important as an antioxidant in mitochondria, which potentially
makes its association with TDP1 very meaningful. However, no obvious link between
TDP1 and Prx3 exists in terms of how these enzymes might act together in DNA repair,
and it was decided that this association would not be pursued scientifically with general
theme of the thesis in mind.
Another protein associated with both forms of TDP1 was importin subunit alpha-2, but
much of the information available on this protein suggest that it is nuclear with no link
to mitochondria to date (Ito et al., 2000, Wang et al., 2011). Although this protein may
function in mitochondria in some capacity it was decided not to carry on in any attempt
to find a function for this protein in mitochondria. However, a protein that is known to
be mitochondrial was associated with TDP1S81E
, namely the mitochondrial single
stranded DNA binding protein (mtSSB). Interestingly, this protein was not found to
associate with TDP1S81A
that may suggest phosphorylation of TDP1 at amino acid 81
facilitates the interaction between these two proteins. It may also be the case that the
structure of TDP1S81A
could be altered by this amino acid change that would then
prevent its interaction with mtSSB and account for some of the differences observed in
tables 6.1 and 6.2. On researching mtSSB further it has been possible to find some

133
interesting facts about the protein and the reasons why it may interact with TDP1 in
vivo. This protein was identified in Xenopus laevis oocyte mitochondria as having a
high affinity for single stranded DNA in the D-loop of the mitochondrial genome
(Mignotte et al., 1985). Building on this, studies using HeLa cells found that mtSSB
was present in a much greater proportion than mtDNA and was proposed to act
cooperatively with TFAM in maintenance of mtDNA by enveloping this genome; thus
providing stability (Takamatsu et al., 2002). More recently it has been proposed that
mtSSB binding of mtDNA during replication acts as a protective measure against some
of the organelles own DNA repair enzymes (Wollen Steen et al., 2012). This was
suggested based on activity assays that demonstrated mtDNA repair enzymes uracil-
DNA glycosylase (UNG1) NEIL1, AlkB homolog 1 (ABH1), and AP endonuclease 1
(APE1) as being unable to cleave single stranded DNA substrates with engineered
damage specific for each enzyme when mtSSB was present (Wollen Steen et al., 2012,
Westbye et al., 2008). However, when mtSSB was not included in these assays or the
assays were performed using duplex DNA substrates with specific damage for each
enzyme to repair, each enzyme was able to remove the damage that had been
engineered in these substrates (Wollen Steen et al., 2012). From this the authors
suggested that when mtDNA was being replicated mtSSB was bound to single stranded
mtDNA, which would prevent repair enzymes from compromising the integrity of
mtDNA in trying to remove any damage that was present (Wollen Steen et al., 2012).
This would suggest that the damaging effects created by introducing nicks in single
stranded mtDNA during replication outweighs the damaging effects that are likely to
occur in the presence of these forms of lesion i.e. point mutations. With regard to TDP1
these findings imply a logical association between this enzyme and mtSSB. It would
appear likely that TDP1 is sequestered by mtSSB or associates with the same substrate
during mtDNA replication given that TDP1 is a single strand break repair enzyme that

134
is involved in resolving lesions formed by TOP1mt; also very likely to be involved in
initiation of mtDNA replication.
Other mitochondrial proteins that were identified in the Co-IP with TDP1S81A
include
estradiol 17-beta-dehydrogenase 8 (HSD17B8), acyl-coenzyme A thioesterase 9
(ACOT9), and glutaryl-CoA dehydrogenase (GCDH). From these it is GCDH that has
the most data published with regard to mitochondria. This protein is involved as part of
the process of degradation of lysine and tryptophan in mitochondria, and more
specifically it acts as a homotetramer to catalyse the oxidative decarboxylation of
glutaryl-CoA (Keyser et al., 2008). Mutations in GCDH can cause the autosomal
recessive neurometabolic disorder glutaric aciduria type 1 (GA1) with more than 150
mutations in GCDH known to cause this disease (Keyser et al., 2008). As for HSD17B8
this protein was identified in having a role in the synthesis of androgens and oestrogens,
and controlling their activity in mammals, but was not initially thought to be
mitochondrial (Pletnev and Duax, 2005). However, it was suggested that this protein
may be involved in fatty acid metabolism in mitochondria based on bioinformatics that
analysed the structure and substrate specificity of the enzyme (Pletnev and Duax, 2005).
Despite this publication there have been no further reports of this enzyme in
mitochondria and also the link between TDP1 and fatty acid metabolism is not
particularly obvious. Any link between TDP1 and GCDH is also hard to establish as
there is also no obvious reason why these two proteins would associate with each other
based on their known function. It may simply be the case that these proteins were found
to associate with TDP1S81A
due to the relatively high levels of expression of this protein
in mitochondria during this experiment and/or the altered structure of TDP1S81A
due to
its amino acid change. This may also be true for ACOT9 for which there is no data to

135
date other than it is predicted to be mitochondrial by RefSeq based on its amino acid
sequence.
The data presented in this chapter has shown that from our experiments there was no
evidence to show that phosphorylation of amino acid 81 in TDP1 mediates its
association with LIG3α. . However, the limitations of experimental procedures
discussed in this chapter cannot give us any clear conclusions on this and so the
association between TDP1 and LIG3α in mitochondria cannot be ruled out. Although
this association was not found the other proteins identified from the Co-IP has opened
the possibility that TDP1 may be involved in processes other than the direct repair of
mtDNA. This data also implies that repair of mtDNA, or even inhibition of repair,
involves an intricate interplay between several proteins suggesting the mechanisms
surrounding mtDNA repair are maybe more complex than considered at this point in
time.

136
Chapter 7. Conclusions and future perspectives
The data provided in this thesis helped to delineate the role of tyrosyl-DNA-
phosphodiesterase (TDP1) in mtDNA repair. This was achieved using a variety of
methods from DNA repair assays to assess the activity of TDP1 in mitochondria to
protein complex immunoprecipitations to ascertain the protein associations between our
enzyme of interest and others in mitochondria. The main findings from the studies
carried out throughout this PhD that are outlined in this thesis include:
Identification of TDP1 presence and activity in mitochondria of human cells and
in mouse brain, which provided evidence for the activity of a novel mtDNA
repair enzyme at the time of this finding.
Evidence to suggest that mtBER is not dependent on TDP1 as was concluded by
Das et al., 2010.
Repair of mtDNA by TDP1 is most probably limited to repair of mtDNA-
TOP1mt lesions.
Based on our experiments it was not possible to determine whether
phosphorylation of amino acid 81 in TDP1 mediates the interaction between this
enzyme and LIG3α in mitochondria.
The identification of a novel enzyme involved in mtDNA repair that is likely not to be
essential to the integrity of this genome suggests that the DNA repair mechanisms in
mitochondria are more intricate than thought at the time of writing this thesis. The
machinery involved in mtDNA repair is far less characterised than in the nucleus, and
although it is most certainly the case that the mechanisms for nDNA repair are far more
complex than in mitochondria, there is still the possibility for identification of many
more repair enzymes for mtDNA.

137
In the coming years it may be possible to determine more factors involved in mtDNA
repair and to assess the impact of mtDNA damage on downstream processes such as
transcription and translation of mtDNA encoded proteins as this is a subject on which
little has been reported. Also, it may be possible to expand on the current knowledge of
the role of epigenetic factors on mtDNA that affect processes within mitochondria.
Although the findings in this thesis may be informative in identifying relatively new
DNA repair pathways in mitochondria, there are many questions that still exist in
relation to this subject. Questions such as:
What is the exact role of mtDNA damage in ageing and disease?
Does mtDNA contribute to the ageing process or is it merely a sign of ageing?
To what extent does mtDNA need to be damaged, with reference to mtDNA
lesions, before an impact is seen in cells?
These are just a few examples of questions that remain on the subject of mtDNA repair
with many more still to be answered despite the findings in this thesis and reports in the
literature from the beginning of this PhD.
To sum up, the results provided in this thesis provide knowledge on just a small section
of the mtDNA repair field in which there is still much to learn. By persisting in attaining
information on this subject on the molecular level it will be possible to determine how
mtDNA damage impacts in ageing and disease, and from this potential advances in the
treatment of patients may be obtained.

138
Appendix
COX/SDH histochemical optimisation Incubation times: A= 5 mins, B= 10 mins, C= 15 mins, D= 20 mins, D= 25 mins, E=
30 mins, F= 35 mins, G= 40 mins, H= 45 mins, J= 50 mins, K= 55 mins, L= 60 mins
i) Mouse brain COX
Optimal incubation time was determined by assessing the most intensely stained image
before saturation occurred. In this case 35 mins (F).

139
Incubation times: A= 5 mins, B= 10 mins, C= 15 mins, D= 20 mins, D= 25 mins, E=
30 mins, F= 35 mins, G= 40 mins, H= 45 mins, J= 50 mins, K= 55 mins, L= 60 mins
ii) Mouse brain SDH
Optimal incubation time was determined by assessing the most intensely stained image
before saturation occurred. In this case 40 mins (G).

140
Incubation times: A= 5 mins, B= 10 mins, C= 15 mins, D= 20 mins, D= 25 mins, E=
30 mins, F= 35 mins, G= 40 mins, H= 45 mins, J= 50 mins, K= 55 mins, L= 60 mins
iii) Mouse eye COX
Optimal incubation time was determined by assessing the most intensely stained image
before saturation occurred. In this case 30 mins (E).

141
Incubation times: A= 5 mins, B= 10 mins, C= 15 mins, D= 20 mins, D= 25 mins, E=
30 mins, F= 35 mins, G= 40 mins, H= 45 mins, J= 50 mins, K= 55 mins, L= 60 mins
iv) Mouse eye SDH
Optimal incubation time was determined by assessing the most intensely stained image
before saturation occurred. In this case 35 mins (F).

142
v) Full data including all exponentially modified protein abundance index
(emPAI) values from the Co-IP of mtLUC/FLAG, mtTDP1S81E
/FLAG,
and mtTDP1S81A
/FLAG.
PROTEIN
GI
PROTEIN GENE emPAI mtLUC/
FLAG
emPAI
mtTDP1S81E
/
FLAG
emPAI
mtTDP1S81A
/
FLAG
41399285 60 kDa heat shock
protein, mitochondrial
HSPD1P6 50.46813857 2.025305457 1.648969288
20127586 tyrosyl-DNA
phosphodiesterase 1
TDP1 0 1.94915073 1.15443469
24234688 stress-70 protein,
mitochondrial precursor
HSPA9 10.15883993 1.15443469 1.077113926
83715985 3-hydroxyacyl-CoA
dehydrogenase type-2
isoform 2
HSD17B10 0 0.318256739 0.737800829
50345984 ATP synthase subunit
alpha, mitochondrial
precursor
Atp5a1 0.865663579 0.211527659 0.467799268
91199540 dihydrolipoyl
dehydrogenase,
mitochondrial precursor
dld 0 0 0.333521432
156071459 ADP/ATP translocase 2 SLC25A5 0.508590709 0.279802214 0.279802214
32189394 ATP synthase subunit
beta, mitochondrial
precursor
ATP5B 1.187761624 0.513561248 0.258925412
32483377 thioredoxin-dependent
peroxide reductase,
mitochondrial isoform b
prdx3 0 0.258925412 0.258925412
295842266 3,2-trans-enoyl-CoA
isomerase,
mitochondrial isoform 2
precursor
ECI1 0 0 0.258925412
4504897 importin subunit alpha-
2
KPNA2 0 0.637893707 0.245197085
15277342 estradiol 17-beta-
dehydrogenase 8
HSD17B8 0 0 0.232846739
4501885 actin, cytoplasmic 1 ACTB 0.564748142 0.291549665 0.211527659
261862352 serine
hydroxymethyltransfera
se, mitochondrial
isoform 3
SHMT2 0.154781985 0.211527659 0.211527659
8923421 seryl-tRNA synthetase,
mitochondrial isoform b
precursor
SARS2 0 0 0.193776642
10337581 keratin, type I cuticular
Ha3-II
KRT33B 0.052500285 0.165914401 0.165914401
188528628 polyribonucleotide
nucleotidyltransferase
1, mitochondrial
precursor
Pnpt1 0 0 0.14504757
189458821 protein-glutamine
gamma-
glutamyltransferase E
precursor
TGM3 0 0 0.14280206
155722983 heat shock protein 75 Trap1 0.099248522 0.03204499 0.134473931

143
kDa, mitochondrial
precursor
16507237 78 kDa glucose-
regulated protein
precursor
LOC40075
0
1.069138081 0.223824937 0.128837892
81295407 acyl-coenzyme A
thioesterase 9,
mitochondrial isoform a
precursor
acot9 0 0 0.113042193
56549662 alpha-amylase 1
precursor
Amy1a 0 0 0.107756851
36796743 monofunctional C1-
tetrahydrofolate
synthase, mitochondrial
precursor
MTHFD1L 0.091376715 0 0.091376715
67191208 polyubiquitin-C UBC 0.058501208 0 0.089022962
156071462 ADP/ATP translocase 3 SLC25A6 0.44974067 0.160155302 0.077105056
70995211 delta(3,5)-Delta(2,4)-
dienoyl-CoA isomerase,
mitochondrial precursor
ech1 0.160155302 0 0.077105056
301897479 beta-enolase isoform 2 ENO3 0 0 0.072267222
193082993 tRNA modification
GTPase GTPBP3,
mitochondrial isoform
III
GTPBP3 0 0 0.068000433
4503943 glutaryl-CoA
dehydrogenase,
mitochondrial isoform a
precursor
gcdH 0 0 0.064209244
4826702 desmocollin-1 isoform
Dsc1b preproprotein
DSC1 0 0 0.062467831
25777721 succinate-semialdehyde
dehydrogenase,
mitochondrial isoform 1
precursor
ALDH5A1 0.05776756 0.118872212 0.05776756
34147630 elongation factor Tu,
mitochondrial precursor
Tufm 0.24782547 0 0.045275495
148539842 deleted in malignant
brain tumors 1 protein
isoform b precursor
DMBT1 0 0 0.031605178
31621305 leucine-rich PPR motif-
containing protein,
mitochondrial precursor
lrpprc 0.015787165 0 0.015787165
4504523 10 kDa heat shock
protein, mitochondrial
HSPE1 0.232846739 0 0
24308295 grpE protein homolog
1, mitochondrial
precursor
GRPEL1 0.389495494 0 0
11596859 39S ribosomal protein
L17, mitochondrial
precursor
MRPL17 0.136463666 0 0
6005854 prohibitin-2 isoform 2 PHB2 0.629750835 0 0
291084742 pyruvate dehydrogenase
E1 component subunit
alpha, somatic form,
mitochondrial isoform 2
PDHA1 0.188502227 0 0

144
precursor
4757732 apoptosis-inducing
factor 1, mitochondrial
isoform 1 precursor
AIFM1 0.197929811 0 0
4557237 acetyl-CoA
acetyltransferase,
mitochondrial precursor
ACAT1 0.125335583 0 0
156564403 pyruvate dehydrogenase
E1 component subunit
beta, mitochondrial
isoform 1 precursor
pdhB 0.417474163 0 0
4507231 single-stranded DNA-
binding protein,
mitochondrial precursor
SSBP1 0 0.165914401 0
13699824 kinesin-like protein
KIF11
KIF11 0.065425129 0 0
4502303 ATP synthase subunit
O, mitochondrial
precursor
atp5o 0.232846739 0 0
4557809 ornithine
aminotransferase,
mitochondrial isoform 1
precursor
OAT 0.218187912 0 0
102469034 tyrosine-protein kinase
JAK1
JAK1 0.110336318 0 0
193211616 protein NipSnap
homolog 1
NIPSNAP1 0.100694171 0 0
31711992 dihydrolipoyllysine-
residue
acetyltransferase
component of pyruvate
dehydrogenase
complex, mitochondrial
precursor
dlaT 0.478465929 0 0
50345988 ATP synthase subunit
gamma, mitochondrial
isoform L (liver)
precursor
Atp5c1 0.115883993 0 0
126635329 luciferase [Photinus
pyralis] + mitochondrial
targeting sequence and
FLAG tag
GENE 39.23936909 0.055008148 0

145
References
AMEUR, A., STEWART, J. B., FREYER, C., HAGSTROM, E., INGMAN, M., LARSSON, N.
G. & GYLLENSTEN, U. 2011. Ultra-deep sequencing of mouse mitochondrial DNA:
mutational patterns and their origins. PLoS Genet, 7, e1002028.
ANDERSON, S., BANKIER, A. T., BARRELL, B. G., DE BRUIJN, M. H. L., COULSON, A.
R., DROUIN, J., EPERON, I. C., NIERLICH, D. P., ROE, B. A., SANGER, F.,
SCHREIER, P. H., SMITH, A. J. H., STADEN, R. & YOUNG, I. G. 1981. Sequence
and organization of the human mitochondrial genome. Nature, 290, 457-465.
ANDREWS, R. M., KUBACKA, I., CHINNERY, P. F., LIGHTOWLERS, R. N., TURNBULL,
D. M. & HOWELL, N. 1999. Reanalysis and revision of the Cambridge reference
sequence for human mitochondrial DNA. Nat Genet, 23, 147.
ATTARDI, G. & SCHATZ, G. 1988. Biogenesis of mitochondria. Annu Rev Cell Biol, 4, 289-
333.
BACMAN, S. R., WILLIAMS, S. L. & MORAES, C. T. 2009. Intra- and inter-molecular
recombination of mitochondrial DNA after in vivo induction of multiple double-strand
breaks. Nucleic Acids Res, 37, 4218-26.
BAROT, M., GOKULGANDHI, M. R. & MITRA, A. K. 2011. Mitochondrial dysfunction in
retinal diseases. Curr Eye Res, 36, 1069-77.
BATISTA, L. F., KAINA, B., MENEGHINI, R. & MENCK, C. F. 2009. How DNA lesions are
turned into powerful killing structures: insights from UV-induced apoptosis. Mutat Res,
681, 197-208.
BECKER, T., BOTTINGER, L. & PFANNER, N. 2012. Mitochondrial protein import: from
transport pathways to an integrated network. Trends Biochem Sci, 37, 85-91.
BENDER, A., KRISHNAN, K. J., MORRIS, C. M., TAYLOR, G. A., REEVE, A. K., PERRY,
R. H., JAROS, E., HERSHESON, J. S., BETTS, J., KLOPSTOCK, T., TAYLOR, R.
W. & TURNBULL, D. M. 2006. High levels of mitochondrial DNA deletions in
substantia nigra neurons in aging and Parkinson disease. Nat Genet, 38, 515-7.
BERK, A. J. & CLAYTON, D. A. 1974. Mechanism of mitochondrial DNA replication in
mouse L-cells: asynchronous replication of strands, segregation of circular daughter
molecules, aspects of topology and turnover of an initiation sequence. J Mol Biol, 86,
801-24.
BIBB, M. J., VAN ETTEN, R. A., WRIGHT, C. T., WALBERG, M. W. & CLAYTON, D. A.
1981a. Sequence and gene organization of mouse mitochondrial DNA. Cell, 26, 167-
180.
BIBB, M. J., VAN ETTEN, R. A., WRIGHT, C. T., WALBERG, M. W. & CLAYTON, D. A.
1981b. Sequence and gene organization of mouse mitochondrial DNA. Cell, 26, 167-80.
BOESCH, P., WEBER-LOTFI, F., IBRAHIM, N., TARASENKO, V., COSSET, A., PAULUS,
F., LIGHTOWLERS, R. N. & DIETRICH, A. 2011. DNA repair in organelles:
Pathways, organization, regulation, relevance in disease and aging. Biochimica et
Biophysica Acta (BBA) - Molecular Cell Research, 1813, 186-200.
BOGENHAGEN, D. F. 1999. Repair of mtDNA in vertebrates. Am J Hum Genet, 64, 1276-81.

146
BOLENDER, N., SICKMANN, A., WAGNER, R., MEISINGER, C. & PFANNER, N. 2008.
Multiple pathways for sorting mitochondrial precursor proteins. EMBO Rep, 9, 42-9.
BONAWITZ, N. D. & SHADEL, G. S. 2007. Rethinking the mitochondrial theory of aging: the
role of mitochondrial gene expression in lifespan determination. Cell Cycle, 6, 1574-8.
BOWMAKER, M., YANG, M. Y., YASUKAWA, T., REYES, A., JACOBS, H. T.,
HUBERMAN, J. A. & HOLT, I. J. 2003. Mammalian mitochondrial DNA replicates
bidirectionally from an initiation zone. J Biol Chem, 278, 50961-9.
BRAND, M. D. 2010. The sites and topology of mitochondrial superoxide production. Exp
Gerontol, 45, 466-72.
BURNEY, S., CAULFIELD, J. L., NILES, J. C., WISHNOK, J. S. & TANNENBAUM, S. R.
1999. The chemistry of DNA damage from nitric oxide and peroxynitrite. Mutat Res,
424, 37-49.
CALDECOTT, K. W. 2008. Single-strand break repair and genetic disease. Nat Rev Genet, 9,
619-31.
CAPALDI, R. A. 1990. Structure and function of cytochrome c oxidase. Annu Rev Biochem, 59,
569-96.
CEBALLOS, M. & VIOQUE, A. 2007. tRNase Z. Protein Pept Lett, 14, 137-45.
CHAE, H. Z., KIM, H. J., KANG, S. W. & RHEE, S. G. 1999. Characterization of three
isoforms of mammalian peroxiredoxin that reduce peroxides in the presence of
thioredoxin. Diabetes Res Clin Pract, 45, 101-12.
CHANG, T. S., CHO, C. S., PARK, S., YU, S., KANG, S. W. & RHEE, S. G. 2004.
Peroxiredoxin III, a mitochondrion-specific peroxidase, regulates apoptotic signaling by
mitochondria. J Biol Chem, 279, 41975-84.
CHAUDIERE, J. & FERRARI-ILIOU, R. 1999. Intracellular antioxidants: from chemical to
biochemical mechanisms. Food Chem Toxicol, 37, 949-62.
CHEN, H. & CHAN, D. C. 2005. Emerging functions of mammalian mitochondrial fusion and
fission. Hum Mol Genet, 14 Spec No. 2, R283-9.
CHIANG, S. C., CARROLL, J. & EL-KHAMISY, S. F. 2010. TDP1 serine 81 promotes
interaction with DNA ligase IIIalpha and facilitates cell survival following DNA
damage. Cell Cycle, 9, 588-595.
CLAYTON, D. A., DODA, J. N. & FRIEDBERG, E. C. 1974. The absence of a pyrimidine
dimer repair mechanism in mammalian mitochondria. Proc Natl Acad Sci U S A, 71,
2777-81.
CLINE, S. D. 2012. Mitochondrial DNA damage and its consequences for mitochondrial gene
expression. Biochim Biophys Acta, 1819, 979-91.
COLBEAU, A., NACHBAUR, J. & VIGNAIS, P. M. 1971. Enzymic characterization and lipid
composition of rat liver subcellular membranes. Biochim Biophys Acta, 249, 462-92.
CORTES LEDESMA, F., EL KHAMISY, S. F., ZUMA, M. C., OSBORN, K. &
CALDECOTT, K. W. 2009. A human 5'-tyrosyl DNA phosphodiesterase that repairs
topoisomerase-mediated DNA damage. Nature, 461, 674-8.

147
CRAMER, W. A., HASAN, S. S. & YAMASHITA, E. 2011. The Q cycle of cytochrome bc
complexes: a structure perspective. Biochim Biophys Acta, 1807, 788-802.
CROSBY, A. H., PATEL, H., CHIOZA, B. A., PROUKAKIS, C., GURTZ, K., PATTON, M.
A., SHARIFI, R., HARLALKA, G., SIMPSON, M. A., DICK, K., REED, J. A., AL-
MEMAR, A., CHRZANOWSKA-LIGHTOWLERS, Z. M., CROSS, H. E. &
LIGHTOWLERS, R. N. 2010. Defective mitochondrial mRNA maturation is associated
with spastic ataxia. Am J Hum Genet, 87, 655-60.
DALLA ROSA, I., GOFFART, S., WURM, M., WIEK, C., ESSMANN, F., SOBEK, S.,
SCHROEDER, P., ZHANG, H., KRUTMANN, J., HANENBERG, H., SCHULZE-
OSTHOFF, K., MIELKE, C., POMMIER, Y., BOEGE, F. & CHRISTENSEN, M. O.
2009. Adaptation of topoisomerase I paralogs to nuclear and mitochondrial DNA.
Nucleic Acids Res, 37, 6414-28.
DAS, B. B., DEXHEIMER, T. S., MADDALI, K. & POMMIER, Y. 2010. Role of tyrosyl-
DNA phosphodiesterase (TDP1) in mitochondria. Proc Natl Acad Sci U S A, 107,
19790-5.
DAVIES, D. R., INTERTHAL, H., CHAMPOUX, J. J. & HOL, W. G. 2002a. Insights into
substrate binding and catalytic mechanism of human tyrosyl-DNA phosphodiesterase
(Tdp1) from vanadate and tungstate-inhibited structures. J Mol Biol, 324, 917-32.
DAVIES, D. R., INTERTHAL, H., CHAMPOUX, J. J. & HOL, W. G. J. 2002b. The Crystal
Structure of Human Tyrosyl-DNA Phosphodiesterase, Tdp1. Structure (London,
England : 1993), 10, 237-248.
DE SOUZA-PINTO, N. C., EIDE, L., HOGUE, B. A., THYBO, T., STEVNSNER, T.,
SEEBERG, E., KLUNGLAND, A. & BOHR, V. A. 2001. Repair of 8-
oxodeoxyguanosine lesions in mitochondrial dna depends on the oxoguanine dna
glycosylase (OGG1) gene and 8-oxoguanine accumulates in the mitochondrial dna of
OGG1-defective mice. Cancer Res, 61, 5378-81.
DE SOUZA-PINTO, N. C., MASON, P. A., HASHIGUCHI, K., WEISSMAN, L., TIAN, J.,
GUAY, D., LEBEL, M., STEVNSNER, T. V., RASMUSSEN, L. J. & BOHR, V. A.
2009. Novel DNA mismatch-repair activity involving YB-1 in human mitochondria.
DNA Repair (Amst), 8, 704-19.
DEBETHUNE, L., KOHLHAGEN, G., GRANDAS, A. & POMMIER, Y. 2002. Processing of
nucleopeptides mimicking the topoisomerase I-DNA covalent complex by tyrosyl-DNA
phosphodiesterase. Nucleic Acids Res, 30, 1198-204.
DIZDAROGLU, M., JARUGA, P., BIRINCIOGLU, M. & RODRIGUEZ, H. 2002. Free
radical-induced damage to DNA: mechanisms and measurement. Free Radic Biol Med,
32, 1102-15.
EFREMOV, R. G. & SAZANOV, L. A. 2012. The coupling mechanism of respiratory complex
I - a structural and evolutionary perspective. Biochim Biophys Acta, 1817, 1785-95.
EL-KHAMISY, S. F., KATYAL, S., PATEL, P., JU, L., MCKINNON, P. J. & CALDECOTT,
K. W. 2009. Synergistic decrease of DNA single-strand break repair rates in mouse
neural cells lacking both Tdp1 and aprataxin. DNA Repair (Amst), 8, 760-6.
EL-KHAMISY, S. F., SAIFI, G. M., WEINFELD, M., JOHANSSON, F., HELLEDAY, T.,
LUPSKI, J. R. & CALDECOTT, K. W. 2005. Defective DNA single-strand break
repair in spinocerebellar ataxia with axonal neuropathy-1. Nature, 434, 108-113.

148
ESTERBAUER, H., SCHAUR, R. J. & ZOLLNER, H. 1991. Chemistry and biochemistry of 4-
hydroxynonenal, malonaldehyde and related aldehydes. Free Radic Biol Med, 11, 81-
128.
EVANS, D., MARQUEZ, S. M. & PACE, N. R. 2006. RNase P: interface of the RNA and
protein worlds. Trends Biochem Sci, 31, 333-41.
EVANS, M. D., DIZDAROGLU, M. & COOKE, M. S. 2004. Oxidative DNA damage and
disease: induction, repair and significance. Mutat Res, 567, 1-61.
FAIRFIELD, F. R., BAUER, W. R. & SIMPSON, M. V. 1979. Mitochondria contain a distinct
DNA topoisomerase. J Biol Chem, 254, 9352-4.
FALKENBERG, M., GASPARI, M., RANTANEN, A., TRIFUNOVIC, A., LARSSON, N. G.
& GUSTAFSSON, C. M. 2002. Mitochondrial transcription factors B1 and B2 activate
transcription of human mtDNA. Nat Genet, 31, 289-94.
FALKENBERG, M., LARSSON, N. G. & GUSTAFSSON, C. M. 2007. DNA replication and
transcription in mammalian mitochondria. Annu Rev Biochem, 76, 679-99.
FARAH, C. A., LINDEMAN, A. A., SIU, V., GUPTA, M. D. & SOSSIN, W. S. 2012.
Autophosphorylation of the c2 domain inhibits translocation of the novel protein kinase
c (npkc) apl ii. J Neurochem.
FOYER, C. H. & NOCTOR, G. 2009. Redox regulation in photosynthetic organisms: signaling,
acclimation, and practical implications. Antioxid Redox Signal, 11, 861-905.
FUKUI, H. & MORAES, C. T. 2009. Mechanisms of formation and accumulation of
mitochondrial DNA deletions in aging neurons. Hum Mol Genet, 18, 1028-36.
GAO, Y., KATYAL, S., LEE, Y., ZHAO, J., REHG, J. E., RUSSELL, H. R. & MCKINNON,
P. J. 2011. DNA ligase III is critical for mtDNA integrity but not Xrcc1-mediated
nuclear DNA repair. Nature, 471, 240-4.
GEGG, M. E. & SCHAPIRA, A. H. 2011. PINK1-parkin-dependent mitophagy involves
ubiquitination of mitofusins 1 and 2: Implications for Parkinson disease pathogenesis.
Autophagy, 7, 243-5.
GERMAIN, M., MATHAI, J. P., MCBRIDE, H. M. & SHORE, G. C. 2005. Endoplasmic
reticulum BIK initiates DRP1-regulated remodelling of mitochondrial cristae during
apoptosis. EMBO J, 24, 1546-56.
GRAY, M. W., BURGER, G. & LANG, B. F. 1999. Mitochondrial evolution. Science, 283,
1476-81.
HACKENBROCK, C. R. 1966. Ultrastructural bases for metabolically linked mechanical
activity in mitochondria. I. Reversible ultrastructural changes with change in metabolic
steady state in isolated liver mitochondria. J Cell Biol, 30, 269-97.
HAGERHALL, C. 1997. Succinate: quinone oxidoreductases. Variations on a conserved theme.
Biochim Biophys Acta, 1320, 107-41.
HALLBERG, B. M. & LARSSON, N. G. 2011. TFAM forces mtDNA to make a U-turn. Nat
Struct Mol Biol, 18, 1179-81.
HALLIWELL, B. & GUTTERIDGE, J. M. 1984. Free radicals, lipid peroxidation, and cell
damage. Lancet, 2, 1095.

149
HARMAN, D. 1956. Aging: a theory based on free radical and radiation chemistry. J Gerontol,
11, 298-300.
HEGDE, M. L., MANTHA, A. K., HAZRA, T. K., BHAKAT, K. K., MITRA, S. &
SZCZESNY, B. 2012. Oxidative genome damage and its repair: implications in aging
and neurodegenerative diseases. Mech Ageing Dev, 133, 157-68.
HEIDE, H., BLEIER, L., STEGER, M., ACKERMANN, J., DROSE, S., SCHWAMB, B.,
ZORNIG, M., REICHERT, A. S., KOCH, I., WITTIG, I. & BRANDT, U. 2012.
Complexome profiling identifies TMEM126B as a component of the mitochondrial
complex I assembly complex. Cell Metab, 16, 538-49.
HENZE, K. & MARTIN, W. 2003. Evolutionary biology: essence of mitochondria. Nature,
426, 127-8.
HIRANO, T. 2008. Repair system of 7, 8-dihydro-8-oxoguanine as a defense line against
carcinogenesis. J Radiat Res, 49, 329-40.
HIRST, J. 2005. Energy transduction by respiratory complex I--an evaluation of current
knowledge. Biochem Soc Trans, 33, 525-9.
HOFHAUS, G., WEISS, H. & LEONARD, K. 1991. Electron microscopic analysis of the
peripheral and membrane parts of mitochondrial NADH dehydrogenase (complex I). J
Mol Biol, 221, 1027-43.
HOLT, I. J., LORIMER, H. E. & JACOBS, H. T. 2000. Coupled leading- and lagging-strand
synthesis of mammalian mitochondrial DNA. Cell, 100, 515-24.
HOLZMANN, J., FRANK, P., LOFFLER, E., BENNETT, K. L., GERNER, C. &
ROSSMANITH, W. 2008. RNase P without RNA: identification and functional
reconstitution of the human mitochondrial tRNA processing enzyme. Cell, 135, 462-74.
HOPPINS, S., LACKNER, L. & NUNNARI, J. 2007. The machines that divide and fuse
mitochondria. Annu Rev Biochem, 76, 751-80.
HOWELL, N., ELSON, J. L., CHINNERY, P. F. & TURNBULL, D. M. 2005. mtDNA
mutations and common neurodegenerative disorders. Trends Genet, 21, 583-6.
HSIEH, P. & YAMANE, K. 2008. DNA mismatch repair: molecular mechanism, cancer, and
ageing. Mech Ageing Dev, 129, 391-407.
INAMDAR, K. V., POULIOT, J. J., ZHOU, T., LEES-MILLER, S. P., RASOULI-NIA, A. &
POVIRK, L. F. 2002. Conversion of phosphoglycolate to phosphate termini on 3'
overhangs of DNA double strand breaks by the human tyrosyl-DNA phosphodiesterase
hTdp1. J Biol Chem, 277, 27162-8.
INTERTHAL, H., CHEN, H. J. & CHAMPOUX, J. J. 2005. Human Tdp1 cleaves a broad
spectrum of substrates, including phosphoamide linkages. J Biol Chem, 280, 36518-28.
INTERTHAL, H., POULIOT, J. J. & CHAMPOUX, J. J. 2001. The tyrosyl-DNA
phosphodiesterase Tdp1 is a member of the phospholipase D superfamily. Proc Natl
Acad Sci U S A, 98, 12009-14.
ITO, S., IKEDA, M., KATO, N., MATSUMOTO, A., ISHIKAWA, Y., KUMAKUBO, S. &
YANAGI, K. 2000. Epstein-barr virus nuclear antigen-1 binds to nuclear transporter
karyopherin alpha1/NPI-1 in addition to karyopherin alpha2/Rch1. Virology, 266, 110-
9.

150
JANG, Y. C. & REMMEN, V. H. 2009. The mitochondrial theory of aging: insight from
transgenic and knockout mouse models. Exp Gerontol, 44, 256-60.
KAMIYA, H. & KASAI, H. 1995. Formation of 2-hydroxydeoxyadenosine triphosphate, an
oxidatively damaged nucleotide, and its incorporation by DNA polymerases. Steady-
state kinetics of the incorporation. J Biol Chem, 270, 19446-50.
KANG, D., NISHIDA, J., IYAMA, A., NAKABEPPU, Y., FURUICHI, M., FUJIWARA, T.,
SEKIGUCHI, M. & TAKESHIGE, K. 1995. Intracellular localization of 8-oxo-
dGTPase in human cells, with special reference to the role of the enzyme in
mitochondria. J Biol Chem, 270, 14659-65.
KARAHALIL, B., DE SOUZA-PINTO, N. C., PARSONS, J. L., ELDER, R. H. & BOHR, V.
A. 2003. Compromised incision of oxidized pyrimidines in liver mitochondria of mice
deficient in NTH1 and OGG1 glycosylases. J Biol Chem, 278, 33701-7.
KASAMATSU, H., ROBBERSON, D. L. & VINOGRAD, J. 1971. A novel closed-circular
mitochondrial DNA with properties of a replicating intermediate. Proc Natl Acad Sci U
S A, 68, 2252-7.
KATYAL, S., EL-KHAMISY, S. F., RUSSELL, H. R., LI, Y., JU, L., CALDECOTT, K. W. &
MCKINNON, P. J. 2007. TDP1 facilitates chromosomal single-strand break repair in
neurons and is neuroprotective in vivo. EMBO J, 26, 4720-4731.
KEYSER, B., MUHLHAUSEN, C., DICKMANNS, A., CHRISTENSEN, E., MUSCHOL, N.,
ULLRICH, K. & BRAULKE, T. 2008. Disease-causing missense mutations affect
enzymatic activity, stability and oligomerization of glutaryl-CoA dehydrogenase
(GCDH). Hum Mol Genet, 17, 3854-63.
KIL, I. S., LEE, S. K., RYU, K. W., WOO, H. A., HU, M. C., BAE, S. H. & RHEE, S. G. 2012.
Feedback control of adrenal steroidogenesis via H2O2-dependent, reversible
inactivation of peroxiredoxin III in mitochondria. Mol Cell, 46, 584-94.
KINOSITA, K., JR. 2012. F(1)-ATPase: a prototypical rotary molecular motor. Adv Exp Med
Biol, 726, 5-16.
KONOVALOVA, S. & TYYNISMAA, H. 2013. Mitochondrial aminoacyl-tRNA synthetases in
human disease. Mol Genet Metab, 108, 206-11.
KOSTER, D. A., CROQUETTE, V., DEKKER, C., SHUMAN, S. & DEKKER, N. H. 2005.
Friction and torque govern the relaxation of DNA supercoils by eukaryotic
topoisomerase IB. Nature, 434, 671-4.
KRISHNAN, K. J., GREAVES, L. C., REEVE, A. K. & TURNBULL, D. 2007. The ageing
mitochondrial genome. Nucleic Acids Res, 35, 7399-405.
KRUSE, B., NARASIMHAN, N. & ATTARDI, G. 1989. Termination of transcription in
human mitochondria: identification and purification of a DNA binding protein factor
that promotes termination. Cell, 58, 391-7.
KUKAT, C., WURM, C. A., SPAHR, H., FALKENBERG, M., LARSSON, N. G. & JAKOBS,
S. 2011. Super-resolution microscopy reveals that mammalian mitochondrial nucleoids
have a uniform size and frequently contain a single copy of mtDNA. Proc Natl Acad Sci
U S A, 108, 13534-9.
LAKSHMIPATHY, U. & CAMPBELL, C. 1999a. Double strand break rejoining by
mammalian mitochondrial extracts. Nucleic Acids Res, 27, 1198-204.

151
LAKSHMIPATHY, U. & CAMPBELL, C. 1999b. The human DNA ligase III gene encodes
nuclear and mitochondrial proteins. Mol Cell Biol, 19, 3869-76.
LARSSON, N. G. 2010. Somatic mitochondrial DNA mutations in mammalian aging. Annu Rev
Biochem, 79, 683-706.
LAX, N. Z., HEPPLEWHITE, P. D., REEVE, A. K., NESBITT, V., MCFARLAND, R.,
JAROS, E., TAYLOR, R. W. & TURNBULL, D. M. 2012. Cerebellar ataxia in patients
with mitochondrial DNA disease: a molecular clinicopathological study. J Neuropathol
Exp Neurol, 71, 148-61.
LEE, S. R., KIM, J. R., KWON, K. S., YOON, H. W., LEVINE, R. L., GINSBURG, A. &
RHEE, S. G. 1999. Molecular cloning and characterization of a mitochondrial
selenocysteine-containing thioredoxin reductase from rat liver. J Biol Chem, 274, 4722-
34.
LEMARIE, A. & GRIMM, S. 2011. Mitochondrial respiratory chain complexes: apoptosis
sensors mutated in cancer? Oncogene, 30, 3985-4003.
LI, M. X., WANG, D., ZHONG, Z. Y., XIANG, D. B., LI, Z. P., XIE, J. Y., YANG, Z. Z., JIN,
F. & QING, Y. 2008. Targeting truncated APE1 in mitochondria enhances cell survival
after oxidative stress. Free Radic Biol Med, 45, 592-601.
LIU, C., POULIOT, J. J. & NASH, H. A. 2002. Repair of topoisomerase I covalent complexes
in the absence of the tyrosyl-DNA phosphodiesterase Tdp1. Proc Natl Acad Sci U S A,
99, 14970-5.
LIU, L., LI, Y., LI, S., HU, N., HE, Y., PONG, R., LIN, D., LU, L. & LAW, M. 2012.
Comparison of next-generation sequencing systems. J Biomed Biotechnol, 2012,
251364.
LIU, L. F., LIU, C. C. & ALBERTS, B. M. 1980. Type II DNA topoisomerases: enzymes that
can unknot a topologically knotted DNA molecule via a reversible double-strand break.
Cell, 19, 697-707.
LIU, P. & DEMPLE, B. 2010. DNA repair in mammalian mitochondria: Much more than we
thought? Environ Mol Mutagen, 51, 417-26.
LIU, P., QIAN, L., SUNG, J. S., DE SOUZA-PINTO, N. C., ZHENG, L., BOGENHAGEN, D.
F., BOHR, V. A., WILSON, D. M., 3RD, SHEN, B. & DEMPLE, B. 2008. Removal of
oxidative DNA damage via FEN1-dependent long-patch base excision repair in human
cell mitochondria. Mol Cell Biol, 28, 4975-87.
MANNELLA, C. A., PFEIFFER, D. R., BRADSHAW, P. C., MORARU, II, SLEPCHENKO,
B., LOEW, L. M., HSIEH, C. E., BUTTLE, K. & MARKO, M. 2001. Topology of the
mitochondrial inner membrane: dynamics and bioenergetic implications. IUBMB Life,
52, 93-100.
MARGULIS, L. 1996. Archaeal-eubacterial mergers in the origin of Eukarya: phylogenetic
classification of life. Proc Natl Acad Sci U S A, 93, 1071-6.
MARTIN, L. J. 2012. Biology of mitochondria in neurodegenerative diseases. Prog Mol Biol
Transl Sci, 107, 355-415.
MASON, P. A. & LIGHTOWLERS, R. N. 2003. Why do mammalian mitochondria possess a
mismatch repair activity? FEBS Lett, 554, 6-9.

152
MASON, P. A., MATHESON, E. C., HALL, A. G. & LIGHTOWLERS, R. N. 2003. Mismatch
repair activity in mammalian mitochondria. Nucleic Acids Res, 31, 1052-8.
MCCULLOCH, V., SEIDEL-ROGOL, B. L. & SHADEL, G. S. 2002. A human mitochondrial
transcription factor is related to RNA adenine methyltransferases and binds S-
adenosylmethionine. Mol Cell Biol, 22, 1116-25.
MIGNOTTE, B., BARAT, M. & MOUNOLOU, J. C. 1985. Characterization of a mitochondrial
protein binding to single-stranded DNA. Nucleic Acids Res, 13, 1703-16.
MITCHELL, P. 1975. Protonmotive redox mechanism of the cytochrome b-c1 complex in the
respiratory chain: protonmotive ubiquinone cycle. FEBS Lett, 56, 1-6.
MITCHELL, P. 1976. Possible molecular mechanisms of the protonmotive function of
cytochrome systems. J Theor Biol, 62, 327-67.
MITRA, S., IZUMI, T., BOLDOGH, I., BHAKAT, K. K., CHATTOPADHYAY, R. &
SZCZESNY, B. 2007. Intracellular trafficking and regulation of mammalian AP-
endonuclease 1 (APE1), an essential DNA repair protein. DNA Repair (Amst), 6, 461-9.
MONTOYA, J., OJALA, D. & ATTARDI, G. 1981. Distinctive features of the 5'-terminal
sequences of the human mitochondrial mRNAs. Nature, 290, 465-70.
MU, J. J., WANG, Y., LUO, H., LENG, M., ZHANG, J., YANG, T., BESUSSO, D., JUNG, S.
Y. & QIN, J. 2007. A proteomic analysis of ataxia telangiectasia-mutated (ATM)/ATM-
Rad3-related (ATR) substrates identifies the ubiquitin-proteasome system as a regulator
for DNA damage checkpoints. J Biol Chem, 282, 17330-4.
MULKIDJANIAN, A. Y. 2010. Activated Q-cycle as a common mechanism for cytochrome
bc1 and cytochrome b6f complexes. Biochim Biophys Acta, 1797, 1858-68.
MYERS, K. A., SAFFHILL, R. & O'CONNOR, P. J. 1988. Repair of alkylated purines in the
hepatic DNA of mitochondria and nuclei in the rat. Carcinogenesis, 9, 285-92.
NAKABEPPU, Y. 2001a. Molecular genetics and structural biology of human MutT homolog,
MTH1. Mutat Res, 477, 59-70.
NAKABEPPU, Y. 2001b. Regulation of intracellular localization of human MTH1, OGG1, and
MYH proteins for repair of oxidative DNA damage. Prog Nucleic Acid Res Mol Biol,
68, 75-94.
NILSEN, H., OTTERLEI, M., HAUG, T., SOLUM, K., NAGELHUS, T. A., SKORPEN, F. &
KROKAN, H. E. 1997. Nuclear and mitochondrial uracil-DNA glycosylases are
generated by alternative splicing and transcription from different positions in the UNG
gene. Nucleic Acids Res, 25, 750-5.
NOJI, H., YASUDA, R., YOSHIDA, M. & KINOSITA, K., JR. 1997. Direct observation of the
rotation of F1-ATPase. Nature, 386, 299-302.
O'ROURKE, B., VAN EYK, J. E. & FOSTER, D. B. 2011. Mitochondrial protein
phosphorylation as a regulatory modality: implications for mitochondrial dysfunction in
heart failure. Congest Heart Fail, 17, 269-82.
OHNO, M., OKA, S. & NAKABEPPU, Y. 2009. Quantitative analysis of oxidized guanine, 8-
oxoguanine, in mitochondrial DNA by immunofluorescence method. Methods Mol Biol,
554, 199-212.

153
OJALA, D., MONTOYA, J. & ATTARDI, G. 1981. tRNA punctuation model of RNA
processing in human mitochondria. Nature, 290, 470-4.
OLD, S. L. & JOHNSON, M. A. 1989. Methods of microphotometric assay of succinate
dehydrogenase and cytochrome c oxidase activities for use on human skeletal muscle.
Histochem J, 21, 545-55.
OTTERLEI, M., HAUG, T., NAGELHUS, T. A., SLUPPHAUG, G., LINDMO, T. &
KROKAN, H. E. 1998. Nuclear and mitochondrial splice forms of human uracil-DNA
glycosylase contain a complex nuclear localisation signal and a strong classical
mitochondrial localisation signal, respectively. Nucleic Acids Res, 26, 4611-7.
PALADE, G. E. 1952. The fine structure of mitochondria. Anat Rec, 114, 427-51.
PALADE, G. E. 1953. An electron microscope study of the mitochondrial structure. J
Histochem Cytochem, 1, 188-211.
PALMER, C. S., OSELLAME, L. D., STOJANOVSKI, D. & RYAN, M. T. 2011. The
regulation of mitochondrial morphology: intricate mechanisms and dynamic machinery.
Cell Signal, 23, 1534-45.
PAPA, S., MARTINO, P. L., CAPITANIO, G., GABALLO, A., DE RASMO, D.,
SIGNORILE, A. & PETRUZZELLA, V. 2012. The oxidative phosphorylation system
in mammalian mitochondria. Adv Exp Med Biol, 942, 3-37.
PARK, C. B. & LARSSON, N. G. 2011. Mitochondrial DNA mutations in disease and aging. J
Cell Biol, 193, 809-18.
PEPIO, A. M. & SOSSIN, W. S. 2001. Membrane translocation of novel protein kinase Cs is
regulated by phosphorylation of the C2 domain. J Biol Chem, 276, 3846-55.
PLETNEV, V. Z. & DUAX, W. L. 2005. Rational proteomics IV: modeling the primary
function of the mammalian 17beta-hydroxysteroid dehydrogenase type 8. J Steroid
Biochem Mol Biol, 94, 327-35.
PLO, I., LIAO, Z. Y., BARCELO, J. M., KOHLHAGEN, G., CALDECOTT, K. W.,
WEINFELD, M. & POMMIER, Y. 2003. Association of XRCC1 and tyrosyl DNA
phosphodiesterase (Tdp1) for the repair of topoisomerase I-mediated DNA lesions.
DNA Repair (Amst), 2, 1087-100.
RABINOWITZ, M., SINCLAIR, J., DESALLE, L., HASELKORN, R. & SWIFT, H. H. 1965.
Isolation of deoxyribonucleic acid from mitochondria of chick embryo heart and liver.
Proc Natl Acad Sci U S A, 53, 1126-33.
RAYMOND, A. C., RIDEOUT, M. C., STAKER, B., HJERRILD, K. & BURGIN, A. B., JR.
2004. Analysis of human tyrosyl-DNA phosphodiesterase I catalytic residues. J Mol
Biol, 338, 895-906.
REDINBO, M. R., STEWART, L., KUHN, P., CHAMPOUX, J. J. & HOL, W. G. 1998.
Crystal structures of human topoisomerase I in covalent and noncovalent complexes
with DNA. Science, 279, 1504-13.
RHEE, S. G., KANG, S. W., CHANG, T. S., JEONG, W. & KIM, K. 2001. Peroxiredoxin, a
novel family of peroxidases. IUBMB Life, 52, 35-41.
RICHTER, R., RORBACH, J., PAJAK, A., SMITH, P. M., WESSELS, H. J., HUYNEN, M.
A., SMEITINK, J. A., LIGHTOWLERS, R. N. & CHRZANOWSKA-

154
LIGHTOWLERS, Z. M. 2010. A functional peptidyl-tRNA hydrolase, ICT1, has been
recruited into the human mitochondrial ribosome. EMBO J, 29, 1116-25.
ROBBERSON, D. L., KASAMATSU, H. & VINOGRAD, J. 1972. Replication of
mitochondrial DNA. Circular replicative intermediates in mouse L cells. Proc Natl
Acad Sci U S A, 69, 737-41.
ROBERTSON, H. D., ALTMAN, S. & SMITH, J. D. 1972. Purification and properties of a
specific Escherichia coli ribonuclease which cleaves a tyrosine transfer ribonucleic acid
presursor. J Biol Chem, 247, 5243-51.
ROEDE, J. R. & JONES, D. P. 2010. Reactive species and mitochondrial dysfunction:
mechanistic significance of 4-hydroxynonenal. Environ Mol Mutagen, 51, 380-90.
RORBACH, J., RICHTER, R., WESSELS, H. J., WYDRO, M., PEKALSKI, M., FARHOUD,
M., KUHL, I., GAISNE, M., BONNEFOY, N., SMEITINK, J. A., LIGHTOWLERS,
R. N. & CHRZANOWSKA-LIGHTOWLERS, Z. M. 2008. The human mitochondrial
ribosome recycling factor is essential for cell viability. Nucleic Acids Res, 36, 5787-99.
ROSSMANITH, W., TULLO, A., POTUSCHAK, T., KARWAN, R. & SBISA, E. 1995.
Human mitochondrial tRNA processing. J Biol Chem, 270, 12885-91.
ROTHBERG, J. M., HINZ, W., REARICK, T. M., SCHULTZ, J., MILESKI, W., DAVEY, M.,
LEAMON, J. H., JOHNSON, K., MILGREW, M. J., EDWARDS, M., HOON, J.,
SIMONS, J. F., MARRAN, D., MYERS, J. W., DAVIDSON, J. F., BRANTING, A.,
NOBILE, J. R., PUC, B. P., LIGHT, D., CLARK, T. A., HUBER, M.,
BRANCIFORTE, J. T., STONER, I. B., CAWLEY, S. E., LYONS, M., FU, Y.,
HOMER, N., SEDOVA, M., MIAO, X., REED, B., SABINA, J., FEIERSTEIN, E.,
SCHORN, M., ALANJARY, M., DIMALANTA, E., DRESSMAN, D., KASINSKAS,
R., SOKOLSKY, T., FIDANZA, J. A., NAMSARAEV, E., MCKERNAN, K. J.,
WILLIAMS, A., ROTH, G. T. & BUSTILLO, J. 2011. An integrated semiconductor
device enabling non-optical genome sequencing. Nature, 475, 348-52.
RUTTER, J., WINGE, D. R. & SCHIFFMAN, J. D. 2010. Succinate dehydrogenase -
Assembly, regulation and role in human disease. Mitochondrion, 10, 393-401.
SANGER, F., NICKLEN, S. & COULSON, A. R. 1977. DNA sequencing with chain-
terminating inhibitors. Proc Natl Acad Sci U S A, 74, 5463-7.
SCALETTAR, B. A., ABNEY, J. R. & HACKENBROCK, C. R. 1991. Dynamics, structure,
and function are coupled in the mitochondrial matrix. Proc Natl Acad Sci U S A, 88,
8057-61.
SCHAPIRA, A. H. 2012. Mitochondrial diseases. Lancet, 379, 1825-34.
SCHLAME, M., REN, M., XU, Y., GREENBERG, M. L. & HALLER, I. 2005. Molecular
symmetry in mitochondrial cardiolipins. Chem Phys Lipids, 138, 38-49.
SHADEL, G. S. & CLAYTON, D. A. 1997. Mitochondrial DNA maintenance in vertebrates.
Annu Rev Biochem, 66, 409-35.
SHARMA, M. R., KOC, E. C., DATTA, P. P., BOOTH, T. M., SPREMULLI, L. L. &
AGRAWAL, R. K. 2003. Structure of the mammalian mitochondrial ribosome reveals
an expanded functional role for its component proteins. Cell, 115, 97-108.
SHEFTEL, A., STEHLING, O. & LILL, R. 2010. Iron-sulfur proteins in health and disease.
Trends Endocrinol Metab, 21, 302-14.

155
SHIFLETT, A. M. & JOHNSON, P. J. 2010. Mitochondrion-related organelles in eukaryotic
protists. Annu Rev Microbiol, 64, 409-29.
SHILOH, Y. 2006. The ATM-mediated DNA-damage response: taking shape. Trends Biochem
Sci, 31, 402-10.
SIMSEK, D., FURDA, A., GAO, Y., ARTUS, J., BRUNET, E., HADJANTONAKIS, A. K.,
VAN HOUTEN, B., SHUMAN, S., MCKINNON, P. J. & JASIN, M. 2011. Crucial
role for DNA ligase III in mitochondria but not in Xrcc1-dependent repair. Nature, 471,
245-8.
SJOSTRAND, F. S. 1953. Electron microscopy of mitochondria and cytoplasmic double
membranes. Nature, 171, 30-2.
SLED, V. D., RUDNITZKY, N. I., HATEFI, Y. & OHNISHI, T. 1994. Thermodynamic
analysis of flavin in mitochondrial NADH:ubiquinone oxidoreductase (complex I).
Biochemistry, 33, 10069-75.
SLESAREV, A. I., STETTER, K. O., LAKE, J. A., GELLERT, M., KRAH, R. &
KOZYAVKIN, S. A. 1993. DNA topoisomerase V is a relative of eukaryotic
topoisomerase I from a hyperthermophilic prokaryote. Nature, 364, 735-7.
SMIRNOVA, E., GRIPARIC, L., SHURLAND, D. L. & VAN DER BLIEK, A. M. 2001.
Dynamin-related protein Drp1 is required for mitochondrial division in mammalian
cells. Mol Biol Cell, 12, 2245-56.
SPELBRINK, J. N. 2010. Functional organization of mammalian mitochondrial DNA in
nucleoids: history, recent developments, and future challenges. IUBMB Life, 62, 19-32.
SPYROU, G., ENMARK, E., MIRANDA-VIZUETE, A. & GUSTAFSSON, J. 1997. Cloning
and expression of a novel mammalian thioredoxin. J Biol Chem, 272, 2936-41.
ST-PIERRE, J., BUCKINGHAM, J. A., ROEBUCK, S. J. & BRAND, M. D. 2002. Topology
of superoxide production from different sites in the mitochondrial electron transport
chain. J Biol Chem, 277, 44784-90.
STIERUM, R. H., DIANOV, G. L. & BOHR, V. A. 1999. Single-nucleotide patch base excision
repair of uracil in DNA by mitochondrial protein extracts. Nucleic Acids Res, 27, 3712-
9.
STUMPF, J. D. & COPELAND, W. C. 2011. Mitochondrial DNA replication and disease:
insights from DNA polymerase gamma mutations. Cell Mol Life Sci, 68, 219-33.
SYKORA, P., CROTEAU, D. L., BOHR, V. A. & WILSON, D. M., 3RD 2011. Aprataxin
localizes to mitochondria and preserves mitochondrial function. Proc Natl Acad Sci U S
A, 108, 7437-42.
SZCZESNY, R. J., WOJCIK, M. A., BOROWSKI, L. S., SZEWCZYK, M. J., SKROK, M. M.,
GOLIK, P. & STEPIEN, P. P. 2013. Yeast and human mitochondrial helicases. Biochim
Biophys Acta.
TAKAMATSU, C., UMEDA, S., OHSATO, T., OHNO, T., ABE, Y., FUKUOH, A.,
SHINAGAWA, H., HAMASAKI, N. & KANG, D. 2002. Regulation of mitochondrial
D-loops by transcription factor A and single-stranded DNA-binding protein. EMBO
Rep, 3, 451-6.

156
TAKASHIMA, H., BOERKOEL, C. F., JOHN, J., SAIFI, G. M., SALIH, M. A. M.,
ARMSTRONG, D., MAO, Y., QUIOCHO, F. A., ROA, B. B., NAKAGAWA, M.,
STOCKTON, D. W. & LUPSKI, J. R. 2002. Mutation of TDP1, encoding a
topoisomerase I-dependent DNA damage repair enzyme, in spinocerebellar ataxia with
axonal neuropathy. Nat Genet, 32, 267-272.
TEMPERLEY, R., RICHTER, R., DENNERLEIN, S., LIGHTOWLERS, R. N. &
CHRZANOWSKA-LIGHTOWLERS, Z. M. 2010. Hungry codons promote
frameshifting in human mitochondrial ribosomes. Science, 327, 301.
THYAGARAJAN, B., PADUA, R. A. & CAMPBELL, C. 1996. Mammalian mitochondria
possess homologous DNA recombination activity. J Biol Chem, 271, 27536-43.
TOVAR, J., LEON-AVILA, G., SANCHEZ, L. B., SUTAK, R., TACHEZY, J., VAN DER
GIEZEN, M., HERNANDEZ, M., MULLER, M. & LUCOCQ, J. M. 2003.
Mitochondrial remnant organelles of Giardia function in iron-sulphur protein
maturation. Nature, 426, 172-6.
TRIFUNOVIC, A., HANSSON, A., WREDENBERG, A., ROVIO, A. T., DUFOUR, E.,
KHVOROSTOV, I., SPELBRINK, J. N., WIBOM, R., JACOBS, H. T. & LARSSON,
N. G. 2005. Somatic mtDNA mutations cause aging phenotypes without affecting
reactive oxygen species production. Proc Natl Acad Sci U S A, 102, 17993-8.
TRIFUNOVIC, A., WREDENBERG, A., FALKENBERG, M., SPELBRINK, J. N., ROVIO, A.
T., BRUDER, C. E., BOHLOOLY, Y. M., GIDLOF, S., OLDFORS, A., WIBOM, R.,
TORNELL, J., JACOBS, H. T. & LARSSON, N. G. 2004. Premature ageing in mice
expressing defective mitochondrial DNA polymerase. Nature, 429, 417-23.
TSE, Y. C., KIRKEGAARD, K. & WANG, J. C. 1980. Covalent bonds between protein and
DNA. Formation of phosphotyrosine linkage between certain DNA topoisomerases and
DNA. J Biol Chem, 255, 5560-5.
TURRENS, J. F. 2003. Mitochondrial formation of reactive oxygen species. J Physiol, 552,
335-44.
VERMULST, M., BIELAS, J. H., KUJOTH, G. C., LADIGES, W. C., RABINOVITCH, P. S.,
PROLLA, T. A. & LOEB, L. A. 2007. Mitochondrial point mutations do not limit the
natural lifespan of mice. Nat Genet, 39, 540-3.
VERMULST, M., BIELAS, J. H. & LOEB, L. A. 2008. Quantification of random mutations in
the mitochondrial genome. Methods, 46, 263-8.
VILLARROYA, M., PRADO, S., ESTEVE, J. M., SORIANO, M. A., AGUADO, C., PEREZ-
MARTINEZ, D., MARTINEZ-FERRANDIS, J. I., YIM, L., VICTOR, V. M.,
CEBOLLA, E., MONTANER, A., KNECHT, E. & ARMENGOD, M. E. 2008.
Characterization of human GTPBP3, a GTP-binding protein involved in mitochondrial
tRNA modification. Mol Cell Biol, 28, 7514-31.
VONGSAMPHANH, R., FORTIER, P. K. & RAMOTAR, D. 2001. Pir1p mediates
translocation of the yeast Apn1p endonuclease into the mitochondria to maintain
genomic stability. Mol Cell Biol, 21, 1647-55.
VOS, S. M., TRETTER, E. M., SCHMIDT, B. H. & BERGER, J. M. 2011. All tangled up: how
cells direct, manage and exploit topoisomerase function. Nat Rev Mol Cell Biol, 12,
827-41.

157
VOULGARIDOU, G. P., ANESTOPOULOS, I., FRANCO, R., PANAYIOTIDIS, M. I. &
PAPPA, A. 2011. DNA damage induced by endogenous aldehydes: current state of
knowledge. Mutat Res, 711, 13-27.
WANG, C. I., WANG, C. L., WANG, C. W., CHEN, C. D., WU, C. C., LIANG, Y., TSAI, Y.
H., CHANG, Y. S., YU, J. S. & YU, C. J. 2011. Importin subunit alpha-2 is identified
as a potential biomarker for non-small cell lung cancer by integration of the cancer cell
secretome and tissue transcriptome. Int J Cancer, 128, 2364-72.
WANG, J. C. 1971. Interaction between DNA and an Escherichia coli protein omega. J Mol
Biol, 55, 523-33.
WATABE, S., HIROI, T., YAMAMOTO, Y., FUJIOKA, Y., HASEGAWA, H., YAGO, N. &
TAKAHASHI, S. Y. 1997. SP-22 is a thioredoxin-dependent peroxide reductase in
mitochondria. Eur J Biochem, 249, 52-60.
WESTBYE, M. P., FEYZI, E., AAS, P. A., VAGBO, C. B., TALSTAD, V. A., KAVLI, B.,
HAGEN, L., SUNDHEIM, O., AKBARI, M., LIABAKK, N. B., SLUPPHAUG, G.,
OTTERLEI, M. & KROKAN, H. E. 2008. Human AlkB homolog 1 is a mitochondrial
protein that demethylates 3-methylcytosine in DNA and RNA. J Biol Chem, 283,
25046-56.
WOLLEN STEEN, K., DOSETH, B., M, P. W., AKBARI, M., KANG, D., FALKENBERG, M.
& SLUPPHAUG, G. 2012. mtSSB may sequester UNG1 at mitochondrial ssDNA and
delay uracil processing until the dsDNA conformation is restored. DNA Repair (Amst),
11, 82-91.
WYATT, M. D. & PITTMAN, D. L. 2006. Methylating agents and DNA repair responses:
Methylated bases and sources of strand breaks. Chem Res Toxicol, 19, 1580-94.
XIAO, W. & SAMSON, L. 1993. In vivo evidence for endogenous DNA alkylation damage as
a source of spontaneous mutation in eukaryotic cells. Proc Natl Acad Sci U S A, 90,
2117-21.
YAKES, F. M. & VAN HOUTEN, B. 1997. Mitochondrial DNA damage is more extensive and
persists longer than nuclear DNA damage in human cells following oxidative stress.
Proc Natl Acad Sci U S A, 94, 514-9.
YANG, D., OYAIZU, Y., OYAIZU, H., OLSEN, G. J. & WOESE, C. R. 1985. Mitochondrial
origins. Proc Natl Acad Sci U S A, 82, 4443-7.
YANG, K. S., KANG, S. W., WOO, H. A., HWANG, S. C., CHAE, H. Z., KIM, K. & RHEE,
S. G. 2002. Inactivation of human peroxiredoxin I during catalysis as the result of the
oxidation of the catalytic site cysteine to cysteine-sulfinic acid. J Biol Chem, 277,
38029-36.
YANG, S. W., BURGIN, A. B., JR., HUIZENGA, B. N., ROBERTSON, C. A., YAO, K. C. &
NASH, H. A. 1996. A eukaryotic enzyme that can disjoin dead-end covalent complexes
between DNA and type I topoisomerases. Proc Natl Acad Sci U S A, 93, 11534-9.
YASUKAWA, T., REYES, A., CLUETT, T. J., YANG, M. Y., BOWMAKER, M., JACOBS,
H. T. & HOLT, I. J. 2006. Replication of vertebrate mitochondrial DNA entails
transient ribonucleotide incorporation throughout the lagging strand. EMBO J, 25,
5358-71.
YOSHIKAWA, S., MURAMOTO, K. & SHINZAWA-ITOH, K. 2012. Reaction mechanism of
mammalian mitochondrial cytochrome c oxidase. Adv Exp Med Biol, 748, 215-36.

158
YOULE, R. J. & VAN DER BLIEK, A. M. 2012. Mitochondrial fission, fusion, and stress.
Science, 337, 1062-5.
ZENG, Z., SHARMA, A., JU, L., MURAI, J., UMANS, L., VERMEIRE, L., POMMIER, Y.,
TAKEDA, S., HUYLEBROECK, D., CALDECOTT, K. W. & EL-KHAMISY, S. F.
2012. TDP2 promotes repair of topoisomerase I-mediated DNA damage in the absence
of TDP1. Nucleic Acids Res.
ZHANG, H., BARCELO, J. M., LEE, B., KOHLHAGEN, G., ZIMONJIC, D. B., POPESCU,
N. C. & POMMIER, Y. 2001. Human mitochondrial topoisomerase I. Proc Natl Acad
Sci U S A, 98, 10608-13.
ZHANG, H., MENG, L. H. & POMMIER, Y. 2007. Mitochondrial topoisomerases and
alternative splicing of the human TOP1mt gene. Biochimie, 89, 474-81.
ZHANG, H. & POMMIER, Y. 2008. Mitochondrial topoisomerase I sites in the regulatory D-
loop region of mitochondrial DNA. Biochemistry, 47, 11196-203.
ZHAO, X., LEON, I. R., BAK, S., MOGENSEN, M., WRZESINSKI, K., HOJLUND, K. &
JENSEN, O. N. 2011. Phosphoproteome analysis of functional mitochondria isolated
from resting human muscle reveals extensive phosphorylation of inner membrane
protein complexes and enzymes. Mol Cell Proteomics, 10, M110 000299.
ZHOU, T., LEE, J. W., TATAVARTHI, H., LUPSKI, J. R., VALERIE, K. & POVIRK, L. F.
2005. Deficiency in 3'-phosphoglycolate processing in human cells with a hereditary
mutation in tyrosyl-DNA phosphodiesterase (TDP1). Nucleic Acids Res, 33, 289-97.