two phases of deindustrialization policies in istanbul
TRANSCRIPT
186
Marmara İktisat Dergisi • Journal of Research in Economics • Cilt: 2 / Issue • Sayı: 2 Ekim • October 2018 • ss/pp. 186-201
ISSN: 2528-8547 • DOI: 10.24954/JORE.2018.24
TWO PHASES OF DEINDUSTRIALIZATION POLICIES IN ISTANBUL*
1
İSTANBUL’DA SANAYİSİZLEŞME POLİTİKALARININ İKİ SAFHASI
A. Suut DOĞRUEL2
* Fatma DOĞRUEL3
**
Abstract
The city of Istanbul is the economic and cultural heart of Turkey and is one of the oldest industrial regions in the country. However, its share of the manufacturing sector in the Turkish economy has been steadily declining since the 1980s. It is possible to define two different phases of deindustrialization during the last several decades. Discouraging new manufacturing investments was the goal of the first phase. During the second phase, priority was given to financial and real estate activities, as favored alternatives to manufacturing. The aim of the paper is to trace the effects of this policy on the structure of the manufacturing sector in Istanbul over the course of deindustrialization in Istanbul. Although Istanbul is still the primary center of Turkish manufacturing, the results show that the deindustrialization policies reduced the share of Istanbul in the Turkish manufacturing sector while at the same time deteriorating its quality.Keywords: Deindustrialization, Productivity Changes, Firm Size, Shift-Share Analysis, Istanbul
JEL Classification: O18, R12, R38
Öz
İstanbul kenti Türkiye’nin ekonomik ve kültürel kalbi ve ülkenin en eski sanayi bölgelerinden biridir. Ancak, İstanbul’daki imalat sanayinin Türkiye ekonomisindeki payı 1980 yılından bu yana istikrarlı bir şekilde düşmektedir. Son dönemler için iki farklı sanayisizleşme safhası tanımlamak mümkündür. Yeni imalat sanayi yatırımlarının cesaretini kırmak ilk safhanın amacıydı. İkinci safha, imalat sanayine alternatif olarak öncelik finans ve gayrı menkul faaliyetlerine verildi. Makalenin amacı, İstanbul’un sanayisizleşme sürecinde bu politikanın İstanbul imalat sanayinin yapısı üzerindeki etkilerini izlemektir. İstanbul hala Türk imalat sanayinin merkezi olmakla birlikte sonuçlar sanayisizleşme politikalarının İstanbul’un Türk imalat sektörü içindeki payını azalttığını ve aynı zamanda kalitesini bozduğunu göstermektedir.
* The authors would like to thank Yasemin Özerkek, Eylül Doğruel, and the anonymous reviewers for their comments and contributions. The authors would also like to thank the Marmara University Scientific Research Committee for its financial support (Project No: SOS-D-120.514.0194).
** Marmara University, E-mail: [email protected]*** Marmara University, E-mail: [email protected]
Two Phases Of Deındustrıalızatıon Polıcıes In Istanbul
187
Anahtar Kelimeler: Sanayisizleşme, Verimlilik Değişmesi, Firma Büyüklüğü, Shift-Share Analizi, İstanbul.
JEL Sınıflandırması: O18, R12, R38
1. Introduction
Istanbul was the capital city of the Ottoman Empire for more than four centuries. It has also been the cultural, commercial, and industrial center of the country. Historically, other coastal provinces, like Izmir (situated in the west of the Aegean region) and Adana (in the east of the Mediterranean region), along with their hinterlands, were other important economic centers. However, despite their rich industrial cultures, the weights of Istanbul and Adana have declined gradually since 1980.1 Doğruel and Doğruel (2012) showed that the shift in government industrialization policy from import substitution to export orientation brought about a reallocation of manufacturing activities after 1980. At the same time, privatization policies reordered the distribution of those activities, particularly in lagging regions (Doğruel and Doğruel, 2011).
In addition to these macroeconomic policies, Istanbul has seen its economic structure targeted by a series of specific government policies. The decline in the share of Istanbul can also be attributed to the deindustrialization policies implemented over the last several decades. The government’s deindustrialization policies before the 2000s first aimed to remove manufacturing facilities from Istanbul’s residential areas and then to persuade such operations to move out of the city altogether. The idea was to have them relocate to the regions east of (Kocaeli and Bursa) and west of (Tekirdağ) Istanbul. Toward this end, not only new investments, but also replacement and modernization investments were restricted in the manufacturing sector.2 During the 2000s, the policy was redesigned to encourage Istanbul’s financial and real estate sectors, replacing manufacturing. We define the policies to remove industrial activities from Istanbul during 1980-2000 as the first phase, and the policies that favored the growth of the financial and real estate sectors in Istanbul after 2000 as the second phase.
The aim of the paper is to trace the effects of these policies on the structure of the manufacturing sector during the course of deindustrialization in Istanbul. We focus on the share of the manufacturing sector, firm size, productivity changes, and the change in the composition of the manufacturing sector in Istanbul. The paper emphasizes that the two phases of deindustrialization
1 After the 1980s, over the next two decades, the regional share of manufacturing in total Turkish manufacturing decreased from 30% to 27% in Istanbul, while Adana’s dropped from 6% to 4%, as the averages of 1983-1985 and 1998-2000, respectively (Doğruel and Doğruel, 2011: 10, Table 1). During 2003-2009, the worsening trend continued for these two regions (Doğruel, 2013, Figure 4). The drop in the share of Adana can be partly explained by the shift of textile activities from Adana to new emerging industrial centers: in 1987, Adana (TR62) was the second most important center in Turkey of textile production, in terms of value added. However, within the textile sector, its rank had plummeted to sixth place by 2000 (Doğruel and Doğruel, 2006, Table 1).
2 Following Feldstein and Foot (1971), the term “replacement and modernization investments” is used for investments that do not increase capacity significantly.
A. Suut DOĞRUEL • Fatma DOĞRUEL
188
policies created different conditions for the growth path of the manufacturing sector in Istanbul: strengthening the centrifugal forces that were acting upon this sector was one goal of the first phase; building up the financial and real estate sectors by enhancing their centripetal characteristics was the second phase’s focus. Descriptive statistics employed in the paper show that the share of Istanbul’s manufacturing sector in the national economy fell markedly over the last three decades, and its very structure has evolved towards the concentration of small-sized low-technology group activities with relatively higher productivity.
In order to define deindustrialization policies referring to centrifugal and centripetal forces, the following section outlines the theoretical discussions on regional economics as it relates to these concepts. The third section briefly examines the policies implemented since 1980 in light of the discussion presented in the second section. The fourth section presents main labor growth trends in Istanbul and the surrounding regions. The dynamics of changes in regional growth are examined by employing shift-share analysis, and the results are discussed in the fifth section. The sixth section considers how the industrial structure of Istanbul was transformed during the two phases of the deindustrialization policies. The last section concludes the paper. Basic properties of the regional data used in the paper are summarized in Appendix 1.
2. Theoretical Background
What are the main characteristics of a geographic concentration? How can we build up a link between deindustrialization policy and the forces affecting the geographic concentration of economic activities? To answer these questions, it is necessary to refer to the vast literature on the concepts of geographical distribution of industries and the factors affecting the location decision of an industry. Industrial organization theory, regional science, and urbanization are the main fields in the literature that are of interest. Trade theory is also useful in this regard. Therefore, from the perspective of developing countries, this short theoretical section intends to clarify location decisions, which are important in the spatial concentration or agglomeration of economic activities.
The mechanism that underlies the location decision of a firm has been an object of curiosity for economic theorists since the 19th century. Johann Heinrich von Thünen and Alfred Marshall are two prominent contributors to this field. Although Von Thünen was a pioneer in this area, his works have not attracted the attention of economists for a long time. One of his early works was “on the theory of rents, transport costs, and land use” (Clark, 1967: 370), which was published in 1827. Samuelson (2009: xii) states that “While deserving notice and praise from his contemporaries, Thünen’s work never really received the recognition it deserved.” The concept of transport cost, which is critical in new economic geography, was ignored by Thünen’s contemporaries. Later, the concept became a cornerstone of the field. The location decision of an industry is also related to the concept of externality. Marshall ([1890], 1920, Chapter 10) described the economic environment and gave his observations on the various dimensions of the
Two Phases Of Deındustrıalızatıon Polıcıes In Istanbul
189
location issue. He discussed the “… modern forces on the geographical distribution of industries (Marshall, [1890] 1920: 21)” for both the demand and supply sides.
For a long period following these two remarkable contributions, the mainstream literature ignored spatial issues in models. Neoclassical market theories were grounded on a model without space and time until Krugman’s 1991 work, which added a spatial dimension. The question was, in his own words, “Why and when does manufacturing become concentrated in a few regions, leaving others relatively undeveloped?” (Krugman, 1991: 484). Krugman (1991) is based on Von Thünen’s concept of “transportation cost,” Marshall’s “externalities,” and many other contributions to the subject of location decisions. Although it was designed under many restricted assumptions, at least Krugman’s was the first attempt to model spatial economics with an increasing return to scale.
At this point, we should say that economic activities may not only concentrate in a geographic area, but they may also disperse under the effects of different forces. Fujita and Thisse (1996: 340) explain geographical concentration and dispersion of economic activities as the following: “Intuitively, the equilibrium spatial configuration of economic activities can be viewed as the outcome of a process involving two opposing types of forces, that is, agglomeration (or centripetal) forces and dispersion (or centrifugal) forces.”3 The centripetal forces are defined by “the three classic Marshallian sources of external economies” in Krugman (1999: 91). These sources are market size, abundant labor market, and “pure external economies” (Krugman, 1999: 91). Local concentration of economic activities makes possible “pure external economies through information spillovers” (Krugman, 1999: 91). The centrifugal forces are explained by the following excerpt from Krugman (1991: 91):
“Immobile factors-certainly land and natural resources, and in an international context people as well-militate against concentration of production, both from the supply side (some production must go to where workers are) and from the demand side (dispersed factors create a dispersed market, and some production will have an incentive to locate close to consumers). Concentrations of economic activity increase the demand for local land, driving up land rents and so discouraging further concentration. And concentrations of activity can generate more or less pure external diseconomies such as congestion.”
Centripetal and centrifugal forces should not be taken in a static sense. For example, Masahisa Fujita and Jacques-Francois Thisse focus on the effects of spatial concentration in the land and labor markets and explain how a concentration may turn from an agglomeration force into a dispersion force:
“The centrifugal force is less straightforward and goes through the land and labor markets. The clustering of many firms in a single area increases the average commuting distance for their workers, which, in turn, increases the wage rate and land rent in the area surrounding the cluster.
3 Fujita and Thisse (2002: 5-11) provide a sample of related literature about the reasons for observing agglomerations.
A. Suut DOĞRUEL • Fatma DOĞRUEL
190
Such high wages and land rents tend to discourage further agglomeration of firms in the same area” (Fujita and Thisse, 2002: 173).
Both centripetal and centrifugal forces play crucial roles in the understanding of what affects the location decision of industries.4 However, it is also necessary to define the geographic units to explain the concentration of economic activities. The geographical units may be defined in various forms, from industrial district to metropolitan area. By referring to Marshall’s external economies in space, Audretsch et al. (2007) define three types of agglomeration: “industrial district,” “industrial agglomeration,” and “urban agglomeration.” Audretsch et al. (2007: 12) stress that urban agglomerations “… are not dominated by one manufacturing industry but are, instead, historically grown centers rich with cultural life and other amenities that support a certain lifestyle.”
Appendix 2 lists a subset of the 30 largest cities in the world that are also the most populous in their countries, with several basic population indicators.5 Istanbul, as the 15th largest city in the world, holds 0.25 % of the urban population of Turkey. The ratio of Istanbul’s population to that of the second largest city in Turkey is about 3. These figures show Istanbul to be a typical example of an urban agglomeration. However, Istanbul differs from Cairo, Buenos Aires, Kinshasa, Dhaka, and Mexico City in that their urban populations are mostly concentrated in that primary city. By contrast, in the case of Turkey, the urban population is divided among Istanbul and several other large cities.
When studying the changes in industrial locations in developing countries, it is first necessary to identify the link between industrialization policy and the forces affecting geographical concentration. As part of this, we expect deindustrialization policies to have produced effects that are similar to those of the centrifugal forces. Such effects can present themselves either directly or indirectly. Placing official restrictions on land use (as part of deindustrialization policy) may increase land rents. However, the regions in a country are often mutually interdependent, and a disruption of the environment affecting the location decision of industries in one region may directly or indirectly affect others elsewhere. To clarify these issues, the two phases of the deindustrialization policies pursued by the government are reviewed in the following section.
3. Deindustrialization Policy in Istanbul
For more than a century, Istanbul was the leading and ever-growing industrial center of Turkey. During the last half century, several planning attempts were made to control the city’s chaotic expansion. The magnetic pull (the centripetal forces) generated by the concentration of
4 The discussion in this section focuses only on the location decisions of industries and thus those of firms. High wages may attract the labor force, and high house rents/prices may push people out of an area, which may be an outcome of the industrial concentration. Glaeser (2007) explains both “the location decisions of people and firms.”
5 Since the term “urban agglomeration” implies various dimensions of city life, it is possible to expect that high population may attract cultural richness as well as a concentration of diversified economic activities.
Two Phases Of Deındustrıalızatıon Polıcıes In Istanbul
191
industrial activities in Istanbul was always a feature of city planning. Initially, the focus was to reorganize industrial localizations within the province; later it turned into forcing the industry to move out of the region. The first recorded urban-development plan for Istanbul goes back to 1933 (Duranay et al., 1972).6 The“1966 Sanayi Nazım Imar Planı” (1966 Development Plan for Regulating Industry) marks the first attempt to organize industrial activities in Istanbul (Yüzer and Giritlioğlu, 2003). The East Marmara and Thrace regions were designated as the new industrial areas to be developed in the plan.7
The “1980 Metropoliten Alan Nazım Planı” (1980 Metropolitan Area Development Plan) was the next official plan to organize the industry in Istanbul (Yüzer and Giritlioğlu, 2003). This Plan called for the deindustrialization of the city, starting with many restrictions on industrial production. The justification given for this new policy was “saving the city from environmental pollution.”
The 1980 Plan is what gave momentum to anti-industry sentiment, and comprehensive policy implementation began in Istanbul soon afterward.8 After 1980, the manufacturing sector was prodded to move east (to Kocaeli and Bursa) and west (to Tekirdağ), a drive that has gone on for three decades. However, in spite of the government’s tenacity in carrying out its deindustrialization crusade, Istanbul still remains the top industrial location in the country.
A third plan was unveiled in 1995 (the Metropolitan Area Sub-Region Master Plan) (IBB, 1995). It was consistent with the special priorities of the Seventh Five-Year Development Plan (1996-2000), which aimed to reshape industrial locations both within and across the provinces.9 The last plan was launched in 2009 (1:100,000 Istanbul Environmental Plan Report) (IBB, 2009). The focus of this plan was not only Istanbul, but also the neighboring provinces, in order to ensure the “environmental, social, and economic” sustainability of Istanbul (IBB, 1995: 509). However, facts on the ground soon made this plan obsolete (“caduc”); the new view of the development path of the city had taken a whole new direction: now the politicians and other decision-makers switched their support away from industrial development and toward finance and real estate, which now appeared to be the new engines of Turkish economic development for the 21st century. Revisions in national economic targets also affected the policies dealing with Istanbul.
Although it did not show up in writing, real estate and financial-sector activities were tacitly encouraged by the government in the wake of the 2001 crisis. Implicitly targeting alternative sectors
6 Bilsel (2007) quotes Özler and Prost (2007) on the planning history of Istanbul and also states that the book follows the chronological order of Duranay et al. (1972).
7 Yüzer and Giritlioğlu (2003) quote from Zaimoğlu (1971: 177-194), and they also refer to İSO (1981).8 Planlama.Org (an Internet portal) also refers to this date as the beginning of deindustrialization policy.http://www.
planlama.org/index2.php?option=com_content&task=view&id=1522&pop=1&page=0&Itemid=93 Accessed on December 23, 2008.
9 Five-year plans are the main guiding documents to design national macro-level economic policies. The Seventh Five-Year Development Plan states that in order to induce industrial activities to move out of Istanbul, investment incentives will be restricted in some sectors, and the industrial concentration in and around Istanbul will be reduced (DPT, 1995: 185).
A. Suut DOĞRUEL • Fatma DOĞRUEL
192
to industry marks the end of the first phase of Istanbul’s deindustrialization and the beginning of its second phase. The “writing” came with formal regulations in 2009, on establishing a financial center in Istanbul, following a long period in which financial institutions based in Ankara had been “advised” to relocate to Istanbul. The headquarters of several of Turkey’s leading banks were among this group.10 This, in turn, encouraged the construction activities, and indirectly stimulated the real estate sector there.
The new strategy to shape the future of Istanbul is called “the Istanbul International Financial Center Strategy and Action Plan” (Official Gazette, 2009). The 2010-2013 Istanbul Region Plan was approved by the Secretary of the State Planning Organization on December 1, 2010. The ultimate goal was to transform the city into one of “the top 20 financial centers in the world” (ARUP, undated).11 This is the new phase of deindustrialization in Istanbul, which “… will become a major business district serving many banks, autonomous public institutions, multi-national companies, and their related back offices and service firms” (ARUP, undated). The new Masterplan covers “…a combination of services, such as geotechnical, infrastructural, structural, mechanical, electrical, transportation, sustainability, ICT, and security-design services” (ARUP).
On the location decisions of the economic actors, Thisse (2014: 806) states that “… the need to interact with others plays the role of a centripetal/agglomeration force, whereas competition for land acts as a centrifugal/dispersion force.” Based on Thisse and the brief summary above of the deindustrialization attempts in Istanbul, we can state that the first phase of the policy decelerated the agglomeration effect (i.e., weakened a centripetal force), whereas the second phase increased the dispersion force (the centrifugal force).
4. Industrial Growth in Istanbul
This section focuses on the industrial growth patterns of Istanbul and its neighboring regions by employing a labor growth indicator. The regions are Bursa (TR41), Kocaeli (TR42), and Tekirdağ (TR21).
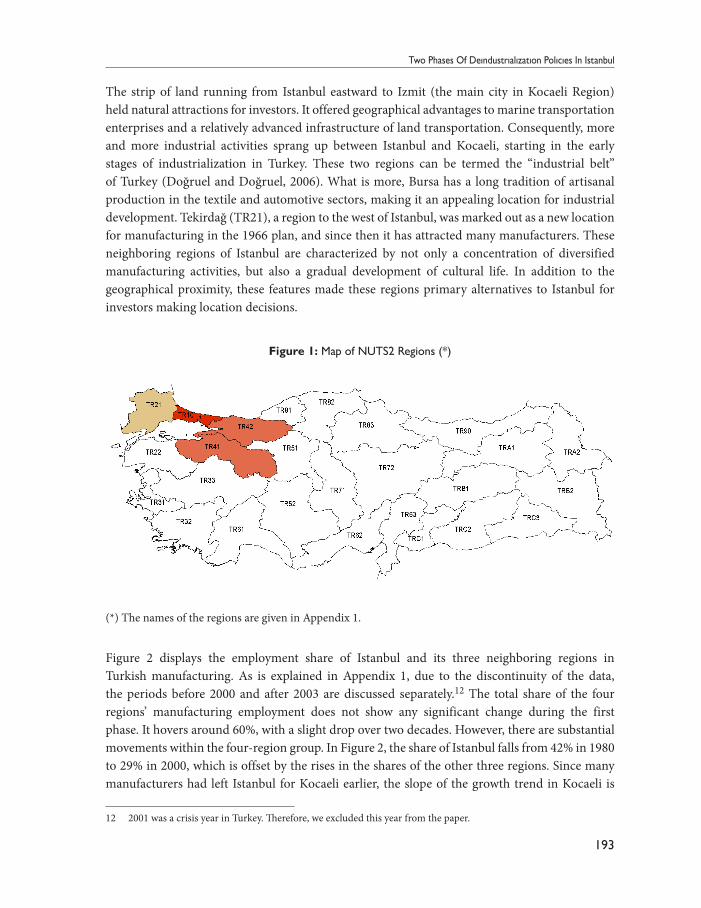
The Map of 26 NUTS2 (Level-2) regions is given in Figure 1. When portraying the share that various regions account for in Turkish manufacturing employment, we may classify the regions into four groups: the industrial zones, the hinterlands and emerging regions, the minor industrial regions, and the poorly industrialized regions (Doğruel and Doğruel, 2011). The industrial zones are Istanbul (TR10), Izmir (TR31), Bursa (TR41), Kocaeli (TR42), and Adana (TR62). Bursa and Kocaeli are neighboring regions of Istanbul.
10 For example, the headquarters of T.C. Ziraat Bank, Halkbank, and Vakıfbank were moved to Istanbul. Türkiye İş Bankası had done the same earlier. The government is also planning to relocate the headquarter of the Central Bank of the Republic of Turkey.
11 Accessed on May 30, 2014.
Two Phases Of Deındustrıalızatıon Polıcıes In Istanbul
193
The strip of land running from Istanbul eastward to Izmit (the main city in Kocaeli Region) held natural attractions for investors. It offered geographical advantages to marine transportation enterprises and a relatively advanced infrastructure of land transportation. Consequently, more and more industrial activities sprang up between Istanbul and Kocaeli, starting in the early stages of industrialization in Turkey. These two regions can be termed the “industrial belt” of Turkey (Doğruel and Doğruel, 2006). What is more, Bursa has a long tradition of artisanal production in the textile and automotive sectors, making it an appealing location for industrial development. Tekirdağ (TR21), a region to the west of Istanbul, was marked out as a new location for manufacturing in the 1966 plan, and since then it has attracted many manufacturers. These neighboring regions of Istanbul are characterized by not only a concentration of diversified manufacturing activities, but also a gradual development of cultural life. In addition to the geographical proximity, these features made these regions primary alternatives to Istanbul for investors making location decisions.
Figure 1: Map of NUTS2 Regions (*)
(*) The names of the regions are given in Appendix 1.
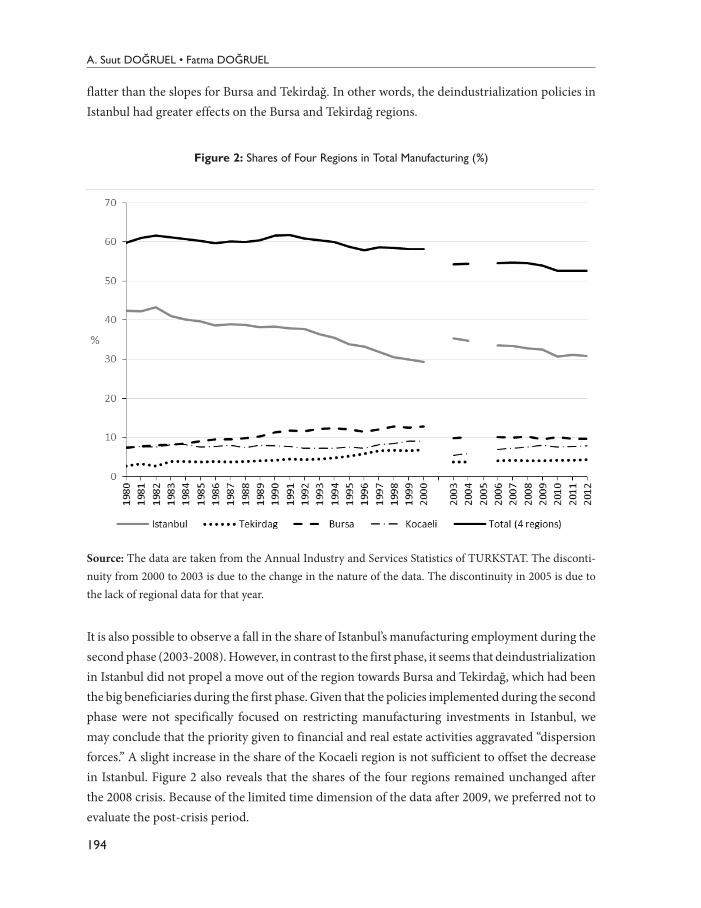
Figure 2 displays the employment share of Istanbul and its three neighboring regions in Turkish manufacturing. As is explained in Appendix 1, due to the discontinuity of the data, the periods before 2000 and after 2003 are discussed separately.12 The total share of the four regions’ manufacturing employment does not show any significant change during the first phase. It hovers around 60%, with a slight drop over two decades. However, there are substantial movements within the four-region group. In Figure 2, the share of Istanbul falls from 42% in 1980 to 29% in 2000, which is offset by the rises in the shares of the other three regions. Since many manufacturers had left Istanbul for Kocaeli earlier, the slope of the growth trend in Kocaeli is
12 2001 was a crisis year in Turkey. Therefore, we excluded this year from the paper.
A. Suut DOĞRUEL • Fatma DOĞRUEL
194
flatter than the slopes for Bursa and Tekirdağ. In other words, the deindustrialization policies in Istanbul had greater effects on the Bursa and Tekirdağ regions.
Figure 2: Shares of Four Regions in Total Manufacturing (%)
Source: The data are taken from the Annual Industry and Services Statistics of TURKSTAT. The disconti-nuity from 2000 to 2003 is due to the change in the nature of the data. The discontinuity in 2005 is due to the lack of regional data for that year.
It is also possible to observe a fall in the share of Istanbul’s manufacturing employment during the second phase (2003-2008). However, in contrast to the first phase, it seems that deindustrialization in Istanbul did not propel a move out of the region towards Bursa and Tekirdağ, which had been the big beneficiaries during the first phase. Given that the policies implemented during the second phase were not specifically focused on restricting manufacturing investments in Istanbul, we may conclude that the priority given to financial and real estate activities aggravated “dispersion forces.” A slight increase in the share of the Kocaeli region is not sufficient to offset the decrease in Istanbul. Figure 2 also reveals that the shares of the four regions remained unchanged after the 2008 crisis. Because of the limited time dimension of the data after 2009, we preferred not to evaluate the post-crisis period.
Two Phases Of Deındustrıalızatıon Polıcıes In Istanbul
195
It should be noted that the discussions above do not ignore the effects of the changes in the global economic order and macro-level economic policies on the country’s manufacturing sector. We are simply emphasizing that the policies put into practice during the first and second phases of deindustrialization contributed to the restructuring of the manufacturing sector in Istanbul. The data also show that the changes in the manufacturing sector in Istanbul indirectly affected manufacturing activities in the neighboring regions.
5. Decomposition of Industrial Growth in Istanbul
In this section, we present the decomposition of the growth in manufacturing employment in the Istanbul region over the relevant period. For the first phase (1980-2000), when the policies were designed to push industrial activities out of the city, we focused only on this sector. These policies also indirectly affected the neighboring regions. Therefore, our decomposition of industrial growth covers not only Istanbul but also those regions. Given that the policy during this second phase was to foster alternative economic activities to manufacturing in Istanbul, our analyses cover all sectors for the period 2003-2008. We did not cover the neighboring regions for this period in view of the absence of specifically industry-expelling measures in the government policy during this time.
We used the shift-share approach in order to decompose the manufacturing employment growth in Istanbul. Traditional shift-share analysis quantifies the components of regional growth. The components of the regional growth (GR) rate consist of “the national growth effect” (NGR), “the industry mix effect” (IME), and “the competitive effect” (CE):13
GR=NGR + IME + CE
NGR shows what would happen if the region grew at the national growth rate. Therefore, the deviation from national growth is the sum of IME and CE:
GR – NGR = IME + CE
The industry mix effect (IME) shows the effects of the initial composition of the sectors: the IME will be positive if fast-growing sectors initially dominate the region. Changes in the composition of the sectors are captured by the competitive effect (CE). A positive sign for the competitive effect indicates that there is a shift from slow-growing sectors to fast-growing sectors in the region.
The regional growth of region i for the period of [0, T] is calculated as follows:
13 The shift-share analysis is frequently used, although it is a simple quantitative spatial technique. Hoover and Giarratani (1999, Appendix 12-1) assert that the first use of the technique appears in Creamer (1943).
However, the landmark text was Perloff et al. (1960), as stated by Riefler (1984) and Hoover and Giarratani (1999, Appendix 12-1).
A. Suut DOĞRUEL • Fatma DOĞRUEL
196
where is the number of employed workers in sector j in region i. The national growth effect (NGR) of region i is identical to the national growth for the period of [0, T].
The industry mix effect (IME) of region i shows what would result if the sectors in region i grew at the national sector’s growth rate while holding the initial sectoral composition unchanged:
where the share of sector j in region i in the initial year 0 is
and the national growth rate of sector j is
The competitive effect (CE) is calculated as the residual:
CEi = GRi – NGRi– IMEi
The traditional shift-share analysis is not an appropriate tool when the time period is not smooth (i.e., during a crisis or other major change) or when there are key differences between national and regional growth rates (Barff and Knight, 2006). The dynamic shift-share reduces the effect of unexpected events or changes in the regional economy.14 It was not logical to assume that the development of the manufacturing sector in Istanbul followed a smooth path during the 1980-2000 period. Therefore, we needed to add a dynamic dimension to the analysis of the first phase. To this end, we evaluated the growth components for moving five-year periods instead of the entire period.
In addition to the direct effects of the deindustrialization policies on the manufacturing sector in Istanbul during the first phase, these policies had indirect effects on the neighboring regions due to the locational proximity. The reallocation of the manufacturing sector within the four regions presented in Figure 2 supports this comment. Consequently, the shift-share analysis is applied to four regions separately in order to compare the structure of the manufacturing growth in these regions.
14 A detailed version of dynamic procedure is defined in Harris et al. (1994, pp. 6-8).
Two Phases Of Deındustrıalızatıon Polıcıes In Istanbul
197
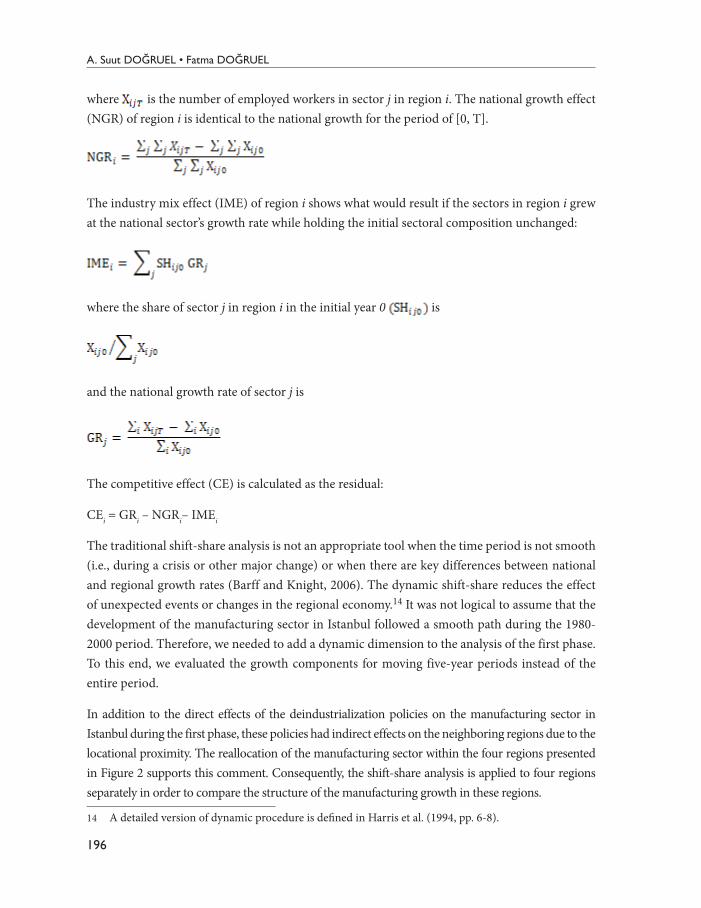
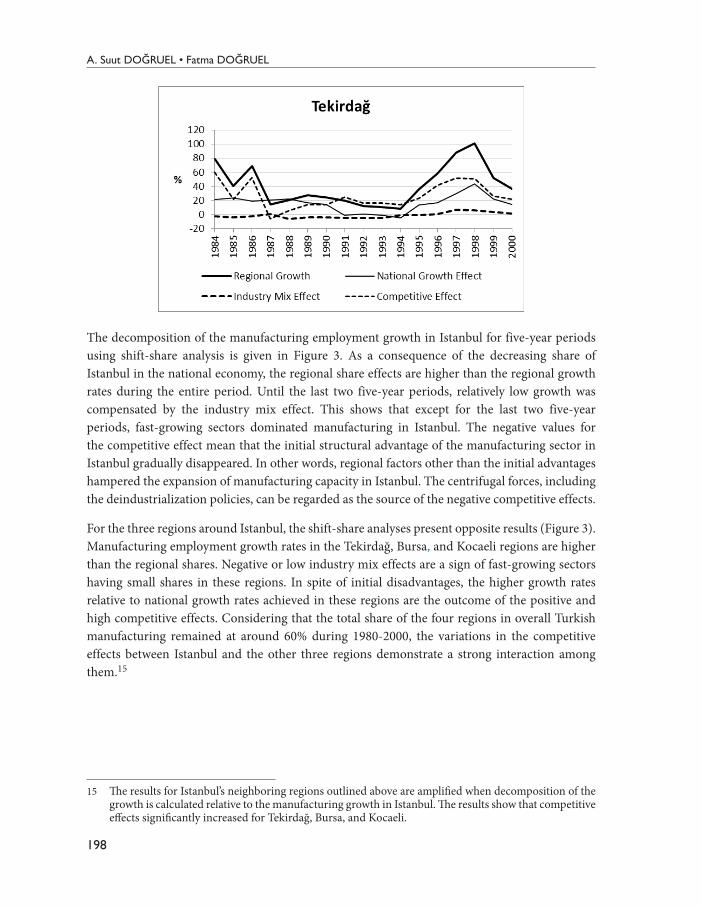
Figure 3: Decomposition of Manufacturing Growth: 1980-2000
A. Suut DOĞRUEL • Fatma DOĞRUEL
198
The decomposition of the manufacturing employment growth in Istanbul for five-year periods using shift-share analysis is given in Figure 3. As a consequence of the decreasing share of Istanbul in the national economy, the regional share effects are higher than the regional growth rates during the entire period. Until the last two five-year periods, relatively low growth was compensated by the industry mix effect. This shows that except for the last two five-year periods, fast-growing sectors dominated manufacturing in Istanbul. The negative values for the competitive effect mean that the initial structural advantage of the manufacturing sector in Istanbul gradually disappeared. In other words, regional factors other than the initial advantages hampered the expansion of manufacturing capacity in Istanbul. The centrifugal forces, including the deindustrialization policies, can be regarded as the source of the negative competitive effects.
For the three regions around Istanbul, the shift-share analyses present opposite results (Figure 3). Manufacturing employment growth rates in the Tekirdağ, Bursa, and Kocaeli regions are higher than the regional shares. Negative or low industry mix effects are a sign of fast-growing sectors having small shares in these regions. In spite of initial disadvantages, the higher growth rates relative to national growth rates achieved in these regions are the outcome of the positive and high competitive effects. Considering that the total share of the four regions in overall Turkish manufacturing remained at around 60% during 1980-2000, the variations in the competitive effects between Istanbul and the other three regions demonstrate a strong interaction among them.15
15 The results for Istanbul’s neighboring regions outlined above are amplified when decomposition of the growth is calculated relative to the manufacturing growth in Istanbul. The results show that competitive effects significantly increased for Tekirdağ, Bursa, and Kocaeli.
Two Phases Of Deındustrıalızatıon Polıcıes In Istanbul
199
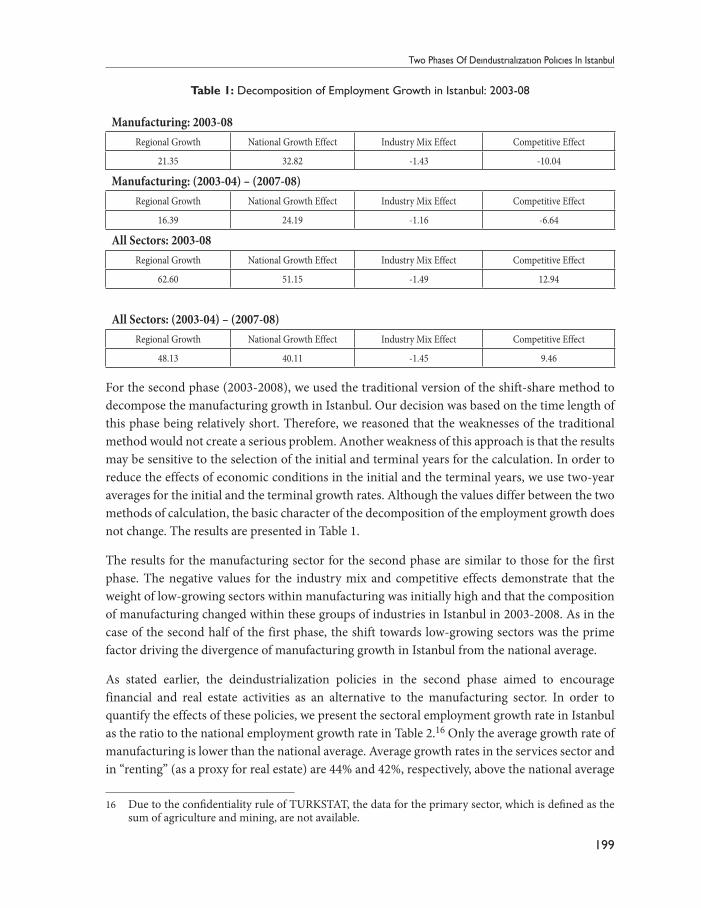
Table 1: Decomposition of Employment Growth in Istanbul: 2003-08
Manufacturing: 2003-08Regional Growth National Growth Effect Industry Mix Effect Competitive Effect
21.35 32.82 -1.43 -10.04
Manufacturing: (2003-04) – (2007-08)Regional Growth National Growth Effect Industry Mix Effect Competitive Effect
16.39 24.19 -1.16 -6.64
All Sectors: 2003-08Regional Growth National Growth Effect Industry Mix Effect Competitive Effect
62.60 51.15 -1.49 12.94
All Sectors: (2003-04) – (2007-08)Regional Growth National Growth Effect Industry Mix Effect Competitive Effect
48.13 40.11 -1.45 9.46
For the second phase (2003-2008), we used the traditional version of the shift-share method to decompose the manufacturing growth in Istanbul. Our decision was based on the time length of this phase being relatively short. Therefore, we reasoned that the weaknesses of the traditional method would not create a serious problem. Another weakness of this approach is that the results may be sensitive to the selection of the initial and terminal years for the calculation. In order to reduce the effects of economic conditions in the initial and the terminal years, we use two-year averages for the initial and the terminal growth rates. Although the values differ between the two methods of calculation, the basic character of the decomposition of the employment growth does not change. The results are presented in Table 1.
The results for the manufacturing sector for the second phase are similar to those for the first phase. The negative values for the industry mix and competitive effects demonstrate that the weight of low-growing sectors within manufacturing was initially high and that the composition of manufacturing changed within these groups of industries in Istanbul in 2003-2008. As in the case of the second half of the first phase, the shift towards low-growing sectors was the prime factor driving the divergence of manufacturing growth in Istanbul from the national average.
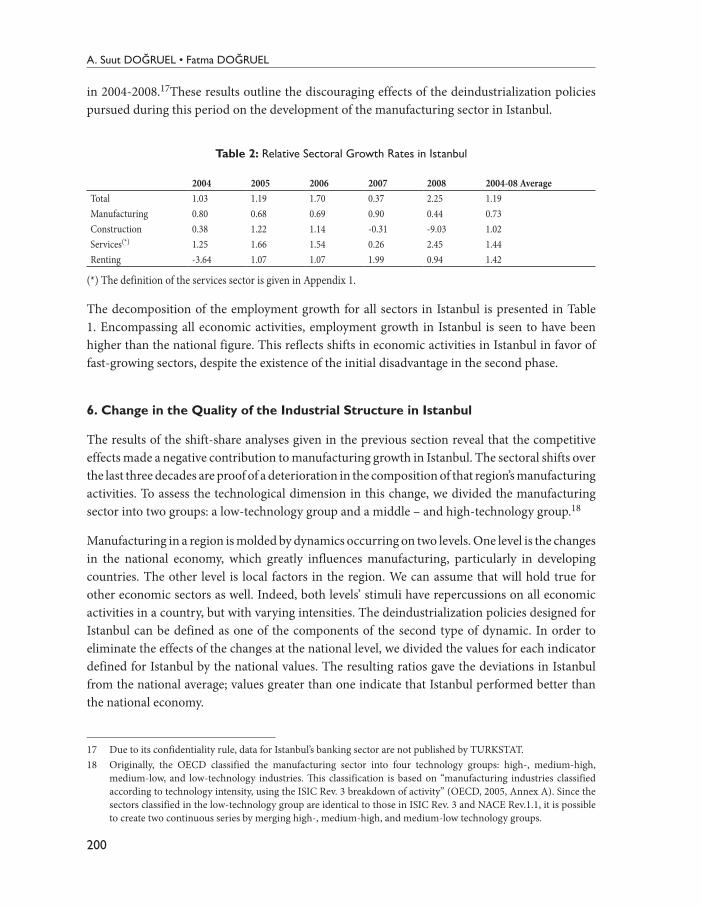
As stated earlier, the deindustrialization policies in the second phase aimed to encourage financial and real estate activities as an alternative to the manufacturing sector. In order to quantify the effects of these policies, we present the sectoral employment growth rate in Istanbul as the ratio to the national employment growth rate in Table 2.16 Only the average growth rate of manufacturing is lower than the national average. Average growth rates in the services sector and in “renting” (as a proxy for real estate) are 44% and 42%, respectively, above the national average
16 Due to the confidentiality rule of TURKSTAT, the data for the primary sector, which is defined as the sum of agriculture and mining, are not available.
A. Suut DOĞRUEL • Fatma DOĞRUEL
200
in 2004-2008.17These results outline the discouraging effects of the deindustrialization policies pursued during this period on the development of the manufacturing sector in Istanbul.
Table 2: Relative Sectoral Growth Rates in Istanbul
2004 2005 2006 2007 2008 2004-08 AverageTotal 1.03 1.19 1.70 0.37 2.25 1.19Manufacturing 0.80 0.68 0.69 0.90 0.44 0.73Construction 0.38 1.22 1.14 -0.31 -9.03 1.02Services(*) 1.25 1.66 1.54 0.26 2.45 1.44Renting -3.64 1.07 1.07 1.99 0.94 1.42
(*) The definition of the services sector is given in Appendix 1.
The decomposition of the employment growth for all sectors in Istanbul is presented in Table 1. Encompassing all economic activities, employment growth in Istanbul is seen to have been higher than the national figure. This reflects shifts in economic activities in Istanbul in favor of fast-growing sectors, despite the existence of the initial disadvantage in the second phase.
6. Change in the Quality of the Industrial Structure in Istanbul
The results of the shift-share analyses given in the previous section reveal that the competitive effects made a negative contribution to manufacturing growth in Istanbul. The sectoral shifts over the last three decades are proof of a deterioration in the composition of that region’s manufacturing activities. To assess the technological dimension in this change, we divided the manufacturing sector into two groups: a low-technology group and a middle – and high-technology group.18
Manufacturing in a region is molded by dynamics occurring on two levels. One level is the changes in the national economy, which greatly influences manufacturing, particularly in developing countries. The other level is local factors in the region. We can assume that will hold true for other economic sectors as well. Indeed, both levels’ stimuli have repercussions on all economic activities in a country, but with varying intensities. The deindustrialization policies designed for Istanbul can be defined as one of the components of the second type of dynamic. In order to eliminate the effects of the changes at the national level, we divided the values for each indicator defined for Istanbul by the national values. The resulting ratios gave the deviations in Istanbul from the national average; values greater than one indicate that Istanbul performed better than the national economy.
17 Due to its confidentiality rule, data for Istanbul’s banking sector are not published by TURKSTAT.18 Originally, the OECD classified the manufacturing sector into four technology groups: high-, medium-high,
medium-low, and low-technology industries. This classification is based on “manufacturing industries classified according to technology intensity, using the ISIC Rev. 3 breakdown of activity” (OECD, 2005, Annex A). Since the sectors classified in the low-technology group are identical to those in ISIC Rev. 3 and NACE Rev.1.1, it is possible to create two continuous series by merging high-, medium-high, and medium-low technology groups.
Two Phases Of Deındustrıalızatıon Polıcıes In Istanbul
201
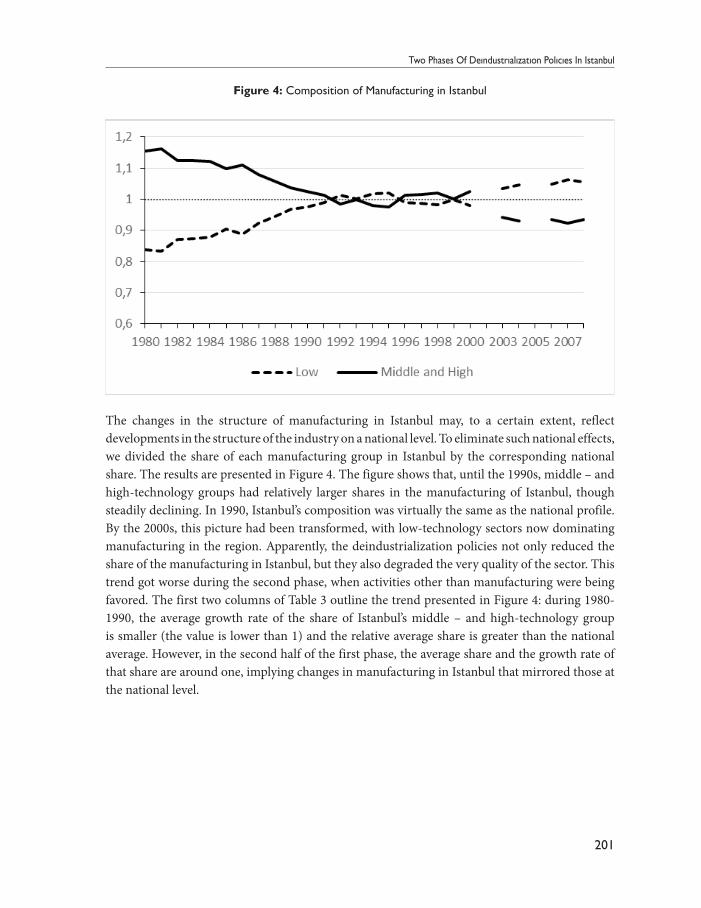
Figure 4: Composition of Manufacturing in Istanbul
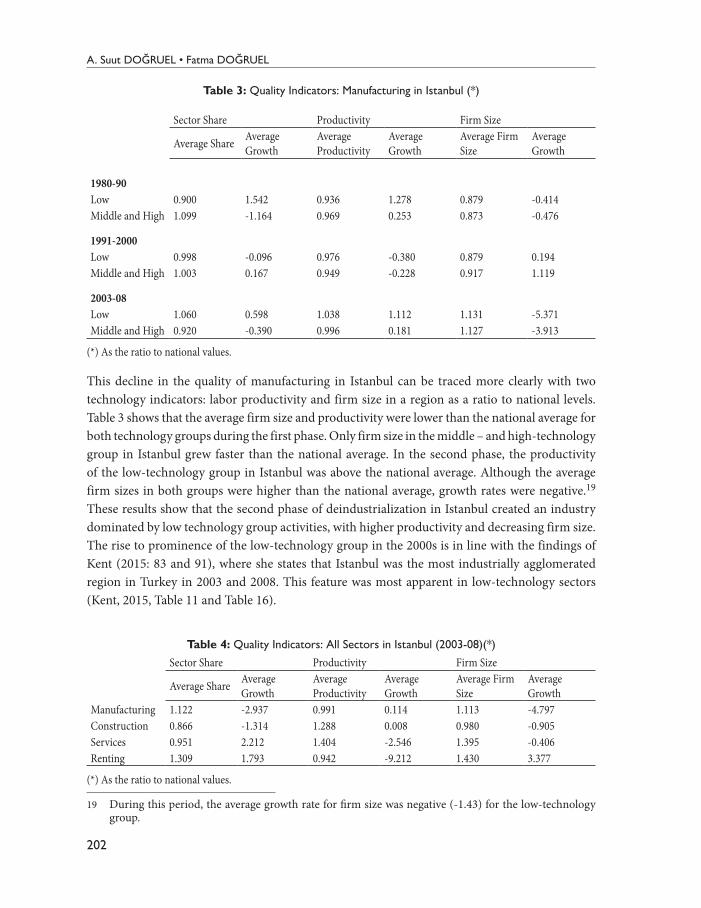
The changes in the structure of manufacturing in Istanbul may, to a certain extent, reflect developments in the structure of the industry on a national level. To eliminate such national effects, we divided the share of each manufacturing group in Istanbul by the corresponding national share. The results are presented in Figure 4. The figure shows that, until the 1990s, middle – and high-technology groups had relatively larger shares in the manufacturing of Istanbul, though steadily declining. In 1990, Istanbul’s composition was virtually the same as the national profile. By the 2000s, this picture had been transformed, with low-technology sectors now dominating manufacturing in the region. Apparently, the deindustrialization policies not only reduced the share of the manufacturing in Istanbul, but they also degraded the very quality of the sector. This trend got worse during the second phase, when activities other than manufacturing were being favored. The first two columns of Table 3 outline the trend presented in Figure 4: during 1980-1990, the average growth rate of the share of Istanbul’s middle – and high-technology group is smaller (the value is lower than 1) and the relative average share is greater than the national average. However, in the second half of the first phase, the average share and the growth rate of that share are around one, implying changes in manufacturing in Istanbul that mirrored those at the national level.
A. Suut DOĞRUEL • Fatma DOĞRUEL
202
Table 3: Quality Indicators: Manufacturing in Istanbul (*)
Sector Share Productivity Firm Size
Average Share Average Growth
Average Productivity
Average Growth
Average Firm Size
Average Growth
1980-90Low 0.900 1.542 0.936 1.278 0.879 -0.414Middle and High 1.099 -1.164 0.969 0.253 0.873 -0.476
1991-2000Low 0.998 -0.096 0.976 -0.380 0.879 0.194Middle and High 1.003 0.167 0.949 -0.228 0.917 1.119
2003-08Low 1.060 0.598 1.038 1.112 1.131 -5.371Middle and High 0.920 -0.390 0.996 0.181 1.127 -3.913
(*) As the ratio to national values.
This decline in the quality of manufacturing in Istanbul can be traced more clearly with two technology indicators: labor productivity and firm size in a region as a ratio to national levels. Table 3 shows that the average firm size and productivity were lower than the national average for both technology groups during the first phase. Only firm size in the middle – and high-technology group in Istanbul grew faster than the national average. In the second phase, the productivity of the low-technology group in Istanbul was above the national average. Although the average firm sizes in both groups were higher than the national average, growth rates were negative.19 These results show that the second phase of deindustrialization in Istanbul created an industry dominated by low technology group activities, with higher productivity and decreasing firm size. The rise to prominence of the low-technology group in the 2000s is in line with the findings of Kent (2015: 83 and 91), where she states that Istanbul was the most industrially agglomerated region in Turkey in 2003 and 2008. This feature was most apparent in low-technology sectors (Kent, 2015, Table 11 and Table 16).
Table 4: Quality Indicators: All Sectors in Istanbul (2003-08)(*)
Sector Share Productivity Firm Size
Average Share Average Growth
Average Productivity
Average Growth
Average Firm Size
Average Growth
Manufacturing 1.122 -2.937 0.991 0.114 1.113 -4.797Construction 0.866 -1.314 1.288 0.008 0.980 -0.905Services 0.951 2.212 1.404 -2.546 1.395 -0.406Renting 1.309 1.793 0.942 -9.212 1.430 3.377
(*) As the ratio to national values.
19 During this period, the average growth rate for firm size was negative (-1.43) for the low-technology group.
Two Phases Of Deındustrıalızatıon Polıcıes In Istanbul
203
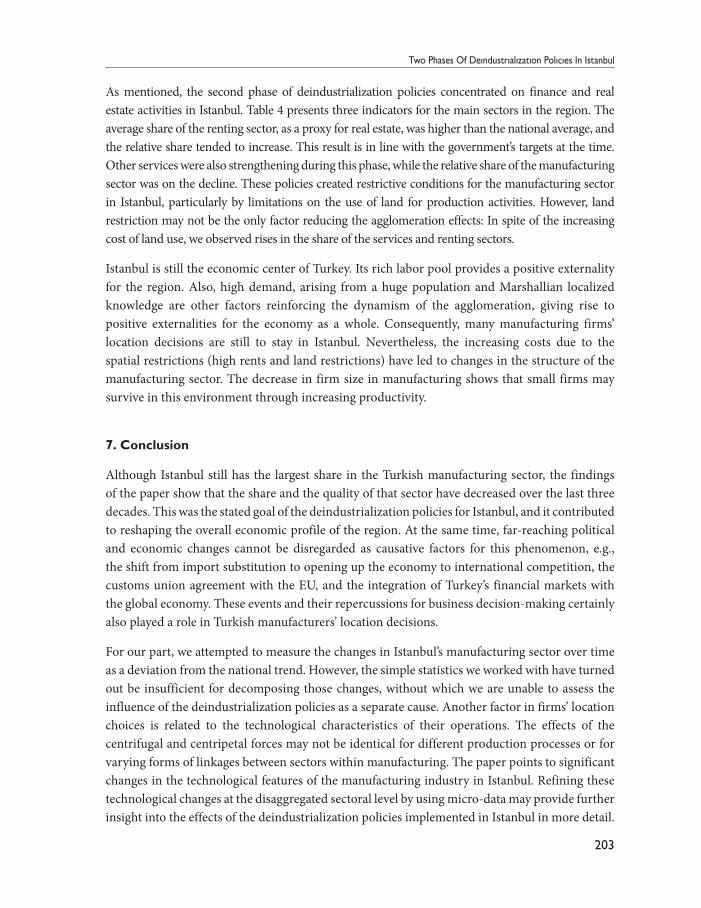
As mentioned, the second phase of deindustrialization policies concentrated on finance and real estate activities in Istanbul. Table 4 presents three indicators for the main sectors in the region. The average share of the renting sector, as a proxy for real estate, was higher than the national average, and the relative share tended to increase. This result is in line with the government’s targets at the time. Other services were also strengthening during this phase, while the relative share of the manufacturing sector was on the decline. These policies created restrictive conditions for the manufacturing sector in Istanbul, particularly by limitations on the use of land for production activities. However, land restriction may not be the only factor reducing the agglomeration effects: In spite of the increasing cost of land use, we observed rises in the share of the services and renting sectors.
Istanbul is still the economic center of Turkey. Its rich labor pool provides a positive externality for the region. Also, high demand, arising from a huge population and Marshallian localized knowledge are other factors reinforcing the dynamism of the agglomeration, giving rise to positive externalities for the economy as a whole. Consequently, many manufacturing firms’ location decisions are still to stay in Istanbul. Nevertheless, the increasing costs due to the spatial restrictions (high rents and land restrictions) have led to changes in the structure of the manufacturing sector. The decrease in firm size in manufacturing shows that small firms may survive in this environment through increasing productivity.
7. Conclusion
Although Istanbul still has the largest share in the Turkish manufacturing sector, the findings of the paper show that the share and the quality of that sector have decreased over the last three decades. This was the stated goal of the deindustrialization policies for Istanbul, and it contributed to reshaping the overall economic profile of the region. At the same time, far-reaching political and economic changes cannot be disregarded as causative factors for this phenomenon, e.g., the shift from import substitution to opening up the economy to international competition, the customs union agreement with the EU, and the integration of Turkey’s financial markets with the global economy. These events and their repercussions for business decision-making certainly also played a role in Turkish manufacturers’ location decisions.
For our part, we attempted to measure the changes in Istanbul’s manufacturing sector over time as a deviation from the national trend. However, the simple statistics we worked with have turned out be insufficient for decomposing those changes, without which we are unable to assess the influence of the deindustrialization policies as a separate cause. Another factor in firms’ location choices is related to the technological characteristics of their operations. The effects of the centrifugal and centripetal forces may not be identical for different production processes or for varying forms of linkages between sectors within manufacturing. The paper points to significant changes in the technological features of the manufacturing industry in Istanbul. Refining these technological changes at the disaggregated sectoral level by using micro-data may provide further insight into the effects of the deindustrialization policies implemented in Istanbul in more detail.
A. Suut DOĞRUEL • Fatma DOĞRUEL
204
ReferencesARUP, (undated), Istanbul International Financial Center. ARUP (ARUP is a global firm of consulting
engineers, designers, planners, and project managers.)http://www.arup.com/Projects/Istanbul_International_Financial_Centre.aspx [Accessed on May 30, 2014, 12:10].
Audretsch, D. B., Oliver, F., and Stephan, H. (2007). It’s All in Marshall: The Impact of External Economies on Regional Dynamics, CESifo Working Paper Series No. 2094, (September). http://ssrn.com/abstract=1016956
Barff, R. A., and Prentice, L K. (2006). Dynamic Shift-Share Analysis, Growth and Change, 19(2):1-10.Bilsel, C. (2007). Yayın Değerlendirme: Cumhuriyet Dönemi Istanbul Planlama Raporları
1934-1995, Mimarlık, 338, Kasım-Aralık. http://www.mimarlikdergisi.com/index.cfm?sayfa=mimarlik&DergiSayi=288&RecID=1662
Clark, C. (1967). Von Thünen’s Isolated State, Oxford Economic Papers, New Series, 19(3): 370-377.Creamer, D. B. (1943). Industrial Location and National Resources, Government Printing Office, Washington,
DC.Doğruel, F. (2013). Deindustrialization of Old Industrial Regions in Turkey, Rives Méditerranéennes, 46: 93-
108.Doğruel, F., and Doğruel, A. S. (2006). Openness and Regional Distribution of Turkish Manufacturing
Industries, Topics in Middle Eastern and North African Economies (electronic journal), 8. http://www.luc.edu/orgs/meea/volume8/PDFS/Dogruel.pdf
Doğruel, F., and Doğruel, A. S. (2011). Privatization and Regional Distribution of Manufacturing in Turkey, Turkish Economic Association, Discussion Paper 2011/4. http://www.tek.org.tr
Doğruel, F., and Doğruel, A. S. (2012). Openness, Technological Changes, and Differentiation in Turkish Manufacturing Sector. Hadi S. Esfahani and G. Tuna (Ed.), Economic Development in the Middle East and North African Countries: Some Contemporary Issues, in: 1-17, New York: Novascience Publishing House.
DPT (1995) VII. Beş Yıllık Kalkınma Planı 1996-2000, Ankara: DPT Publication. http://ekutup.dpt.gov.tr/plan/vii/plan7.pdf
Duranay, N., Gürsel, E., and Ural, S. (1972). Cumhuriyetten Bu Yana Istanbul Planlaması, Mimarlık, 105: 67-108. http://dergi.mo.org.tr/dergiler/4/421/6606.pdf
Feldstein, M. S., and Foot, D. K. (1971). The Other Half of Gross Investment: Replacement and Modernization Expenditures, The Review of Economics and Statistics, 53(1): 49-58.
Fujita, M., and Thisse, J. F. (1996). Economics of Agglomeration. Journal of the Japanese and International Economies, 10(4): 339-378.
Fujita, M., and Thisse, J. F. (2002). Economics of Agglomeration: Cities, Industrial Location, and Regional Growth. Cambridge University Press, New York.
Glaeser, E. L. (2007). The Economics Approach to Cities, NBER Working Paper No. 13696. http://www.nber.org/papers/w13696
Harris, T. R., Gillberg, C. B., Narayanan, R., Shonkwiler, J. S., and Lambert, D. K. (1994). A Dynamic Shift-Share Analysis of an Economic Impact: Report on the Nevada Economy, Technical Report, UCED 94-06, University of Nevada, Reno. Accessed on August 7, 2008. http://www.cabnr.unr.edu/uced/Reports/Technical/fy1994_1995/9495_06rpt.pdf
Hoover, E. M., and Giarratani, F. (1999). An Introduction to Regional Economics, Third Edition, Regional Research Institute, WVU.
Two Phases Of Deındustrıalızatıon Polıcıes In Istanbul
205
IBB. (1995) Istanbul Metropoliten Alan Alt Bölge Nazım Plan Raporu, Istanbul: Istanbul Büyükşehir Belediyesi Planlama ve İmar Daire Başkanlığı Şehir Planlama Müdürlüğü.
IBB. (2009). Ölçekli Istanbul Çevre Düzeni Planı Raporu (1:100,000 Scale Istanbul Environmental Plan Report), Istanbul: Istanbul Büyükşehir Belediyesi İmar ve Şehircilik Daire Başkanlığı Şehir Planlama Müdürlüğü.http://www.planlama.org/new/images/stories/Dokuman/istanbul_cdp/
ISO. (1981). İstanbul Metropoliten Alanında Sanayi Yerleşim Planlaması, İstanbul Sanayi Odası Yayınları, Istanbul.
Kent, O. (2015). Agglomeration Economies and Geographic Distribution of Manufacturing Industries in Turkey, PhD. Thesis, Yildiz Technical University, Istanbul.
Krugman, P. (1991). Increasing Returns and Economic Geography, The Journal of Political Economy, 99(3): 483-499.
Krugman, P. (1999). The Role of Geography in Development, Boris Pleskovic and Joseph E. Stiglitz (Ed.), Annual World Bank Conference on Development Economics 1998, in: 89-125, Washington, DC,: The World Bank.
Marshall, A. ([1890] 1920). Principles of Economics, London: Macmillan and Co., Ltd. [Online] available from http://www.econlib.org/library/Marshall/marP24.html; accessed on October 12, 2008 [BOOK IV, CHAPTER X, Industrial Organization, Continued. The Concentration of Specialized Industries in Particular Localities.].
OECD. (2005). OECD Science, Technology, and Industry Scoreboard 2005, Paris: OECD Publishing.DOI: http://dx.doi.org/10.1787/sti_scoreboard-2005-en
Official Gazette. (2009). Istanbul International Financial Center Strategy and Action Plan (Strategy and Action Plan),” The Supreme Planning Board’s Decision No. 2009/31 (September 29, 2009), The Official Gazette No. 27364, October 2, 2009.
Özler, E., and Prost, H. (2007). Cumhuriyet Donemi İstanbul Planlama Raporları 1934-95, TMMOB Mimarlar Odası İstanbul Büyükkent Şubesi, İstanbul.
Perloff, H. S., Dunn, E. S, Lampard, Jr., E. E., and Muth, R. F. (1960). Regions, Resources, and Economic Growth, Baltimore: The Johns Hopkins Press.
Riefler, R. F. (1984). Book Review: The Development of the U.S. Urban System, Vol. 1.: Concepts, Structures, Regional Shifts; Vol. 2: Industrial Shifts, Implications by Edgar S. Dunn, Jr,” Journal of Economic History, XLIV (I): 179-184.
Samuelson, P. A. (2009). Preface. Thünen: An Economist Ahead of His Times,” Johann Heinrich von Thünen (Translated from the German by Keith Tribe and Edited by Ulrich van Suntum), The Isolated State in Relation to Agriculture and Political Economy, Part III: Principles for the Determination of Rent, the Most Advantageous Rotation Period and the Value of Stands of Varying Age in Pinewoods, in: xii-xv, Palgrave Macmillan, UK (First published in German 1863).
Thisse, J. F. (2014). The New Science of Cities by Michael Batty: The Opinion of an Economist, Journal of Economic Literature, 52(3): 805-19.
United Nations. (2014), Department of Economic and Social Affairs, Population Division (2014). World Urbanization Prospects: The 2014 Revision, CD-ROM Edition.
Yüzer, A. Ş., and Giritlioğlu, C. (2003). Sanayi alanları yeni düzenleme stratejileri – Istanbul örneği, ITU Dergisi / AMimarlık, Planlama, Tasarım, 2(1): 119-127.
Zaimoğlu, S. (1971). İstanbul Sanayi Bolgeleri, Hüsnütabiat Matbaası, Istanbul.
A. Suut DOĞRUEL • Fatma DOĞRUEL
206
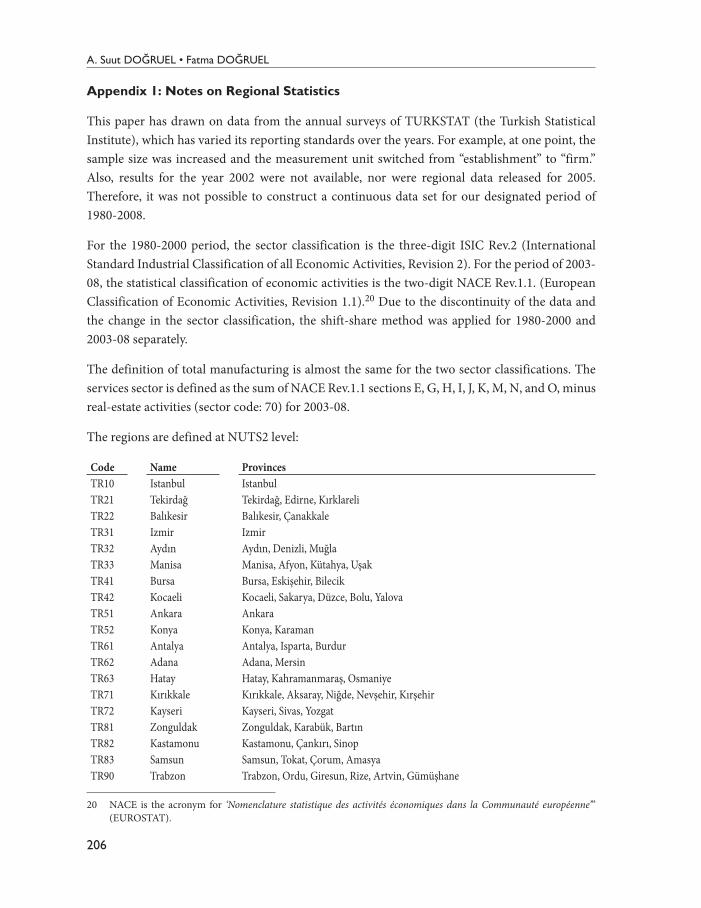
Appendix 1: Notes on Regional Statistics
This paper has drawn on data from the annual surveys of TURKSTAT (the Turkish Statistical Institute), which has varied its reporting standards over the years. For example, at one point, the sample size was increased and the measurement unit switched from “establishment” to “firm.” Also, results for the year 2002 were not available, nor were regional data released for 2005. Therefore, it was not possible to construct a continuous data set for our designated period of 1980-2008.
For the 1980-2000 period, the sector classification is the three-digit ISIC Rev.2 (International Standard Industrial Classification of all Economic Activities, Revision 2). For the period of 2003-08, the statistical classification of economic activities is the two-digit NACE Rev.1.1. (European Classification of Economic Activities, Revision 1.1).20 Due to the discontinuity of the data and the change in the sector classification, the shift-share method was applied for 1980-2000 and 2003-08 separately.
The definition of total manufacturing is almost the same for the two sector classifications. The services sector is defined as the sum of NACE Rev.1.1 sections E, G, H, I, J, K, M, N, and O, minus real-estate activities (sector code: 70) for 2003-08.
The regions are defined at NUTS2 level:
Code Name ProvincesTR10 Istanbul IstanbulTR21 Tekirdağ Tekirdağ, Edirne, KırklareliTR22 Balıkesir Balıkesir, ÇanakkaleTR31 Izmir IzmirTR32 Aydın Aydın, Denizli, MuğlaTR33 Manisa Manisa, Afyon, Kütahya, UşakTR41 Bursa Bursa, Eskişehir, BilecikTR42 Kocaeli Kocaeli, Sakarya, Düzce, Bolu, YalovaTR51 Ankara AnkaraTR52 Konya Konya, KaramanTR61 Antalya Antalya, Isparta, BurdurTR62 Adana Adana, MersinTR63 Hatay Hatay, Kahramanmaraş, OsmaniyeTR71 Kırıkkale Kırıkkale, Aksaray, Niğde, Nevşehir, KırşehirTR72 Kayseri Kayseri, Sivas, YozgatTR81 Zonguldak Zonguldak, Karabük, BartınTR82 Kastamonu Kastamonu, Çankırı, SinopTR83 Samsun Samsun, Tokat, Çorum, AmasyaTR90 Trabzon Trabzon, Ordu, Giresun, Rize, Artvin, Gümüşhane
20 NACE is the acronym for ‘Nomenclature statistique des activités économiques dans la Communauté européenne’” (EUROSTAT).
Two Phases Of Deındustrıalızatıon Polıcıes In Istanbul
207
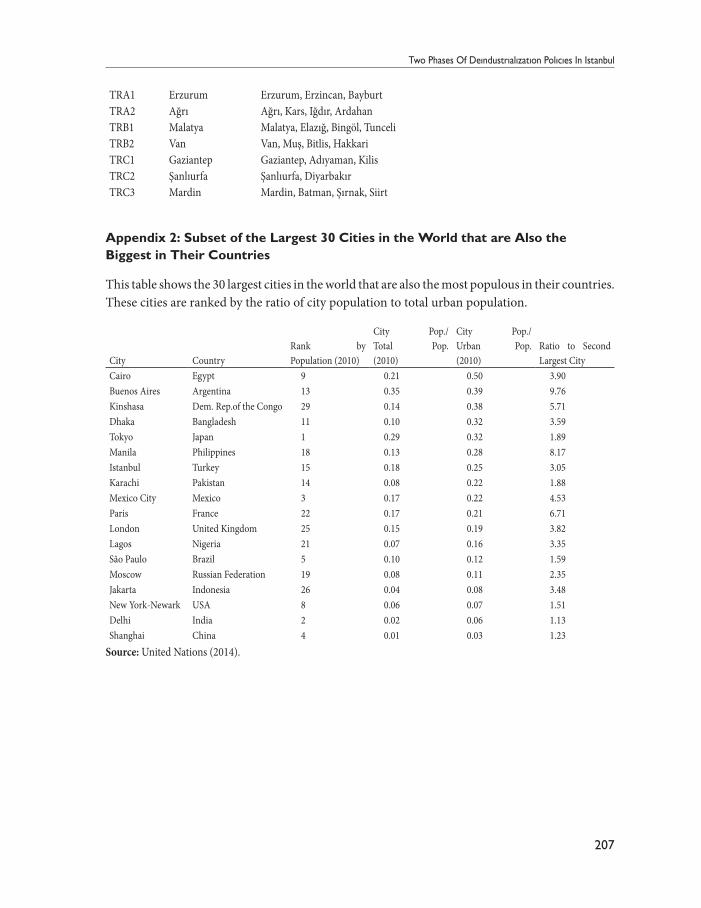
TRA1 Erzurum Erzurum, Erzincan, BayburtTRA2 Ağrı Ağrı, Kars, Iğdır, ArdahanTRB1 Malatya Malatya, Elazığ, Bingöl, TunceliTRB2 Van Van, Muş, Bitlis, HakkariTRC1 Gaziantep Gaziantep, Adıyaman, KilisTRC2 Şanlıurfa Şanlıurfa, DiyarbakırTRC3 Mardin Mardin, Batman, Şırnak, Siirt
Appendix 2: Subset of the Largest 30 Cities in the World that are Also the Biggest in Their Countries
This table shows the 30 largest cities in the world that are also the most populous in their countries. These cities are ranked by the ratio of city population to total urban population.
City CountryRank by Population (2010)
City Pop./ Total Pop. (2010)
City Pop./ Urban Pop. (2010)
Ratio to Second Largest City
Cairo Egypt 9 0.21 0.50 3.90Buenos Aires Argentina 13 0.35 0.39 9.76Kinshasa Dem. Rep.of the Congo 29 0.14 0.38 5.71Dhaka Bangladesh 11 0.10 0.32 3.59Tokyo Japan 1 0.29 0.32 1.89Manila Philippines 18 0.13 0.28 8.17Istanbul Turkey 15 0.18 0.25 3.05Karachi Pakistan 14 0.08 0.22 1.88Mexico City Mexico 3 0.17 0.22 4.53Paris France 22 0.17 0.21 6.71London United Kingdom 25 0.15 0.19 3.82Lagos Nigeria 21 0.07 0.16 3.35São Paulo Brazil 5 0.10 0.12 1.59Moscow Russian Federation 19 0.08 0.11 2.35Jakarta Indonesia 26 0.04 0.08 3.48New York-Newark USA 8 0.06 0.07 1.51Delhi India 2 0.02 0.06 1.13Shanghai China 4 0.01 0.03 1.23
Source: United Nations (2014).