two harbors investment corp.investor.twoharborsinvestment.com/sites/twoharbors... · ·...
TRANSCRIPT

Two Harbors
Investment Corp.
First Quarter 2013
Earnings Call
May 8, 2013
2
Forward-Looking Statements
This presentation includes “forward-looking statements” within the meaning of the safe harbor provisions of the United States Private Securities Litigation Reform Act of 1995. Actual results may differ from expectations, estimates and projections and, consequently, readers should not rely on these forward-looking statements as predictions of future events. Words such as “expect,” “target,” “assume,” “estimate,” “project,” “budget,” “forecast,” “anticipate,” “intend,” “plan,” “may,” “will,” “could,” “should,” “believe,” “predicts,” “potential,” “continue,” and similar expressions are intended to identify such forward-looking statements. These forward-looking statements involve significant risks and uncertainties that could cause actual results to differ materially from expected results. Factors that could cause actual results to differ include, but are not limited to, higher than expected operating costs, changes in prepayment speeds of mortgages underlying our RMBS, the rates of default or decreased recovery on the mortgages underlying our non-Agency securities, failure to recover certain losses that are expected to be temporary, changes in interest rates or the availability of financing, the impact of new legislation or regulatory changes on our operations, the impact of any deficiencies in the servicing or foreclosure practices of third parties and related delays in the foreclosure process, the inability to acquire mortgage loans or securitize the mortgage loans we acquire, the impact of new or modified government mortgage refinance or principal reduction programs, and unanticipated changes in overall market and economic conditions.
Readers are cautioned not to place undue reliance upon any forward-looking statements, which speak only as of the date made. Two Harbors does not undertake or accept any obligation to release publicly any updates or revisions to any forward-looking statement to reflect any change in its expectations or any change in events, conditions or circumstances on which any such statement is based. Additional information concerning these and other risk factors is contained in Two Harbors’ most recent filings with the Securities and Exchange Commission. All subsequent written and oral forward looking statements concerning Two Harbors or matters attributable to Two Harbors or any person acting on its behalf are expressly qualified in their entirety by the cautionary statements above.
Safe Harbor Statement
Executive Summary
First Quarter Results – Exceptional Economic Return
Generated exceptional economic return in Q1-2013 with $248 million in comprehensive income, or $0.81
per diluted weighted average common share.
― Comprehensive income was driven by strong non-Agency performance.
Generated total return on book value for Q1-2013 of 8.5%1.
Declared a dividend of $0.32 per common share and a special dividend of Silver Bay common stock
amounting to $1.012 per share.
― Distributed approximately 17.8 million shares of Silver Bay common stock on or about April 24, 2013
to stockholders of record on April 2, 2013. The distribution ratio for this special dividend amounted
to approximately 0.0493 shares of SBY common stock for each share of Two Harbors common stock,
and fulfills our stated objective with this investment.
Completed an accretive offering in March 2013, resulting in the issuance of 57.5 million shares for net
proceeds of approximately $763 million.
Reported progress regarding a number of previously-identified new business initiatives.
(1) See Appendix page 14 for calculation of first quarter 2013 return on book value.
(2) The per share calculation utilized the closing price of Silver Bay common stock on March 28, 2013, which was $20.70, multiplied by 17,824,647 shares of Silver Bay common stock, divided by Two Harbors’ shares outstanding of 365,065,756 on the record date, April 2, 2013. The dividend per share received by a stockholder for tax purposes was approximately $0.95 per share, which utilized the closing share price of Silver Bay
common stock on the payable date, April 24, 2013, adjusted for the shares sold in open market and converted to cash proceeds which were distributed in lieu of fractional shares. (3) Based on the shares outstanding on the record date, April 2, 2013, stockholders were entitled to receive 0.048825853 shares of Silver Bay common stock for each share of Two Harbors common stock held on that
date. 3

Macroeconomic Update
(1) Source: CoreLogic Home Price Index rolling 12-month change as of February 28, 2013.
Key Macroeconomic Factors that Impact our Business
Home Prices
The U.S. housing market continues to perform well, with the CoreLogic Home Price Index +10%1 on a rolling
12-month basis.
Employment
Unemployment is still high, which is a meaningful determinant of probability of default on a mortgage loan.
If employment trends improve, interest rates could move higher.
Eurozone Crisis
The Eurozone Crisis continues to pressure global markets.
Interest Rates
Rates moved modestly higher in the first quarter, as economic indicators such as GDP strengthened.
We continue to hedge against an increase in rates.
Policy Considerations
HARP extension through 2015
GSE reform
Potential new FHFA Director
Streamlined refinancing of non-Agency loans
4
5
Investment Opportunities
Expansion of Core Competency Set
Agency and non-Agency markets
Progress on several new opportunities:
― Mortgage Servicing Rights (MSRs)
― Securitization
― Credit Sensitive Loans (CSLs)
Criteria for evaluating investment opportunities includes the following:
― Based on core competencies, such as understanding and managing prepayments and credit risk
― Attractive return profiles
― Improve the risk-reward profile of our total portfolio

110 110
Financial Summary
Financial Highlights Core Earnings1
Expense Ratio
Core Earnings1 of $0.29 per weighted average share represents
an annualized ROE of 9.7%.
GAAP Earnings of $0.47 per weighted average share.
Expense ratio of 0.7% is in-line with fourth quarter.
Leverage declined to 3.1x from 3.4x at December 31, 2012,
largely due to our capital raise completed on March 22, 2013.
$63.8 $76.3
$87.1 $84.0$89.7$0.34
$0.36 $0.32 $0.28 $0.29
$0.0
$0.1
$0.2
$0.3
$0.4
$0.5
$0.0
$20.0
$40.0
$60.0
$80.0
$100.0
Q1-2012 Q2-2012 Q3-2012 Q4-2012 Q1-2013
Core Earnings ($M) Core EPS ($)
0.8% 0.7% 0.5% 0.7% 0.7%
0.0%
2.0%
4.0%
Q1-2012 Q2-2012 Q3-2012 Q4-2012 Q1-2013
Other Operating Expenses as % of Average Equity
(1) Core Earnings is a non-GAAP measure that the company defines as GAAP net income, excluding impairment losses, gains or losses on sales of securities and termination of interest rate swaps, unrealized gains or losses on trading securities, interest rate swaps and swaptions, certain gains or losses on derivative instruments, certain non-recurring gains and losses related to discontinued operations, and certain non-recurring upfront costs related to securitization transactions. As defined, Core Earnings includes interest income associated with the company's inverse interest-only securities ("Agency Derivatives") and premium income or loss on credit default swaps.
(2) The realized gain utilized the closing price on April 24, 2013, which was $19.40, less the cost basis of $18.50, multiplied by 17,824,647 shares of Silver Bay common stock.
Accounting Matters
OTTI of $236k remains immaterial to our non-Agency RMBS
portfolio.
On-balance sheet securitization accounted for under fair value
election.
Distribution of Silver Bay common stock on April 24, 2013
resulted in a taxable realized gain of approximately $162 million.
Installment sales gains of $1.4 million and reduction to
management fee of $4.3 million related to the Silver Bay
contribution transaction.
6

7
Book Value
Book Value
Q1-2013 Book
Value ($M)
Common
Shares
Outstanding
Net Book Value
Per Common
Share
Beginning stockholders’ equity $ 3,450.6 298.8 $ 11.55
GAAP Net Income:
Core Earnings, net of tax 89.7
Realized gains and losses, net of tax (49.8)
Unrealized mark-to-market losses, net of tax 102.4
Discontinued Operations 1.4
Other Comprehensive Income, net of tax 104.3
Dividend declaration1 (460.3)
Other -
Balance before Capital Transactions $ 3,238.3 298.8
Issuance of Common Stock, Net of Offering Costs 763.0 57.5
Proceeds from Issuance of Common Stock through
Warrant Exercise
63.8 5.8
Ending stockholders’ equity – basic $ 4,065.1 362.1 11.23
Warrants oustanding2 - 1.0 (0.04)
Ending stockholders’ equity – diluted $ 4,065.1 363.1 11.19
(1) Dividend utilized the dividend declaration date of March 18, 2013; included a cash dividend of $116.8 million and a special dividend of $343.5 million. (2) Using the treasury stock method, 1.0 million shares would be considered outstanding and dilutive to book value per share at March 31, 2013.
Includes cash dividend
of $116.8 million, or
$0.32 per diluted share
Includes special
dividend of $343.5
million, which
represents the market
value of Silver Bay
common stock held as
of the date of
declaration
Completed accretive
public offering
Comprehensive
Income of $248.0
million
8
Financing Profile
High-Quality Non-Agency Counterparties3 Diverse Agency Counterparties2
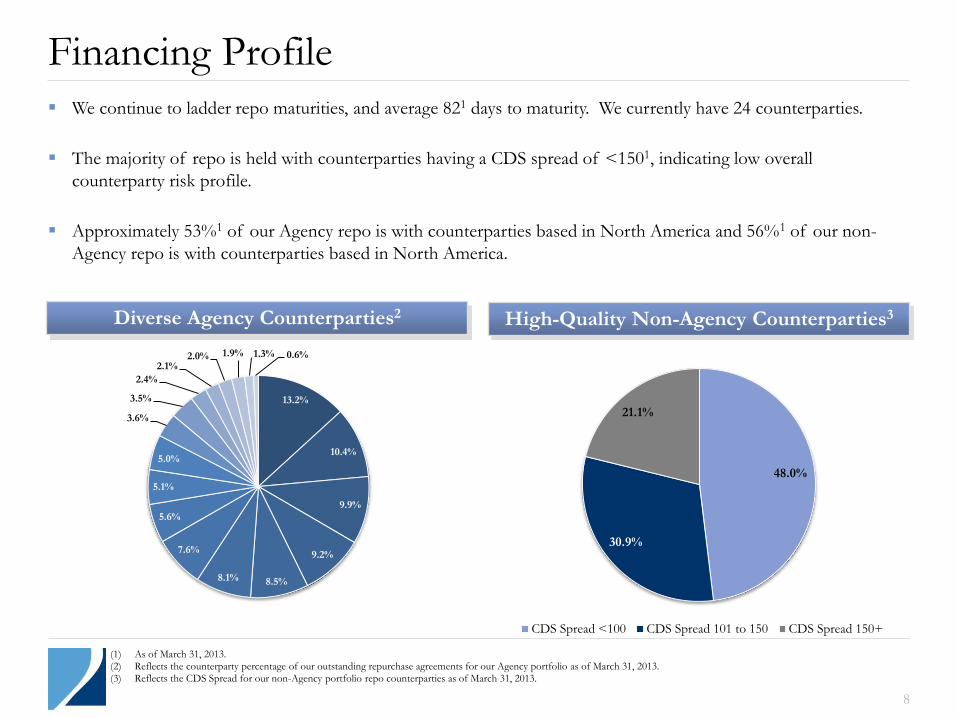
We continue to ladder repo maturities, and average 821 days to maturity. We currently have 24 counterparties.
The majority of repo is held with counterparties having a CDS spread of <1501, indicating low overall
counterparty risk profile.
Approximately 53%1 of our Agency repo is with counterparties based in North America and 56%1 of our non-
Agency repo is with counterparties based in North America.
(1) As of March 31, 2013. (2) Reflects the counterparty percentage of our outstanding repurchase agreements for our Agency portfolio as of March 31, 2013. (3) Reflects the CDS Spread for our non-Agency portfolio repo counterparties as of March 31, 2013.
13.2%
10.4%
9.9%
9.2%
8.5% 8.1%
7.6%
5.6%
5.1%
5.0%
3.6%
3.5%
2.4%
2.1% 2.0% 1.9% 1.3% 0.6%
48.0%
30.9%
21.1%
CDS Spread <100 CDS Spread 101 to 150 CDS Spread 150+
110
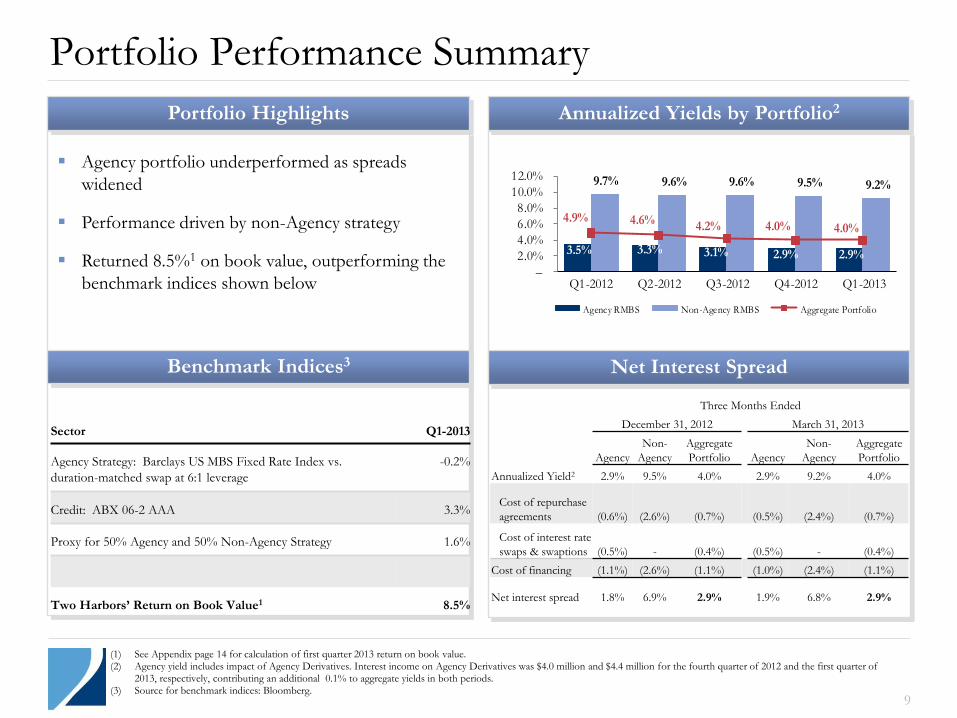
Agency portfolio underperformed as spreads
widened
Performance driven by non-Agency strategy
Returned 8.5%1 on book value, outperforming the
benchmark indices shown below
Sector Q1-2013
Agency Strategy: Barclays US MBS Fixed Rate Index vs.
duration-matched swap at 6:1 leverage
-0.2%
Credit: ABX 06-2 AAA 3.3%
Proxy for 50% Agency and 50% Non-Agency Strategy 1.6%
Two Harbors’ Return on Book Value1 8.5%
Benchmark Indices3
Portfolio Performance Summary
9
110
3.5% 3.3% 3.1% 2.9% 2.9%
9.7% 9.6% 9.6% 9.5% 9.2%
4.9% 4.6% 4.2% 4.0% 4.0%
–
2.0%
4.0%
6.0%
8.0%
10.0%
12.0%
Q1-2012 Q2-2012 Q3-2012 Q4-2012 Q1-2013
Agency RMBS Non-Agency RMBS Aggregate Portfolio
(1) See Appendix page 14 for calculation of first quarter 2013 return on book value. (2) Agency yield includes impact of Agency Derivatives. Interest income on Agency Derivatives was $4.0 million and $4.4 million for the fourth quarter of 2012 and the first quarter of
2013, respectively, contributing an additional 0.1% to aggregate yields in both periods. (3) Source for benchmark indices: Bloomberg.
Three Months Ended
December 31, 2012 March 31, 2013
Agency
Non-
Agency
Aggregate
Portfolio Agency
Non-
Agency
Aggregate
Portfolio
Annualized Yield2 2.9% 9.5% 4.0% 2.9% 9.2% 4.0%
Cost of repurchase
agreements (0.6%) (2.6%) (0.7%) (0.5%) (2.4%) (0.7%)
Cost of interest rate
swaps & swaptions (0.5%) - (0.4%) (0.5%) - (0.4%)
Cost of financing (1.1%) (2.6%) (1.1%) (1.0%) (2.4%) (1.1%)
Net interest spread 1.8% 6.9% 2.9% 1.9% 6.8% 2.9%
Portfolio Highlights Annualized Yields by Portfolio2
Net Interest Spread
110 110
Portfolio Composition
10
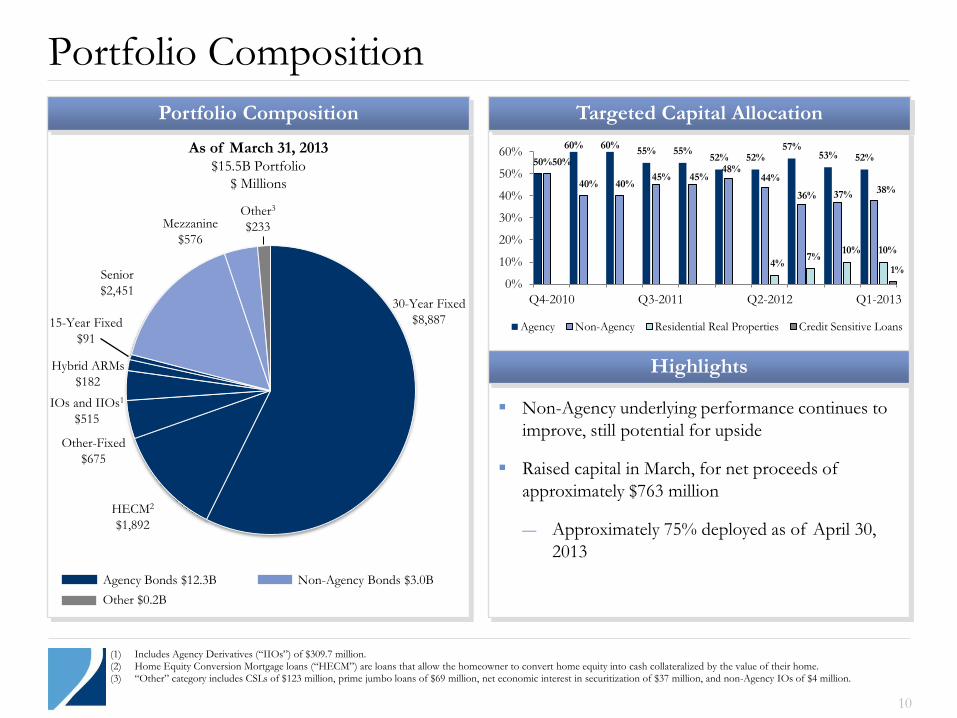
(1) Includes Agency Derivatives (“IIOs”) of $309.7 million. (2) Home Equity Conversion Mortgage loans (“HECM”) are loans that allow the homeowner to convert home equity into cash collateralized by the value of their home. (3) “Other” category includes CSLs of $123 million, prime jumbo loans of $69 million, net economic interest in securitization of $37 million, and non-Agency IOs of $4 million.
Highlights
Targeted Capital Allocation
Non-Agency underlying performance continues to
improve, still potential for upside
Raised capital in March, for net proceeds of
approximately $763 million
― Approximately 75% deployed as of April 30,
2013
As of March 31, 2013 $15.5B Portfolio
$ Millions
Agency Bonds $12.3B Non-Agency Bonds $3.0B
30-Year Fixed
$8,887 15-Year Fixed
$91
HECM2
$1,892
Other-Fixed
$675
IOs and IIOs1
$515
Hybrid ARMs
$182
Mezzanine
$576
Senior
$2,451
Portfolio Composition
50%
60% 60% 55% 55%
52% 52% 57%
53% 52% 50%
40% 40% 45% 45%
48% 44%
36% 37% 38%
4% 7%
10% 10%
1%
0%
10%
20%
30%
40%
50%
60%
Q4-2010 Q3-2011 Q2-2012 Q1-2013
Agency Non-Agency Residential Real Properties Credit Sensitive Loans
Other $0.2B
Other3
$233
110
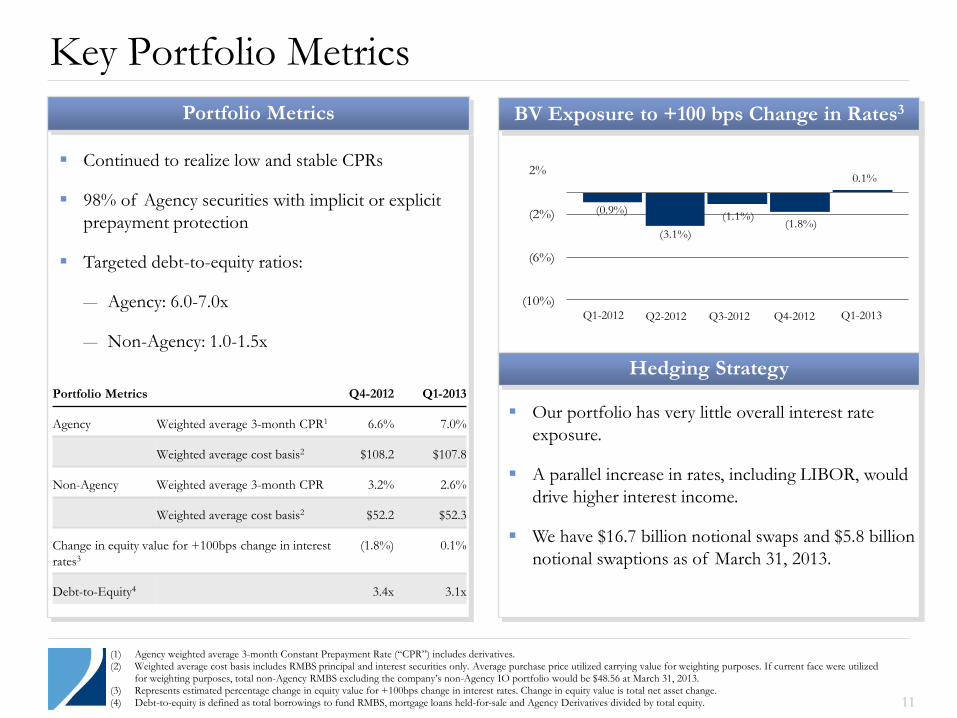
(0.9%)
(3.1%)
(1.1%)(1.8%)
0.1%
(10%)
(6%)
(2%)
11
110
Key Portfolio Metrics
Continued to realize low and stable CPRs
98% of Agency securities with implicit or explicit
prepayment protection
Targeted debt-to-equity ratios:
― Agency: 6.0-7.0x
― Non-Agency: 1.0-1.5x
(1) Agency weighted average 3-month Constant Prepayment Rate (“CPR”) includes derivatives. (2) Weighted average cost basis includes RMBS principal and interest securities only. Average purchase price utilized carrying value for weighting purposes. If current face were utilized
for weighting purposes, total non-Agency RMBS excluding the company’s non-Agency IO portfolio would be $48.56 at March 31, 2013. (3) Represents estimated percentage change in equity value for +100bps change in interest rates. Change in equity value is total net asset change. (4) Debt-to-equity is defined as total borrowings to fund RMBS, mortgage loans held-for-sale and Agency Derivatives divided by total equity.
Our portfolio has very little overall interest rate
exposure.
A parallel increase in rates, including LIBOR, would
drive higher interest income.
We have $16.7 billion notional swaps and $5.8 billion
notional swaptions as of March 31, 2013.
Portfolio Metrics Q4-2012 Q1-2013
Agency Weighted average 3-month CPR1 6.6% 7.0%
Weighted average cost basis2 $108.2 $107.8
Non-Agency Weighted average 3-month CPR 3.2% 2.6%
Weighted average cost basis2 $52.2 $52.3
Change in equity value for +100bps change in interest
rates3
(1.8%) 0.1%
Debt-to-Equity4 3.4x 3.1x
Portfolio Metrics BV Exposure to +100 bps Change in Rates3
Q4-2012
Hedging Strategy
Q3-2012 Q2-2012 Q1-2012 Q1-2013
2%
12
Hybrid Model Provides Flexibility Prime Jumbo Securitization
Opportunity to create attractive mortgage credit investment is beneficial to shareholders
Participated in a prime jumbo securitization in 1Q13
Continue building aggregation capabilities
Credit Sensitive Loans (CSLs)
Very similar to the performing residential mortgage loans in subprime/Alt-A deals
We will control servicing on the loans
As of April 30, 2013, we had purchased or contracted to purchase approximately $600 million CSLs
(approximately $450 million in market value)
Potential to securitize and create attractive credit investments
Mortgage Servicing Rights (MSRs)
Natural interest rate hedge for portfolio
Leverages strength in prepayment analysis
We recently acquired a company with seller-servicer approvals from Fannie Mae, Freddie Mac and Ginnie Mae
GSE Credit Investments
Will evaluate when, and if, the GSEs move to distribute credit risk

13
Appendix
14
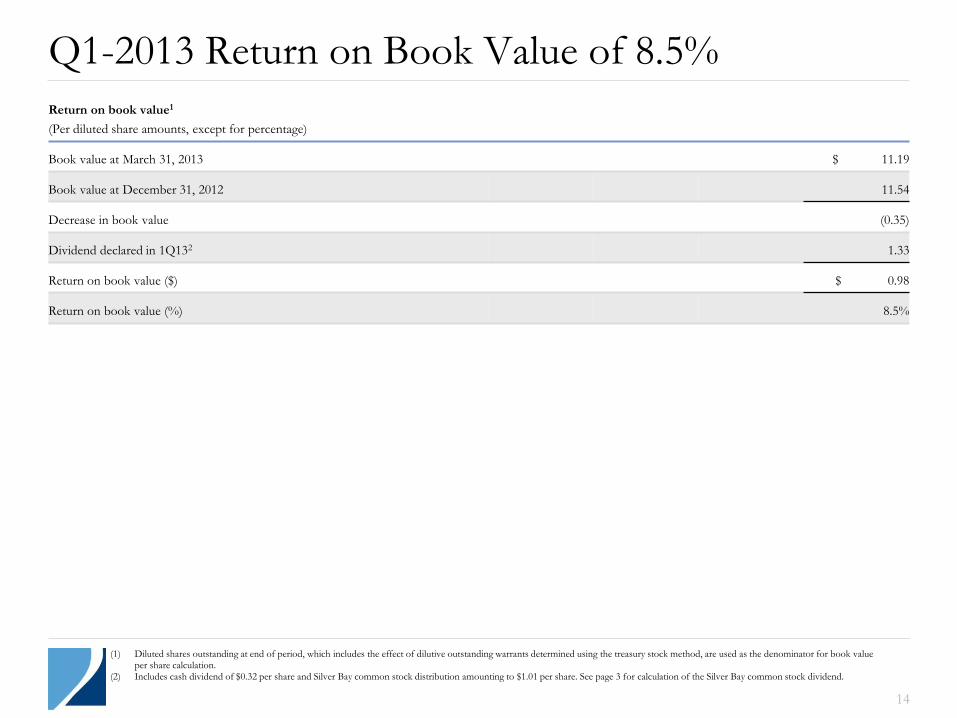
Q1-2013 Return on Book Value of 8.5%
Return on book value1
(Per diluted share amounts, except for percentage)
Book value at March 31, 2013 $ 11.19
Book value at December 31, 2012 11.54
Decrease in book value (0.35)
Dividend declared in 1Q132 1.33
Return on book value ($) $ 0.98
Return on book value (%) 8.5%
(1) Diluted shares outstanding at end of period, which includes the effect of dilutive outstanding warrants determined using the treasury stock method, are used as the denominator for book value per share calculation.
(2) Includes cash dividend of $0.32 per share and Silver Bay common stock distribution amounting to $1.01 per share. See page 3 for calculation of the Silver Bay common stock dividend.
15
110
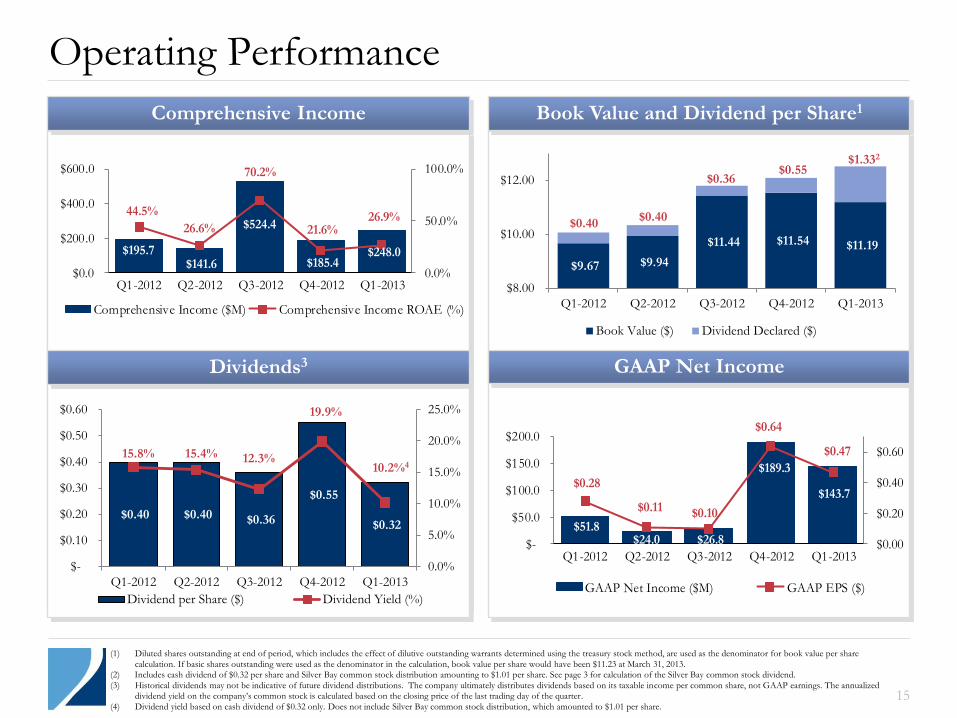
Operating Performance
110 110
$195.7 $141.6
$524.4
$185.4$248.0
44.5%
26.6%
70.2%
21.6%26.9%
0.0%
50.0%
100.0%
$0.0
$200.0
$400.0
$600.0
Q1-2012 Q2-2012 Q3-2012 Q4-2012 Q1-2013
Comprehensive Income ($M) Comprehensive Income ROAE (%)
(1) Diluted shares outstanding at end of period, which includes the effect of dilutive outstanding warrants determined using the treasury stock method, are used as the denominator for book value per share
calculation. If basic shares outstanding were used as the denominator in the calculation, book value per share would have been $11.23 at March 31, 2013. (2) Includes cash dividend of $0.32 per share and Silver Bay common stock distribution amounting to $1.01 per share. See page 3 for calculation of the Silver Bay common stock dividend.
(3) Historical dividends may not be indicative of future dividend distributions. The company ultimately distributes dividends based on its taxable income per common share, not GAAP earnings. The annualized dividend yield on the company’s common stock is calculated based on the closing price of the last trading day of the quarter.
(4) Dividend yield based on cash dividend of $0.32 only. Does not include Silver Bay common stock distribution, which amounted to $1.01 per share.
Book Value and Dividend per Share1
GAAP Net Income
Comprehensive Income
Dividends3
$51.8 $24.0 $26.8
$189.3
$143.7 $0.28
$0.11 $0.10
$0.64
$0.47
$0.00
$0.20
$0.40
$0.60
$-
$50.0
$100.0
$150.0
$200.0
Q1-2012 Q2-2012 Q3-2012 Q4-2012 Q1-2013
GAAP Net Income ($M) GAAP EPS ($)
$0.40 $0.40 $0.36
$0.55
$0.32
15.8% 15.4% 12.3%
19.9%
10.2%4
0.0%
5.0%
10.0%
15.0%
20.0%
25.0%
$-
$0.10
$0.20
$0.30
$0.40
$0.50
$0.60
Q1-2012 Q2-2012 Q3-2012 Q4-2012 Q1-2013
Dividend per Share ($) Dividend Yield (%)
$9.67 $9.94
$11.44 $11.54 $11.19
$0.40 $0.40
$0.36 $0.55
$1.332
$8.00
$10.00
$12.00
Q1-2012 Q2-2012 Q3-2012 Q4-2012 Q1-2013
Book Value ($) Dividend Declared ($)
16
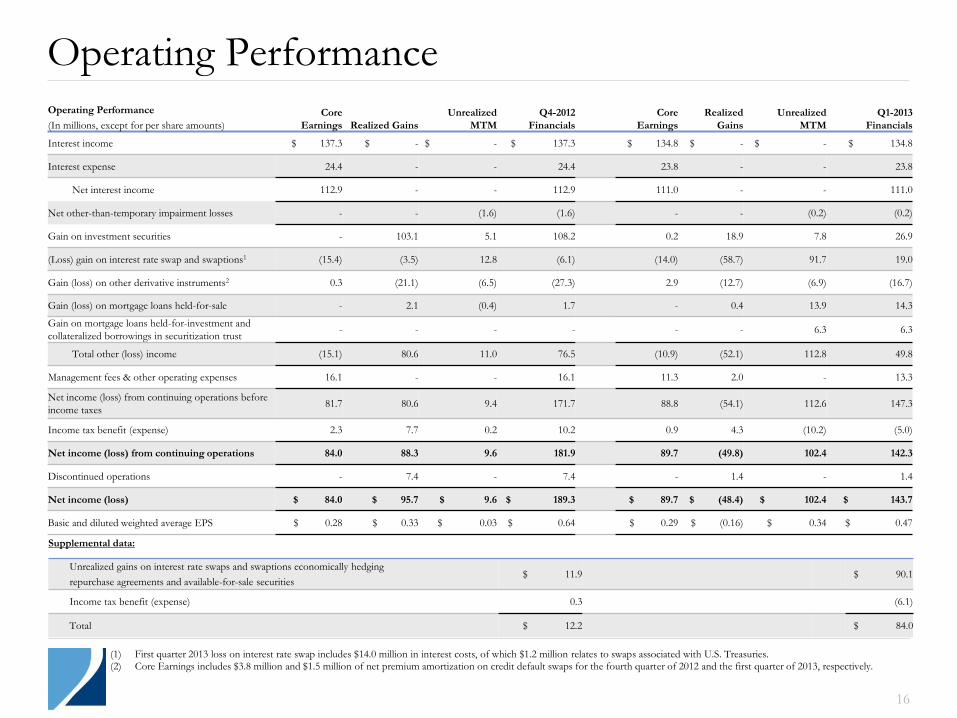
Operating Performance
(1) First quarter 2013 loss on interest rate swap includes $14.0 million in interest costs, of which $1.2 million relates to swaps associated with U.S. Treasuries. (2) Core Earnings includes $3.8 million and $1.5 million of net premium amortization on credit default swaps for the fourth quarter of 2012 and the first quarter of 2013, respectively.
Operating Performance
(In millions, except for per share amounts)
Core
Earnings Realized Gains
Unrealized
MTM
Q4-2012
Financials
Core
Earnings
Realized
Gains
Unrealized
MTM
Q1-2013
Financials
Interest income $ 137.3 $ - $ - $ 137.3 $ 134.8 $ - $ - $ 134.8
Interest expense 24.4 - - 24.4 23.8 - - 23.8
Net interest income 112.9 - - 112.9 111.0 - - 111.0
Net other-than-temporary impairment losses - - (1.6) (1.6) - - (0.2) (0.2)
Gain on investment securities - 103.1 5.1 108.2 0.2 18.9 7.8 26.9
(Loss) gain on interest rate swap and swaptions1 (15.4) (3.5) 12.8 (6.1) (14.0) (58.7) 91.7 19.0
Gain (loss) on other derivative instruments2 0.3 (21.1) (6.5) (27.3) 2.9 (12.7) (6.9) (16.7)
Gain (loss) on mortgage loans held-for-sale - 2.1 (0.4) 1.7 - 0.4 13.9 14.3
Gain on mortgage loans held-for-investment and
collateralized borrowings in securitization trust - - - - - - 6.3 6.3
Total other (loss) income (15.1) 80.6 11.0 76.5 (10.9) (52.1) 112.8 49.8
Management fees & other operating expenses 16.1 - - 16.1 11.3 2.0 - 13.3
Net income (loss) from continuing operations before
income taxes 81.7 80.6 9.4 171.7 88.8 (54.1) 112.6 147.3
Income tax benefit (expense) 2.3 7.7 0.2 10.2 0.9 4.3 (10.2) (5.0)
Net income (loss) from continuing operations 84.0 88.3 9.6 181.9 89.7 (49.8) 102.4 142.3
Discontinued operations - 7.4 - 7.4 - 1.4 - 1.4
Net income (loss) $ 84.0 $ 95.7 $ 9.6 $ 189.3 $ 89.7 $ (48.4) $ 102.4 $ 143.7
Basic and diluted weighted average EPS $ 0.28 $ 0.33 $ 0.03 $ 0.64 $ 0.29 $ (0.16) $ 0.34 $ 0.47
Supplemental data:
Unrealized gains on interest rate swaps and swaptions economically hedging
repurchase agreements and available-for-sale securities $ 11.9 $ 90.1
Income tax benefit (expense) 0.3 (6.1)
Total $ 12.2 $ 84.0

17
Silver Bay Stock Dividend1
Considerations for basis in Two Harbors common stock:
On or about April 24, 2013, Two Harbors distributed shares of Silver Bay common stock that, for tax purposes, equated to
$0.95 per share. Two Harbors’ stockholders of record as of April 2, 2013 were entitled to receive 0.048825853 shares of
Silver Bay common stock for each share of Two Harbors’ common stock (and cash in lieu of issuing fractional shares of
Silver Bay common stock).
The company intends to distribute cash in 2013 that is equal to its current and accumulated earnings and profits through
December 31, 2013, in addition to the distribution of Silver Bay common stock. The cumulative quarterly 2013
distributions of cash and Silver Bay common stock that are in excess of the current and accumulated earnings and profits
will be treated as a “nondividend distribution” for U.S. federal income tax purposes, which will have the effect of reducing
the basis of a stockholder’s shares of Two Harbors common stock.
Each quarterly distribution during 2013 will be characterized for tax purposes as having the same percentage allocation that
is designated as ordinary, capital gain, and nondividend distribution. The percentage allocation is based on the total cash
and the fair market value of property distributed relative to the annual 2013 taxable income. Therefore, the nondividend
distribution component will be allocated on a Form 1099 for federal income tax purposes to each dividend paid during
2013.
Considerations for basis in Silver Bay common stock:
Two Harbors’ stockholders will have a tax basis in the distributed Silver Bay common stock of $19.40, which was the
closing price of Silver Bay common stock on April 24, 2013.
See the Press Release “Two Harbors Investment Corp. Announces Tax Basis Information for the Distribution of Silver
Bay Realty Trust Corp. Common Stock” issued April 29, 2013 for additional information.
(1) Consult your Tax Advisor for tax advice. The tax laws require stockholders to retain records with respect to the Distribution, including information regarding the amount, basis and
fair market value relating to the Silver Bay common stock distributed. Stockholders may have additional reporting obligations to the Internal Revenue Service and/or other tax
authorities. The U.S. federal income tax treatment of holding Two Harbors common stock to any particular stockholder will depend on the stockholder’s particular tax circumstances.
You are urged to consult your tax advisor regarding the U.S. federal, state, local and foreign income and other tax consequences to you, in light of your particular investment or tax
circumstances, of acquiring, holding and disposing of Two Harbors common stock.
18
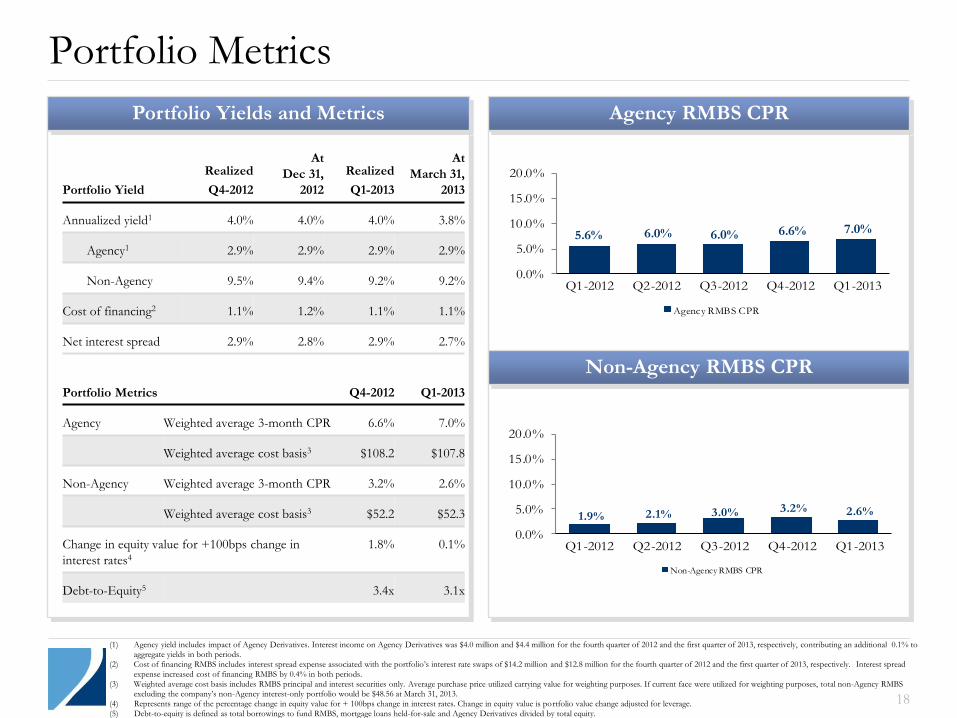
Portfolio Metrics
110
Portfolio Yield
Realized
Q4-2012
At
Dec 31,
2012
Realized
Q1-2013
At
March 31,
2013
Annualized yield1 4.0% 4.0% 4.0% 3.8%
Agency1 2.9% 2.9% 2.9% 2.9%
Non-Agency 9.5% 9.4% 9.2% 9.2%
Cost of financing2 1.1% 1.2% 1.1% 1.1%
Net interest spread 2.9% 2.8% 2.9% 2.7%
Portfolio Metrics Q4-2012 Q1-2013
Agency Weighted average 3-month CPR 6.6% 7.0%
Weighted average cost basis3 $108.2 $107.8
Non-Agency Weighted average 3-month CPR 3.2% 2.6%
Weighted average cost basis3 $52.2 $52.3
Change in equity value for +100bps change in
interest rates4
1.8% 0.1%
Debt-to-Equity5 3.4x 3.1x
Portfolio Yields and Metrics
110
Agency RMBS CPR
Non-Agency RMBS CPR
1.9% 2.1% 3.0% 3.2% 2.6%
0.0%
5.0%
10.0%
15.0%
20.0%
Q1-2012 Q2-2012 Q3-2012 Q4-2012 Q1-2013
Non-Agency RMBS CPR
5.6% 6.0% 6.0% 6.6% 7.0%
0.0%
5.0%
10.0%
15.0%
20.0%
Q1-2012 Q2-2012 Q3-2012 Q4-2012 Q1-2013
Agency RMBS CPR
(1) Agency yield includes impact of Agency Derivatives. Interest income on Agency Derivatives was $4.0 million and $4.4 million for the fourth quarter of 2012 and the first quarter of 2013, respectively, contributing an additional 0.1% to aggregate yields in both periods.
(2) Cost of financing RMBS includes interest spread expense associated with the portfolio’s interest rate swaps of $14.2 million and $12.8 million for the fourth quarter of 2012 and the first quarter of 2013, respectively. Interest spread
expense increased cost of financing RMBS by 0.4% in both periods.
(3) Weighted average cost basis includes RMBS principal and interest securities only. Average purchase price utilized carrying value for weighting purposes. If current face were utilized for weighting purposes, total non-Agency RMBS excluding the company’s non-Agency interest-only portfolio would be $48.56 at March 31, 2013.
(4) Represents range of the percentage change in equity value for + 100bps change in interest rates. Change in equity value is portfolio value change adjusted for leverage.
(5) Debt-to-equity is defined as total borrowings to fund RMBS, mortgage loans held-for-sale and Agency Derivatives divided by total equity.
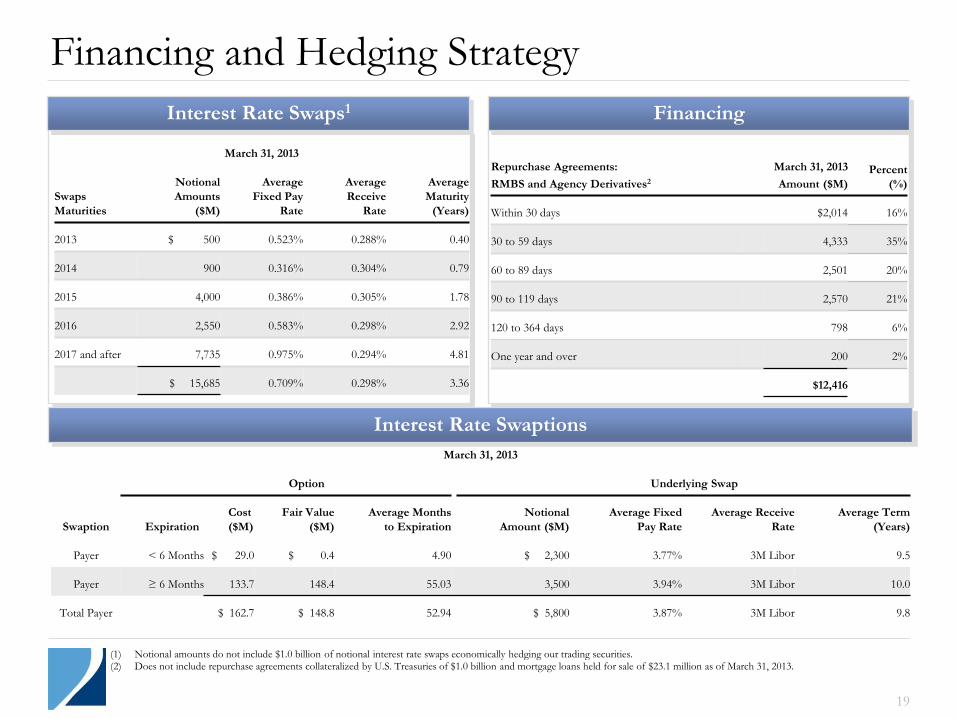
110 110
March 31, 2013
Swaps
Maturities
Notional
Amounts
($M)
Average
Fixed Pay
Rate
Average
Receive
Rate
Average
Maturity
(Years)
2013 $ 500 0.523% 0.288% 0.40
2014 900 0.316% 0.304% 0.79
2015 4,000 0.386% 0.305% 1.78
2016 2,550 0.583% 0.298% 2.92
2017 and after 7,735 0.975% 0.294% 4.81
$ 15,685 0.709% 0.298% 3.36
19
Financing and Hedging Strategy
(1) Notional amounts do not include $1.0 billion of notional interest rate swaps economically hedging our trading securities. (2) Does not include repurchase agreements collateralized by U.S. Treasuries of $1.0 billion and mortgage loans held for sale of $23.1 million as of March 31, 2013.
Interest Rate Swaps1 Financing
Interest Rate Swaptions
March 31, 2013
Option Underlying Swap
Swaption Expiration
Cost
($M)
Fair Value
($M)
Average Months
to Expiration
Notional
Amount ($M)
Average Fixed
Pay Rate
Average Receive
Rate
Average Term
(Years)
Payer < 6 Months $ 29.0 $ 0.4 4.90 $ 2,300 3.77% 3M Libor 9.5
Payer ≥ 6 Months 133.7 148.4 55.03 3,500 3.94% 3M Libor 10.0
Total Payer $ 162.7 $ 148.8 52.94 $ 5,800 3.87% 3M Libor 9.8
Repurchase Agreements:
RMBS and Agency Derivatives2
March 31, 2013
Amount ($M)
Percent
(%)
Within 30 days $2,014 16%
30 to 59 days 4,333 35%
60 to 89 days 2,501 20%
90 to 119 days 2,570 21%
120 to 364 days 798 6%
One year and over 200 2%
$12,416
20
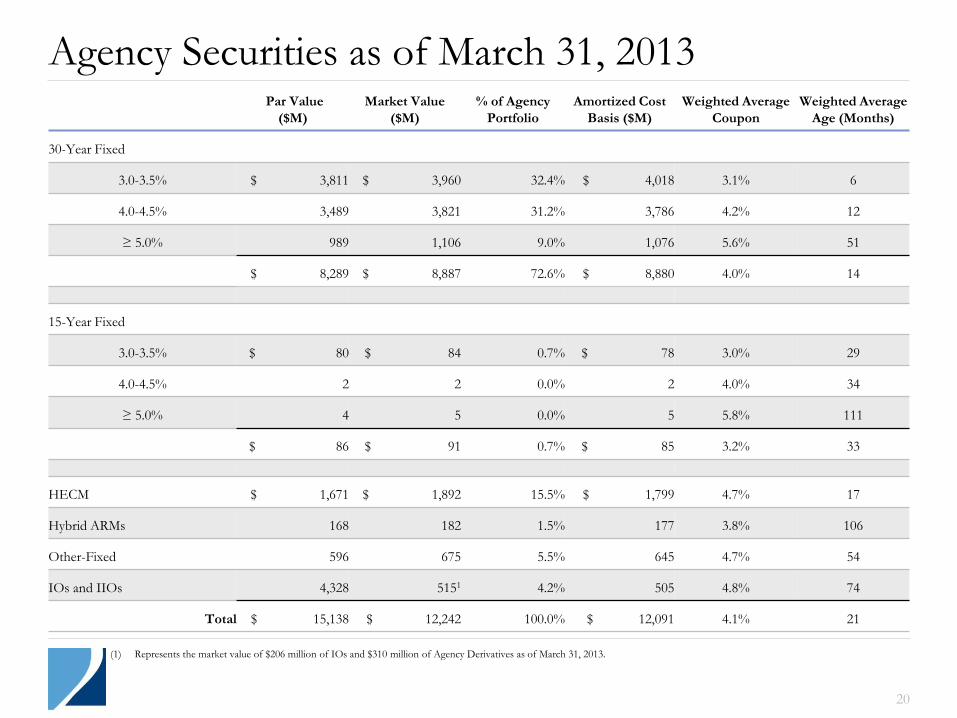
Agency Securities as of March 31, 2013 Par Value
($M)
Market Value
($M)
% of Agency
Portfolio
Amortized Cost
Basis ($M)
Weighted Average
Coupon
Weighted Average
Age (Months)
30-Year Fixed
3.0-3.5% $ 3,811 $ 3,960 32.4% $ 4,018 3.1% 6
4.0-4.5% 3,489 3,821 31.2% 3,786 4.2% 12
≥ 5.0% 989 1,106 9.0% 1,076 5.6% 51
$ 8,289 $ 8,887 72.6% $ 8,880 4.0% 14
15-Year Fixed
3.0-3.5% $ 80 $ 84 0.7% $ 78 3.0% 29
4.0-4.5% 2 2 0.0% 2 4.0% 34
≥ 5.0% 4 5 0.0% 5 5.8% 111
$ 86 $ 91 0.7% $ 85 3.2% 33
HECM $ 1,671 $ 1,892 15.5% $ 1,799 4.7% 17
Hybrid ARMs 168 182 1.5% 177 3.8% 106
Other-Fixed 596 675 5.5% 645 4.7% 54
IOs and IIOs 4,328 5151 4.2% 505 4.8% 74
Total $ 15,138 $ 12,242 100.0% $ 12,091 4.1% 21
(1) Represents the market value of $206 million of IOs and $310 million of Agency Derivatives as of March 31, 2013.

21
Non-Agency Securities as of March 31, 2013
Senior Bonds Mezzanine Bonds Total P&I Bonds
Portfolio Characteristics
Carrying Value ($M) $2,451 $576 $3,027
% of Non-Agency Portfolio 81.0% 19.0% 100.0%
Average Purchase Price1 $51.05 $57.35 $52.25
Average Coupon 1.8% 1.3% 1.7%
Collateral Attributes
Average Loan Age (months) 78 98 82
Average Loan Size ($K) $249 $182 $236
Average Original Loan-to-Value 77.1% 76.2% 77.0%
Average Original FICO2 632 634 632
Current Performance
60+ Day Delinquencies 36.8% 31.3% 35.7%
Average Credit Enhancement3 13.2% 30.0% 16.4%
3-Month CPR4 2.4% 3.4% 2.6%
(1) Average purchase price utilized carrying value for weighting purposes. If current face were utilized for weighting purposes, the average purchase price for senior, mezzanine and total non-Agency RMBS,
excluding our non-Agency interest-only portfolio, would be $47.23, $55.18 and $48.56, respectively, at March 31, 2013. (2) FICO represents a mortgage industry accepted credit score of a borrower, which was developed by Fair Isaac Corporation.
(3) Average credit enhancement remaining on our non-Agency RMBS portfolio, which is the average amount of protection available to absorb future credit losses due to defaults on the underlying collateral. (4) 3-Month CPR is reflective of the prepayment speed on the underlying securitization; however, it does not necessarily indicate the proceeds received on our investment tranche. Proceeds received for each
security are dependent on the position of the individual security within the structure of each deal.
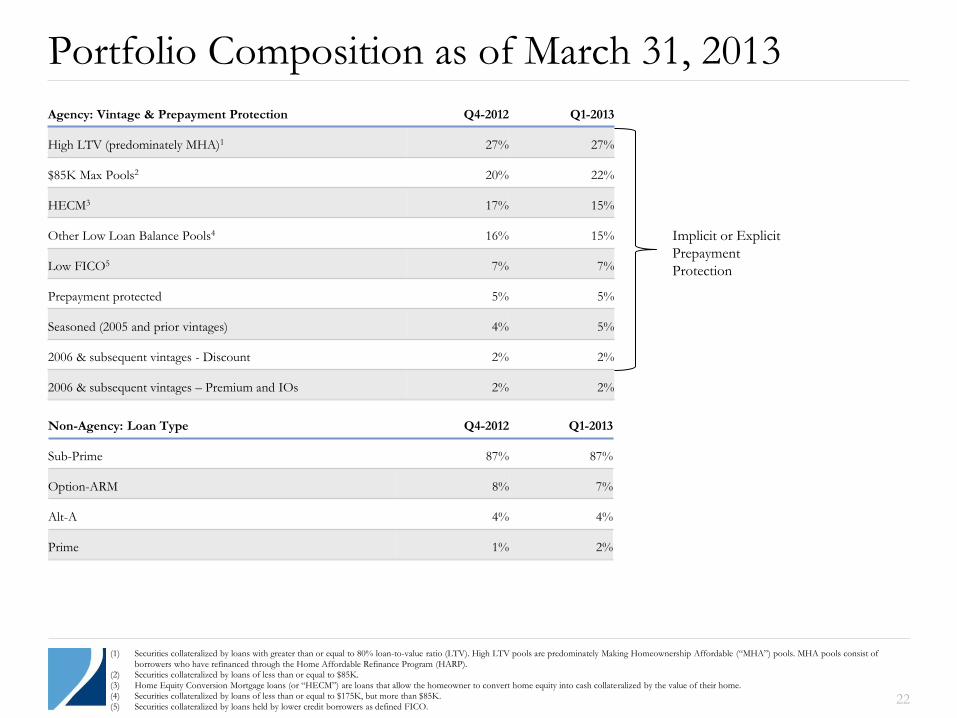
Agency: Vintage & Prepayment Protection Q4-2012 Q1-2013
High LTV (predominately MHA)1 27% 27%
$85K Max Pools2 20% 22%
HECM3 17% 15%
Other Low Loan Balance Pools4 16% 15%
Low FICO5 7% 7%
Prepayment protected 5% 5%
Seasoned (2005 and prior vintages) 4% 5%
2006 & subsequent vintages - Discount 2% 2%
2006 & subsequent vintages – Premium and IOs 2% 2%
Portfolio Composition as of March 31, 2013
Implicit or Explicit
Prepayment
Protection
Non-Agency: Loan Type Q4-2012 Q1-2013
Sub-Prime 87% 87%
Option-ARM 8% 7%
Alt-A 4% 4%
Prime 1% 2%
(1) Securities collateralized by loans with greater than or equal to 80% loan-to-value ratio (LTV). High LTV pools are predominately Making Homeownership Affordable (“MHA”) pools. MHA pools consist of
borrowers who have refinanced through the Home Affordable Refinance Program (HARP). (2) Securities collateralized by loans of less than or equal to $85K.
(3) Home Equity Conversion Mortgage loans (or “HECM”) are loans that allow the homeowner to convert home equity into cash collateralized by the value of their home. (4) Securities collateralized by loans of less than or equal to $175K, but more than $85K.
(5) Securities collateralized by loans held by lower credit borrowers as defined FICO. 22