two essays on the unintended consequences of sarbanes
TRANSCRIPT

Kennesaw State UniversityDigitalCommons@Kennesaw State University
Dissertations, Theses and Capstone Projects
4-1-2013
Two Essays on the Unintended Consequences ofSarbanes-Oxley on Small Banks and SmallBusinessesEarl C. HowellKennesaw State University
Follow this and additional works at: http://digitalcommons.kennesaw.edu/etdPart of the Business Administration, Management, and Operations Commons
This Dissertation is brought to you for free and open access by DigitalCommons@Kennesaw State University. It has been accepted for inclusion inDissertations, Theses and Capstone Projects by an authorized administrator of DigitalCommons@Kennesaw State University.
Recommended CitationHowell, Earl C., "Two Essays on the Unintended Consequences of Sarbanes-Oxley on Small Banks and Small Businesses" (2013).Dissertations, Theses and Capstone Projects. Paper 554.

TWO ESSAYS ON THE UNINTENDED CONSEQUENCES
OF SARBANES-OXLEY ON SMALL BANKS
AND SMALL BUSINESSES
by
Earl C. Howell
A Dissertation
Presented in Partial Fulfillment of Requirements for the
Degree of
Doctor of Business Administration
In the
Coles College of Business
Kennesaw State University
Kennesaw, Georgia
2013

Coles College of Business Doctor of Business Administration
Dissertation Defense: April17, 2013
DBA Candidate: Earl Howell (Cohort 1, Management)
The content and format of the dissertation are appropriate and acceptable for the awarding of
the degree of Doctor of Business Administration.
Lance E. Brouthers, PhD Committee Chair Professor of Management Department of Management & Entrepreneurship Coles College of Business Kennesaw State University
Scott M. Widmier, PhD Committee Member Associate Professor of Marketing Department of Marketing and Professional Sales Coles College of Business Kennesaw State University
Dana Hermanson, PhD Reader Professor of Accounting Dines Eminent Scholar Chair of Private Enterprise School of Accountancy Kennesaw State University
Neal P. Mero, PhD Executive Director, KSU DBA Program Professor of Management Department of Management and Entrepreneurship
Signature: tl2 E-:7
SignatureA~
Signature:Q __ [.._-______ _
Kennesaw State University Signature:
Charles J. Amlaner, Jr., DPhil Vice President for Research and Dean of Graduate College Kennesaw State University

iii
ACKNOWLEDGMENTS
I am indebted to many who have provided support and guidance throughout the production of this work: To the Coles College of Business Doctorate in Business Administration staff for providing the platform for my efforts, To my classmates, now friends, who made the classroom rewarding, To Dr. Lance Brouthers and Dr. Scott Widmier, my committee, and Dr. Dana Hermanson, my reader, whose guidance and patient teaching have made it possible for me to appreciate the extraordinary challenge of scholarship, And to my wife, Rosalind, without whose encouragement, indulgence and support, I would not have completed this journey.

iv
ABSTRACT
TWO ESSAYS ON THE UNINTENDED CONSEQUENCES OF SARBANES-OXLEY
ON SMALL BANKS AND SMALL BUSINESSES By
Earl C. Howell
These essays examine the impact of the Sarbanes-Oxley Act on small banks
(Essay #1) and small businesses (Essay #2). Sarbanes-Oxley (SOX), passed in 2002 by
the Congress of the United States, was intended to enhance the security of the public
shareholder through extensive reporting and compliance programs. As some compliance
costs are fixed, the costs of SOX would logically fall disproportionately upon smaller
banks, possibly producing unintended consequences. These costs if significant may
impact the bank’s choice of strategy. How then can the bank respond? The expectation
of a negative impact on small banks is well documented, and consistent with this
expectation I found that small public banks’ ratio of expense post Sox increased more
than that of large public banks. However pretax earnings for small listed banks post SOX
compared to pre SOX was indistinguishable from that of large banks, suggestive of
coping strategies. However, I found that fewer small banks elected public reporting
status post SOX, reflective of the higher perceived cost of public market membership and
that a significant number of financial institutions elected to exit the public securities
market. Turning to the impact on small businesses, while small banks had reduced
capital accumulation post SOX on a scale similar to that of large banks, the business
lending of small listed banks was significantly higher than that of large banks. Small
v
businesses, which depend significantly upon small banks for their lending, are thus not
potentially constrained in their growth efforts in the post SOX period, at least with
respect to listed banks. I find, in contrast with the direct effect of the costs of SOX, a
significant impact upon small banks making a capital market decision. The reduction in
the number of banks electing public market membership is a shift in the small banking
growth model and may suggest a future weakening in small banking support for small
business. This research shows how the initial perception of legislation impacts capital
market decisions and may create a long-term resource constraint downstream for
dependent small companies, thus suggesting a potential future framework for the
evaluation of intended regulation.

vi
TABLE OF CONTENTS
Title Page ..............................................................................................................................
Signature Page .................................................................................................................... ii
Acknowledgments .............................................................................................................. iii
Abstract .............................................................................................................................. iv
Table of contents ................................................................................................................ vi
List of Tables ................................................................................................................... viii
Summary of Research ......................................................................................................... 1
Essay #1 – Sarbanes-Oxley, its Impact on Small Banks and their Response ..................... 5
Introduction ......................................................................................................................... 5
Literature Review ................................................................................................................ 8
Methods ............................................................................................................................. 24
Findings ............................................................................................................................. 33
Conclusion ........................................................................................................................ 39
Limitations ........................................................................................................................ 42
Suggestions for future research ......................................................................................... 44
Essay #2: Bank Capital and Small/New Business Lending ............................................. 46
Introduction ....................................................................................................................... 46
Literature Review .............................................................................................................. 48
Methods ............................................................................................................................. 57

vii
Findings ............................................................................................................................. 63
Conclusion ........................................................................................................................ 68
Limitations ........................................................................................................................ 73
Suggestions for future research ......................................................................................... 74
References ......................................................................................................................... 68

viii
LIST OF TABLES
Table Page
1 Descriptive Statistics – Essay 1……………………………………………….34 2 Correlations – Essay 1………………………………………………………...34 3 Hierarchical Regression Results for Other Expense.…………………………36 4. Hierarchical Regression Results for Pretax Income ………………………….37 5. U.S. Financial Institutions by Size and Public Reporting Category …………39 6. Descriptive Statistics – Essay 2………………………………………………66 7. Correlations – Essay 2………………………………………………………..67 8. Hierarchical Regression Results for Equity Capital………………………….68 9. Hierarchical Regression Results for Business Loans………………………...69

1
SUMMARY OF RESEARCH
Banking is at the heart of our economy with key roles in recession and in
recovery. The prudent use of public depositors’ funds is overseen by a variety of
regulators both state and federal. This regulation, while well intentioned, may have
unintended consequences with profound effects for the economy generally.
These papers examine one such regulation: the passage of the Sarbanes-Oxley
Act. Sarbanes-Oxley, passed in the wake of numerous failures of corporate governance,
was intended to safeguard funds invested in public companies on principal stock
exchanges as overseen by the U.S. Securities Exchange Commission. While sweeping in
its coverage, it is unclear whether SOX has been effective on behalf of public
shareholders (Ashbaugh-Skaife, Collins, Kinney, & LaFond, 2008; Chhaochharia &
Grinstein, 2007; Hostak, Karaoglu, Lys, & Yang, 2009; Leuz, Nasharr, Swanson, &
Chatz, 2007), and its compliance burden has been acknowledged (U.S. Securities and
Exchange Commission, 2006).
Monitoring of all kinds has an associated cost. In this case, however, we ask
whether the cost of new regulation is borne equally by all banks, and, if not, are there any
consequences of the differential cost burden? We find that, in contrast with Barr, Killgo,
Siems and Zimmel (2002), SOX has not had a disproportionate impact on small banks.
While not directly a banking regulation, SOX has had a significant impact on
small banks and small business. Small banks play a pivotal role in providing capital for
small and start-up businesses (Sharpe, 1997). Small businesses, in turn, provide 60-80%
of net new jobs created in the United States, including 40% of critical high technology

2
positions (U.S. Department of Commerce, Bureau of the Census and International Trade
Statistics). This process of job creation is central to the soundness of the U.S. economy.
In my first essay, I examine the impacts of SOX directly upon banks. Using
Transaction Cost Theory (Barr et al., 2002; Williamson, 1983, 1991a), I hypothesize that
the direct cost impact will be significantly greater for small banks versus larger
institutions. I further hypothesize that this cost impact will be manifested in a reduction
of small listed banks’ pretax income. Finally, I hypothesize that the passage of SOX
resulted in a reduction in the number of small banks electing public market participation.
I used a sample of 117 banks from the Federal Financial Institutions Examining
Council (FFIEC) database. I selected 60 large and 57 small banks randomly from the
database, excluding certain types of banks that do no company lending, banks that have
elected Subchapter S tax treatment, any bank that was acquired before the end of the
observation period, and statistical outliers. The data was drawn for two time periods:
1998-2000, the period immediately preceding SOX, and 2004-2006, the time period after
SOX. The three years of data are averaged for each observation period to dampen the
impact of a single year’s results.
Using hierarchical regression, I found support for the hypothesis that the direct
cost impact of SOX would be significantly greater for small listed banks, but not for the
hypothesis asserting that the impact would also be significant on pretax income. The
failure to support the pretax income hypotheses may reflect the general data “noise” in
income, or the induced profitability enjoyed in the second observation period as a result
of the different interest rate environment (Berger & Humphrey, 1991). Alternatively, as
this was a study of survivors, that is companies that operated throughout the SOX

3
implementation period, the lack of differentiation may represent successful coping
strategies. Using a population study, I examined the final hypothesis and found support
for the expected reduction in small listed banks post SOX.
In my second essay, I consider, in the context of both small banks and small
business, the likely follow-on impacts that would result from SOX. With Resource
Dependence Theory as a framework, I first hypothesize capital will be reduced generally
for small financial institutions. This is of particular importance as banks are only allowed
growth in assets and hence in loans in strict ratio to their underlying equity. Therefore, I
further hypothesize that this reduction in capital will be accompanied by a reduction in
the amount of small business lending done by small banks.
I use the same sample as in Essay 1. Using hierarchical regression I find no
significant support for the first hypothesis that post SOX small listed banks will have less
capital. I also find no empirical support for the second hypothesis predicting reduced
business lending by small banks. Moreover, there is a statistically significant growth in
lending among small banks, in direct contrast with the hypothesis.
Based on my results, Transaction Cost Theory appears to explain the impact of
compliance costs in the public market for equity for small banks in so far as choice of
markets for capital is concerned. In Essay 2 however, the value of Resource Dependence
Theory as a theoretical prism for assessing the down-stream effects of a reduction in
listed community banks’ lending capacity for small businesses is in doubt, as capital is
not reduced and loans by small banks grew significantly.
Of interest then is whether, in Essay 1, the expectation rather than actual impact
on earnings, capital and in turn loans influenced the decision on the part of a clearly

4
significant number of banks to remain private. Further, it will be of interest to understand
the coping strategies employed by the listed banks to balance the additional costs of SOX
and whether these strategies have a long-term impact.
I view this effort as “research opening” in that it raises other questions about the
impact of other federal regulation, such as Dodd-Frank, on smaller businesses. Thus, this
dissertation may provide a potential framework for the future evaluation of the impact of
compliance costs of proposed federal regulation.

5
ESSAY #1 – SARBANES-OXLEY, ITS IMPACT ON SMALL BANKS AND THEIR
RESPONSE
Introduction
Has the passage of Sarbanes-Oxley (SOX) affected all banks in the same manner?
And what actions have they taken in response? SOX-related regulation, created in the
aftermath of financial scandals of the 1990s and early 2000s, was intended: “To protect
investors by improving the accuracy and reliability of corporate disclosures made
pursuant to the securities laws, and for other purposes” ("Sarbanes-Oxley Act of 2002,").
While the net benefits of Sarbanes-Oxley (SOX) are still being debated (Ashbaugh-
Skaife et al., 2008; Chhaochharia & Grinstein, 2007; Hostak et al., 2009; Leuz et al.,
2007), it is clear that there is a disclosure and reporting driven financial cost that must be
borne by companies that elect to access the public market.
These costs are important in a regulated industry such as banking that derives its
productive capacity for lending from its capital base. The Securities and Exchange
Commission stated that they believed the costs of SOX would increase commensurate
with the size of the company (U.S. Securities and Exchange Commission, 2003). Despite
the SEC’s contention, I suggest that the fixed element of SOX compliance costs has an
impact that varies dramatically according to firm size. The general compliance activities
required of all reporting companies represent a direct cost in additional analysis and
reporting, as well as outside auditing. These costs approach .5% of net profit for a bank
with $10 billion in assets (the lower bound for the largest banks), but increase to 5% of
profit for a bank with $1 billion in assets (the upper bound for a typical small/community

7
bank) and 10% of profit for a midrange small bank (Barr et al., 2002). This reduction of
earnings, manageable for large banks, creates a dilemma for small banks. They must
consider whether the costs of compliance, essential to listing on a public market, are
balanced by the value that public market access represents. In short, they must choose
among markets for capital. The public market offers a low cost of funds at a significant
cost of compliance, while the private market for funds is both more expensive and offers
less capacity.
Listed banks of any size, faced with the prospect of increased costs resulting from
requirements associated with their public listing, have three strategic responses available
to them. First, they can accept the increased costs, take no countervailing action and
accept the resultant decrease in profitability as the cost is ultimately reflected in the
financial statements of the institution. Second, they can reduce costs elsewhere to avoid a
reduction of income. Third, they can elect to leave the public markets and raise capital in
other venues.
In this essay, I examine the impact of SOX on small banks using Transaction Cost
Theory (TCT). TCT provides a framework in which to examine market choices in light
of both the direct and indirect costs of a transaction (Williamson, 1983). The theory
states that a transaction will be undertaken in such a way as to minimize the cost of
carrying it out (Williamson, 1991b). While the attractiveness of the public market is
clear on a direct cost basis, TCT, by considering the associated indirect costs of
compliance, affords a more complete consideration of the true transaction costs.
For this reason, TCT is useful in examining the impact of SOX on small financial
institutions’ costs, earnings, and capital market selection. More specifically, I

8
hypothesize that the impact of SOX on small banks was: (H1) to increase costs; (H2) to
provide no offsetting benefit, resulting in a reduction in earnings; and (H3) as a
consequence, to have a negative impact on capital market selection (i.e., fewer small
banks accessing the public market). Summing up, I hypothesize that small banks after
SOX had significantly higher costs, significantly lower earnings, and reduced access to
public capital markets.
This paper uses a pre-test, post-test design with a comparison group. The
treatment group consists of an initial sample of 57 smaller financial institutions. The
comparison group consists of an initial sample of 60 of the nation’s largest banks. The
data was collected from the Financial Institutions Examination Council Central Data
Repository and the Securities and Exchange Commission EDGAR database. Data was
collected on 57 randomly selected small banks and 60 randomly selected large banks for
the time periods of 1998-2000 and 2004-2006. Both are three-year study periods with
one occurring prior to SOX’s passage and the other occurring after SOX became law.
Literature Review Transaction Cost Theory.
Transaction Cost Theory (TCT) provides that a transaction will be undertaken in
such a way as to minimize the cost of carrying it out (Williamson, 1991b). Transactions
can either take place in a market or in a hierarchical setting (essentially a firm exhibiting
some level of vertical or horizontal integration). According to TCT the choice of which
venue to choose is determined by a consideration of the total costs of the transaction
(direct and indirect). TCT assumes that the decisions are taken in a behavioral context of
bounded rationality, opportunism, and risk neutrality (Rindfleisch & Heide, 1997). The
9
driving structural elements of the transaction are: uncertainty, asset specificity, and
transaction frequency.
There are two types of uncertainty. The first type, behavioral uncertainty, is
defined as a risk that parties to a contract will not perform as agreed. It results from the
potential for opportunistic behavior by parties to the transaction (Sutcliffe & Zaheer,
1998). “Self-interest seeking with guile” is the description used by Williamson (1993).
Behavioral uncertainty stems from the difficulty of monitoring behavior by the agent
(opportunism), differences in risk sharing perspectives between parties to the transaction
(how do I know you’ll deliver/how do I know you’ll pay) (Brown & Eisenhardt, 1998),
or from the exploitation of a contract weakness. In all cases behavioral uncertainty
reduces the efficiency of the transaction.
The second type, environmental uncertainty, is defined as the inability of the firm
to successfully forecast changes in the environment. These might include changes in
governmental policy, the macroeconomic effect of inflation, exchange and interest rates,
changes in the quality and availability of materials, shifts in market preference and
product demand, and changes in the competitive structure of the market (L. E. Brouthers,
Brouthers, & Werner, 2000). Environmental uncertainty is exogenous to the firm (Folta,
1998) and concerns factors such as customer actions, raw material supplies, capital
sources, and changes in technology.
Both types of uncertainty have an impact upon the final decision in an
organizational strategy context. A useful example can be drawn from entry mode studies
that contrast the entry mode choices of service firms with those of manufacturers. Both
types of firms are affected differently by the types of uncertainty, but satisfaction with

10
performance is increased when firms examine both types of uncertainty and integrate
appropriate responses to them into their governance structures (Keith D. Brouthers &
Brouthers, 2000).
Asset specificity is defined as assets, unique to the needs of the firm, “that cannot
be costlessly redeployed to other uses” (Balakrishnan & Fox, 1993:3). Firms pursue
vertical integration when asset specificity is high because the benefits of control outweigh
the costs. Conversely, when asset specificity is low, firms purchase in the market as the
cost of control cannot be recouped by internal production (Erramilli & Rao, 1993).
Asset specificity recognizes the degree of uniqueness of the assets central to the
transaction. Williamson (1983) identifies four kinds of specificity: site assets, the
dedication of assets to a location; physical assets, special dies and forms; human assets,
specialists with, for example, specialized training; and dedicated assets, as in capacity
designed solely to support a particular customer. While generally considered in the
context of hard assets, intangibles can also be considered to be transaction specific assets.
For example, the development of a focused and dedicated sales force driving forward
market channel internalization represents an investment in a specialized asset specific to
the products and markets of the firm (Shervani, Frazier, & Challagalla, 2007). Consistent
with the notion of asset specificity, the redeployment of this sales force would require
further investment in retraining and at a significant additional cost.
The particular type of asset specificity employed and/or encountered by a given
firm may shift according to industry structure. For instance, service industries may be
more sensitive to human asset specificity, while manufacturing companies are more
driven by consideration of physical assets (Keith D. Brouthers & Brouthers, 2003).

11
Transaction frequency is defined as the number of times a transaction recurs. It is
the least studied of the three structural elements. Transaction frequency creates a
potential for cost savings by internalizing the production of frequently purchased assets if
the product is produced internally at a cost lower than that available in the market
(Safizadeh, Field, & Ritzman, 2008). Frequency could include the number of trades with
an established partner (Baker, Gibbons, & Murphy, 2002) or how often an item is traded
in the marketplace (Williamson, 1991a). In either case, the volume of activity helps to
determine whether the firm should either make the product or buy it. This decision often
reflects the consideration of a number of issues such as the security of multiple external
manufacturers, the cost of adding manufacturing capacity and the potential for
product/model obsolescence (L. E. Brouthers et al., 2000).
Thus, TCT is a model of firm behavior that addresses behavioral and
environmental uncertainty, frequency of transaction, and specificity of assets. Moreover,
TCT provides that the purchasing party in a transaction considers indirect costs, like
compliance costs, in determining the appropriate transaction structure. Consequently, the
impact of such ancillary considerations as costs and fees, resulting from the effect of
regulation, can be reflected in the likely outcome. In contrast with the Modigliani and
Miller (1958) model, which held taxes as irrelevant and capital instruments as largely
interchangeable, TCT provides a framework in which to judge the operational impact of
the complete range of costs including regulatory assessment, increased audit costs, and
the costs of governance occasioned by Board of Directors activities. TCT holds that
substantial costs, whether they are direct (such as interest costs) or indirect (such as the

12
cost of regulatory compliance), may influence whether banks choose public or private
markets.
TCT considers both direct and indirect costs. To examine the likely impact of
SOX, I first establish the direct cost impact of compliance for small banks. TCT allows
for consideration of the complete range of costs with a view toward judging whether the
costs, taken in total, are significant such that they affect decisions about the acquisition of
goods or services. In assessing the cost impact of SOX, I consider the range of direct
costs that a small bank would be forced to incur to achieve compliance. These include,
but are not limited to: costs incurred in the annual audit, costs incurred for a second audit
firm to perform the control review, additional board of director costs for SOX activities,
and systems costs (both hardware and software related) to provide for general control
tracking or to strengthen the information technology systems to meet control
requirements (U.S. Government Accountability Office, 2006). TCT holds that the total
final cost is the determining factor in the market selection decision.
Of significance is the timing and extent of SOX compliance for the sample banks
chosen here. SOX required filing compliance based upon the market value of the entity’s
securities on a public exchange. Accelerated filers, with at least $75 million of public
market securities, were required to file commencing with the first fiscal year ending after
November 15, 2004. The banks chosen for the small bank sample had assets in 2000 of
$300 to $500 million requiring $30 to $50 million of nominal capital (approximately 10%
of assets). Banks traded throughout the period at a market value of 1.5 times book or
greater (Argus Research, 2008). With growth from 2000 to 2004, each of the institutions

13
likely either qualified as an accelerated filer or was rapidly approaching that status.
Therefore we expect the costs of compliance to be observable among the small banks.
It is possible that SOX, in addition to requiring the incurrence of the direct costs
enumerated above, could also provide reduced indirect costs or additional operational
benefits that offset the direct costs such that the total costs are the same as before or
lower. Benefits could be reflected in lower costs of sales, marketing, or transportation.
SOX could also serve to lower other state, federal, or local compliance costs. If these
benefits were present, from whatever source and however diffuse, then their impact could
be considered in combination with their costs. If there is no reduction of net income, then
we conclude that absent some identifiable benefit, the shortfall created by direct costs is
balanced by some combination of cost saving initiatives or deferrals. Small banks, for
example, are sensitive to the relatively high fixed costs of key marketing initiatives such
as geographic expansion and key personnel acquisition. Thus small banks may have
elected to defer building the next branch or adding expensive lending staff. If however,
notwithstanding any savings resulting from operational benefits, there is a negative
impact to net income then, consistent with TCT, a resulting shift in market preference
from the public to the private market for capital is expected.
Each of these choices could impact the growth rate of the banks and hence the
capacity of the bank to provide loans to small business (examined in Essay #2).
Regulatory Environment.
It is useful to review the compliance environment for financial institutions at the
time of the passage of SOX. Banking is a highly regulated industry with both state and
federal regulatory bodies providing oversight of both the bank, and where applicable, its

14
holding company. Nevertheless, combinations of economic downturn, legislative action
and managerial excess can lead to significant losses from financial institutions and the
industry. The savings and loan crisis of the mid 1980’s to mid 1990’s resulted in the
failure of 747 of the 3,234 savings and loan institutions in the U.S. This led to the passage
of two significant pieces of regulation. The Financial Institutions Restitution and
Recovery Act of 1989 (FIRREA) provided significant enforcement authority for
regulators by granting the power to impose Cease and Desist Orders and to assess
administrative civil money penalties from officers and directors. This was followed in
1991 by the Federal Deposit Insurance Corporation Improvement Act (FIDICIA). This
act provided for the assessment of and attestation to the sufficiency of financial controls
by senior management, and in the case of large banks, their auditors. Initially the
reporting threshold for FIDICIA was established at $500 million and was raised to $1
billion in 2006. Thus financial institutions already faced the potential for significant fines
and a requirement to attest to the sufficiency of their controls. SOX as passed in 2002,
like FIDICIA, focused in large part upon the sufficiency of internal control systems and
activities but added significant additional cost with the requirement for external testing,
and the extension to nonbank subsidiaries and to the holding company. In the period
immediately after passage of SOX, the SEC began to adjust the required date of
implementation for filers with large accelerated filing companies (greater than $700
million of public common equity securities) filing immediately, and accelerated filers
(equity of $75 million to $700 million of public common equity securities) required to
file for the first fiscal year ending after November 2004. The implementation date for

15
non-accelerated filers was delayed a number of times, finally ending with their exemption
from filing under the Dodd-Frank Act of 2010.
Strategy Choices for Small Banks.
Most banks follow a similar initial path from inception to a size of about $300
million. Upon approval to proceed by the appropriate regulatory authority, a start-up
bank will raise, from founders and the local community, the agreed amount of capital.
With this capital, the new bank commences operations and, with local deposits providing
loanable funds, begins to build a balance sheet and create an income stream. Once
profitability is achieved, additions to the capital accounts provide a basis for further
lending. Absent access to additional capital, the bank is constrained to that level of
growth supported by the annual increase in capital from earnings. For a bank earning 1%
on assets (an approximation of average results) this translates into a maximum of 10%
growth in assets a year. This results from the regulatory requirement to maintain a capital
ratio (capital to assets) of 10%.
SOX and Smaller Bank Direct Costs.
The Sarbanes-Oxley Act (SOX), passed on July 30, 2002 was intended “to help
protect investors and restore investor confidence” (U.S. Government Accountability
Office, 2006). The Act prescribes a program of public company accounting standards
and corporate governance review, attention to corporate and criminal fraud accountability
with enhanced associated penalties, and a heightened assessment and reporting of internal
control structure and effectiveness [HR 3763]. It is the last area of internal control
review, designated as Section 404, which accounts for a significant cost to public
corporations. Total costs include those costs established by the act to support new
16
infrastructure and the direct costs borne by individual companies that must comply with
the provisions of the act.
The cost of implementation of the public infrastructure called for in the act is
significant. The act directs the establishment of a new agency, The Public Company
Accounting Oversight Board (PCAOB). Studies document the costs of compliance with
the act ($599,627,000 for the first 7 years of operating costs of the PCAOB alone, with
one major fine of $1,000,000) (Gilbertson & Herron, 2009). This cost is recovered
through the assessment of fees on public corporations.
The most immediate strategic impact on smaller financial institutions is the
financial burden that SOX compliance creates. The Securities and Exchange
Commission (SEC), in a 2009 empirical study of public reporting companies (n = 2842),
provides a clear assessment of that impact. More specifically, compliance with SOX
requires additional auditing, reporting, and Board of Directors activity, with associated
costs that are non-linear with respect to firm size (U.S. Securites and Exchange
Commission, 2009). Krishnan et al. (2008) in a broad study of SOX related expenses in
non-financial firms identify three types of costs: additional audit fees, internal labor costs
and consulting/technology expenses. This later category would include outsourced
assistance by an additional accounting firm to perform the initial assessment of the
internal control environment, which would in turn lead to additional auditing fees in the
review of the work. Once established, the internal controls must be reviewed annually
and maintained. Krishnan et al. (2008) further identified the highly significant costs that
arise if the internal control review drives restatement of the financial statements.
Financial institutions, as regulated entities, undergo frequent auditing from multiple

17
parties, have extensive internal control experience, and have very few restatements for
the critical period 2004-2006. Banks have 18 total restatements for the three years versus
3,316 for all public reporting companies. Thus, we conclude that financial institutions
are principally exposed to the governance-related costs of SOX (Audit Analytics, 2007)
as opposed to the costs of control deficiency remediation. These governance-related
costs, a requirement of public market access, can be up to 40 times greater (taken as a
percent of revenue) for smaller banks than for the largest banks (U.S. Securites and
Exchange Commission, 2009), and are highly meaningful for smaller financial
institutions, potentially rendering the public market too expensive. Small banks,
sometimes referred to as community banks, are generally $1 billion or less in total asset
size, while the top 50 banks in the U.S. range from $25 billion to $2.3 trillion in assets
(U.S. Federal Reserve, 2012). Thus, a given fixed cost has a much greater impact on
smaller banks than on larger ones. Of significance for this study is the initial question of
whether the costs, post-SOX are a significant differentiator between small public and
large public banks.
Hence, based on the above literature I hypothesize:
H1: Post-SOX SEC reporting small banks’ costs are statistically significantly
higher than those of large reporting banks, as compared to the pre-SOX costs for
the same two samples of banks.
SOX and Smaller Bank Indirect Costs or Benefits.
Researchers propose that if there are direct costs of SOX, they can be offset by
some resulting reduction in indirect costs due to SOX compliance. Gramling et al. (2009)
report that approximately 21% of small company filers reported some material weakness

18
in internal controls. Sinnett (2009:35), summarizing the findings of the Financial
Executive Institute 2005 report Sarbanes-Oxley Section 404 Implementation: Practices of
Leading Companies, states: “most of the participating executives agreed that compliance
with section 404 had resulted in specific benefits to their businesses, such as encouraging
a thorough review of existing processes in their business units”. Schneider et al. (2009)
detail the significant costs associated with the existence and correction of internal control
deficiencies, including the reaction of the equity markets and financing sources with
resulting higher credit spreads and higher cost of equity. Correction of these deficiencies
could have provided some reduction in indirect costs. Akhigbe and Martin (2006) note
that valuation effects were generally favorable for companies post SOX albeit less so for
small firms.
Other scholars suggest that SOX compliance creates a considerable drag in the
form of indirect costs and the potential of significant strategic harm. Research on SOX’s
potential improvements in the quality of earnings, transparency of information, the
consistency of accounting data, and effectiveness of governance have not produced
measurable offsets to costs. Wilson (2009) notes the general lack of improvement in the
quality of reported earnings. Siegel, Franz and O’Shaughnessy (2010) examining the
impact on listed versus non-listed banks find that ∆ROA and ∆ROE were positive post
SOX for unlisted firms and negative for listed firms. Moreover, it appears unclear
whether transparency will provide net benefits. While the reduced costs of debt or equity
provided by the public market have long-term value, the required disclosures and the
market imposed penalties for disclosed internal control deficiencies are a significant
offset. Liebeskind (1996) argues that knowledge is a strategic asset worthy of protection.

19
The Act calls for full disclosure of internal control deficiencies with significant
associated penalties for non-compliance. Full disclosure, as called for in the Act, to the
extent it can be provided, may compromise the ability of a firm to implement its
strategies (Barney, 1991), compromising the effectiveness of its management team.
Indeed, disclosure of internal control deficiencies brings an immediate and negative
equity and debt market effect. Schneider et al. (2009) cite research finding abnormal
negative returns subsequent to the acknowledgement of an internal control deficiency.
Similarly, analyst earnings forecasts were adjusted downward and risk assessed as higher.
Indeed, Hermanson and Ye (2009) report a reduced likelihood of early reporting in
advance of a securities offering so as to maximize the proceeds. On balance, there was a
reduction in accrual earnings management and an increase in real earnings management
documented post-SOX by Cohen, Lys and Dey (2008), as managers sought to meet
targets without managing the accrual accounting estimates. Real earnings management,
however, may involve deferral of investment and hiring and could have a negative long-
term implication for the firm.
Similarly, the Act has impact on the allocation of resources within the firm.
Ghose and Rajan (2006:16) conclude:
“Given that most organizations have a finite annual budget that is allocated to all
investments, the regulations accruing from the SOX Act have forced companies to undertake a series of dramatic changes in the way they appropriate resources to activities such as IT security and internal controls. This can have some broader ramifications on firm profitability, market structure and social welfare many of which were unintended when policy makers first formulated this act.”
The breadth of the requirements (particularly Sections 201 and 404) and their
applicability across all organizations have been questioned. For instance, Tong & Sapra

20
(2009:1954) conclude, “Our analysis also implies that a mandatory restriction of non-
audit services imposed by Section 201 of SOX may decrease audit quality and damage
investment efficiency”. The likelihood of SOX acting as a positive agent of change in the
auditing profession also has been called into question (Bazerman, Moore, Tetlock, &
Tanlu, 2006). Collis, Young and Goold (2007:388) ascribe the compliance activities to
the third role of a corporate headquarters, specifically mentioning SOX compliance, and
observe, “This role as the representative of the firm to external constituencies is a pure
overhead expense since it has no operational benefits”.
The Act further establishes new requirements for each board of directors’
governance activities, including additional audit committee oversight. Such new
requirements serve to raise costs.
Indirect cost reductions (if there are any) of whatever form ultimately impact the
revenue stream or the cost structure and are for that reason reflected in the net income of
the company. In the absence of countervailing offsets the direct cost impact should result
in lower overall income. Hence,
H2: Post SOX earnings for listed small banks are more negatively impacted than
those of large listed banks.
SOX, Small Banks and the Public Market/Private Market Decision.
Public financial institutions, large and small, access the capital markets through
one of the principal financial exchanges (New York Stock Exchange [NYSE], American
Stock Exchange [ASE] acquired by NYSE in 2008, the National Association of
Securities Dealers Automated Quotations Systems [NASDAQ] National Market and
Capital Market exchanges, and the Over the Counter Bulletin Board [OTC-BB]). These

21
exchanges provide capacity and attractive costs. Of particular note is the number of
small financial institutions “going dark”, that is, delisting from these principal public
stock exchanges in recent years (Engel et al., 2007). In addition to delisting, companies
may elect to forego public market membership. Thus the number of member or listed
firms of a particular industry segment reflects the net of losses to delisting as well as the
decision of growing firms to forego listing. The market for capital for an organization
includes various forms of debt and equity, and the choice among markets and instruments
reflects a pecking order determined by circumstances (Bagley, Ghosh, & Yaari, 1998).
Sources of capital range from least expensive (public equity and debt markets) to most
expensive (private equity investors or funds).
SOX compliance, as a requirement for accessing the public market for capital, has
a significant impact on cost and governance structure. The cost of SOX compliance has
been measured at 2.55% of revenues for small firms (market capitalization less than $100
million, consistent with the capitalization of small financial institutions) as compared to
.27% of revenues for medium sized public firms (market capitalization of $500 million to
$999 million) and .06% of revenues for large firms (market capitalization greater than $5
billion, the market capital of the largest banks) (U.S. Securities and Exchange
Commission, 2006). Thus we would expect the costs for financial institutions to be
significant and, consistent with the SEC findings above, of greater effect on small banks.
This disproportionate impact on small firms results in misalignment (Williamson, 1996)
with the associated loss of efficiency, producing an adverse impact on capital market
costs and hence capital source choices. The strategic impact of misalignment is even
more pronounced on smaller firms (Argyres & Bigelow, 2007).

22
Levy (2009) notes that many private companies are reevaluating the decision to
go public in light of the increased cost of compliance with SOX. Likewise, the majority
of the increase in going private transactions is among smaller companies for whom the
cost of compliance represents a significant portion of profits. In each case the practical
result is to eliminate a significant and relatively inexpensive source of capital. These
costs can be generalized across industries and firms, since SOX is required for all
publicly traded firms.
The General Accounting Office, in its April 2006 report to the Committee on
Small Business and Entrepreneurship of the U.S. Senate, SARBANES-OXLEY ACT -
Consideration of Key Principles Needed in Addressing Implementation for Smaller
Public Companies, identified both the reduction in small company initial public offerings
(IPOs) as well as the trend among small companies toward going private (delisting) as
SOX related. Further, it must be noted that exclusion from the public market also means
a loss of further capital cost reducing opportunities such as shelf registrations and the
support of active market makers (Anand, Tanggaard, & Weaver, 2009).
In TCT, differences and similarities among companies are identified via three
principal attributes of a transaction: asset specificity, uncertainty, and frequency. With
respect to specificity, for firms seeking equity capital, money is fungible and capital
instruments are uniform. For these two reasons, financial institutions generally exhibit
low asset specificity (Balakrishnan & Fox, 1993). For that reason they tend to prefer
market-based transactions. This is evident through the active competition in the public
market by banks large and small for borrowing in the contractual form of deposits, a form
of debt unique to banking. For public reporting banks, uncertainty is resolved through

23
the application of extensive rules-driven public market auditing and associated securities
exchange reporting. This suggests that from an uncertainty perspective banks also tend to
prefer market-based transactions. Finally, with respect to the attribute of frequency, the
need to raise capital is infrequent. This too, leads to a preference for market-based
outsourcing in the public capital markets (Safizadeh et al., 2008).
Thus, financial institutions are both well adapted to and familiar with public
markets and exhibit a strong preference for market transactions. Why then would a bank
undertake a private transaction to raise equity? Private transactions may take many forms
but are typically higher cost and have shorter maturity than that offered by the public
market (Berger & Udell, 1998). For those reasons they are usually undertaken only as a
stop-gap measure to support continued growth (Berger & Udell, 1998) or, in the case of
small banks in the immediate period after commencing operations, private transactions
may serve to “bridge” the bank to a size sufficient to enter the public market for equity
capital (Berger & Udell, 1998).
Thus, for capital markets, the public market offers the greatest number of
suppliers of capital and the likely lowest cost. However, registration for participation in
the public market brings costs in the form of additional auditing and compliance. These
costs are required to access to the public equity market, characterized by the principal
stock exchanges. Nevertheless, adjusted for all offering costs (but not compliance costs),
these exchanges represent the least expensive sources for equity capital (Easley &
O'Hara, 2004). However, additional compliance costs, such as in the case of SOX,
significantly affect these costs, resulting in a preference for private capital over public
capital, particularly for small banks.

24
The passage of SOX introduced an additional set of compliance costs, which fall
disproportionally on small companies generally. These costs include: additional work by
an additional outside auditor to develop the set of controls that must be maintained,
additional disclosures in each transaction, staff time to conduct additional tests of the
control environment, and additional time by management and the board of directors in
evaluating the results and providing reports. These actions are the required minimum and
must be conducted for all reporting entities. This establishes a minimum level of cost
that does not increase directly with size. These additional SOX-related compliance costs
significantly affected the costs associated with entering public capital markets. I
hypothesize that from a TCT perspective, these significant additional costs (often
amounting to 10% of profits) shift the preference of small banks from markets to
hierarchies and hence to a preference for private capital over public capital.
H3: The post SOX percentage of small banks choosing public market equity is
lower than the pre SOX percentage.
Methods
Design.
This paper uses a quasi-experimental pre-test, post-test design (Shadish, Cook, &
Campbell, 2002). This paper examines data from two periods: period 1 includes pre-
SOX data from 1998 -2000 and period 2 includes post-SOX data from 2004 – 2006.
SOX was enacted in 2002. Implementation of the act was undertaken in phases and the
2004-2006 period was chosen to ensure that the treatment effect was in place but to avoid
the economic downturn of 2008 and beyond.

25
A quasi-experimental design differs from experimental design in that the
treatment group cannot be manipulated by the observer (Shadish et al., 2002:159). In this
paper the treatment is the passage of SOX. The treatment group in each hypothesis is
expected to be affected by the passage of SOX, with the potential for differing effects
between subgroups.
Data Sources.
The data for Hypothesis H1 and H2 is drawn from the Federal Financial
Institutions Examination Council (FFIEC) Central Data Repository. The FFIEC is a
formal interagency body of the U.S. Government charged with the coordination of
regulation for financial institutions. In that role the FFIEC maintains the Central Data
Repository. All chartered financial institutions operating in the United States are
required to submit quarterly information through the U. S. Federal Reserve and the
Federal Deposit Insurance Corporation to the Central Data Repository using a designated
format. This format provides for consistency of accounting definition and measurement
across reporting companies and across time and hence avoids the problem of source
induced data variation (Berger & Mester, 1997). These reports are extensive, capturing
balance sheet and income statement information in significant detail. Additionally, there
are memorandum fields that provide for comments and explanations. This database has
been used extensively for efficiency analysis of U.S. banks (Barr et al., 2002; Siems &
Barr, 1998).
Data for the analysis of H3 is drawn from the Compustat database and from the
Federal Deposit Insurance Corporation Statistics on Depository Institutions Database.

26
Information regarding the listing status was drawn from Compustat, while the data on
number of banks by asset size was drawn from the FDIC.
Samples and Sample Size
The treatment group for H1 and H2 consists of a random sample of 57 small SEC
reporting (listed) financial institutions and 60 large listed financial institutions that were
in existence throughout the pre-SOX and post-SOX period. For the purposes of the
study, small banks are defined as having greater than $300 million but less than $500
million in total assets and must have been in business longer than three years. Public
banks of this size are likely at or approaching the threshold for reporting under SOX as
accelerated filers (defined as market capital of $75 million or greater). Large banks have
been providing internal control reports for some period under the compliance provisions
of FDICIA and will face some incremental expense to comply with SOX. Small banks
however have been exempt from FDICIA and are facing full financial control reporting
for the first time. In addition, Garneau and Shahid (1991) report on perceived “regulatory
creep” and note the FDIC’s recommendation for small banks to include CEO/CFO
certification. Consequently, banks of this size are likely mindful of the potential costs.
Large banks are defined as banks having more than $2 billion in assets. Both the
large and small banks used in the analysis are chartered financial institutions with
principal operations in the United States.
A number of companies carry banking charters but use them in limited ways. The
focus of this study is on those banks that actually perform the core banking activities of
taking deposits and making loans. Excluded from the study therefore are organizations
performing limited or specialized banking. These include: trust and investment

27
organizations that may hold deposits in connection with their custodian activities, credit
card banks conducting card related operations only, and foreign bank U.S. subsidiaries
providing heavy equipment leasing. These banks are involved in financial activities that
have no relevance to our study.
Also, banks three years old or less have been excluded. This allows for the
avoidance of those banks that are recently formed and may be operating under more
restrictive provisions as a start-up financial institution (DeYoung, 2003). These
restrictive provisions are imposed as a feature of the banking charter granted by the state
or federal government and may include, for example, the requirement to maintain
additional capital during the first three years (DeYoung, 2003). The intent is to limit
what a new bank and operating team can do as a way of minimizing risk during the start-
up period. These limitations typically match the amount of capital available at start-up
with operational needs eliminating the requirement to seek additional capital from other
sources.
Additionally, those banks that have elected Subchapter S treatment for federal
taxation are excluded from the samples. Subchapter S limits a bank to 100 shareholders
and consequently precludes effective use of the public capital markets. Finally, since the
analysis focuses on survivors, those institutions that are acquired in a merger transaction
during the study period have been excluded.
Thus the following banks have been excluded:
1. Credit Card Banks
2. Trust Banks
3. Foreign subsidiaries engaged in leasing

28
4. New banks (3 years old or less)
5. Federal Tax structure Subchapter S banks
6. Banks acquired in the course of the study.
For H3 we will analyze the shift in capital market preferences of the population of
financial institutions of all sizes both pre and post-SOX. As we are not attempting to
compare accounting data over time but rather general preferences for capital markets, we
will use the population of banks for 1998, 2000, 2004, 2006, and 2011. We include both
banks and savings and loans. In this way we provide a framework reflective of public
market trends and preferences both before and after the enactment of SOX.
Following Hair et al. (2010, pp. 5,171) and Cohen (1992, p. 158) the study for H1
and H2 was designed with an initial random sample of n=120. Upon examining the data I
removed one bank that did not report any data for Business Loans and two banks that
were outliers. The resulting sample was n=117.
Dependent Variables
The dependent variables (with the exception of the information on public filing
status) are drawn from the FFIEC database described above. The dependent variables
used here are from national databases consistently used for analysis of banking
companies (Calomiris & Karceski, 2000; Madura & Wiant, 1994; Steven J. Pilloff, 1996;
Steven J. Pilloff & Rhoades, 2002; Rhoades, 1998; Srinivasan & Wall, 1992). The
FFIEC database line reference code is provided in parentheses after the data element
name.
For Hypothesis 1 the dependent variable is OTHER EXPENSE (RIAD4092).
Financial institutions report their income, expenses and balance sheet information in a

29
format provided by the Federal Financial Institutions Examining Council in their role as
agent for the FDIC, The Federal Reserve and The Office of the Controller of the
Currency. This insures a consistent chart of accounts for calculation of regulatory ratios
The Other Expense category is a subcategory of Total Noninterest Expense (RIAD 4093.
There are two other subcategories of Total Noninterest Expense: Salary and Employee
Benefits (RIAD 4135) and Expenses of Premises and Fixed Assets (RIAD 4217). These
two subcategories together with Other Expense make up the category Total noninterest
Expense. This general category (Total Noninterest Expense) functions as the General
and Administrative category for financial institutions. Krishnan et al. (2008:171)
identified these categories as the likely location for SOX related expenses. These are
direct costs exclusive of the interest costs associated with funding the lending operation.
The Federal Reserve Micro Data Reference Manual provides that subcategory Other
Expense (RIAD 4092) shall include: “ Fees paid to directors for attendance at Board of
Directors or committee meetings (including travel and expense allowances)”, “Premiums
on fidelity insurance (blanket bond, excess employee dishonestly bond), directors and
officers liability insurance, and life insurance policies for which the bank is the
beneficiary”, “Research and development costs and costs incurred in the internal
development of software”, and “Retainer fees, legal fees, audit fees, and other fees paid
to attorneys, accountants, management consultants, investment counselors, and other
professionals who are not bank officers or employees”. Thus, the Other Expense
subcategory is used to capture board of directors’ expense, auditor, legal and consulting
expense and is consequently the best measure of SOX direct cost impact. This variable
has been used in prior studies of bank costs (Srinivasan & Wall, 1992) and was used by

30
Altamura and Beatty to measure the impact of FDICIA reporting, a similar internal
reporting control regime. The ratio of post-SOX three-year OTHER EXPENSE divided
by pre-SOX three-year OTHER EXPENSE is used. By using the post/pre ratio relative
size is controlled for and all data normalized to a start point value of 1. For Hypothesis 2
the dependent variable is PRETAX EARNINGS (RIAD4301). These earnings reflect the
impact of all operations except for the effect of taxes. By measuring all revenue and cost
before taxes, consistency among institutions that may be pursuing varying levels of
investments in non-taxable municipal bonds is preserved. This measure has been used in
prior studies of bank costs (Hwang, Lee, & Liaw, 1997). The ratio of post-SOX three-
year PRETAX EARNINGS divided by pre-SOX three-year PRETAX EARNINGS was
used. By using the post/pre ratio relative size effect is controlled for and all data
normalized all data to a start point value of 1.
Independent Variable.
The following variable is used:
BANK SIZE will be coded 0 for large banks and 1 for small banks; Bank size has
been used in prior studies (Berger, Frame, & Miller, 2005; Cyree, Hein, & Koch, 2005)
Control Variables.
The potential impact of key structural differences will be controlled for through
the use of the following control variables: BANK CHARTER is the type of charter, state
or national, the bank holds under which it does business (Cyree, Wansley, & Boehm,
2000), and will be coded 0 for state and 1 for national; MULTIBANK HOLDING
COMPANY captures the format of the bank structure whether single bank or multi-bank

31
holding company (Thomson, 1991) and is coded 0 if single or 1 for multi-bank holding
company.
Analysis.
Hierarchical regression (Edmondson & McManus, 2007) is used for H1 and H2.
The analysis was conducted in two steps. First the control variables were entered. Next
the main effect variable was added. In H1, an increase in the amount of other expense for
the small listed banks was anticipated. Thus, if beyond the effect of the control variables
the main effect variable of bank size is significant in the expected direction, we can
conclude that H1 is supported. H2 anticipates a reduction of pretax earnings by small
public banks relative to small banks generally. Consequently, if beyond the impact of the
control variables, the main effect of bank size is significant in the expected direction, we
can conclude that H2 is supported.
The distribution was analyzed and is both peaked and exhibits a positive skew.
This is attributable to the large banks being frequent acquirers and over time adding
significantly to their asset size and hence earnings. The data therefore was transformed
by taking its natural logarithm (Hair et al., 2010).
For H3 we analyze the population trends for small banks, assessing the percentage
in each of the reporting years of small public banks as a percentage of total banks and as
a percentage of public banks. We compare this data with the trends among similar
segments of larger banks to determine whether there is a discernable change in the
difference between large and small banks in their preference for public market listing.

32
Threats to Inference.
The analysis follows Shadish et al. (2002:55) in an evaluation of threats to
inference. The following threats are of concern due to the structure of the experiment and
the time periods under study and apply to each of the hypotheses. Of particular initial
concern is history, as there were other “treatment-like” events occurring during the time
period under examination. More specifically, the Small Business Job Protection Act of
1996 extended to banks the ability to elect Subchapter S status for assessment of federal
taxes effective in 1997. A significant number of banks converted to S Corporation status
(FDIC database). These banks when compared to C Corporation (remaining under the
normal corporate tax provision) banks are smaller, slower growing, more rural
institutions with less commercial and industrial lending (Cyree et al., 2005). To control
for this possible confounding effect, S Corporation banks are excluded from the study.
Maturation was considered as a potential threat due to the four-year break
between measurement periods. Maturation is the process of change that an organization
undergoes with the passage of time. This is the case of “growing older, hungrier, wiser,
stronger, or more experienced” (Shadish et al., 2002). In the typical corporation this may
include changes in business model, level of vertical integration and product line. In
banking, however, the business model is highly regulated and relatively unchanging,
except for balance sheet growth. The growth rate for financial institutions from
12/31/2000 to 12/31/2004 averaged 7.74% annually (FDIC Data Base). This makes it
unlikely that a small bank could grow to the size of a large bank, mitigating that threat.
As Berger et al. (1995) suggest, the highly regulated nature of the industry and the

33
consistency of business model among banks, as evidenced by relatively high permitted
leverage ratios, further serve to mitigate threats to inference.
Findings
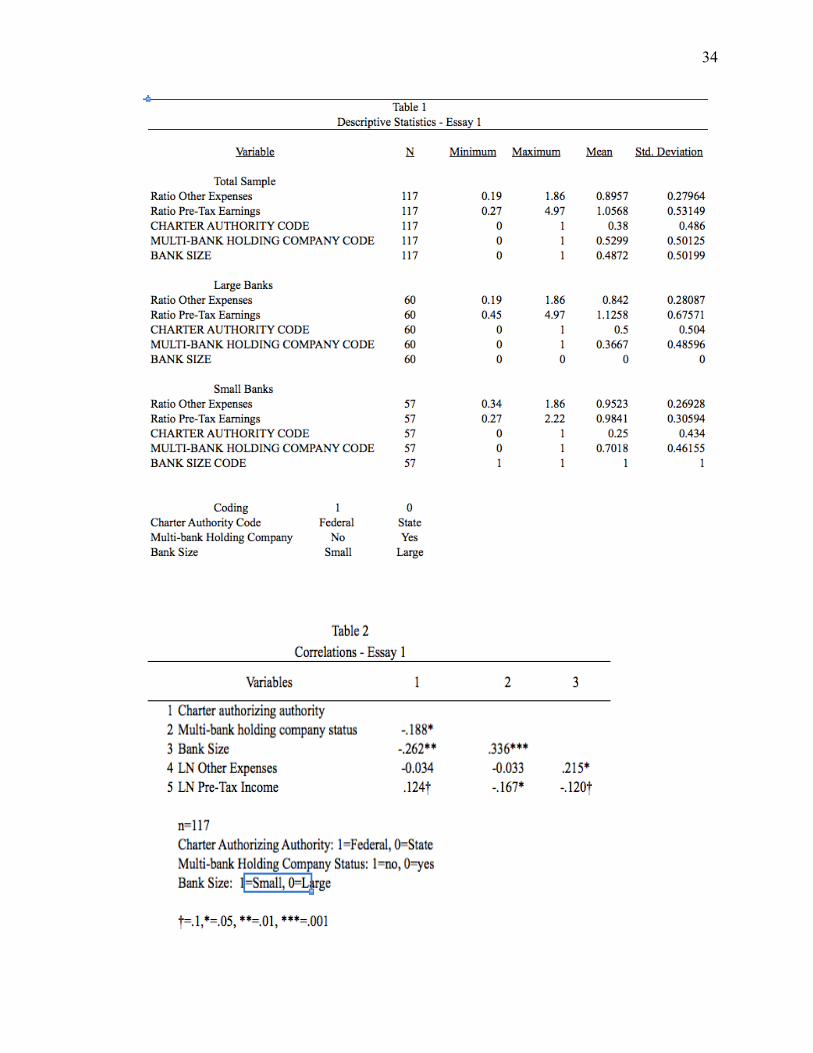
The minima, maxima, means, and standard deviations of the variables are
reported in Table 1. The means of the data show that for Other Expense (show as a
percent of assets) both large and small banks reflect a decline in the values post SOX
with large banks showing the greatest decline. This decline is reflective of the
operational leverage gained by the institutions as a result of their growth over the period
of study. For Pre-tax Income, the means show a modest reduction of income for small
banks while large banks grew income. There is however considerable Pre-tax Income
variance among large banks as reflected in the standard deviation. The correlations are
reported in Table 2. Bank size is correlated with Other Expense at the p<.05 level with
the expected sign. Pre-tax Income is correlated with Banks Size at the p<.1 with the
expected sign. The results of the hierarchical linear regression on Other Expense and
Pretax Income are reported in Tables 3 and 4 respectively. Table 5 provides the results of
the analysis of the data on public company status. I used a Variance Inflation Factor
(VIF) of 10 as a threshold value for multicollinearity, (Hair et al., 2010), and no measure
exceeded this threshold (the highest was 1.18).
34

35
Other Expense Cost.
Hypothesis 1 predicts that post-SOX other expense is higher than pre-SOX for
listed small banks than for large banks. This hypothesis was tested using hierarchical
linear regression in a two-step model (Models 1A & 1B) as shown in Table 3. Model 1A
included the control variables that reflect holding company structure and whether the
bank has a state or federal banking charter. The R2 values were not significant for this
model.
Model 1B included the main effect variable Bank Size and was significant. The F
value and the F change value were significant at the p < .10 level and the p < .05 level
respectively for this model.
Thus, Hypothesis 1 was supported, as the listed small banks other expense
declined significantly less than the listed large banks.

36
Pretax Income.
Hypothesis 2 predicts that post SOX pretax Income will be reduced for small
listed banks as compared to large listed banks. The analytical approach is the same as
Hypothesis 1 and is shown in Table 3. Model 2A, including the control variables, was
not significant.

37
Model 2B included the main effect variable, Bank Size and was not significant at
the desired level. Thus, Hypothesis 2 was not supported.

38
Small Bank Public Market Selection.
Hypothesis 3 predicts that small banks are more likely to be private post-SOX
than pre-SOX. We assess this outcome through analysis of the various time periods.
Recall that the number of public banks, either small or large, reflects several phenomena.
Banks may grow in assets over time, possibly moving from one category to another.
Alternatively, banks may elect to cease public market membership through the “going
dark” process or as a result of merger with another institution (where the electing bank is
not the survivor). Finally, the level of public banks may be increased by banks electing
public market membership. As we want to capture the preferences of all banks large and
small, we define small banks as having less than $500 million in assets and large as
having over $500 million in assets. We use 1998 and 2000 to establish the trend in
preference for public listing pre-SOX and 2004, 2006 and 20011 to illustrate the trend
post-SOX. Table 4 provides an overview of the numbers of banks by category for each of
the relevant time periods.
Table 5 shows the change in the number of U.S. Banks over the period 1998 to
2011, a decline of 29.7%. During that period, public banks as a percentage of total banks
increase from 8.1% to 8.8% with a high in 2004 of 9.3%. Within the category of Public
Banks, large banks, by number, increase from 54.7% to 78.5%, reflecting a small bank
decline from 45.3% to 21.5%. Large public banks taken as a percentage of large banks
show a decline in percentage terms of 6.8% from 2000 to 2004 and 17.8% from 2000 to
2006. Small banks during the same periods show declines of 20.9% and 39.5%
respectively. In summary, the data show that the preference of small banks for public
market membership, stable to increasing in the years 1998 and 2000 pre-SOX, declines

39
significantly, by number, in the post-SOX years – and the percentage decline is much
greater than that for large banks. Thus Hypothesis 3 is supported.
Conclusion This study examines whether, first, the imposition of SOX resulted in higher costs
for small public market listed banks, second whether that expense would be reflected in
the pretax earnings of the banks, and finally whether small banks post-SOX chose to
enter public markets less frequently than prior to SOX.
We theorized that as the costs of SOX compliance fell disproportionately on small
banks. This added cost, consistent with Transaction Cost Theory, would be sufficient to
reduce the number of banks going public. We hypothesized (H1) that Other Expenses
would be greater in the post-SOX period for small banks than large banks. Hypothesis 1
was supported.

40
We further hypothesized (H2) that this relative increase in costs for small banks
would be carried through to the income statement and reflected in the pretax Income of
the bank. Our Hypothesis 2 was not supported. Why were the relative cost increases for
small banks not detected in the pretax income figure? Part of this is likely attributable to
the variability of earnings generally, as small bank earnings can be significantly impacted
by the costs of a new branch, additions to staff, loan charge-offs and recoveries. It may
also reflect the different interest rate environments of the two periods. In the first
observation period (1998-2000), interest rates were relatively stable with the prime rate
increasing from a nominal rate of 7.75% to 9.25%, an increase of 22.5%. In the second
observation period (2004-2006) the prime rate increased sharply from a nominal rate of
4.00% to 8.25%, an increase of 106%. Banks exhibit “stickiness” on re-pricing their
deposits during periods of rising rates (Berger, 1991) while they are able to quickly
institute increased interest charges on loans, and this affords an opportunity for increased
earnings. Thus, the increase in earnings may have obscured the impact of SOX. Part of
the answer may be in the results obtained in the analysis of Hypothesis 3.
In Hypothesis 3, we hypothesized that, post SOX, small banks would be more
likely to choose private status and/or delist from the major exchanges. An analysis of the
trends in public market preference pre-SOX versus post-SOX supports Hypothesis 3.
Small banks increasingly support private status over public status post-SOX. Therefore,
the results in H1 and H2 may represent significant coping strategies adapted by the small
public banks.
41
Economic Implications.
The role of the small bank in the provision of credit to small business is well
documented (Beck & Demirguc-Kunt, 2006). Likewise, the central role played by small
banks in providing funding to small/new businesses is clearly understood (Berger &
Udell, 2002; Sharpe, 1997). Small banks raise capital and then deposits to grow with the
companies and communities they serve. The imposition of additional costs to access the
public market for capital may result in a discontinuity in the supply of capital to growing
businesses. Whether the impact is measured from the point of view of the economy,
generally where 60-80% of net new jobs come from small business, or the point of view
of the critical high technology sector where 40% of new hires go to small business, the
potential for significant negative impact is clear.
Industry Implications.
The impact of the imposition of SOX has a tactical significance at the bank level
but a strategic significance for the banking industry. The industry is highly regulated and
is consistent. From inception, banks grow with the communities they serve, acquiring
capital to support that growth from a variety of public and private sources. Typically, the
bank’s need for capital will outstrip the ability to raise it through local private placement.
At this point, some number of banks will seek access to the public market to support
continued growth. These banks become the next regionals and national market banks,
utilizing public market equity to fund acquisitions of smaller institutions. Other banks
may elect to continue banking in a private structure anticipating acquisition by a larger
bank in the future. If as a result of the costs of public market access or the perception of
those costs, fewer small banks are able to commit to long-term growth, it is possible that

42
we reduce the appetite for the acquisition of small banks. With this reduction in appetite
will come an associated reduction in franchise value and a concomitant reduction in small
bank start-ups.
Managerial Implications.
Bank management and the Board will ultimately be faced with the decision to
absorb the additional costs of public market listing or elect to remain private with
constrained sources of capital. If they elect to remain private they will be required to
develop coping strategies to manage around the capital availability problem. As the need
for capital in the business competes with dividend policy the ability to raise capital is
likely compromised. If they elect to enter the public market, there are significant costs to
be borne. Each of these choices will require focus on capital raising at the likely expense
of core banking activities. Coping strategies to reduce costs for small banks would likely
take the form of reduced hiring for critical positions (lenders) or deferral of deposit
growth through branching. Each is expensive for small banks but represents a key
ingredient for long-term growth. Consequently, adopting a coping strategy may be
effective in the short-run with long-run negative impacts.
Limitations This study has at least three limitations. These include: ability to measure SOX
costs directly, applicability to all banks, and applicability to other national business
environments.
Ability to Measure SOX Costs Directly.
There is not a single unified accounting entry that may be used to capture the cost
of SOX. The Other Non-Interest Expense category (shortened to Other Expense) is used

43
as a proxy for SOX costs. The Other Expense category (FDIC code RIAD 4092), a
subcategory of Other Non-Interest Expense (FDIC code RIAD 4093) was chosen to
capture the costs of SOX as it is the accounting category of record for legal, accounting
and consulting expense. As noted however, compliance with SOX may require that
actions be taken which could be reported as expense in other expense categories in the
chart of accounts for the institution. Also, accounting practices, though typically
consistent across banks, may nevertheless allow for varying treatment of the same costs
in different banks. Thus it may be the case that we have failed to capture the full SOX
costs or that we are reflecting increases not solely attributable to SOX.
Applicability Across All Banks.
The sample used here is composed solely of financial institutions holding a
banking charter issued by the federal government of the United States or by a state
government. The institutions used in the sample all conduct general banking business
involving the collection of deposits and making of loans to the public. Thus the findings
may not be applicable to specialty organizations holding a bank charter in aid of a
finance-based business (trust, leasing, credit cards) or to foreign banks that may be
operating under a different capital regime.
Applicability To Other National Business Environments.
While there are international norms for the regulation of banking, the specific
regulatory environment of each country is unique. The Sarbanes-Oxley Act is unique to
the United States public market, and similar regulations may not exist in whole or in part
in other countries. Thus the impacts noted here may not exist for other banks in other
countries.

44
Suggestions for future research In the examination of the impact of the SOX regulations, significant questions are
raised:
First, as this is a survivor analysis, the decisions of small banks to exit the market
altogether by being acquired or to further constrain their growth by electing Subchapter S
federal income tax treatment with its constrained ownership rules are missed. A more
complete rendering of the question, “did SOX have an impact on small banks?” can only
be made by understanding the strategic decisions of all banks. Future studies may wish
to examine the motivations behind the decisions to sell or elect Subchapter S.
Second, we did not observe the costs found in H1 affecting the pretax income in
H2. What served to moderate this impact? Was there some salutary benefit of SOX that
offset in some way the cost of compliance? Did the public market bankers develop a set
of coping skills? Or did they benefit from reduced marketing cost as a function of
reduced growth? Future research may be able to identify the source of this benefit.
Finally, what if any are the impacts of this regulation on the ability of small banks
to serve the small business? Is there a permanent reduction of available capital to support
small business? While the role of small banks is clear, further research may wish to
focus on the long-term durability of the business model. Has there for example, been a
reduction in the franchise value of small banks?
The purpose of the research was to examine the impact of significant regulatory
legislation, the Sarbanes-Oxley Act, on small banks. Using Transaction Cost Theory we
focused on the potential for the costs of compliance with SOX to impact the cost
structure and the decision to pursue the public market for funds. While the scale of
45
banking varies dramatically, the small bank has a significant role in providing funds
through loans to small business. Understanding how key regulation might impact small
banks may usefully inform the debate on bank regulation. In this way, the role of small
business in the creation of jobs can be usefully supported.

46
ESSAY #2: BANK CAPITAL AND SMALL/NEW BUSINESS LENDING
Introduction
Has the Sarbanes-Oxley Act (SOX) reduced the capital available for small
business? SOX imposed a variety of compliance driven activities that have associated
costs with direct impact upon small financial institutions. These small banks, sometimes
referred to as “community banks”, are the primary capital source for American small
businesses (Sharpe, 1997).
The question of reduced access to capital is important because small business is
the primary engine for job creation in the U.S. (Stangler & Litan, 2009). Small
businesses employ about half of all private sector employees, pay nearly 45 % of total
U.S. private payroll, generated 60-80 percent of net new jobs annually over the last
decade, and hire 40 percent of high technology (scientists, engineers, and computer
professionals) workers (U.S. Department of Commerce, Bureau of the Census and
International Trade Statistics).
The role new business plays in the creation of new employment is underscored by
a recent Kaufman Foundation report. It states that from 1980 to 2005, nearly all net job
creation in the United States occurred in firms less than five years old (Stangler & Litan,
2009). These firms typically derive their capital requirements from small banks (Berger
& Udell, 2002; Sharpe, 1997). Thus, the ability of small banks to lend money to
small/new business is a key driver of the health of the American economy (Brevoort &
Hannan, 2006; Goldberg & White, 1998; Keeton, 1995; Walker, 1989).

47
The purpose of this paper is to examine the impact that the Sarbanes-Oxley Act
had on the lending relationship between small banks and small/new businesses. The
theoretical prism I use to investigate this issue is Resource Dependence Theory (Pfeffer
& Salancik, 2003; Schulze, 1992; Wernerfelt, 1984). Resource Dependence Theory
(RDT) considers the impact of the availability of key resources on an organization. RDT
holds that the availability of key resources largely determines the success of a firm
(Salancik & Pfeffer, 1978).
According to current federal regulations, capital, typically in the form of common
equity, must equal 10% of a bank’s assets (U.S. Federal Reserve, 1989) in order for the
bank to be deemed well-capitalized. Thus the amount of capital a bank has determines
how much lending a bank can do. Capital for small and new businesses, for the most part
in the form of loans, comes primarily from small banks (Walker, 1989). These loans are
a critical resource in the execution of the small firm’s strategy, providing funds for the
acquisition of raw materials, parts inventory, and staff (Petersen & Rajan, 1994).
Using Resource Dependence Theory, I hypothesize that one unintended
consequence of the Sarbanes-Oxley Act has been to limit small bank capital growth (H1).
SOX requires additional compliance activities in auditing and audit review for SEC
reporting (publicly traded) banks. These activities result in a cost to the bank that if not
offset by additional sales or margin improvement may thus directly reduce earnings. The
first essay found support for the expected increase in costs but not the expected reduction
in pretax income. However, the first essay also shows a significant trend away from
public market membership by small banks in the period post SOX. This may reflect the
perception that the public market (SEC regulated major national exchanges) is too

48
expensive with the result that a significant number of small banks turn to/or remain in the
private market (non-SEC regulated). The private market is both more expensive and
provides less capacity thus potentially constraining the bank’s access to capital.
Limiting small bank capital growth impedes a bank’s ability to grow its lendable
funds, restricting loan volume and reducing the availability of credit to small business.
Small banks are the primary capital provider for small business (Berger & Udell, 2002),
and hence a reduction of small bank capital results in a reduction of lending to small
business. Thus, I further hypothesize that a second consequence of the Sarbanes-Oxley
Act has been to limit availability of credit to small business (H2). The hypotheses are
tested by comparing a sample of small banks pre and post SOX to a sample of large
banks.
Literature Review Resource Dependence Theory.
Resource Dependence Theory (RDT) gauges the importance of power in
relationships as a function of resource dependence (Salancik & Pfeffer, 1978). The key
underlying assumption of RDT is that the success of a firm depends on its ability to
access resources (Salancik & Pfeffer, 1978).
RDT builds upon the work of Emerson (1962) on power dependency in networks.
RDT focuses on resource dependency both within and external to the firm. High
dependence is perceived as a risk factor and potentially reduces the economic efficiency
of the firm. The likely impact of a particular resource dependence is context specific (K.
D. Brouthers, Brouthers, & Werner, 2008).
Resources may be physical (Williamson, 1975), human (Prescott & Visscher,
1980) or organizational (Tomer, 1987) in nature. Physical resources might include

49
factory capacity, warehouse space, transportation vehicles, or production machinery.
Human resources could include trained staff or knowledgeable sales team.
Organizational resources could include systems and procedures, technological base or
access to capital. RDT focuses on those resources that have significant or strategic
impact, the relative dependency of the firm upon others for the provision of that resource,
and the tactics that may moderate the impact of the dependency.
A variety of measures have been identified which may potentially be employed to
mitigate the dependence of the firm. They include diversification, which may be
employed to lessen the dependence upon a particular supplier, marketing channel, or raw
material (Wernerfelt, 1984). The general approach to resource dependence mitigation
depends upon the firm’s ability to source needs from multiple providers (Pfeffer &
Salancik, 2003). Scarcity, contractual provisions, or relationships may preclude the use
of other providers. In such instances the firm “…will tend to be influenced by those who
control the resources they require” (Pfeffer & Salancik, 2003:44).
RDT applies across a broad spectrum of organizations and resources in a strong-
form and a weak-form. Schulze (1992:42) summarizes the work on establishing the two
forms of the general theory: “The weak-form model addresses the issue of creating and
replacing wealth generating assets. The strong-form addresses the issues of identification
of underemployed resources, exploitation and protection of those sources of wealth.”
Strong-form RDT is most applicable to mature firms whose competitive advantage
derives from key product differences attributable to particular resources. Weak-form
RDT, by contrast, is characterized by resource heterogeneity such that the availability of
a resource provides the opportunity for temporary efficiency rents (Castanias & Helfat,

50
1991; Rumelt, Schendel, & Teece, 1991; Schoemaker, 1990). It is the creation and
protection of the resource source that is the focus of management in the weak form of
RDT. Thus, for a small business, the resource issue is the acquisition of capital (weak-
form) rather than the allocation of capital among business units, as would be the case for
an established firm (strong-form).
Consequently, the key differentiator between the strong and weak-form model is
the role of power as the isolating or controlling mechanism in the weak-form. In the
weak-form case the firm has relatively little power over the source of the needed resource
whereas in the strong-form case the exercise of power over the resource is the central
feature (Schulze, 1992). The relationship between smaller businesses and small banks
then is consistent with the weak-form model, as underscored by the strategic dependence
of the firm on the bank.
The elements of the weak-form model create a lens through which we can see the
dependence of small firms on small banks as providers of capital as follows: capital, a
critical strategic resource for small firms, can at times be unavailable to small firms.
There is no effective substitute for capital. A capital shortfall likely has a strategic
impact as the small firm is unable to pursue investment needs and opportunities such as
the acquisition of raw materials, equipment, facilities and staff. Efforts to diversify
capital sources via relationships with other banks, typically an effective strategy to
mitigate resource dependence, actually reduce the access and efficiency of capital
management generally (Berger, Herring, & Szego, 1995; Berger, Klapper, & Udell,
2001). This is because the investment that a small bank makes in the relationship with a
small firm in order to mitigate the problem of informational opacity is typically founded

51
on a form of relational contract. These contracts are defined (Baker et al., 2002:39) as
“informal agreements sustained by the value of future relationships”. This promise of
future business is the inducement for performance by the bank. The result is that only
about one-third of small firms have a relationship with more than one bank (Berger &
Udell, 1998). RDT thus effectively captures the dependence of the small business on the
small bank as their source of capital, an essential resource.
How Small Financial Institutions Gain Access to Capital.
Banking regulation requires that a financial institution maintain capital as a
percentage (generally 10%) of its outstanding assets (Capital Maintenance, 12 CFR 325,
Bank Holding Companies, 12 CFR 225). This requirement places a direct constraint on
the growth of loans, as loans to businesses and individuals are the predominant category
of assets carried on the bank’s balance sheet. Banks, like all companies, add capital by
retaining earnings and by accessing the public and private capital markets. While the
debt and equity instruments available in each market are similar, pricing and availability
can vary significantly, with the public market providing the greatest capacity and the best
pricing (Slee & Paglia, 2010). Prior to SOX, small banks utilized the private market at
start up, transitioning to the public market as their growth and demand for lendable funds
increased (Berger & Udell, 1998). This process provided capital in amounts and at times
that supported the banks’ growth and its ability to lend to others.
For small banks, access to the public market through securities registration and
offering on a major stock exchange provides two key benefits: reduced costs and
enhanced flexibility. Reduced costs can be seen through a hypothetical example of
financial market cross listing benefits. Cross listing is the process of offering the shares

52
of a firm based in one country for sale in the financial markets of a different country.
Foreign firms that cross list on major U.S. stock exchanges gain an improvement in cost
of capital of 70 to 120 basis points over that available in their home countries, while U.S.
private placements of foreign firm securities represent no savings (Hail & Leuz, 2009).
Thus the positive spread of 70 to 120 basis points represents the positive value for
meeting SOX filing requirements versus raising money in the more expensive private
placement market. In this example, small banks that raise money in the private sector
would be expected to pay a premium of 70 to 120 basis points over the public market
price, reducing the amount of capital raised and subsequently the funds available for
small companies to borrow.
A second benefit of the public market is the range of financing choices and
providers available. Public market banks may access the market through equity, debt and
a range of specialized instruments with hybrid characteristics of debt and equity. Each of
these instruments is a form of capital having different costs and features. Banking
regulations prescribe how each type of capital instrument should be accounted for and the
amount of leverage (in terms of deposits) it can support (Bank Holding Companies 12
CFR 225). It is this leverage that ultimately provides capital downstream to borrowers by
allowing the bank to access capital in amounts and at times which reflect attractive
conditions in the public market and hence to be responsive to the demand for loans.
Public market registration provides advantages in accessing each of the
instruments above. Access to the public market for equity requires transparency
(Flannery, 1998). This is accomplished through the provision of standard reporting and
compliance activities (now including SOX) built as an add-on to existing Securities

53
Exchange Commission (SEC) reporting rules. SEC registration and hence SOX
compliance is also useful in accessing the market for debt (Andrade, Bernile, & Hood,
2009) by establishing a consistent framework for reporting and controls. Finally, public
market registration aids in the adoption and affordability of innovative hybrid capital
instruments as well (Benston, Irvine, Rosenfeld, & Sinkey Jr, 2000).
The private market alternative to the public capital market is not attractive (Leuz
et al., 2007). Small banks, absent the ability to access the public market, generally access
the equity market through more limited exchanges. Examples would include the “pink
sheets”, where a small local or regional market maker provides some matching of buyers
and sellers; sales to private equity groups; or sales upon demand to the public under an
exclusion from SEC registration (Engel, Hayes, & Wang, 2007). These sources
characteristically are more expensive, provide less capacity, and have uncertain timing.
The cost, capacity and timing effect each impact the downstream business borrowers in
the form of higher cost capital, in smaller amounts, in irregular capacities.
SOX, however, altered the way in which small banks gained access to capital.
With the passage of SOX, the additional cost incurred in public registration created an
obstacle to access to the public market impacting the cost, availability and timing of
capital acquisition, both debt and equity, by small banks. These additional costs directly
reduce the earnings of the bank and hence, as valuation in a public equity offering is a
function of earnings, reduce the amount of equity that can be raised in the public market.
Alternatively, the reduction of earnings directly reduces the coverage available for debt
and thus the amount of debt that can be raised in the public market. As a result, small
banks must accept increased costs and reduced availability for raising the necessary funds
54
or elect to attempt to evade those costs and manage within a smaller private shareholder
group. The result is that needed capital is more expensive, more difficult to access or
both (Slee & Paglia, 2010). For small businesses that, in turn, depend upon small banks
as a source of borrowed funds, this translates into reduced borrowing availability or
increased cost or both.
As a result the impact of SOX drives the small bank away from the public market
for capital reducing the availability and increasing the cost of capital to the institution.
The private market alternative ultimately offers less availability of capital at an increased
cost. The ability of the small bank, both public and non-public, to acquire capital to
support its lending needs is therefore reduced with direct implications for both the cost
and availability of capital for small company borrowers, thus:
H1: The level of Capital held by small listed banks is impacted by SOX such that
post SOX capital levels are lower than pre SOX for small listed banks as
compared to large listed banks.
The Role of Small Financial Institutions in Providing Capital for Small Business.
Banks generally function as intermediaries to match funds available in the market
(typically in the form of deposits) with demand by companies for loans (Allen &
Santomero, 2001). Among borrowers, the banking market for lending products is
characterized by information asymmetry resulting in imperfect competition (Myers &
Majluf, 1984). Large borrowers have significant history and resources and achieve
transparency by producing (often in connection with other regulatory requirements) the
necessary information (managerial accounting data, audited financial statements) to allow
broad based third party analysis by investment analysts as required by public company

55
reporting (Bolton & Freixas, 2000). Large borrowers, by meeting the standard for public
company reporting, can access the capital markets through the largest financial
institutions and the public markets (Bolton & Freixas, 2000).
Conversely, small borrowers typically are less transparent and hence represent
more risk (Berger & Udell, 1995). While the increased risk ultimately entails additional
cost for the small borrower, such borrowers also face a problem of capital availability.
Small businesses’ inability to access the public financial markets and their consequential
reliance on bank capital is documented by Walker (1989). From the lender’s point of
view, the market for small company loans suffers the potential for adverse selection and
adverse incentive (and their interaction with pricing) and may result in an equilibrium
characterized by credit rationing (Arnold & Riley, 2009; Stiglitz & Weiss, 1981).
The dependence by small business on small banks is well documented. Berger
and Udell (2002:32) observe: “These firms simply do not have access to public capital
markets.” In contrast with their large bank counterparts, small financial institutions
typically provide capital support to small businesses through a relationship-lending
model. In this model banks acquire information over time through contact with the firm,
its owner, and its local community on a variety of dimensions and use this information in
their decisions about the availability and terms of credit to the firm (Almazan, 2002;
Berger & Udell, 2002).
The costs of information gathering in this model are balanced by higher
borrowing costs to the borrower and expected loyalty from the borrower such that small
businesses attempting to access multiple borrowers typically suffer higher costs and
reduced availability of credit (Dell'Ariccia & Marquez, 2004; Petersen & Rajan, 1994).

56
These relationships are particularly important in times of general credit constraint
(Petersen & Rajan, 1995).
This preference of small companies for small banks is reflected in the geography
of banking, such that for individuals and small businesses banking markets are basically
local in nature rather than regional or national (Sharpe, 1997). With the advent of
interstate banking the competition for deposits is nationwide, but recent studies show
that, if anything, the significance of distance in the lending relationship is increasing
(Brevoort & Hannan, 2006). This means that the local small bank remains the lender of
choice for most small business.
RDT provides the framework in which to understand the relationship of small
business to small bank. This relationship is characterized by dependence and centers on
the provision of a critical resource. Small businesses, lacking transparency and unable to
afford the systems and external reviews that provide it, must depend upon small banks for
funds in the form of loans. Before the passage of SOX, financial institutions, large and
small, brought on to their balance sheets available deposits in their market, in turn
providing these funds to their relevant borrowers (Allen & Santomero, 2001). I
hypothesize that, post SOX, the capital and hence the capacity of small banks to accept
deposits was constrained. This reduction in the level of capital in small banks limits the
bank’s balance sheet, and hence the amount of loan funding they can provide for the
needs of small businesses. Thus:
H2: The level of small business lending by small listed banks is impacted by SOX
such that post SOX small bank lending to small business is lower as compared to
large listed banks.

57
Methods Design.
A quasi-experimental pre-test, post-test design (Shadish et al., 2002) was used.
Unlike a true experiment, in a quasi-experimental structure the treatment group cannot be
manipulated by the observer (Shadish et al., 2002:159). As SOX was enacted in 2002
with full effect over a span of several years, the paper will focus upon the period pre and
post-SOX providing a break for the extended period of implementation: the treatment
period. Consequently, data from two periods was used: period 1 includes pre-SOX data
from 1998 – 2000 and period 2 includes post-SOX data from 2004 – 2006. The treatment
is the passage of SOX. In each hypothesis, the treatment group is expected to be affected
by the passage of SOX, with the potential for differing effects among subgroups.
Data Sources.
The data used to test our hypotheses comes from a public data source, the Federal
Financial Institutions Examination Council (FFIEC) Central Data Repository. FFIEC is
an umbrella agency that acts as a formal interagency body of the U.S. Government
coordinating regulation by the various agencies responsible for the oversight, monitoring,
and regulation of financial institutions. The Central Data Repository holds data
accumulated from filings mandated by regulation. Banks in the United States, without
regard to the source of their charter, must submit quarterly information thru their
regulator (typically the U. S. Federal Reserve and/or the Federal Deposit Insurance
Corporation) to the Central Data Repository. A single reporting format is used providing
for consistency of accounting definition and measurement across reporting companies
and across time and avoiding the problem of source induced data variation (Berger &
Mester, 1997). These reports are extensive, capturing balance sheet and income

58
statement information in significant detail, with memo fields for comments and
explanations. This database has been used extensively for efficiency analysis of U.S.
banks (Barr et al., 2002; Siems & Barr, 1998).
Samples and Sample Size.
The treatment group for H1 and H2 of Essay #2 consists of a random sample of
117 small financial institutions and large financial institutions that were operating
throughout the pre-SOX and the post-SOX period. The approach employed defines small
banks as having greater than $300 million but less than $500 million in total assets and in
business for more than three years.
Large banks are defined as having greater than $2 billion in assets. All
institutions in the study are public reporting institutions and thus subject to SOX. All
banks, large and small, used in the analysis are chartered financial institutions with
operations in the United States.
The term bank is applied to any organization holding a charter to conduct banking
business. We are concerned specifically with those institutions that conduct deposit
taking and lending activities. Many of these organizations however, hold a charter as
incidental to a financing service not involved in raising funds and making loans. Thus we
have excluded from the sample a number of banks whose activities are inconsistent with
small business service. Credit card banks that exist solely to conduct credit card
operations, trust banks whose principal activities are custodianship and investment
advice, and subsidiary banks of foreign institutions which exist to conduct heavy
equipment leasing have been removed from the database. In each case these “banks”

59
have a different cost structure and operational focus in their principal line of business and
do not provide funding for small business.
Additionally, banks less than three years old typically are operating under original
charter restrictions (DeYoung, 2003). Such restrictions may include, for example, the
requirement to maintain additional capital during the first three years (DeYoung, 2003).
These restrictions are intended to provide a low-risk operating environment during the
start-up period by limiting the types of risks the institution may undertake. Care is taken
to ensure that sufficient capital is raised at the outset to support the operational plan for
this period thus eliminating the need to access any market for capital. Consequently,
banks less than three years old have been excluded from consideration. Likewise, those
banks that have elected Subchapter S treatment for federal taxation have been excluded
from the samples. This provision of the tax code limits a bank to 100 shareholders and
consequently precludes effective use of the public capital markets. Finally, throughout
the period of study banks have acquired other banks and in turn been acquired. As the
study focuses upon the actions of survivor institutions, those institutions that are acquired
in a merger transaction during the study period have been excluded.
As a result the following types of banks were excluded:
1. Credit Card Banks
2. Trust Banks
3. Foreign subsidiaries engaged in leasing
4. New banks (3 years old or less)
5. Federal Tax structure Subchapter S banks
6. Banks acquired in the course of the study.

60
Based upon the recommendations of Hair et al, (2010, pp. 5,171) and Cohen
(1992, p. 158), an initial random sample of n=120 was used for this research. In
subsequent review of the data one bank that did not report any Business Loans was
eliminated, as were two outlier banks. This resulted in a final sample of n=117.
Dependent Variables.
The dependent variables are drawn from the FFIEC database outlined previously.
Dependent variables used are from U.S. national databases and have been consistently
used for analysis of banking companies (Calomiris & Karceski, 2000; Madura & Wiant,
1994; Steven J. Pilloff, 1996; Steven J. Pilloff & Rhoades, 2002; Rhoades, 1998;
Srinivasan & Wall, 1992). The FFIEC database line reference code is provided in
parentheses after the data element name.
For Hypothesis 1, the dependent variable is TOTAL EQUITY CAPITAL
(RCFD3210). This is the total of the shareholders’ equity accounts of the bank and
reflects the total of Tier 1 (most favored) capital available to the bank. Any capital
obtained in the market plus any earnings are added to this capital account. While there
are a number of measures of bank capital and near capital, this account is the primary
measure of core capital availability and has been used in prior banking studies (Aysun &
Hepp, 2011). The ratio of post-SOX three-year TOTAL EQUITY CAPITAL divided by
pre-SOX three-year TOTAL EQUITY CAPITAL is used to control for relative size effect
and normalize all data to a start point value of 1.
In Hypothesis 2 the dependent variable is BUSINESS LOANS (RCON1763).
This is the amount of the commercial and industrial lending (in dollars U.S.) that the
institutions make available to businesses. This is a distinct sub category within the
61
lending accounts and is used in other studies to approximate business loans (Craig &
Thomson, 2003). The ratio of post-SOX three-year BUSINESS LOANS divided by pre-
SOX three-year BUSINESS LOANS is used. The post/pre ratio is used to control for
relative size effect and normalize all data to a start point value of 1.
Independent Variable.
The following variable is used:
BANK SIZE is coded 0 for large banks and 1 for small banks; Bank size has been
used in prior studies (Berger et al., 2005; Cyree et al., 2005).
Control Variables
While the banking business model is highly consistent across institutions, there
are differences in charter source and structure, which must be considered. The potential
impact of key structural differences will be controlled for through the use of the
following control variables: BANK CHARTER is the type of charter, state or national,
the bank holds under which it does business (Cyree et al., 2000) and will be coded 0 for
state and 1 for national; MULTIBANK HOLDING COMPANY captures the format of
the bank structure whether single bank or multi-bank holding company (Thomson, 1991)
and is coded 0 if single variable or 1 for multi-bank holding company.
Analysis.
For H1 and H2 hierarchical regression (Edmondson & McManus, 2007) is used.
In this study, through a series of steps, first the effect of the control variables, and next
the main effect variable reflecting bank size were entered. A negative effect upon the
accumulation of small bank capital (H1) and business lending (H2) post-SOX was
anticipated. Thus if beyond the variance explained by the control variables, the main

62
effect variable adds to the variance explained with the appropriate sign and is significant,
we can conclude that the hypotheses are supported.
In the conduct of the analysis two conditions were encountered that required
attention in the model. First, the balance sheet and associated income statement values
vary significantly between “small” and “large” firms within the banking industry, which
obscures the impact of a change in values within the small firm structure. In order to
mitigate this, both the level of equity capital and the level of business loans for an
institution were indexed to the level of assets for that institution. Second, large banks are
frequent acquirers of small institutions and thus the addition of acquired assets to normal
same-store growth further obscures underlying trends when compared between the two
periods. The resulting data distribution is peaked with a positive skew. Following Hair
et al (2010:80), the data was transformed by taking its natural logarithm.
Threats to Inference.
The evaluation of threats to inference followed Shadish et al (2002:55). Any
consideration of banking institutions over a multi-year period raises concerns over
potential changes in the underlying data. The following threats are of concern due to the
structure of the experiment and the time periods under study and these threats apply to
each of the hypotheses. Of particular initial concern is history, as there were other
“treatment-like” events occurring during the time period under examination. More
specifically, the Small Business Job Protection Act of 1996 extended to banks the ability
to elect Subchapter S status for assessment of federal taxes effective in 1997. A
significant number of banks converted to Subchapter S status (FDIC database). These
banks when compared to non-Subchapter S banks are smaller, slower growing, more

63
rural institutions with less commercial and industrial lending (Cyree et al., 2005). To
control for this possible confounding effect, Subchapter S banks have been removed from
the study.
In order to provide time for the full effect of implementation of SOX, there is a
four-year break between the periods under measurement. As a result, maturation, the
process of change that an organization undergoes with the passage of time, was
considered as a potential threat. This is the case of “growing older, hungrier, wiser,
stronger, or more experienced” (Shadish et al., 2002). Among businesses generally this
may include changes in business model, level of vertical integration and product line.
The regulated nature of banking, however, ensures that the business model is relatively
unchanging, except for balance sheet growth. The growth rate for financial institutions
from 12/31/2000 to 12/31/2004 averaged 7.74% annually (FDIC Data Base).
Consequently, it is unlikely that a small bank could grow to the size of a large bank,
mitigating that threat. Berger et al. (1995) note the relatively high leverage ratios
permitted by regulation as evidence of the highly controlled business model, further
serving to mitigate threats to inference.
Findings
Table 1 reports the minima, maxima, means and standard deviations of all
variables used. While both large and small bank equity capital (taken as a percent of
assets) grew, the mean for large banks reflects growth in excess of that of the small
banks. Business Loans however show large banks reducing business lending generally
while small banks reflect a significant increase. Table 2 reports the correlations of the
variables. The correlations show that capital growth is not significantly correlated with

64
bank size, however business loans are significant at he p,.001 level. Table 3 reports the
results of the hierarchical linear regression on capital growth, and Table 4 reports the
results of the hierarchical linear regression on business lending. No Variance Inflation
Factor (VIF) exceeded 1.2, and no Tolerance level was less than .8, showing
multicollinearity not to be a problem (Hair et al., 2010).

65
Equity Capital Growth.
Hypothesis 1 predicts that post-SOX capital levels (the capital asset ratio) is lower
post-SOX than pre-SOX for small listed banks as compared to large listed banks. This
hypothesis was tested using hierarchical linear regression in a two-step model (Models
1A & 1B) as shown in Table 3. Model 1A included the control variables that reflect
holding company structure and whether the bank has a state or federal banking charter.
Model 1B included the main effect variable Bank Size and was not found to be
significant. The R2 values and R2 change values were not significant for this model.
Thus Hypothesis 1 was not supported, as the capital levels for small listed banks
were not negatively impacted by SOX as compared to large listed banks.

66
Business Loan Growth.
Hypothesis 2 states that post-SOX small bank lending to businesses is lower than
pre-SOX lending, relative to large banks. This hypothesis was also tested using
hierarchical linear regression in a two-step model (Models 2A & 2B) as shown in Table

67
4. Model 2A included the control variables for holding company structure and banking
charter issuer. This model was not significant.
Model 2B included the main effect variable Bank Size and was significant. The
overall F for the model was significant at the p < .05 level, and the F for change was
significant at the p < .001 level. However, the variable carried the wrong sign, thus
Hypothesis 2 was not supported, as the business loan growth for small listed banks was
not slower in the post-SOX period than pre-SOX as compared to large listed banks. In
fact, business loans by small banks increased markedly, while business loans by large
banks contracted. Taken together with the increase in capital, the findings suggest that
small banks grew capital about 9% over the study period while growing business lending
by 15 % while large banks grew capital by 14% while reducing business lending by 16%.

68
Conclusion
This study commenced by questioning whether the enactment of Sarbanes-Oxley
resulted in consequences for small banks and small businesses. In a previous study, the
direct cost impacts of SOX on large and small banks were examined, concluding that the
cost was significantly greater for small banks relative to large banks. The expectation of
this cost disadvantage may have affected small banks in several ways. It may have

69
dissuaded small banks from going public, convinced small public banks to go private or
created the need for extensive coping behavior to avoid the continuing cost burden.
We theorized that the practical effect would be to reduce capital available to
small banks and by extension to reduce lending to small companies. The typical growth
pattern for a small bank is fairly linear. In a growing market, it becomes increasingly
difficult to raise sufficient capital through earnings and local investors. The bank then
faces a strategic growth choice to: 1) seek access to public funding, to grow capital and in
turn the balance sheet to serve its growing customers, 2) remain privately held with the
potential for diminishing capital growth and hence restricted future growth, or 3) seek
sale of the institution to another bank at what is likely the best value on a time adjusted
basis.
Consistent with Resource Dependence Theory, we expected to find limitations
upon the sourcing of capital by small banks in the period after the enactment of the
Sarbanes-Oxley Act. We had hypothesized (H1) that capital growth post-SOX would be
less than pre-SOX for small banks, relative to large banks. Capital, in the form of equity,
serves several core purposes for the bank. First it is the bank’s cushion with which to
withstand losses taken in the lending program. The ability to efficiently replenish that
capital reserve in the aftermath of losses determines the ability and timing of a bank’s
return to its principal role as lender. The amount of lending a bank can do at any time is
determined in relationship to that bank’s equity capital. Constraint of capital growth acts
directly as a regulatory constraint on loan growth (Benston et al., 2000; Berger et al.,
1995). Therefore, whether we consider the impact of bank capital shortfall on lending in
the normal course of business or at a pivotal time in an economic recovery when capital

70
is critical to the return of jobs to the workplace, it is clear that the potential for damage
exists. Small banks are the key source of capital, in the form of business loans, for small
businesses (Berger & Udell, 2002). Thus, this resource constraint has the potential for
down-stream implications, and we further hypothesized (H2) that small business lending
for the post-SOX period would be less than pre-SOX. Neither Hypothesis 1 nor
Hypothesis 2 was empirically supported. Our results show that indeed capital
accumulation by small banks was not significantly constrained in the period following the
adoption of SOX. Likewise, small business lending was not similarly reduced; in fact, it
increased markedly, while large bank business lending decreased. Resolving the ultimate
deployment of the capital raised by large banks is beyond the scope of this study, but will
provide an important element of framework for understanding the relative growth in the
level business lending nationally.
While the study showed no short term impairment of capital or lending capacity
for small listed banks, the number of small listed banks was reduced and the ability of the
non-listed small banks to fill the void remains to be analyzed. Thus, the long-term
implications for the pool of capital may still be in question, as there are two potential
impacts identified in the study:
1) The number of small financial institutions with access to capital to
support long-term growth is reduced, and
2) A source of long-term funding for small banks in general is now more
costly, with implications for the perceived value of small banking
franchises generally.

71
Managerial Implications.
This study has two implications for managers. First, if the true costs or
perceptions of the likely costs of SOX compliance have raised the bar for public market
access, small banks will likely, in increasing numbers, pursue one of the two non-public
alternative strategies. Small banks can elect to accept a slower growth strategy, relying
solely upon internally generated funds to support lending needs. Alternatively, they can
choose to be acquired by a larger bank thus avoiding the challenge of capital sourcing.
Neither strategy maximizes earnings or provides for the needs of customer businesses.
In both instances, each of these non-public strategies represents a reduced value-
creation opportunity (Ayogu & Dezhbakhsh, 2004). Hence they may reduce the value of
non-public small banks generally, further exacerbating the task of capital sourcing. At a
minimum it suggests increased difficulty in raising sufficient capital to fund the growing
needs of customers, including small and start-up businesses.
Second, while reduced capital may be a tactical constraint for small banks with
implications for ultimate value, it could very well spell the difference between success
and failure for small/start-up companies dependent upon the small bank for support (Beck
& Demirguc-Kunt, 2006). Small companies have traditionally depended upon a single
bank for their lending needs, building upon the relationship to secure needed finance
because attempting to access additional banks for capital has resulted in reduced access
and efficiency of capital management (Berger & Humphrey, 1991; Berger et al., 2001).
Thus, small business managers, in planning their growth, now face increased challenges
in sourcing capital in amounts and at the times needed.

72
Industry Implications.
Capital is drawn to the banking industry seeking a return. The banking model has
been a stable one producing new firms almost solely by start-up. Banking capacity
results from the creation and growth of these new banking firms. These firms, as they
grow, typically reach a decision point regarding the ultimate source of their capital and
some will elect public market sourcing. As the data shows, small banks are generally
private and large banks are generally public. If the costs or the perceptions of those costs
associated with the decision to go public make that alternative unattractive, we risk
creating a discontinuity in scale. If the number of banks in that middle ground that have
made the decision to become a public company is reduced, then the capacity of the
industry to absorb small banks is reduced. This lack of strategic alternatives for the
banking model may reduce the capital competing for new banking licenses.
Public Policy Implications.
Small/new firms have been the central driver of net new job creation in the U.S.
(Stangler & Litan, 2009). Consequently, a reduction in small business lending can only
serve to slow the pace of economic growth. It may have its greatest impact at times when
the economy is most vulnerable, that is, speeding up the downturns and slowing the
recovery. The challenge for regulators generally will be to preserve the safeguards for
the individual investor while minimizing the impact to the economy overall. Programs of
phased implementation, reduced compliance burdens and alternative regulatory regimes
may offer an approach more sensitive to the administrative capacity of small business.

73
Limitations
This study has at least two limitations. These include: applicability to all banks,
and applicability to other national business environments.
Applicability across all banks.
The sample used here is composed solely of financial institutions holding a
banking charter issued by the federal government of the United States or by a state
government. The institutions used in the sample all conduct general banking business
involving the collection of deposits and making of loans to the public. Thus the findings
may not be applicable to specialty organizations holding a bank charter in aid of a
finance-based business (trust, leasing, credit cards) or to foreign banks that may be
operating under a different capital regime.
Applicability to other national business environments.
While there are international norms for the regulation of banking, the specific
regulatory environment of each country is unique. The Sarbanes-Oxley Act is unique to
the United States public market, and similar regulations may not exist in whole or in part
in other countries. Thus the impacts noted here may not exist for other banks in other
countries.

74
Suggestions for future research In this paper we examine the potential for unintended impact of regulation upon small
banks with the reduction of loan volume for small business. Two fruitful questions are
raised by this research:
First, we specifically structured this analysis as a survivor analysis; that is, we
retained in the general pool only those banks that existed throughout the three-year pre-
SOX period as well as the three-year post-SOX period. We excluded from consideration
those banks that elected United States Federal Income Tax status S, as they are precluded
from accessing the public market and so do not have to comply with SOX. Likewise, we
excluded any small banks that elected to be sold to another bank even though they may
have existed for some of the post-SOX three-year period. Each of these decisions is a
strategic one with implications for the institution’s shareholders, and, as they affect the
institution’s ability to garner funds, they also affect the availability of loanable funds to
small business. Future studies may wish to examine the role of impending SOX
compliance on the strategic decision to elect Sub-S tax treatment or to put the bank up for
sale. Such studies would provide additional insights into the total impact of SOX on
banking.
The purpose in this analysis was to provide clarity on the critical linkages
between capital formation for small banks and lending support for small companies. As
small companies play a key role in the creation of jobs in the United States, as well as
throughout the world (Baas & Schrooten, 2006), understanding the role of their leading
financial institutions in providing capital to business could prove useful to banking and
securities regulators as they promulgate banking and stock exchange regulations

75
(Garneau & Shahid, 2009). In this way unintended consequences with significant
negative downstream effects for small companies might be avoided.

68
REFERENCES
Akhigbe, Aigbe, & Martin, Anna D. (2006). Valuation impact of Sarbanes‚ Oxley:
Evidence from disclosure and governance within the financial services industry. Journal of Banking and Finance, 30(3), 989-1006. doi: 10.1016/j.jbankfin.2005.06.002
Allen, F., & Santomero, A. (2001). What Do Financial Intermediaries Do? Journal of Banking & Finance, 25(2), 271-294.
Almazan, Andres. (2002). A Model of Competition in Banking: Bank Capital vs Expertise. Journal of Financial Intermediation, 11(1), 87.
Anand, Amber, Tanggaard, Carsten, & Weaver, Daniel G. (2009). Paying for Market Quality. Journal of Financial & Quantitative Analysis, 44(6), 1427-1457.
Andrade, Sandro C., Bernile, Genaro, & Hood, Frederick M. (2009). SOX, Coporate Transparency and the Cost of Debt.
Argus Research. (2008). Price to Book for S&P 500 Financials. In A. F. N. a. Bottom? (Ed.). New York: Argus Research Company.
Argyres, Nicholas, & Bigelow, Lyda. (2007). Does Transaction Misalignment Matter for Firm Survival at All Stages of the Industry Life Cycle? Management Science, 53(8), 1332-1344.
Arnold, Lutz G., & Riley, John G. (2009). On the Possibility of Credit Rationing in the Stiglitz-Weiss Model. American Economic Review, 99(5), 2012-2021. doi: 10.1257/aer.99.5.2012
Ashbaugh-Skaife, Hollis, Collins, Daniel W., Kinney, Jr William R., & LaFond, Ryan. (2008). The Effect of SOX Internal Control Deficiencies and Their Remediation on Accrual Quality. Accounting Review, 83(1), 217-250.
Audit Analytics. (2007). 2006 Financial Restatements: A SIx-Year Comparison. Retrieved 27 October 2012, from http://www.auditanalytics.com
Ayogu, Melvin, & Dezhbakhsh, Hashem. (2004). Strategic competition in the banking industry. Applied Financial Economics, 14(12), 835-845.
Aysun, Uluc, & Hepp, Ralf. (2011). Securitization and the balance sheet channel of monetary transmission. Journal of Banking & Finance, 35(8), 2111-2122. doi: 10.1016/j.jbankfin.2011.01.011
Baas, Timo, & Schrooten, Mechthild. (2006). ‘Relationship Banking and SMEs: A Theoretical Analysis’. Small Business Economics, 27(2/3), 127-137.

70
Bagley, C. N., Ghosh, D. K., & Yaari, U. (1998). Pecking order as a dynamic leverage theory. European Journal of Finance, 4(2), 157-183.
Baker, George, Gibbons, Robert, & Murphy, Kevin J. (2002). Relational contracts and the theory of the firm. Quarterly Journal of Economics, 117(1), 39-84. doi: 10.1162/003355302753399445
Balakrishnan, Srinivasan, & Fox, Isaac. (1993). Asset Specificity, Firm Heterogeneity, and Capital Structure. Strategic Management Journal, 14(1), 3-16.
Barney, Jay. (1991). Firm Resources and Sustained Competitive Advantage. Journal of Management, 17(1), 99.
Barr, Richard, Killgo, Kory, Siems, Thomas, & Zimmel, Sheri. (2002). Evaluating the productive efficiency and performance of U.S. commercial banks. Managerial Finance, 28(8), 3.
Bazerman, Max H., Moore, Don A., Tetlock, Philip E., & Tanlu, Lloyd. (2006). Reports of solving the conflicts of interest in accounting are highly exaggerated. Academy of Management Review, 31(1), 43-49.
Beck, Thorsten, & Demirguc-Kunt, Asli. (2006). Small and medium-size enterprises: Access to finance as a growth constraint. Journal of Banking & Finance, 30(11), 2931-2943. doi: 10.1016/j.jbankfin.2006.05.009
Benston, George, Irvine, Paul, Rosenfeld, Jim, & Sinkey Jr, Joseph F. (2000). Bank Capital Structure, Regulatory Capital, and Securities Innovations. Federal Reserve Bank of Atlanta. Retrieved from http://search.ebscohost.com/login.aspx?direct=true&db=bth&AN=5850129&site=bsi-live
Berger, Allen N., Frame, W. Scott, & Miller, Nathan H. (2005). Credit Scoring and the Availability, Price, and Risk of Small Business Credit. Journal of Money, Credit & Banking (Ohio State University Press), 37(2), 191-222.
Berger, Allen N., Herring, Richard J., & Szego, Giorgio P. (1995). The role of capital in financial institutions. Journal of Banking & Finance, 19(3/4), 393-430.
Berger, Allen N., & Humphrey, David B. (1991). The dominance of inefficiencies over scale and product mix economies in banking. Journal of Monetary Economics, 28(1), 117-148.
Berger, Allen N., Klapper, Leora F., & Udell, Gregory F. (2001). The ability of banks to lend to informationally opaque small businesses. Journal of Banking & Finance, 25(12), 2127.

71
Berger, Allen N., & Mester, Loretta J. (1997). Inside the black box: What explains differences in the efficiencies of financial institutions? Journal of Banking & Finance, 21(7), 895-947.
Berger, Allen N., & Udell, Gregory F. (1995). Relationship lending and lines of credit in small firm finance. Journal of Business, 68(3), 351.
Berger, Allen N., & Udell, Gregory F. (1998). The Economics of small business finance: The roles of private equity and debt markets in the financial growth cycle. Journal of Banking & Finance, 22(6-8), 613-673.
Berger, Allen N., & Udell, Gregory F. (2002). Small Business Credit Availability and Relationship Lending: The Importance of Bank Organisational Structure. Economic Journal, 112(477), F32.
Bolton, Patrick, & Freixas, Xavier. (2000). Equity, Bonds, and Bank Debt: Capital Structure and Financial Market Equilibrium Under. Journal of Political Economy, 108(2), 324.
Brevoort, Kenneth P., & Hannan, Timothy H. (2006). Commercial Lending and Distance: Evidence from Community Reinvestment Act Data. Journal of Money, Credit & Banking (Ohio State University Press), 38(8), 1991-2012.
Brouthers, K. D., Brouthers, L. E., & Werner, S. (2008). Resource-Based Advantages in an International Context. Journal of Management, 34(2), 189-217.
Brouthers, Keith D., & Brouthers, Lance E. (2000). Acquisition or greenfield start-up? Institutional, cultural and transaction cost influences. Strategic Management Journal, 21(1), 89.
Brouthers, Keith D., & Brouthers, Lance Eliot. (2003). Why Service and Manufacturing Entry Mode Choices Differ: The Influence of Transaction Cost Factors, Risk and Trust. Journal of Management Studies, 40(5), 1179-1204. doi: 10.1111/1467-6486.00376
Brouthers, Lance E., Brouthers, Keith D., & Werner, S. (2000). Perceived Environmental Uncertainty, Entry Mode Choice and Satisfaction with EC-MNC Performance. British Journal of Management, 11(3), 183-195.
Brown, Shona L., & Eisenhardt, Kathleen M. (1998). Competing on the Edge: Strategy as Structured Chaos (Hardcover) (pp. 1).
Calomiris, Charles, & Karceski, Jason. (2000). Is the bank merger wave opf the 90s efficient? Lessons from nine case studies (Vol. Mergers and Productivity): University of Chicago Press.
Castanias, Richard P., & Helfat, Constance E. (1991). Managerial Resources and Rents. Journal of Management, 17(1), 155.

72
Chhaochharia, Vidhi, & Grinstein, Yaniv. (2007). Corporate Governance and Firm Value: The Impact of the 2002 Governance Rules. Journal of Finance, 62(4), 1789-1825.
Cohen, D., Dey, A., & Lys, T. (2008). Real and Accruals-based Earnings Management in the Pre- and Post-Sarbanes Oxley Periods. The Accounting Review, 82(May), 757-787.
Cohen, Jacob. (1992). A Power Primer. Psychological Bulletin, 112(1), 155-159.
Collis, David, Young, David, & Goold, Michael. (2007). The size, structure, and performance of corporate headquarters. Strategic Management Journal, 28(4), 383-405.
Craig, Ben R., & Thomson, James B. (2003). Federal Home Loan Bank Lending to Community Banks: Are Targeted Subsidies Desirable? Journal of Financial Services Research, 23(1), 5.
Cyree, Ken B., Hein, Scott E., & Koch, Timothy W. (2005, October 2005). Avoiding Double Taxation: The Case of the Commercial Banks. Paper presented at the Financial Management Association.
Cyree, Ken B., Wansley, James W., & Boehm, Thomas P. (2000). Determinants of bank growth choice. Journal of Banking & Finance, 24(5), 709-734.
Dell'Ariccia, Giovanni, & Marquez, Robert. (2004). Information and bank credit allocation. Journal of Financial Economics, 72(1), 185. doi: 10.1016/s0304-405x(03)00210-1
DeYoung, Robert. (2003). De Novo Bank Exit. Journal of Money, Credit & Banking (Ohio State University Press), 35(5), 711-728.
Easley, David, & O'Hara, Maureen. (2004). Information and the Cost of Capital. Journal of Finance, 59(4), 1553-1583. doi: 10.1111/j.1540-6261.2004.00672.x
Edmondson, Amy C., & McManus, Stacy E. (2007). Methodological fit in management field research. Academy of Management Review, 32(4), 1155-1179. doi: 10.5465/amr.2007.26586086
Emerson, R. M. (1962). Power-dependence Relations. American Sociological Review, 27, 31-41.
Engel, Ellen, Hayes, Rachel M., & Wang, Xue. (2007). The Sarbanes-Oxley Act and firms going-private decisions. Journal of Accounting & Economics, 44(1/2), 116-145. doi: 10.1016/j.jacceco.2006.07.002

73
Erramilli, M. Krishna, & Rao, C. P. (1993). Service firms' international entry-mode choice: A modified transaction-cost analysis approach. Journal of Marketing, 57(3), 19.
Flannery, Mark J. (1998). Using Market Information in Prudential Bank Supervision: A Review of the U.S. Empirical Evidence. Journal of Money, Credit & Banking (Ohio State University Press), 30(3), 273-305.
Folta, Timothy B. (1998). Governance and Uncertainty: The Tradeoff Between Administrative Control and Commitment. Strategic Management Journal, 19(11), 1007.
Garneau, Victoria, & Shahid, Abdus. (2009). The Sarbanes-Oxley Act of 2002 (SOX): A redundant regulation for the banking industry. Journal of Banking Regulation, 10(4), 285-299.
Ghose, Anindya, & Rajan, Uday. (2006). Teh Economic Impact of Regulatory Information Disclosure on Infomation Security Investments, COmpetition, and Social Welfare. Workshop on Economics of Information Security 2006, 1-20.
Gilbertson, David L., & Herron, Terri L. (2009). PCAOB Enforcements: A Review of the First Three Years. Current Issues in Auditing, 3(2), A15-A34.
Goldberg, Lawrence G., & White, Lawrence J. (1998). De novo banks and lending to small business: An empirical analysis. Journal of Banking & Finance, 22(6-8), 851-867.
Gramling, Audrey A., Hermanson, Dana R., & Hermanson, Heather M. (2009). Audit Committee Material Weaknesses in Smaller Reporting Companies. CPA Journal, 79(12), 24-29.
Hail, Luzi, & Leuz, Christian. (2009). Cost of Capital Effects and Changes in Growth Expectations around U.S. Cross-listings. Journal of Financial Economics, 93(3), 428-454.
Hair, J., Black, W. C., Babin, B. J., & Anderson, R. E. (2010). Multivariate Data Analysis (7th ed.). Upper Saddle River, NJ 07458: Prentice Hall.
Hermanson, Dana R., & Zhongxia, Ye. (2009). Why Do Some Accelerated Filers with SOX Section 404 Material Weaknesses Provide Early Warning under Section 302? Auditing, 28(2), 247-271. doi: 10.2308/aud.2009.28.2.247
Hostak, Peter, Karaoglu, Nuri ., Lys, Thomas Z., & Yang, Yong George. (2009). An Examination of the Impact of the Sarbanes-Oxley Act on the Attractiveness of US Capital Markets for Foreign Firms. SSRN eLibrary.
Hwang, D, Lee, C , & Liaw, T. (1997). Forecasting bank failures and deposit insurance premium International Review of Economics and FInance, 317-344.

74
Keeton, William R. (1995). Multi-office bank lending to small business: Some new evidence. Economic Review (01612387), 80(2), 45.
Krishnan, Jagan, Rama, Dasaratha, & Yinghong, Zhang. (2008). Costs to Comply with SOX Section 404. Auditing, 27(1), 169-186.
Leuz, Christian, Nasharr, Anthony, Swanson, Kristofer, & Chatz, Barry. (2007). Sarbanes-Oxley: Was It Worth It? DePaul Business & Commercial Law Journal, 5(4), 643-666.
Levy, Elliott. (2009). Fallout from the Sarbanes-Oxley Act -- are Private Companies and Nonprofits Next? Research in Business & Economics Journal, 1, 1-8.
Liebeskind, Julia Porter. (1996). Knowledge, strategy and the theory of the firm. Strategic Management Journal, 17, 93-107.
Madura, Jeff, & Wiant, Kenneth J. (1994). Long-term valuation effects of bank acquisitions. Journal of Banking & Finance, 18(6), 1135-1154.
Modigliani, Franco, & Miller, Merton H. (1958). The cost of capital, corporation finance, and the theory of the firm. American Economic Review, 48(3), 261.
Myers, Stewart C., & Majluf, Nicholas S. (1984). Corporate financing and investment decisions when firms have information that investors do not have. Journal of Financial Economics, 13(2), 187-221.
Petersen, Mitchell A., & Rajan, Raghuram G. (1994). The Benefits of Lending Relationships: Evidence from Small Business Data. Journal of Finance, 49(1), 3-37.
Petersen, Mitchell A., & Rajan, Raghuram G. (1995). The effect of credit market competition on lending relationships. Quarterly Journal of Economics, 110(2), 407.
Pfeffer, Jeffrey, & Salancik, Gerald R. (2003). The External Control of Organizations. Stanford, California: Stanford University Press.
Pilloff, Steven J. (1996). Performance Changes and Shareholder Wealth Creation Associated with Mergers of Publicly Traded Banking Institutions. Journal of Money, Credit & Banking (Ohio State University Press), 28(3), 294-310.
Pilloff, Steven J. , & Rhoades, Stephen A. . (2002). Structure and Profitability in Banking Markets. Review of Industrial Organization, 20(1), 81.
Prescott, Edward C., & Visscher, Michael. (1980). Organization Capital. Journal of Political Economy, 88(3), 446-461.

75
Rhoades, Stephen A. (1998). The efficiency effects of bank mergers: An overview of case studies of nine mergers. Journal of Banking & Finance, 22(3), 273-291.
Rindfleisch, Aric, & Heide, Jan B. (1997). Transaction cost analysis: Past, present, and future applications. Journal of Marketing, 61(4), 30.
Rumelt, Richard P., Schendel, Dan, & Teece, David J. (1991). Strategic management and economics. Strategic Management Journal, 12, 5-29.
Safizadeh, M. Hossein, Field, Joy M., & Ritzman, Larry P. (2008). Sourcing practices and boundaries of the firm in the financial services industry. Strategic Management Journal, 29(1), 79-91.
Salancik, Gerald R., & Pfeffer, Jeffrey. (1978). A Social Information Processing Approach to Job Attitudes and Task Design. Administrative Science Quarterly, 23(2), 224-253.
Sarbanes-Oxley Act of 2002, Pub. L. No. 107-204 (2002 30 July 2002).
Schoemaker, Paul J. H. (1990). Strategy, Complexity, And Economic Rent. Management Science, 36(10), 1178-1192.
Schulze, William S. (1992, 1992/08//). The two resource model of the firm: Definitions and implications for research.
Shadish, W.R., Cook, T.D., & Campbell, D.T. (2002). Experimental and Quasi-experimental Designs for Generalized Causal Inference. New York: Houghton Mifflin Company.
Sharpe, Steven A. (1997). The Effect of Consumer Switching Costs on Prices: A Theory and its Application to the Bank Deposit Market. Review of Industrial Organization, 12(1), 79-94.
Shervani, Tasadduq A., Frazier, Gary, & Challagalla, Goutam. (2007). The moderating influence of firm market power on the transaction cost economics model: An empirical test in a forward channel integration context. Strategic Management Journal, 28(6), 635-652.
Siegel, Philip H., Franz, David P., & O'Shaughnessy, John. (2010). The Sarbanes-Oxley Act: A Cost-Benefit Analysis Using The U.S. Banking Industry. Journal of Applied Business Research, 26(1), 73-83.
Siems, Thomas, & Barr, Richard. (1998). Benchmarking the Productive Efficiency of U.S. Banks. Federal Reserve Dallas.
Sinnett, William M. (2009). Does Internal Control Improve Operations And Prevent Fraud? Financial Executive, 25(10), 32-36.

76
Slee, Rob, & Paglia, John K. (2010). Private Cost of Capital Model. Value Examiner, 23-31.
Srinivasan, Aruna, & Wall, Larry D. (1992). Cost savings associated with bank mergers. Working Paper 92-2. Federal Reserve Bank of Atlanta.
Stangler, Dane, & Litan, Robert. (2009). Where will the jobs come from? Kansas CIty MO: The Ewing Marion Kaufman Foundation.
Stiglitz, Joseph E., & Weiss, Andrew. (1981). Credit Rationing in Markets with Imperfect Information. American Economic Review, 71(3), 393.
Sutcliffe, Kathleen M., & Zaheer, Akbar. (1998). Uncertainty in the transaction environment: An empirical test. Strategic Management Journal, 19(1), 1.
Thomson, James B. (1991). Predicting bank failures in the 1980s. Economic Review (00130281), 27(1), 9.
Tomer, John F. (1987). Developing organizational comparative advantage via industrial policy. Journal of Post Keynesian Economics, 9(3), 455.
Tong, Lu, & Sapra, Haresh. (2009). Auditor Conservatism and Investment Efficiency. Accounting Review, 84(6), 1933-1958.
Bank Holding Companies and Change in Bank Control, 12 C.F.R. § 225 (1989).
U.S. Federal Reserve. (2012). Top 50 Holding Companies. Retrieved 2 October 2012
U.S. Government Accountability Office. (2006). Sarbanes Oxley Act - Consideration of Key Principles needed in Addressing Implementation for Smaller Public Companies. (GAO-06-361). Washington, DC.
U.S. Securites and Exchange Commission. (2009). Study of the Sarbanes-Oxley Act of 2002 Section 404 Internal Control over Financial Reporting. Washington, DC.
U.S. Securities and Exchange Commission. (2003). Management’s Report on Internal Control Over Financial Reporting and Certification of Disclosure in Exchange Act Periodic Reports. Washington: Government Printing Office.
U.S. Securities and Exchange Commission. (2006). Final Report of the Advisory Committee on Smaller Public Companies to the U.S. Securities and Exchange Commission. Washington, DC.
Walker, David A. (1989). Financing the Small Firm. Small Business Economics, 1(4), 285-296.
Wernerfelt, Birger. (1984). A Resource-based View of the Firm. Strategic Management Journal, 5(2), 171-180.

77
Williamson, Oliver E. (1975). Markets and hierarchies: Analysis and antitrust implications. New York & London: The Free Press and Collier Macmillian.
Williamson, Oliver E. (1983). Credible Commitments: Using Hostages to Support Exchange. American Economic Review, 73(4), 519.
Williamson, Oliver E. (1991a). Comparative Economic Organization: The Analysis of Discrete Structural Alternatives. Administrative Science Quarterly, 36(2), 269-296.
Williamson, Oliver E. (1991b). Strategizing, Economizing, and economic organization Strategic Management Journal, 12, 75-94.
Williamson, Oliver E. (1993). Opportunism and its Critics. Managerial & Decision Economics, 14(2), 97-107.
Williamson, Oliver E. (1996). Economic Organization: The Case For Candor. Academy of Management Review, 21(1), 48-57.
Wilson, Jr Thomas E. (2009). Financial Reporting in the Sarbanes-Oxley Era: Have Reforms Improved Earnings Quality? Research in Business & Economics Journal, 1, 1-11.