two dimensional stability evaluation of a
TRANSCRIPT


TWO DIMENSIONAL STABILITY EVALUATION OF A
SINGLE ENTRY LONGWALL MINING SYSTEM
by
Thummala Venkat Rao
A thesis submitted to the faculty of the University of Utah in partial fulfillment
of the requirements for the degree of
Master of Science
in
Mining Engineering
Department of Mining, Metallurgical, and Fuels Engineering
University of Utah
June 1974
UNIVERSITY OF UTAH GRADUATE SCI-TOOL
SUPERVISORY COMMITTEE APPROVAL
of a thesis submitted by
Thumma1a Venkat Rao
I have read this thesis and have found it to be of satisfactory quality for a master's
degree.
May 13, 1974
Date William G. Pariseau, Ph.D. Chainnan, Supervisory Committee
I have read this thesis and have found it to be of satisfactory quality for a master's
degree.
May 138 1974
Date �rohn E. Willson, E.M. Member, Supervisory Committee
T have read thj� thesis and have found it to be of satisfactory quality for a master's
degree.
May 13, 1974
Date
UNIVERSITY OF UTAH GRADUATE SCHOOL
FINAL READING APPROVAL
To the Graduate Council of the University of Utah:
Thummala Venkat Rao I have read the thesis of in its final fonn and have found that (1) its fonnat, citations, and bibliographic style are
consistent and acceptable; (2) its illustrative materials including figures, tables, and charts are in place; and (3) the final manuscript is satisfactory to the Supervisory Committee and is ready for submission to the Graduate School.
May 13, 1974
Date William G. Pariseau, Ph.D.
Member, Supervisory Committee
Approved for the Major Department
Ferron A. Olson, Ph.D. Chainnan/Dean
Approved for the Graduate Council
A��',' '� Sterling
.
\ I
Dean of the Graduate School

ACKNOWLEDGMENTS
The author wishes to express his deep gratitude and
appreciation to Dr. William G. Pariseau for his guidance
and encouragement which inspired free and objective think
ing during this work.
The author is indebted to Professor John E. Willson
for his guidance and advice and also to Dr. Wolfgang R.
Wawersik for his advice and cooperation in doing labora
tory work.
The financial support from U.S. Bureau of Mines and
from the University of Utah is also kindly acknowledged.
Finally, the author wishes to express his appre
ciation to his friends and his wife, Rajeswari, for their
help and cooperation.
I rT "I"'" I~TI\J. I nn ft "".-.s.

ACKNOWLEDGMENTS
LIST OF TABLES
LIST OF ILLUSTRATIONS
ABSTRACT
I . INTRODUCTION
TABLE OF CONTENTS
II. THEORETICAL BACKGROUND
Governing Equations. Yield Criteria Solution Technique
III. ANALYSIS OF MINE OPENINGS
Page iv
vii
. vii i
xi
1
6
8 9
1 5
23
Present and Proposed Mining Systems. . .. 23
I V •
Applied Loads. . .. ~...... 26 Material Properties . .•..... 27 Finite Element Meshes for Mine Openings.. 34
RESULTS . . . . . . . .
Double Entry Analysis. Single Entry Analysis.
41
41 43
v. ANALYSIS AND DISCUSSION 53
V I .
V I I •
Comparison of Field and Computer Results 53 Interpretation of Results . . . 59 Stability Criteria . . . . . .. ... 62
CONCLUSIONS .
REFERENCES
APPENDIX A. DETAILS OF MATERIAL CONSTANTS
65
68
72
APPENDIX B. DETAILS AND VERIFICATION OF FINITE ELEMENT PROGRAM . . . . . . . . . .. 74
APPENDIX C.
APPENDIX D.
APPENDIX E.
APPENDIX F.
VITA ...
ROCK PROPERTIES VARIABILITY STUDY
MODEL LOADING STUDY
MESH REFINEMENT STUDY ...
WIDTH/HEIGHT RATIO STUDY ..
vi
Page
81
92
98
. . 104
• 1 08

Table
1 .
2 •
3.
LIST OF TABLES
Mechanical Properties of Coal .•.
Mechanical Properties of Sandstone
Mechanical Properties of Coal Measure Rocks
Page
28
29
31
4. Measured and Predicted Vertical Closures 58
5. Material Properties Used in Four Elastic-Plastic Analyses of a Rectangular Opening 83
6. Random Rock Properties Defining 80 Subtypes 88
7. Displacements for Various Types of Model Load i ng .......... ... 96
8. Stresses for Various Types of Model Loading. 97
LIST OF ILLUSTRATIONS
Figure Page
1. Stress-strain curves for elastic-plastic and elastic-perfectly plastic materials. . 7
2. Stress-strain curve, elastic and plastic strains. . . . . . . . . . . . . . . . 10
3. Coulomb and Tresca Yield for an isotropic material ............... 12
4. Finite element mesh used for row of openings separated by pillars .. . . . . . . . .. 17
5 . . Typical two-dimensional triangular element 18
6. Present double entry longwa1l mining system. 24
7. Proposed single entry longwall mining system . .. ......... 25
8. Rock properties and geologic section for single and double entry analyses . . . .. 33
9. Mesh dimensions for single and double entry analyses . . • . . . . . . . . •. 35
10. Coal seam level dimension detail for single and double entry analyses. . . . . . . 36
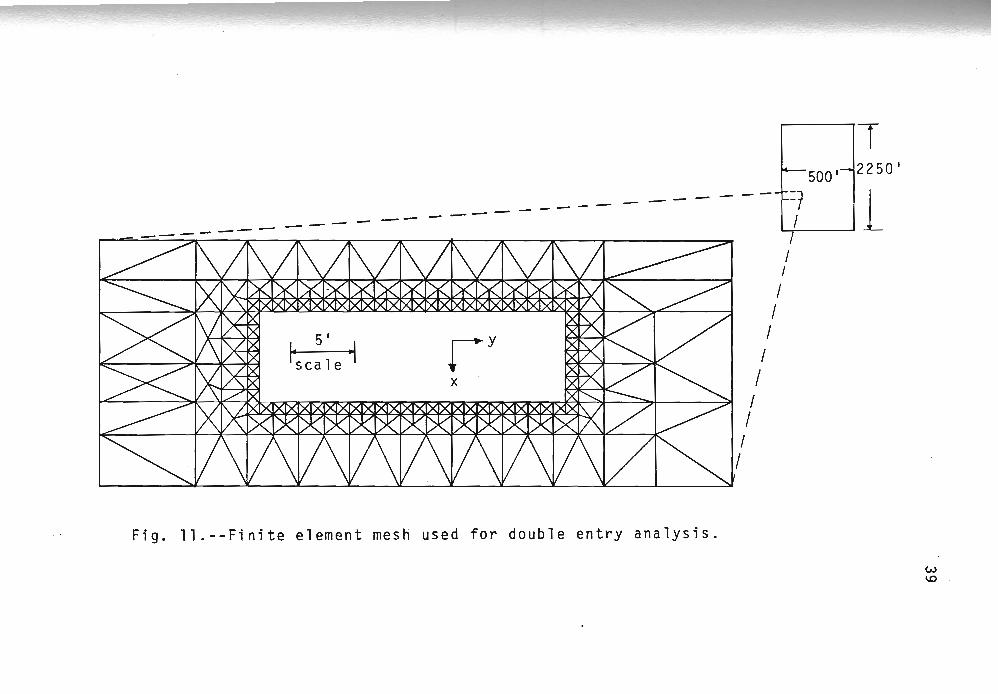
11. Finite element mesh used for double entry analysis .. . . . . . . . . . . . . . 39
12. Finite element mes~ used for single entry analysis . . . . . . . . . . . . . . . 40
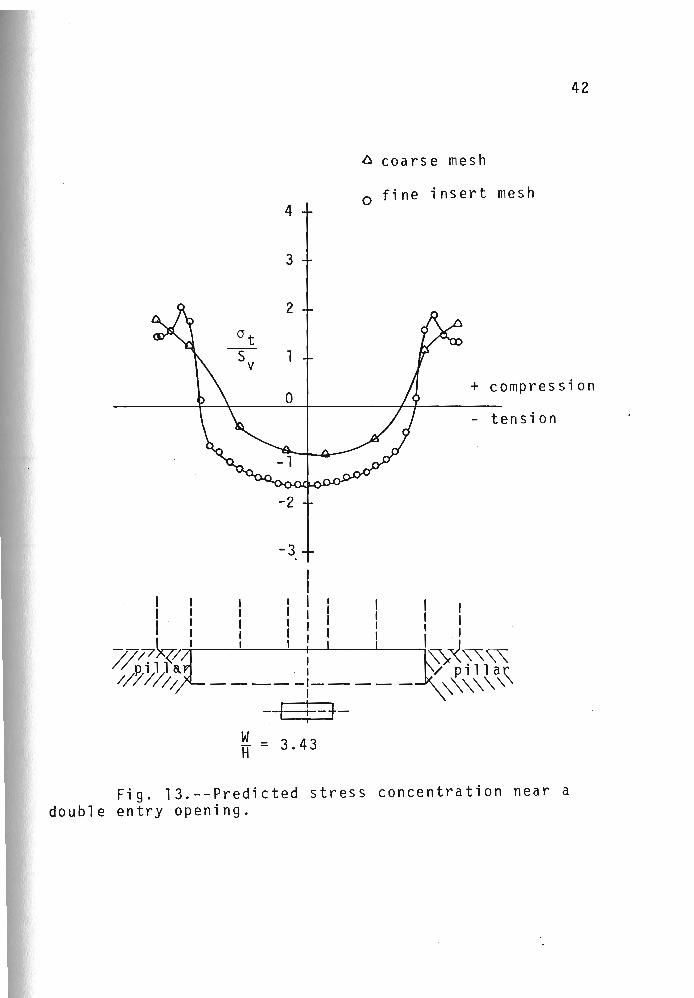
13. Predicted stress concentration near a double entry opening. . . . . . . . . . . . . .. 42
14. Stress contours around double entry opening. 44
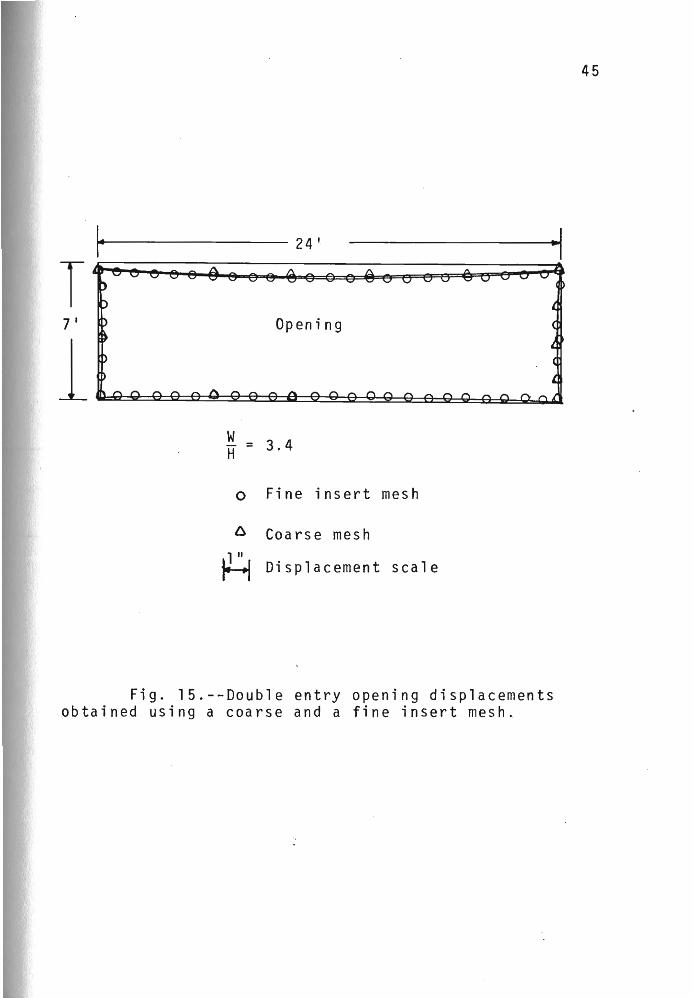
15. Double entry opening displacements obtained using a coarse and a fine insert mesh. .. 45

Figure Page
16. Predicted failure zones about a double entry opening 46
17. Predicted stress concentration about a single entry opening. . . . . . . . . . . . . .. 47
18. Stress contours around single entry opening. 49
19. Predicted displacements about a single entry opening 5 0
20. Predicted failure zones about a single entry opening 51
21. Proposed single entry mining system and location of test room 1 .............. 54
22. Support system near test area ·1, mine 2 . 55
23. Different instruments and their location at tes t a rea 1 . . . . . . . . . . . . . . .. 56
24. Location of vertical closure stations in mine 2, test area 1 .... ........ 57
25. Comparison between single and double entry res u 1 ts . . . . . . .. ........ 60
26. Flow diagram of finite element program 75
27. Elastic analysis of stress and displacement in a hollow cylinder under internal pressure. 77
28. Elastic analysis of stress in a transversely isotropic plate containing a circular hole under uniform pressure . . . . . . . . .. 79
29. Elastic plastic analysis of stress in a circu-lar tunnel in rock . . . . . . . . . . .. 80
3~. Stress concentration as a function of Pois-son's ratio for a rectangular opening. .. 84
31. Element failures about a rectangular opening with different material properties .. .. 86
32. Element failures around single entry opening: a) conventional method with mean-values; b) with random material properties. . . . 90
33. Details of various types of model loading.. 93
ix
Figure Page
34. Dimensions of coarse and fine insert meshes for double entry analysis. . . . . • • . . . 100
35. Stress results for single and two pass from the same mesh and a fine insert mesh . . . . . . 101
36. Displacements from coarse and fine insert meshes .. . . . . .. . ... 103
37. Stress concentration as a function of width/ height ratio for rectangular openings. . . . 106
38. Displacement as a funation of width/height ratio for rectangular openings ..... 107
x

ABSTRACT
This thesis describes work performed under U.S.
Bureau of Mines Contract #H022077 concerning an investiga
tion of the relative merits of single and double entry
longwall mining systems at the Sunnyside Mine of Kaiser
Steel Corporation near Sunnyside, Utah.
The Sunnyside Coal Mine has a present working depth
of approximately 1800 feet with future expected depths to
3000 feet. At present a two entry longwall system of mining
is used. However, lower production cost, improved ground
control, and faster development of longwall panels pro
vides incentive to develop longwall panels through a single
entry system. Research consisted of experimental as well
as theoretical investigations. Field study included instru
mentation, field measurements, and data processing. In-situ
and laboratory tests were conducted to estimate the physi
cal and mechanical properties of rock types present at the
Sunnyside Mine. Theoretical study included prediction of
stress concentrations, displacements, and failure zones
around mine openings. A finite element technique was used
for these purposes.
All the finite element program branches used for
the present study were verified by comparison of results

to existing solutions of various problems. Predicted
displacements around double entry opening compared favor
ably with the average vertical closure measured in the
field. The magnitude of tensile stress concentration
near the periphery of the single entry opening was slightly
higher than in the double entry. Failure zones around
single and double entry openings were approximately the
same size. The results indicate, therefore, that the
single entry system would be as safe as the existing
double entry system.
The views presented heretn are those of the author
and do not necessarily reflect those of the U.S. Bureau
of Mines.
xii

I. INTRODUCTION
The purpose of this study was to determine whether
a single entry is as safe for the development of
longwall panels than the present double entry system at the
Sunnyside Coal Mine near Sunnyside, Utah. The work is a
joint effort by the U.S. Bureau of Mines in cooperation
with Kaiser Steel Corporation and the University of Utah.
The study included field instrumentation and measurements
as well as data processing and interpretation. In-situ
and laboratory tests were conducted to estimate the physi
cal and mechanical properties of rock types present at the
Sunnyside Mine. Theoretical studies included prediction
of stress concentrations and failure zones as well as com-
parisons between theoretical and field measurements of
displacements about mine openings. A finite element com-
puter program was used for theoretical study, comparison
of field data, and for simulation of face advance.
In most of the United States coal and non-coal
mines, longwall panels are developed by a three entry
system (38): At the Sunnyside Mine longwall sections
are developed by two entries and some advantages were
realized in such a two entry system as compared to the
three entries. In the proposed mining method longwall
*Numbers in parentheses refer to corresponding items in the References.

2
panels are developed by a single entry on both sides of
the panel. The proposed single entry system will be sup
ported by cribs along the center line and separated by
fireproof brattice cloth, thus making it, in effect, a
double entry without intervening coal pillars and cross
cut intersections. During development, one-half of the
single entry is used for fresh air and the other for return
air. As the longwall face advances, half of the single
entry will be caved and the remaining half will be used
as return airway for the longwall section.
The two entry system exposes less area of roof than
the three entry system and decreases the magnitude of
squeeze and severity of bounce conditions since the
exposed area of excavation is reduced. The advantages
of two entries over three can be extrapolated to the single
entry system. There are advantages and risks involved in
the single entry system as compared to the double entry.
Some of the advantages are:
a) Longwall panels can be developed at faster
speed and development cost will be reduced.
b) Less area of roof is exposed and absence of coal
pillars would avoid pillar spalling and reduce stress con
centrations.
c) Asthe face advances, the roof would cave more easily
behind the supports, since no pillar remnants are left
in the gob.

d) Elimination of the second entry would reduce
methane liberation because less coal surface area will
be exposed.
3
e) More desirable and efficient ventilation would
be realized because the total amount of air will pass
along only one exposed coal rib before reaching the face.
f) Dust concentration would be reduced at the face
since only the face is ventilated and dust would be car
ried directly into the return.
Risks include those associated with geometry. The
wider single entry would create higher stress concentra
tion zones,greater convergence and increased failures
than in the two entry. Since critical stresses and bounces
occur during mining, stability of the opening and adequacy
of cribs are important system questions. Failure of cribs
could cause complete failure of the opening,and at the same
time ventilation for the longwall section could be stopped.
Information about stress concentration, convergence,
and support requirements aid in evaluating the stability of
mine openings. Input data for analyses include material
properties, geological information, and mine opening
geometry. Knowledge of material properties is one of
the important factors for mine design problems. Some
laboratory properties are available for the present study.
Other material properties used for this analysis were
selected by judgment after comparison between test values
4
and properties from the literature.
A two dimensional finite element program {28}' based
on an elastic-plastic material idealization serves as an
analysis tool. Program capabilities include arbitrary
geometry, in-situ stress, application of external forces
and displacements, elastic and plastic properties for iso-
tropic and anisotropic materials and time dependent mate-
rial properties. Material properties may be linear or non
linear in the program. Finite element meshes with triangu
lar elements were used for the single and double entry •
study. In the finite element model each triangular ele
ment can be assigned different material properties which
need not be in numerical sequence. Openings in the meshes
can be changed to the desirable geometry by changing coor
dinate factors. The program is also capable of handling
premining stresses for an arbitrary geometry. Simulation
of face advance can be included in the program. All the
program branches used for these analyses were verified by
comparing them with existing theoretical and experimental
result~(30).
Results obtained from the computer analyses are
dependent on the refinement of mesh, mesh size, loading,
and material model as well as more direct input such as
material properties.
Stress, displacement, and failure zone predictions
were made for the single and double entrtes~ Predicted

5
stress concentrations around openings are comparable with
existing experimental results. Applicability of the com
puter program for stability analysis of mine openings is
demonstrated by comparison between closure predictions and
mine convergence measurements from the Sunnyside Mine.
Conclusions concerning stability of the proposed single
entry system follow from these results.

II. THEORETICAL BACKGROUND
Most metals and rocks respond elastically to an
initial application of load but tend to yield and deform
permanently upon continued loading. The main character
istic of the mechanical behavior of an elastic material is
adequately expressed by Hooke's law. No similar simple
description of the mechanical behavior of plastic material
seems possible. According to Drucker (7) an elastic body
is reversible, nondissipative and time independent under
isothermal conditions. All the work done on an elastic
body is stored as strain energy and can be recovered on
unloading. Plastic material denotes irreversibility and
implies permanent or residual strain upon unloading.
Stress-strain curves (Figure la) for work hardening
material can be classified into elastic or perfectly elas
tic, ductile, and brittle according to their behavior and
these are represented by OA, AB, and BC portions, respec
tively. An elastic-perfectly plastic material is supposed
to deform elastically up to yield stress (Figure lb), but
be able to sustain no stress greater than this so that it
will flow indefinitely at this stress unless restricted by
some outside agency or adjacent elastic region. Ductile
behavior is not of great importance in rock mechanics,
nevertheless rock can be assumed as an elastic and .perfectly

a Stress
o
B
£-strain (a )
a Stress
a £-strain
(b )
Fig. l.--Stress-strain curves for (a) elasticplastic and (b) elastic-perfectly plastic materials.

8
plastic material (4, 17, 31,33) that deforms permanently
by some mechanism other than that responsible for .ductile
behavior. The mechanical behavior of a perfectly plastic
material is completely characterized by its yield function
(8) .
Governing Equations
The governing equations describing the behavior of
elastic plastic material are (12):
(i) Stress equilibrium equations
dO' •• J 1
,d x j + X. = 0
1
(ii) Equations of deformation geometry 1 s .. = -2(u .. + u· .)
lJ 1,J J,l
(iii) Stress strain relations (constitutive
equations)
0' •• lJ
and (iv) yield function
y [ 0" •• , S P .. ) = 0 lJ lJ
Subscript notation and summation are in force.
( 1 )
(2)
(3)
(4 )
Hijkl are the elastic constants of the material, 0', s, u
denote stress, strain, and displacement respectively; X
refers to body force per unit volume, se and sP are the
elastic and plastic strains, A is non-negative proportion-
ality constant and Y is yield function.

9
The stress strain equations for elastic plastic
material can be written in the incremental form. Stress
strain curve OABC (Figure 2) in one dimensional uniaxial
case represents loading and unloading of the mate
rial. Along the curve OA the material behaves completely
elastic up to yield stress (ao ) and after point A it shows
both elastic and plastic changes. In the elastic plastic
region for each increment of stress (da) the total incre
mental strain (dE) will be sum of elastic and plastic
strains, then
dE .. = dE P .. + dEe .. lJ lJ lJ
( 5) ,
Total incremental strain is given by
d - H- l d + '\ dV £ .• - • . k 1 a k 1 1\ ao . . lJ lJ lJ
( 6 )
Where dE P •. and d lJ -E e .. are inc rem e n tal p 1 a s tic and lJ l · . -1 e astlc stralns; H ijkl are the inverse 'of elastic coeffi-
cients ' (linear case).
Yield Criteria
The elastic behavior of a material for tension or
compression test is normally denoted by its tensile or com-
pressive strengths, whereas for triaxial or polyaxial state
of stres~ a single value of stress cannot be used to find the
elastic limit. Therefore a functional relation is required
among all the stress at the onset of yield which is known
as the yield function or yield criterion (Y). The yield
function is determined by experiment and testing. For any

o Stress
B--.L do
o ~~ ______________________ ~
Fig. 2.--Stress-strain curve, elastic and plastic strains are shown.
1 0

1 1
state of stress within the elastic range Y < 0; for such
states of stress the material is called safe. Plastic
flow may occur only under states of stress for which Y = o. The geometric representation of plastic states of stress
is called the yield surface.
The general types of yield conditions for isotropic
material can be divided into two groups. The first group
consists of those which are influenced by the intermediate
principal stress, and the second consists of those that are
not. The later group can be written in more general form
(31 ) :
I'm In = Ao + m B
Where ° = 1/2 (0 1 m and n (n ,2:1) are material
( 7 )
+ °3)' lm = 1/2 (°1 - °3),and A, B,
constants; 01 and 03 are major
and minor principal stresses, respectively.
By substitution of different values for A, B, and n
(31) in equation 7, various yield criteria can be formed
which are in common use. For example, Tresca and Coulomb
criteria are shown in Figure 3. For Tresca yield cri-
terion:
A = 0; B = Co To
and = 1 2- 2 n (7 a )
and for Coulomb yield:
A Co - To B Co To and = ; = n = (7b) Co + To Co+To
Where Co and To are unaxial tensile and compressive
strengths, compression is taken as positive.

1 2
T
Tresca a
Fig. 3.--Coulomb and Tresca yield for an isotropic material.
13
Since the process of yield must be independent of
the choice of axes in an isotropic material, yield cri-
terion should also be independent of choice of axes.
This yield condition should be expressed in an invariant
formulation which will include the effect of intermediate
principal stress. This type of yield condition (31) is
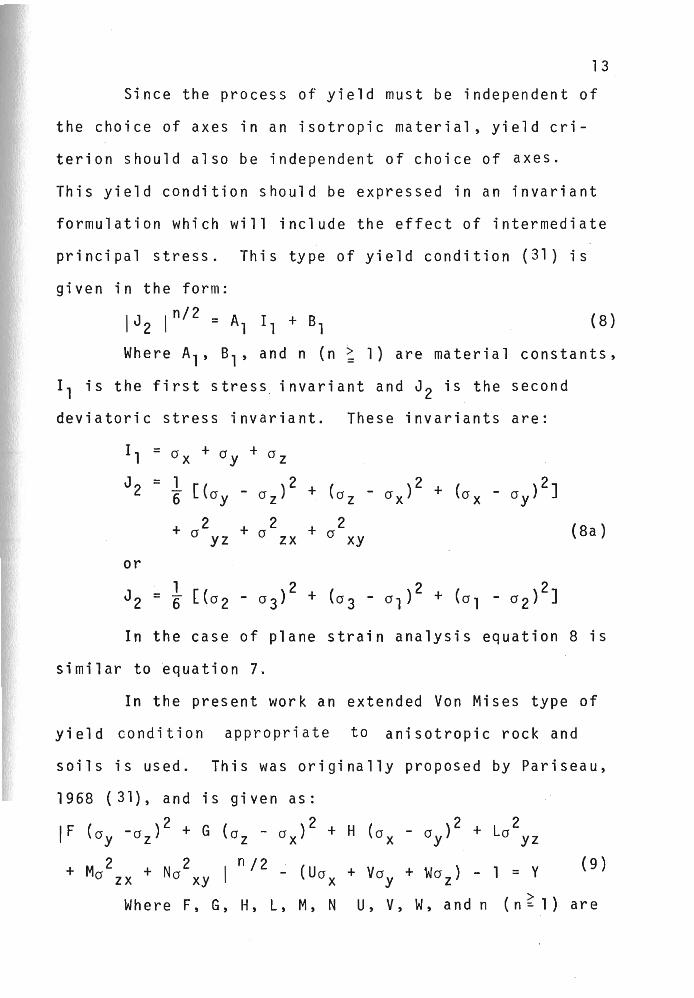
given in the form:
IJ 2 In/
2 = A, I, + B, (8 )
Where Al , B1 , and n (n ; 1) are material constants,
11 is the first stress invariant and J 2 is the second
deviatoric stress invariant. These invariants are:
11 = + 0 + Ox y Oz
J 2 = 1 2 + (0 2
(0 x 2
6" [(Oy oz) - 0) + - ° ) ] z x y
+ 2 + ° 2 + 2 (8a) ° yz zx ° xy
or
J 2 1
= "6 [(02 2
- 03) + 2 (03 - 01) + (01
2 - 02) ]
In the case of plane strain analysis equation 8 is
similar to equation 7.
In the present work an extended Von Mises type of
yield condition appropriate to anisotropic rock and
soils is used. This was originally proposed by Pariseau,
1968 (31) , an dis g i ve n as:
IF (Oy -oz)2 + G {oz - Ox)2 + H (ox - Oy)2 + L02yZ
+ M02zx + N0 2XY n/2 - (Uo x + VOy + WO z ) - 1 = Y
Wh e re F, G, H, L, M, N U, V, W, and n (n ~ 1 )
(9 )
are
14
material constants determined by experiment and x~ y, z
refer to the principal axes of anisotropy. The value of n can
be equal to one or two in the present work.
The material constants of equation 9 will change if
another reference coordinate system is adopted. For U = V
= W = 0, the yield criterion equation 9 gives Hi11's (14)
criterion which includes only the deviatoric stresses.
The nine plastic moduli of equation 9 are expressab1e in
terms of unconfined tensile, compressive and shear strengths
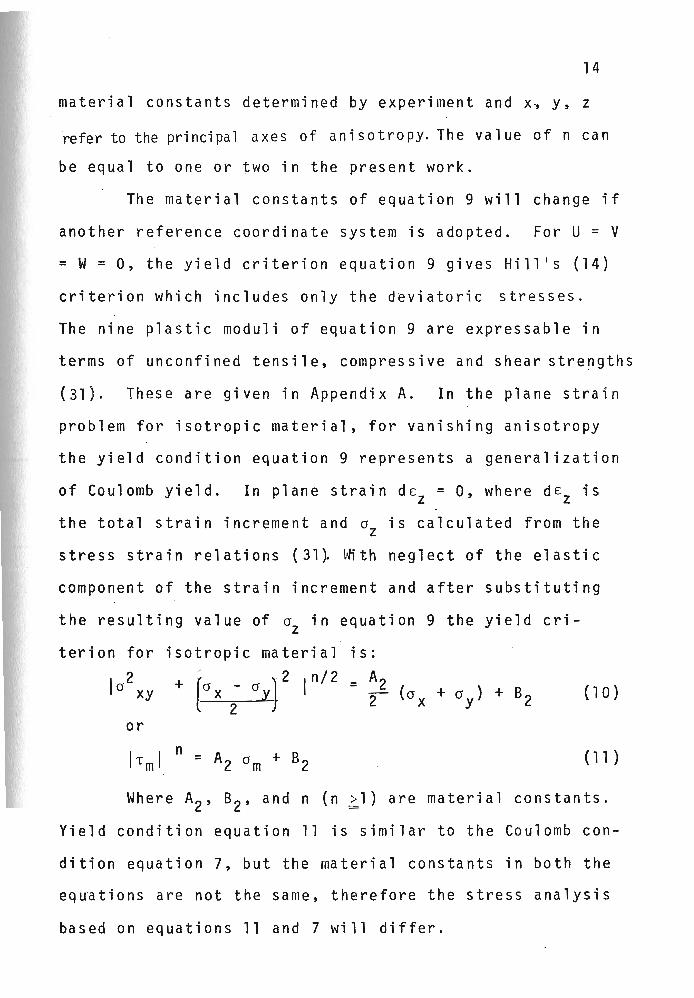
(31). These are given in Appendix A. In the plane strain
problem for isotropic material, for vanishing anisotropy
the yield condition equation 9 represents a generalization
of Coulomb yield. In plane strain dEz = 0, where dEz is
the total strain increment and 0z is calculated from the
s t res sst r a i n r e 1 a t ion s ( 3 1). t'ft t h neg 1 e c t 0 f the e 1 a s tic
component of the strain increment and after substituting
the resulting value of 0z in equation 9 the yield cri
terion for isotropic material is:
I 2 + r )2 n/2 - A2 o xy to x ; 0 YJ I - 2 (0 x + 0 y) + B2 ( 1 0 )
or
(11 )
Where A2 , 82 , and n (n ~l) are material constants.
Yield condition equation 11 is similar to the Coulomb con
dition equation 7, but the material constants in both the
equations are not the same, therefore the stress analysis
based on equations 11 and 7 will differ.

1 5
The yield condition equation 10 for anisotropic
materials in plane strain is (31 ) given as:
( 0 - 0 r + 02 ( 1 c) n/2 ( 1 c)-1/2 x y - -xy
2 ( 1 2 )
= A3
0 + .A4
+ B3 T T 0 x y
Where c, A3, A4 , 83 , and n ( n ~ 1 ) are material con-
stants. In the present work, equation 9 is widely used.
No assumption concerning the elastic component of the
strain increment is made. However, all analyses are plane
s t r a in, sot hat the tot a 1 s t r a i n inc rem e n t d EZ
= o. The
corresponrling stress increment dO z is calculated through
an inverted form of the complete stress strain relations.
Solution Technigue
The finite element method of analysis is a powerful
technique which can readily be applied to boundary value
problems in solid mechanics. It is very well suited for
handling rock mechanics problems because the usual assump-
tions that rock is an isotropic and homogeneous medium need
not be made; any geometry and loading conditions are easily
modeled. The method has been used for various problems in
roc k m e c han i c s (2, 2 3 , . 3 5, 3 9 ). I n fin i tee 1 em e n tan a 1 y-
sis, different material properties can be assigned for
different elements, which need not be in sequence. Be-
cause of the above advantages and simplicity, the finite
element technique is employed for the present work. There
are no suitable alternatives.
16 f
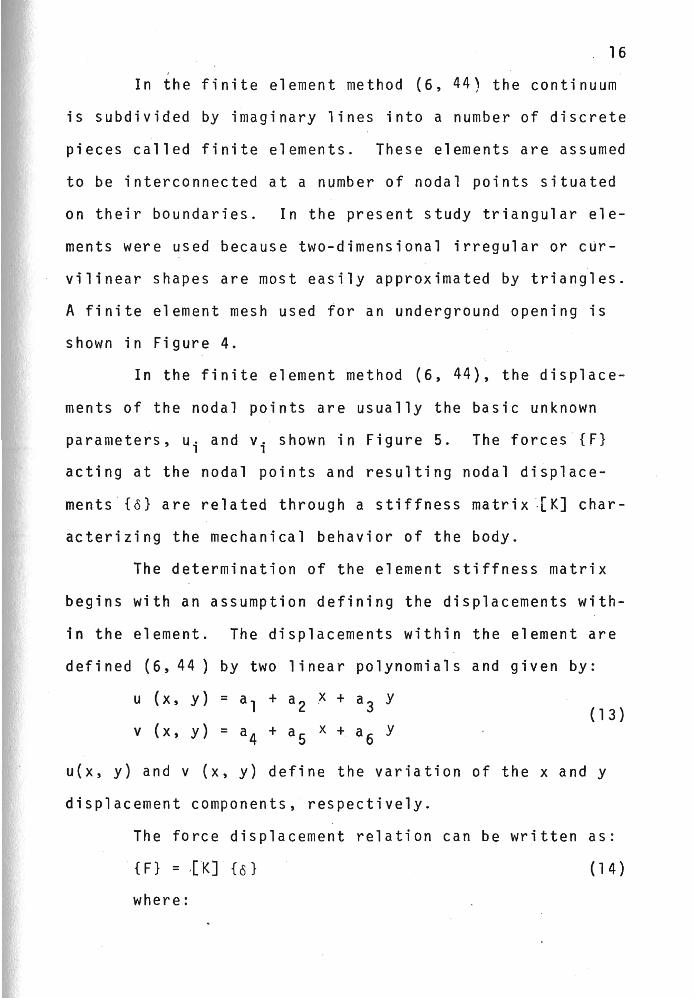
In the finite element method (6, 44) the continuum
is subdivided by imaginary lines into a number of discrete
pieces called finite elements. These elements are assumed
to be interconnected at a number of nodal points situated
on their boundaries. In the present study triangular ele-
ments were used because two-dimensional irregular or c~r-
vilinear shapes are most easily approximated by triangles.
A finite element mesh used for an underground opening is
shown in Figure 4.
In the finite element method (6, 44), the displace-
ments of the nodal points are usually the basic unknown
parameters, ui and vi shown in Figure 5. The forces {F}
acting at the nodal points and resulting nodal displace
ments{8} are related through a stiffness matrix ~ [K] char
acterizing the mechanical behavior of the body.
The determination of the element stiffness matrix
begins with an assumption defining the displacements with
in the element. The displacements within the element are
defined (6,44) by two linear polynomials and given by:
u (x, y) = a l + a2 x + a3 y ( 1 3 )
v (x, y) = a4 + as x + a 6 y
u(x, y) and v (x, y) define the variation of the x and y
displacement components, respectively.
The force displacement relation can be written as:
( 1 4 )
where:

I
t
---__ ___ -- -- - - - --l ____ --- I
--- -1
I I
I I I I I I I
I I I
I I I I
I I I I
I I
~----~~------r-----~~------~I I
17
Fig. 4.--Finite element mesh used for row of openings separated by pillars.

18
o y
x
Fig. 5.--Typica1 two-dimensional triangular element.

19
{F} = = (14a)
. {~.} = = (14b)
and
[K] = k11 k12 k13
k21 k22 k23 (14c)
k31 k32 k33
where Ui , Vi' and ui' vi are the force and the correspond
ing displacement components in a common coordinate system
and the subscri pt i represents node poi nt of each fi ni te
element numbered in a counterclockwise direction. Symbols
{F} and {oJ are column matrix and correspond to the listing
of the nodal point forces and displacements in each ele
ment, respectively. The symbol [K] is a square matrix
which represents the element stiffness matrix and in which
20
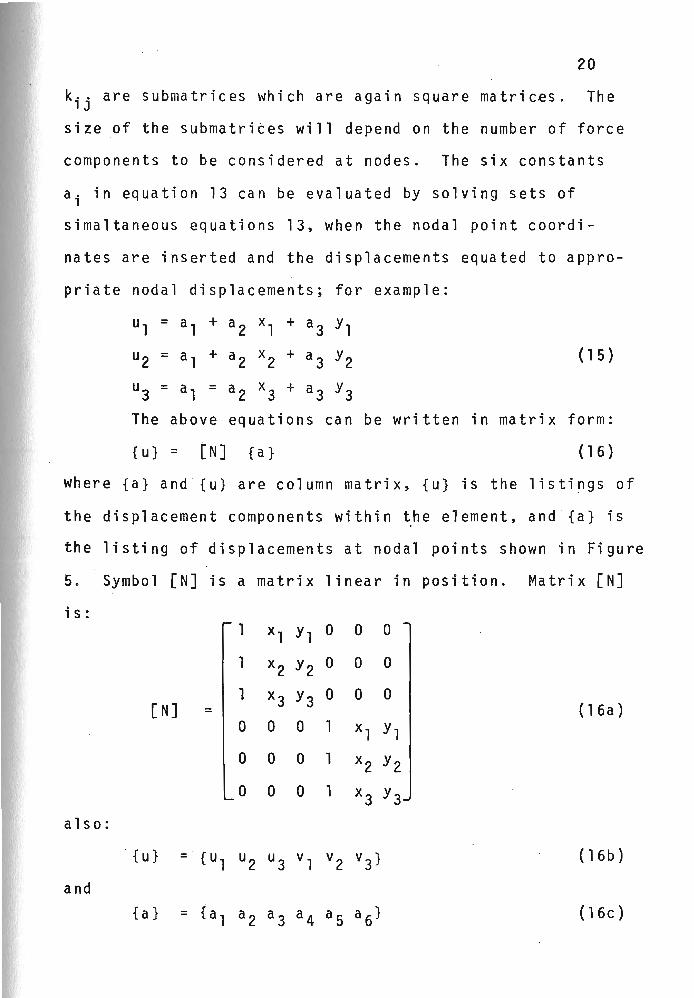
k .. are submatrices which are again square matrices. The 1 J
size of the submatrices will depend on the number of force
components to be considered at nodes. The six constants
ai in equation 13 can be evaluated by solving sets of
simaltaneous equations 13, when the nodal point coordi
nates are inserted and the displacements equated to appro
priate nodal displacements; for example:
ul = a1 + a 2 xl + a3 Y1
u2 = a l + a2 x2 + a 3 Y2
u3 = a1 = a 2 x3 + a3 Y3
( 1 5 )
The above equations can be written in matrix form:
· {u} = [N] {a} ( 1 6 )
where {a} and {u} are column matrix, {u} is the listings of
the displacement components within ~he element, and · {a} is
the listing of displacements at nodal points shown in Fi gu re
5. Symbol [N] is a matrix linear in position. Matrix [N]
is: 1 xl Y, 0 0 0 , x2 Y2 0 0 0
1 x3 Y3 0 0 0 [N] = (1 6a )
a 0 0 1 xl Y,
0 0 a , x2 Y2 0 a 0 1 x3 Y3
also:
·{u} = {u 1 u2 u3 vl v2 V3} (16b)
an·d
{a} = {a, a 2 a 3 a 4 a 5 a 6} ( 1 6c )
21
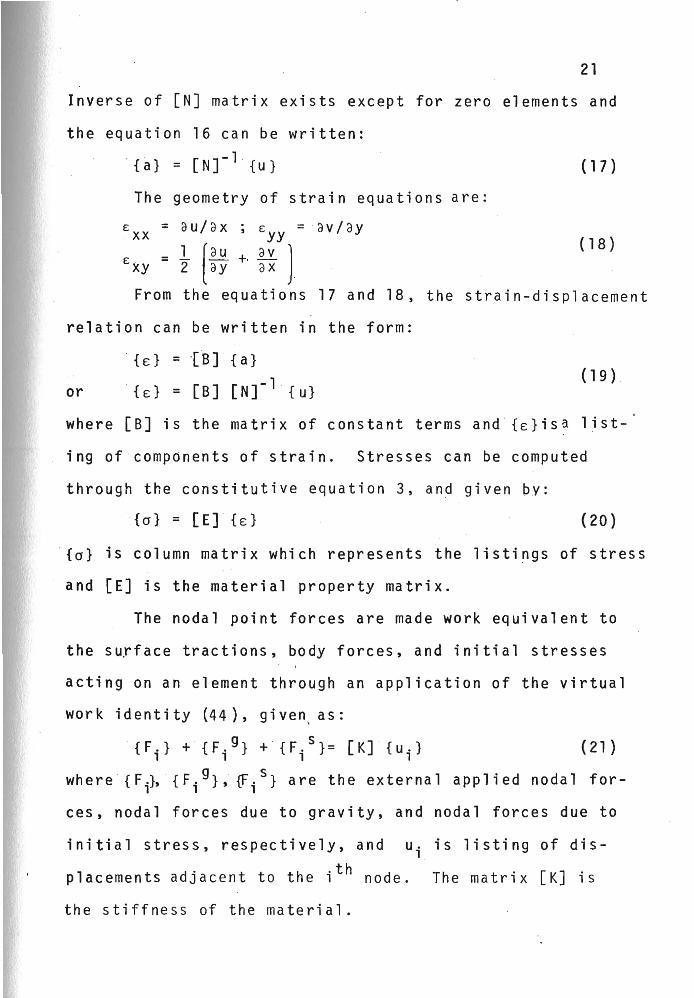
Inverse of [N] matrix exists except for zero elements and
the equation 16 can be written:
{a} = [N]-l {u} ( 1 7 )
The geometry of strain equations are:
£ = au/ax £yy = av/ay xx ( 18 )
£xy = 1 [~ +, lY, ] 2 'ay ax
From the equations 17 and 18 , the strain-displacement
relation can be written in the form:
' {e:} = '[8] {a}
or ' {e:} = [8] [N]-l {u} ( 1 9 )
where [B] is the matrix of constant terms and {e:}isa list-
ing of components of strain. Stresses can be computed
through the constitutive equation 3, and given by:
'{a} = [E] {e:} (20)
'{a} is column matrix which represents the listings of stress
and [E] is the material property matrix.
The nodal point forces are made work equivalent to
the surface tractions, body forces, and initial stresses
acting on an element through an application of the virtual
war kid en t i ty ( 44 ), g i ve n \ as:
{F.} + {F.g} + {F. s}= [K] {u.} (21)
1 1 1 1
where ' {F i}, {Fig}, {Fi s } are the external applied nodal for-
ces, nodal forces due to gravity, and nodal forces due to
initial stress, respectively, and u. is listing of dis-1,
placements adjacent to the ith node. The matrix [K] is
the stiffness of the material.

22
The unknown displacements {u.} are computed from 1
equation 21. Once the displacements are known, strains
and stresses can be calculated by the application of equa
tions 19 and 20.
Some of the details of the finite element program
and verification of th~ program are presented in Appendix
B.

III. ANALYSIS OF MINE OPENINGS
Present and Proposed Mining Systems
At present a two-entry longwall system of mining is
employed at the Sunnyside Mine, Utah. In this system,
longwall panels are developed with two 24-foot wide entries
that are separated by 26-foot wide coal pillars. Cross
cuts (18 foot wide) are driven between the two entries at
approximately 115-foot centers. The average thickness of
the working coal seam is about 7 feet. Dimensions of the
longwall panel and other information is given in Figure 6.
In the proposed mining method, panels are developed with
one 26-foot wide entry, shown in Figure 7. The support
system for the single entry includes roof bolts installed
at 4-f90t centers and cribs along the center line of the
entry, spaced 4 feet apart. Fire-resistant brattice cloth
is installed along the crib line that separates the single
entry into two portions.
During development of the single entry, one side of
the entry is used for intake air and the other for return
air. Once the panel is developed, one side of the panel
entry is used for fresh air and return air is sent through
the other side. As the coal face advances, half of the
single entry will be caved and the remaining portion

'I 11111/1/11/11/111 Ij //1/// I I; Ij / I / / I / I / / / / I
;; / / 1/ 1/ / /1 / /: 1;/~~:(o7~:~!'~;;:'~<~~ U :~:==I II I [II II JI ]0
~--------- 36oo l---------PD 500 1
o o
---"----+------f
A ~-------I 0 t---I I P 1 I I a rll to-_--,tl '--_--,I r::=J 0
--+-------f----B l fJ
24
Doubl e Entry /
(a) Plan Bleeder Entry
24' , 26' 24'
Entry Entry coal
Pillar (b) Section On AB
Fig. 6.--Present double entry longwall mining system.

3600~
(a) Plan
500'
Longwall face
r-- 26 1-----91, ....... -- 500 1 -------e4oI·I _______ -26 1
(b) Section on AB
Fig. 7.--Proposed single entry longwall mining system.
Bleeder entry
Single entry
N (J1

26
of the entry is supported by the cribs as shown in Figure
7. This remaining portion of the entry will be used as
return airway for the longwall panel.
Applied Loads
Applied loads refer to the external forces capable
of causing deformation of the mine openings. All under
ground rock is subjected to the weight of the overlying
rock. Static loads include those of gravitational, tec-
tonic and thermal origin; dynamic loads include those
caused by blasting. Gravitational load is considered
to be the major applied load in the present analysis.
At the Sunnyside Mine, coal is being mined at a I
depth of approximately 1750 feet from the surface and
the coal seam is slightly dipping. Topography may affect
the load due to gravity, but such effects are not dis-
cussed here.
Development entries are driven by continuous miners,
hence blasting is completely eliminated. Tectonic and
thermal loads are not taken into account. The vertical
premining stress component a is computed as the specific v weight multiplied by depth of the opening. The horizontal
premining stress a H is calculated as M a v ' where M =
v and v is Poisson's ratio. The applied loads are (l-v) achieved by replacing the material to be excavated by a
set of stress boundary conditionsacti~g at the excavation
surface. The magnitude of these stresses are exactly those

27
generated by the excavated material prior to its removal.
The stresses resulting from the applied loads are t~en added
to the premining stresses to obtain the final post-mining stresses.
-Material Properties
Material properties are an important component of
input data. Properties of coal and sandstone were deter
mined by laboratory tests. These experiments were con
ducted by Bureau of Reclamation personnel for the Bureau
of Mines. Coal and sandstone samples were cored from
Sunnyside Mine No.2 near test area 1. Laboratoryexperi
ments include both static and dynamic testing. Dynamic
rock properties have greater values (41) than statically
determined properties. The difference between these values
is from 10 to 30 percent.
Statically determined properties were used in the
present analysis. Laboratory properties of coal and sand
stone from 6 to 12 samples are summarized in Tables 1 and
2. · All the static measurements given in these tables were
made on the first loading which was taken up to failure of
the specimen. Shear moduli were computed from Young's mod-
ult · and Poisson's ratios. Plastic properties include
unconfined compressive, tensile, and shear strengths.
Shear strengths for isotropic materials are computed from
compressive and tensile strengths using the formulas in
Appendix A.
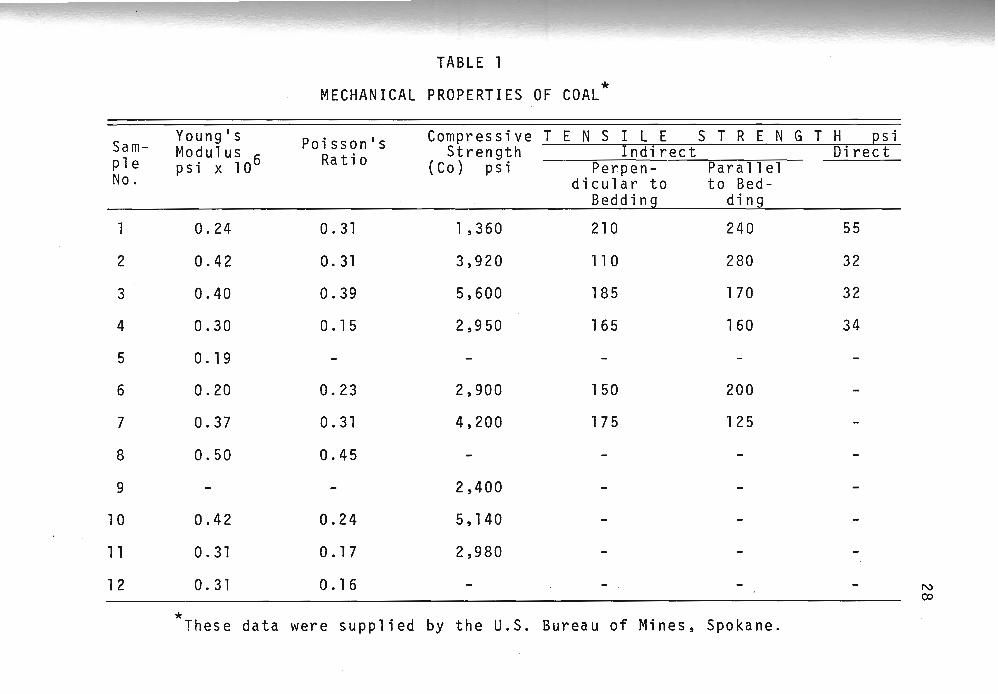
TABLE 1
MECHANICAL PROPERTIES OF COAL *
Sam-Young's Poisson's Compressive T ENS I L E S T R E N G T H ~si Modulus 6 Strength Indirect Direct
ple psi x 10 Ra t i 0 (Co) psi Perpen- Parallel No. dicu1ar to to Bed-
Bedding ding
1 0.24 O. 31 1 ,360 210 240 55
2 0.42 O. 31 3,920 110 280 32
3 0.40 0.39 5,600 185 170 32
4 0.30 O. 15 2,950 165 160 34
5 O. 19
6 0.20 0.23 2,900 150 200
7 0.37 0.31 4,200 175 125
8 0.50 0.45
9 2,400
10 0.42 0.24 5, 140
1 1 0.31 0.17 2,980
12 O. 31 o . 1 6 N ex>
* These data were supplied by the u . S. Bureau of Mines, Spokane.
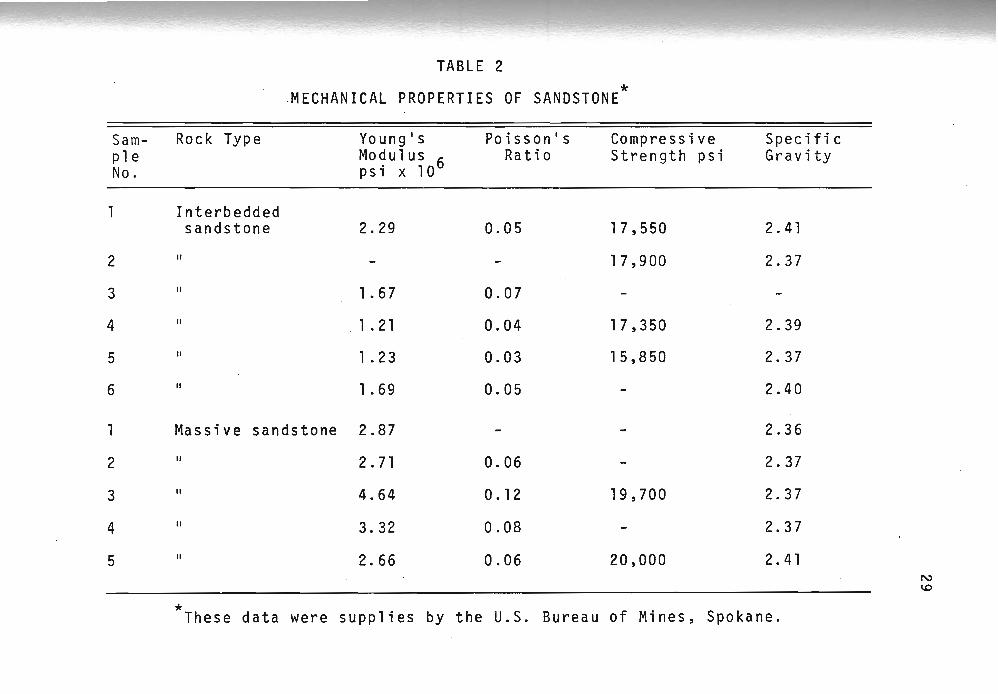
TABLE 2
* .M ECHAN I CAL PROPERTIES OF SANDSTONE
Sam- Rock Type Young's Poisson's Compressive Specific ple Modulus 6 Ratio Strength psi Gravity No. psi x 10
1 Interbedded sandstone 2.29 0.05 1 7 ,550 2.41
2 II 1 7 ,900 2.37
3 II 1 .67 0.07
4 II 1 . 21 0.04 17,350 2.39
5 II 1 .23 0.03 1 5,850 2.37
6 II 1 .69 0.05 2.40
1 Massive sandstone 2.87 2.36
2 II 2.71 0.06 2.37
3 II 4.64 0.12 19,700 2.37
4 II 3.32 0.08 2.37
5 II 2.66 0.06 20,000 2.41 N \0
* These data were supplies by the U.S. Bureau of Mines, Spokane.

30
A typical geological section of the Sunnyside Mine
is shown in Figure 8. Rock types may be geologically
different but have similar material properties. Layers
Qutside the section are assigned average properties; the
stresses in this region are not affected by the excava
tion at the coal seam level. Laboratory test values were
not available for all layers. Consequently some of the
properties were estimated from an abbreviated survey of the
technical literature. These are given in Table 3.
The material properties used for the final analyses
were selected by judgment from laboratory and literature.
These are presented in Figure 8. In the present work the
material is assumed as isotropic and homogeneous within
each layer. More complicated material behavior can be
handled by the computer program.
Rock properties used in the present study are about
midrange of those values obtained from laboratory tests.
But the in-situ properties can vary from the laboratory
values. Rock properties' within each layer itself may not
be constant due to the presence of fractures and inhomo
geneity in material. In general, a standard deviation of
30 percent of the mean or greater is observed in rock prop
erties data. Rock properties could exert a considerable
influence on stress prediction and factor of safety. When
the factors of safety are high, rock properties variability
may not greatly influence stability of the opening, but

TABLE 3: MECHANICAL PROPERTIES OF COAL MEASURE ROCKS
Rock Type Ref- Unit Young's Poisson's Compressive Tensile erenee Weight Modulus 6 Ratio Strength Strength
pef psi x 10 ~si x 1000 ~si x 100 * ** * **
Siltstone (Utah) #15 3.869
Coal (Utah) #15 0.487 4.541 3.600
Sandstone (Utah) #15 8.987 6.861
Coal (Utah) #15 0.654 3.642 4.030
Sandstone (Virginia) #15 2.980 17.860 16~250 Siltstone (Virginia) #15 1 . 709 3.483 2.073 Sandstone (W . Virginia) #15 3.670 15.550
Sandstone (U.S.) #34 7 . 711 18.0 to 22.0
Shale #34 5.494 11.000 Sandstone (Ohio) #5 136.2 2.760 0.38 10.700 1.70
Siltstone (New Jersey) #5 1 62.0 3.870 0.22 17.800 4.30
Shale #10 10.63 to 12.28
Shale #3 0.09 0.09 to 27.0 to 0.13 O. 13 to 49.0
Sandstone (Utah) #43 137.28 1 .900 0.01 1 5. 500
Sandstone (Utah) #43 143.50 2.770 0.07 27.700
*Perpendieu1ar ** w to bedding Parallel to bedding

TABLE 3--Continued
Rock Type
Shale (Utah) Shale (Michigan) Sandstone (Utah)
Reference
# 43 #1 #1
* Perpendicular to bedding
** Parallel to bedding
Unit Weight
pcf
174.72 173.47 143.52
Young's Modulus 6 psi x 10
8.44 7.50 3. 15
Poisson'·s Ratio
0.09 O. 1 5 0.03
Compressive Strength psi x 1000
**
31.300 28.600 13.100
Tensile Strength psi x 100
* **
1 . 6
W N

33
Unit E Co To Weight 10 6
10 3 psi 10 2 0 pcf psi si
Over- 144.0 1 .700 0.25 1.000 0.500 burden
148~2 3.000 0.20 19.000 8.500
Massive sand-
75~0 0.350 0.30 3.500 1.300 stone
Coal 149.5 1 . 500 0.10 1 7 . 500 7.000
Layered sand-stone 148.2 3.000 0.20 19.000 8.500
M.S. SandySha 1 e Coal 170.0 4.500 0.10 15.000 0.000
M.S. 75.0 0.350 0.30 3.500 1 .300
148.2 3.500 0.20 19.500 10.000
Layered sand- 149.5 1 .500 stone
0.10 17.500 7.000
Dimensions in feet
Fig. 8.--Rock properties and geologic section for single and double entry analyses.
34
where margins of safety are low, a stability analysis as
based on the mean values is questionable. In the elas
tic-plastic analysis, variability of plastic moduli dis
closes more failed elements which are safe a~ mean values
of rock properties. More detailed study of rock proper-
ties uncertainty is discussed in Appendix C.
Finite Element Meshes for Mine Openings
Mesh information and material properties are the
basic components of the input for finite element analysis.
Meshes are prepared by drawing the model to scale. Each
element in the mesh is identified by its nodal points and
nodes are located by their coordinates. Nodal coordinates
are taken from the drawing. Mesh plots were generated by
the computer for verification of the meshes.
Accuracy of stress and displacements from an
analysis will depend on mesh size, boundary influence, num-
ber and size of elements around the openings, and model
loading. As a ru1e-of-thumb, a stress concentration caused
by two dimensional excavation decays inversely with the
square of distance from the opening. The magnitude of
stress at a distance of ten times the dimen~on of th~
outer edge of the opening may not be affected by the
excavations. All the meshes used in the present work
satisfies this distance rule. The dimensions of,the
meshes used for single and double entry are shown in
Figures 9 and 10.

-,-Insert mesh ----L-
Double entry
500' --. r
~2 30'-1
C 120' ~ ~ 1 120'· •
t--
Surface
l750~
7' Coal seam
500'
!
. Single entry
1--260
, ...
35
Fig. 9.--Mesh dimensions for single and double entry analyses.

36
l __ ~37' ~ ________________ __ 463 '
Mesh side
PM v!/lwF;77;;7:~77S7:::777Z777ZZZZZZZZll7Zm WIll/III
~ ~ 7" X 24' entry (one of two)
7 ' x 26 ' pillar (half pillar shown)
(a) doubl e entry
Mesh side 13 t . 247 1 -------~
~ I-- 7' X 26' entry ' (h'alf shown)
(b) single entry
Fig. lO.--Coal seam level dimension detail for single and double entry analyses.
37
Stresses near the side and bottom boundaries should
not be affected by the excavations. Adequacy of mesh sizes
is determined by a simple test. Pre~ and post-mining
stress adjacent to the mesh boundaries should be approxi~
mately the same. Though the mesh size is limited by the
number of elements and nodal points, all the meshes used
for the analysis are of adequate size.
Single and double entry meshes extend to the sur~
face. For the meshes that are not extended to the surface,
the effect of the overburden can be replaced by equivalent
nodal forces, but by this system of loading the stiffness
effect of the overburden cannot be replaced without influ
encing displacement predictions. Displacement predictions
mainly depend on the type of loading. When the overburden
effect is replaced by its equivalent nodal point forces,
the value of displacements are a little higher. Some of
the results for different types of model loading are dis
cussed in Appendix D.
In general, stress gradients are very high near the
periphery of the underground openings. Though coarse mesh
es are satisfactory for prediction of displacements, the
same meshes may not be sufficient for estimation of stress.
Detailed information about stress history near the peri
phery of the opening requires a more refined mesh.
One of the difficulties in preparing a refined mesh
is that the element size is controlled by very thin rock
layers and numbers of elements in a mesh are limited by
38
computer core storage. To overcome this problem p two
pass solution technique is used. This point is discussed
in greater detail and illustrated in Appendix E.
The computer program (28) is sensitive to changes
in the geometry of the opening and has th~ ability to dis
criminate between rectangular openings of even slightly
different dimensions. The double and single entry systems
have width to height ratios of 3.4 and 3.7 to 1, respect
ively. In the present analysis it is important to the cal
culation of stress concentrations near the periphery of the
single and double entries. Slight changes in the width to
height ratios are in fact reflected in stress and displace
ment predictions by the computer program. More information
on this study is discussed in Appendix F.
Portions of the finite element meshes used for
double and single entry analyses are shown in Figures 11
and 12. The elements around the openings are made very
small for accurate stress ·predictions near periphery of
the openings. Near the opening, the width of each element
is 12 inches and the height is 6 11•
-- - -- -------~ ----
---
Fig. ll.--Finite element mesh used for double entry analysis.
I /
I /
I
I I
I I
500' 2250'

I I I I
I
I I
I
I I
40
60'
Fig. l2.--Finite element mesh used for single entry analysis.
T 2250'
1

IV. RESULTS
The output results from finite element analyses
consist of listings of stresses, strains, displacements,
and results of the elastic-plastic analysis. In the double
and single entry analyses, the effect of layering is in
cluded. Material properties in both cases are the same as
shown in Figure 8. Average nodal point stresses were com
puted from element stresses; these stresses were taken from
the elastic part of the solution. Stress concentrations,
displacements, stress contours, and failure zone predic- '
tions for the double and single entry systems are pre
sented here.
Double Entry Analysis
A two-pass technique was, used in the double entry
analysis. Displacements from coarse and fine meshes are
in close agreement, but there are differences in stress
predictions. The difference in stress is due to high
stress gradient around the periphery of opening and mesh
refinement.
Figure 13 shows the boundary stress concentration
about a double entry opening, Maximum tensile stress con
centration is 1.63 and it occurs along the centerline of
the opening. Compressive stress concentratiori is slightly
4
3
2
°t -S- 1
v
42
6 coarse mesh
o fine insert mesh
o + compression
-3 , I
I I
tension
I, I ~ I I ,
I I I I I I I I
7/:'7~~' I I i I I ~I"-\t-"<""'\\ pllla. , I / pillar
///'//// - --- -1-- - - - "" """ ,,, --1-+-+-
* = 3.43
Fig. 13.--Predicted stress concentration near a double entry opening.
43
higher in the pillar than in solid coal. Maximum predicted
compressive stress concentration is 2.02. The vertical
stress Sv is approximately 1750 psi. Stress concentrations
from both fine and coarse mesh are shown in Figure 13.
Stress contours near the opening are shown in Figure
14. These contour lines were drawn by joining the lines
along centroids of elements having the same magriitude of
stress. Tensile stress is predominant both in the roof
and floor. Tensile stress in the roof drops down to 400
psi in massive sandstone due to low Young's modulus as com
pared to shale modulus. Peak compressive stress concentra
tion is localized near the corners of the opening and is
higher than in the coal ribs.
Figure 15 shows displacements about the opening.
Results from coarse and a fine mesh insert mesh are in
close agreement. Displacements from elastic and elastic
plastic analyses are within 3 percent. For practical pur
poses they can be taken as equal.
Figure 16 shows the failed elements about a double
entry opening. Tensile stresses are present in the roof
and floor. The failure zone in the roof extends through
the shale and decreases in massive sandstone. Failure
zone extends 4.5 feet into the roof and 1.S feet in the
floor. No rib failures are indicated.
Single Entry Analysis
Figure 17 shows the boundary stress concentrations

--------
(ge x
------ )GA -3.0 ~l
-2.
------------------ 0.4~ ~O.~ ~O.~~
2.5 2.3 2.7 1.8 I
---
5 I; ca 1 e -I
opening 1 • 1
-:::::0:0
.6
1.0 _~
0.8
----- O. 4 ---~
---------2.3
-2.3
- Compression: Vertical stress
+ Tension: Horizontal stress
50 I
I , I
I I I
I I
Fig. 14.--Stress contours around double entry opening (contour values are multiples of 1000 psi).
T 2250·
1
~ 24' 1 T 7' Opening
1 W 3.4 H =
0 Fine insert mesh
6 Coarse mesh
1 " r--1 Displacement scale
Fig. l5.--Double entry opening displacements obtained using a coarse and a fine insert mesh.
45
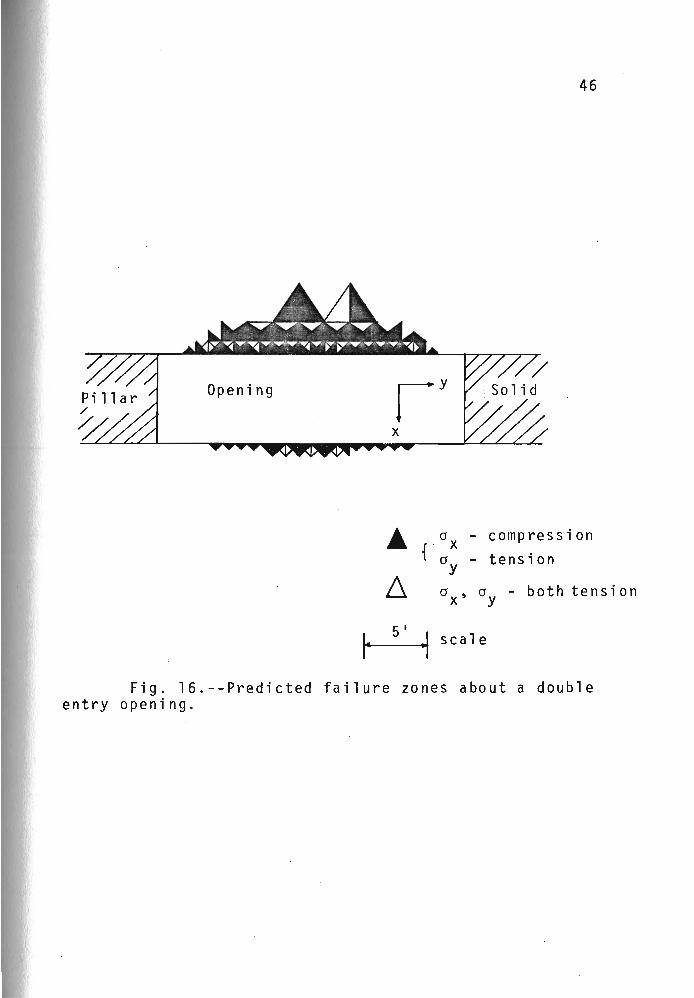
46
Opening
A ° - compression { ' x
0y - tension
6 ° x ' 0y - both tensi on
I-5'
1 scale
Fig. l6.--Predicted failure zones about a double entry opening.

at -sv
3
2
1
0
-1
-2
I I
+ Compression
- Tension
Opening
-r- -- -- - ---- --- ---t
-F_u_;----]-w _ H - 3.7
47
0
Fig. 17.--Predicted stress concentration about a single entry opening.

48
about a single entry opening. The stress concentrations
are ~hown on one side of the centerline of the opening.
Maximum elastic tensile stress concentration is 1,73 and
compressive stress concentration near the corner is 1.84.
Tensile stress concentration in this case is about 6 per
cent higher than in the double entry, whereas maximum com
pressive rib stress concentration in the single entry sys
tem is 6 percent less than in the double entry system. Ab
sence of coal pillars in the single entry system reduces
the critical compressive stresses in the rib.
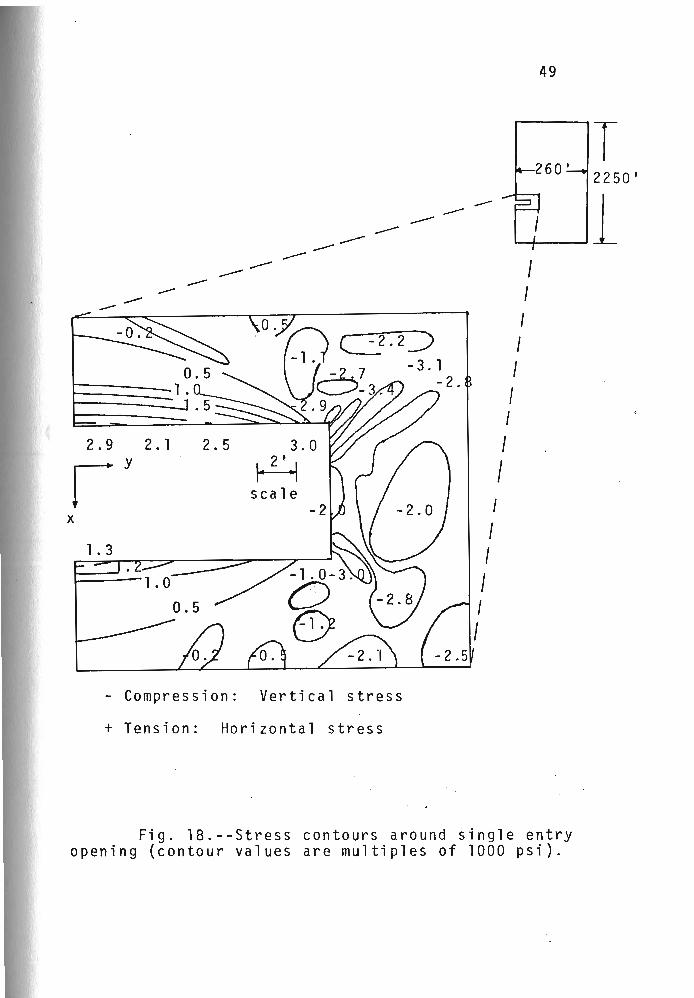
Stress contours around the single entry opening are
shown in Figure 18. Tensile stresses are present in the
roof and floor. There is about a 200 psi increase in ten
sile stress in the floor and roof over the double entry.
Higher compressive stresses are present near centers of
the opening.
Figure 19 shows displacements about the single
entry opening. Displacements from both elastic and
elastic-plastic analyses are presented. Though results
from the elastic-plastic analysis are somewhat higher,
for practical purposes they are equal. Maximum vertical
closure is represented along the centerline of the opening.
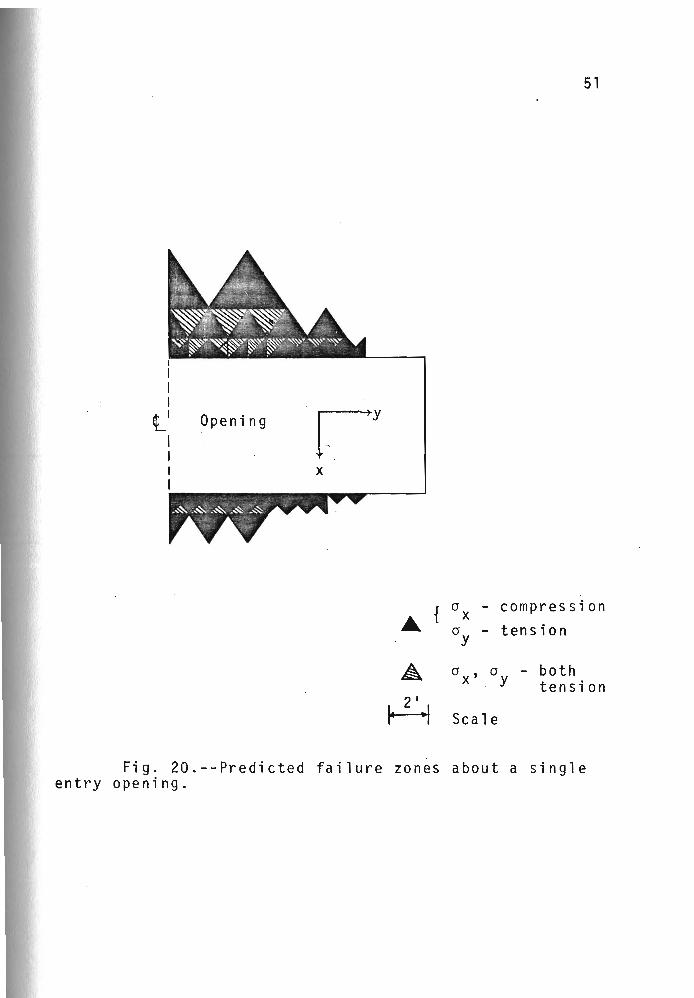
Figure 20 shows the zone of failed elements about
the single entry opening. Failure zone in the roof extends
into shale and sandstone. There are more failed elements
in shale than in the sandstone. Maximum height of the
49
-----,-- I ,--
------,--
--- I ,------ I ---- I I I I I
2.9 2 . 1 2.5 I
r y I
scale I x I I I I I
- Compression: Vertical stress
+ Tension: Horizontal stress
Fig. 1B.--Stress contours around single entry opening (contour values are multiples of 1000 psi).
T 2250'
1

I I I I I
II I I I I I I
50
13' ·1
Opening
0.5 11
H Scal e
o 0 Elastic
8 ~ Elastic-plastic
Fig. 19.--Predicted displacements about a single entry opening.
7'
I
I I I
tl I I I I
Opening
x
.. {
A
r 2 1'1
51
cr - compression x cry - tension
cr x ' cr - both y tension
Scale
Fig. 20.--Predicted failure zones about a single entry opening.
52
failure zone in the roof is about 4.5 feet and in the floor
1.5 feet.

V. ANALYSIS AND DISCUS$ION
Compafis6h "6f "Field and " Comput~~Results
Field observations of vertical closuie from Mine 2,
Test Room 1 of the Sunnyside Mine are available for com
parison with computer results. The location of the test
room is shown in Figure 21. The support system and the
instrumentation are shown in Figure 22. The support system
consists of 3/4-inch diameter, 6-foot long roof bolts
spaced approximately on 4-foot centers sUpporting landing
mats. Timber posts and cribs are installed wherever addi
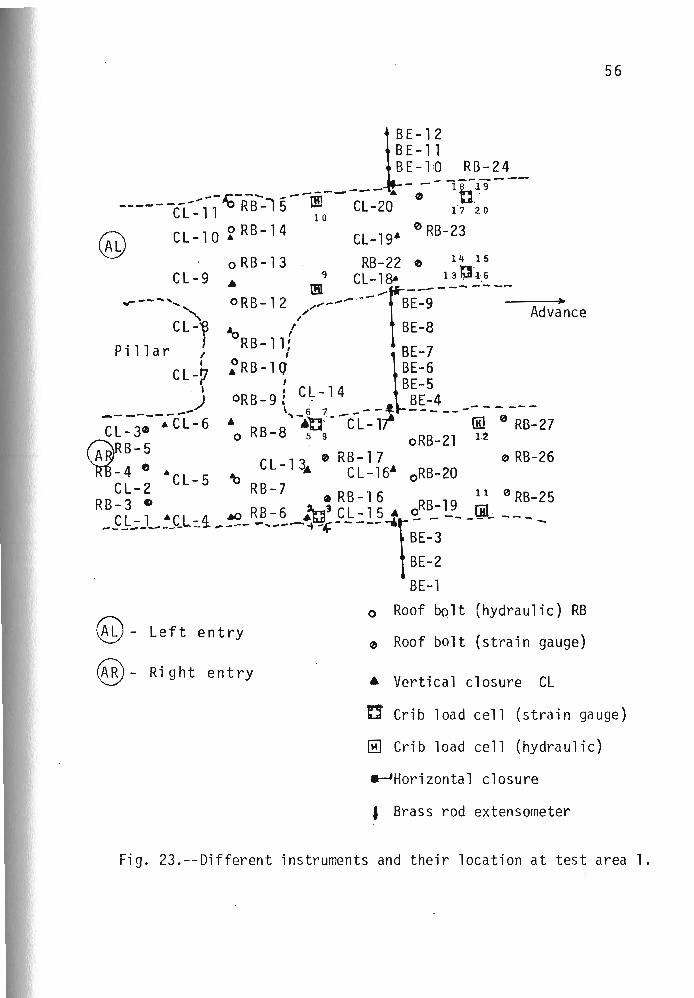
tional support is required. Figure 23 shows various types
of instruments used in the test room and their location.
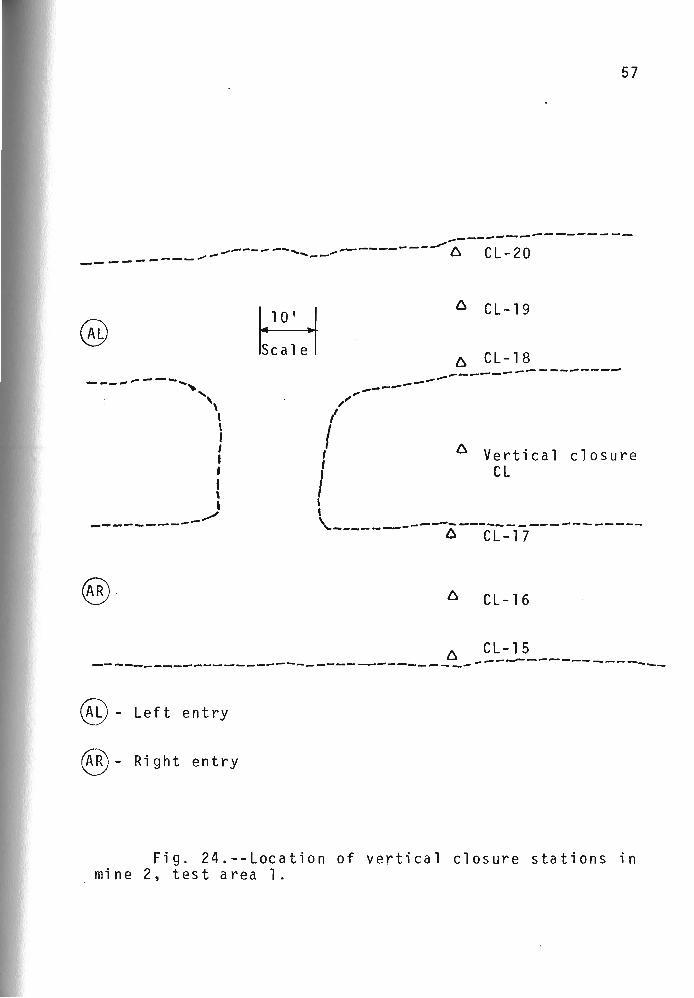
The locations of vertical closure points used for compari
son with computer results are shown in Figure 24.
Table 4 is a tabulation of computer predictions and
field measurements of vertical closure at the Sunnyside
Mine. Field measurements show maximum vertical closure
near the rib of the pillar but predicted maximum vertical
closure occurs at the center of the opening. Displace
ments from elastic and elastic~plastic solutions are close.
The average computer predictions for the double entry sys
tem are approximately 10 percent higher than the field
measurements. The effect of roof bolting is not included

Area instrumented
nu nn n~ O~ flU flll un on O~ un on Dil
~350 I --I_
I I
/ 1~~~~c::::2~c::::::::Jt:::Jc::::J
I "T r
Test area 1
1 Ma in haulage
3000'
Proposed
Panels
1 500 '
Single entry
j
Fig. 2l.--Proposed single entry mining system and location of test room 1.

•
---- ----... ...... . ..... "
Pillar
\ \, \ I I , I , I
g 0 iii 8 ~ __ ----
.a-fl 13-8 /~
B B 8 : I
B 9 -g,' o B e, Pillar
C Q 0"/
9 0 0:
."....-- .-.. ............ - ..... _ ....
,,-- ---:lff---------.-:--
55
• Advance
.. · f.] ~t i.. _____ ~ __ 1_ ~~--~--~~---~-~-~~~~----~--------
• Timber post
o Rock bol ts
- Landing mat locations
~ Cribs
Fig. 22.--Support system near test area 1, mine 2~
l!F ~ ,~ __ R_B~~4 __
---l;- - Ib19
----- -{c:l~ J:O-Rs--l5 - -~:- CL-20 0 1"7 '; 0
CL-l 0 ~ RB-14 CL-19~ 0 RB-23
oRB - 1 3 RB- 22 0 14 ,15
~ -- ... ' ..... ~ 0 R B-1 2 ~--- .. - - BE =-9 ~ CL-9 • mt CL-1B--
r _12 .?~'~ __
-" ,.~;" Advance CL-~ ~ l BE-8
Pillar : RB-ll; BE-7
CL_h ~RB-1Q ~E-6 {I BE-5
_) ORB-9{ C[-714 _--.f. ~~ __ 4 _______ --
-C-L~3-~--:CL-6 • RB 8'-''t]' --CL-lt 00 0 RB-27 o - 5 8 oRB-21 1.2
~RB-5 A f) C L -1 3 (I) RB - 1 7 • 0 RB-26
-4 "CL-S ~ ~ CL-16 oRB-20 C L - 2 R B - 7 • R B _ '1 6 1 1 0 RB- 2 5
R B-3 e ~'3 RB-19 rnI C L -1 ·C L- 4. ~-RJ3,:~_·EiE ~l-:l§ 4r~ -- -- ----------------- - -- ... + BE-3
BE-2 BE-l
@ - Left entry
@- Right entry
o Roof bqlt (hydraulic) RB
o Roof bolt (strain gauge)
• Vertical closure CL
56
0' Crib load cell (strain gauge)
[ill Cri b load ce 11 (hydra u 1 i c)
~Horizontal closure
~ Brass rod extensometer
Fig. 23.--Different instruments and their location at test area 1.
57
------- .... --'---------- ---------_------, -------....,., A CL .... 20 .... _ ...... .".,... , ____ ,-, U --- -- .-. - --
@
.... -... .,.",..--- .... ,,, " \
\ \ , I I
• , \
• ----------------
_/
@ - Left entry
@ - Ri ght entry
~ ~
l I , I
I , t
/' -,."". ....... .",..--..",..
6 CL-19
6 CL-18 .,,- ........ ----.,- .... - --_.-."..-----
6 Vertical closure CL
\.----- ------6 --CL -=-17--- - -- -----
6 CL-16
Fig. 24.--Location of vertical closure stations in mine 2, test area 1.

58
TABLE 4
* MEASURED AND PREDICTED VERTICAL CLOSURES
M E A S U RED PRE D I C T E 0
CL Vertical Elastic Solution Elastic-Plastic Station Closure Solution
Double Single Double Single
1 5 0.237 0.367 0.359 0.367 0.364
** 20 0.323 (0.384)
Average: 0.280
16 0.426 0.651 0.642 0.660 0.664
19 0.292 (0.641)
Average: 0.359
17 0.877 0.413 0.359 0.413 0.364
18 0.475 (0.401 )
Average: 0.676
Average 0.438 0.477 0.453 0.480 0.464
(0.475)
* All measurements and predictions were i n inches
** Coarse mesh results

59
in the finite element analysis which would reduce the pre
dicted values and bring the averages into better agree
ment. Though the roof span is greater in the single entry
system than in the double entry,displacements are higher
in the latter system due to pillar squeeze. Field data
also appear to reflect pillar squeeze. Predicted vertical
displacement in the pillar is less than field measurements
which indicates that coal modulus from laboratory tests is
higher than the actual field value. No attempt was made
to change material properties for matching computer dis
placement results and field measurements in greater detail.
Interpretation of Results
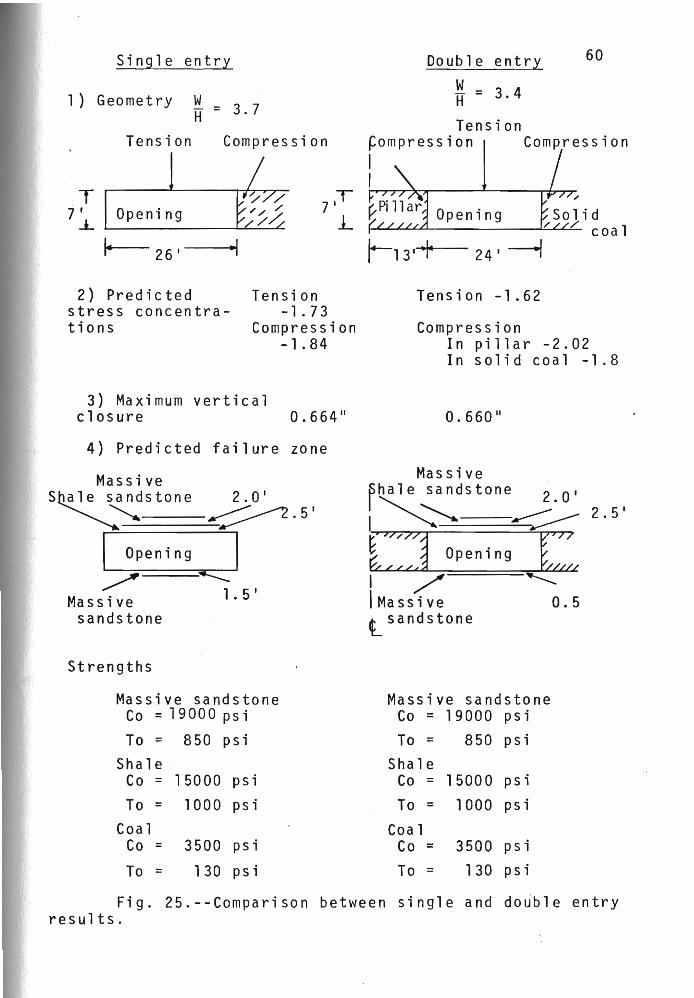
A comparison of results for the double and single
entry analyses are shown in Figure 25. Opening geometry,
vertical closure, stress and failure zone in both the
systems are compared.
Width to height ratios in single and double entry
systems are 3.7 and 3.4 respectively. The height of the
opening in both cases is the same. Since the width of the
opening in a si~gle entry system is more than in the double
entry system, one can expect higher values 'of displacements
or vertical closure, higher stress concentration, and a
more extensive failure zone in the single entry. In both
cases, layering effect is included and each layer represents
its own mechanical behavior. But the differences in the
results for the two systems are generally very small.
Single entry
1) Geometry w = 3.7 IT Tension Compression
T 7 ~ Openi ng
26'
2) Predicted stress concentrations
Tension -1 .73
Compression -1 .84
3) Maximum vertical closure 0.664"
4) Predicted failure zone
Massive S~le ~ndstone 2.0' ~~ ~.5'
I Opening I ...,Jr ..::::::::
~ 1.5' Massive sandstone
Strengths
Massive sandstone Co = 19000 psi
To = 850 psi Shale
Co = 15000 psi
To = 1000 psi Coal
Co = 3500 psi
To = 130 psi
Double entry W _ H - 3.4
Tension
60
~ompression Compression I I
Opening
~- 24' ----I
Tension -1.62
Compression In pillar -2.02 In solid coal -1.8
0.660"
Massive phale sandstone 2.0'
: ~ ~ ---::--- 2.5'
t::] Opening E: 1/ -..--.. \Massive 0.5 t sandstone
Massive sandstone Co = 19000 psi
To = 850 psi Shale
Co = 15000 psi
To = 1000 psi
Coal Co = 3500 psi
To = 130 psi
Fig. 25.--Comparison between single and double entry results.

61
Vertical closure in the single and double entries
are very close and for practical purposes they are equal.
Tensile stress concentration in the single entry is approx
imately 6 percent higher than in the double entry system,
whereas critical compressive stress concentration near the
opening is higher in the double entry. Tensile stress con
centration in the single entry system is higher because the
length of the roof span is greater, The results show that
absence of pillars in the single entry reduces the value of
critical compressive stress in the sides of the opening.
The predicted failure zone from elastic-plastic analysis
for the single and double entries extends in the roof and
floor. Failure zone extends into the immediate roof (shale
and massive sandstone) layers. No failures are indicated
in the remote roof that consists of layered sandstone.
The floor is a massive sandstone and the failure
zone is less in the floor than in the roof. In single and
double entry systems the failed zone in the roof is almost
the same size. But in double entry,failed elements in the
floor are less than in the other case. Rib failures were
not indicated in both the cases due to higher strength of
coal and triaxial state of stress in the rib elements.
The failure zone in the roof extends into two layers
and the height of this zone is approximately 4.5 f~et~ .. ~ti
ficial roof supports can control the failure zone and'growth
of this zone around the opening. Six foot long roof bolts

62
are used for controlling fractured zones in the rnof. How-
ever, the results from the single and double entry analyses
show that the difference in ~esults for both systems are
v e r y . s rna 1 1. '
Stability Criteria
Stability (25,32,36 )evaluations of surface and
underground openings in rock are based mainly on consider-
at ions of strength and stress. The stability of the open
ing will depend on the ability of the rock and artificial
support system to resist the applied loads. In general,
stability of an opening is determined on the basis of
safety factors. The safety factor FS (11, 37) is defined
as the ratio of the relevant values of strength to load,
that is:
Safety factor IFS I = strength load
A structure is stable when the load acting on it
is smaller than the strength of the structure. Failure
occurs when load acting on it is greater than the strength
of the structure or when load exceeds the strength. These
statements in terms of the safety factor are as follows:
FS >1 stable structure
FS <1 failed or unstable structure
As stated above, factors of safety greater than one
are considered indicative of stability and factors of safe
ty less than one indicate that the opening or structure

63
would be unstable. Failure or instability are used to
evaluate any kind of operational hazard, such as collapse
or failure of an opening, caused by application of load
leading to unserviceability of the structure or opening
over its intended lifetime.
The object of a stability analysis is to determine
whether or not the opening will remain useful over its
intended life. Complete stability of an opening can be
determined when the safety factors are known. But the
safety factors in rock mechanics are not well defined and
direct methods are not available for computing safety fac~ .
tors.
In the present study stability of the single entry
is determined from the results of the elastic and elastic~
plastic analyses. Elastic analysis includes calculation
of elastic stress concentrations and displacements around
openings. Elastic~plastic analysis is utilized to deter
mine the failure or collapse conditions of the underground
openings. Elastic-plastic stability analysis involves the
usual considerations of applied loads, material properties,
and opening geometry.
Results of the elastic analysis were presented in
the previous sections. Elastic stress concentrations and
displacements around single and double entries are com
parable and close. The size of the failed or plastic zone
is indicative of the risk of collapse. The failure zone
64
around the opening indicates the regions whose safety fac
tors are one. Local failures may not lead to the unstable
or collapse conditions. The predicted localized failure
zones can be controlled by using artificial supports (16,
18, 20, 22, 27).
VI. CONCLUSIONS
An existing finite element computer program has been
used for double and single entry stability analyses. All
program branches used in the present work are fully veri
fied by comparison with existing analytic and numerical
solutions of various problems. Applicability of the solu
tion technique to stability analysis is assessed by com
parison of closure predictions and mine measurements ob
tained in an instrumented double entry section of the Sun
nyside Mine.
Predicted vertical closure values are, on average,
in good agreement with vertical closure measurements in the
mine. The effect of layering is included in both the dou
ble and single entry analyses, although the divided layers
are considered to be isotropic. Field measurements indi
cate that maximum vertical closure occurs near the rib of
the coal pillar. But the maximum predicted vertical clo
sure is along the centerline of the opening.
The coal Young's modulus and strength determined
by experimental procedure are therefore probably higher
than the actual in-situ properties. Predicted vertical
closure is approximately 10 percent higher than the
measured values. The effect of roof bolting is not
66
included in the analysis, which would reduce the predicted
closure values.
Stability evaluation of the single entry system re
quires the knowledge of stress concentrations, displace~
ments and failure zones around the opening. Stress field,
displacement and failure zone predictions have been made
for the single and double entry systems. The vertical clo
sure of the single entry is higher than in the double entry,
but the closure values in both the cases are equal for
practical purposes. Tensile stress concentration in the
single entry system is approximately 6 percent higher than'
in the double entry design. However the results indicate
that absence of pillars in the single entry reduces the
value of the compressive rib stresses around the opening.
Permanent deformation and failure are important
features of the single and double entry systems. Pre
dicted failure zones in the single and double entries are
of the same size. Failure zone in the single entry ex
tends in two roof layers~ The height of the failure zone
in the roof is approximately four feet; this can be easily
controlled by using roof bolts.
In the single and double entry systems the differ
ences in stress concentration, displacements, and failure
zones are small. Dangerous pillar stress concentrations
and wide intersections are eliminated in the single entry
system. The results of the present investigation indicate
67
that the single entry is as stable and safe as the present
double entry on development, but the effect of supports
and influence of mining operations has not been considered
in the present work.
The resul ts of the present investigation offer en,
couragement, and further research should be continued for
a more complete assessment of stability and safety of the
single entry longwall mining system. Suggestions for fur
ther research include:
1. Reinforcement effects of bolts and cribs should
be included in future research. The effect of bolting can
be introduced by applying two point loads for each bolt.
Nonlinear behavior of wooden cribs can also be included.
2. Adequacy of cribs and caving patterns are impor
tant factors in the single entry stability analysis. There
fore, simulation of face advance should be included in fu
ture investigations.
3. Since mining operations involve time, time depen
dent rock behavior may be of importance to stability anal
ysis and should be considered in further work.

REFERENCES
1. B 1 air , B, E., II P h Y sic alP r 0 per tie s 0 f Min e Roc k , ~I Part III, U.S.B.M., RI 5130, 1955.
2. Blake, W., IIApp1ications of the Finite Element Method of Analysis in Sblving Boundary Value Problems in Rock Mechanics,1I Int. J. Rock Mech. Min. Sci., Vol. 3, 1966, pp. 169-180.
3. Brown, A., IIGround Stress Investigations in Canadian Coal Mines," Mining Engineering, Translations AIME, August 1958.
4. Dahl, H. D., "Finite Element Model for Anisotropic Yielding in Gravity Loaded Rock.1I Ph. D. Thesis Pennsylvania State University, 1969.
5. Deere, D. U., and Miller, R. P., "Engineering Classification and Index Properties for Intact Rock," Univ. of Illinois Contract AF 29 (601)-6319. Tech. Rept. AFWL-TR-65l16. Springfield, Va., Fed. C1r. Hs. Sci. & Tech. Inf., 1966 ..
6. Desai, C. S., and Abel, J. F., "Introduction to the Fi ni te El ement Method," VNR Company, New York, 1972 .
. 7. Drucker, D. C. IIA Definition of Stable Inelastic
Materia1,11 J. Applied Mechanics, Vol. 24, March 1959, pp. 101-106.
8. Drucker, D. C., Prager, W., and Greenberg, H. J., "Extended Limit Design Theorems for Continuous Media,1I Q. Applied Math., Vol. 9, No.4, 1952, pp. 381-389.
9. Duncan, J. M., and Goodman, R. E., "Finite Element Analysis of Slopes in Jointed Rock," Contract Report S-68-3, University of California, Berkeley, 1968.
10. Emery, C. L., IIIn-situ Measurements Applied to Mine Design,1I 6th Sym. on Rock Mechanics at Rolla, October 1964.

69
11. Freudenthal, A.M., Garrelts, J.M., and Shinozuka~ M., "T h e A n a 1 y sis 0 f S t r u c t u r a 1 Sa f e ty ,II Pro c. AS C E Volume 92, N. ST1, pp. 267-325, Feb. 1966.
12. Fung, Y.C., "Foundations of Solid Mechanics,1I Prentice-Hall, Inc. (1965)
1 3 . Ham mer s 1 e y, J. M., and Han d s com b, D. C " II M 0 n t e Car 1 0 Met hod s ," J 0 h n Wi 1 ey and Son s, Inc., N. Y ., 1965
14. Hill, R., "The Mathematical Theory of Plasticity," Oxford. The Clarendon Press, 1950.
15. Holland, C.T., "Cause and Occurrence of Coal Mine Bumps," Mining Engineering, Transactions AIME, pp. 996, September 1958.
16. Jacobi, 0., "The Origin of Roof Fall in Starting Faces with the Caving System," Int. J. Rock Mech. Min . Sc i ., Vol. 1, p p. 31 3 - 3 1 8, 1 9 6 5 •
17. Jaeger, J.C. and Cook, N.G. W., "Fundamentals of Rock Mechanics," Chapman and Hall Ltd. 1969.
18. Kenny, P., "The Cavi ng of the Waste on Longwa 11 Faces," Int. J. Rock Mech. Min.Sci., Vol. 6, pp. 541-555, 1969.
19. Lekhuitskii, S.G., "Theory of Elasticity of an Anisotropic Elastic Body," Holden-Day, Inc., San Franc i sco, 1963.
20. Lewis, A.T., and Wllson, J.W., "The Introduction of Composite Pack Support at Western Holdings, Ltd.," Papers and Discussions 1968-69, Association of Mine Managers of South Africa, The Chamber of Mines of South Africa, pp. 561-583.
21. Love, A.E.H., "A Treatise on the Mathematical Theory of Elasticity," Dover Publications, N.Y., 1944.
22. Margo, E., and Bradley, R.K.O., "An Analysis of the Load Compression Characteristics of Conventional Chock Packs," Journal of the South African Institute of Mining and Metallurgy, pp. 364-401, April 1966.

23.
24.
25.
26. \
27.
28.
29.
30.
31 .
32.
33.
70
Nair, K., Sandhu., R.S., and Wilson, E. L., IITimedependent Analysis of Underground Cavities Under an Arbitrary Initial Stress Field," Tenth Symposium on Rock Mechanics, Austin Texas, AIME Publications, 1968.
Naude, T. R., liThe Pioneering of Full Mechanized Longwa11 Coal Mining in South Africa," Journal of the South African Institute of Mining and Metallurgy pp. 322-350, February 1967.
Obert, L., and Duvall, W., IIDesign and Stability of Excavations in Rock-Subsurface,1I SME Mining Engineering Handbook, Edited by Given, I.A., Vol. 1, pp. (7-10) - (7-47), SocietyofMining Engineers, AIME, N.Y., 1973.
Obert, L. Duvall, W. I., and Merrill, R. H., UDesign of Underground Openings in Competent Rock,u Bulletin 587, U.S. Bureau of Mines, pp. 8-17,1960.
Panek, L.A., IIDesign for Bolting Stratified Rock," Transactions, Society of Mining Engineers of AIME, Vol. 229, pp. 113-119, June. 1964.
Pariseau, W. G., IIA Finite Element Program Based on the Elastic-Plastic Material Idealization," University of Utah, 1972.
Pariseau, W.G., IIInfluence of Rock Properties Variability on Mine Opening Stability Analysis," Ninth Canadian Symposium on Rock Mechanics, Montreal, Quebec, 1973.
Pariseau, W.G. IIInterpretation of Rock Mechanics Oat a : Sin 9 1 e E n try S y s t em, Sun n y sid e Min e, Uta h , 1.1
First Annual Report, U.S.Bureau of Mines Contract #H022077, June 1973.
Pariseau, W.G., "Plasticity Theory for Anisotropic Rocks and Soils," lOth Symposium on Rock Mechanics, Au s tin, T e x as, 1 968 .
Pariseau, W. G. IIRock Mechanics and Risk in"Open Pit Mining,1I Proc. Eleventh International Symposium on Computer Applications in the Mineral Industry, University of Arizona, Tucson, April 16-20, 1973, pp. A106-Al24.
Pariseau, W.G. and Fairhurst, C., "The Force-Penetration Characteristic for Wedge Penetration into Rock," Int. J. Rock Mech. Min. Sci. Vol. 4, pp. 165-180, 1967.

34. Phillips, D.W., "Investigation of the Physical Properties of Coal Measured Rock," Transactions AIME, Vol. 82, pp. 432-450, 1931.
71
35. Reyes, S.F., IIElastic-Plastic Analysis of Underground Openings by the Finite Element Method,1I Ph.D. Thesis University of Illinois, Urbana, 1966.
36. Salamon, M.D.G., "Stability, Instability and Design of Pillar Workings,1I Int. J. Rock. Mech. Min.Sci., Vol. 7, pp. 613-631,1970.
37. Salamon, M.D.G., and Muro, A.H., IIA Study of the Strength of Coal Pillars,1I Journal of the South African Institute of Mining and Metallurgy, pp. 55-67, September 1967.
38. Shields, J.J., IILongwa11 Mining in Bituminous Coal Mines with Planers, Shearer Loaders and Self Advancing Hydraulic Roof Supports,1I Information Circular-8321, U.S. Bureau of Mines, 1967.
39. Stacey, T. R., IIThree-dimentional Finite Element Stress Analysis Applied to Two Problems in Rock Mechanics,1I Journal of the South African Institute of Mining and Metallurgy, Vol. 71, May 1972.
40. Su, Y.L., Wayng, Y.J., and Stefanko, R., IIFinite Element Analysis of Underground Stresses Utilizing Stochastically Simulated Material Properties," Rock Mechanics Theory and Practice (Ed. Sowerton, W.H.), AIME/SME, N. Y., pp. 253-266, 1970.
41. Sutherland, R.B., IIS ome Dynamic and Static Properties of Rock,1I Rock Mechanics, Edited by Fairhurst, C., pp. 473-491, Pergamon Press, New York 1963.
42.· Wagner, H.M., IIPrincip1es of Operations Research,1I Prentice-Hall, Inc., N.J. 1969.
43. Winders, S. L., IIPhysical Properties of Mine Rock ll,
Part II, U.S.B.M., RI 4727, 1950.
44. Zienkiewicz, O.C., liThe Finite Element Method in Engi neeri ng Sci ence, II McGraw-Hi 11, London, 1971.
APPENDIX A
DETAILS OF MATERIAL CONSTANTS
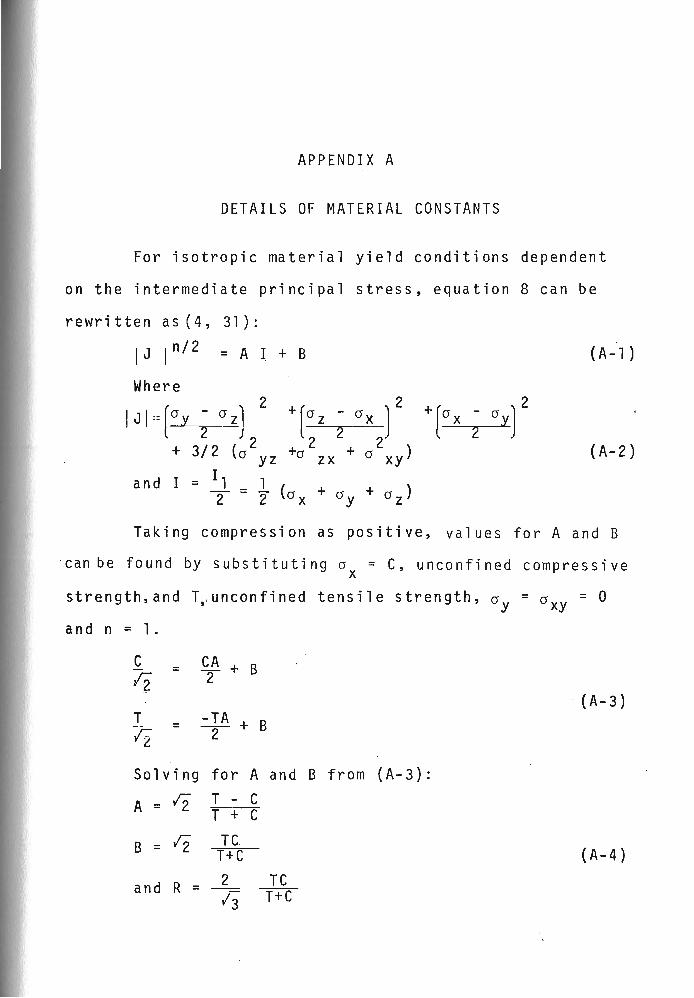
For isotropic material yield conditions dependent
on the intermediate principal stress, equation 8 can be
rewritten as(4, 31):
IJ In / 2 = A 1+ B
Where
and I = 11 _ 2-
(A-1 )
(A-2)
Taking compression as positive, values for A and B
··c an be f 0 un d by sub s tit uti n g 0 = C, u nco n fin e d com pre s s i ve x
strength, and T" uncon fi ned tens i 1 e strength, 0y = 0 = 0 xy
and n = 1 .
C = CA + B I? 2
(A-3) T = -TA + B 72 -2-
Solving for A and B from (A-3):
A = 12 T - C T + C
B = 12 TC T+C (A-4)
and R = 2 TC 13 T+C
73
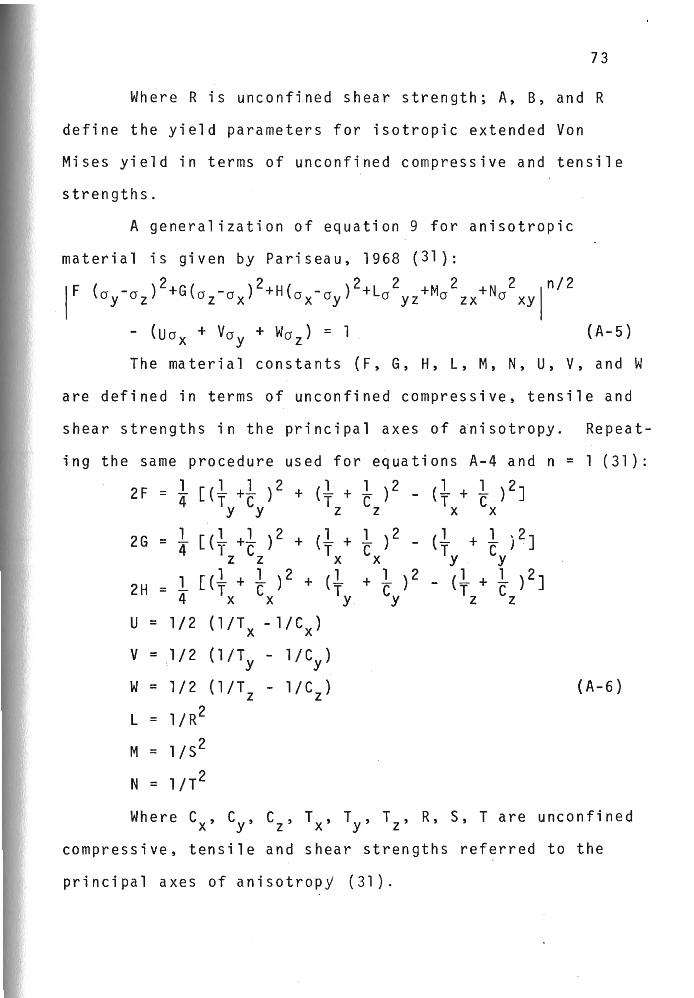
Where R is unconfined shear strength; A, B, and R
define the yield parameters for isotropic extended Von
Mises yield in terms of unconfined compressive and tensile
strengths.
A generalization of equation 9 for anisotropic
material is given by Pariseau, 1968 (31):
IF (a -a )2+G(a -a )2+H(a -a )2+La 2 +Ma 2 +N a
2 In/2 y z z x x y yz zx xy
- (Ua + Va + Wa ) = 1 x y z (A-5)
The material constants (F, G, H, L, M, N, U, V, and W
are defined in terms of unconfined compressive, tensile and
shear strengths in the principal axes of anisotropy. Repeat-
ing the same procedure used for equations A-4 and n = 1 (31):
2F = 1 [( 1 +1 ) 2 + (1 + 1 )2 (t + t )2] 4" Ty Cy Tz Cz x x
2G = 1 [( t +t ) 2 + (1 + 1 )2 (1 + 1 )2] 4" Tx Cx Ty Cy z z
2H = 1 [(1 + 1 )2 + (1 + 1 )2 - (1 + 1 )2] 4" Tx ex Ty Cy Tz Cz
U = 1/2 (l/Tx -l/Cx )
V = .1 12 (1 IT y 1 ICy)
W = 112 (l/T z l/C z ) (A-6)
L = 1 I R2
M = 1/5 2
N = l/T2
W her e C x' Cy ' C , T , T , T , R, 5, Tar e un con fin e d z x y z compressive, tensile and shear strengths referred to the
principal axes of anisotropY (31).

APPENDIX B
DETAILS AND VERIFICATION OF
THE FINITE ELEMENT PROGRAM
The finite element program is capable of handling a
wide variety of problems including arbitrary sequences of
cuts and fills, face advances and a number of material com
plexities. The two dimensional (plane strain, plane stress
and axial symmetry) problems involving anisotropic, time
dependent, nonhardening, gravitating elastic-plastic mate
rials may be initially stressed. Nonlinearities in mate
rial properties are approximated. Linear and nonlinear
extended VonMises type of yield conditions for anisotropic
geologic media are used in the program (28, 30).
Ihe program consists of " a main l"ine and followed by
eight subroutines. The mainline acts as an executive rou
tine and reads most of the input data and other information
of the problem. A brief flow diagram of the program is
shown in Figure 26. Element stiffness matrices are formed
by Elstif and Assem adds and subtracts element stiffness
from the master stiffness matrix. Writer prints the re
sults of the elastic and elastic-plastic analyses. The
Elyeld subroutine locates the intersection of load paths

75 Read Input Oa ta
Element Nodal Points Nodal Point Coordinates
Material Properties Boundary Conditions
l Calculate nodal' point forces due to gravity and initial stresses
j
Introduce excavation surface, prescribed forces, and displacements
~
Generate master stiffness matrix for thermal and time dependent problems, call T-moduli and T-force
1 Calculate strains and stresses caused by displace-ments and add to initial stress
~ Print results of elastic solution
1 l · Only elastic solution Elastic-plastic solu-required tion is required
1 l l Stop I (continue) I
l Elastic-plastic analysis; solve for incremental displacements
1 Calculate s tra ins· and check for failed elements
1 Update s ti ffness for failed elements and compute stress
! Print results of failed elements in each load
· increment
! ~nt elastic-plastic solution after final
. lncrement I
l I Stop I
Fig. 26.--Flow diagram for finite element program.
76
with the present yield surface. The Axes routine trans-
forms forces and displacements to local coordinates or
global coordinates as required. T-module reads the time
dependent material properties and T-force computes time
dependent loads.
The assembled system of equations has the form F =
[K] {u}, where {F} and {u} are the nodal point force and
displacement respectively and [K] is the master stiffness
matrix. For solving the system of equations Gauss-Seidel
line iteration method is used. Where the node displacement
component is prescribed the corresponding row of equations
is skipped during the iteration. In the case of nonlinear
stress strain analysis the final load is applied in a pre-
scribed number of load increments. The system of equations
is solved by iteration for each load increment.
Program Verification
All branches of the finite element program used for
the present work are verified and results are compared with
available analytic and numerical solutions (9, 19, 21, 35).
Each example problem verifies ~ifferent branches of the pro~
gram. Three example problems are shown here:
Example Problem 1: Elastic analysis of hollow
cylinder under internal pressure.
For this problem the analytic solution is known and shown in Figure 27. Results from the finite element method agree within the plotting accuracy of the analytic solution (21). This example problem verifies the

a P
Exact solution (Ref. #21)
o 0 0 Finite element solution
2.0
1 . 5
1 . 0
0.5
o 1 .0 r
a
y
o
at p
-a r
p
a b
4.0
3.0
U
2.0
1 .0
2.0
Fig. 27 .--Elastic analysis of stress and displacement in a hollow cylinder under internal pressure.
77
x

linear, homogeneous isotropic stress, strain, displacement, and boundary condition branches of the program. Average nodal point stresses are given in the example problems.
Example Problem 2: Elastic analysis of circular
hole under internal pressure.
78
This example verifies the anisotropic elastic branches of the program. This example was run under plane stress conditions to compare with analytic and finite element results. The results are presented in Figure 28. In Figure 28 the results are in good agreement with the analytic results (19) and present results predict more maximum stress than those mentioned in reference #9. Better results can be obtained by decreasing the size of the elements around periphery of the hole.
Example Problem 3: Elastic-plastic analysis of
circular tunnel in rock, loaded by external forces.
This problem has been solved numerical~y (35) and provides a test of the linear yield, isotropic elastiGplastic stress and displacement branches of the program. The yield condition, one appropriate to rock, is used in this analysis. The circular tunnel in rock is under nonuniform external loading. Results are shown in Figure 29 which are in good agreement with those reported in reference #35.
The verification of the program is discussed in
greater detail in reference #30.

3.0
2.0
1 . 0
o
2
e 0
79
p
Ex(act solut.ion Ref. #19)
Finite element
-6A-~~~ Reference: (9 )
El =1.2 x 10 5 psi E2=0.6 x 10 5 psi
G = 7000 psi ~~~ __ ~ __ ~ ____ ~ __ ~-i~ __ ~~
o 1 ~ 0 2.0 3.0
Fig. 28 .--E1astic analysis of stress in a transversely isotropic plate containing a circular hole under uniform pressure.

2.0
1 . 5
.,..
I 1. 0 V)
V)
OJ ~ ....,
(/)
0.5
2R
1.0 ksi
l 1 1 11 ~0.4 ksi ~
--~--------~~
o I~fi -8R - ....... ~ A
o Reference: (35)
o Present program
Vertical stress on OA
Horizontal stress on OA
3R
80
Fig. 29.--Elastic plastic analysis of stress in a circular tunnel in rock.
APPENDIX C
ROCK PROPERTIES VARIABITY STUDY
Uniform material properties are used in the conven
tional finite element stress analysis. These values are
usually midrange or average values determined from labora
tory tests. Because the rock is not perfectly homogeneous
and isotropic, the laboratory material properties in the
same rock may change from sample to sample. Moreover in
the usual laboratory testing the effect of moisture, tem
perature, and structural defects are not taken into ac
count. These factors may further reduce the values deter
mined by laboratory tests. A standard deviation of 30 per
cent of the average values is not uncommon in rock proper
ties testing procedures (41).
Variability of material properties would influence
the stability of mine openings" land the stability analyses
of openings determined by using average values are there
fore questionable. Two different methods were used to
introduce the effect of material properties variability
into the stress analysis (30).· These are:
1) A conventional stress analysis procedure where
the material properties vary for different runs; and
2) A modified conventional method in which the
effect of variability is directly introduced into stress
analysis (29, 32, 40).
The finite element mesh used for the first case
represents a typical rectangular opening and pillar in a
long row of such entries at a depth of 1750 feet. The
width to height ratio of the opening is 3-4 which is the
same ratio as in the double entry system. The material
properties used for four elastic and elastic-plastic
analyses are given in Table 5. Figure 30 shows stress
concentrations around the periphery of the opening for
82
four sets of rock properties. These stresses are taken
from the elastic part of the anlysis. Uniform rock proper
ties were used for this case and the material assumed as
homogeneous and isotropic.
Results from , Figure 30 show that with increasing
Poisson's ratio, the tensile stress concentration in the
roof tend to vanish. Critical compressive stress is not
affected much by changes in Poisson's ratio. The average
pillar stress can be calculated from formula (26) a p = 0v
(f-R) where 0p and 0v are pillar and vertical stresses and
R is the extraction ratio, which is defined as the ratio
of area mined to original area. According to this formula
for a given extraction ratio, the pillar stress in Figure
30 should have stress concentration of 2.08. Results from
the finite element analysis are close to this value. But

83 TAB L E 5
MATERIAL PROPERTIES USED IN FOUR ELASTIC-PLASTIC ANALYSES OF A
RECTANGULAR OPENING
P R 0 P E R T Y
E (10 6 psi) v Co To Run (10 3 psi) (10 2 psi)
1 3.0 o . 1 5 5.0 2.5
2 3.0 0.25 10.0 4.5
3 3.0 0.38 15.0 7.0
4 3.0 0.45 10 .0 4.5

°t
~
6 0 No.
0 No. 5 0 No.
4 • No .
3
2
l-E=3xl0 6psi
2-E=3xl0 6psi
3-E=3xl0 6psi
4-E=3xl0 6psi
1 2
84
v= o. 1 5
v= 0.25
v= 0.38
v= 0.45
o i=~~~~~~~~~~~~+-=C~o~mLP~r~e~s~s~i~on~ __ _ - Tension
-1
w "IT = 3.4
I I I . I I I I 1 , I
J / /
J
Fig. 30 .--Stress concentration as a function of Poisson's ratio for a rectangular opening.
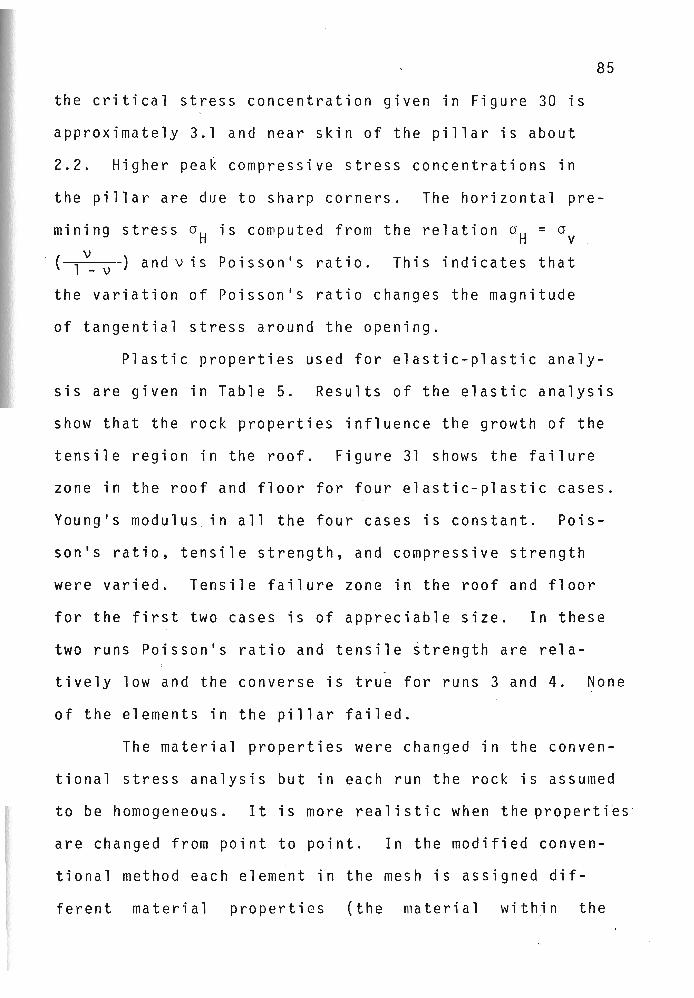
the critical stress concentration given in Figure 30 is
approximately 3.1 and near skin of the pillar is about
2.2. Higher peak compressive stress concentrations in
85
the pillar are due to sharp corners. The horizontal pre-
mining stress 0H is computed from the relation 0H = cr v ( 1 v_ v -) and vis Poi s son's rat; 0 . T his i n d i cat est hat
the variation of Poisson's ratio changes the magnitude
of tangential stress around the opening.
Plastic properties used for elastic-plastic analy
sis are given in Table 5. Results of the elastic analysis
show that the rock properties influence the growth of the
tensile region in the roof. Figure 31 shows the failure
zone in the roof and floor for four elastic-plastic cases.
Young's modulus in all the four cases is constant. Pois-
son's ratio, tensile strength, and compressive strength
were varied. Tensile failure zone in the roof and floor
for the first two cases is of appreciable size. In these
two runs Poisson's ratio and tensile strength are rela-
tively low and the converse is true for runs 3 and 4. None
of the elements in the pillar failed.
The material properties were changed in the conven
tional stress analysis but in each run the rock is assumed
to be homogeneous. It is more realistic when the properti'es ~
are changed from point to point. In the modified conven
tional method each element in the mesh is assigned dif
ferent material properties (the material within the

Opening
Run 1
I , t~
I Opening
I I
Run 3
I I I
II , I
51
~
I I
t' I I I
Opening
Run 2
~
Opening
Run 4
Fig. 31 .--Element failures about a rectangular opening with different material properties.
86
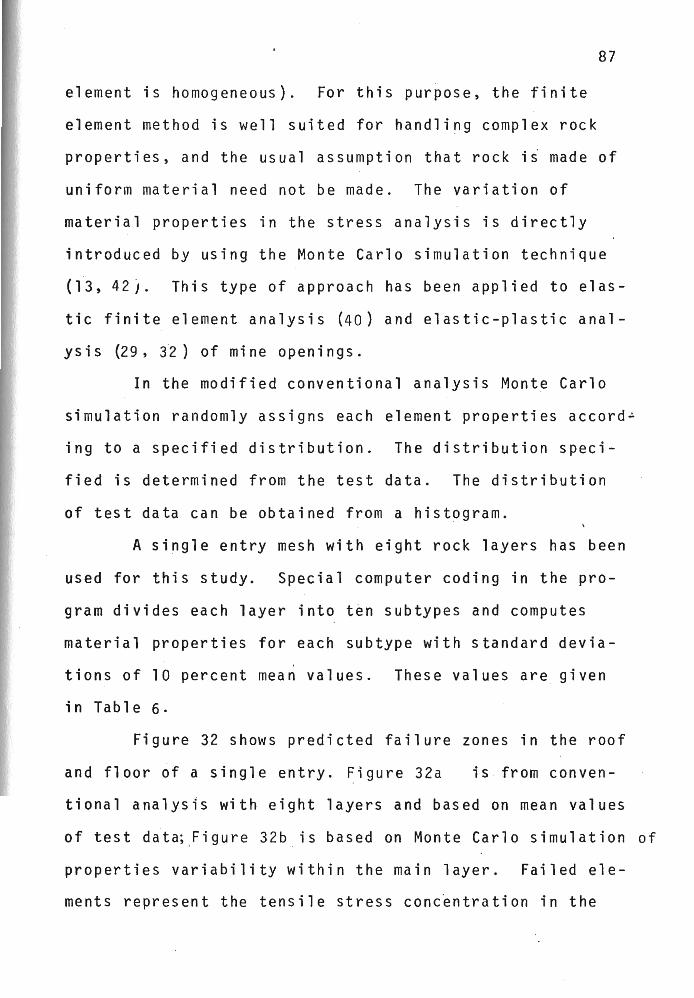
87
element is homogeneous). For this purpose, the finite
element method is well suited for handling complex rock
properties, and the usual assumption that rock ii made of
uniform material need not be made. The variation of
material properties in the stress analysis is directly
introduced by using the Monte Carlo simulation technique
(13,42). This type of approach has been applied to elas
tic finite element analysis (40) and elastic-plastic anal
y sis (29, 3"2) 0 f min e 0 pen i n g s .
In the modified conventional analysis Monte Carlo
simulation randomly assigns each element properties accord~
fng to a specified distribution. The distribution speci
fied is determined from the test data. The distribution
of test data can be obtained from a histogram.
A single entry mesh with eight rock layers has been
used for this study. Special computer coding in the pro
gram divides each layer into ten subtypes and computes
material properties for each subtype with standard devia
tions of 10 percent mean values. These values are given
in Table 6.
Figure 32 shows predicted failure zones in the roof
and floor of a single entry. Figure 32a is from conven-
tional analysis with eight layers and based on mean values
of test data;,Figure 32b : is based on Monte Carlo simulation of
properties variability within the main layer. Failed ele
ments represent the tensile stress concentration in the
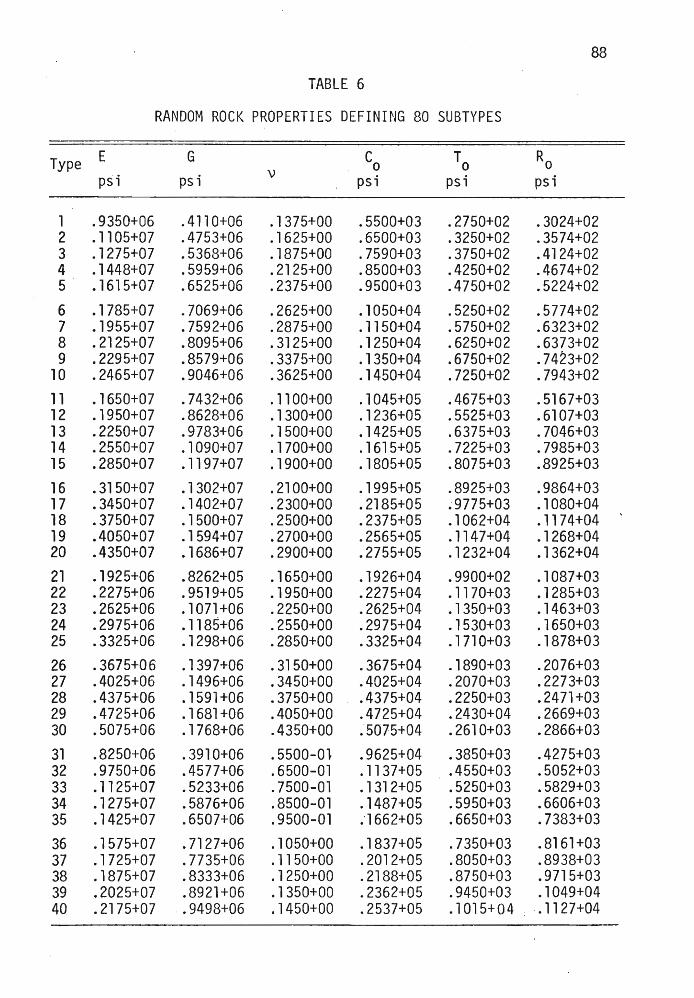
88
TABLE 6
RANDOM ROCK PROPERTIES DEFINING 80 SUBTYPES
Type E G C To Ro 0 psi psi v psi psi psi
1 .9350+06 .4110+06 .1375+00 .5500+03 .2750+02 .3024+02 2 .1105+07 .4753+06 · 1625+00 .6500+03 .3250+02 .3574+02 3 · 1275+07 .5368+06 .1875+00 .7590+03 .3750+02 .4124+02 4 .1448+07 .5959+06 .2125+00 .8500+03 .4250+02 .4674+02 5 · 1615+07 .6525+06 .2375+00 .9500+03 .4750+02 .5224+02
6 .1785+07 .7069+06 .2625+00 .1050+04 .5250+02 .5774+02 7 · 1955+07 .7592+06 .2875+00 .1150+04 .5750+02 .6323+02 8 .2125+07 .8095+06 .3125+00 · 1250+04 .6250+02 .6373+02 9 .2295+07 .8579+06 .3375+00 .1350+04 .6750+02 .7423+02
10 .2465+07 .9046+06 .3625+00 · 1450+04 .7250+02 .7943+02
11 · 1650+07 .7432+06 · 1100+00 .1045+05 .4675+03 .5167+03 12 · 1950+07 .8628+06 · 1300+00 .1236+05 .5525+03 .6107+03 13 .2250+07 .9783+06 · 1500+00 · 1425+05 .6375+03 .7046+03 14 .2550+07 .1090+07 .1700+00 .1615+05 .7225+03 .7985+03 15 .2850+07 · 1197+07 .1900+00 · 1805'+0.5 .8075+03 .8925+03
16 .3150+07 · 1302+07 .2100+00 · 1995+05 .8925+03 .9864+03 17 .3450+07 .1402+07 .2300+00 .2185+05 .-9775+03 .1080+04 18 .3750+07 .1500+07 .2500+00 .2375+05 .1062+04 .1174+04 19 .4050+07 · 1594+07 .2700+00 .2565+05 · 1147+04 · 1268+04 20 .4350+07 · 1686+07 .2900+00 .2755+05 .1232+04 .1362+04
21 · 1925+06 .8262+05 · 1650+00 .1926+04 .9900+02 .1087+03 22 .2275+06 .9519+05 · 1950+00 .2275+04 .1170+03 · 1285+03 23 .2625+06 · 1071 +06 .2250+00 .2625+04 · 1350+03 · 1463+03 24 .2975+06 · 1185+06 .2550+00 .2975+04 · 1530+03 .1650+03 25 .3325+06 .1298+06 .2850+00 .3325+04 .1710+03 .1878+03
26 .3675+06 .1397+06 .3150+00 .3675+04 .1890+03 .2076+03 27 .4025+06 · 1496+06 .3450+00 .4025+04 .2070+03 .2273+03 28 .4375+06 .1591+06 .3750+00 .4375+04 .2250+03 .2471+03 29 .4725+06 · 1681 +06 .4050+00 .4725+04 .2430+04 .2669+03 30 .5075+06 .1768+06 .4350+00 .5075+04 .2610+03 .2866+03
31 .8250+06 .3910+06 .5500-01 .9625+04 .3850+03 .4275+03 32 .9750+06 .4577+06 .6500-01 .1137+05 .4550+03 .5052+03 33 .1125+07 .5233+06 .7500-01 · 1312+05 .5250+03 .5829+03 34 .1275+07 .5876+06 .8500-01 .1487+05 .5950+03 .6606+03 35 .1425+07 .6507+06 .9500-01 .'1662+05 .6650+03 .7383+03
36 · 1575+07 .7127+06 .1050+00 .1837+05 .7350+03 .8161+03 37 · 1725+07 .7735+06 .1150+00 .2012+05 .8050+03 .8938+03 38 · 1875+07 .8333+06 · 1250+00 .2188+05 .8750+03 .9715+03 39 .2025+07 .8921+06 · 1350+00 .2362+05 .9450+03 .1049+04 40 .2175+07 .9498+06 .1450+00 .2537+05 · 1 015+ 0 4 .1127+04

TABLE 6.--Continued 89
Type E G Co To R 0
psi psi \)
psi psi psi
41 · 1650+07 .7432+06 · 11 00+00 .1045+05 .4675+03 .5167+03 42 · 1950+07 .8628+06 .1300+00 · 1235+05 .5525+03 .6107+03 43 .2250+07 .9763+06 · 1500+00 · 1425+05 .6375+03 .7046+03 44 .2550+07 .1090+07 .1700+00 .1615+05 .7225+03 .7985+03 45 .2850+07 .1197+07 .1900+00 · 1805+05 .8075+03 .8925+03 46 .3150+07 · 1302+07 .2100+00 · 1995+05 .8925+03 .9864+03 47 .3450+07 · 1402+07 .2300+00 .2185+05 .9775+03 .1080+04 48 .3750+07 .1500+07 .2500+00 .2375+05 .1062+04 .1174+04
. 49 .4050+07 · 1594+07 .2700+00 .2565+05 .1147+04 .1268+04 50 .4350+07 .1686+07 .2900+00 .2755+05 · 1232+04 · 1362+04 51 .2475+07 .1173+07 .5500-01 .8250+04 .5500+03 .5954+03 52 .2925+07 · 1373+07 .6500-01 .9750+04 .6500+03 .7036+03 53 .3375+07 .1570+07 .7500-01 .1126+05 .7500+03 .8119+03 54 .3825+07 · 1763+07 .8500-01 · 1275+05 .8500+03 .9202+03 55 .4275+07 · 1952+07 .9550-01 · 1425+05 .9500+03 .1028+04 56 .4725+07 .2138+07 .1050+00 · 1575+05 .1050+04 · 1137+04 57 .5175+07 .2321+07 .1150+00 .1725+05 · 1150+04 · 1245+04 58 .5625+07 .2500+07 .1250+00 .1875+05 · 1250+04 · 1353+04 59 .6075+07 .2876+07 .1350+00 .2025+05 · 1350+04 · 1461 +04 60 .6525+07 .2849+07 .1450+00 .2175+05 · 1450+04 · 1570+04 61 · 1925+06 .8262+05 .1650+00 · 1925+04 .9900+02 .1087+03 62 .2275+06 .9519+05 .1950+00 .2275+04 · 1170+03 .1285+03 63 .2625+06 · 1 071 +06 .2250+00 .2625+04 · 1350+03 · 1483+03 64 .2975+06 .1185+06 .2550+00 .2975+04 · 1530+03 · 1680+03 65 .3325+06 .1294+06 .2850+00 .3325+04 .1710+03 .1878+03 66 .3675+06 · 1397+06 .3150+00 .3675+04 · 1890+03 .2076+03 67 .4025+06 · 1496+06 .3450+00 .4025+04 .2070+03 .2273+03 68 .4375+06 .1591+06 .3750+00 .4375+04 .2250+03 .2471+03 69 .4725+06 .1681+06 .4050+00 .4725+04 .2430+03 .2669+03 70 .5075+06 · 1768+06 .4350+00 .5075+04 .2610+03 .2866+03
71 · 1925+07 .8671+06 · 1100+00 .1072+05 .5500+03 .6041+03 72 .2275+07 .1007+07 · 1300+00 · 1267+05 .6500+03 .7139+03 73 .2625+07 .1141+07 · 1500+00 .1462+05 .7500+03 .8238+03 74 .2975+07 .1271+07 .1700+00 · 1657+05 .8500+03 .9336+03 75 .3325+07 · 1397+07 .1900+00 · 1852+05 .9500+03 .1043+04 76 .3675+07 .1519+07 .2100+00 .2047+05 .1050+04 · 1153+04 77 .4025+07 .1636+07 .2300+00 .2242+05 .1150+04 · 1263+04 78 .4375+07 · 1750+07 .2500+00 .2437+05 · 1250+04 · 1373+04 79 .4725+07 .1860+07 .2700+00 .2632+05 · 1350+04 · 1483+04 80 .5075+07 · 1967+07 .2900+00 .2827+05 · 1450+04 · 1593+04
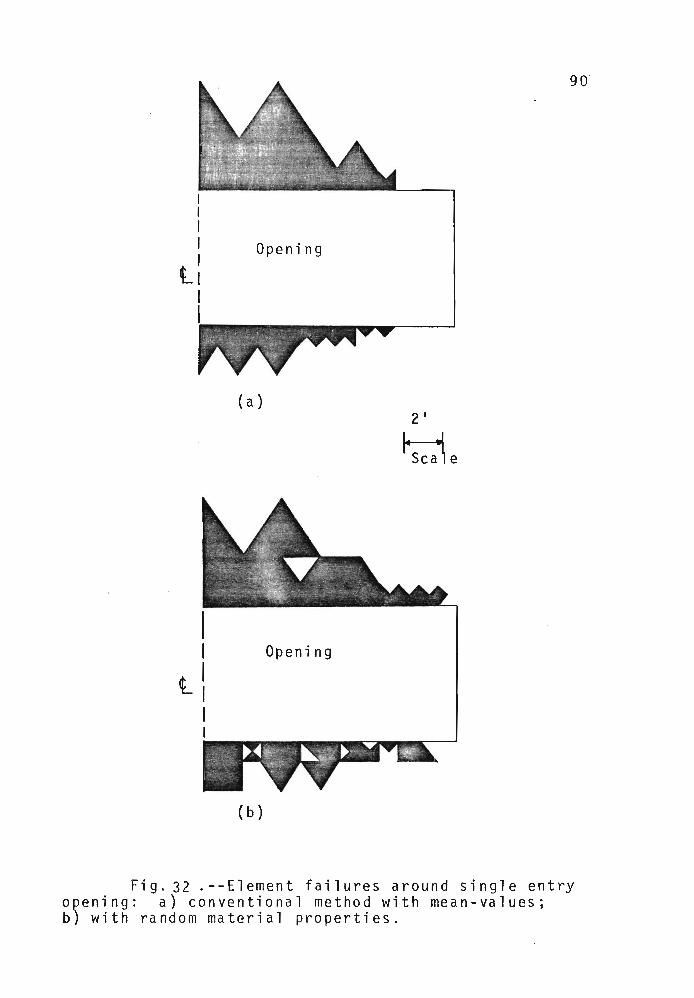
I I I I t: I I
Opening
(a )
, I Opening
tl I I
( b )
90
2'
~e
Fig. 32 .--Element failures around single entry opening: a) conventional method with mean-values; b) with random material properties.

91
roof and floor. When random properties are assigned, the
failed elements extend farther toward the rib of the pil
lar than in the conventional method. A conventional anal
ysis using low strength properties may indicate less fail
ure and more stability, but simulated rock properties varia
bility may result in a larger failure zone and collapsible
conditions.

APPENDIX D
MODEL LOADING STUDY
Displacements and stresses from the finite element
analysis woul d depend on the type of model 1 oadi ng. These
values may be higher or lower depending on different types
of loads. Meshes that extend to surface would give best
results, but small meshes are more economical because they
contai n 1 ess elements and requi re 1 ess computati onal ef-
fort~ Six examples are taken to compare the results
between full and small meshes. These examples are illus
trated schematically in Figure 33,and details are given
below.
a) The full mesh is 2250~ x 500' iri size and extends
to the surface. Initial gr~vity stresses are computed due
to the weight of the overburden. Nodal forces around the
opening are calculated to the excavated surface by a set
of stress boundary conditions and these stresses are added
to the initial gravity loads. This type of model loading
gives more accurate stresses and displacements.
b) The mesh used in this case is small and 240' x
230' in size, which is also a part of full mesh. Small
mesh nodes on the external boundaries will exactly match
the full mesh. Displacements in X and Y directions are

93
Surface
C:J
(a ) ( b ) ( c )
Surface Surface
1630'
7777177777 /7
1630'
(d ) ( e )
Pass-l
( f)
Fig. 33 .--Details of various types of model loading.

94
taken from the output of full coarse mesh ~nd used as input
for the small mesh. In this way, the effect of the removed
material is introduced by prescribing the displacements
on the external boundary nodal points of small mesh.
c) This model loading is the same as in (b) except
the stresses generated by the excavated material are not
added to the gravity loads. Because the effect of excava
tion is not included in this model and stresses obtained
in this case are equal to the unit weight of material
times depth
d) In this case, the effect of overburden is intro
duced by burying the small mesh at the same depth as in
the full mesh. This can be obtained by simply adding the
difference in depth to all nodal point coordinates. Grav
ity loads are computed as unit weight times depth and the
stresses generated by the excavated material are calculated
by a set of stress boundary conditions on the excavation
surface. These stresses due to excavation'are added to
the gravity loads. The results from this model are within
4 to 9 percent as compared to the results from full mesh
and require less computer time because of smaller mesh.
e) In this case the problem is solved in two passes.
The same small mesh as in model (d) is used for this, two
pass solution. In the first pass the model is buried at
its original depth and the gravity stresses are computed
from material unit weight and depth. Stresses due to

95
excavation are calculated in the second pass by a. set of
stress Doundary conditions acting at the excavation bound
ary. These stresses generated by the excavated material
are added to the gravity loads in the second pass.
f) This type of model loading is quite similar to
the previous one. In the first pass the mesh is not buried
at its original depth like in the previous case, whereas
the effect of the overburden is introduced by application
of overburden equivalent forces on the top nodal points of
the mesh. Stresses caused by excavated material are com
puted by a set of boundary conditions on the excavation
boundary and these stresses are added to the initial grav
ity stresses in the second pass.
Results for all these models are summarized in
Tables 7 and 8. Vertical displacements for the nodes in
the roof are given in the tables. For models (a), (b)
the displacements and stresses are approximately equal.
Very low values of stresses and displacements were pre
dicted in model (c) as compared to the other cases. Dis
placements and stresses from model (d) are close (4 to 9
pe~cent) to the values obtained from the full mesh. The
last two models predict low stresses and displacements.
These are approximately 22 percent less than in the first
case. Though the smaller mesh in (b) predicts very close
values as in the full mesh, input information had to be
taken from the full mesh run. Therefore, in model (b)
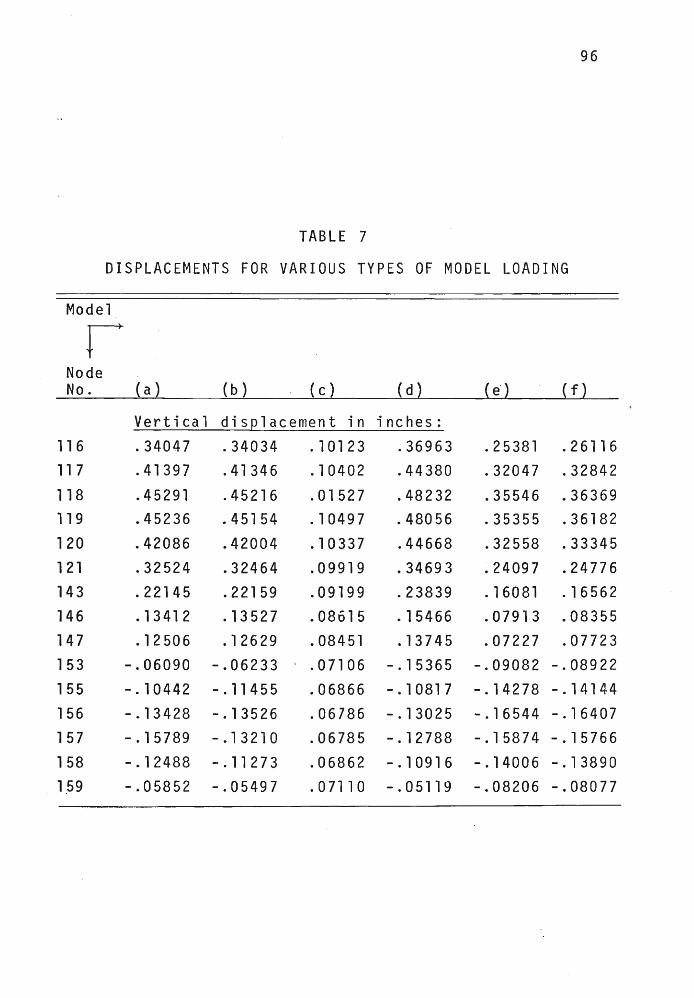
96
TABLE 7
DISPLACEMENTS FOR VARIOUS TYPES OF MODEL LOADING
Model
r Node No. (a } (b } ( c } ( d ) {e) {f)
Vertical dis~lacement in inches: 11 6 .34047 .34034 .10123 .36963 .25381 .26116 11 7 .41397 .41346 .10402 .44380 .32047 .32842
118 .45291 .45216 .01527 .48232 .35546 .36369 119 .45236 .45154 . 10497 .48056 .35355 .36182
120 .42086 .42004 .10337 .44668 .32558 .33345
121 .32524 .32464 .09919 .34693 .24097 .24776 143 .22145 .22159 .09199 .23839 .16081 .16562 146 .13412 .13527 .08615 . 15466 .07913 .08355
147 . 1 2506 .12629 .08451 .13745 .07227 .07723
153 -.06090 -.06233 .07106 -.15365 -.09082 -.08922 155 -.10442 -.11455 .06866 -.10817 -.14278 -.14144 156 -.13428 -.13526 .06786 -.13025 -.16544 -.16407
157 -.15789 -.13210 .06785 -.12788 -.15874 -.15766
158 -.12488 -.11273 .06862 -.10916 -.14006 -.13890 159 -.05852 -.05497 .07110 -.05119 -.08206 -.08077

97 TABLE 8
STRESSES FOR VARIOUS TYPES OF MODEL LOADING
Model
r Node No. (a } (b } ( c } ( d ) (e} (f}
Nodal Qoint stresses near o~ening (~si}:
118 1484.2 1470.9 - 1 36 . 1 1564.0 1147.3 1176.3
119 1635.9 1621.4 - 1 34. 3 1709.2 1261.4 1293.6
120 1112.57 1099.3 - 163.2 1157.1 713. 1 745.5
121 -1863.9 -1854.2 -1769.8 -1923.3 -2053.1 -2044.3
143 -2509.5 -2470.5 -1044.9 -2590.7 -3005.2 -2980.3
147 -2618.3 -2598.8 -1048.2 -2688.8 -3101.9 -3077.7
the input data have to be taken from the full mesh and
this procedure is long and takes more computer time which
may not be economical. When the smaller meshes are used
for stress analysis, model (d) gives reasonable results
which are only 4 to 9 percent higher than the values from
full mesh. Therefore, the model (d) is preferred to the
others and at the same time saves computer time and extra
work.

APPENDIX E
MESH REFINEMENT STUDY
Stress concentrations around underground openings
are necessary for design. Because stress gradients are
high near the periphery of the openings, a relatively fine
mesh ;s required to detect dangerous stress concentrations.
Failure zones which are masked by large elements are re
vealed by a more refined mesh (30).
In the refined meshes, 35 to 45 percent of the
total elements are placed near the periphery of the open
ing. , Element sizes are controlled by thin rock layers
and maximum number of elements in a mesh are limited by
computer core storage capacity. More refined meshes re
quired for accurate stress analysis may easily exceed
computer core storage capacity. To overcome this diffi
culty, a two-pass problem-solving approach is used. The
two-pass solving system needs more computer time than the
single pass runs, but remains within computer core storage
limits.
The two-pass solution technique consists of making
an initial pass with full coarse mesh and then making a
second pass with a small refined insert mesh. The insert
mesh includes the mine opening but matches the first

99
(coarse) mesh at nodal points away from the opening. Dis
placements from the first coarse mesh output are used as
input to the fine insert mesh. These displacements are
prescribed on the external boundaries of the fine insert
mesh. In this way the effect of the removed material on
the insert mesh is introduced.
The dimensions of the coarse mesh and fine insert
mesh used for double entry study are shown in Figure 34.
The fine mesh has 62 nodal points around the opening and
the coarse mesh has only 14 nodal points. Coarse insert
and fine insert meshes contain the same number of nodal
points on their external boundaries. The dimensions of
the openings in both cases are the same. The width of
refined mesh for the single entry is less than the double
entry mesh and fits within the limitations of core storage.
Therefore, a two-pass solution procedure is not required
for the single entry analysis.
Reliability of the two-pass solution is verified
by using a mesh that fits entirely in core. Conventional
run results were compared to the results obtained by the
two-pass procedure using a part of the original mesh. In
both these cases uniform material properties were used.
Results were in good agreement as shown in Figure 35.
Results from the two-pass solution, those obtained by
using a fine mesh, are also given in Figure 35. Coarse
mesh results show 0.12 maximum tensile stress concentra
tion in the roof, whereas fine mesh predicts maximum
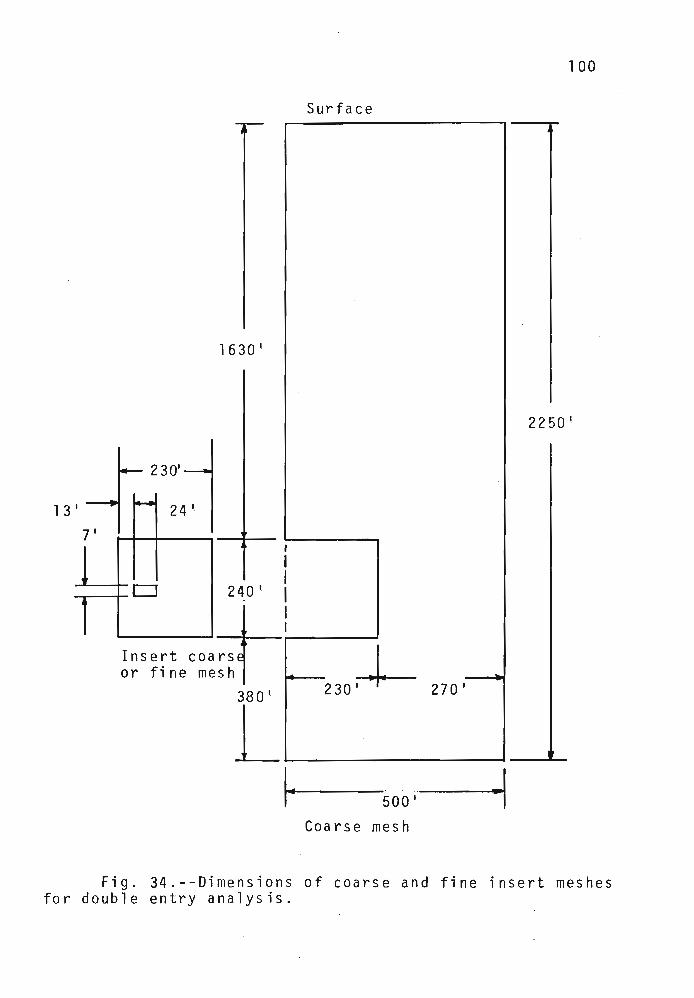
1630'
13'
7 1
___ ~CJ 240 ~
Insert coa~ or fi ne me~~i
380 '.
L
I
I I I I I
I~
Surface
230...1.-- 270 I
500'
Coarse mesh
100
2250 t
-"'"
Fig. 34.--0imensions of coarse and fine insert meshes for double entry analysis.

101
• Full mesh D 5 0 Course insert r---'
I I mesh
~ I I
4 0 Fine insert I I I
mesh L ___ .J
3
at 2 SV
+ compression
- tension
w _ H - 3.43
Stress concentration around opening
Fig. 35 .--Stress results for single and two pass from the same mesh and a fine insert mesh.
102
a critical tensile stress concentration of 0.36
The more reliable fine mesh estimate is three times
greater than the coarse mesh estimate of peak tensile
stress concentration. Estimates of compressive stress
concentration are much closer. Coarse mesh predicts 2.8
and fine mesh 3.2 compressive stress concentration. Figure
36 shows a comparison of displacements obtained from coarse
and fine meshes for a double entry system. Displacements
from coarse and fine meshes are within 2 percent.
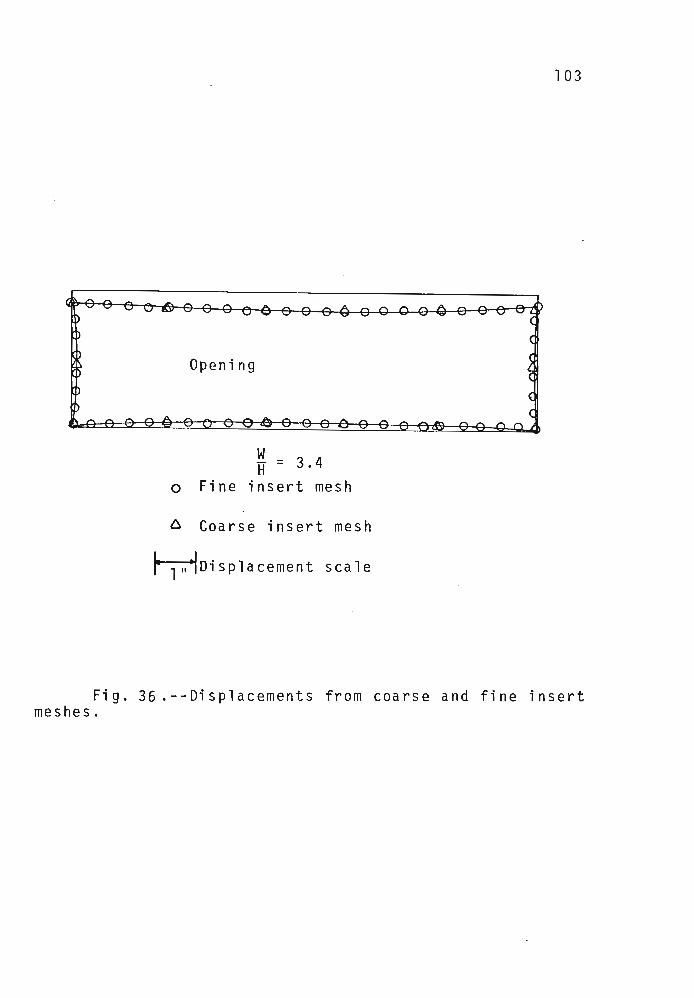
103
Opening
w If = 3.4
o Fine insert mesh
o Coarse insert mesh
~DisPlacement scale
Fig. 36 .--Displacements from coarse and fine insert meshes.

APPENDIX F
WIDTH/HEIGHT RATIO STUDY
In the double entry system at the Sunnyside Mine,
the opening has a width to height ratio of 3.42. The
proposed single entry system has a width to height ratio
approximately 9 percent greater than in the double entry.
Since the differences in width/height ratios are small,
a question arises concerning the ability of the computer
program to discriminate between the two width/height ra
tios. A study was made to see whether or not the computer
program would discriminate between small changes in the
opening geometry (30).
Maximum displacements and stress concentrations
around rectangular openings are functions of the width/
height ratio. These stresses and displacements near the
periphery of the opening will increase as width/height
rat i 0 inc rea s e s . A ty.p:i cal open i n g and a pi 11 a r ina 1 on g
row of entries was used for this analysis. Uniform mate
erial properties (no layering effect) were assumed for
this study. The coal seam depth was 1750 feet which is
the same as at the Sunnyside Mine. The results of this
study are shown in Figures 37 and 38.

105
Figure 37 sho~s the boundary stress concentration
about rectangular openings of width/height ratios of 3.0,
3 . 2, 3. 4, 3. 6, 3. 8 and 4. 0 '. The d iff ere n c e bet wee nth e
width/height ratios is approximately 6.5 percent and this
is less than the difference between the single and double
entries. There is a little difference in the critical ten
sile stress concentration near rectangular opening which
is approximately constant for width/height ratios from 3.0
to 4.0. There is a small but definite increase in the
critical compressive stress concentration near the corner
of the opening.
Compressive stress concentration for width/height
ratio of 3~0 is about 3.3 and for width/height ratio of
4.0 the concentration is 3.6. Predicted differences in
compressive stress concentration between width/height
ratios of 3.0 and 4~0 is 0.3 and the difference from the
analytical method gives 0.9. The extraction ratio in all
the cases is constant, so the average stress in the pillar
is very close.
The displacements near the openings of different
width/height ratios are shown in Figure 38. Maximum
vertical closure increases from 2.5 inches to 3.4 inches
as the width/height ratio increases from 3.0 to 4.0.
This study indicates that the computer program is
sensitive to . small changes in the opening geometry.

106
• [xperiment, W H = 4.0 (Ref. #26)
Finite element:
o *= 3. a o!i = 3.6 H
6 6W
• W 3.8 H =3.2 H = 0 <:>
5 W = 3.4 W = 4.0 H H
\) = 0.25 4
3 °t S v 2
1
+ Compression
-1
- Tension
3.0 4.0
I I I .--------- - - - - - ---
Fig.37 .--Stress concentration as a function of width/height ratio for rectangular opening.

107
w = 4.0 W 3.0 • • H H = ~
• • W 3.8 W 3.2
H = 0--0 H =
I • .. W 3.6 6----l:l W 3.0 H = H =
1 1 T If i
11 .6 11 lO.95"
2.1 II I T ~
I I I Opening I I I I I 1 I
~ I 1 . 31\ I
I 0.9 II
TI: w ·1 H = 3.0
w ~I 4.0 H =
Fig. 38.-- Dis placement as a function of width/height ra t i 0 for rectangular openings.
Name
Birtholace
Birthdate
Hi gh - Schoo 1
College 1963
Universities 1964-1970
1971-1974
Degree 1970
Professional Organizations
VITA
Thummala Venkat Rao
Govada. A. P. India
November 23~ 1945
P.V.C.Z.P.H. School Govada, A.P., India
Arts & Science College Gadwal, A.P., India
Osmania University Hyderabad, India
University of Uta-h Salt Lake City, Utah
B.E. (Mining), Osmania University Hyderabad, India
American Institute of Mining, Metallurgical and Petroleum Engineers