twitter - the university of...
TRANSCRIPT

Twitter Text Mining
in Healthcare
Third Year Honours Project
Author: Radu Mutilică
BSc (Hons) Computer Science
Supervisor: Dr. Goran Nenadic
April, 2014

Abstract
Emotion Mining in Healthcare on Twitter Author: Radu Mutilică
The increased usage and popularity of social media platforms has generated a large pool of publicly-available data suited for mining and analysis in the context of healthcare. This project attempts to tap into the data flow of one of these platforms, Twitter, in order to build a dataset suited for performing the process of emotion analysis. The end-goal of the project is to offer a tool to researchers in the medical field to be able to visualize and study patterns in emotions manifested by Twitter users before and after they have been diagnosed with particular mental disorders (such as schizophrenia, borderline personality disorder, etc). Via the use of text processing methods, machine learning classifiers (K-Nearest Neighbours and Support-Vector Machine) and a training dataset labelled by participating psychology researchers, the tool yielded accuracies of up to 90% in detection of joy, sadness, anger, fear and surprise. While the tool has been tested with a dataset containing primarily tweets of people diagnosed with schizophrenia, its design is generic and agnostic to other disease-datasets, even outside the psychological spectrum, as the methods used in text processing and machine learning are not discriminative towards particular types of illnesses. Keywords: social media, emotion extraction, mental illnesses, text processing, machine learning
1

Acknowledgments
Firstly, I would like to thank my supervisor, Dr. Goran Nenadic, for his continuous support throughout the development process of my project and his invaluable input and feedback regarding the design decisions encountered. Moreover, many thanks to the psychology researchers: Natalie Berry, Dr. Rohan Morris and Dr. Andrew Shepherd, from the University of Manchester, who aided my project by providing substantial domain knowledge and helped immensely during the process of requirement gathering. Thanks also go to the community at NLTK and scikit-learn, for creating and sustaining amazing Python libraries that I have used extensively in the project. Last but not least, I would like to thank my friends and family for the support during times when progress was slow and bugs were plentiful.
2

Table of Contents
1.Introduction……………………………………..……………………………………..……………………….4 1.1. Motivation……………………………………..…………………………………………………….4 1.2. Aim……………………………………..……………………………………..……………………….4 1.3. Objectives……………………………………..……………………………………………………..4
2. Background.……………………………………..……………………………………..……………..……….5 2.1. Text Mining……………..……………..……………..……………..……………..……………...5 2.2. Machine Learning……………..……………..……………..……………..…………….….…..6 2.3. Emotion Classification……………..……………..……………..……………..……………...8 2.4. Healthcare Studies on Twitter……………..……………..……………..……………..…...8
3. Development……………..……………..……………..……………..……………..……………..………….9 3.1. Requirements……………..……………..……………..……………..……………..…………...9 3.2. Design……………..……………..……………..……………..……………..……………..……….11
3.2.1. Acquiring the Dataset……………..……………..……………..………..………...11 3.2.2. Acquiring Labeled Data for Training……………..……………..……….…..14 3.2.3. Extracting Emotions……………..……………..……………..……………...…….14 3.2.4. Aggregating results…………………………………………………………………..15
3.3. Implementation……………..……………..……………..……………..……………………….15 3.3.1. Development Environment……………..……………..…………………………15 3.3.2. Implementation of Requirements……………..……………………………….16
3.4. Testing……………..……………..……………..……………..………………………..…………..24 3.4.1. Unit Testing……………..……………..……………..…….…..……………………...24 3.4.2. Integration Testing……………..……………..…….…..……………..…………...25
3.5. Summary of Development……………..……………..….……..……………..…………….25 4. Results and User Feedback……………..……………..……………..……………..……………..…….25
4.1. Results……………..……………..……………..……………..……………..……………...……..25 4.2. User Feedback……………..……………..……………..……………..……………..…….…….27
5. Conclusions……………..……………..……………..……………..……………..…………...……………..28 5.1. Achievements……………..……………..……………..……………..………...………………..28 5.2. Future Improvements……………..……………..……………..………...…………………...28 5.3. Lessons Learned……………..……………..……………..………………………..…………….29 5.4. Summary……………..……………..……………..……………..…..……..……………..……….29
References……………………………………………………………………………………………………………30 Appendix……………………………………………………………………………………………………………..31
3
1. Introduction
This introduction gives a brief overview of my motivation of pursuing my third year project, its aim and objectives set out to achieve.
1.1. Motivation
During recent times there has been a shift from traditional broadcasting channels such as mailing lists and regular blogs to microblogging platforms. These have become the go-to social environments for users of all types and backgrounds to broadcast opinions, facts and ideas. The platform of choice for my work is Twitter, but the process detailed in this case study is applicable to any social network. Every month, 288 million active users fire close to 500 million tweets per day[1], adding to the valuable pool of untapped data - fertile grounds for opinion and sentiment analysis.
Previous university modules such as Machine Learning and Artificial Intelligence have developed my interest in Text Mining and the tools and technologies used to accomplish it.
This motivation is also doubled by the practical use case of the project, which is text mining of healthcare related tweets, targeting users diagnosed with mental disorders and analysing how they react emotionally to their diagnostics.
1.2. Aim
The underlying goal of my project is to search, archive and analyse tweets of users diagnosed with certain type of disorders (ex. schizophrenia, borderline personality disorder - and all sub-categories of disorders belonging to the schizo spectrum[2]).
I aim to provide a system which extracts emotions portrayed by Twitter users diagnosed with mental disorders, specifically in the temporal proximity of their diagnostic tweet (the tweet in which they explicitly state they possess a mental disorder). By using this tool, psychology researchers as end-user will be able to explore any patterns and relations in emotional behaviour before and after the diagnostic.
To maintain an ethical approach, the research will not focus on specific users which display such disorders, but, in turn, will target the overall demographic, preserving a degree of anonymity. As such, tweets and any other findings will not be traceable back to the users.
1.3. Objectives
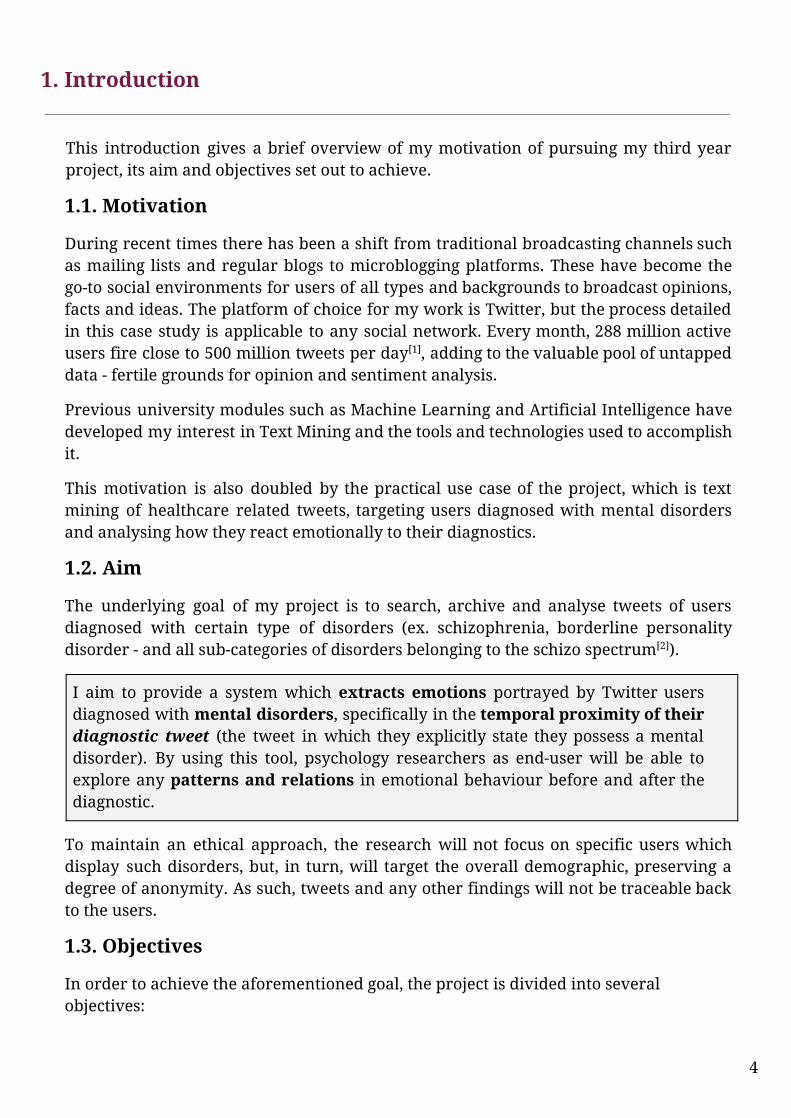
In order to achieve the aforementioned goal, the project is divided into several objectives:
4
These objectives serve as the uppermost layer of abstractization which the design of the system is based on.
The following Chapter (Background) will detail the tools and concepts applied in my work. Chapter 3 (Development) will encompass the requirements which have been laid down before and during work on the project, by continuous collaboration with psychology researchers and potential end-users. This will include the overall system design, coupled with discussions of the design decisions adopted and possible alternatives at the time. The next part - Implementation - will focus onto the technical aspects and the challenges that had to be overcome in order to complete the application. Final part of this section will revolve around Testing - discussing whether or not it behaves according to specifications. The fourth Chapter (Results and User Feedback) will be focused on comparing the quality of results with other similar researches and with the desired outcomes solicited by the participating psychologists. This will also serve as an opportunity to showcase the graphical user interface and comments made by the testers. As per usual, the project essay will end with a conclusion consisting of a summary and any future improvements which would have been made if the deadline had accommodated them.
2. Background
In order to fully explore and further detail the intricacies of the project at hand, it is required to provide context and background on the areas of computer science which it is based upon: text mining and machine learning. This Chapter will touch upon other similar studies, by exemplifying techniques used, offering a smooth transition to the “Development” Chapter.
2.1. Text Mining
While text-mining, in its incipient labour-intensive (manual) form dates back to the 1980s, technological advances have enabled the field to go forward in the past two decades. It represents the concept of processing unstructured information (example: tweets, Facebook statuses) into a relevant structured form, making it accessible to various types of machine learning (or statistical) algorithms[3]. Examples of the types that can be derived from text range from a simple word count or number of spelling errors, to more complex ones such as readability scores[4]. These methods are discussed
5
more in depth in a comprehensive overview of this field found in the work by Manning and Schütze[5]. Transforming text into a set of statistics which portray its characteristics produces a computer-compatible form of data which can be then used as a base for other analytics such as predictive data mining projects.
There exist a series of linguistic deconstruction concepts which are agnostic to the type of project developed. They are applied in order to format and prepare raw data for further processing: Tokenization, Stemming and Part of Speech tagging.
Tokenization - refers to the process of breaking a string of text up into words, symbols, phrases or other meaningful basic linguistic units called tokens. The most common tokens employed are words, division being performed on whitespace.
Stemming - following tokenization, stemming is the process of reducing inflected/derived words to their word stem, base or root form. Its use lies in lowering the amount of variations of the same word.
Part of speech tagging - refers to the process of attributing a word to its respective part of speech category. This step usually follows tokenization and stemming.
The main goal of text mining and natural language processing in this project is to prepare the data gathered for machine learning algorithms to understand it and then subsequently, classify it.
2.2. Machine Learning
“The field of machine learning is concerned with the question of how to construct computer programs that automatically improve with experience”[6] or as defined by Dr. G. Brown: “[machine learning operates] self-configuring data structures that allow a computer to do things that would be called ‘intelligent’ if a human did them”[7]. Algorithms based on the principles of machine learning are able to tackle problems such as speech recognition[8] outperforming other approaches that have also been attempted. In regards to this particular project’s concern, in the field of text and data mining, machine learning algorithms are used in various scenarios such as: large commercial databases, finances and medical records. Examples of the latter use case consist of application of aforementioned techniques to develop classifiers used to detect and diagnose diseases as seen in Foster et al[9].
Machine learning based classifiers can be categorized depending on the nature of the learning process:
● Supervised learning: after being presented with examples of inputs mapped to outputs, the computer must develop a general rule to map new inputs to their outputs accordingly.
6
● Unsupervised learning: no labels are given to the computer, leaving it on its own to find structure in its input. Unsupervised learning can be considered means towards an end, used to find hidden patterns in data.
Supervised learning
As stated, in supervised learning, the algorithm trains on a labeled dataset provided by the supervisor, becoming able to map new entries of an unlabeled dataset to their respective labels. For example, in the task of determining whether or not an email is “spam”, the algorithm is first presented with examples of both “non-spam” labeled and “spam” labeled emails. It will then process the emails, looking for features which determine their membership to either one of the labels, thus generating a set of rules. Via the use of these rules, the algorithm will be able to decide (predict) the membership of new email examples with a degree of accuracy. Accuracy is dictated by the quality of the training data and the chosen features which the algorithm looks for during training. An example of one of these algorithm (called classifiers) is the KNN (K-Nearest-Neighbour) classifier, which I have employed the use of in my project.
The KNN classifier (see Appendix 2) is regarded as a lazy-learner. During training, the training data is represented as vectors in a multidimensional feature space, each labelled accordingly. Upon arrival of new data to be classified, an unlabeled vector is created and mapped onto the feature space and then classified by assigning the label which is most frequent among the ‘k’ (predefined variable) training samples nearest to the unlabeled vector. The metric for distance usually used is Euclidian distance, but in the case of discrete variables, other metrics such as overlap metric can be used.
This algorithm’s advantages relate to its intuitiveness and good classification performance in many domains. It also performs well in scenarios with noisy training data. One of its main disadvantages, however, is the poor computational performance with large training sets, due to the need to compute the distance between each query instance to the training samples.
A more complex type of classifier is the SVM (support-vector machine) classifier. The SVM’s approach to classification is done by analyzing data and discovering patterns in it. Like in the case of the KNN, it is given a set of training examples, each marked as belonging to one of two categories. Using this data, it builds a model used to assign new examples into one of the categories. The model encompasses the training examples as points in space, mapped so that the examples of the separate categories are divided by a clear space gap (a decision boundary). New examples are then mapped into that same space and predicted to belong to a category based on which side of the gap they fall on.
Among its notable advantages, SVM generally offers high classification accuracies and good computational performances, being able to classify even non-linearly separable data by altering the kernel function.
7

As a bottom-line concerning classifiers, machine learning is a data-driven science, therefore good quality data often trumps better algorithms. The quality of classification results is highly influenced by the training data and the features selected. Both of the aforementioned classifiers were used in this project with their results being detailed in Chapter 4.
2.3. Emotion Classification
This term refers to the concept of predictive algorithms extracting human emotions from fragments of text. It is not to be confused with the field of sentiment analysis, which uses similar approaches but to achieve slightly different, more general results regarding the writer’s affective preference of the topic discussed. My project’s aim is to go beyond a simple binary classification of positive/negative sentiment which is derived from using traditional sentiment analysis methods, to a more fine-grained classification of actual emotions (i.e. joy, sadness, surprise). Emotions represent “a natural instinctive state of mind deriving from one’s circumstances, mood and relationships with others”. They are widely studied in psychology and other behaviour sciences but have been drawing attention of researchers in computer sciences as they are continuously building applications and innovating new techniques[10] to automatically and accurately identify emotions present in fragments in text. Studies have been performed on various types of corpora ranging from newspaper headlines[11] to microblogging posts as it is unanimously accepted that the knowledge which can be gained from this endeavour represents a valuable source of both commercial and social insight.
2.4. Healthcare Studies on Twitter Data
From 2009 to 2013, PubMed (a comprehensive archive of medical publications comprising now over 23 million citations) has included 123 articles related to both medicine and Twitter[12]. Williams et al. illustrate this trend by concluding that through recent years, the general consensus regarding Twitter as grounds for medical analytics shifted from merely revolving around awareness of its potential to using knowledge discovery and data mining techniques to understand large Twitter data: it has transformed into quantitative research.
Notable examples include the work of Munmun et al.[13], which have been able to predict depression in individuals on Twitter with promising results as high as 70% classification accuracy. By crowdsourcing a training and testing data set and employing the use of classification features such as language, emotion, style, ego network and user engagement, all fitted in a support-vector machine classifier, they have been able to predict depressive behaviour in a sample space of 476 Twitter users.
Similarly, Pak et al.[14] approached Twitter as a corpus for sentiment analysis, detailing the steps of determining positive, negative and neutral sentiments. Via the use of n-grams and parts-of-speech as features, coupled with a Naive Bayes sentiment classifier, they successfully achieved accuracies of over 85%.
8

With the prevail of microblogging platforms and the increasing availability of data mining tools and hardware, social media as grounds for opinion mining has shed its niché status becoming a mainstream field of study. In present times, focus has shifted from questioning its potential to raising new opportunities of leveraging mentioned techniques to produce more scalable solutions.
3. Development
This chapter details the four steps of development of this project, starting from requirements gathering, design, implementation and ending with testing, to verify system integrity and correctness.
3.1. Requirements
Due to an experimental nature of the task at hand and the unexplored question this project was posing, requirements were collected and refined from a continuous collaboration between myself, my supervisor and a group of domain experts. Due to the interdisciplinary aspect of the work at hand, Dr. Rohan Morris (University of Manchester, School of Psychological Sciences), Dr. Andrew Shepherd (University of Manchester, West Mental Health NHS Foundation Trust) and Natalie Berry (University of Manchester, PhD Psychology Student) who are interested in the study of mental health issues and their implications on social media, aided the progress by offering domain knowledge related to the project area of application: mental disorders, particularly schizophrenia and its spectrum of subtypes (see Figure 2).
By interviewing the domain experts regarding the type of results they were looking to obtain, we managed to lay down the requirements foundation by subsequent refinement of large chunks of functionality (example: “After speaking to Dr. Morris I found out that I need to find tweets mentioning the following diseases [...]. In order to do that, I need to build a dictionary containing all the entries and forward it to the Twitter API”). By keeping the objectives (Section 1.3) in mind and through the process of subsequent refinement of requirements, I have been able to conjure up a
9

comprehensive list of granular requirements (see Figure 3) and a detailed documentation to back them up.
Typically, a text mining and sentiment analysis project is composed of two distinct but equally important parts: information retrieval and performing analysis. As detailed in the introduction, the corpus for our analytics is Twitter. The aim is to build a tweet dataset suited for performing emotion extraction. This translates into gathering a
10
representative data set of tweets which are related to our chosen domain, that of mental disorders.
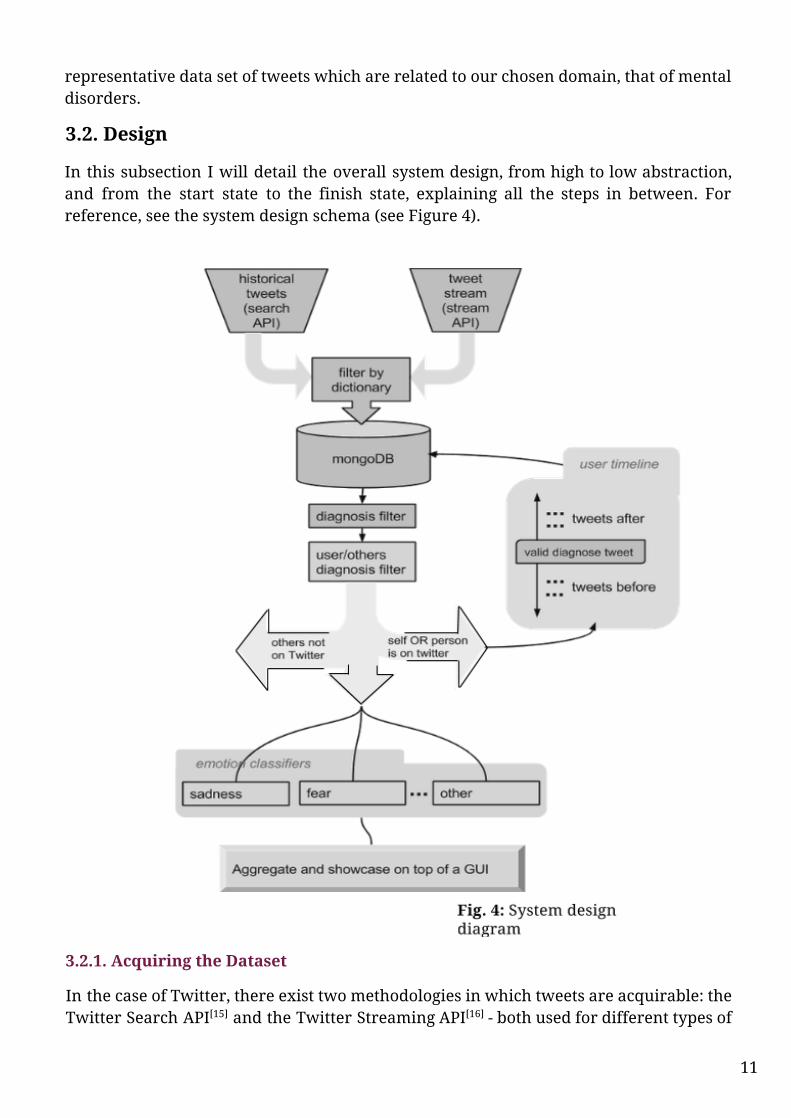
3.2. Design
In this subsection I will detail the overall system design, from high to low abstraction, and from the start state to the finish state, explaining all the steps in between. For reference, see the system design schema (see Figure 4).
3.2.1. Acquiring the Dataset
In the case of Twitter, there exist two methodologies in which tweets are acquirable: the Twitter Search API[15] and the Twitter Streaming API[16] - both used for different types of
11

results while complementing each other when aiming for a complete history and flow of data.
3.2.1.1. Twitter Search API
The Search API behaves similarly to the intrinsic search feature Twitter offers as part of their platforms. As part of Twitter’s 1.1 REST API, this method focuses on relevancy and popularity, but not completeness of results. A query through the Search API will yield both popular and historical tweets depending on the thresholds the search algorithms see fit. This is valuable, as will be described shortly, as its complementary tool - the Streaming API - handles results differently.
3.2.1.2. Twitter Streaming API
As opposed to the Search API, its counterpart yields a different type of results. The Streaming API is essentially a ‘firehose’ link to the Twitter main timeline. Every tweet 1
that is fired after the stream is turned on is subject to fetching. Acting akin to a listener, the connection picks up any tweets that contain the forwarded query filters and return them to the other end of the stream. Its quality lies in its completeness of the results.
In my project I used both APIs to gather a sensible amount of tweets (approximatively 20.000 total) to create a quality dataset: the Search for past results and the Streaming API for present and ongoing tweets. My queries directed towards the Twitter servers were in the form of a dictionary of the disorder names (Figure 2) and tweets containing those keywords were returned.
3.2.1.3. The Storage Solution
The most sensible solution for storage, considering the type of data this project is aiming to collect and archive, was to use a non-relational database[17]. The biggest disadvantage of using a relational database revolves around the “object-relational impedance mismatch[18]”, and considering the fact that tweets are essentially instances of an attribute-rich object, the logical approach was to seek the use of a NoSQL database. Since the focus is on potentially massive amounts of data which do not require a particularly complex hierarchical organization, I opted for MongoDB as the storage solution for my datasets.
3.2.1.4. Getting the Right Data (Filtering)
The next step is configuring the dataset creation subsystem to return quality and domain-relevant data, "fit for [its] intended uses in operations, decision making and planning"[19]. As detailed in the introduction, the aim of this project is primarily to find tweets of Twitter users which are diagnosed with a particular mental disorder and then perform emotion extraction on them. To limit the amount of unrelated and noisy data, a series of filters had to be put in place:
1 Note: There exist limitations to the amount of tweets the Twitter servers returns back. Around 1-10% of the main timeline is requestable. With proper access, more can be unlocked, however for a basic access level, the stream width is limited.
12
Diagnosis filter
This filter will run through the database among all the downloaded tweets and attempt to discern whether or not a diagnosis of a disorder is explicitly stated in the tweet. It is important to isolate these particular entries since they represent the most valuable type of tweet for this project, that which points to a person having a particular mental disorder. They represent gateways to that specific individual’s personal timeline, which will be targeted later for scraping. This filter will be responsible for finding tweets like:
● “I have been diagnosed with schizophrenia earlier this week”;
● “Just got from the doctor. I finally got a diagnosis #schizophrenia”;
and ignoring the vast majority of others which even though may contain the names of the sought mental disorders, represent unrelated data. As a point of reference, from a subsample space of 5000 tweets taken directly from Twitter just by querying for disorder names, only 32 (0.64%) turn out to be tweets which state diagnostics.
Diagnosis referring to user/others filter
Once all the tweets which contain diagnostics are isolated from the rest of the data, they are subjected to another filter. This filter is responsible for deciding whether or not the diagnostic refers to the author of the tweet (as in: owner of the Twitter account), or another individual (acquaintance, relative or any other relationship level). The success of this step assures the quality of later acquired data from diagnosed user’s timelines. The filtering is aiming to eliminate tweets like:
● “Don’t worry @anonymous, I come from a family wth a history in schizophrenia, my dad had it aswell”
● “I think my cat defo has schizophrenia”
3.2.1.5. Mining User Timelines
Once the two-step filtering process is undergone, a subset of tweets reaches a final step of processing. It is important to note that tweet is in actuality a collection of attributes, ranging from the time of post, the device which it was posted from to geo-location coordinates . This is called the 2
tweet metadata. Its scope is to offer as much detail and context as possible to an individual tweet. Among them, the user “nick-name” and account ID serve as a link to the author’s Twitter account which is home to their timeline - an exhaustive collection of the person’s tweeting history. As
2 Note: The availability of some of these attributes is subject to each user’s preference and account details. Some may be missing if users have disabled their presence. This is in line with Twitter’s privacy policy.
13

previously mentioned, once the diagnostic tweets are obtained, they are used to further mine that individual’s timeline for more tweets. The reason for this is linked to the underlying goal of the project: in order to study patterns and trends in emotions manifested by users diagnosed with mental disorders, we require access to their timelines and tweeting history, therefore, a final step of data mining is put in place to achieve this.
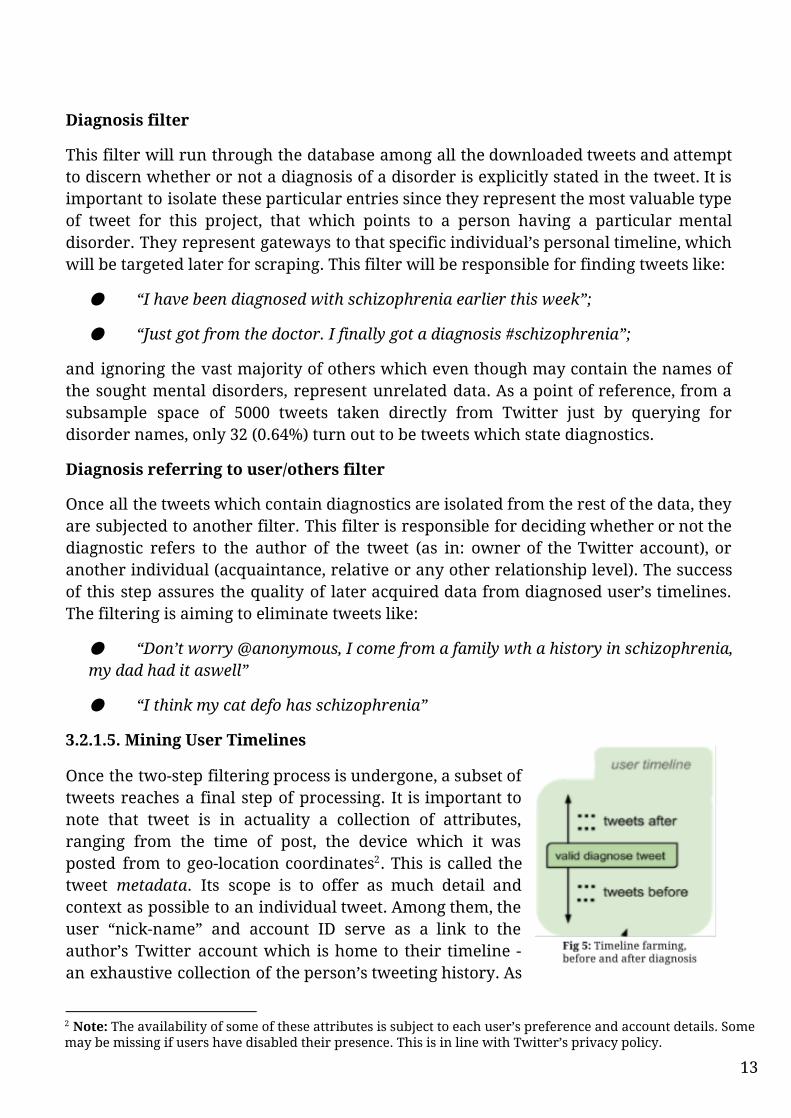
Via the use of a subset of tweet metadata attributes, each diagnosis tweet is linked to a user’s timeline. The step which closes the loop of tweet mining represents timeline farming. Each of those Timelines will be split into two temporally adjacent slices in regards to the recognized diagnosis tweet (see Figure 5): tweets before that diagnosis and tweets after that diagnosis. Depending on the tweeting habits of that particular user, a set of tweets from each side are gathered and fed back into the database, thus providing the system with both context on the diagnosis and a notion of ‘past’ and ‘future’ revolving around that relative point in time. This will enable researchers to observe patterns in emotions manifested before the person got the diagnosis and subsequently, after. This step concludes the data gathering part of my project.
3.2.2. Acquiring Labeled Data for Training
The second step of building a dataset required for a predictive model is acquiring a training/testing subset. This is also called labeled data, as it enables machine learning algorithms to model what a particular emotion looks like in text form. As stated before, due to the task this project is tackling and the unexplored corners of social media healthcare text mining it is attempting to uncover, there does not exist a suitable labeled dataset (set of tweets which have emotions labeled in them). The solution to this problem is to follow past studies and manually label a training set. The help of the participating psychology researchers was employed to validly label all the emotions in a subset of tweets. This translates into another part of the overall system - the labelling application (and GUI) which enables the three researchers to effortlessly go through tweets and adequately label them. This application is bundled with the overall project but serves a separate functionality: it bridges the gap between building the dataset and extracting emotions from a logic point of view.
3.2.3. Extracting Emotions
As described in the “Introduction” Chapter(see 1.3.2, 1.3.3) this functionality aims to employ the use of machine learning algorithms to predict emotions expressed in tweets. The chapters so far describe the design decisions of the infrastructure required to gather data which will be subjected to emotion extraction. Following the types of emotions chosen by Strapparava and Mihalcea[11], we decided to pursue the
14

classification of anger, sadness, joy, surprise, fear and disgust, as they fundamentally represent primary emotions[20] (i.e. are not composite). They are universally basic emotions, which serve as building blocks for more complex feelings and sentiments. The detection of these particular emotions can also serve as a framework for implementing more complex logic to predict composite emotions. In terms of the system design, each emotion is assigned to a separate classifier: this results in 6 separately trained classifiers which independently score the degree in which the designated emotion is manifested in every tweet fed through them. After the classification for each emotion is done, the tweet will be annotated accordingly and sent back into the database.
3.2.4. Aggregating results
This layer of functionality represents the front-end of the system. Since this project is meant to serve as a potential tool for researchers to use in identifying patterns of emotions, its results will have to be displayed in a comprehensive and user-friendly manner. The user will be able to interact with the tweets from start to finish, altering the dataset as they see fit and selecting which results from which diagnostics they want to view. Once the query for results is finalized, a plot of the emotion trends will be generated. The user is also able to also export the results into a parser-friendly format to plug into other statistical processing applications.
3.3. Implementation
The following Section will delve into the technical aspects of this project, detailing the tools used, the issues faced in development along with their solutions, the challenges encountered and the way they were overcome. In order to systematically approach every layer of the system, the implementation will be structured on a requirement-by-requirement (see Figure 3) basis. Any notable impasse will be touched upon along with the solution employed to solve it.
3.3.1. Development Environment
3.3.1.1. Programming Language:
The main programming language chosen to write this tool was python. I chose python due to a series of both objective and subjective reasons:
● Python offers excellent support for dictionaries. Dictionaries also have many
applications in scientific programming. This fits perfectly with the nature of a Tweet object which can be effortlessly converted from a serialized form to dictionary and back. This essentially takes place whenever a script interacts with the database.
● Python’s code is highly readable.
● Object-oriented programming (OOP) in python is simple.
15
● The multipurpose nature of the project: that to serve both as a scientific
programming application, and a potential end-user researcher tool, made python a strong choice due to its versatility and huge community of available integration.
● Python is free.
3.3.1.2 Software Used
In terms of the development environment, my workbench was running an Ubuntu Virtual Machine, with Eclipse as the preferred IDE. All software used to accomplish it was either freeware or open-source.
3.3.2. Implementation of Requirements
Following the requirements table (Figure 3) provided, each individual slice of functionality will have its implementation detailed:
● Connecting to the Twitter API to download tweets
These represented the first lines of code written for the project: a python script to connect to the Twitter servers via the 1.1 REST API and query for tweets. At first, I used the Search method to download all the tweets that contain the sought after disorder names. This was done by querying Twitter with a list of mental disorder keywords (see Figure 2). Due to the inherent limitations of Twitter’s basic access level, only a small fraction of all the tweets ever posted containing those search terms were fetched back. The plan at the time was to run this script every day and fetch any new results since the last run. Results however were scarce, only managing to acquire 1,213 total tweets across all disorders over two weeks of use. Since this aim of this project requires sensible amounts of data, the Search API by itself did not suffice. I also started using the Streaming API (detailed in 2.2.1.2). This led me to the first issue encountered. To access the Twitter server, one has to possess: a regular Twitter account and a Twitter Developer App account. This app account, upon registration, provides the user with a set of keys and secret tokens used to uniquely identify him and grant him permission to the Twitter servers. The most notable event while using the Twitter APIs happened when queries started returning code 32. This proved to be a time consuming issue, not due to its difficulty, but due to the lack of information that came along with the error code. Eventually, the fix came in the form of syncing my computer’s clock properly, as it was skewed by 1 hour on the virtual machine. This time difference caused the Twitter servers to reject my queries for the longest time. The rest of my time spent utilizing the Twitter APIs were eventless.
● Setting up MongoDB to store downloaded Tweets
The reasons for adopting this particular type of storage solution were described in Section 2.2.1.3. In order to implement and host an instance of a MongoDB I installed the required framework on my workbench and hosted it locally. Since I am dealing with a NoSQL database, a database schema is futile to provide, as tweets were uploaded in
16
separate collections depending on date of upload and search term they were found with.
● Feeding data to MongoDB via pyMongo
After implementing the first requirement - that of acquiring tweets containing mentions of mental disorders - without a database I had to serialize them in json form. Json (JavaScript Object Notation) is a preferred data-interchange format because of its readability and ease of parsing. Incoming tweets were loaded in dictionary form and then dumped in json form on hard drive. After the database was up and running, I moved already accumulated data up to the MongoDB instance, as it was easier to work with it from there, as opposed to serializing and deserializing data continuously. MongoDB uses the bson format, which is essentially binary-coded json. The step of moving jsoned data to the database required converting them to bson format and uploading them. This raised an issue linked to character encoding. Twitter is a multi-language platform which supports characters from every widespread alphabet, enforcing the use of the industry standard UTF-8 character encoding. After 3
encountering some issues with and switching my data from Unicode to UTF-8, it was ready to be uploaded to the database . This is where the pyMongo package came into play as it provided a trivial way to handle data between python scripts and the database.
● Downloading tweets and uploading to MongoDB
This step required linking together two separate python scripts: the one which communicates with Twitter and downloads disorder related tweets and the one responsible with uploading said downloaded tweets to locally hosted database. The bulk of the coding was done in the previous steps and any issues regarding character and data format were ironed out. I combined the two scripts into one “TweetFetcher.py” script which, when run, constantly streams tweets filtered by my search term dictionary directly to my databse. This remained an independent part of the system which handles data gathering, in its most brute form.
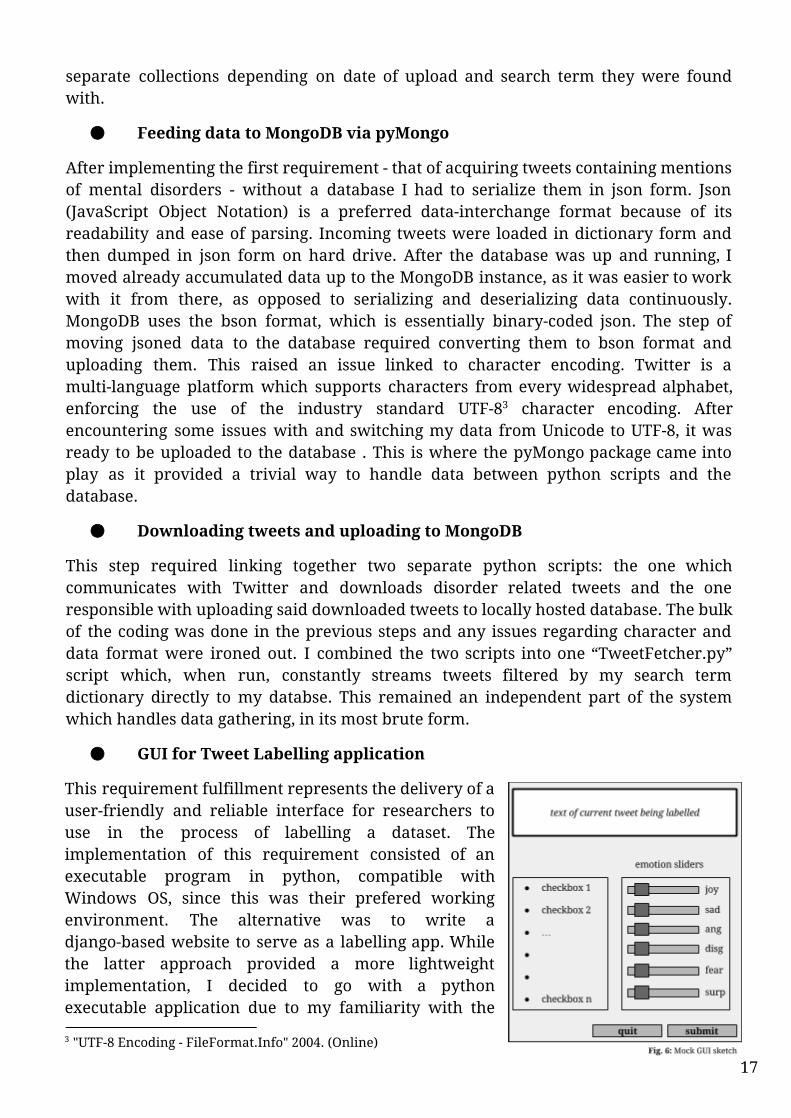
● GUI for Tweet Labelling application
This requirement fulfillment represents the delivery of a user-friendly and reliable interface for researchers to use in the process of labelling a dataset. The implementation of this requirement consisted of an executable program in python, compatible with Windows OS, since this was their prefered working environment. The alternative was to write a django-based website to serve as a labelling app. While the latter approach provided a more lightweight implementation, I decided to go with a python executable application due to my familiarity with the
3 "UTF-8 Encoding - FileFormat.Info" 2004. (Online)
17

TKinter framework and python itself. The finished GUI (see Figure 7.2) encompassed a text field designed to hold the tweet text, a series of checkboxes for researchers to describe the validity of the tweet in relation to our cause, and separate slider bars for each emotion to be labeled independently. The slider bars are designed to go from 0 (that emotion is not present at all) to 100 (emotion is strongly present). This highly granular scoring system enabled me to later round up scores how I saw fit, depending on classifier proprieties, and the results I was getting with them. A valid point of discussion was raised by my supervisor regarding the relationship between emotions and if they could be interpreted as opposite of each other, particularly in the case of joy and sadness, rendering their presence as two separate sliders redundant. While it is fundamentally wrong to assume otherwise, I have chosen this particular type of scoring system to accommodate the rest of the emotions: anger, surprise, disgust, fear which are inherently independent. In the case of joy and sadness, their coexistence in a tweet is left at the discretion of the psychology expert, and not denied by a purposeful logic limitation of the tool. Once finished, the tool was sent to all three participants in the labelling process, along with credentials used to log in. This type of differentiation was implemented due to the nature of the dataset: each of the three domain annotators was attributed 90 individual tweets, out of which 20 were common (to assure that data was
labelled objectively by all three participants). The login (Figure 7.1) credentials would simply point the application to the right dataset. On login, the application would start downloading the assigned dataset from a remote instance of my database which was set up using MongoLab[22]. The decision to host the datasets intended for labelling online was meant to provide on-demand access to them, from any point with an internet connection. After the dataset downloads, the application presents a window with the first tweet in the series and the required attributes discussed earlier. Once happy with the labels attributed, the researchers could ask for the next tweet in the array and so on, until the assigned quota is exhausted. Among the most notable user friendly features I was required to implement was the safety measure of constant progress tracking.
18

Every interaction with the program saves the current progress so that in case of failure, everything can be picked up from last known point. As soon as a tweet is labeled, upon request of a new one, the previous tweet labels are already sent to the MongoLab instance, providing me access to them immediately. This ensured that the valuable labeled data was sent as soon as it was ready and at every incremental point in the array. This was also implemented to save researchers from the hassle of having to deal with manually sending back the labelled data, making their experience as smooth and streamlined as possible. Once the users finished their quota, a message popped up informing them so and further use of the app was disabled. I view this stage as a critical part in the project, as building a dataset labelling tool is a task on its own. My goal was to provide high quality user experience and also ensuring the networking infrastructure was unobtrusive to the user and sturdy to resist cross platform compatibility issues and the end user comments I received were on par with my goal.
● Extraction of Machine Learning Features
With the training data obtained, the next step in the supervised machine learning pipeline revolves around training (or fitting) a classifier with the training data. To achieve this, features are extracted from the training data. In a text mining project, with data in the form of text, features are obtained via the use of natural language processing methods (Section 2.1.). We have built the feature set through iterations with collaborators and external research into text mining on social media. The most recurrent chosen features used by similar studies and the ones we agreed on were:
19

1. word count - performed a word count on the tweet text. 2. spelling errors - used pyEnchant package which provides detection of spelling errors. Subsequently, used both the spelling errors, and their count as features. 3. parts of speech - the most common parts of speech from a tweet and their respective count were introduced as both discrete and numerical features. 4. readability score - the The Flesch Reading Ease Readability[4] score was calculated using the TextStat package and used as a feature. 5. temporal expressions - using word lists of temporal adverbs and expression, their presence in tweets was identified and used as a feature, alongside their count. 6. medications - as in the case of the previous feature, a list of both typical and atypical mental disorder medications was compiled under the guidance of the psychology researchers and used to identify them in tweets. Their count and mentions were used as features. 7. friends and family - similarly, lists of names of relationship levels and family connections were compiled to be run against incoming tweets. This feature’s relevancy is warranted by the assumption that derives from the notion of "family expressiveness"[23] which states that frequent communication and natural expression of emotion among family members is a conducive, healthy habit, thus lack of it may denote lack of manifested emotions. 8. percentages - percentages are usually a trademark of impersonal speech, which may denote a lack of emotion manifestation. Their presence as a feature was experimental, warranted by the above assumption and the fact that machine learning algorithms are not hindered by eventual useless features.
● Building classifiers for each emotion
Each of the mentioned emotions (see Figure 5) is designated a classifier which is supposed to decide whether or not its emotion is present in a tweet. After a tweet passes through all the classifiers, it gets annotated with the labels produced and sent back into the database. For this task, I employed the use of two types of classifiers: a KNN classifier and an SVM classifier. In total, 12 classifiers (two for each emotion) were trained (or fitted) with half of the training set and tested with the other half to determine which type of classifier is better suited for the task (accuracies and results in Chapter 4) both classifiers were part of the scikit-learn python toolkit:
● the KNN classifier was tested with K=n where n = [1, 5]. Best performances measured on the training data were yielded by K=2. The metric employed was Euclidian distance (see Chapter 4).
20
● the SVM classifier used a linear kernel and equal class and feature weights initially, while being tweaked after repeated runs to value the Parts-of-speech derived features more, for improved classifications.
● Aggregation of results on the GUI
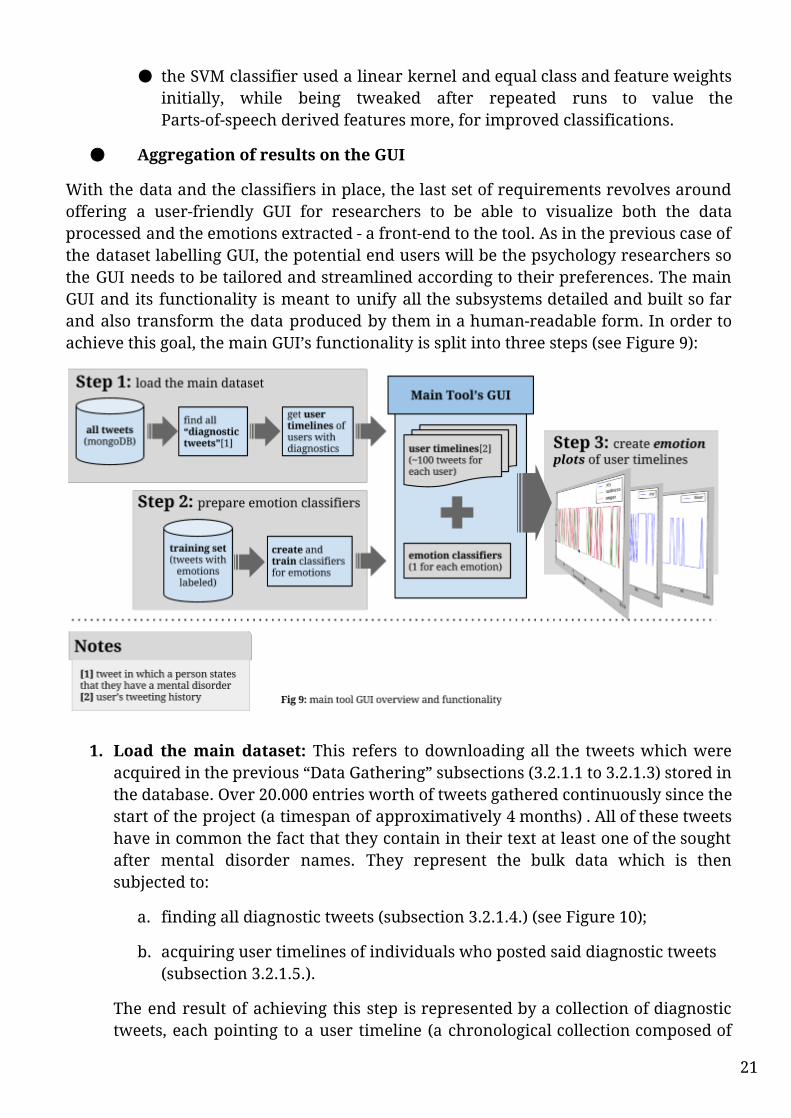
With the data and the classifiers in place, the last set of requirements revolves around offering a user-friendly GUI for researchers to be able to visualize both the data processed and the emotions extracted - a front-end to the tool. As in the previous case of the dataset labelling GUI, the potential end users will be the psychology researchers so the GUI needs to be tailored and streamlined according to their preferences. The main GUI and its functionality is meant to unify all the subsystems detailed and built so far and also transform the data produced by them in a human-readable form. In order to achieve this goal, the main GUI’s functionality is split into three steps (see Figure 9):
1. Load the main dataset: This refers to downloading all the tweets which were acquired in the previous “Data Gathering” subsections (3.2.1.1 to 3.2.1.3) stored in the database. Over 20.000 entries worth of tweets gathered continuously since the start of the project (a timespan of approximatively 4 months) . All of these tweets have in common the fact that they contain in their text at least one of the sought after mental disorder names. They represent the bulk data which is then subjected to:
a. finding all diagnostic tweets (subsection 3.2.1.4.) (see Figure 10);
b. acquiring user timelines of individuals who posted said diagnostic tweets (subsection 3.2.1.5.).
The end result of achieving this step is represented by a collection of diagnostic tweets, each pointing to a user timeline (a chronological collection composed of
21

the tweets before and the tweets after the diagnostic tweet (this sums up to approximatively 100 tweets per timeline - depending on the tweeting habits of said user).
2. Prepare the emotion classifiers: This step has the goal to instantiate and prepare the emotion classifiers (subsection 3.2.3.). In order to achieve it, it must first acquire the labeled training set from the database (separate from the main tweet dataset), generate one classifier for each of the emotions and train it.
22
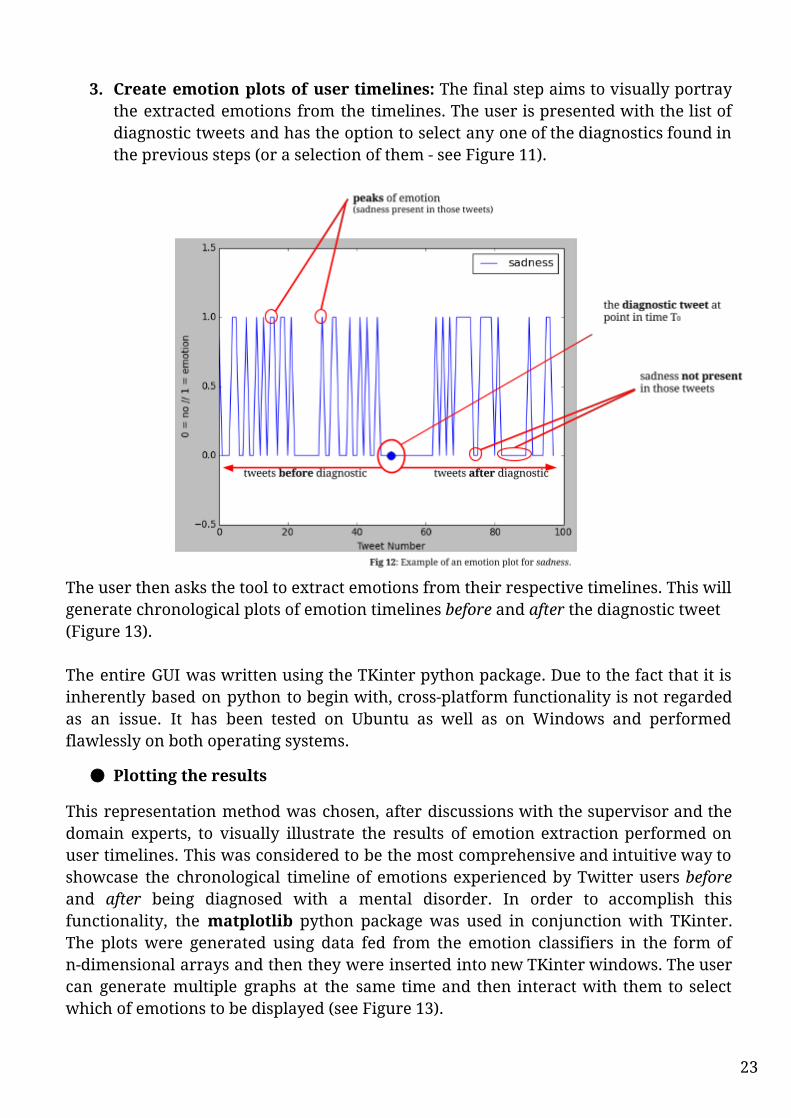
3. Create emotion plots of user timelines: The final step aims to visually portray the extracted emotions from the timelines. The user is presented with the list of diagnostic tweets and has the option to select any one of the diagnostics found in the previous steps (or a selection of them - see Figure 11).
The user then asks the tool to extract emotions from their respective timelines. This will generate chronological plots of emotion timelines before and after the diagnostic tweet (Figure 13). The entire GUI was written using the TKinter python package. Due to the fact that it is inherently based on python to begin with, cross-platform functionality is not regarded as an issue. It has been tested on Ubuntu as well as on Windows and performed flawlessly on both operating systems.
● Plotting the results
This representation method was chosen, after discussions with the supervisor and the domain experts, to visually illustrate the results of emotion extraction performed on user timelines. This was considered to be the most comprehensive and intuitive way to showcase the chronological timeline of emotions experienced by Twitter users before and after being diagnosed with a mental disorder. In order to accomplish this functionality, the matplotlib python package was used in conjunction with TKinter. The plots were generated using data fed from the emotion classifiers in the form of n-dimensional arrays and then they were inserted into new TKinter windows. The user can generate multiple graphs at the same time and then interact with them to select which of emotions to be displayed (see Figure 13).
23

3.4. Testing
Testing was performed concurrently with the Implementation phase, and consisted of two approaches:
• Unit testing – Was used to test small fragments of code such as python modules and individual functions or thin slices of functionality.
• Integration testing – Was used to test each module of the tool interacting together. The stress points of this phase revolved around the communication between the database, the classification modules and the main GUI (backend to frontend).
3.4.1. Unit Testing
Since the beginning of the actual code writing, unit testing served its purpose to assess the functionality of every small snippet of code or requirement deliverable. Among the bugs discovered using this method, the most notable are:
● the pyEnchant python package used for spell checking and language detection returned an exception whenever encountering a set of characters derived from using ‘emoticons’ from the Twitter mobile app. This was resolved by temporarily ignoring said characters during the language detection step.
● The python-twitter python wrapper had trouble establishing a successful streaming connection with Twitter, even though the search functionality which communicated with the Search API behaved correctly. From a desire to limit the
24

number of outside packages used, I decided to switch entirely to using Tweepy, a similar Twitter wrapper, but which performed better.
3.4.2. Integration Testing
Using the bottom-up integration testing technique, I proceeded to test and integrate the less complex and lower level modules first and then progressively switching to more complex ones. This translated into testing and integrating the backend functionality first, assuring that the intended core modules performed correctly. The final step of back-end integration testing targeted the emotion classifiers. During this testing process, some issues were detected such as:
● When accessing diagnostic tweets from the database and then querying Twitter for their respective user timelines, there were some occurrences when the tweet was deleted from Twitter by the user, therefore rendering the entire emotion extraction of the timeline process redundant (since there was no diagnostic to compare emotions before and after). In this case, the GUI notifies the user that the person in question deleted their tweet, and the tweet is marked as unavailable in the database.
3.5. Summary of Development
This chapter encompassed the evolution of the project from the requirements laid down on the drawing board, to design decisions taken in their implementation. The objectives of the project were discussed and detailed thoroughly, along with issues encountered and showcases of their deliverables:
● Gather tweets related to mental disorders. ● Identify diagnostic tweets. ● Build a labeled training and testing set. ● Perform emotion extraction on gathered data. ● Aggregate results on top of GUI.
The GUI’s functionality and ties to its backend were showcased and illustrated, with examples of emotion plots.
The next Chapter will revolve around judging the quality of results of the process of emotion extraction and discussing some examples of emotion timeline plots.
4. Results and User Feedback
4.1. Results
Among the different ways of evaluating machine learning/text mining systems, the most relevant measures are accuracy, precision, sensitivity (or recall) and specificity (or true negative rate). A result of a binary classification can take one of four values:
25

● True positive (tp) ● True negative (tn) ● False positive (fp) ● False negative (fn)
This categorization breeds a series of measures, with the aid of which, one can judge the quality of results of a machine learning algorithm (in our case, both KNN and SVM). They are defined as:
Results are derived from performing the process of cross-validation: the labelled dataset was partitioned into two sets - one for training, and one for testing (or validation), so in the case of anger, the 24 labelled tweets which contained emotion scores for this particular emotion were split into two sets, each containing 12 tweets. Both the KNN and SVM classifiers were trained on the first set and tested on the latter one.
Both classifiers performed similarly in most cases (see anger, joy, sadness) in terms of accuracy but drastically differently in the cases of surprise and fear, where training data was limited. In these cases, KNN (keeping in mind k=2) performed poorly. In the “release candidate” for the tool, each emotion is assigned the classifier with the best overall performance, be it KNN or SVM.
A border-line comparison is provided in the shape of “keyword dicts (dictionaries)” - (see the last column in Table 14). A collection of words from the lexical field of each of
26

the emotions was created and used as a basic naive form of classification along the lines of:
if any word from list is present → emotion is present in tweet
As expected, this methodology performed considerably worse than the machine learning classifiers in all the cases where a sensible training dataset was present.
In the case of disgust, no training data was labeled by the researchers for this specific emotion so results are unavailable, but as a bottom-line, with enough training data (>20-30 tweets), accuracies reach upwards of 90.9% (see sadness), with a mean accuracy (for aforementioned three emotions) of 79.0%.
These statistical results place my classifiers and my tool among the results of similar text mining and sentiment analysis researches (from the Introduction and Background), as successful and promising.
4.2. User Feedback The goal of this project was to create a tool for psychology researchers to be able to visualize and study plots of emotional behaviour of Twitter users suffering from mental disorders before and after their diagnostics. From my developer’s point of view, this meant providing a complete and comprehensive, user friendly piece of software that employs the use of Machine Learning and Text Mining concepts to yield good results in the task of extraction and classification of emotions from tweets, and then present the findings in the form of plots. The only type of relevant evaluation for this project can only come in the form of the findings and knowledge gathering the domain experts have found or expect to be able to perform with it. This chapter concludes with the statements of the participating psychology researchers of the potential this kind of tool could have in their field (full statements found in Appendix A).
I am interested in the way that social media can be used as an expansion in normal social networks. We know that during times of crisis people with experience of mental distress, such as 'Schizophrenia', become increasingly isolated - but can social media prevent this isolation to a degree and lessen crisis? By understanding the manner in which social media is used to communicate, for example through emotional context, we can explore this further. One limitation [...] is the absence of detailed phenomenological context discernible through social media without extensive contextualisation, and even then only with caution [...].
- Dr. Andrew Shepherd
27

Firstly, we would like to see whether it is possible to obtain detailed information from Twitter about emotions from people who experience mental health problems. Through studying emotion plots, we expect to be able to potentially identify emotions associated with certain stages during the diagnosis of a mental health problem, i.e. before, during, and after. In being able to access the information, we could potentially identify the most common feelings associated with this difficult time, and use the evidence to show healthcare professionals what their service users are likely to be feeling before, during, and after a diagnosis. As such, interventions targeting these emotions could be in place to support individuals before they visit their doctor and after their diagnosis. Additionally, through using the plots we may be able to see how emotions change over the course of being diagnosed. [..] If we identify that different people experience different emotions and emotional intensity during the diagnosis stage of a mental health problem via this twitter study, this would point to future areas of research.
- Dr. Natalie Berry
5. Conclusions
5.1. Achievements With the initial Objectives table in mind (Figure 15), the positive feedback received from the researchers regarding the quality and ease-of-use of the tool and in the light of the results obtained from the emotion classification, it can be said that the project was a success. With a mean accuracy of 79.0% (across joy, sadness and anger), the goal has been achieved.
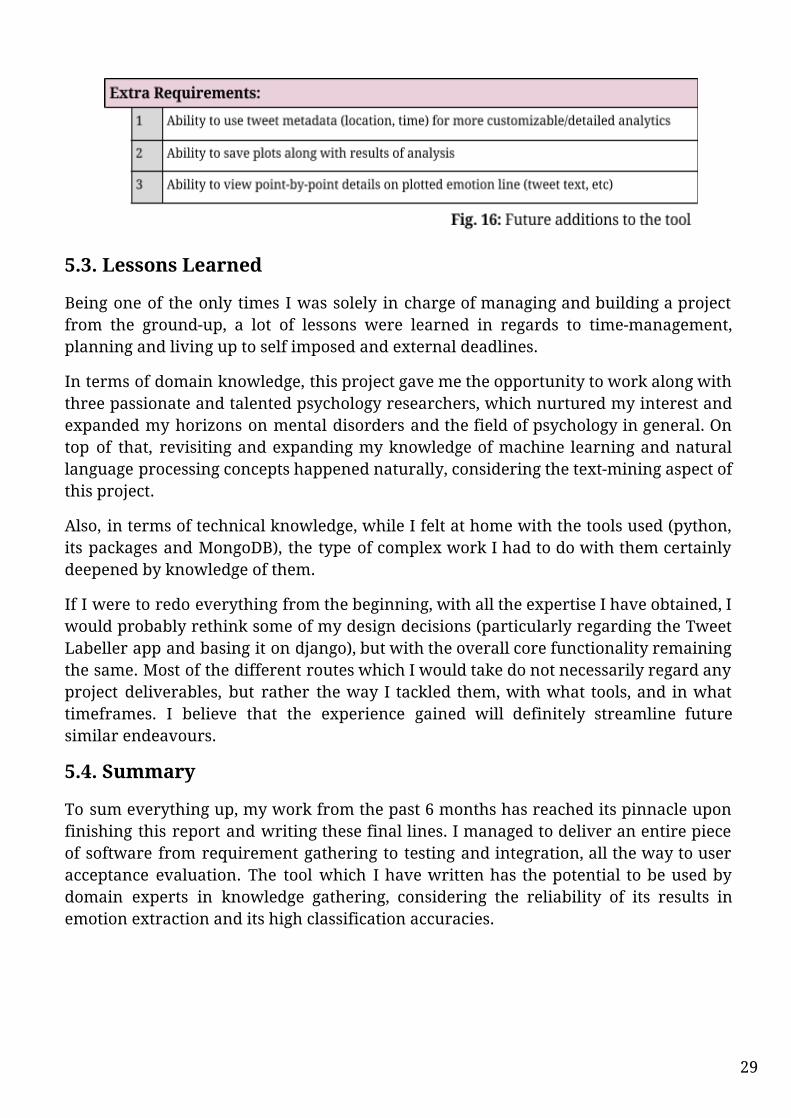
5.2. Future Improvements
While the functionality which we set out to implement is all working and deployed and the project can stand on its own as a well rounded and reliable tool, some extra modules could have worked their way into the final version if the Third Year Project deadlines would have accommodated them. The most valuable ones would have been:
28
5.3. Lessons Learned
Being one of the only times I was solely in charge of managing and building a project from the ground-up, a lot of lessons were learned in regards to time-management, planning and living up to self imposed and external deadlines.
In terms of domain knowledge, this project gave me the opportunity to work along with three passionate and talented psychology researchers, which nurtured my interest and expanded my horizons on mental disorders and the field of psychology in general. On top of that, revisiting and expanding my knowledge of machine learning and natural language processing concepts happened naturally, considering the text-mining aspect of this project.
Also, in terms of technical knowledge, while I felt at home with the tools used (python, its packages and MongoDB), the type of complex work I had to do with them certainly deepened by knowledge of them.
If I were to redo everything from the beginning, with all the expertise I have obtained, I would probably rethink some of my design decisions (particularly regarding the Tweet Labeller app and basing it on django), but with the overall core functionality remaining the same. Most of the different routes which I would take do not necessarily regard any project deliverables, but rather the way I tackled them, with what tools, and in what timeframes. I believe that the experience gained will definitely streamline future similar endeavours.
5.4. Summary
To sum everything up, my work from the past 6 months has reached its pinnacle upon finishing this report and writing these final lines. I managed to deliver an entire piece of software from requirement gathering to testing and integration, all the way to user acceptance evaluation. The tool which I have written has the potential to be used by domain experts in knowledge gathering, considering the reliability of its results in emotion extraction and its high classification accuracies.
29

References
[1] "Company - About Twitter." 2013 (Online)
[2] Barch, DM. "Schizophrenia Spectrum Disorders | Noba." 2015 (Online)
[3] StatSoft, "Text Mining, Big Data, Unstructured Data" (Online)
[4] "The Flesch Reading Ease Readability Formula" 2008 (Online)
[5] Manning, Christopher D. Foundations of statistical natural language processing. Hinrich Schütze. MIT press, 1999.
[6] Mitchell, Tom M. Machine Learning. New York: McGraw-Hill, 1997. (Print)
[7] G. Brown, "Machine Learning: Lecture 1 - Motivation." (Online)
[6] T. Morris, "Fundamentals of Artificial Intelligence: Lecture 1 - Speech recognition" (Online)
[9] Foster, Kenneth R, Robert Koprowski, and Joseph D Skufca. "Machine learning, medical diagnosis, and biomedical engineering research-commentary." Biomed Eng Online 13.94 (2014): 10.1186.
[10] Li, Weiyuan, and Hua Xu. "Text-based emotion classification using emotion cause extraction." Expert Systems with Applications 41.4 (2014): 1742-1749.
[11] Strapparava, Carlo, and Rada Mihalcea. "Learning to identify emotions in text." Proceedings of the 2008 ACM symposium on Applied computing 16 Mar. 2008: 1556-1560.
[12] Williams, Shirley Ann, Melissa Terras, and Claire Warwick. "How Twitter is studied in the Medical Professions: A classification of Twitter papers indexed in PubMed." Medicine 2.0 2.2 (2013).
[13] De Choudhury, Munmun et al. "Predicting Depression via Social Media." ICWSM 8 Jul. 2013.
[14] Pak, Alexander, and Patrick Paroubek. "Twitter as a Corpus for Sentiment Analysis and Opinion Mining." LREC 19 May. 2010: 1320-1326.
[15] "The Search API | Twitter Developers." 2014. (Online)
[16] "The Streaming APIs | Twitter Developers." 2014. (Online)
[17] "NoSQL - Wikipedia" 2009. (Online)
[18] "Object-relational impedance mismatch - Wikipedia" 2006 (Online)
[19] Juran, J. M, and A. Blanton Godfrey. Juran's Quality Handbook. New York: McGraw Hill, 1999. (Print)
[20] Amandine, Charmasson, Kim Jong-Hwan, and Kambiz Arab Tehrani. "Cognitive Architecture to Composite Emotions from Autonomic Nervous System for Robotic Head." Robot Intelligence Technology and Applications 2012 (2013): 301-313.
[21] "UTF-8 Encoding - FileFormat.Info" 2004. (Online)
[22] "MongoDB Hosting: Database-as-a-Service by MongoLab." 2010. (Online)
[23] "Expressed emotion - Wikipedia, the free encyclopedia." 2005 (Online)
30

Appendix A Attempting to study emotion plots in mental health problems via twitter is an extremely novel research idea. The limitation with the majority of research in the field is that it often relies on retrospective self-reports in order to understand an individual's emotional state. As such, the results obtained regarding emotion are potentially inaccurate as they are not in-the-moment reports. In order to combat this issue, researchers have been beginning to use ecological sampling methodology, whereby participants are alerted with a beep and they are asked to complete in-the-moment real-time assessments. However, in this case the participants are still aware that this is being used for research purposes so results may be confounded by this factor. Additionally, the limitations of having a few alerts a day means that certain emotions and the intensity may be missed if they are not alerted at the specific time they are experiencing that emotion.
Twitter provides the unique opportunity to overcome this issue, whereby we are gaining real-time experiences by individuals whose reports are more likely to be open and honest. Firstly, we would like to see whether it is possible to obtain detailed information from Twitter about emotions from people who experience mental health problems. Through studying emotion plots, we expect to be able to potentially identify emotions associated with certain stages during the diagnosis of a mental health problem, i.e. before, during, and after. In being able to access the information, we could potentially identify the most common feelings associated with this difficult time, and use the evidence to show healthcare professionals what their service users are likely to be feeling before, during, and after a diagnosis. As such, interventions targeting these emotions could be in place to support individuals before they visit their doctor and after their diagnosis.
Additionally, through using the plots we may be able to see how emotions change over the course of being diagnosed. Too many studies fail to recognise the impact that a diagnosis can have on an individual and how it may be positive for some whilst negative for others. If we identify that different people experience different emotions and emotional intensity during the diagnosis stage of a mental health problem via this twitter study, this would point to future areas of research. For example, further research could examine whether demographic characteristics influence emotions associated with diagnosis. Additionally, we could investigate what factors are likely to influence these emotions, for example clinician-patient relationship, family support.
- Natalie Berry I am interested in the way that social media can be used as an expansion in normal social networks. We know that during times of crisis people with experience of mental distress, such as 'Schizophrenia', become increasingly isolated - but can social media prevent this isolation to a degree and lessen crisis? By understanding the manner in which social media is used to communicate, for example through emotional context, we can explore this further.
31

One limitation I would highlight is the absence of detailed phenomenological context discernible through social media without extensive contextualisation, and even then only with caution. This is why, in my opinion, efforts to use such material in the identification of 'psychotic' or 'neurotic' thought will fail.
- Dr. Andrew Shepherd A brief to answer to your question might be something like... There is a dearth of user-generated data pertaining to perceptions of receiving a diagnosis of a schizophrenia spectrum disorder. This twitter mining project will enable an exploratory investigation into this area of research, enabling the identification of commonly expressed emotions relating to diagnosis. One implication of this research is that it may represent a novel means of assessing societal changes (over time) and geographical variation in the emotion associated with a diagnosis.
- Dr. Rohan Morris
32