twin cities walking study - active living research
TRANSCRIPT

Twin Cities Walking Study
Drs. Ann Forsyth, Kathryn H. Schmitz, Michael OakesSurvey Staff: Dan Pepper, Gail Babes, Kimberly Carolan, Nathan
Mitchell, Patricia BattinGIS Staff: Joel Koepp, Jason Zimmerman Statistical Assistant: Mary HearstDesign Inventory Fieldwork: Chelsa Johnson, Jorge SalcedoAdditional Travel Diary Proofing: Allison Rockwell, Frank FitzgeraldTranslation: Jorge Salcedo, Pang Angel ThaoAccounts: Jill Bezecny, David Lowe; Graphics: Katherine Thering
Twin Cities Walking Study
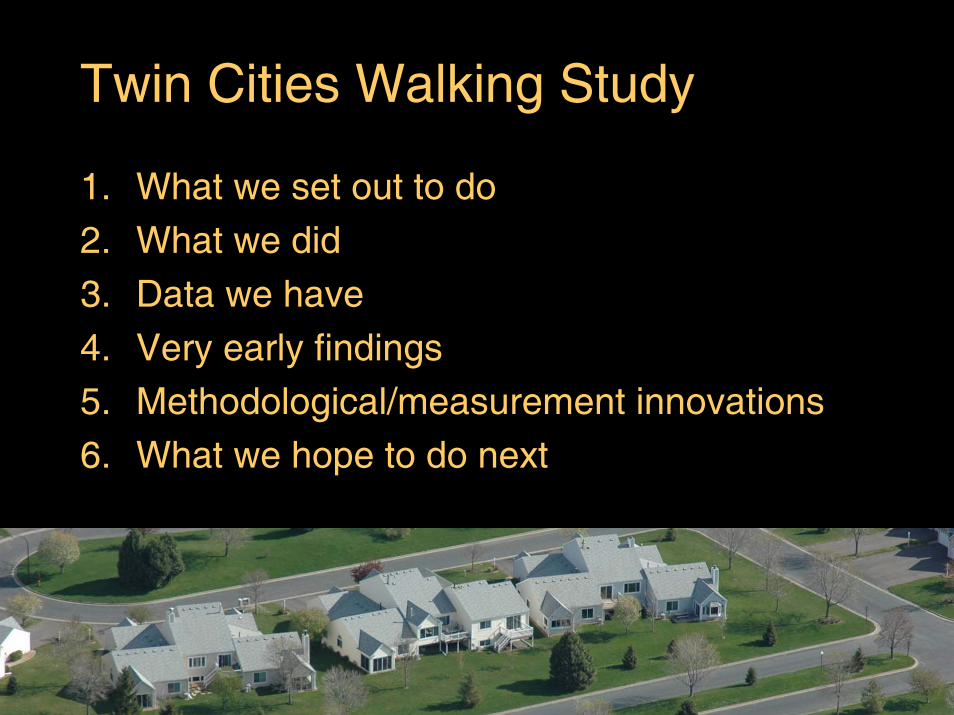
1. What we set out to do2. What we did3. Data we have4. Very early findings5. Methodological/measurement innovations6. What we hope to do next

1. What We Set Out To DoStudy Design
• Cross-sectional study with measures of:– Physical environment of 36 specific residential
areas– 20 randomly selected Individual residents of the
areas included in the study (Goal N = 720)
• Repeatability sample of 20% for all measures• Pilot testing of all individual level measures
on diverse sample of 40– Time to complete survey and acceptability of
survey

1. What We Set Out To DoHypotheses
• Hypothesis 1: High density, high street connected neighborhoods ↑ walking behavior.
• Hypothesis 2: Those who perceive the environment to be more walkable will walk more.
• Hypothesis 3: Other observed and perceived physical and socio-cultural features of the environment will explain variance in walking behavior.
• Hypothesis 4: Individual-level variables will mediate relationships between environment and walking.

2. What We DidSelecting Neighborhoods & Environmental Measures
• 36 805*805 meter areas in corridor from St. Paul to Blaine– Vary by combinations of high/low
gross density + median block size– 9 big blocks/high density, 9 big
blocks/low density, etc.
• 50+ environmental variables – GIS—existing, digitized, inventory
• 718 participants
• Environmental measures at multiple geographies around each participant – Distances to nearest features– Network + straight line buffer– Grid cells
DowntownSt. Paul
Urban edge
8 km
DowntownMinneapolis

Area 30:High Gross Density—15.8 persons/acre, 39/ha Small Median Block—3.7 acre, 1.5 ha

Area 3: Low Gross Density—4.7 persons/acre, 11.6/ha Large Median Block—11.1 acres, 4.5ha
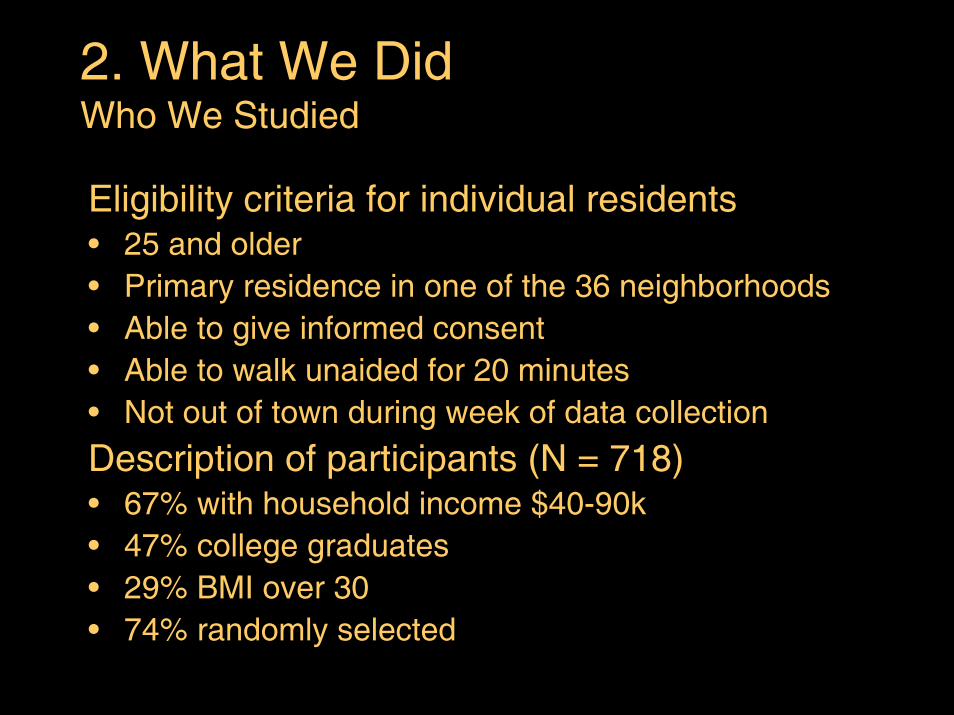
2. What We DidWho We Studied
Eligibility criteria for individual residents• 25 and older• Primary residence in one of the 36 neighborhoods• Able to give informed consent• Able to walk unaided for 20 minutes• Not out of town during week of data collection
Description of participants (N = 718)• 67% with household income $40-90k• 47% college graduates• 29% BMI over 30• 74% randomly selected

2. What We DidData Collected with Individual Residents
• 7-day travel diaries (N=718)• 7-day accelerometer records (N=718)• Measured height and weight (N=718)• Participant-drawn maps of self-defined neighborhood (N=717)• Telephone interview (N=718)
– NQLS Survey• IPAQ• Physical environment perceptions• Social environment perceptions• Psychosocial predictors of PA
– Demographics (NHTS)– Quality of Life – Neighborhood definition– Dog ownership– Bicycle ownership/use/safety

3. DataBroad Topics We Can Examine
• How different aspects of measured and perceived environment correlate with physical activity
• Environment– Density– Street pattern– Mixed use– Pedestrian amenities– Socioeconomic variables
• Physical activity– Physical activity in specific domains from IPAQ– Objectively measured PA from accelerometry

4. Very Early FindingsIPAQ Survey Data and Focus Area Density and Block Size Data
Low Density < 5/ac or 12.4/ha
High Density > 10/ac or 24.7/ha•Hypothesis 1: High density, high street connected neighborhoods ↑ walking behavior
•Have examined self reported physical activity for focus areas stratified by gross density and median block size.

< 5/ac OR >10/ac
367
183
243
319
0
100
200
300
400
L D it Hi h D it
by Neighborhood Density & TypeIPAQ Walking Activity
•Both leisure walking and travel walking are statistically significantly different by density (p<0.001)•Significant differences remain significant after adjusting for age and income of respondent•Neither total PA nor BMI statistically differ by density
Low Density High Density
Low Density < 5/ac or 12.4/ha
High Density > 10/ac or 24.7/ha
Leisure
Walking
Travel
Walking
Mea
n M
et M
inut
es/W
eek

300273
309
231
0
100
200
300
400p
S ll Bl k L Bl k
by Neighborhood Block Size & TypeIPAQ Walking Activity
•Both leisure walking and travel walking are not statistically significantly different by block size•Relationships remain insignificant after adjusting for age and income of respondent•Neither total PA nor BMI statistically differ by block size
Small Blocks < 5 ac or 2 ha
Big Blocks > 8 ac or 3.2 ha
Leisure
WalkingTravel
Walking
Mea
n M
et M
inut
es/W
eek
Small Block Large Block

4. Very Early FindingsHypothesis 1: High density, high street connected (small block) neighborhoods ↑ walking behavior.
•High density focus areas have more self-reported travel walking but less leisure walking than low density areas. Total walking does not differ. •Focus areas with small blocks have no difference to big blocks in leisure or travel walking.•Total self-reported PA and (measured) BMI do not differ by either density or block size.•But there are lots of variables left to analyze including accelerometry + many environmental measures!

5. Methodological and Measurement Innovations Models (Propensity Scoring)• Working toward a causal model (vs. predictive)Measurement• Testing and modifications to the Boarnet +
Day/Irvine-Minnesota urban design inventory• Developing comprehensive set of GIS-based
environmental measurement protocols • 7-day travel diaryRecruitment• Novel recruitment plan made use of media relations
expertise to ‘condition the market’
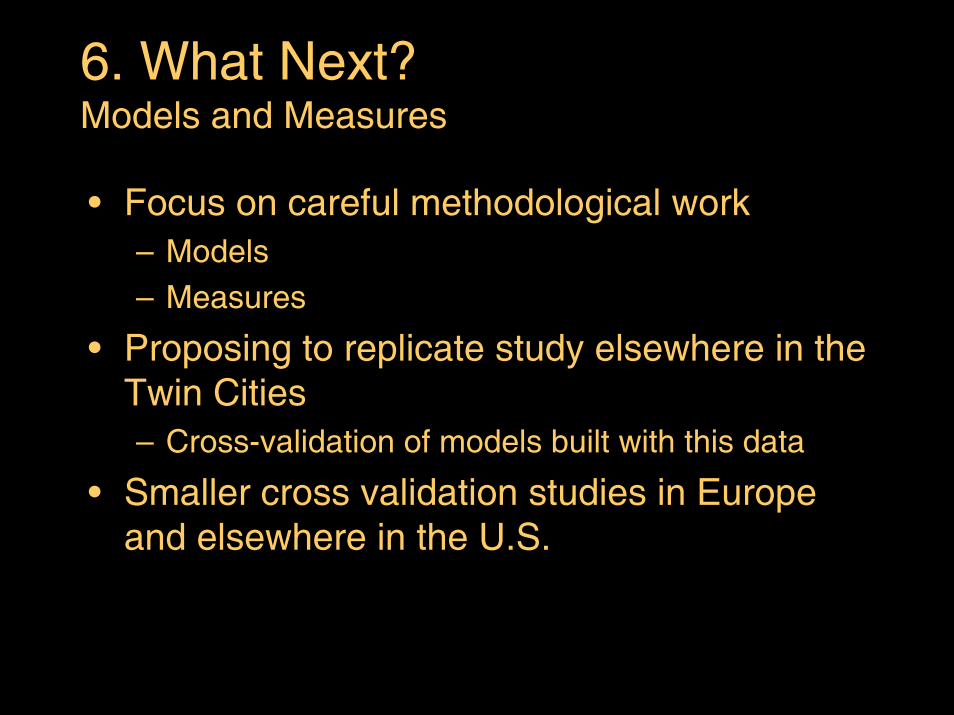
6. What Next?Models and Measures
• Focus on careful methodological work– Models– Measures
• Proposing to replicate study elsewhere in the Twin Cities – Cross-validation of models built with this data
• Smaller cross validation studies in Europe and elsewhere in the U.S.

Twin Cities Walking Study
1. What we set out to do2. What we did3. Data we have4. Very early findings5. Methodological/measurement innovations6. What we hope to do next
Drs. Ann Forsyth, Kathryn H. Schmitz, Michael Oakes