tweddle annual report_2014_final
TRANSCRIPT

AnnualReport2013-2014

About Tweddle 1
Services and Highlights of 2013 -14 2
Tweddle Board Members 3
Leadership Report 4
Services 6
Psychology Service 10
Social Support Program 11
Community Programs 14
Research 17
Corporate Report 18
Quality 21
Declarations and Compliance 22
Organisational Chart 23
Governance & Accountability 24
Thank you to donors & community partners 25
Life Governors 26
Contents
53 Adelaide Street Footscray Victoria 3011 Australia Tel + 61 3 9689 1577 Fax + 61 3 9689 1922Web www.tweddle.org.au


Services
1. Assessments
2. Pre-intake assessments with clients and health professionals
3. Referrals and liaison with referrers
4. Advice only calls

2012 -13 2013 -14
No. beds available each day of operation 7-8 (M-F) 7-8 (M-F)
(Closed Alternate Weekends) 7 (S&S) 7 (S&S)
Clients discharged 1627 1683
Average length of stay (days) 3.65 3.01
Total No. of Bed Days 7453 5061
Occupancy (%) 105.00 102.87
0-7 Days
8-14 Days
15-30 Days
31-60 Days
61-90 Days
28%
11%
27%
23%
11%

Barwon S/W
Eastern Metro
Gippsland
Grampians
Hume
Loddon-Mallee
North West Metro
70%
16%
4%
4%
4%
1%0%


120
100
80
60
40
20
0D
omes
tic v
iole
nce
Str
ess
/ hi
gh a
nxie
ty
Isol
atio
n
Chi
ld d
isab
ility
(incl
udin
g m
enta
l hea
lth, I
ntel
lect
ual
disa
bilit
y or
deb
ilita
ting
illne
ss)
Ad
ult
dis
abili
ty(in
clud
ing
men
tal h
ealth
, Int
elle
ctua
l di
sabi
lity
or d
ebili
tatin
g ill
ness
)
Hou
sing
Dru
g an
d A
lcoh
ol
Fina
ncia
l
120
100
80
60
40
20
0
Prim
ary
rela
tions
hip
(p
artn
er/h
usba
nd)
Oth
er r
elat
ions
hip
(s
igni
fican
t oth
ers)
grie
f and
loss
Tran
sitio
n to
p
aren
ting
- d
ads
Tran
sitio
n to
p
aren
ting
- m
ums
Fath
ers
lack
of
par
entin
g co
nfid
ence
Mot
hers
lack
of
par
entin
g co
nfid
ence
Diff
eren
t p
aren
ting
styl
es
Par
entin
g to
geth
eras
a t
eam


12%
8%
18%
14%
23%
25% Footscray
Altona Meadows
Essendon
Wyndham Vale
Point Cook
Werribee Gold


PRACTICE FRAMEWORKThe environment in which we work:
Government Frameworks and Policy
Statutory legislation and regulations
Socio-economic trends
The outcomes we seek to achieve with our families:
Parenting Confidence
Safety, Stability and healthy development
Improved overall health
Connectedness to community Improved family relationships
Resilience
The house containing the models and interventions that guide our practice:
Case work, goals and planning Care Teams Assessment Sleep & SettlingPlay based activitiesCommunity based activitiesTherapy and counselling Secondary consultationGroup workPsycho-educationHealth promotion
Attachment
Child Development
Trauma Culturally sensitive
Strengths based Relationship based
Gender role sensitivity Ecological systems
Community Development Social Model of Health
Our foundations representing the philosophies, beliefs, vision and values of the organisation:
Organisation history Cultural diversity Social Justice Gender Equality Empowerment Self-determination
Human rights Healthy and resilient families
Our T
heor
ies a
nd P
ersp
ectiv
es
provide a framework for our practice:


Board ofManagement
Chief Executive Officer
Director Corporate Services
DirectorOf Clinical Services (Nursing)Executive Assistant
Qualtiy
OHS
Psychology
A & I
SocialSupport
PracticeLead
ResidentialServices
PASDS Program
Day Stay
Home Visiting
MyTime
PlaySteps
Prison
Childbirth Education
Community Programs
Accounts& Payroll
WorkforceDevelopment
WorkforceWellbeing
OperationsCoordinator
DomesticServices
Clinical Support
Communicationsand Fundraising
Frontline
Health InformationManagement
Administration &Human Resources
Support


Board member's, accountable officer's and chief finance and accounting
officer's declaration
We certify that the attached financial report for Tweddle Child and Family Health Service has been
prepared in accordance with Standing Direction 4.2 of the Financial Management Act 1994, applicable
Financial Reporting Directions, Australian Accounting Standards, Australian Accounting Interpretations
and other mandatory professional reporting requirements.
We further state that, in our opinion, the information set out in the comprehensive operating
statement, balance sheet, statement of changes in equity, cash flow statement and notes to and
forming part of the financial statements, presents fairly the financial transactions during the year ended
30 June 2014 and financial position of Tweddle Child and Family Health Service as at 30 June 2014.
At the time of signing, we are not aware of any circumstance which would render any particulars
included in the financial statements to be misleading or inaccurate.
We authorise the attached financial report for issue on this day.
Ms. Nicole Milburn Ms. Jacquie O'Brien
Mr. Nick Catton
Chairperson Chief Executive Officer
Director of Corporate
Services
Footscray Footscray
Footscray
Date: 10th
September 2014 Date: 10th
September 2014
Date: 10th
September 2014
Tweddle Child & Family Health Services Audited Financial Statements 30 June 2014
Page 1 of 56

Tweddle Child & Family Health Service
Note 2014 2013
$ $
Revenue from Operating Activities 2 4,366,156 4,361,665
Revenue from Non‐operating Activities 2 2,437 11,787
Employee Benefits 3 (3,622,249) (3,442,041)
Non Salary Labour Costs 3 (25,651) (31,104)
Supplies & Consumables 3 (89,142) (78,832)
Other Expenses from Continuing Operations 3 (656,388) (794,881)
Net Result Before Capital & Specific Items (24,837) 26,594
Capital & Specific Purpose Items
Capital Purpose Income 2 255,027 237,734
Brokerage Fees 3 (43,212) (41,871)
Depreciation and Amortisation 4 (186,779) (162,609)
Impairment loss building revaluation 3 (104,890) ‐Net Capital & Specific Items (79,854) 33,254
Net Result for the Year (104,691) 59,848
Other Comprehensive Income
Net fair value gains/(losses) on Available for Sale Financial Investments 13 227,269 290,978
Land & Buildings Revaluations
Land revaluation increment/ decrement 13 1,634,000 ‐ Buildings revaluation increment/ decrement 13 (184,005) ‐ Total Capital & Specific Items 1,492,719 384,080
COMPREHENSIVE RESULT FOR THE YEAR 1,572,573 350,826
Comprehensive Operating Statement For the Year Ended 30 June 2014
Tweddle Child & Family Health Services Audited Financial Statements 30 June 2014
Page 2 of 56

Balance Sheet
For the Year Ended 30 June 2014
Note 2014 2013
$ $
ASSETS
Current Assets
Cash and Cash Equivalents 5 9,115 185,647
Receivables 6 106,385 73,628
Other Financial Assets 7 4,061,761 3,554,179
Other Current Assets 8 10,000 ‐ Total Current Assets 4,187,261 3,813,454
Non‐Current Assets
Property, Plant & Equipment 9 6,271,056 4,934,211
Intangible Assets 10 125,701 167,282
Total Non‐Current Assets 6,396,757 5,101,493
TOTAL ASSETS 10,584,018 8,914,947
LIABILITIES
Current Liabilities
Payables 11 217,240 137,018
Provisions 12 513,692 468,985
Total Current Liabilities 730,932 606,003
Non‐Current Liabilities
Provisions 12 143,842 172,273
Total Non‐Current Liabilities 143,842 172,273
TOTAL LIABILITIES 874,774 778,276
NET ASSETS 9,709,244 8,136,671
EQUITY
Asset Revaluation Reserve 13a 4,303,417 2,853,422Available for Sale Revaluation Reserve 13a 803,423 576,154Restricted Specific Purpose Reserve 13a 416,474 416,474Contributed Capital 13b 3,587,206 3,587,206Accumulated Surpluses 13c 598,724 703,415
TOTAL EQUITY 9,709,244 8,136,671
Commitments 16Contingent Assets and Liabilities 22
Tweddle Child & Family Health Services Audited Financial Statements 30 June 2014
Page 3 of 56

2014 Changes due to
Equity at 30
June 2013
Comprehensive
Result
Equity at 30 June
2014
Note $ $ $
Accumulated Surplus/(Deficit) 703,415 (104,691) 598,724
Contribution by Owners 13b 3,587,206 3,587,206
Reserves
Property Plant and Equipment Revaluation Surplus 13a 2,853,422 1,449,995 4,303,417
Available for Sale Investments Revaluation Surplus 13a 576,154 227,269 803,423
Restricted Specific Purpose Reserve 13a 416,474 416,474
3,846,050 1,677,264 5,523,314
Total Equity at the end of the financial year 8,136,671 1,572,573 9,709,244
2013 Changes due to
Equity at 30
June 2012
Comprehensive
Result
Equity at 30 June
2013
Note $ $ $
Accumulated Surplus/(Deficit) 643,567 59,848 703,415
Contribution by Owners 13b 3,587,206 3,587,206
Reserves
Property Plant and Equipment Revaluation Surplus 13a 2,853,422 2,853,422
Available for Sale Investments Revaluation Surplus 13a 285,176 290,978 576,154
Restricted Specific Purpose Reserve 13a 416,474 416,474
3,555,072 290,978 3,846,050
Total Equity at the end of the financial year 7,785,845 350,826 8,136,671
Statement of Changes in Equity
For the Year Ended 30 June 2014
Tweddle Child & Family Health Services Audited Financial Statements 30 June 2014
Page 4 of 56

Note 2014 2013
$ $ CASH FLOWS FROM OPERATING ACTIVITIES
Operating Grants from Government 4,353,263 4,316,169 Interest Received from Operations 17,381 11,787 Other Receipts - - Employee Benefits Paid (3,547,393) (3,960,461) Payments for Supplies & Consumables (918,572) (718,079) Fringe Benefits Tax Paid - (9,755) Other (Payments) / Receipts 33,626 237,734 Net Cash (Used)/Generated from Operations (61,695) (122,605)
Capital Grants from Government - - CCaappiittaall DDoonnaattiioonnss aanndd BBeeqquueessttss RReecceeiivveedd 88,804 110,155 Capital Interest Received - - Capital Dividends Received - - Other Capital Receipts 34,109 -
NNEETT CCAASSHH IINNFFLLOOWW FFRROOMM OOPPEERRAATTIINNGG AACCTTIIVVIITTIIEESS 14 61,218 (12,450)
CASH FLOWS FROM INVESTING ACTIVITIES
Purchase of Property, Plant & Equipment (99,567) (138,181) Purchase of Intangible Assets (38,183) (19,120) Proceeds from Sale of Other Financial Assets (100,000) 199,019 Purchase of Other Financial Assets - (188,730) NET CASH INFLOW/(OUTFLOW) FROM INVESTING ACTIVITIES (237,750) (147,012)
CASH FLOWS FROM FINANCING ACTIVITIES
Contributed Capital (DHS) - - NET CASH INFLOW/(OUTFLOW) FROM FINANCING ACTIVITIES - -
NET INCREASE IN CASH & CASH EQUIVALENTS HELD (176,532) (159,462) CASH AND CASH EQUIVALENTS AT BEGINNING OF YEAR 185,647 345,109 CASH AND CASH EQUIVALENTS AT END OF YEAR 5 9,115 185,647
Cash Flow Statement For the Year Ended 30 June 2014
Tweddle Child & Family Health Services Audited Financial Statements 30 June 2014
Page 5 of 56

Table of Contents
Note Description Page
1 Statement of Significant Accounting Policies 7
2 223 254 285 286 297 298 309 3110 3711 3812 3913 4014 4115 4216 5317 5418 5519 5520
Revenue
Expenses
Depreciation and Amortisation
Cash and Cash EquivalentsReceivables
Other Financial AssetsOther AssetsProperty, Plant and Equipment
Intangible AssetsPayables
Employee BenefitsEquity & ReservesReconciliation of Net Result for the Year to Net Cash Inflow / (Outflow) from Operating Activities Financial Instruments
Commitments
Segment ReportingResponsible Persons and Executive Officer DisclosuresRemuneration of AuditorsEvents Occurring After the Balance Sheet Date 55
21 Summary of Financial Results 56
22 Contingent Assets and Liabilties 56
Tweddle Child & Family Health Services Audited Financial Statements 30 June 2014
Page 6 of 56

Note 1: STATEMENT OF SIGNIFICANT ACCOUNTING POLICIES
(a) Statement of compliance
These financial statements are a general purpose financial report which has been prepared in accordance with the Financial Management Act 1994 and applicable Australian Accounting Standards (AASs). They are presented in a manner consistent with the requirements of AASB 101 Presentation of Financial Statements. Accounting policies are selected and applied in a manner which ensures that the resulting financial information satisfies the concepts of relevance and reliability, thereby ensuring that the substance of the underlying transactions or other events is reported.
The financial statements also comply with relevant Financial Reporting Directions (FRDs) issued by the Department of Treasury and Finance, and relevant Standing Directions (SDs) authorised by the Minister for Finance.
The annual financial statements were authorised for issue by the board of Tweddle Child and Family Health Service on 10 September 2014.
(b) Basis of accounting preparation and measurement
The accounting policies set out below have been applied in preparing the financial statements for the year ended 30 June 2014, and the comparative information presented in these financial statements for the year ended 30 June 2013.
The going concern basis was used to prepare the financial statements.
These financial statements are presented in Australian dollars, the functional and presentation currency of the Health Service.
The financial statements, except for cash flow information, have been prepared using the accrual basis of accounting. Under the accrual basis, items are recognised as assets, liabilities, equity, income or expenses when they satisfy the definitions and recognition criteria for those items, that is they are recognised in the reporting period to which they relate, regardless of when cash is received or paid.
The financial statements are prepared in accordance with the historical cost convention, except for: non‐current physical assets, which subsequent to acquisition, are measured at a revalued amount being their fair value at the date of the revaluation less any subsequent accumulated depreciation and subsequent losses. Revaluations are made and are re‐assessed with sufficient regularity to ensure that the carrying amounts do not materially differ from their fair values; and available‐for‐sale investments which are measured at fair value with movements reflected in equity until the asset is derecognised (i.e. other comprehensive income ‐ items that may be reclassified subsequent to net result).The fair value of assets other than land is generally based on their depreciated replacement value. Historical cost is based on the fair values of the consideration given in exchange for assets.
In the application of AASs, management is required to make judgments, estimates and assumptions about carrying values of assets and liabilities that are not readily apparent from other sources. The estimates and associated assumptions are based on professional judgements derived from historical experience and various other factors that are believed to be reasonable under the circumstances. Actual results may differ from these estimates.
Tweddle Child & Family Health Services Audited Financial Statements 30 June 2014
Page 7 of 56

Judgements and assumptions made by management in the application of AAS that have significant effects on the financial statements and estimates relate to the fair value of land, buildings, infrastructure, plant and equipment, (refer to Note 1(j)) and employee benefits Note 12.)
The accounting policies set out below have been applied in preparing the financial statements for the year ended 30 June 2014 and the comparative information presented in these financial statements for the year ended 30 June 2013.
Consistent with AASB 13 Fair Value Measurement, Tweddle determines the policies and procedures for both recurring fair value measurements such as property, plant and equipment, investment properties and financial instruments, and for non‐recurring fair value measurements such as non‐financial physical assets held for sale, in accordance with the requirements of AASB 13 and the relevant FRDs.
All assets and liabilities for which fair value is measured or disclosed in the financial statements are categorised within the fair value hierarchy, described as follows, based on the lowest level input that is significant to the fair value measurement as a whole:
Level 1 – Quoted (unadjusted) market prices in active markets for identical assets or liabilities
Level 2 – Valuation techniques for which the lowest level input that is significant to the fair valuemeasurement is directly or indirectly observable
Level 3 – Valuation techniques for which the lowest level input that is significant to the fair valuemeasurement is unobservable.
For the purpose of fair value disclosures, Tweddle has determined classes of assets and liabilities on the basis of the nature, characteristics and risks of the asset or liability and the level of the fair value hierarchy as explained above.
In addition, Tweddle determines whether transfers have occurred between levels in the hierarchy by re‐assessing categorisation (based on the lowest level input that is significant to the fair value measurement as a whole) at the end of each reporting period. The Valuer‐General Victoria (VGV) is Tweddle’s independent valuation agency.
VGV engaged a third party independent valuer to value Tweddle’s land and buildings at 30 June 2014.
(c) Reporting Entity
The reporting entity is Tweddle Child and Family Health Service. The principal address is;
53 Adelaide Street Footscray, Vic 3011.
(d) Functional and Presentation Currency
The presentation currency of Tweddle Child and Family Health Service is the Australian dollar, which has also been identified as the functional currency of the Health Service.
Tweddle Child & Family Health Services Audited Financial Statements 30 June 2014
Page 8 of 56

(e) Expense recognition
Expenses are recognised as they are incurred and reported in the financial year to which they relate.
Cost of goods sold
Costs of goods sold are recognised when the sale of an item occurs by transferring the cost or value of the item/s from inventories.
Employee expenses
Employee expenses include:
wages and salaries;
annual leave;
sick leave;
long service leave; and
superannuation expenses
Depreciation
All infrastructure assets, buildings, plant and equipment and other non‐financial physical assets that have finite useful lives are depreciated (i.e. excludes land assets held for sale, and investment properties). Depreciation begins when the asset is available for use, which is when it is in the location and condition necessary for it to be capable of operating in a manner intended by management.
Intangible produced assets with finite lives are depreciated as an expense from transactions on a systematic basis over the asset’s useful life.
Depreciation is generally calculated on a straight line basis, at a rate that allocates the asset value, less any estimated residual value over its estimated useful life. Estimates of the remaining useful lives, residual value and depreciation method for all assets are reviewed at least annually, and adjustments made where appropriate. This depreciation charge is not funded by the Department of Health. Assets with a cost in excess of $1,000 are capitalised and depreciation has been provided on depreciable assets so as to allocate their cost or valuation over their estimated useful lives.
The following table indicates the expected useful lives of non‐current assets on which the depreciation charges are based.
2014 2013 Buildings Up to 40 years Up to 40 years Plant & Equipment Up to 10 years Up to 10 years Computers and Communication Up to 3 years Up to 3 years Furniture and Fitting Up to 10 years Up to 10 years Motor Vehicles Up to 5 years Up to 5 years Computer Software development Up to 5 Years Up to 5 Years
Tweddle Child & Family Health Services Audited Financial Statements 30 June 2014
Page 9 of 56
Intangible produced assets with finite lives are depreciated as an expense on a systematic basis over the asset’s useful life.
Amortisation
Amortisation is allocated to intangible non‐produced assets with finite useful lives on a systematic (typically straight‐line) basis over the asset’s useful life. Amortisation begins when the asset is available for use, that is, when it is in the location and condition necessary for it to be capable of operating in the manner intended by management. The consumption of intangible non‐produced assets with finite useful lives is classified as amortisation.
The amortisation period and the amortisation method for an intangible asset with a finite useful life are reviewed at least at the end of each annual reporting period. In addition, an assessment is made at each reporting date to determine whether there are indicators that the intangible asset concerned is impaired. If so, the asset concerned is tested as to whether its carrying value exceeds its recoverable amount.
Intangible assets with indefinite useful lives are not amortised, but are tested for impairment annually or whenever there is an indication that the asset may be impaired. The useful lives of intangible assets that are not being amortised are reviewed each period to determine whether events and circumstances continue to support an indefinite useful life assessment for that asset. In addition, the Health Service tests all intangible assets with indefinite useful lives for impairment by comparing the recoverable amount for each asset with its carrying amount:
● annually; and whenever there is an indication that the intangible asset may be impaired
Any excess of the carrying amount over the recoverable amount is recognised as an impairment loss.
Intangible assets with finite useful lives are amortised over a period up to 5 years.
(f) Scope and Presentation of Financial Comprehensive Operating Statement
The Comprehensive operating statement includes the subtotal entitled “Net Result Before Capital & Specific Items to enhance the understanding of the financial performance of Tweddle Child and Family Health Service. This subtotal reports the result excluding items such as capital grants; assets received or provided free of charge, depreciation, and items of an unusual nature and amount such as specific revenues and expenses. The exclusion of these items is made to enhance matching of income and expenses so as to facilitate the comparability and consistency of results between years and Victorian Public Health Services. The ‘Net Result Before Capital & Specific Items’ is used by the management of Tweddle Child and Family Health Service, the Department of Health and the Victorian Government to measure the ongoing performance of Health Services in operating hospital services.
Capital and specific items, which are excluded from this sub‐total, comprise:
Capital purpose income, which comprises all tied grants, donations and bequests received for the purpose of acquiring non‐current assets, such as capital works, plant and equipment or intangible assets. Consequently the recognition of revenue as capital purpose income is based on the intention of the provider of the revenue at the time the revenue is provided.
Tweddle Child & Family Health Services Audited Financial Statements 30 June 2014
Page 10 of 56

Depreciation and amortisation as described in Note 1 (e).
Expenditure using capital purpose income, comprises expenditure which either falls below the asset capitalisation threshold or doesn’t meet asset recognition criteria and therefore does not result in the recognition of an asset in the balance sheet, where funding for that expenditure is from capital purpose income.
Other Comprehensive income
Includes the realised and unrealised gains on the investment portfolio.
Balance Sheet
Assets and liabilities are categorised either as current or non current.
Statement of Changes in Equity
The statement of changes in equity presents reconciliations of each non owner and owner equity opening balance at the beginning of the reporting period to the closing balance of the end of the reporting period. It also shows separately changes due to amounts recognised in the comprehensive result and amounts recognised in other comprehensive income related to other non‐owner changes in equity.
Cash Flow Statement
Cash flows are classified according to whether or not they arise from operating activities, investing activities, or financing activities. This classification is consistent with requirements under AASB 107 Statement of Cash Flows.
(g) Change in accounting policies
AASB 13 Fair Value Measurement
AASB 13 establishes a single source of guidance for all fair value measurements. AASB 13 does not change when a health service is required to use fair value, but rather provides guidance on how to measure fair value under Australian Accounting Standards when fair value is required or permitted. Tweddle has considered the specific requirements relating to highest and best use, valuation premise, and principal (or most advantageous) market. The methods, assumptions, processes and procedures for determining fair value were revised and adjusted where applicable. In light of AASB 13, Tweddle has reviewed the fair value principles as well as its current valuation methodologies in assessing the fair value, and the assessment has not materially changed the fair values recognised.
AASB 13 has predominantly impacted the disclosures of Tweddle. It requires specific disclosures about fair value measurements and disclosures of fair values, some of which replace existing disclosure requirements in other standards, including AASB 7 Financial Instruments: Disclosures.
The disclosure requirements of AASB 13 apply prospectively and need not to be provided for comparative periods, before initial application. Consequently, comparatives of these disclosures have not been provided for 2012‐13, except for financial instruments, of which the fair value disclosures are required under AASB 7 Financial Instruments Disclosures.
Tweddle Child & Family Health Services Audited Financial Statements 30 June 2014
Page 11 of 56

AASB 119 Employee Benefits
In 2013‐14, Tweddle has applied AASB 119 Employee Benefits (Sep 2011, as amended), and related consequential amendments for the first time.
The revised AASB 119 changes the accounting for defined benefit plans and termination benefits. The most significant change relates to the accounting for changes in defined benefit obligation and plan assets. As the current accounting policy is for the Department of Treasury and Finance to recognise and disclose the State’s defined benefit liabilities in its financial statements, changes in defined benefit obligations and plan assets will have limited impact on Tweddle.
The revised standard also changes the definition of short‐term employee benefits. These were previously benefits that were expected to be settled within 12 months after the end of the reporting period in which the employees render the related service, however, short‐term employee benefits are now defined as benefits expected to be settled wholly within 12 months after the end of the reporting period in which the employees render the related service. As a result, accrued annual leave balances which were previously classified as short‐term employee benefits no longer meet this definition and are now classified as long‐term employee benefits. This has resulted in a change of measurement for the annual leave provision from an undiscounted to discounted basis.
Tweddle considers change in classification has not materially altered its measurement of the annual leave provision.
(h) Income from transactions
Income is recognised in accordance with AASB 118 Revenue and is recognised to the extent it is earned. Unearned income at reporting date is reported as income received in advance. Amounts disclosed as revenue are, where applicable, net of returns, allowances and duties and taxes.
Government Grants
Government Grants are recognised as income when Tweddle Child and Family Health Service gains control of the underlying assets in accordance with AASB 1004 Contributions. Yet a distinction is made between reciprocal. and non reciprocal grants. Where grants received in advance are reciprocal, revenue is deferred and reported as Income in Advance due to the non‐completion of the service at reporting date. The revenue is then recognised as performance occurs under the grant. Non‐reciprocal grants are recognised as revenue when Tweddle Child and Family Health Services gains control of transfer, that is, the grant is received or receivable. Conditional grants may be reciprocal or non reciprocal depending on the terms of the grant.
Indirect Contributions
Insurance is recognised as revenue following advice from the Department of Human Services.
Long Service Leave (LSL) Revenue is recognised upon finalisation of movements in LSL liability in line with the arrangements set out in the Acute Health Division Hospital Circular 05/2013.
Patient Fees
Patient fees are recognised as revenue at the time invoices are raised.
Tweddle Child & Family Health Services Audited Financial Statements 30 June 2014
Page 12 of 56

Donations and Other Bequests
Donations and bequests are recognised as revenue when received, except when specific reference is made to a financial year. If donations are for a special purpose, they may be appropriated to a reserve, such as specific restricted purpose reserve.
Dividend Revenue
Dividend revenue is recognised on a receivable basis.
Interest Revenue
Interest revenue is recognised on a proportionate basis that takes in account the effective yield of the financial asset.
(i) Financial Instruments
Where relevant, for note disclosure purposes, a distinction is made between those financial assets and financial liabilities that meet the definition of financial instruments in accordance with AASB 132 and those that do not.
Categories of non derivative financial instruments;
Loans and receivables
Loans and receivables are financial instrument assets with fixed and determinable payments that are not quoted on an active market. These assets are initially recognised at fair value plus any directly attributable transaction costs. Subsequent to initial measurement, loans and receivables are measured at amortised cost using the effective interest method, less any impairment.
Loans and receivables category includes cash and deposits (refer to Note 1(f)), term deposits with maturity greater than three months, trade receivables, loans and other receivables, but not statutory receivables.
Available for sale financial assets
Available for sale financial instrument assets are those designated as available for sale or not classified in any other category of financial instrument asset.
Such assets are initially recognised at fair value. Subsequent to initial recognition, they are measured at fair value with gains and losses arising from changes in fair value, recognised in other comprehensive income until the investments are disposed. Movements resulting from impairment and foreign currency changes are recognised in the net result.
Fair value is determined in the manner described in Note 7 Other Financial Assets. Available for sale category includes certain equity investments and those debt securities that are designated as available for sale. Financial instruments at fair value through profit or loss are initially measured at fair value and attributable transaction costs are expensed as incurred. Subsequently, any changes in fair value are recognised in the net result. Any dividend or interest on a financial asset is recognised in the net result from transactions.
Tweddle Child & Family Health Services Audited Financial Statements 30 June 2014
Page 13 of 56

Financial liabilities at amortised cost
Financial instrument liabilities are initially recognised on the date they are originated. They are initially measured at fair value plus any directly attributable transaction costs.
Subsequent to initial recognition, these financial instruments are measured at amortised cost with any difference between the initial recognised amount and the redemption value being recognised in profit and loss over the period of the interest bearing liability, using the effective interest rate method (refer to Note 17)
Financial instrument liabilities measured at amortised cost include all payables, deposits held and advances received, and interest bearing arrangements other than those designated at fair value through profit or loss.
(j) Assets
Cash and Cash Equivalents
Cash and cash equivalents comprise cash on hand and cash at bank, deposits at call and highly liquid investments with an original maturity date of three months or less, which are held for the purpose of meeting short term cash commitments rather than for investment purposes, which are readily convertible to known amounts of cash and are subject to insignificant risk of changes in value.
For the Cash Flow Statement presentation purposes, cash and cash equivalents includes bank overdrafts. Bank overdrafts are shown within borrowings in current liabilities in the Balance Sheet.
Receivables
Trade debtors are carried at nominal amounts due and are due for settlement within 30 days from the date of recognition. Collectability of debts is reviewed on an ongoing basis, and debts which are known to be uncollectible are written off. A provision for doubtful debts is raised where doubt as to collection exists. Bad debts are written off when identified.
Inventories
Inventories include goods and other property held either for sale or for distribution in the ordinary course of business operations. It excludes depreciable assets.
Inventories are measured at the lower of cost and net realisable value. Cost is determined principally by the first in, first out method.
Cost of Goods Sold
Costs of goods sold are recognised when the sale of an item occurs by transferring the cost or value of the item/s from inventories.
Other Financial Assets
Other financial assets are recognised and derecognised on trade date where purchase or sale of an investment is under a contract whose terms require delivery of the investment within the timeframe established by the market concerned, and are initially measured at fair value, net of transaction costs. Other financial assets are classified
Tweddle Child & Family Health Services Audited Financial Statements 30 June 2014
Page 14 of 56

between current and non‐current assets based on Tweddle Child and Family Health Service’s Board of Management’s intention at balance date with respect to the timing of disposal of each asset.
Tweddle Child and Family Health Service classifies its other financial assets as loans and receivables and available for sale assets. Investments are classified as current assets as each asset within the portfolio can be held for short to long periods before it is traded.
Other financial assets classified as being available for sale are stated at fair value. Gains and losses arising from changes in fair value are recognised directly in equity, until the investment is disposed of or is determined to be impaired, at which time to the extent appropriate, the cumulative gain or loss previously recognised in equity is included in the operating statement for the period.
Dividend revenue is recognised on an accrual basis. Interest revenue is recognised on a time proportionate basis that takes into account the effective yield on the financial asset.
Intangible Assets
Intangible assets represent identifiable non‐monetary assets without physical substance such as patents, trademarks, and computer software and development costs (where applicable). Intangible assets are initially recognised at cost. Subsequently, intangible assets with finite useful lives are carried at cost less accumulated amortisation and accumulated impairment losses. Costs incurred subsequent to initial acquisition are capitalised when it is expected that additional future economic benefits will flow to the entity.
Amortisation is allocated to intangible assets with finite useful lives on a straight line basis over the asset’s useful life. Amortisation begins when the asset is available for use, that is, when it is in the location and condition necessary for it to be capable of operating in the manner intended by management. The amortisation period and the amortisation method for an intangible asset with a finite useful life are reviewed at least at the end of each annual reporting period. In addition, an assessment is made at each reporting date to determine whether there are indicators that the intangible asset concerned is impaired. If so, the assets concerned are tested as to whether their carrying value exceeds their recoverable amount.
Property, Plant and Equipment
Crown Land is measured at fair value with regard to the property’s highest and best use after due consideration is made for any legal or constructive restrictions imposed on the asset, public announcements or comments made in relation to the intended use of the asset. Theoretical opportunities that may be available in relation to the asset(s) are not taken into account until it is virtually certain that any restrictions will no longer apply.
Land and Buildings are recognised initially at cost and subsequently measured at fair value less accumulated depreciation.
Plant, Equipment and Vehicles are measured initially at cost less accumulated depreciation and impairment.
Revaluations of Non‐Current Assets
Non‐current physical assets measured at fair value are revalued in accordance with FRD 103D. This revaluation process normally occurs every five years, as directed by timelines in FRD 103D which sets the next revaluation to occur in the year commencing 1 July 2018. Revaluation increments or decrements arise from differences between an asset’s carrying value and fair value.
Tweddle Child & Family Health Services Audited Financial Statements 30 June 2014
Page 15 of 56

Revaluation increments are credited directly to the asset revaluation reserve, except that, to the extent that an increment reverses a revaluation decrement in respect of that class of asset previously recognised as an expense in net result, the increment is recognised as revenue in the net result.
Revaluation decrements are recognised immediately as expenses in the net result, except that, to the extent that a credit balance exists in the asset revaluation reserve in respect of the same class of assets, they are debited directly to the asset revaluation reserve.
Revaluation increases and revaluation decreases relating to individual assets within class of property, plant and equipment are offset against one another within that class but are not offset in respect of assets in different classes.
Depreciation and Amortisation
Assets with a cost in excess of $1,000 are capitalised and depreciation has been provided on depreciable assets so as to allocate their cost or valuation over their estimated useful lives using the straight line method. Estimates of the remaining useful lives and depreciation method for all assets are reviewed at least annually. This depreciation charge is not funded by the Department of Human Services (DHS).
Net Gain/(Loss) on Non‐Financial Assets
Net gain/(loss) on non‐financial assets includes realised and unrealised gains and losses from revaluations, impairments and disposals of all physical assets and intangible assets.
Disposal of Non‐Financial Assets
Any gain or loss on the sale of non‐financial assets is recognised at the date that control of the asset is passed to the buyer and is determined after deducting from the proceeds the carrying value of the asset at that time.
Impairment of Assets
All assets are assessed annually for indications of impairment.
If there is an indication of impairment, the assets concerned are tested as to whether their carrying value exceeds their recoverable amount. Where an asset’s carrying value exceeds its recoverable amount, the difference is written off by a charge to the operating statement except to the extent that the write down can be debited to an asset revaluation reserve amount applicable to that class of asset.
It is deemed that, in the event of the loss of an asset, the future economic benefits arising from the use of the asset will be replaced unless a specific decision to the contrary has been made. The recoverable amount for most assets is measured at the higher of depreciated replacement cost and fair value less costs to sell. Recoverable amount for assets held primarily to generate net cash inflows is measured at the higher of the present value less costs to sell.
Tweddle Child & Family Health Services Audited Financial Statements 30 June 2014
Page 16 of 56

(k) Liabilities
Payables
These amounts consist predominantly of liabilities for goods and services. Payables are initially recognised at fair value, and then subsequently carried at amortised cost and represent liabilities for goods and services provided to the organisation prior to the end of the financial year that are unpaid, and arise when the organisation becomes obliged to make future payments in respect of the purchase of these goods and services. The normal credit terms are usually Net 30 days.
Provisions
Provisions are recognised when Tweddle Child and Family Health Service have a present obligation, the future sacrifice of economic benefits is probable, and the amount of the provision can be measured reliably.
The amount recognised as a provision is the best estimate of the consideration required to settle the present obligation at reporting date, taking into account the risks and uncertainties surrounding the obligation. Where a provision is measured using the cash flows estimated to settle the present obligation, its carrying amount is the present value of those cash flows.
Employee Benefits
Wages and Salaries, Annual Leave, Sick Leave and Accrued Days Off
Liabilities for wages and salaries, including non‐monetary benefits, annual leave, accumulating sick leave and accrued days off expected to be settled within 12 months of the reporting date are recognised in the provision for employee benefits in respect of employee’s services up to the reporting date, classified as current liabilities and measured at nominal values.
Those liabilities that Tweddle does not expect to settle within 12 months are recognised in the provision for employee benefits as current liabilities, measured at present value of the amounts expected to be paid when the liabilities are settled using the remuneration rate expected to apply at the time of settlement.
Long Service Leave
Under the revised AASB 119, employee benefits that are not expected to be wholly settled within 12 months are measured at present value while employee benefits that are expected to be wholly settled within 12 months, are measured at nominal value.
Non Current Liability‐conditional LSL (representing less than 10 years of continuous service) is disclosed as a non‐current liability. There is an unconditional right to defer the settlement until 10 years of service has been completed by an employee. Conditional LSL is required to be measured at present value.
Consideration is given to expect future wage and salary levels, experience of employee departures and periods of service. Expected future payments are discounted using interest rates of national Government guaranteed securities in Australia.
Tweddle Child & Family Health Services Audited Financial Statements 30 June 2014
Page 17 of 56

Superannuation
Defined contribution plans
Contributions to defined contribution superannuation plans are expenses when incurred.
Defined benefit plans
The amount charged to the Operating Statement in respect of defined benefit superannuation plans represents the contributions made by Tweddle Child and Family Health Service to the superannuation plan in respect of the services of current Tweddle Child and Family Health Service staff. Superannuation contributions are made to the plans based on the relevant rules of each plan.
Employees of Tweddle Child and Family Health Service are entitled to receive superannuation benefits and Tweddle Child and Family Health Service contributes to both the defined benefit and defined contribution plans. The defined benefit plan(s) provide benefits based on years of service and final average salary.
Tweddle Child and Family Health Service made contributions to the following major superannuation plans during the year:
Defined Benefit Plans 2014 2013
Health Super Pty Ltd 5,582 11,509
Defined contribution plans
Health Super Pty Ltd 115,985 130,696
Vision Super Pty Ltd 10,567 11,826
Trust Australia (HESTA) 75,974 59.726
T & L Kelly Super Fund 4,694 4,486
Australian Super 16,550 17,928
Other Super 61,091 47,306
Tweddle Child and Family Health Service does not recognise any unfunded defined benefit liability in respect of the superannuation plans because Tweddle Child and Family Health Service has no legal or constructive obligation to pay future benefits relating to its employees; its only obligation is to pay superannuation contributions as they fall due. The Department of Treasury and Finance administers and discloses the State’s defined benefit liabilities in its financial report.
Termination Benefits
Liabilities for termination benefits are recognised when a detailed plan for the termination has been developed and a valid expectation has been raised with those employees affected that the terminations will be carried out. The liabilities for termination benefits are recognised in other creditors unless the amount or timing of the payments is uncertain, in which case they are recognised as a provision.
On Costs
Tweddle Child & Family Health Services Audited Financial Statements 30 June 2014
Page 18 of 56

Employee benefits on costs (workers compensation, superannuation annual leave and LSL accrued while on LSL taken in service) are recognised separately from provision for employee benefits.
(l) Leases
A lease is a right to use an asset for an agreed period of time in exchange for payment.
Leases are classified at their inception as either operating or finance leases based on the economic substance of the agreement so as to reflect the risks and rewards incidental to ownership. We have only operating leases.
Operating leases
Rental income from operating lease is recognised on a straight‐line basis over the term of the relevant lease.
All incentives for the agreement of a new or renewed operating lease are recognised as an integral part of the net consideration agreed for the use of the leased asset, irrespective of the incentive’s nature or form or the timing of payments. In the event that lease incentives are given to the lessee, the aggregate cost of incentives are recognised as a reduction of rental income over the lease term, on a straight‐line basis unless another systematic basis is more appropriate of the time pattern over which the economic benefit of the leased asset is diminished.
Operating lease payments, including any contingent rentals, are recognised as an expense in the comprehensive operating statement on a straight line basis over the lease term, except where another systematic basis is more representative of the time pattern of the benefits derived from the use of the leased asset. The leased asset is not recognised in the balance sheet.
(m) Equity
Contributed Capital
Consistent with Australian Accounting Interpretation 1038 Contributions by Owners Made to Wholly‐Owned Public Sector Entities and FRD 119 Contributions by Owners, appropriations for additions to the net asset base have been designated as contributed capital. Other transfers that are in the nature of contributions or distributions that have been designated as contributed capital are also treated as contributed capital.
Property, Plant and Equipment Revaluation Reserve
The asset revaluation reserve is used to record increments and decrements on the revaluation of non‐current assets.
Financial Asset Available‐for‐Sale Revaluation Reserve
The available for‐sale revaluation reserve arises on the revaluation of available‐for‐sale financial assets. Where a re‐valued financial asset is sold, that portion of the reserve which relates to that financial asset is effectively realised, and is recognised in the operating statement. Where a revalued financial asset is impaired that portion of the reserve which relates to that financial asset is recognised in the operating statement.
Specific Restricted Purpose Reserve
Tweddle Child & Family Health Services Audited Financial Statements 30 June 2014
Page 19 of 56

A specific restricted purpose reserve is established where Tweddle Child and Family Health Service has possession or title to the funds but has no discretion to amend or vary the restriction and/or condition underlying the funds received.
(n) Commitments
Commitments for future expenditure include operating and capital commitments arising from contracts. These commitments are disclosed by way of a note (refer to Note 18 Commitments for expenditure) at their nominal value and inclusive of the GST payable. In addition, where it is considered appropriate and provides additional relevant information to users, the net present values of significant individual projects are stated. These future expenditures cease to be disclosed as commitments once the related liabilities are recognised in the balance sheet.
(o) Contingent assets and contingent liabilities
Contingent assets and contingent liabilities are not recognised in the balance sheet, but are disclosed by way of a note (refer to Note 22 Contingent assets and contingent liabilities) and, if quantifiable, are measured at nominal value. Contingent assets and liabilities are presented inclusive of GST receivable or payable respectively.
(p) Services Supported By Health Services Agreement and Services Supported By Hospital and
Community Initiatives
Activities classified as Services Supported by Health Services Agreement (HSA) are substantially funded by the Department of Human Services, while Services Supported by Hospital and Community Initiatives (Non HSA) are funded by Tweddle Child and Family Health Service’s own activities or local initiatives and/or the Commonwealth.
(q) Goods and Services Tax
Income, expenses and assets are recognised net of the amount of associated GST, unless the GST incurred is not recoverable from the taxation authority. In this case it is recognised as part of the cost of acquisition of the asset or as part of the expense. Receivables and payables are stated inclusive of the amount of GST receivable or payable. The net amount of GST recoverable from, or payable to, the taxation authority is included with other receivables or payables in the balance sheet.
Cash flows are presented on a gross basis. The GST components of cash flows arising from investing or financing activities which are recoverable from, or payable to the taxation authority, are presented as operating cash flow.
(r) Category Groups
Other Services excluded from Australian Health Care Agreement (AHCA) (Other) comprises revenue/expenditure for services not separately classified above, including: Public Health Services including Laboratory testing, Blood Borne Viruses / Sexually Transmitted Infections clinical services, Kooris liaison officers, immunisation and screening services, Drugs services including drug withdrawal, counselling and the needle and syringe program, Dental Health services including general and specialist dental care, school dental services and clinical education, Disability services including aids and equipment and flexible support packages to people with a disability, Community Care
Tweddle Child & Family Health Services Audited Financial Statements 30 June 2014
Page 20 of 56

programs including sexual assault support, early parenting services, parenting assessment and skills development, and various support services. Health and Community Initiatives also falls in this category group.
(s) Comparative Information
Where necessary, the previous year’s figures have been reclassified to facilitate comparisons.
Tweddle Child & Family Health Services Audited Financial Statements 30 June 2014
Page 21 of 56

Note 2: Revenue HSA HSA H&CI H&CI TOTAL TOTAL
2014 2013 2014 2013 2014 2013$ $ $ $ $ $
Revenue from Operating ActivitiesGovernment Grants - Department of Human Services : Acute Care Program 3,482,304 3,413,788 3,482,304 3,413,788 - Department of Human Services : Protective Services 390,825 384,089 147,375 119,376 538,200 503,465Day Stay Programs 50,176 42,945 50,176 42,945My Time Program 63,674 61,871 63,674 61,871Prison Program 9,890 8,548 9,890 8,548Psychology Services 23,978 31,759 23,978 31,759Play Steps 12,185 12,185Tweddle at Home - - - - Breast Feeding Program - 18,413 18,413Total Government Grants 3,873,129 3,797,877 307,278 282,912 4,180,406 4,080,789
Indirect Contributions by Department of Human Services 4,312 15,494 4,312 15,494Total Indirect Contributions by Department of Human Services 4,312 15,494 4,312 15,494
Specific Purpose ProgramsOther Revenue from Operating Activities 96,218 224,138 96,218 224,138Total Commercial Activities & Specific Purpose Funds 96,218 224,138 96,218 224,138
Donations and Bequests 85,220 41,244 85,220 41,244Total Revenue from Operating Activities 3,873,129 3,797,877 493,028 563,788 4,366,156 4,361,665
Revenue from Non-Operating ActivitiesInterest 2,437 5,684 2,437 5,684Other Revenue from Non-Operating Activities 6,103 6,103Sub-Total Revenue from Non-Operating Activities 2,437 11,787 2,437 11,787
Revenue from Capital Purpose IncomeNet Gain/(Loss) on Disposal of Other Financial Assets 565 3,552 565 3,552Capital Interest 72,137 72,137Capital Dividends 244,760 153,045 244,760 153,045
Property Income 9,702 9,000 9,702 9,000State Government Capital GrantSub-Total Revenue from Capital Purpose Income 255,027 237,734 255,027 237,734
Total Revenue from Continuing Operations (refer to note 2a) 3,873,129 3,797,877 750,492 813,309 4,623,620 4,611,186
Indirect contributions by Department of Human Services :Department of Human Services makes payments for Insurance and Long Service Leave on behalf of Tweddle Child and Family Health Service. These amountshave been brought to account in determining the operating result for the year by recording them as revenue and expenses.
Tweddle Child & Family Health Services Audited Financial Statements 30 June 2014
Page 22 of 56

Note 2a: Analysis of Revenue by Source
Acute Protective Day Stay My Time Prison Psychology Other TOTAL TOTALHealth Services Programs Program Program Services
2014 2014 2014 2014 2014 2014 2014 2014 2013$ $ $ $ $ $ $ $ $
Revenue from Services Supported by Health Services Agreement
Government Grants - Department of Human Services : Acute Care Program 3,482,304 - - - - - - 3,482,304 3,413,788 - Department of Human Services : Protective Services - 390,825 - - - - - 390,825 384,089 - Insurance 4,312 - - - - - - 4,312 15,494
Sub-Total Revenue from Services Supported by Health Services Agreement 3,486,615 390,825 - - - - - 3,877,440 3,813,371
Revenue from Services Supported by Hospital and Community InitiativesOperating Services :Protective Services : DHS Other Regions - 147,375 - - - - - 147,375 119,376Day Stay Programs - - 50,176 - - - - 50,176 42,945My Time Program - - - 63,674 - - - 63,674 61,871Prison Program - - - - 9,890 - - 9,890 8,548Breast Feeding Program - - - - - - - 18,413Psychology Services - - - - - 23,978 - 23,978 31,759Other - - - - - - 107,838 107,838 224,138
- 147,375 50,176 63,674 9,890 23,978 107,838 402,931 507,049Other Activities :Property Income - - - - - - 9,702 9,702 9,000Net Gain/(Loss) from Disposal of Other Financial Assets - - - - - - 565 565 3,552Donations & Bequests - - - - - - 85,785 85,785 41,244Interest - - - - - - 2,437 2,437 77,821Dividends & Dividend Imputation Credits - - - - - - 244,760 244,760 153,045Other - - - - - - 6,103
- - - - - - 343,249 343,249 290,765Sub-Total Revenue from Services Supported by Hospital and Community Initiatives - 147,375 50,176 63,674 9,890 23,978 451,087 746,180 797,814
Total Revenue from Operations 3,486,615 538,200 50,176 63,674 9,890 23,978 451,087 4,623,620 4,611,186
Indirect contributions by Department of Human Services: Department of Human Services makes payments for Insurance and Long Service Leave on behalf of Tweddle Child and Family Health Service. These amounts have beenbrought to account in determining the operating result for the year by recording them as revenue and expenses.
Tweddle Child & Family Health Services Audited Financial Statements 30 June 2014
Page 23 of 56

Note 2b ‐ Net Gain/(Loss) from Disposal of Other Financial Assets 2014 2013
$ $
Proceeds from Disposals of Non‐Current
Plant & Equipment ‐ Other Equipment 3552 Plant & Equipment ‐ Furniture & Fittings 565 Total Proceeds from Disposal of Non‐Current Assets 565 3552
Less: Written Down Value of Non Current Assets Sold
Plant & Equipment ‐ Other Equipment ‐ Plant & Equipment ‐ Furniture & Fittings ‐ Total Written Down Value of Non Current Assets Sold ‐ ‐
Net gain/(loss) on Disposal of Non‐Financial Assets 565 3552
--
-
Tweddle Child & Family Health Services Audited Financial Statements 30 June 2014
Page 24 of 56
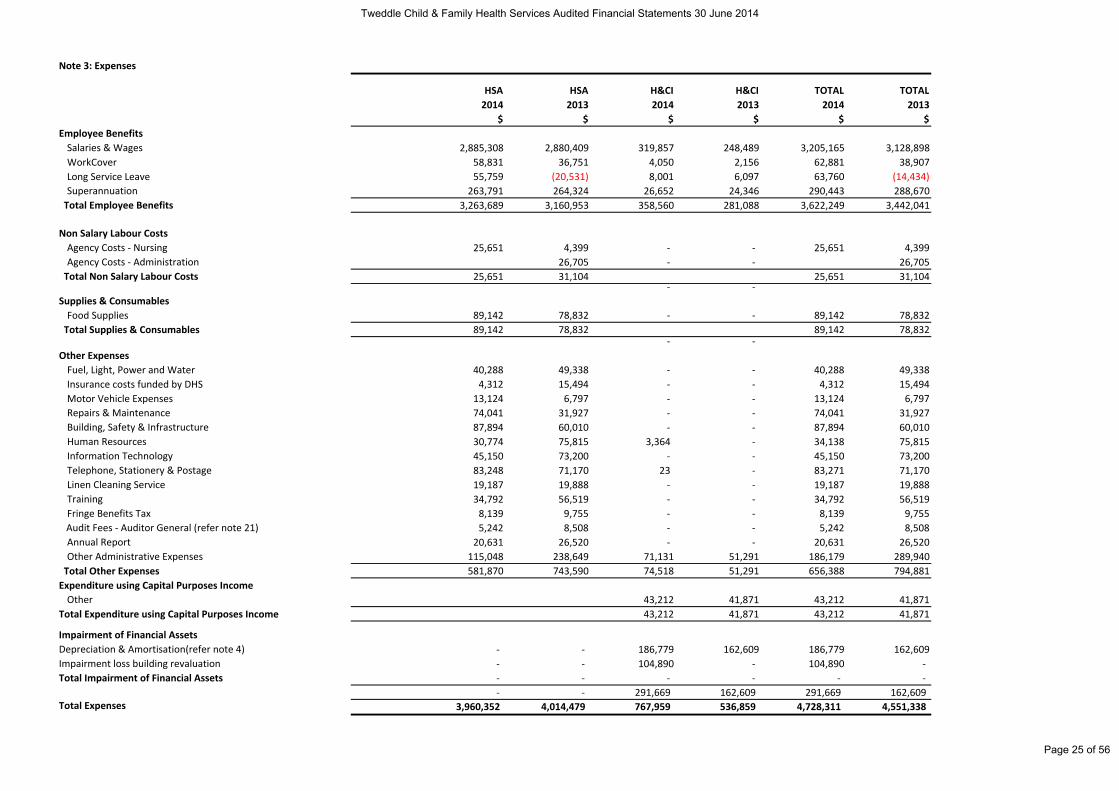
Note 3: Expenses
HSA HSA H&CI H&CI TOTAL TOTAL
2014 2013 2014 2013 2014 2013
$ $ $ $ $ $
Employee Benefits
Salaries & Wages 2,885,308 2,880,409 319,857 248,489 3,205,165 3,128,898
WorkCover 58,831 36,751 4,050 2,156 62,881 38,907
Long Service Leave 55,759 (20,531) 8,001 6,097 63,760 (14,434)
Superannuation 263,791 264,324 26,652 24,346 290,443 288,670
Total Employee Benefits 3,263,689 3,160,953 358,560 281,088 3,622,249 3,442,041
Non Salary Labour Costs
Agency Costs ‐ Nursing 25,651 4,399 ‐ ‐ 25,651 4,399
Agency Costs ‐ Administration 26,705 ‐ ‐ 26,705
Total Non Salary Labour Costs 25,651 31,104 25,651 31,104‐ ‐
Supplies & Consumables
Food Supplies 89,142 78,832 ‐ ‐ 89,142 78,832
Total Supplies & Consumables 89,142 78,832 89,142 78,832‐ ‐
Other Expenses
Fuel, Light, Power and Water 40,288 49,338 ‐ ‐ 40,288 49,338
Insurance costs funded by DHS 4,312 15,494 ‐ ‐ 4,312 15,494
Motor Vehicle Expenses 13,124 6,797 ‐ ‐ 13,124 6,797
Repairs & Maintenance 74,041 31,927 ‐ ‐ 74,041 31,927
Building, Safety & Infrastructure 87,894 60,010 ‐ ‐ 87,894 60,010
Human Resources 30,774 75,815 3,364 ‐ 34,138 75,815
Information Technology 45,150 73,200 ‐ ‐ 45,150 73,200
Telephone, Stationery & Postage 83,248 71,170 23 ‐ 83,271 71,170
Linen Cleaning Service 19,187 19,888 ‐ ‐ 19,187 19,888
Training 34,792 56,519 ‐ ‐ 34,792 56,519
Fringe Benefits Tax 8,139 9,755 ‐ ‐ 8,139 9,755
Audit Fees ‐ Auditor General (refer note 21) 5,242 8,508 ‐ ‐ 5,242 8,508
Annual Report 20,631 26,520 ‐ ‐ 20,631 26,520
Other Administrative Expenses 115,048 238,649 71,131 51,291 186,179 289,940
Total Other Expenses 581,870 743,590 74,518 51,291 656,388 794,881
Expenditure using Capital Purposes Income
Other 43,212 41,871 43,212 41,871
Total Expenditure using Capital Purposes Income 43,212 41,871 43,212 41,871
Impairment of Financial Assets
Depreciation & Amortisation(refer note 4) ‐ ‐ 186,779 162,609 186,779 162,609
Impairment loss building revaluation ‐ ‐ 104,890 ‐ 104,890 ‐ Total Impairment of Financial Assets ‐ ‐ ‐ ‐ ‐ ‐
‐ ‐ 291,669 162,609 291,669 162,609 Total Expenses 3,960,352 4,014,479 767,959 536,859 4,728,311 4,551,338
Tweddle Child & Family Health Services Audited Financial Statements 30 June 2014
Page 25 of 56

Note 3a: Analysis of Expenditure by Source
Acute Protective Day Stay My Time Prison Psychology Other TOTAL TOTAL
Health Services Programs Program Program Services
2014 2014 2014 2014 2014 2014 2014 2014 2013
$ $ $ $ $ $ $ $ $
Expenditure from Services Supported by Health Services Agreement
Employee Expenses 2,529,647 415,106 147,634 170,092 3,262,479 3,160,953
Non Salary Labour Costs 25,651 ‐ ‐ ‐ ‐ ‐ ‐ 25,651 31,104
Supplies & Consumables 485,560 99,417 19,199 ‐ ‐ 5,919 ‐ 610,095 845,477
Sub‐Total Expenditure from Services Supported by Health Services Agreement3,040,858 514,523 166,833 ‐ ‐ 176,011 ‐ 3,898,225 4,037,534
Expenditure from Services Supported by Hospital and Community Initiatives
Employee Expenses 82,606 30,434 70,712 19,138 14,922 73,829 291,641 258,032
Non Salary Labour CostsSupplies & Consumables ‐ 30,347 473 5,513 4,959 538 54,588 96,418 51,291
Sub‐Total Expenditure from Services Supported by Hospital and Community Initiatives ‐ 112,953 30,907 76,225 24,097 15,460 128,417 388,059 309,323 ‐
Expenditure using Capital Purposes Income
Other Expenses from Continuing Operations 107,146 ‐ ‐ ‐ ‐ ‐ 43,212 150,358 41,871
Sub‐Total Expenditure using Capital Purposes Income 107,146 ‐ ‐ ‐ ‐ ‐ 43,212 150,358 41,871 ‐ ‐ ‐ ‐ ‐ ‐
Other Expenditure ‐ ‐ ‐ ‐ ‐ ‐ Impairment of Non‐Financial Assets ‐ ‐ ‐ ‐ ‐ ‐ 104,890 104,890
Depreciation & Amortisation 186,779 ‐ ‐ ‐ ‐ ‐ 186,779 162,609
Specific Expenses ‐ ‐ ‐ ‐ ‐ ‐ Finance Costs ‐ ‐ ‐ ‐ ‐ ‐ Total Other Expenditure 186,779 ‐ ‐ ‐ ‐ ‐ 104,890 291,669 162,609 Total Expenditure 3,334,783 627,476 197,740 76,225 24,097 191,471 276,519 4,728,311 4,551,337
Tweddle Child & Family Health Services Audited Financial Statements 30 June 2014
Page 26 of 56

Note 4a: Depreciation
2014 2013
$ $
Buildings 51,175 48,198
Motor Vehicles 16,222 14,585
Computers and Communications 15,522 20,659
Other Plant & Equipment 20,985 20,930
Furniture and Fittings 3,725 4,916
Total Depreciation 107,629 109,288
Note 4b: Amortisation
Computer Software 79,150 53,321
Total Amortisation 79,150 53,321
Total Depreciation and Amortisation 186,779 162,609
Note 5: Cash and Cash Equivalents For the purposes of the Cash Flow Statement, cash and cash equivalents includes cash on hand and in banks, and short-term
deposits which are readily convertible to cash on hand, and are subject to an insignificant risk of change in value, net of outstanding bank overdrafts.
2014 2013
$ $
Cash On Hand 429 370
Cash at Bank 8,686 185,277 TOTAL 9,115 185,647
Represented by:
Cash for Tweddle Child and Family Health Service Operations 9,115 185,647
Cash for Monies Held in Trust - -
TOTAL 9,115 185,647
Cash for monies held in Trust is deposited in an 'At-Call' account and there is no risk of a change in value for this amount.
Tweddle Child & Family Health Services Audited Financial Statements 30 June 2014
Page 27 of 56

Note 6: Receivables 2014 2013
$ $
CURRENT
Contractual
Trade Debtors 64,615 31,183
Accrued Revenue - Other 34,296 35,225
98,911 66,408 Statutory
GST - Receivable 7,474 7,220 TOTAL CURRENT RECEIVABLES 106,385 73,628
TOTAL RECEIVABLES 106,385 73,628
(a) Ageing analysis of receivables
Please refer to note 15(b) for the ageing analysis of receivables
(b) Nature and extent of risk arising from receivables
Please refer to note 15(b) for the nature and extent of credit risk arising from receivables
Note 7: Other Financial Assets
Capital Fund TOTAL TOTAL 2014 2013 2014 2013
$ $ $ $
TOTAL 4,061,761 3,554,179 4,061,761 3,554,179
Represented by:
Tweddle Child and Family Health
Service Investments 4,061,761 3,554,179 4,061,761 3,554,179
TOTAL 4,061,761 3,554,179 4,061,761 3,554,179
(a) Ageing analysis of other financial assets
Please refer to note 15(b) for the ageing analysis of other financial assets
(b) Nature and extent of risk arising from other financial assets
Please refer to note 15(b) for the nature and extent of credit risk arising from other financial assets
Tweddle Child & Family Health Services Audited Financial Statements 30 June 2014
Page 28 of 56

Note 8 : Other Current Assets
2014 2013 $ $
CURRENT Prepayments 10,000 -
TOTAL OTHER CURRENT ASSETS 10,000 -
Tweddle Child & Family Health Services Audited Financial Statements 30 June 2014
Page 29 of 56

Note 9: Property, Plant & Equipment
2014 2013
$ $
Land
Crown Land 3,559,000 2,225,000 Freehold Land 1,020,000 720,000 Total Land at Fair Value 4,579,000 2,945,000
Buildings & Improvements
Buildings & Improvements at Fair Value 1,487,000 1,979,307 Less Accumulated Depreciation (181,491)
Total Buildings at Fair Value 1,487,000 1,797,816
Plant and Equipment
Motor Vehicles Motor Vehicles 74,066 74,066 Less Accumulated Depreciation (50,789) (33,763) Total Motor Vehicles at Fair Value 23,277 40,303
Computers and Communication Computers and Communication 250,478 229,465 Less Accumulated Depreciation (223,329) (207,804) Total Computers and Communication at Fair Value 27,149 21,661
Other Equipment Other Equipment 341,447 298,176 Less Accumulated Depreciation (212,111) (191,126) Total Other Equipment at Fair Value 129,336 107,050
Total Plant and Equipment 179,762 169,015
Furniture and Fittings Furniture and Fittings 200,700 194,060
Less Accumulated Depreciation (175,406) (171,680) Total Furniture and Fittings at Fair Value 25,294 22,380
TOTAL 6,271,056 4,934,211
-
Tweddle Child & Family Health Services Audited Financial Statements 30 June 2014
Page 30 of 56

Note 9 Property, Plant & Equipment (Continued)
Reconciliations of the carrying amounts of each class of asset at the beginning and end of the previous and current financial year is set out below.
Plant and Equipment
Land Buildings Motor Computers & Other Furniture & Total
Vehicles Communications Equipment Fittings
$ $ $ $ $ $ $
Balance at 30 June 2012 2,945,000 1,757,216 32,798 23,280 119,727 27,296 4,905,317
Additions 88,798 38,534 19,040 8,254 154,626
Disposals (16,444) (16,444)
Revaluation increments
Depreciation (note 4a) (48,198) (14,585) (20,659) (20,930) (4,916) (109,288)
Balance at 30 June 2013 2,945,000 1,797,816 40,303 21,661 107,050 22,380 4,934,211
Additions 29,254 21,010 43,271 6,639 100,174
Disposals (804) (805)
Revaluation increments 1,634,000 (288,895) 1,345,105
Depreciation (note 4a) (51,175) (16,222) (15,522) (20,985) (3,725) (107,629)
Balance at 30 June 2014 4,579,000 1,487,000 23,277 27,149 129,336 25,294 6,271,056
Tweddle Child & Family Health Services Audited Financial Statements 30 June 2014
Page 31 of 56

Note 9 Property, Plant & Equipment (Continued)
Note (i) Classified in accordance with the fair value hierarchy, see Note 1 There have been no transfers between levels during the period.
Non‐specialised land and non‐specialised buildings Non‐specialised land and non‐specialised buildings are valued using the market approach. Under this valuation method, the assets are compared to recent comparable sales or sales of comparable assets which are considered to have nominal or no added improvement value. For non‐specialised land and non‐specialised buildings, an independent valuation was performed by independent valuers Opteon to determine the fair value using the market approach. Valuation of the assets was determined by analysing comparable sales and allowing for share, size, topography, location and other relevant factors specific to the asset being valued. An appropriate rate per square metre has been applied to the subject asset. The effective date of the valuation is 30 June 2014. To the extent that non‐specialised land and non‐specialised buildings do not contain significant, unobservable adjustments, these assets are classified as Level 2 under the market approach.
Specialised land and specialised buildings The market approach is also used for specialised land and specialised buildings although is adjusted for the community service obligation (CSO) to reflect the specialised nature of the assets being valued. Specialised assets contain significant, unobservable adjustments; therefore these assets are classified as Level 3 under the market based direct comparison approach. The CSO adjustment is a reflection of the valuer’s assessment of the impact of restrictions associated with an asset to the extent that is also equally applicable to market participants. This approach is in light of the highest and best use consideration required for fair value measurement, and takes into account the use of the asset that is physically possible, legally permissible and financially feasible. As adjustments of CSO are considered as significant unobservable inputs, specialised land would be classified as Level 3 assets.
For the health services, the depreciated replacement cost method is used for the majority of specialised buildings, adjusting
Fair Value Measurement Hierarchy of Assets as at 30 June 2014 Carrying amount as
at 30 June 2014 Fair Value Measurement at the end of the
reporting period using:
Level 1(1) Level 2(1) Level 3(1)
Land
Crown Land at Fair Value 3,559,000 3,559,000 Freehold Land at Fair Value 1,020,000 1,020,000
Total Land at Fair Value 4,579,000 4,579,000
Buildings at Fair Value
Buildings at Fair Value 1,487,000 1,487,000
Total Buildings at Fair Value 1,487,000 1,487,000
Plant and Equipment
Motor Vehicles 23,277 23,277
Computers and Communication 27,150 27,150
Other equipment 129,336 129,336
Furniture and Fittings 25,294 25,294 Total Plant & Equipment at Fair Value 205,057 205,057
Carrying amount as at 30 June 2014 6,271,057 4,579,000 1,692,057
Tweddle Child & Family Health Services Audited Financial Statements 30 June 2014
Page 32 of 56

for the associated depreciation. As depreciation adjustments are considered as significant and unobservable inputs in nature, specialised buildings are classified as Level 3 for fair value measurements. An independent valuation of the Hospital’s specialised land and specialised buildings was performed by the Valuer‐General Victoria. The valuation was performed using the market approach adjusted for CSO. The effective date of the valuation is 30 June.
Vehicles The Health Service acquires new vehicles and at times disposes of them before completion of their economic life. The process of acquisition, use and disposal in the market is managed by the Health Service who set relevant depreciation rates during use to reflect the consumption of the vehicles. As a result, the fair value of vehicles does not differ materially from the carrying value (Depreciated cost).
Plant and equipment
Plant and equipment is held at carrying value (depreciated cost). When plant and equipment is specialised in use, such that it is rarely sold other than as part of a going concern, the depreciated replacement cost is used to estimate the fair value. Unless there is market evidence that current replacement costs are significantly different from the original acquisition cost, it is considered unlikely that depreciated replacement cost will be materially different from the existing carrying value.
There were no changes in valuation techniques throughout the period to 30 June 2014.
For all assets measured at fair value, the current use is considered the highest and best use.
Tweddle Child & Family Health Services Audited Financial Statements 30 June 2014
Page 33 of 56
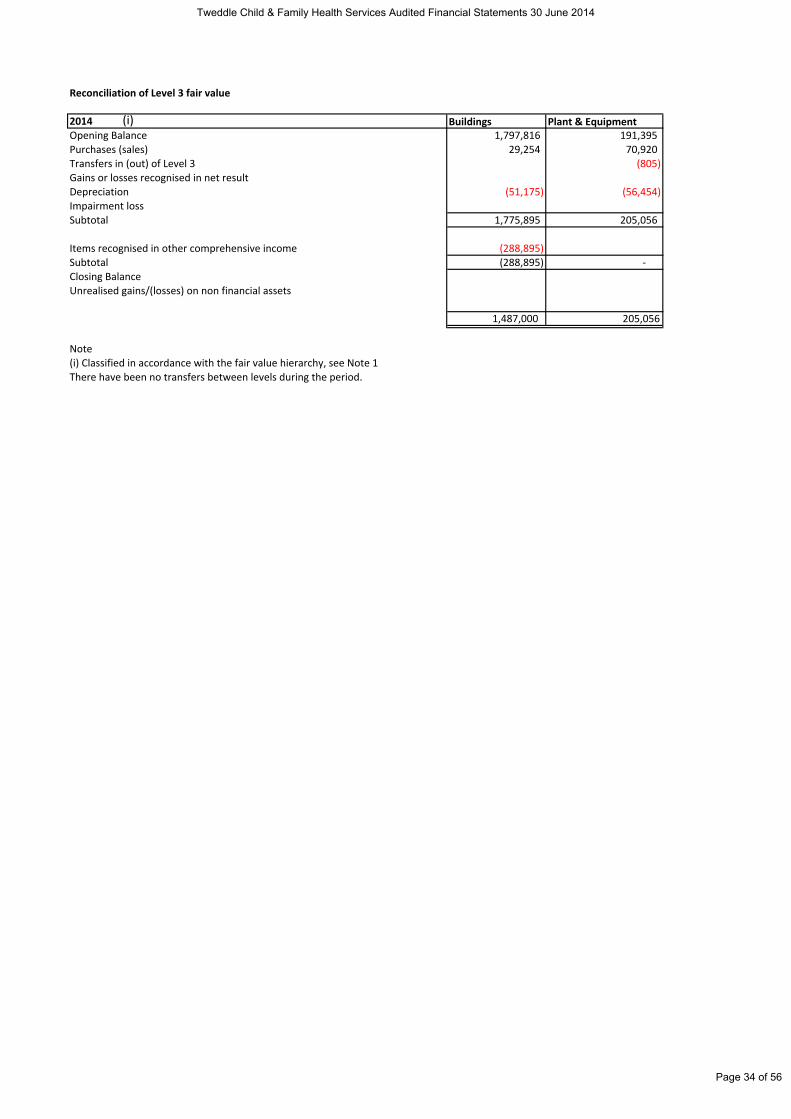
Reconciliation of Level 3 fair value
2014 Buildings Plant & EquipmentOpening Balance 1,797,816 191,395 Purchases (sales) 29,254 70,920 Transfers in (out) of Level 3 (805) Gains or losses recognised in net resultDepreciation (51,175) (56,454) Impairment lossSubtotal 1,775,895 205,056
Items recognised in other comprehensive income (288,895)Subtotal (288,895) ‐ Closing Balance Unrealised gains/(losses) on non financial assets
1,487,000 205,056
Note(i) Classified in accordance with the fair value hierarchy, see Note 1There have been no transfers between levels during the period.
(i)
Tweddle Child & Family Health Services Audited Financial Statements 30 June 2014
Page 34 of 56

Note 9 Property, Plant & Equipment (Continued)
Description of significant unobservable inputs to Level 3 valuations:Specialised Land Valuation technique Significant unobservable inputs Range (weighted
average) Sensitivity of
fair value measurement to
changes in significant
unobservable inputs
25 Thwaites Close, Highton Market/Direct Comparison approach
Sales evidence- Unit of value by comparative basis ($ per m2) 0%
72 Sydney Street, Footscray 3011 Market/Direct Comparison approach
Sales evidence- Unit of value by comparative basis ($ per m2) 0%
74 Sydney Street, Footscray 3011 Market/Direct Comparison approach
Sales evidence- Unit of value by comparative basis ($ per m2) 0%
76 Sydney Street, Footscray 3011 Market/Direct Comparison approach
Sales evidence- Unit of value by comparative basis ($ per m2) 0%
49-73 Adelaide Street, Footscray 3011 Market/Direct Comparison approach
Sales evidence- Unit of value by comparative basis ($ per m2) 0
Specialised Buildings
49-73 Adelaide Street, Footscray 3011 Market/Direct Comparison approach
Sales evidence- Unit of value by comparative basis ($ per m2) 0%
49-73 Adelaide Street, Footscray 3012 Cost Approach or DRC
Building Costs, Cost approach using best available evidence from recognised building cost indicators and or Quantity Surveyors and examples of current costs 0%
25 Thwaites Close, Highton Market/Direct Comparison approach
Sales evidence- Unit of value by comparative basis ($ per m2) 0%
26 Thwaites Close, Highton Cost Approach or DRC
Building Costs, Cost approach using best available evidence from recognised building cost indicators and or Quantity Surveyors and examples of current costs 0%
74 Sydney Street, Footscray 3011 Market/Direct Comparison approach
Sales evidence- Unit of value by comparative basis ($ per m2) 0%
74 Sydney Street, Footscray 3011 Cost Approach or DRC
Building Costs, Cost approach using best available evidence from recognised building cost indicators and or Quantity Surveyors and examples of current costs 0%
n/a
n/a
n/an/a
n/a
n/a
n/a
n/a
n/a
n/a
n/a
Tweddle Child & Family Health Services Audited Financial Statements 30 June 2014
Page 35 of 56

Plant and equipment at fair value
Valuation technique
Significant unobservable inputs Range (weighted average)
Sensitivity of fair value measurement to changes in significant unobservable inputs
Motor Vehicles Depreciated replacement cost Useful life of Motor Vehicles 3‐5 years (4 years)
Increase (decrease) in useful life would result in a significantly higher (lower) fair value
Motor Vehicles Cost Per Unit 10,000‐30,000 Increase (decrease) in gross replacement cost would result in a significantly higher (lower) fair value
Computers and Communication
Depreciated replacement cost
Useful life of Computers and Communication hardware 3‐5 years (4 years)
Increase (decrease) in useful life would result in a significantly higher (lower) fair value
Computers and Communication Cost Per Unit 1,000‐15,000
Increase (decrease) in gross replacement cost would result in a significantly higher (lower) fair value
Other equipment Depreciated replacement cost Useful life of Other Equipment 10‐15 years (12 years)
Increase (decrease) in useful life would result in a significantly higher (lower) fair value
Other equipment Cost Per Unit 1,000‐4,000 Increase (decrease) in gross replacement cost would result in a significantly higher (lower) fair value
Furniture and Fittings Depreciated replacement cost Useful life of Furniture and Fittings 10‐15 years (12 years)
Increase (decrease) in useful life would result in a significantly higher (lower) fair value
Furniture and Fittings Cost Per Unit 1,000‐4,000 Increase (decrease) in gross replacement cost would result in a significantly higher (lower) fair value
(i) CSO adjustments of 0% were applied to reduce the market approach value for the Department’s specialised land.
Tweddle Child & Family Health Services Audited Financial Statements 30 June 2014
Page 36 of 56

Note 10: Intangible Assets
2014 2013
$ $
Intangible Assets
Computer Software
Computer Software at Cost 373,060 335,490
Less Accumulated Amortisation (247,359) (168,209)
Total Intangible Assets 125,701 167,282
Reconciliations of the carrying amounts of each class of asset at the beginningand end of the previous and current financial year is set out below.
Computer
Software
$
Balance at 30 June 2012 201,483 Additions‐WIP 19,120 Amortisation (note 4b) (53,321)
Balance at 30 June 2013 167,282
Additions‐WIP 37,569 Amortisation (note 4b) (79,150)
Balance at 30 June 2014 125,701
Tweddle Child & Family Health Services Audited Financial Statements 30 June 2014
Page 37 of 56

Note 11: Payables
2014 2013 $ $
CURRENT
82,860 88,223 Contractual Trade Creditors Other Payables 84,086 434
166,946 88,657 Statutory GST Payable 6,620 4,113 PAYG Tax Payable 43,674 44,248
50,294 48,361 TOTAL 217,240 137,018
(a) Maturity analysis of payables Please refer to note 15(c) for the ageing analysis of payables
(b) Nature and extent of risk arising from payables Please refer to note 15(c) for the nature and extent of risks arising from payables
Tweddle Child & Family Health Services Audited Financial Statements 30 June 2014
Page 38 of 56

Note 12: Employee Benefits 2014 2013 $ $
Current Provisions Employee Benefits Annual Leave - Unconditional and expected to be settled within 12 months (ii) 186,796 241,511 - Unconditional and expected to be settled after 12 months (ii)
Long service leave 29,585 73,832 - Unconditional and expected to be settled within 12 months (ii), (iv)
-Unconditional and expected to be settled after 12 months (ii) (ii) 122,422
Provisions related to Employee Benefit On-Costs 174,889 153,642 - Unconditional and expected to be settled within 12 months (ii)
Total Current Provisions 513,692 468,985
Non Current Provisions 143,842 172,273 Employee Benefits
Total Non-Current Provisions 143,842 172,273
(a) Employee Benefits and Related On-Costs
246,019 241,511 115,666 153,642
Current Employee Benefits and related on-costs Annual Leave Entitlements (i) Accrued Wages and Salaries Unconditional Long Service Leave Entitlement (iv) 152,007 73,832
Non-Current Employee Benefits and related on-costs Conditional Long Service Leave Entitlements 143,842 172,273
Total Employee Benefits and Related On-Costs 657,534 641,258
(i) Employee benefits consist of annual leave and long service leave accrued by employees. On-costs such as payroll tax and worker's compensation insurance are (ii) The amounts disclosed are at present values
(iii) Employee benefits and are reflected as a separate provision.
(iv) Comparatives for provision of annual leave have been adjusted in response to the changed definition of short-term employee benefits under AASB 119
-
Tweddle Child & Family Health Services Audited Financial Statements 30 June 2014
Page 39 of 56
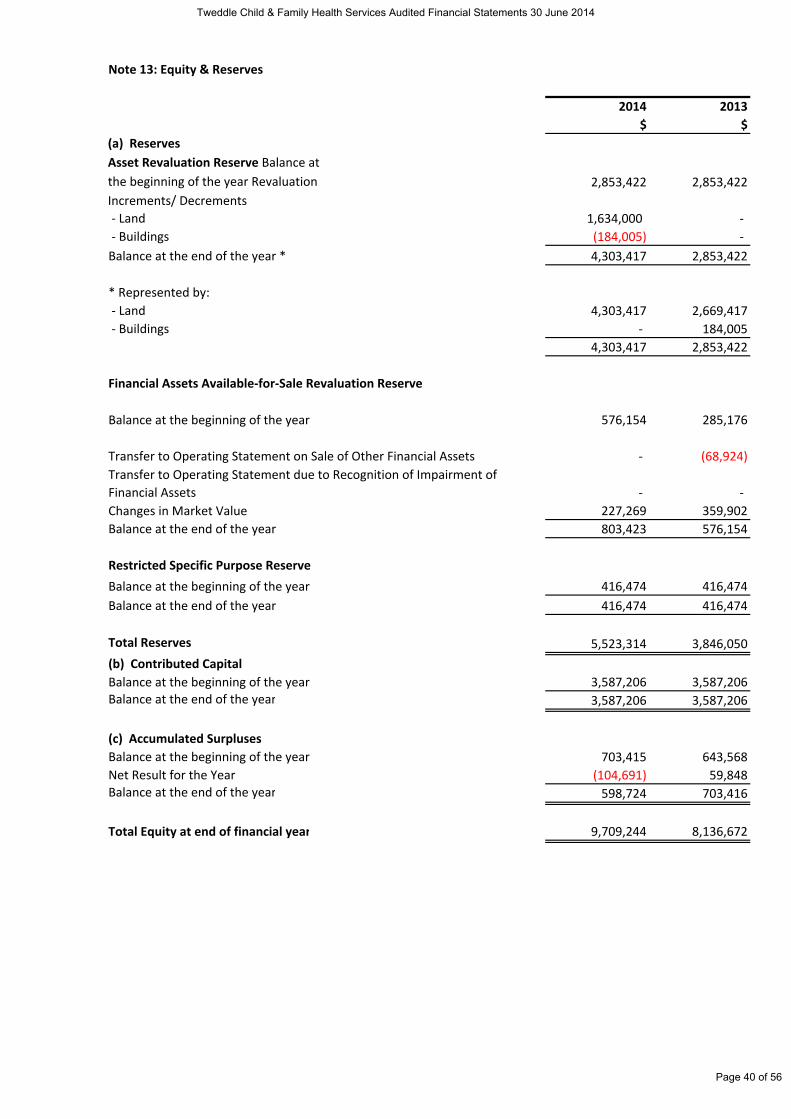
Note 13: Equity & Reserves
2014 2013
$ $
2,853,422 2,853,422
(a) Reserves
Asset Revaluation Reserve Balance at the beginning of the year Revaluation Increments/ Decrements ‐ Land 1,634,000 ‐ ‐ Buildings (184,005) ‐ Balance at the end of the year * 4,303,417 2,853,422
* Represented by: ‐ Land 4,303,417 2,669,417
‐ Buildings ‐ 184,005
4,303,417 2,853,422
Balance at the beginning of the year 576,154 285,176
Transfer to Operating Statement on Sale of Other Financial Assets ‐ (68,924)
Transfer to Operating Statement due to Recognition of Impairment of Financial Assets ‐ ‐ Changes in Market Value 227,269 359,902
Balance at the end of the year 803,423 576,154
Restricted Specific Purpose Reserve
Balance at the beginning of the year 416,474 416,474
Balance at the end of the year 416,474 416,474
Total Reserves 5,523,314 3,846,050
(b) Contributed Capital
Balance at the beginning of the year 3,587,206 3,587,206Balance at the end of the year 3,587,206 3,587,206
(c) Accumulated Surpluses
Balance at the beginning of the year 703,415 643,568
Net Result for the Year (104,691) 59,848Balance at the end of the year 598,724 703,416
Total Equity at end of financial year 9,709,244 8,136,672
Financial Assets Available‐for‐Sale Revaluation Reserve
Tweddle Child & Family Health Services Audited Financial Statements 30 June 2014
Page 40 of 56

Note 14: Reconciliation of Net Result for the Year to Net Cash Inflow/(Outflow) from Operating Activities
2014 2013$ $
Net Result for the Year (104,691) 59,848Depreciation & Amortisation 186,779 162,609Impairment Loss Building Renovation 104,890 Net (Gain)/Loss from Sale of Investments (179,501) (3,552)Change in Operating Assets & Liabilities :
Increase/(Decrease) in Payables 195,888 (20,917)Increase/(Decrease) in Provisions (99,390) (310,449)Increase/(Decrease) in Other Liabilities - (79,955)(Increase)/Decrease in Receivables (32,757) 68,211(Increase)/Decrease in Inventories - 29,690(Increase)/Decrease in Prepayments (10,000) 2,110
NET CASH INFLOW / (OUTFLOW) FROM OPERATING ACTIVITIES 61,218 (12,450)
Tweddle Child & Family Health Services Audited Financial Statements 30 June 2014
Page 41 of 56

Note 15: Financial Instruments
(a) Financial risk management objectives and policies Tweddle's principal financial instruments comprise of: (1) cash assets (2) term deposits (3) receivables excluding statutory receivables (4) investment in equities and managed investment schemes (5) payables excluding statutory payables
Details of the significant accounting policies and methods adopted, including the criteria for recognition, the basis of measurement and the basis on which income and expense are recognised, with respect to each class of financial asset, financial liability and equity instrument are disclosed in note 1 to the financial statements.
Tweddle's main financial risks include credit risk, liquidity risk, interest rate risk, and equity price risk. Tweddle manages these financial risks in accordance with its financial risk management policy. Tweddle uses different methods to measure and manage the risks. Primary responsibility rests with the Finance Audit & Risk Committee. Tweddle has minimal exposure to cash flow interest rate risks through its cash and deposits, term deposits and bank overdrafts that are at floating rate.
Tweddle Child & Family Health Services Audited Financial Statements 30 June 2014
Page 42 of 56

contractual financial assets/liabilities held for trading at fair value through
profit/loss contractual financial assets
loans receivables contractual financial
assets available for sale
contractual financial liabilities at amortised
cost Total $ $ $ $ $
9,115 9,115 64,615 64,615 34,296 34,296
4,061,761 4,061,761
2014 Contractual Financial Assets Cash and cash equivalents
‐ Trade Debtors
‐ Other Receivables
‐ Managed Investment Portfolio Total Financial Assets (i) 4,061,761 108,026 ‐ ‐ 4,169,787
166,946 166,946 Financial Liabilities
Payables
Total Financial Liabilities (ii) ‐ ‐ ‐ 166,946 166,946
$ $ $ $ $
185,647 185,647 ‐
31,183 31,183 35,225 35,225
3,554,178 3,554,178
2013 Contractual Financial Assets Cash and cash equivalents Receivables
‐ Trade Debtors
‐ Other Receivables
‐ Managed Investment Portfolio Total Financial Assets (i) 3,554,178 252,055 ‐ ‐ 3,806,233
88,657 88,657 ‐ 88,657 88,657
Financial Liabilities
Payables
Total Financial Liabilities (ii) ‐ ‐
(i) The total amount of financial assets disclosed here excludes statutory receivables(ii) The total amount of financial liabilities disclosed here excludes statutory payables (i.e. Taxes payable)
Categorisation of financial instruments
Details of each categories in accordance with AASB 139, shall be disclosed either on the face of
the balance sheet or in the notes.
Tweddle Child & Family Health Services Audited Financial Statements 30 June 2014
Page 43 of 56

Net Holding Gain/(Loss) on financial instruments by category
Net holding gain/ (loss)
Total interest income/ (expense)
Fee Income / (expense)
Impairment loss Total
$ $ $ $ $
- 2,437 - - 2,437
-
-
2014 Financial Assets Cash & Cash Equivalents Designated at Fair Value through Profit or Loss Held for Tradining at Fair Value through Profit & Loss Loans and Receivables Available for Sale (iii)
-
Receivables
507,582
- -
507,582
Total Financial Assets (i) - 510,019 - - 510,019 Financial Liabilities Designated at Fair Value through Profit or Loss Held for Tradining at Fair Value through Profit & Loss - - - At Amortised Cost - - - - Total Financial Liabilities (ii) - - - - -
- 11,787 - - 11,787 - -
-
-
2013 Financial Assets Cash & Cash Equivalents Designated at Fair Value through Profit or Loss Held for Tradining at Fair Value through Profit & Loss Loans and Receivables Available for Sale (iii) -
- -
Receivables -
284,241
- -
284,241
Total Financial Assets (i) 296,028 - - 296,028 Financial Liabilities Designated at Fair Value through Profit or Loss Held for Tradining at Fair Value through Profit & Loss - - - - - At Amortised Cost - - - - - Total Financial Liabilities (ii) - - - -
(i) For cash and cash equivalents, loans or receivables and available-for-sale financial assets, the net gain or loss is calculated by taking the movement in the fair value of the asset, interest revenue, plus or minus foreign exchange gains or losses arising from revaluation of the financial assets, and minus any impairment recognised in the net result;
(ii) For financial liabilities measured at amortised cost, the net gain or loss is calculated by taking the interest expense, plus or minus foreign exchange gains or losses arising from the revaluation of financial liabilities measured at amortised cost; and
(iii) For financial assets and liabilities that are held-for-trading or designated at fair value through profit or loss, the net gain or loss is calculated by taking the movement in the fair value of the financial asset or liability
-
-
Tweddle Child & Family Health Services Audited Financial Statements 30 June 2014
Page 44 of 56

(b) Credit risk exposures Credit risk arises from the contractual financial assets of the health service, which comprise cash and cash equivalents, non-statutory receivables and available for sale contractual financial assets. The health service's exposure to credit risk arises from the potential default of a counter party on their contractual obligations resulting in financial loss to the health service. Credit risk is measured at fair value and is monitored on a regular basis.
Credit risk associated with the health services contractual financial assets is minimal because the main debtor is the Victorian Government. For debtors other than the government, it is the health services policy to deal with entities with high credit ratings and to obtain sufficient collateral or credit enhancements where appropriate. As with the debtors policy, Tweddle policy is only to deal with banks with high credit ratings.
Provision of impairment is recognised when there is objective evidence that Tweddle will not be able to collect a receivable.
Except as otherwise detailed in the following table, the carrying amount of contractual financial assets recorded in the financial statements net of allowances for losses represents Tweddle's maximum exposure to credit risk without taking account of the value of any collateral obtained.
Credit quality of contractual financial assets that are neither past due or impaired
Financial Institutions (AA-
credit rating)
Other (min BBB Credit rating)
Total
2014 Financial Assets
Cash at Bank 8,686 429 9,115
Receivables (i) - 98,911 98,911
Other Financial Assets - 4,061,761 4,061,761 Total Financial Assets 8,686 4,161,101 4,169,787
2013 Financial Assets
Cash at Bank 185,277 - 185,277
Receivables (i) - 66,408 66,408
Other Financial Assets - 3,554,179 3,554,179 Total Financial Assets 185,277 3,620,587 3,805,864
(i) the total amount disclosed here excludes statutory amounts (e.g. amounts owing from Victorian Government and GST input tax recoverable).
Tweddle Child & Family Health Services Audited Financial Statements 30 June 2014
Page 45 of 56
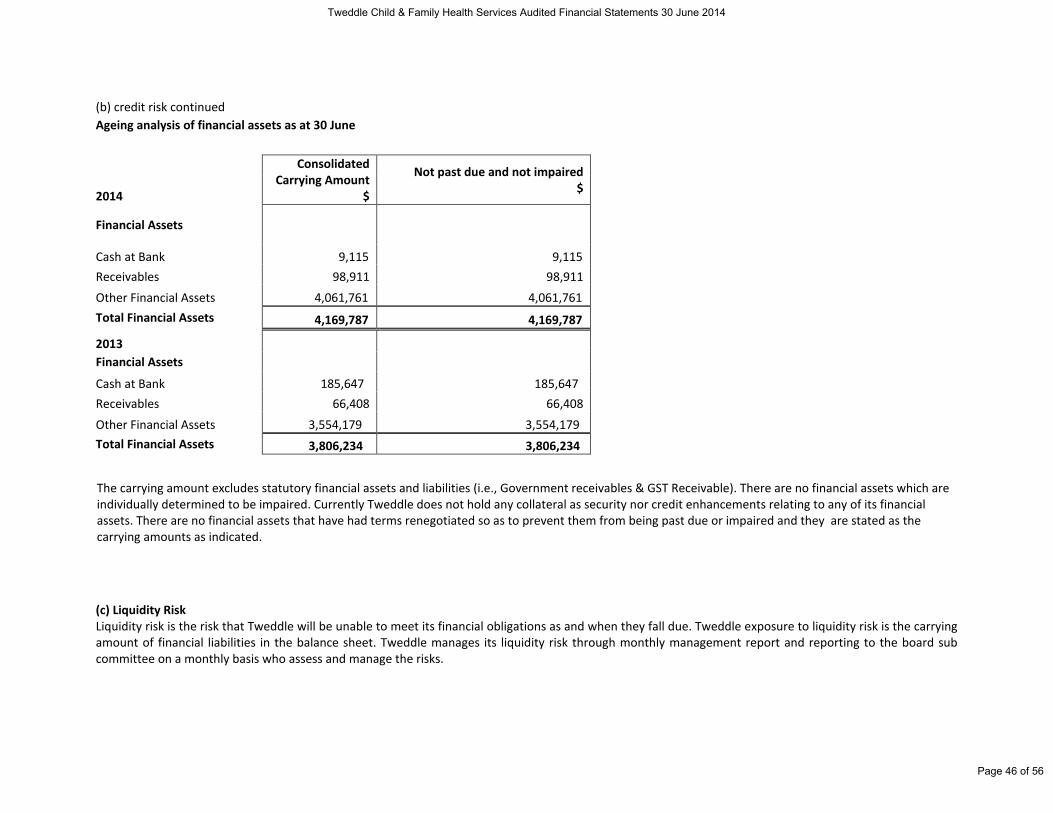
(b) credit risk continued Ageing analysis of financial assets as at 30 June
Consolidated Carrying Amount
$
Not past due and not impaired $ 2014
Financial Assets
Cash at Bank 9,115 9,115 Receivables 98,911 98,911 Other Financial Assets 4,061,761 4,061,761 Total Financial Assets 4,169,787 4,169,787
2013 Financial Assets
Cash at Bank 185,647 185,647 Receivables 66,408 66,408 Other Financial Assets 3,554,179 3,554,179 Total Financial Assets 3,806,234 3,806,234
The carrying amount excludes statutory financial assets and liabilities (i.e., Government receivables & GST Receivable). There are no financial assets which are individually determined to be impaired. Currently Tweddle does not hold any collateral as security nor credit enhancements relating to any of its financial assets. There are no financial assets that have had terms renegotiated so as to prevent them from being past due or impaired and they are stated as the carrying amounts as indicated.
(c) Liquidity Risk Liquidity risk is the risk that Tweddle will be unable to meet its financial obligations as and when they fall due. Tweddle exposure to liquidity risk is the carrying amount of financial liabilities in the balance sheet. Tweddle manages its liquidity risk through monthly management report and reporting to the board sub committee on a monthly basis who assess and manage the risks.
Tweddle Child & Family Health Services Audited Financial Statements 30 June 2014
Page 46 of 56

The following table discloses the contractual maturity analysis for Tweddle Child and Family Health Service's financial liabilities. For interest rates applicable to each class of liability refer to individual notes to the financial statements.
Interest rate exposure and maturity analysis of financial liabilities as at 30/06/2014
TOTAL Carrying Amount $ Nominal Amount $
Maturity Dates
2014 Less than 1 month
$ Payables
Trade creditors and accruals 166,946 166,946 166,946
Total Payables 166,946 166,946 166,946
TOTAL Carrying Amount $ Nominal Amount $
Maturity Dates
2013 Less than 1 month
$ Payables
Trade creditors and accruals 88,657 88,657 88,657
Total Payables 88,657 88,657 88,657
The carrying amount excludes statutory financial assets and liabilities (i.e., GST Payable)
Tweddle Child & Family Health Services Audited Financial Statements 30 June 2014
Page 47 of 56

*WeightedAverage
Effective Interest Rates %
TOTAL Carrying Amount $
Interest Rate Exposure
2014 Fixed Interest Rate Variable Interest
Rate Non Interest Bearing Financial Assets Cash at Bank 2.00% 9,115 - 8,686 429 Receivables 98,911 - 98,911 Other Financial Assets 4,061,761 - 4,061,761 Total Financial Assets 4,169,787 - 8,686 4,161,101
2014 Payables Trade creditors and accruals 166,946 - - 166,946 Total Payables 166,946 - - 166,946
*WeightedAverage
Effective Interest Rates %
TOTAL Carrying Amount $
Interest Rate Exposure
2013 Fixed Interest Rate Variable Interest
Rate Non Interest Bearing Financial Assets Cash at Bank 2.00% 185,647 - 185,277 Receivables 66,408 - 66,408 Other Financial Assets 3,554,179 - 3,554,179
Total Financial Assets 3,806,234 - 185,277 3,620,957
2013 Payables Trade creditors and accruals 88,657 - 88,657 Total Payables 88,657 - - 88,657 *Weighted average or effective interest rates for each class of asset.
370
Tweddle Child & Family Health Services Audited Financial Statements 30 June 2014
Page 48 of 56

(d) Market Risk Currency Risk As Tweddle Child & Family Health Service does not hold any international instruments it is not affected by any movements in foreign currency.
Interest Rate Risk We are not exposed to interest bearing liabilities.
Other Price Risk Exposure to other price risk might arise primarily through a change in the Market Value of Tweddle Child & Family Health Service's investments in Shares in Publicly Listed Companies. Sensitivity Disclosure Analysis Taking into account past performance, future expectations, economic forecasts, and management's knowledge and experience of the financial markets, Tweddle Child & Family Health Service believes the following movements are 'reasonably possible' over the next 12 months (Base rates are sourced from the Commonwealth Bank of Australia). -A parallel shift of 6% in market interest rates from year-end rates. - A parallel shift of 15% in market movements from year end share market positions.
The following table discloses the impact on net operating result and equity for each category of financial instrument held by Tweddle Child & Family Health Service at year end as presented to key management personnel, if changes in the relevant risk occur.
Tweddle Child & Family Health Services Audited Financial Statements 30 June 2014
Page 49 of 56

Interest Rate Risk Other Price Risk
Carrying Amount $
-6% +6% -15% +15%
2014 Profit
$ Equity
$ Profit
$ Equity
$ Assets Equity
$ Assets
$ Equity
$
Financial Assets -
Cash at Bank 8,686 (521) (521) 521 521 - - - -
Receivables 98,911 - - - - - - -
Other Financial Assets:
- Managed Investments 4,061,761 - - - - (609,264) (609,264) 609,264 609,264 Payables - - - -
Trade creditors and accruals 166,490 - - - - - - -
Interest Rate Risk Other Price
Risk
Carrying Amount $
-6% 6% -15% +15%
2013 Profit
$ Equity
$ Profit
$ Equity
$ Assets Equity Assets Equity
Financial Assets -
Cash at Bank 185,277 (11,117) (11,117) (11,117) (11,117) - - - -
Receivables 66,408 - - - - - - -
Other Financial Assets: - -
- Managed Investments 3,554,179 - - - - (533,127) (533,127) 533,127 533,127 Payables
Trade creditors and accruals 88,657 - - - - - - -
The carrying amount excludes statutory financial assets and liabilities (i.e., GST Receivable and Payable)
Tweddle Child & Family Health Services Audited Financial Statements 30 June 2014
Page 50 of 56

(e) Fair Value
The fair values and net fair values of financial instrument assets and liabilities are determined as follows:• Level 1 - the fair value of financial instrument with standard terms and conditions and traded in active liquid markets are determined with reference to quoted market prices;• Level 2 - the fair value is determined using inputs other than quoted prices that are observable for the financial asset or liability, either directly or indirectly; and• Level 3 - the fair value is determined in accordance with generally accepted pricing models based on discounted cash flow analysis using unobservable market inputs. Fair value of these is determined by projecting future cash inflows from expected future dividends and subsequent disposal of the securities. These cash flows are then discounted back to their present value using a discount rate of 4.75% . Tweddle considers that the carrying amount of financial instrument assets and liabilities recorded in the financial statements to be a fair approximation of their fair values, because of the short-term nature of the financial instruments and the expectation that they will be paid in full. The following table shows that the fair values of most of the contractual financial assets and liabilities are the same as the carrying amounts.
Comparison between carrying amount and fair value Consolidated
Carrying Amount Fair Value Consolidated
Carrying Amount Fair Value
2014 2014 2013 2013
$ $ $ $ Financial Assets
Cash at Bank 9,115 9,115 185,647 185,647
Receivables 98,911 98,911 66,408 66,408
Other Financial Assets:
- Managed Investments 4,061,761 4,061,761 3,554,179 3,554,179
Total Financial Assets 4,135,062 4,135,062 3,806,234 3,806,234 Payables
Trade creditors and accruals 166,946 166,946 88,657 88,657
Total Financial Liabilities 166,946 166,946 88,657 88,657
The carrying amount excludes statutory financial assets and liabilities (i.e., Government receivables & GST Receivable).
Tweddle Child & Family Health Services Audited Financial Statements 30 June 2014
Page 51 of 56

Financial assets measured at fair value Carrying Amount as at 30 June
Fair value measurement at end of reporting period using:
$ $ $ $
Level 1 Level 2 Level 3
2014 Financial Assets at fair value through profit & loss Other Financial Assets:
- Managed Investments 4,061,761 4,061,761
Total Financial Assets 4,061,761 4,061,761 - -
2013 Financial Assets at fair value through profit & loss Other Financial Assets:
- Managed Investments 3,554,179 3,554,179
Total Financial Assets 3,554,179 3,554,179 - -
*There is no significant transfer between level 1 and level 2
The managed investment portfolio is measured and evaluated by the Finance Audit & Risk committee on monthly basis.
Tweddle Child & Family Health Services Audited Financial Statements 30 June 2014
Page 52 of 56
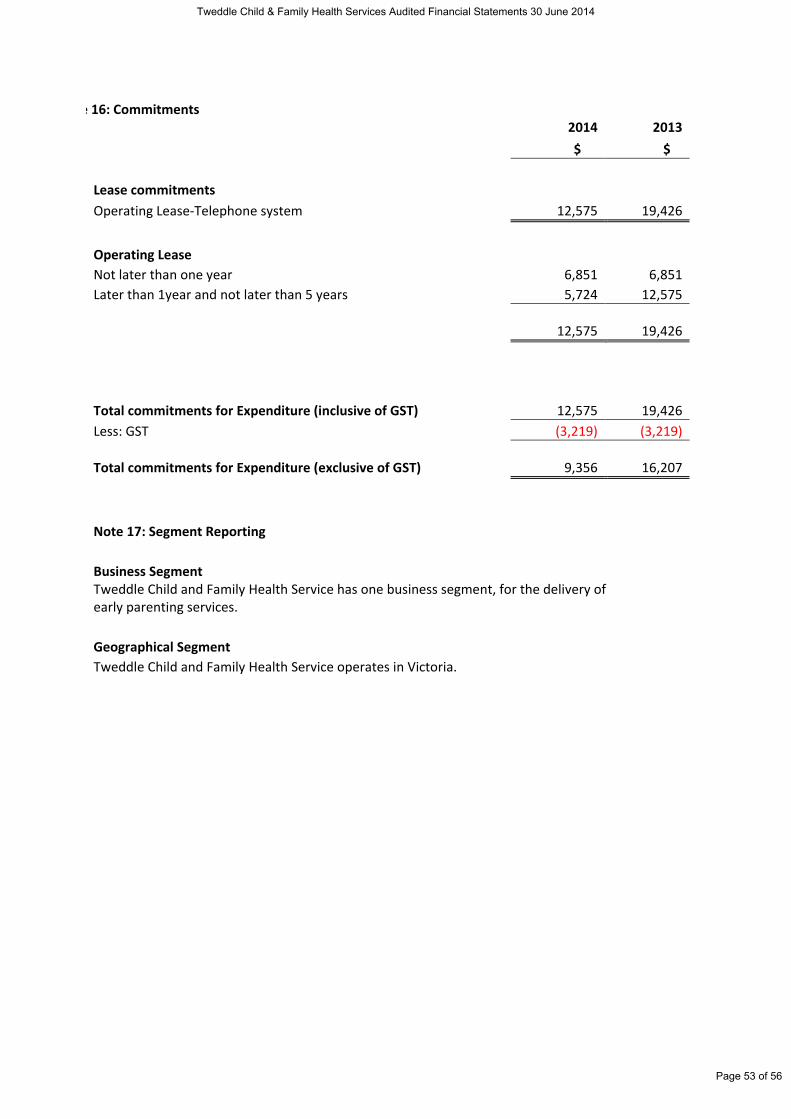
e 16: Commitments 2014 2013 $ $
Lease commitments Operating Lease-Telephone system 12,575 19,426
Operating Lease Not later than one year 6,851 6,851 Later than 1year and not later than 5 years 5,724 12,575
12,575 19,426
Total commitments for Expenditure (inclusive of GST) 12,575 19,426 Less: GST (3,219) (3,219)
Total commitments for Expenditure (exclusive of GST) 9,356 16,207
Note 17: Segment Reporting
Business Segment Tweddle Child and Family Health Service has one business segment, for the delivery of early parenting services.
Geographical Segment Tweddle Child and Family Health Service operates in Victoria.
Tweddle Child & Family Health Services Audited Financial Statements 30 June 2014
Page 53 of 56

Note 18: Responsible Persons Disclosures
In accordance with the Ministerial Directions issued by the Minister for Finance under the Financial Management Act 1994, the following disclosures are made regarding responsible persons for the reporting period.
Period Responsible Minister
The Honourable David Davis, MP, Minister for Health 1/07/2013- 30/06/2014
Governing Boards
Ms N Milburn ( Chairperson) 1/07/2013- 30/06/2014 Ms M Howard (Deputy Chair) 1/07/2013- 30/06/2014 Mr M Wild (Treasurer) 1/07/2013- 30/06/2014 Ms L Black 1/07/2013- 30/06/2014 Ms M Dawson-Smith 1/07/2013- 30/06/2014
Ms S Gannon 1/07/2013- 30/06/2014
DR C Orkin 1/07/2013- 30/06/2014
Ms H Johnson-Way 26/9/2013-30/06/2014
Ms Melanie Telford 26/9/2013-30/06/2014
Ms D Nelson 26/9/2013-30/06/2014
Board members resigned as of 30 June 2014; Ms S Gannon, Dr C Orkin
Accountable Officers
Ms. J. O'Brien - Chief Executive Officer 1/07/2013- 30/06/2014
Other Personnel - Contractors with significant Management Responsibilities - NIL
Remuneration of Responsible Persons
The number of Responsible Persons are shown in their relevant income bands;
2014 2013 Income Band
No. No. $0 - $9,999 9 12 $130.000 -$149,999 1 0 $160,000 - $169,999 - - $200,000 -$209,999 - 1 Total Numbers 10 13
$ $ Total remuneration received or due and receivable by Responsible Persons from the reporting entity amounted to:
134,952 163,311
Amounts relating to Responsible Ministers are reported in the financial statements of the Department of Premier and Cabinet. Members of the Board of Management all hold honorary positions.
Other Transactions of Responsible Persons and their Related Parties. There were no transactions with Responsible Persons and related parties.
Tweddle Child & Family Health Services Audited Financial Statements 30 June 2014
Page 54 of 56

Note 19: Remuneration of Auditors 2014 2013
$ $ Audit fees paid or payable to the Victorian Auditor-General's Office for audit of the Tweddle Child and Family Health Service current financial report
Audit or review of financial statement 9,000 11,108
Note 20: Events Occurring After the Balance Sheet Date
No matters or circumstances have arisen since the end of the financial year which significantly effect the operations of Tweddle.
Tweddle Child & Family Health Services Audited Financial Statements 30 June 2014
Page 55 of 56

NNoottee 2211:: SSuummmmaarryy ooff ffiinnaanncciiaall rreessuullttss
2014 2013 2012 2011 2010
$ $ $ $ $
Total Revenue 4,623,620 4,611,186 4,702,806 4,617,630 4,742,748
Total Expenses (4,728,311) (4,551,338) 4,691,957 4,675,158 4,644,175
Operating Surplus/ (Deficit) (104,691) 59,848 10,849 (57,528) 98,573
Accumulated Surplus 598,724 703,415 643,567 632,718 690,246
Total Assets 10,584,018 8,914,947 8,975,442 8,906,589 9,050,115
Total Liabilities 874,774 778,276 1,189,597 955,974 1,102,689
Net Assets 9,709,244 8,136,671 7,785,845 7,950,615 7,947,426
Total Equity 9,709,244 8,136,671 7,785,845 7,950,615 7,947,426
Net Cash flows from Operating Activities 61,218 (12,450) 396,092 (56,015) 237,501
Note 22: Contingent Assets & Liabilities
There are no contingent assets or liabilities
Tweddle Child & Family Health Services Audited Financial Statements 30 June 2014
Page 56 of 56