tvet needs assessment for awdp needs assessment for awdp supply and demand in afghanistan’s six...
TRANSCRIPT

TVET Needs Assessment for AWDP
Supply and Demand in Afghanistan’s Six Largest Cities
April 2012

1
This report was produced for review by the United States Agency for International Development (USAID). It was
prepared under contract with Strategic Social. The report was prepared in cooperation with Daniel Enterline
(Research Director), Anne-Marine Vanier (Research Operations), Clark Letterman (Data Cleansing), Sarah
Khederian and Clint Hougen (Analysts), under contract with Strategic Social.
This report was Contracted under USAID Contract Number 306-C-00-12-00539 Kabul Office Strategic Social House # 4159, Lab-e-Jar, Kabul Afghanistan Corporate Headquarters 1911 North Fort Myer Drive Suite 600 Arlington, VA 22209 DISCLAIMER: The views expressed in this report are those of the authors and do not necessarily reflect the views of the
Government of Afghanistan, USAID, or any other organization or person associated with this project.
AKNOWLEDGEMENT: Strategic Social Survey Team gratefully acknowledges the support of USAID/OEG for their support and advice at
each stage of this research. The Survey Team would also like to acknowledge the cooperation and assistance of
the Central Statistics Office, the Ministry of Labor, Social Affairs, Martyrs and Disabled, the Ministry of
Commerce, the Afghan Investment Support Agency, the TVET Directory of the Ministry of Education, the
National Skills Development Program and ASMED.

2
Contents ACRONYMS & ABBREVIATIONS ..................................................................................................................................4
1.0 EXECUTIVE SUMMARY ..........................................................................................................................................5
2.0 INTRODUCTION ....................................................................................................................................................9
2.1 Background .......................................................................................................................................................9
2.2 Objectives and Methodology ........................................................................................................................ 11
2.2.1 Research Objectives ............................................................................................................................... 11
2.2.2 Literature Review ................................................................................................................................... 11
2.2.2 Research Instrument .............................................................................................................................. 11
2.2.1 Sampling Size and Sampling Frame ........................................................................................................ 11
2.2.3 Field Research ......................................................................................................................................... 12
2.2.4 Analysis and Compliance with USAID’s Data Quality Standards ............................................................ 13
2.2.5 Survey Limitations .................................................................................................................................. 13
3.0 SME DEMOGRAPHICS ........................................................................................................................................ 15
3.1 Industries ....................................................................................................................................................... 15
3.2 Business Size .................................................................................................................................................. 17
3.3 Gender ........................................................................................................................................................... 19
3.4 Age ................................................................................................................................................................. 20
4.0 GENERAL PERCEPTION OF ECONOMIC SITUATION ........................................................................................... 22
4.1 Business and Economic Performance ............................................................................................................ 22
4.1.1 Explanations for Positive Changes .......................................................................................................... 23
4.1.2 Explanations for Negative Changes ........................................................................................................ 24
4.2 Health of Business ......................................................................................................................................... 24
4.2.1 Perception .............................................................................................................................................. 24
4.2.2 Intent to Hire .......................................................................................................................................... 26
5.0 DEMAND ............................................................................................................................................................ 29
5.1 Demand for Skilled Workers .......................................................................................................................... 29
5.1.1. Skilled Worker Demand by City ............................................................................................................. 29
5.1.2 Skilled Worker Demand by Industry ....................................................................................................... 31
5.2 Demand for Training ...................................................................................................................................... 31
5.2.1 Training Demand by City ........................................................................................................................ 32

3
5.2.2 Training Demand by Industry ................................................................................................................. 33
5.3 Demand for Skills ........................................................................................................................................... 33
5.3.1 Demand for Skills by City ........................................................................................................................ 34
5.3.2 Demand for Skills by Industry ................................................................................................................. 36
6.0 SUPPLY ............................................................................................................................................................... 40
6.1 National Supply.............................................................................................................................................. 40
6.2 Regional Supply ............................................................................................................................................. 41
6.3 Supply by Industry ......................................................................................................................................... 41
6.4 Demand for Foreign Labor............................................................................................................................. 42
6.4.1 Demand for Foreign Labor by Region ..................................................................................................... 43
6.4.2 Demand for Foreign Labor by Industry .................................................................................................. 44
7.0 BARRIERS and OPPORTUNITIES FOR TVET ........................................................................................................ 45
7.1 Barriers for TVET ............................................................................................................................................ 45
7.1.1 Awareness .............................................................................................................................................. 45
7.1.2 Perception toward TVET Services ........................................................................................................... 47
7.1.3 Financial Motivation ............................................................................................................................... 49
7.2 Opportunities for TVET .................................................................................................................................. 51
7.2.2 Perceived Profitability ............................................................................................................................ 51
7.2.1 Time ........................................................................................................................................................ 53
PRELIMINARY CONCLUSIONS .................................................................................................................................. 56
APPENDIX 1 – GRAPHS AND TABLES BY CITY AND INDUSTRY – SME Survey .......................................................... 58
APPENDIX 2 – GRAPHS AND TABLES BY CITY AND INDUSTRY – LM Survey ............................................................ 65
APPENDIX 3 – BIBLIOGRAPHY .................................................................................................................................. 68
APPENDIX 4 – VISITED WEBSITES ............................................................................................................................ 69

4
ACRONYMS & ABBREVIATIONS
AIMS Afghanistan Information Management Services
ADB Asia Development Bank
AISA Afghanistan Investment Support Agency
ANDS Afghanistan National Development Strategy
AWDP Afghanistan Workforce Development Program
CIPE Center for International Private Enterprise
DM TVET Deputy Ministry Technical and Vocational Education and Training
GDP Gross Domestic Product
GIRoA Government of the Islamic Republic of Afghanistan
ILO International Labor Organization
IRC International Rescue Committee
ISAF International Security Assistance Force
LM Labor Market
LMIAU Labor Market Information and Analysis Unit
MoE Ministry of Education
MoHE Ministry of Higher Education
MoLSAMD Ministry of Labor, Social Affairs, Martyrs and Disabled
NSDP National Skills Development and Market Linkages Project
NGO Non-Governmental Organizations
OEG Office of Economic Growth
SME Small and Medium Enterprises
TVET Technical and Vocational Education and training
USAID United States Agency for International Development
USG United States Government
WB World Bank

5
1.0 EXECUTIVE SUMMARY
The Afghanistan Labor Market (LM) and Small &
Medium Enterprise (SME) Surveys Project is designed to
assess the workforce development needs of
Afghanistan’s small and medium enterprises in six urban
areas of the country over time. These six cities are;
Kabul city, Mazar-i-Sharif, Jalalabad, Herat city,
Kandahar city and Kundoz city. In addition, the Surveys
Project will assess the state of Afghanistan’s labor
market over time, including salaries, job creation,
unemployment rates, education levels and hours
worked in the six aforementioned urban centers. The
geographic breakdown of the field research will allow USAID to develop specific regional strategies to meet local
SME and LM needs.
The Labor Market and Small & Medium Enterprise Surveys Project will assist and inform the USAID Office of
Economic Growth’s (OEG) Afghan Workforce Development Program (AWDP), which seeks to increase job
placement, salaries/wages and self-employment opportunities for Afghan men and women through the
provision of market-driven skills training, business training and linkages to credit, as well as business
development support and job placement services. The surveys will assist in the focused and effective
implementation of the AWDP as it improves the quality and variety of sustainable technical and vocational
education and training (TVET). The surveys are more heavily focused on gathering responses from SMEs rather
than members of the LM.1
The survey results identified eight industry categories as follows (listed from largest to smallest in terms of
percentage of SMEs participating in that industry): Textiles (19%), Construction (18%), Agribusiness (17%),
Electronics and Technology (12%), Non-Technical Services and Hospitality (11%), Non-clothing/Non-electronic
Consumer Goods (10%), Medical and Cosmetology (8%) and Energy and Transportation (6%).
The survey identified SME owners/managers according to their age. The plurality of SMEs below the age of 21
worked in Agribusiness (30%). The plurality of respondents between the ages of 22 and 34 worked in the
Textiles industry (19%), but were spread evenly across all other industries except Energy and Transportation.
The plurality of respondents between the ages of 34 and 44 were working in the Construction industry and the
Textiles industry (21% each). The plurality of SME respondents between the ages of 55 and 64 were working in
the Agribusiness industry (25%) followed closely by the Textiles industry (22%). The majority of respondents
over the age of 65 worked in Textiles (60%).
1 At the request of USAID, 70% of respondents were SMEs and 30% were from the LM, with a sample size of 1,250 for each of four rounds
of the survey, which will take place every 6 months over two years. In the first round, the survey teams interviewed 959 SMEs and 307 members of the LM. Due to the low base values and undetermined sampling frame, the statistical significance of the data cannot be determined until the fourth and final survey, expected in late 2013. A more in-depth and complete analysis of Afghanistan’s LM is expected in 2012 from the International Labor Organization (ILO) and will be used to measure this survey’s sampling frame. Given the ILO’s anticipated LM Survey, this survey and report were designed to favor the information collected from the SME Survey (hence, the 70:30 SME:LM breakdown).
6
The majority of small enterprises (1 – 5 employees) were located in Kundoz (56%). The majority of medium-
sized enterprises (6 – 20 employees) were located in Kandahar (55%). The primary industry in which small
enterprises participated was Agribusiness (41%). The primary industry in which medium enterprises
participated was Construction (42%) followed closely by Textiles (41%).
The gender breakdown of the survey was 83% male and 17% female, far over-representing women’s
participation in the labor force let alone participation as owners and managers of businesses. This is the result
of a high response rate from Herat, where women make up around 43% of the workforce.2
Afghan SME owners and managers indicated that they believe their businesses are performing better now than
compared to a year ago (74%). This perception was especially notable in Kandahar, where more than 40% of
respondents said that their business was performing “a lot better” than a year ago. Results from the Labor
Market Survey suggest that members of the workforce are less enthusiastic about their personal economic
situations as only 45% of LM respondents said that their family’s economic situation was better now than a year
ago. The causes of positive perceptions amongst the SME respondents included an increase in customers and
improved security. The reasons for positive perceptions of the economic situation from members of the LM
included improved security and increased employment of family members. Negative perceptions of the
economic situation of SME respondents were attributed to lack of customers, high prices and lack of electricity.
Negative perceptions of the economic situation of members of the LM include unemployment and high prices.
In addition to the economic situation, SME respondents were asked about the health of their business. 85% of
SME respondents indicated that the health of their business was “very good” or “somewhat good.” The highest
concentrations of SME respondents who described the health of their business as “somewhat bad” or “very
bad” were located in Kabul (58% of SME respondents) and Kundoz (28% of SME respondents). Kandahar had the
highest concentration of SME respondents who stated that the health of their business was “very good” (45%).
When broken down by industry, the highest percentage of SME respondents who answered that the health of
their business was “very bad” were in the Textiles industry (35%). The most positive responses, “very good,”
came from SME respondents in the Construction and Agribusiness industries (22% and 19% respectively).
Nationally, the survey results indicate that 53% of SME respondents intend to hire more employees. This
sentiment was especially pronounced in Kandahar, Herat and Kabul (23%, 20% and 17% of SME respondents
respectively). Kundoz had the highest percentage of SME respondents indicate they did not want to hire (24% of
SME respondents). The industries with the most favorable hiring environment, measured by SME responses,
were the Textiles and Construction industries (21% and 20% of SME respondents respectively). The Agribusiness
industry had the highest concentration of SME respondents say they did not want to hire (19%).
SME respondents indicated a high demand for skilled (36%) and professional (35%) employees at the national
level. The highest concentration of SMEs who hire skilled employees was in Kandahar (34%) and those who hire
professional employees were in Kabul (21%). The highest concentrations of SMEs who hire both unskilled and
semi-skilled workers were in Herat (43% and 40% respectively). The Agribusiness and Textiles industries have
the highest percentages of SMEs who answered that they mostly hire unskilled (21% of SMEs in Agribusiness and
22% of SMEs in Textiles) or semi-skilled worker (22% of SMEs in Agribusiness and 33% of SMEs in Textiles). The
Textiles industry also hired the highest percentages of skilled workers (27% of SMEs), while the Construction
industry hired the most professional workers (23% of SMEs).
2 Neall, J. & Schutte, S., (2006), Urban Livelihoods in Afghanistan, Afghanistan research and Evaluation Unit, Kabul, Afghanistan, p.41

7
55% of SMEs indicated that they would like “a great deal” of training for their employees. Employers and
members of the LM (40% reported being “very interested”) in all cities were interested in receiving training
except Kundoz. Kandahar had the highest percentage of SMEs who responded that they would like “a great
deal” of training for their employees (26% of SMEs). The highest amounts of interest in training were recorded
in the Construction industry (20% of respondents wanted “a great deal” of training for their employees), while
the lowest amounts of interest were found in the Agribusiness industry (27% of “none at all” respondents).
When asked what skills were most needed the top five responses were (1) General Knowledge of the industry,
13%; (2) Literacy, Language and General Education, 12%; (3) Management and Administration, 10%; (4)
Marketing and Sales, 10%; and (5) Clothing Production/Tailoring, 9%. These results reflect the desire of SME
respondents to have their employees trained in general skills that can be used across various industries, with the
exception of Clothing Production/Tailoring, which is likely in the top five skills demanded due to the high amount
of respondents in the Textiles industry.
Only 7% of SME respondents indicated that they are “always” able to find adequately trained and skilled
employees. 26% indicated that they are “never” able to find adequately trained and skilled employees. The
highest percentage of respondents who are “always” able to find qualified employees were in Kabul (30% of
SMEs), and the highest percentage who were “never” able to find qualified employees were in Mazar and Herat
(23% of SMEs each) followed by Kundoz (19% of SMEs). In the industries category, the highest percentage of
respondents who were “always” able to find adequately trained employees were in the Electronics and
Technology industry (19% of SMEs), while those “never” able to find skillful employees were concentrated in the
Textiles industry (24% of SMEs).
The difficulty SMEs have in finding skillful Afghan employees may be a reason for why 23% of respondents
indicated that they hire foreign labor. The plurality of SMEs who hire foreign labor were in Kandahar (21% of
SMEs), while Herat had the lowest percentage of SMEs who hire foreign workers (13% of SMEs). The highest
percentage of SMEs who hired foreign workers participated in the Construction industry (26% of SMEs) while
the lowest percentage of SMEs who hire foreign labor work in the Energy and Transportation industry (6% of
SMEs).
The survey identified three barriers or obstacles for TVET in Afghanistan’s labor market: low awareness of TVET,
poor perceptions of TVET and an unwillingness to pay for TVET. 75% of SME respondents indicated they were
unaware of TVET opportunities in their area. The highest levels of unawareness were in Kandahar (87%) and
Kundoz (76%). The industries with the highest levels of unaware SMEs were the Agribusiness and Non-
clothing/Non-electronic Consumer Goods
industries (83% each).
Perceptions of TVET were generally poor across
Afghanistan’s six largest cities. This
measurement was taken by asking SMEs about
their perception of the quality of graduates
from local TVET programs. 63% of SME
respondents indicated that their local TVET
programs do not produce high quality
graduates. The highest level of SME

8
respondents in any city who reported not knowing training centers that produce high quality graduates were in
Kandahar (79%). Jalalabad had the highest percentage of SME respondents report being able to identify training
centers that produce high quality graduates (38%). The Electronics and Technology industry as well as the Non-
clothing/Non-electronic Consumer Goods industry had the highest levels of SME respondents indicate that they
were unable to identify training centers that produce high quality graduates (72% and 71% respectively). The
highest levels of SME respondents who said they could identify training centers that produce high level
graduates were found in the Medical and Cosmetology industry and Textiles industry (32% and 31%
respectively).
60% of SME respondents indicated that they are unwilling to pay for training for their employees. More than
half of SME respondents stated their objection to paying for their employees’ training in all cities except for
Kabul and Jalalabad. The highest level of SMEs who said they were unwilling to pay for training was in Kundoz,
where 89% of SME respondents said “no.” The majority of SME respondents in all industries indicated that
they were unwilling to pay for training for employees. The industry with the highest level of SMEs who were
unwilling to pay for training was the Textiles industry (64%). The industries with the highest levels of SMEs who
responded that they are willing to pay for training were the Energy and Transportation industry (46%) and the
Medical and Cosmetology industry (43%).
The survey also identified two opportunities for TVET to succeed in the labor market: the perception that
training will increase business profits and a willingness on the part of SMEs to allow time away from work for
training. The majority of SME respondents from all six cities and all eight industries indicated that they believed
training would help make their businesses more profitable. Kundoz had the highest level of SMEs who did not
believe that training would make their business more profitable (16%). Across industries, the highest level of
SMEs who believe training would not make their business more profitable was in the Non-clothing/Non-
electronic Consumer Goods industry (10%).
69% of SME respondents indicated that they would be willing to allow time away from work for their employees
to attend training programs. The majority of SME respondents in every city except for Kundoz stated their
willingness to allow time away from work for training. On the contrary, in Kundoz the majority stated they
would not allow time away from work. The largest percentage of SME respondents who would allow time away
from work for training were located in Kandahar (87%). The majority of SME respondents across all industries
indicated that they are willing to allow time off from work for specialized training. The highest percentage of
negative responses came from the Non-clothing/Non-electronic Consumer Goods industry (31%) and the
Textiles industry (30%), while the positive responses were spread evenly across all industries.

9
GDP: Monetary value of
all the finished goods and
services produced within
a country's borders in a
specific time period. It
includes all of private and
public consumption,
government outlays,
investments and exports
less imports that occur
within a defined
territory. It does not take
into account the
underground economy -
transactions that are not
reported to the
government.
2.0 INTRODUCTION
2.1 Background
Job creation in Afghanistan has been a key priority for both the Government of the Islamic Republic of
Afghanistan (GIRoA) and the international donor community. Surveys show that at the national level,
unemployment is considered the second largest problem in Afghanistan after security.3 At the local level,
unemployment often surpasses security as the biggest problem in Afghanistan.4 In recognition of this, many
international donors have designed programs to support private sector development with the hope that jobs
will be created and incomes increased. Gains in employment have shown to have an impact in areas other than
productivity: Increases in employment correlate with elevated levels of health and education, as well
significantly increased stability. Employed persons are less likely to engage in illicit activities such as poppy
cultivation or terrorist acts. This explains in part why programs aiming to increase employment and wages are a
key component of the U.S. Government (USG) strategy to combat illicit activities in Afghanistan.
In recent years, surveys that measured perceptions of the economy have shown
that despite the persistence of unemployment, Afghans view the country’s
economic situation more favorably than in previous years.5 Recent economic
indicators generally portray Afghanistan’s economy as strong but volatile:
Afghanistan’s economy is driven by the service and agriculture industries and has
been characterized by robust but unpredictable growth over that last decade. GDP
growth rates ranged from as low as 1% to as high as 20% over the last ten years.6
Inflation rose sharply to 26.8% in 2008, turned negative (deflation of 13.2%) in 2009
and is currently increasing again at around 13%.7 Given Afghanistan’s dependence
on trade, specifically imports (current account balance is estimated to be -40% of
GDP8), inflation remains vulnerable to the whims of international prices of food and
fuels. The unemployment rate in Afghanistan is unclear, but some sources suggest
it to be as high as 43%,9 while underemployment hovers near 33%.10 Despite the
widely recognized importance of increasing employment opportunities, in light of
the unpredictable economic indicators, there is no reliable or consistently
administered labor market survey in Afghanistan. To date, there is no widely-
accepted definition of Afghanistan’s labor market using indicators including salaries
and wages, or skills and abilities of the workforce. The implementation of such a survey is complicated by the
fact that a census has not been conducted in Afghanistan since 1979 and the size of the labor market is generally
based on estimates from collections of research accumulated since 1979. The International Labor Organization
(ILO) has signaled its intent to conduct a detailed, nationwide survey in 2012.
3 The Asia Foundation (2011), Afghanistan in 2011: Survey of the Afghan People, The Asia Foundation, Kabul, Afghanistan
4 Ibid
5 Ibid
6 The World Bank Group (2011). http://siteresources.worldbank.org/AFGHANISTANEXTN/Resources/305984-
1297184305854/AFGEconUpdate2011.pdf 7 Ibid
8 Ibid
9 USAID Office of Economic Growth, Why Economic Growth Matters in Afghanistan, October 2011
10 International Rescue Committee, Afghanistan Labor Market Information Survey, Ministry of Labor, Social Affairs, Martyrs and Disabled.
September 2003 p. 12
10
Data from the International Rescue Committee (IRC) in association with the Ministry of Labor, Social Affairs,
Martyrs and Disabled (MoLSAMD) at GIRoA in 2003 suggests that the majority of technical and vocational
education and training (TVET) centers in Afghanistan were operated by NGOs (57%), while private organizations
(24%) and the government (19%) were the second and third most supportive of TVET. The majority of training
centers had only been operating for one year, making them relatively new in Afghanistan. Their focus was on
handicraft and trade skills. The majority of trainees were between the ages of 16 and 25, and 70% were women.
Most of the training centers conducted trainings for only half of the day for an average of eight months. Almost
all the training centers (97%) paid the trainees to attend. The trainers at the training centers were considered to
be skilled workers, largely coming from local bazaars, but none of the trainers reported having any formal
teacher training. According to IRC’s survey, job training was also offered by employers – 65% of whom offer on-
the-job training.11
Accurate labor market data is necessary to measure Afghanistan’s progress in job creation and inform the design
of future donor activities. Small and Medium Enterprise (SME) surveys are also needed in order to adequately
assess the workforce development needs of SMEs and the prospect for their participation in TVET.
Understanding the types of skills SMEs are seeking from the labor market allows for more effectively targeted
assistance. This assistance is intended to come from USAID’s AWDP, and will consist of two components:
Component 1: This component will focus on providing capacity-building support to the Afghan public,
and the private-sector and NGO TVET providers. This component seeks to improve the quality and
availability of TVET to the unemployed, underemployed and other vulnerable populations.
Component 2: This component will provide capacity-building support to the Afghan private and public-
sector business training providers. This support will serve to improve the quality and accessibility of
business training programs at the university level as well as targeted continuing education and
professional development needs through partnerships with private and public-sector business institutes
and universities.
Component 1 will materialize through the contracting of one of USAID’s implementing partners while
Component 2 will be applied through on-budget assistance provided to GIRoA and implemented through a
Program Management Unit established at the Ministry of Education (MoE), with the collaboration of the
MoLSAMD and the Ministry of Higher Education (MoHE). The project is set to begin in 2012 and will strengthen
the capacity of the Afghan government and private‐sector business/vocational training and education institutes
through a blend of on-budget grants, technical assistance, and training.12
A more accurate picture of the labor market will help to inform TVET initiatives by AWDP and other international
donor activities. A clearer understanding of what skills are demanded by SME owners and managers will aid in
the development of TVET initiatives that seek to more precisely match laborers’ skills with enterprises’ needs.
Such an initiative will help implementers prevent addressing perceived workforce development needs and
instead address actual skill sets demanded of and by the workforce.
11
Ibid 12
USAID Afghan Workforce Development Program, http://afghanistan.usaid.gov/en/USAID/Activity/207/Afghanistan_Workforce_Development_Program_AWDP

11
2.2 Objectives and Methodology
This study is based on the results of two surveys conducted simultaneously (LM survey and SME survey) to
assess the workforce development needs faced by Afghan businesses. In order to assess both supply and
demand, and link these factors to the role of technical and vocational education and training (TVET) programs in
bridging the gap between labor supply and demand, it is essential to conduct primary research among business
owners and managers as well as members of the labor force. These surveys will be repeated four times at six
months intervals over a two-year period. The findings will enable USAID to measure the impact of the AWDP in
linking employers from the private sector to employees and will support evidence-based decision-making for
workforce development programming.
2.2.1 Research Objectives
The overall research objective of these surveys aims to assess the workforce development needs of
Afghanistan’s small and medium enterprises over time in six urban areas of the country (Kabul city, Mazar-i-
Sherif, Jalalabad city, Herat city, Kandahar city and Kundoz city). The industries studied include textiles,
construction, agribusiness, electronics and technology, non-technical services and hospitality, non-clothing and
non-electronic consumer goods, medical and cosmetology, energy and transportation. Knowing the
characteristics and skills SMEs are seeking from the labor market will allow for more effectively targeted
implementation of the AWDP.
2.2.2 Literature Review
The research team conducted a review of existing information, including program records13 and documents,
studies, and statistical data available through public14 15 and private agencies.16 17 An effort has been made to
review earlier surveys on similar and related topics.18 The literature review provided valuable information for
the research design, the questionnaire development, the research implementation and the analysis.
2.2.2 Research Instrument
Two distinct research instruments were developed for this survey, one for the SME survey and another for the
LM survey. The questionnaires were developed in close collaboration with USAID’s OEG, DM TVET, MoC,
MoLSAMD and AISA.
The SME and LM questionnaires included 24 and 21 close-ended questions respectively, in addition to 10 open-
ended questions, demographics collection and the interview records. The interview length was approximately
40 minutes to avoid respondent fatigue. Both questionnaires were translated into Dari and Pashto and were
pretested through cognitive interviews in Kabul, Herat and Jalalabad between January 9 and January 11, 2012.
2.2.1 Sampling Size and Sampling Frame
The sample size for this research is projected to be n=5000 over 4 survey iterations producing a minimum
sample size of n=1250 per wave; 1266 respondents were interviewed in this wave. The ratio of SME to LM
surveys was determined by USAID to be 70:30. Further research and analysis of the Afghan labor market is
13
http://afghanistan.usaid.gov/en/USAID/Activity/32/Afghanistan_Small_and_Medium_Enterprise_Development_ASMED 14
The Labor Market Information and Analysis Unit (2008) , “An Urban Area Primary Source Study on Supply and Demand in the Labor Market”, Kabul, Afghanistan 15
http://siteresources.worldbank.org/AFGHANISTANEXTN/Resources/305984-1297184305854/AFGEconUpdate2011.pdf 16
http://asiafoundation.org/resources/pdfs/TAF2011AGSurvey.pdf 17
http://www.adb.org/publications/afghanistan-fact-sheet 18
http://data.worldbank.org/country/afghanistan

12
anticipated to be conducted by ILO this year and will provide a deeper analysis of the state of Afghanistan’s
labor market, including salaries, job creation, unemployment rates, education levels, hours worked, etc.
SME Survey (n=959)
The target populations for the SME survey consisted of business owners and managers in Afghanistan’s six main
urban areas. This population of interest was selected in order to focus the study on a thorough assessment of
businesses’ needs for training. A total of 959 SME owners and managers were surveyed for this study. The
research team applied a multistage probability cluster sampling:19 Stage 1: Each city was divided into four
geographical zones; Stage 2: Two to six clusters were selected in each zone depending on the concentration of
businesses in each zone; Stage 3 - At least two sampling points were selected in each cluster and finally the
businesses were selected through a randomized protocol. This method was selected in order to cover both
formal and informal businesses; the advantage of multistage cluster sampling relies on the fact that it allows the
research to cover as many sectors of business as possible while guaranteeing proper geographical dispersion.
LM Survey (n=307)
In order to properly contextualize the training needs of business owners, a total of 307 interviews were
conducted in Afghanistan’s largest cities with members of the labor force. The target population was limited to
employed adults living or working in Afghanistan’s six main urban areas. The research team applied a similar
sampling method as the SME survey for the two first stages (geographical zones and clusters), however labor
market respondents were selected through a random street-intercept protocol. The data collectors screened the
potential respondents in order to keep the focus on the population of interest (employed individuals).
2.2.3 Field Research
Before field research began, a quality assurance plan was designed in order to reduce the risk of data
manipulation during and after field research. The survey team adopted a proactive approach to ensure quality of
the data collected using standardized protocols. The research operations manager held trainings in Kabul,
Mazar-i-Sherif and Herat in January 2012. The training curricula included an in-depth explanation of the research
objectives, the sampling methodology, questionnaire content, target population, quality assurance and quality
control protocols. The intensive training attended by each data collector limited the likelihood of “drift” during
field research, when a data collector unintentionally deviates from the original protocol. Additionally, the
cognitive pretesting of the questionnaires engendered a reduced frequency of errors during field data collection.
Data collection was performed between January 31 and February 15, 2012 by 24 trained and locally-sourced
data collectors. In each city, two males and two females conducted an average of 211 interviews (53 interviews
each).
Direct supervision was performed by provincial supervisors during data collection as well as random back-
checks. The provincial supervisors sent daily reports to the national survey coordinator based in Kabul.
Moreover, in order to keep track of the field research, the provincial supervisor and the data collectors mapped
each sampling point during their field research.
19
Kalton, Graham (1983), Introduction to Survey Sampling, Sage Publications, p. 28

13
2.2.4 Analysis and Compliance with USAID’s Data Quality Standards
Compliance with data quality standards ensures confidence in the data collected and effective and adequate use
of USAID’s resources20 for the AWDP.
In accordance with the research objectives, the research team articulated the study around four main indicators:
SME Demographics and Perception of Economic Situation
Supply and Demand for Training
Barriers and Opportunities for TVET
Data Validity
The validity of the data principally depends on proper design and implementation of the research instrument.
Data validity ensures the appropriateness of the causal inferences made in the analysis (internal validity)21 and
the generalizability of the analysis to the target population (external validity)22. Data validity was achieved
through a collaborative research design which involved key stakeholders from DM TVET, MoC, AISA and the
OEG. Cognitive pretesting of the questionnaires engendered a reduced frequency of errors during field data
collection. The application of quality assurance and quality control best practices throughout the research
process guarantees that the survey results are internally and externally valid.
Data Reliability & Integrity
The data received in Kabul were duly inspected by the analyst and then entered in MS Excel and exported and normalized in the Statistical Package for Social Sciences (SPSS). The survey specialist conducted a series of statistical and logical tests to identify outliers and inconsistencies across interviewer pools of responses. Pools with unusually high or low levels of variance, nonresponse, and average interview time were flagged for further investigation.23 Finally, the national survey coordinator conducted a 10% phone recall after completion of the field research. The data collected for the SME and LM surveys reflect stable and consistent data collection processes and analysis methods over time. The majority of quantitative analysis was done in the form of frequencies and cross-tabulations representing key research findings.
Timeliness
This report is being released less than three months after completion of the field research. This report is
currently adequate to support evidence-based decision making for the AWDP; a follow-up survey will take place
in October 2012.
2.2.5 Survey Limitations
Current Best Approach with Unavailable Sampling Frame
Systematic random sampling was not applicable for this survey as there was no adequate sampling frame
available. Cluster sampling was the most adequate methodology as it eliminated the need for a complete list of
all units in the target populations. However, cluster sampling has some limitations: it’s less accurate than
systematic random sampling as it does not cover the population as evenly. Nevertheless, usually on a similar
20
http://www.usaid.gov/policy/evalweb/documents/TIPS-DataQualityStandards.pdf 21
Shadish, W., Cook, T., and Campbell, D. (2002), Experimental and Quasi-Experimental Designs for Generalized Causal Inference,:Houghton Mifflin, Boston, United States 22
Brewer, M. (2000), Research Design and Issues of Validity; in Reis, H. & Judd, C. (eds) Handbook of Research Methods in Social and Personality Psychology, Cambridge University Press, Cambridge, Unite Kingdom 23
Russ-Eft, D. F. (1980)., Validity and Reliability in Survey Research, American Institutes for Research in the Behavioral Sciences

14
budget, cluster sampling is more representative as it’s more economical to implement and thus allows the data
collectors to interview more respondents.
Translation & Semantics
After approval, the questionnaire was translated from English into Pashto and Dari. The questionnaire was not
merely translated,24 but adapted to convey semantically similar constructs. However some translation issues
arose throughout the survey: for instance in the naming of the educational levels (baccalaureate being confused
with a graduate degree).
Complexity of the Research Instrument & Data Entry
The survey was complex; it involved numerous logically linked questions. This led to difficulties for the data
collectors to administer the survey and resulted in small sample sizes for some of the responses. For example,
when asking in an open-ended fashion what skills employers wanted their employees trained, the number of
individual responses was so great that follow-on questions asking how many employees they would like trained
with that skill, and what skill level they would like the employees to achieve were statistically insignificant. This
also engendered data entry irregularity as open-response answers produced some questions with an
unexpectedly large number of response codes. Analysts were able to use the data after implementing time-
consuming protocols for recoding the data. While some responses where intentionally kept open to collect in-
depth information on businesses’ needs, a greater effort will be made to keep a maximum of questions with set
responses in future waves of this survey.
Unreliable Maps The AIMS maps were used to design the cluster sampling and plan the field research. The data collectors faced
some difficulties in using them properly in the field, as they were not up-to-date. Moreover, this also created
some reporting issues as it was difficult for the national survey coordinator to reliably determine exactly where
the interview took place.
24
Alwin, D.F., Braun, M., Harkness, J.A and Scott, J. (1994), Measurement in Multi-National Surveys. In: I. Borg and P.Ph. Mohler, Trends and Perspectives in Empirical Social Research (pp. 26-39), De Gruyter, Berlin, Germany.

15
3.0 SME DEMOGRAPHICS
3.1 Industries
Business owners and managers were asked to describe the type of business that they owned/operated. This
resulted in a high degree of diversity within the responses, and necessitated aggregating responses into eight
larger industry types developed following the careful analysis of respondents’ open-response answers. They are
defined below.
Agribusiness: Businesses involved in food
production, including farming (limited to its impact
on urban labor markets in this survey); seed and
livestock supply and sales; farm machinery use and
sales; as well as the wholesale, distribution,
processing, marketing, and retail sales of processed
and unprocessed plant and animal-based food
goods. Specific examples from the data set include
dry fruit processing and retail, butchery, poultry,
cotton selling and grocery store management.
Textiles: Work with and the sale of fabric products
ranging from clothing to carpets to curtains to
shoes. Includes raw material collection,
processing, design, production and manufacturing
as well as retail stages of the textile industry’s
value chain. Specific examples from the data set
include cloth shop management, embroidery,
shoemaking, Kandahari cap making and carpet
weaving.
Medical and Cosmetology: All services and
treatments for the physical and mental wellbeing
of the individual. Dataset examples include
radiology technical work, pharmacy technical work,
laboratory management, beauticians, barbers and
make-up artistry.
Construction: Raw material sales, contracting
services as well as trade specialties that are critical
to infrastructure construction ranging from roads
to homes to commercial property. Some specific
examples from the dataset include masonry,
plumbing, metalwork, painting, contracting and
raw material sales.
Electronics and Technology: Manufacturing, sales,
repair and programming of electronic equipment
and information technology. Specific examples
from the dataset include the sales and repair of
computers, mobile phones and home appliances.
Non-clothing/Non-electronic Consumer Goods:
Design, production, manufacturing and sales of
consumer goods that cannot be classified in textiles,
electronic technology or agribusiness. Specific
examples from the data set include furniture
production and sales, women’s handicraft
production and sales, and jewelry design,
manufacturing and sales.
Energy and Transportation: Sale of fuel oil and gas,
as well as the sale and repair of cars, trucks,
motorcycles and bicycles. Examples from the data
set include car servicing, bicycle sales and gas
station management.
Non-Technical Services and Hospitality: All service
industry specialties that do not require technical
training (such as the training required to cut hair or
operate an X-ray machine), as well as the hospitality
sector. Examples from the dataset include property
dealing, travel agencies, telecoms, restaurants and
financial services such as banking or import and
export businesses.
16
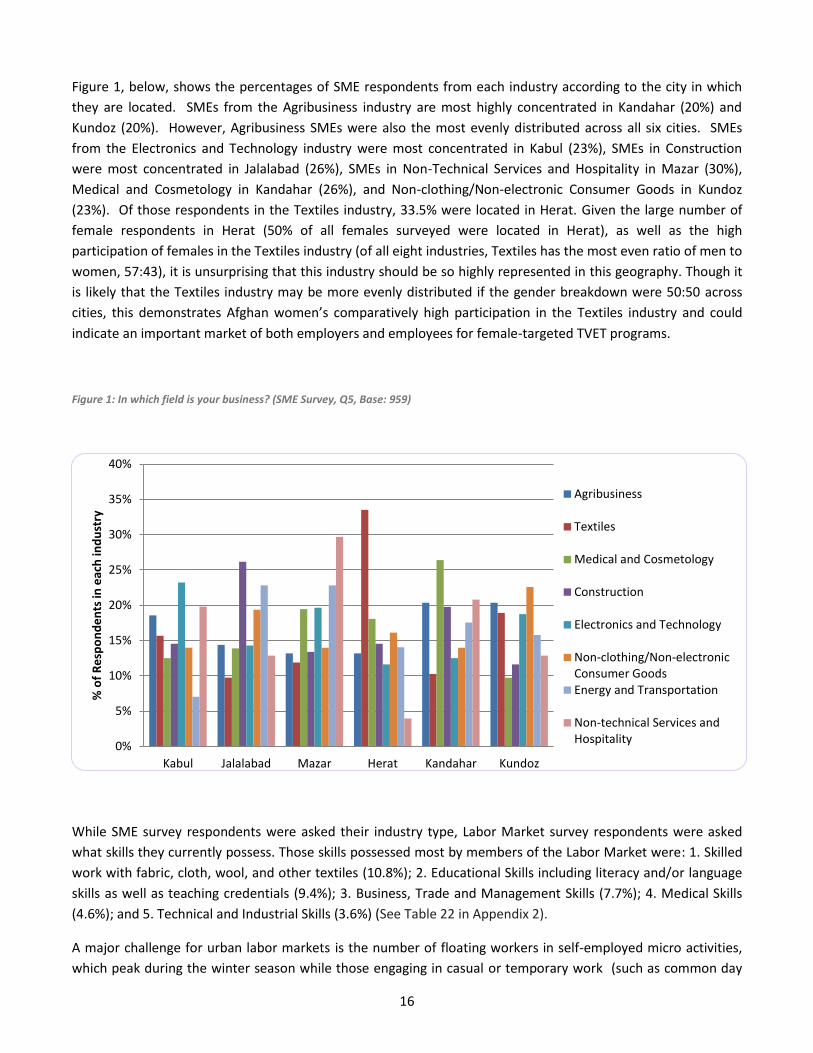
Figure 1, below, shows the percentages of SME respondents from each industry according to the city in which
they are located. SMEs from the Agribusiness industry are most highly concentrated in Kandahar (20%) and
Kundoz (20%). However, Agribusiness SMEs were also the most evenly distributed across all six cities. SMEs
from the Electronics and Technology industry were most concentrated in Kabul (23%), SMEs in Construction
were most concentrated in Jalalabad (26%), SMEs in Non-Technical Services and Hospitality in Mazar (30%),
Medical and Cosmetology in Kandahar (26%), and Non-clothing/Non-electronic Consumer Goods in Kundoz
(23%). Of those respondents in the Textiles industry, 33.5% were located in Herat. Given the large number of
female respondents in Herat (50% of all females surveyed were located in Herat), as well as the high
participation of females in the Textiles industry (of all eight industries, Textiles has the most even ratio of men to
women, 57:43), it is unsurprising that this industry should be so highly represented in this geography. Though it
is likely that the Textiles industry may be more evenly distributed if the gender breakdown were 50:50 across
cities, this demonstrates Afghan women’s comparatively high participation in the Textiles industry and could
indicate an important market of both employers and employees for female-targeted TVET programs.
Figure 1: In which field is your business? (SME Survey, Q5, Base: 959)
While SME survey respondents were asked their industry type, Labor Market survey respondents were asked
what skills they currently possess. Those skills possessed most by members of the Labor Market were: 1. Skilled
work with fabric, cloth, wool, and other textiles (10.8%); 2. Educational Skills including literacy and/or language
skills as well as teaching credentials (9.4%); 3. Business, Trade and Management Skills (7.7%); 4. Medical Skills
(4.6%); and 5. Technical and Industrial Skills (3.6%) (See Table 22 in Appendix 2).
A major challenge for urban labor markets is the number of floating workers in self-employed micro activities,
which peak during the winter season while those engaging in casual or temporary work (such as common day
0%
5%
10%
15%
20%
25%
30%
35%
40%
Kabul Jalalabad Mazar Herat Kandahar Kundoz
% o
f R
esp
on
de
nts
in e
ach
ind
ust
ry
Agribusiness
Textiles
Medical and Cosmetology
Construction
Electronics and Technology
Non-clothing/Non-electronicConsumer GoodsEnergy and Transportation
Non-technical Services andHospitality

17
labors) tend to decline. This movement between and
within different sectors is generally an unplanned response
to immediate short-term opportunities and does not reflect
well-planned employment choices.25 For example, regular
participants in the agriculture industry can generally be
found in the rural areas during growing and harvest seasons
(spring, summer and autumn). However, in the winter
these same laborers are more likely to be found in the cities
selling their agricultural goods or picking up other short-
term employment, possibly unrelated to the agribusiness
sector, while fields lay buried under the snow. Further
surveys (preferably timed with seasonal changes and not
strictly on 6-month intervals) must be conducted to draw
more accurate conclusions about the movement of workers
and their participation in specific sectors based on the
seasons. Given that this particular survey was conducted in
the winter, it is likely that urban participants in the
Agribusiness Industry and short-term employment in the
other defined seven industries may be overrepresented in
the survey results.
3.2 Business Size
Defining small and medium enterprises, as well as large
enterprises, in Afghanistan must take into account the country’s unique political, security and economic
situation.26 For the sake of this survey and analysis, small enterprises include businesses of one to five
employees; medium enterprises include businesses with six to 20 employees; and medium-large businesses
include businesses with more than 21 employees. SME size can also be determined by revenue; however that
information was not collected in this survey due to the sensitivity of the subject. Furthermore, Afghanistan has
no regularly enforced revenue-reporting regulations. Of the SMEs interviewed, 64% employed five or fewer
workers (small enterprises), while 31%% employed between six and 20 employees (medium enterprises).
Medium-large enterprises accounted for only 5% of responses (See Figure 32 in Appendix 1). The employee
base of most SMEs should be a prime consideration when designing training programs targeted at SME
employees; for example, as the size of SMEs increased, owners/operators were more likely (albeit by small
percentages) to have been aware of private training centers.
25
Neall, J. & Schutte, S., (June 2006), Urban Livelihoods in Afghanistan, Afghanistan research and Evaluation Unit, Kabul, Afghanistan, p.40 26
Afghanistan’s unique political, security and economic situation is defined by high corruption, fragile physical security and a growing but volatile economy largely dependent on the international community, The World Bank Group (2010). Afghanistan Economic Update, p.1
18
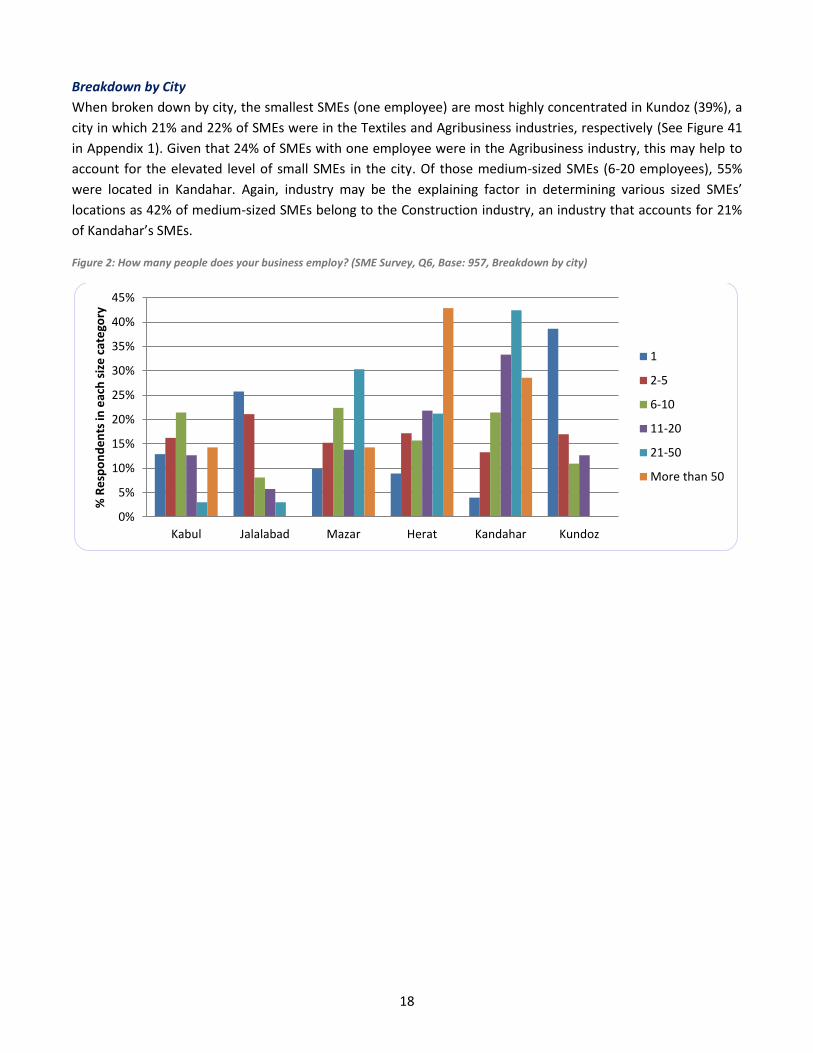
Breakdown by City
When broken down by city, the smallest SMEs (one employee) are most highly concentrated in Kundoz (39%), a
city in which 21% and 22% of SMEs were in the Textiles and Agribusiness industries, respectively (See Figure 41
in Appendix 1). Given that 24% of SMEs with one employee were in the Agribusiness industry, this may help to
account for the elevated level of small SMEs in the city. Of those medium-sized SMEs (6-20 employees), 55%
were located in Kandahar. Again, industry may be the explaining factor in determining various sized SMEs’
locations as 42% of medium-sized SMEs belong to the Construction industry, an industry that accounts for 21%
of Kandahar’s SMEs.
Figure 2: How many people does your business employ? (SME Survey, Q6, Base: 957, Breakdown by city)
0%
5%
10%
15%
20%
25%
30%
35%
40%
45%
Kabul Jalalabad Mazar Herat Kandahar Kundoz
% R
esp
on
de
nts
in e
ach
siz
e c
ate
gory
1
2-5
6-10
11-20
21-50
More than 50

19
Breakdown by Industry
As noted above, industry type may influence SME size. This may be particularly true in the case of the
Agribusiness industry, in which 24% of one-person SMEs work. An influx of seasonal, one-person Agribusiness
SMEs to urban centers during the fielding of this survey may have contributed to nearly a quarter of the smallest
SMEs being concentrated in this industry. Findings also demonstrated that the Textiles and Construction
industries were those in which most medium-sized SMEs operated (20% and 21% of 6-10 people-sized SMEs and
22% and 21% of 11-20 people-sized SMEs, respectively). This evaluation suggests that in order to support the
growth of medium-sized enterprises, TVET programs should target the Textiles and Construction industries.
Figure 3: How many people does your business employ? (SME Survey, Q6, Base: 957, Breakdown by industry)
3.3 Gender
The overall labor force participation rate of 67% in Afghanistan conceals large differences between male and
female participants. Less than half (47%) of working-age females are currently active in the labor market,
compared to 86% of males - a gap of 39% points. In urban areas, this gender gap is even larger (60%) due to a
very low female labor force participation rate (21%).27 In the SME survey, when looking at concentrations of
males and females across various industries, patterns that emerged from the regional breakdown of industry
types (see Figure 1) are even more pronounced when broken down by gender, indicating that gender also plays
an important role in survey respondents’ industry. 17% of SME respondents were female, and as only 2-3% of
businesses in Afghanistan are owned and/or operated by females,28 these SME findings may overemphasize
industries in which women claim ownership. Data from Herat in particular may exaggerate female participation
in SMEs given the relatively large number of female respondents in the city (See Figure 40 in Appendix 1).
However, findings from other workforce surveys demonstrate that Herat has an unusually high level of female
participation in the labor market (43% in 2006) owing to the city’s Western geographic orientation and its less
orthodox social conservatism.29 Figure 4 demonstrates that of female respondents, 50% owned/managed a
27
Ashraf Abdullah (2008), National Risk and Vulnerability Assessment 2007/8,ICON-Institute for the European Union 28
The World Bank (2008), Afghanistan Country Profile 2008, The World Bank, Kabul, Afghanistan p.5 29
Neall, J. & Schutte, S., (2006), Urban Livelihoods in Afghanistan, Afghanistan research and Evaluation Unit, Kabul, Afghanistan, p.41
0%
5%
10%
15%
20%
25%
30%
% o
f R
esp
on
de
nts
in e
ach
siz
e c
ate
gory
1
2-5
6-10
11-20
21-50
More than 50

20
business in the Textiles industry. Herat’s historical and cultural role within the Textiles industry, and the ease
with which women can enter this industry, help to explain this outlier.
Figure 4: Gender breakdown (SME Survey, D1, Base: 959, Breakdown by industry)
3.4 Age
Evaluating age groupings by respondents’ industry type demonstrates that age too appears to be an important
factor in SME respondents’ industry type. Within the “Younger than 21” age group, 30% of business owners
worked in the Agribusiness industry. Similarly, 30% of 55-64 year old business owners were also in the
Agribusiness industry. Having the Agribusiness industry dominated by both the oldest and youngest age groups
may seem counterintuitive at first, but barriers to market entry are most likely less in the Agribusiness industry
than others, which may appeal to younger Afghans with little-to-no training in starting and managing an SME.
Afghans in the 55-64 age group may also be particularly represented in this industry as they likely entered the
workforce in the early to mid-1970s and had little opportunity to pursue work in industries that required more
in-depth training. Note that while the 65+ age group seems vastly overrepresented in the Textiles industry, only
five SME participants were in this age group.
Figure 5: What is your age? (SME Survey, D2, Base: 959, Breakdown by industry)
0%
10%
20%
30%
40%
50%
60%
% o
f R
esp
on
de
nts
in e
ach
ge
nd
er
Male
Female
0%
10%
20%
30%
40%
50%
60%
70%
% o
f R
esp
on
de
nts
in e
ach
age
cat
ego
ry
Younger than 21
22-34
35-44
45-54
55-64
65+

21
Amongst Labor Market respondents, business skills
appeared to be the most popular within the 45-54 and
55-64 age groups, as 50% of both age groups
possessed these skillsets. This data may seem
contradictory to SME findings that reveal 55-64 year
old managers/owners are more likely to take part in
industries requiring less intensive training. However,
older SME managers/owners’ decision to enter into
the Agribusiness industry may have been determined
by their initial lack of skills. As SMEs’ skillsets were not
evaluated in this survey, it is impossible to compare
the current industries of SMEs and the skillsets of
members of the labor market. Still, it is likely that older
members of the labor market (45-64 years old) have,
over the course of several years in their various
industries, acquired rudimentary business skills and
would list these in a self-evaluation. In the 35-44 age
group, 37% of respondents listed that they had skills in
the education field. For those respondents younger
than 34, skillsets were more evenly divided. However,
skilled work with textiles was more popular within this
group than other skillsets (See Table 22 in Appendix 2)

22
4.0 GENERAL PERCEPTION OF ECONOMIC SITUATION
In order to accurately evaluate the opportunities for successfully strengthening TVET and business management
training programs, it is necessary to understand SME owners and general members of the labor force’s
perceptions of the current economic situation in their local area. SMEs and members of the labor market’s
impressions of the economic environments in which they live and work were measured looking at various
indicators, including change in business performance over the past year, current health of business, change in
local economic situations and current personal financial status.
4.1 Business and Economic Performance
SME owners expressed a general belief that their businesses were performing better now compared to a year
ago, with 74% of total respondents citing “a lot better” or “somewhat better” business performance (See Table
15 in Appendix 1). The perception of improvement was especially profound in Kandahar, where over 40% of
respondents said that their businesses were performing “a lot better” than one year ago. Anecdotal evidence
suggests that non-business owners were less impressed with the state of their personal economic situation, as
only 45% of respondents said that their family’s economic situation was better now than one year ago, and 23%
of respondents said that their economic situation was worse now than a year ago. A slightly lower percentage
of Labor Market respondents said that their city’s economic situation had also improved over the last year. 33%
said that the local economy had improved while 23% said that it was worse and 27% said it was unchanged.
While the number of interviews in each city were too small to be generalized to the population as a whole, it is
interesting that less than 2% of respondents in Kundoz believed that economic conditions in their city had
improved in the last year (See Table 23 in Appendix 2)
Figure 6: Compared to a year ago, how is your business performing? (SME Survey, Base: 959, Breakdown by city)
0
10
20
30
40
50
60
70
80
Kabul Jalalabad Mazar Herat Kandahar Kunduz Total
% o
f R
esp
on
de
nts
in e
ach
cit
y
A lot better
Somewhat better
Somewhat worse
A lot worse
Not recorded/ illegible
Don’t know

23
Why Kundoz?
The survey results indicate that respondents in Kundoz were much
less optimistic about their current economic and security situation
than in Afghanistan’s other major cities. Additionally, respondents
to both the LM and SME surveys in Kundoz were less interested in
and less optimistic about TVET.
Kundoz is a complex and ethnically diverse province compared to
Afghanistan’s other northern provinces. Familial and tribal
disputes over land have been cited as significant contributors to
Kundoz’s high rates of corruption and crime. High rates of crime
and the inability of the local governments to properly handle
perceived land grabs have left an open door for the Taliban to
return to the province and restore order.
The security situation in Kundoz took a marked decline in 2009,
when two NATO fuel trucks were stolen by insurgents leading to
aerial bombings by ISAF, which resulted in the deaths of as many
as 140 people. In October 2010, the governor of Kundoz,
Mohammad Omar, was assassinated. In 2011, the district
governor of Chardara was assassinated in a suicide
bombing. Local armed groups, such as Hezb-i-Islami, the Islamic
Movement of Uzbekistan and the Haqqani Network have made
recent comebacks in addition to the Taliban. This decrease in
provincial security and the prevalence of corruption may explain
why respondents in Kundoz were less optimistic about their
economic prospects, as the majority of Afghans perceive their
personal security and economic situation to be linked (USAID,
2011, Why Economic Growth Matters in Afghanistan).
Additionally, results from this survey suggest that Kundoz’s
negativity could be due to relatively high levels of SMEs in the
Agribusiness and Non-clothing/Non-electronic Consumer Goods
industries. Both of these industries are characterized by relatively
high levels of unskilled workers, low awareness of TVET, poor
perceptions of the quality of TVET, low intention to hire more
employees and the belief that training employees will not increase
business profits. The relative importance of these two industries in
Kundoz may account for the low demand for TVET and poor
perceptions of business health.
4.1.1 Explanations for Positive Changes
When asked what the most positive change to
occur to their business was, SME survey
respondents most commonly cited an increase
in customers as well as an improvement in the
security situation. Labor Market participant
responses echoed SME responses that improved
security had caused families’ economic
conditions to improve. Labor Market
respondents also noted increased employment
of family members as an agent of change.
SME owners’ opinions of the change in their
business’s performance generally coincide with
the continual growth of Afghanistan’s economy.
While growth has slowed over the past year
(real GDP grew at a rate of 21.0% in 2009/2010
and 8.4% in 2010/2011),30 this growth rate is
still high, making Afghanistan’s the 20th fastest
growing economy in the world. Citing an
increase in customers as the most positive
change to occur to SMEs’ businesses parallels
Afghanistan’s continued increase in GDP per
capita (in 2010, GDP/capita grew at a rate of
5.2%31), which implies that Afghan families have
increasing disposable income. Furthermore,
private consumption has been the fuel for
growth in Afghanistan’s economy in recent
years, accounting for 6.9% of GDP growth in
2010/2011.32
30
The World Bank (2011). Afghanistan Economic Update. p. 17 http://siteresources.worldbank.org/AFGHANISTANEXTN/Resources/305984-1297184305854/AFGEconUpdate2011.pdf 31
The World Bank Group (2010).p. 1 http://devdata.worldbank.org/AAG/afg_aag.pdf 32
The World Bank Group (2011). Afghanistan Economic Update. p. 2 http://siteresources.worldbank.org/AFGHANISTANEXTN/Resources/305984-1297184305854/AFGEconUpdate2011.pdf

24
4.1.2 Explanations for Negative Changes
Alternatively, lack of customers, high prices,
and lack of electricity were the most commonly
noted negative changes that had occurred in
the last year. Despite a high GDP growth rate,
strong inflation (13.7%)33 resulting in higher
prices was most likely the driving factor in SME
respondents’ perceptions of negative
influences on their business’ performance.
Security concerns were also noted, particularly
in Kundoz where 18% of business owners cited
poor security as the cause of declining business.
Unemployment was noted by Labor Market
respondents as one of the two most common
perceptions as to why family economic
conditions had deteriorated in the last year.
Note that by nature of their definition, SME respondents are employed. Though all LM respondents interviewed
for this survey were also employed, their perceptions of unemployment may be more negative given that they
do not own their own businesses and depend on others for employment. Additionally, like SME respondents,
Labor Market participants viewed high prices as a detriment to their improving financial well-being.
Both positive and negative perceptions of the change in levels of Employment, Security, and Prices were seen as
the most important factors affecting the economic trajectory over the last year. These survey results coincide
with the results recently published by the Asia Foundation’s 2011 Survey of the Afghan People.34 While
improved security appeared to be a dominating factor in positive economic change in most major cities, the
negative outlier of Kundoz may indicate that security is perceived as a necessary precondition to sustainable
economic growth.
4.2 Health of Business
In addition to how SMEs feel about the change in their business performance over the past year, the current
condition of their businesses also provides important insight into how SMEs view their personal economic status
and that of their city and region as improvement in performance does not necessarily imply a “healthy”
business. Business Health was measured based on how SMEs described the state of their enterprise as well as
the more objective indicator of SMEs’ intent to hire more employees.
4.2.1 Perception
National Perception
In general, SME owners seemed positive about the current health of their business. 85% of all respondents
rated the current health of their business as “very good” or “somewhat good.” These positive responses mirror
similarly elevated expectations of future business developments by business owners in a 2009-2010 Center for
International Private Enterprise (CIPE) survey in which over 75% of respondents expected increases in sales,
profits, investments and employees in the following six months – all factors that would improve economic
33
The World Bank Group (2011). Afghanistan Economic Update. p. 17 34
The Asia Foundation (2011), Afghanistan in 2011: Survey of the Afghan People, The Asia Foundation, Kabul, Afghanistan

25
outlook for SMEs35. Kundoz had the largest percentage of respondents stating that the health of their business
was either “somewhat bad” or “very bad” with 25% of respondents offering one of these responses.
Figure 7: How would you describe the current health of your business? (SME Survey, Q1, Base: 959, Six cities aggregated)
Perception by City
Though only 3% and 11% of SMEs noted “very bad” or “somewhat bad” business health, respectively, regional
breakouts reveal concentrations of negative responses in Kabul and Kundoz; of those business owners who
described their current business health as “very bad” 52% and 28% were located in Kabul and Kundoz,
respectively. These two cities also had relatively high levels of “somewhat bad” responses. Despite seemingly
elevated perceptions of increased business performance, Kabul and Kundoz also held the highest concentrations
of those SMEs that saw “a lot worse” business performance over the past year (see Figure 6).
Figure 8: How would you describe the current health of your business? (SME Survey, Q1, Base: 957, Breakdown by city)
35
CIPE, 2009-2010 Afghan Business Survey, p.5
0%
10%
20%
30%
40%
50%
60%
70%
Very good Somewhat good Somewhat bad Very bad Undefined/Unknown
% o
f R
esp
on
de
nts
0%
10%
20%
30%
40%
50%
60%
Kabul Jalalabad Mazar Herat Kandahar Kundoz
% o
f R
esp
on
de
nts
in e
ach
like
rt
cate
gory
Very good
Somewhat good
Somewhat bad
Very bad

26
Perception by Industry
Again, even though a very small percentage of SME respondents actually noted that their business health was
“very bad,” these answers were mostly found in the Textiles and Construction industry with 35% and 24% of
responses, respectively. As medium-sized enterprises were also concentrated in these two industries, there may
be a correlation between business size and business health. Additionally, the industry with the next highest
percentage amongst “very bad” responses was Agribusiness, which also had 25% of “somewhat bad” responses
and has a plurality of one-person enterprises. These business sizes fall into the World Bank’s “small business”
category (1-19 employees), which according to the organization’s 2008 Afghanistan country profile, perceived
crime, theft and disorder, lack of electricity and political instability as the main obstacles to their firms.36
Figure 9: How would you describe the current health of your business? (SME Survey, Q1, Base: 957, Breakdown by industry)
4.2.2 Intent to Hire
Another indicator of business health is whether or not SMEs would like to hire more employees. When asked,
53% of respondents stated that they wanted to hire new employees, while 45% noted that they did not. It is
likely that a lack of desire to hire new employees stems from perceptions of one’s current business situation. Of
those who responded that their current business health was “somewhat bad” or “very bad” 59% and 58%,
respectively, said that they did not want to hire new employees. These results nearly mimic the results of a
recent survey by the Center for International Private Enterprise (CIPE) in which 57% of respondents indicated
they planned to hire more people.37
36
The World Bank (2008), Afghanistan Country Profile 2008, p.4 37
CIPE, 2009-2010 Afghan Business Survey p 11
0%
5%
10%
15%
20%
25%
30%
35%
40%
% o
f R
esp
on
de
nts
in e
ach
like
rt
cate
gory
Very good
Somewhat good
Somewhat bad
Very bad

27
National Intent Figure 10: Do you want to hire more employees for your business? (SME Survey, Q7, Base: 959, Six cities aggregated)
Intent by City
While business owners’ responses to questions about business health were generally positive across cities and
fields of business, responses varied significantly by location when respondents were asked if they were
interested in hiring more workers for their business. This question revealed a strong hiring environment in
Kandahar and Herat, where 20% and 23% of positive respondents were located, while only 9% of respondents
were interested in adding new workers in Kundoz. Kandahar and Herat’s heightened positive responses may be
a result of their industrial strengths. Having higher concentrations of SMEs within the Construction and Textiles
industries respectively may have influenced these responses as 82% of Textiles SME respondents and 88% of
Construction SME respondents stated that their business health was “very good” or “somewhat good.”
Figure 11: Do you want to hire more employees for your business? (SME Survey, Q7, Base: 959, Breakdown by city)
0%
10%
20%
30%
40%
50%
60%
Yes No Don't Know Undefined/Unknown
% o
f R
esp
on
de
nts
0%
5%
10%
15%
20%
25%
30%
Kabul Jalalabad Mazar Herat Kandahar Kundoz
% o
f R
esp
on
de
nts
in e
ach
an
swe
r ca
tego
ry
Yes
No

28
Intent by Industry
Unsurprisingly, SMEs in the Textiles and Construction industries demonstrated a desire for increased employees.
After the Textiles, Construction and Agribusiness Industries, which accounted for the majority of SME
respondents, the highest concentration of SMEs who did not intend to hire more employees were in the
Electronics and Technology Industry (14%), while the highest concentration of SMEs who do intend to hire were
in the Non-Technical Services and Hospitality Industry (11%). Given the structure of Afghanistan’s economy,
which is service industry and agriculture based, it stands to reason that SMEs in the Non-Technical Services and
Hospitality Industry are seeking to hire at relatively higher rates. Manufacturing and technology represent a
very small and vulnerable sector of Afghanistan’s economy considering both require substantial investment.38
This may explain why the Electronics and Technology Industry has such a high percentage of SMEs not seeking to
hire more employees.
Figure 12: Do you want to hire more employees for your business? (SME Survey, Q7, Base: 959, Breakdown by industry)
38
Manufacturing accounted for only 13% of the economy in 2010. The World Bank Group (2010) http://devdata.worldbank.org/AAG/afg_aag.pdf
0%
5%
10%
15%
20%
25%
% o
f re
spo
nd
en
ts in
eac
h a
nsw
er
cate
gory
Yes
No

29
Unskilled employees: Require no
special skills and can be taught to
perform their jobs in a short
amount of time.
Semi-skilled employees: Require
some specialized training and
can be taught to perform their
jobs in a fairly short amount of
time.
Skilled employees: Require
technical knowledge or abilities
to perform their jobs, often
gained through formal training.
Professional employees: Have
advanced training in their field
and usually a degree from a
university.
5.0 DEMAND
Findings from 3.0 SME Demographics and 4.0 General Perception of Economic Situation indicators demonstrate
that generally employers view their economic environments favorably and are eager to expand their
enterprises. Assessing both SMEs’ current hiring demand and their desire to train their employees will help to
reveal current skill levels required across industries and demand for skills within those industries.
5.1 Demand for Skilled Workers
Generally, SMEs’ responses indicate a fairly high level of hiring of
skilled workers, as 36% desire skilled employees and 35% desire
professional employees (Figure 34 in Appendix 1). Realistically, it is
unlikely that over 70% of Afghan SMEs hire skilled or professional
employees more than any other type; therefore this may be
interpreted as more of a desire than a real need.
5.1.1. Skilled Worker Demand by City
Demand for skilled workers across cities reveals that Herat has the
highest demand for unskilled and semi-skilled workers; 43% of those
SMEs who hire unskilled workers and 40% of those who hire semi-
skilled workers were located in Herat. Herat’s high percentages of
demand for unskilled and semi-skilled workers likely mirror the same
high demand for those types of workers in the Textile Industry (see
Figures 13 and 14). Thus, it may be that Afghans do not perceive the
employees needed for manufacturing and selling textiles in Herat to
be especially skilled. Kundoz (16%) and Kabul (19%) also had high
percentages of semi-skilled employee demand, which may coincide
with their high percentage of SMEs in the Agribusiness Industry,
which often does not require more skilled labor than what it takes to
dry fruit, bake bread or sell vegetables roadside. Notably in Kabul, no
SMEs claimed to employ unskilled workers. In reality, this is highly
unlikely but it suggests that SMEs in Kabul at least perceive all of their
employees to have some skills.

30
Of those SMEs who responded that they mostly employ professional employees, 34% were located in Kandahar.
This could be due to the relatively high concentration of both the Construction and Medical and Cosmetology
industries in Kandahar, both of which also have pluralities of demand for professional employees (39% of SMEs
in the Construction industry and 54% of SMEs in the Medical and Cosmetology industry) (See Figure 35 in
Appendix 1).
Figure 13: What type of employee do you employ most? (SME Survey, Q8, Base: 564, Breakdown by city)
0%
5%
10%
15%
20%
25%
30%
35%
40%
45%
Kabul Jalalabad Mazar Herat Kandahar Kundoz
% o
f R
esp
on
de
nts
in e
ach
e
mp
loye
e c
ate
gory
Unskilled Employees
Semi-skilled Employees
Skilled Employees
Professional Employees

31
5.1.2 Skilled Worker Demand by Industry
The Agribusiness and Textiles industries have the highest percentage of SMEs who answered that they mostly
employed unskilled or semi-skilled workers as employees in these industries can likely learn skillsets on the job
with ease. Comparatively, the Medical and Cosmetology, Electronics and Technology, and Non-Technical
Services and Hospitality industries appeared to require more skilled labor (See Figure 35 in Appendix 1). The
highest percentage of SME respondents who demand professional employees were in the Construction Industry,
which may be due to both the high level of skill required to work with wood and metal, as well as furnish homes
with electricity and plumbing. Additionally, the skills required to manage construction projects, such as trade
and business skills required of contractors, may also have contributed to this industry’s high demand for
professional employees.
Figure 14: What type of employee do you employ most? (SME survey, Q8, Base: 564, Breakdown by industry)
5.2 Demand for Training
Given that SMEs are seeking to hire, generally they feel that their businesses are performing well and have
demand for a range of skilled workers, it is imperative that TVET programs be able to address the demand for
training in order to produce the skilled workers SMEs require. At the national level, it appears to be the case
that SMEs have a high demand for training as 55% of SMEs stated that they would like to receive “a great deal”
of training for their employees. 31% of SME respondents indicated that they would like “a fair amount” of
training and only 11% stated they require “not much at all” or “none at all” (See Figure 37 in Appendix 1).
Demand for training may additionally be impacted by SMEs’ requirement that employees receive on-the-job
training. If SMEs are largely training their employees on the job, they may have less of a demand for training;
alternatively, they may wish to forgo already established on-the-job training in order to receive training at
specialized training centers. According to the survey results, 60% of SMEs said that they train their employees
on the job. The amount of time they took to train their employees varied widely from less than one week to
more than one year, reflecting the wide variety of training needs in Afghan SMEs. For the respondents that
0%
5%
10%
15%
20%
25%
30%
35%
% o
f R
esp
on
de
nts
in e
ach
an
swe
r ca
tego
ry
Unskilled Employees
Semi-skilled Employees
Skilled Employees
Professional Employees

32
provide on-the-job training, 80% provide less than six months of training or none at all (see Table 17 in Appendix
1). Comparatively, of those LM respondents who had previously participated in training programs, 62% were
trained for either more than six months or more than one year (Table 26, Appendix 2).
5.2.1 Training Demand by City
In both the LM and SME surveys, potential employees and employers expressed a demand for training programs
that could improve skills and lead to higher productivity. Employers in all cities, except Kundoz, were very
interested in receiving employee training.
While the sample size for each city in the LM survey will be much greater after all four surveys are completed, at
this point (the first of four surveys) in the two-year survey study, the results offer anecdotal evidence of a strong
desire for training amongst the labor force in all cities but Kundoz. In the five other cities at least 40% of
respondents reported being “very interested” in training that would improve their job skills, while only 11.5% of
respondents in Kundoz reported being “very interested” (See Table 24 in Appendix 2).
The highest concentrations of SMEs who indicated that they demand “not very much” or no training at all were
in Kundoz (74% and 60% respectively). These results reiterated the generally negative responses received from
Kundoz, which may be a product of the fragile security, political and economic environments. SMEs in Jalalabad,
Herat and Kandahar all have no “none at all” responses when asked if they were interested in training assistance
for their employees. Positive responses “a great deal” and “a fair amount” were spread evenly across all cities
except for Kundoz, which had the lowest percentage of SMEs demanding “a great deal” of training assistance
(2%).
Figure 15: How much interest would you have in receiving training assistance for your employees? (SME Survey, Base: 927, Breakdown by city)
0%
10%
20%
30%
40%
50%
60%
70%
80%
Kabul Jalalabad Mazar Herat Kandahar Kundoz
% o
f R
esp
on
de
nts
in e
ach
like
rt
cate
gory
A great deal
A fair amount
Not very much
None at all

33
5.2.2 Training Demand by Industry
Though there appeared to be somewhat universal interest in receiving training across cities, the same cannot be
said for interest across industries. Of those who answered that they have “a great deal” of interest in receiving
training assistance for their employees, 20% were a part the Textiles industry and 20% were a part of the
Construction industry. Low levels of interest or “none at all” were highest in the Agribusiness industry where
SMEs are likely to provide their own on-the-job training.
Figure 16: How much interest would you have in receiving training assistance for your employees? (SME Survey, Q13, Base: 927, Breakdown by industry)
5.3 Demand for Skills
When asked in what skills SMEs’ employees most needed training, the top responses were: (1) General
Knowledge, 13%; (2) Literacy, Language and General Education, 12%; (3) Management and Administration, 10%;
(4) Marketing and Sales, 10%; and (5) Clothing Production/Tailoring, 9% (See Table 16 in Appendix 1 for a
complete list). These skills reflect a desire on SMEs’ parts to hire employees with general skills that can be used
across various industries. The additional desire for clothing production/tailoring skills also reflects on the needs
of the Textiles industry and its large representation in this survey’s results.
Among members of the labor market who were interested in receiving training, Literacy, Language (including
English language) and General Education were the most sought after skills, followed by those in the Textiles
industry, the Medical industry, Construction, Trades and Computers and Information Technology. Though there
is a preference for business-related skills among the SME respondents, LM respondents appear to be more
interested in trade-specific skills, i.e. Medical training, Construction skills and Technology skills. This divide may
be a result of the limited statistical significance of the LM survey findings, but this anecdotal evidence may also
represent a real gap in SME and LM skillset demands: SME owners and managers want to build businesses while
laborers want more skills. Overlap in demand does occur in desire for literacy, language and educational
training and textile skills (See Table 25 in Appendix 2).
0%
5%
10%
15%
20%
25%
30%
35%
% o
f R
esp
on
de
nts
in e
ach
like
rt
cate
gory
A great deal
A fair amount
Not very much
None at all

34
5.3.1 Demand for Skills by City
In order to assess the geographic-specific demand for skills, the top five skillsets desired in each city have been
analyzed. Skills in Marketing and Sales are most frequently in the top five skills demanded across all cities.
Management and Administration and Literacy, Language and General Education were the second and third most
frequent skill sets to be named in the top five skills demanded by SME respondents. . Though TVET initiatives
have focused on literacy training for some time in Afghanistan, this survey’s results indicate that literacy
education is still highly demanded. According to the World Literacy Foundation, countries with less than 40%
literacy rates amongst the adult population will not attain continuous and rapid economic growth. Increasing
literacy education among women has shown to be especially effective at reducing poverty, increasing family
wages, increasing family health and resulting in more children attending school. Literacy and general education
have shown to increases wages by as much as 15% per year of primary education and 25% per year of secondary
education later in an individual’s career.39 Afghanistan’s male and female literacy rates are estimated to be 43%
and 13% respectively (28% for the total population).40 Thus, increasing levels of literacy among Afghan male and
female workers should be a significant part of future TVET initiatives.
Table 1: Top 5 Skills Demanded by SMEs in Kabul
In Kabul, the top five skills demanded fall into either
Business Skills (38%), Computer/IT, Electronics
Programming and Repair skills (13%) and General
Knowledge of the industry in which the SME
respondent worked (8%). This spread of demand
for skills in Kabul emphasizes the fact that Kabul is
Afghanistan’s most modern and developed urban
center. No trade-related skills, such as metal work
or carpet making, were in the top five skills
demanded by SMEs in Kabul.
Table 2: Top 5 Skills Demanded by SMEs in Herat
In Herat, the top five skills demanded by SMEs
strongly highlights the city’s textile industry as
Clothing Production/Tailoring accounted for 32%,
nearly a third, of skills demanded. Business skills
were only demanded in the top five skills in the form
of Marketing and Sales (7%). This likely reflects SMEs
in the Textile industry’s desire to increase sales of
clothing and carpets.
39
The World Literacy Foundation. http://www.worldliteracyfoundation.org/literacy-achieve.html 40
The CIA Word Factbook, 2000 literacy estimates. https://www.cia.gov/library/publications/the-world-factbook/geos/af.html
Top 5 Skills - Kabul Percent
Management and Administration 17.2
Marketing and Sales 16.6
Computer/IT, Electronics Programming and Repair
13.4
General Knowledge 8.3
Business Development and Customer Relations
4.5
Top 5 Skills - Herat Percent
Clothing Production/Tailoring 32.1
Marketing and Sales 7.4
General Knowledge 6.8
Food Processing and Packaging 5.6
Furniture and Craft Manufacturing 5.6
Hair and Skin Treatments 5.6

35
Table 3: Top 5 Skills Demanded by SMEs in Mazar-i-Sherif
In Mazar-i Sharif, general business skills were more
commonly found in the top five skills demanded by
SMEs: 21% Management and Administration, 14%
Marketing and Sales, as well as 6% Business
Development and Customer Relations and Quality
Assurance and Quality Check. Mazar was also one of
three of the six cities surveyed that demanded
Literacy, Language and General Education (9%). This
corresponds with the Non-Technical Services and
Hospitality industry (19% demand for skills in Literacy,
Language and General Education), which is most heavily concentrated in Mazar, according to this survey’s
results (30% of SME respondents in the Non-Technical Services and Hospitality industry are located in Mazar).
This likely reflects the city’s high tourist volume to sites such as the Blue Mosque and events such as Mazar’s
famous New Year’s (Norooz) party.
Table 4: Top 5 Skills Demanded by SMEs in Kundoz
In Kundoz, 26% of SME respondents stated that
General Knowledge was the skill most demanded by
their business. This relatively high percentage of a
vague answer likely reflects the general mood in
Kundoz, which is reiterated throughout the survey
responses in this report. SME respondents who have
a negative outlook for their business or for TVET may
feel less motivated to give clearer, more specific
answers. On the other hand, General Knowledge of the industry in which the SME respondents work may be
sufficient enough for Kundoz’s SMEs to bolster their businesses. Kundoz also had skill sets demanded within the
top five that align with the Textile industry: Clothing Production/Tailoring (11%) and Carpet Making (6%). This
likely reflects the relatively high percentage of SMEs respondents participating in the Textiles industry in Kundoz
(19%, second after Herat when compared to all six cities). Notably, skills associated with the Non-clothing/Non-
electronic Consumer Goods industry, such as furniture or handicraft production, were absent from Kundoz’s top
five most desired skills despite the fact that SMEs in this industry were most concentrated in Kundoz. The
demand for Textile-related skills in Kundoz may indicate that Kundoz SMEs see the Textile industry as more
lucrative than handicraft and furniture production.
Top 5 Skills – Mazaar-i-Sherif Percent
Management and Administration 20.8
Marketing and Sales 13.8
Literacy, Language and General Education 9.4
Computer/IT, Electronics Programming and Repair
8.2
Quality Assurance and Quality Check 5.7
Business Development and Customer Relations
5.7
General Knowledge 5.7
Top 5 Skills – Kundoz Percent
General Knowledge 25.6
Clothing Production/Tailoring 10.6
Management and Administration 10.0
Marketing and Sales 10.0
Carpet Making 5.6
Computer/IT, Electronics Programming and Repair
5.6

36
Table 5: Top 5 Skills Demanded by SMEs in Kandahar
In Kandahar, the top five skillsets consisted mostly of
business-related skills, General Knowledge and
Computer/IT, Electronics Programming and Repair.
Literacy, Language and General Education accounted
for nearly 17% of the skills demanded in Kandahar,
which may be a product of both the high amount of
SMEs in the Construction industry in Kandahar, as
well as the relatively high percentage of SMEs
working in the Medical and Cosmetology industries.
Table 6: Top 5 Skills Demanded by SMEs in Jalalabad
In Jalalabad, a city famous for its university and
literary heritage, Literacy, Language and General
Education was the second most demanded skill, after
General Knowledge, accounting for 12% of skills
demanded. Business skills such as Marketing and
Sales, as well as Management and Administration
were also found in the top five skills demanded. The
demand for business skills as well as literacy and language skills corresponds with the high percentages of SMEs
in Jalalabad who participate in the Construction and Energy and Transportation industries, both of which
demanded business skills and literacy and language skills in their top five skills. This is no surprise as these two
industries regularly work with raw materials and chemicals and rely heavily on the sales of their products in a
competitive and internationally-influenced market.
5.3.2 Demand for Skills by Industry
In addition to analyzing the top five skillsets by geography, the top five skills demanded in each industry were
also analyzed. Literacy, Language and General Education as well as Marketing and Sales and General Knowledge
of the industry were the three most frequently named skill sets in the top five skills demanded across all eight
industries.
Table 7: Top 5 Skills Demanded by SMEs in Agribusiness
In the Agribusiness industry, business skills such as
Management and Administration, as well as
Marketing and Sales were found in the top five
skills demanded. Not surprisingly, Food
Processing and Packaging was the second most
demanded skill set. Literacy, Language and
General Education also made it into the top five.
This spread of business, language and trade-related skills reflect the complexity of the Agribusiness industry,
which includes both self-employed individuals who sell dried fruits roadside and medium to medium-large-sized
Top 5 Skills - Kandahar Percent
General Knowledge 22.6
Literacy, Language and General Education 16.5
Marketing and Sales 9.8
Computer/IT, Electronics Programming and Repair
9.8
Management and Administration 6.1
Top 5 Skills - Jalalabad Percent
General Knowledge 13.3
Literacy, Language and General Education 12.0
Management and Administration 10.4
Marketing and Sales 10.3
Clothing Production/Tailoring 9.4
Top 5 Skills - Agribusiness Percent
General Knowledge 22.2
Food Processing and Packaging 16.2
Management and Administration 11.4
Marketing and Sales 9.6
Literacy, Language and General Education 9.0

37
enterprises, such as market vendors and grocers, who employ more workers and require different skills at
various stages of the value chain.
Table 8: Top 5 Skills Demanded by SMEs in the Textiles Industry
In the Textiles industry, trade-related skills such as
Clothing Production/Tailoring and Carpet Making
accounted for the majority of demanded skills (54%).
Far behind, Marketing and Sales (14%) skills were
demanded as well as General Knowledge of the
industry (8%). This may reflect the industry’s relative
lack of skilled workers as demonstrated in section 6.3
Supply of Skilled Workers by Industry.
Table 9: Top 5 Skills Demanded by SMEs in the Construction Industry
The Construction industry also indicated demand for
mostly trade-related skills such as Electrician/Plumber
(16%) and Metalworker (11%). Literacy, Language
and General Education was the third most demanded
skill set in the Construction industry, which may be
due to the industry’s high levels of participation from
non-Afghans, such as contractors from the
international community. The Construction industry
had the highest percentage of SMEs state that they
hired foreign workers (26% of respondents), which may be due to the lack of skilled construction workers in
Afghanistan (electricians, plumbers and metalworkers as demonstrated by demand in this table) and/or the
nature of the Construction industry itself, which is highly dependent on raw material, import and exports, as
well as cross-cultural and international engagements.
Table 10: Top 5 Skills Demanded by SMEs in the Electronics and Technology Industry
In the Electronics and Technology industry, not
surprisingly Computer/IT, Electronics Programming
and Repair skills were the most demanded.
Management and Administration skills were highly
demanded, likely reflecting the nature of running IT
stores in large cities like Kabul. Literacy, Language and
General Education were demanded by nearly 13% of
SME respondents, which may be a product of the
nature of the Technology industry as it is also very internationally driven. Note that there is no fifth skill
demanded in this table due to the fact that the remaining 20% of skills demanded were spread so thinly over
many skill sets, their value here would be nil.
Top 5 Skills - Textiles Percent
Clothing Production/Tailoring 41.6
Marketing and Sales 14.1
Carpet Making 11.9
Management and Administration 8.1
General Knowledge 8.1
Top 5 Skills – Construction Percent
Electrician/Plumber 15.7
General Knowledge 15.7
Literacy, Language and General Education
14.0
Metalworker 11.0
Marketing and Sales 9.3
Top 5 Skills – Electronic & Technology Percent
Computer/IT, Electronics Programming and Repair
33.9
General Knowledge 19.6
Management and Administration 12.5
Literacy, Language and General Education
12.5

38
Table 11: Top 5 Skills Demanded by SMEs in the Medical and Cosmetology Industry
In the Medical and Cosmetology industry, Hair and
Skin Treatments, such as hair cutting and make-up
artistry were the highest demanded skillset.
Literacy, Language and General Education was the
second highest demanded skill set, which logically
reflect the Medical industry’s need for workers who
can read directions on medical technology, lab
results or prescriptions. Specialized technicians, such as pharmacy techs or medical equipment technicians,
accounted for 22% of the skillsets demanded in this industry, implying that highly educated professionals like
doctors and pharmacists are in need of qualified assistants. With the exception of Marketing and Sales, business
skills were notably absent from the Medical and Cosmetology industries. This is likely due to the fact that the
industry is more commonly managed by health professionals themselves and not businessmen.
Table 12: Top 5 Skills Demanded by SMEs in the Non-Clothing/Non-Electronic Consumer Goods Industry
In the Non-clothing/Non-electronic Consumer Goods industry, trade-related skills, such as Furniture and Craft
Manufacturing barely took the spot at the top of
skills demanded. Business skills and
literacy/language skills, when combined, more than
double the demand for trade-related skills. This
implies that SME respondents in the Non-
clothing/Non-electric Consumer Goods industry are
relatively content with the trade skills available but
need assistance organizing their businesses and getting their products off the shelves.
Table 13: Top 5 Skills Demanded by the SMEs in the Energy and Transportation Industry.
In the Energy and Transportation industry, Literacy,
Language and General Education was the highest
demanded skill set, accounting for 21% of skills
demanded by SMEs in this industry. The remaining
top five skills demanded are all business skills.
Trade-related skills did not make it into the top five
demanded skills. This is likely a reflection of the
nature of the Energy and Transportation industry, which requires high-level organization and adherence to
national and international regulations. Given that Afghanistan imports its energy and modes of transportation,
the ability to read and understand written directions is an important skill in this industry.
Top 5 Skills – Medical and Cosmetology Percent
Hair and Skin Treatments 25.0
Literacy, Language and General Education 11.1
Pharmacy Technician 11.1
Medical Equipment Technician/Repair 11.1
Marketing and Sales 8.3
Top 5 Skills – Non-Clothing/Non-Electr. Percent
Furniture and Craft Manufacturing 17.2
Management and Administration 15.1
Literacy, Language and General Education 15.1
Marketing and Sales 14.0
General Knowledge 8.6
Top 5 Skills – Energy and Transportation Percent
Literacy, Language and General Education 21.1
Marketing and Sales 15.8
Management and Administration 12.3
General Knowledge 10.5
Business Development and Customer Relations
8.8
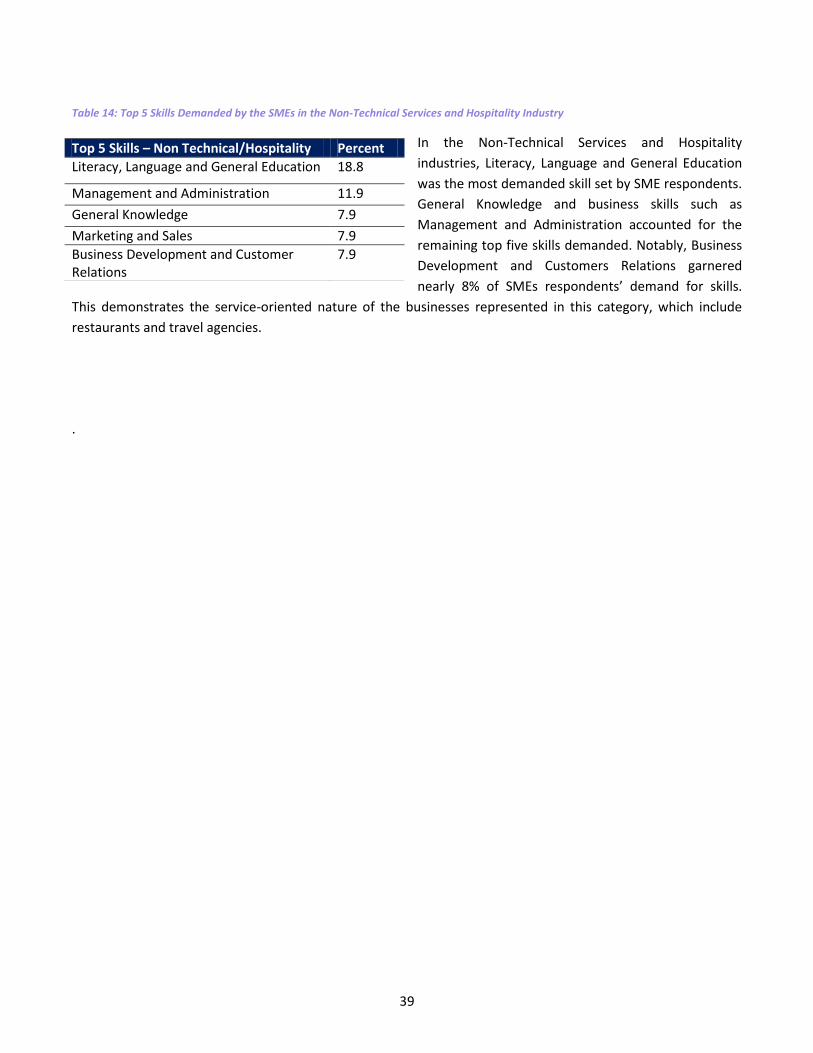
39
Table 14: Top 5 Skills Demanded by the SMEs in the Non-Technical Services and Hospitality Industry
In the Non-Technical Services and Hospitality
industries, Literacy, Language and General Education
was the most demanded skill set by SME respondents.
General Knowledge and business skills such as
Management and Administration accounted for the
remaining top five skills demanded. Notably, Business
Development and Customers Relations garnered
nearly 8% of SMEs respondents’ demand for skills.
This demonstrates the service-oriented nature of the businesses represented in this category, which include
restaurants and travel agencies.
.
Top 5 Skills – Non Technical/Hospitality Percent
Literacy, Language and General Education 18.8
Management and Administration 11.9
General Knowledge 7.9
Marketing and Sales 7.9
Business Development and Customer Relations
7.9

40
6.0 SUPPLY
As SME respondents have indicated their demand for skilled workers, training and specific skillsets, a significant
obstacle for SME owners and managers is the lack of supply of employees with adequate specified trainings and
skills. Supply of employees with adequate training and skills was measured in the survey by asking SME
respondents how frequently they are able to find employees with the training and skills needed to sufficiently
complete the required job’s tasks.
6.1 National Supply
While a large percentage of SME owners/managers said that they hire specialized employees, they also clearly
had a problem finding employees with the necessary skills. Only 7% across all cities said that they were “always”
able to find employees with adequate training and skills to perform their job; while 26% of all employers said
that they were “never” able to find employees with necessary training and skills.
Figure 17: How often are you able to find employees with adequate training and skills to perform their joins? (SME Survey, Q9, Base: 911, six cities aggregated)
0%
5%
10%
15%
20%
25%
30%
35%
40%
Always Most of the time Only sometimes Never Undefined/Unknown
% o
f R
esp
on
de
nts

41
6.2 Regional Supply
Closer analysis reveals that the majority of SME employers in each city were “only sometimes” or “never” able
to find properly qualified workers. The highest percentage of SME respondents who were able to “always” find
employees with adequate training and skills were found in Kabul. Given Kabul’s size, relative modernity and
higher standard of living compared to other cities in Afghanistan, it is not surprising that the plurality of SME
respondents who are “always” able to find qualified workers reside there. Notably, Mazar had the highest
concentration of SMEs who responded that “most of the time” they are able to find adequately trained and
skilled workers, as well as the highest concentration of SMEs who responded that they are “never” able to find
qualified workers. This may be due to the variations within the major industries in Mazar. As displayed in Figure
19, Non-Technical Services and Hospitality, which had the highest concentration of SME respondents in Mazar,
has near equal percentages of respondents who said they were able to find trained and skillful employees (21%)
as those that said they were not (22%).
Figure 18: How often are you able to find employees with adequate training and skills to perform their jobs? (SME Survey, Q9, Base: 911, breakdown by city)
6.3 Supply by Industry
A similar trend is also demonstrated when the supply of skilled workers is analyzed by industry: SME survey
respondents appeared to rarely be able to find workers with the proper skills. The one exception to this is the
Electronics and Technology industry in which 46% of SMEs could “always” or “most of the time” find workers
with the necessary skills (See Figure 39 in Appendix 1). While members of the labor market desire electronics
and computer skills, these same skills did not top employers’ most desired list (see section 5.3 Demand for
Skills). As the use of technology increases across the country, it is increasingly likely that youth (representing the
largest age bracket of Afghanistan’s population and labor market) entering the labor market in urban areas will
have some experience with electronics and computer skills. This is also demonstrated below in Figure 19, as the
0%
5%
10%
15%
20%
25%
30%
35%
Kabul Jalalabad Mazar Herat Kandahar Kundoz
% o
f R
esp
on
de
nts
in e
ach
like
rt
cate
gory
Always
Most of the time
Only sometimes
Never

42
Electronics and Technology industry has the highest concentration of SME respondents who are “always” able to
find adequately trained and skillful employees (19%).
Industries that seem to be suffering from a lack of skilled workers in particular are the Agribusiness and Textiles
industries, with 68% and 70% of SMEs “only sometimes” or “never” able to find skilled workers (See Figure 39 in
Appendix 1). Of all SME respondents, the highest percentages of “only sometimes” and “never” responses came
from the Agribusiness and Textiles industries. SMEs in the Construction industry were the mostly like to “only
sometimes” find adequately trained and skillful employees.
Figure 19: How often are you able to find employees with adequate training and skills to perform their jobs? (SME Survey, Q9, Base: 911, Breakdown by industry)
6.4 Demand for Foreign Labor
The lack of available skilled employees in Afghanistan has led a significant percentage of SME employers to hire
employees from outside of Afghanistan. The true significance of this phenomenon is that even these very small
localized enterprises are forced to hire foreign workers. Despite the seemingly low response of 23% of
respondents hiring foreign workers, as business size increased, so did the likelihood that SMEs would employ
foreign workers at a lower cost. Of those respondents who have more than 50 employees, almost 60% stated
that they had hired cheaper foreign labor. Given this trend, it is likely that the percentage of foreign workers at
larger enterprises is likely many times higher.
Specific reasons for SMEs’ demand for foreign labor have not been thoroughly identified but the 2003 Labor
Market Information Survey from the IRC and MoLSAMD suggests that the relatively lower cost of housing
migrant workers from Pakistan, China, India and Iran in hostels, the ability to more easily manage migrant
workers, as well as the inclination that these workers had more “finely honed skills” compared to Afghans
encouraged Afghan SMEs to hire non-Afghan employees.
0%
5%
10%
15%
20%
25%
30%
% o
f R
esp
on
de
nts
in e
ach
an
swe
r ca
tego
ry
Always
Most of the time
Only sometimes
Never

43
6.4.1 Demand for Foreign Labor by Region
For SMEs the percentage of sampled firms that have had to hire foreign workers is relatively consistent between
cities. The highest percentage of SMEs that hired foreign workers was in Kandahar (21%), while Herat has the
smallest percentage of foreign hires (13%). Given these two cities’ geographic locations (Herat is close to the
Iranian border and Kandahar is close to the Pakistani border), the influx of migrant workers into Afghan SMEs’
businesses may also be representative of the political and economic situations present in the countries from
where the migrant workers are coming. For cities so close to the border, the decision to hire migrant workers is
likely influenced by both Afghanistan’s current labor market and economic situation as well as Afghanistan’s
neighbors’ economic situation and labor market. However, overall it appears that geography may not play a
significant role in whether SMEs seek foreign workers, but industry type may be a factor in the decision to hire
non-nationals.
Figure 20: Have you ever had to hire employees from outside of Afghanistan because potential Afghan employees did not have the necessary training and skills? (SME Survey, Q11, Base: 908, Breakdown by city)
0%
5%
10%
15%
20%
25%
Kabul Jalalabad Mazar Herat Kandahar Kundoz
% o
f R
esp
on
de
nts
in e
ach
an
swe
r ca
tego
ry
Yes
No

44
6.4.2 Demand for Foreign Labor by Industry
Of those respondents who stated that they had hired foreign laborers, 26% were members of the Construction
industry. This is 9 percentage points higher than any other industry and 5% higher than SMEs within the city
with the highest “yes” response (Kandahar). A large portion of Afghanistan’s migrant workforce is made up of
Pakistanis (though estimates on the number of workers have never been verified) who serve across a wide
variety of industries; however, open source anecdotal evidence eludes to Pakistani workers entering the Afghan
labor market early on in Afghanistan’s reconstruction as the construction industry experienced a boom, but had
few skilled Afghan workers to fill the demand. Similar findings have resulted from the IRC and MoLSAMD’s 2003
Afghan Labor Market Survey.41 The industries with the highest percentage of SMEs who did not hire foreign
labor were the Textile industry and the Agribusiness industry. This corresponds with the highest percentages of
SME respondents in those two industries who claimed that they hire unskilled and semi-skilled laborers.
Figure 21: Have you ever had to hire employees from outside of Afghanistan because potential Afghan employees did not have the necessary training and skills? (SME Survey, Q11, Base: 908, Breakdown by industry)
While a significant percentage of employers have hired foreign workers in the past, respondents seemed
predisposed to hire Afghan workers if they had better skills and training, even if they were more expensive than
comparable foreign workers. 43% of employers said they would be either “very likely” or “somewhat likely” to
hire a skilled Afghan worker at a higher salary rather than an equally skilled foreign worker at a lower salary. This
counterintuitive finding may be due in part to the stigma of hiring Pakistani workers (who work both illegally and
for lower wages) resulting in some Afghans’ unwillingness to admit that they employ workers who many
Afghans feel have contributed to their unemployment. If employers are truly willing to pay more for skilled
Afghan workers, TVET programs focusing on construction skills could be particularly effective and well-received.
41
International Rescue Committee, Afghanistan Labor Market Information Survey, Ministry of Labor, Social Affairs, Martyrs and Disabled. September 2003
0%
5%
10%
15%
20%
25%
30%
% o
f R
esp
on
de
nts
in e
ach
an
swe
r ca
tego
ry
Yes
No

45
7.0 BARRIERS and OPPORTUNITIES FOR TVET
The survey sought to identify possible barriers or
obstacles for TVET, as well as opportunities for
TVET in Afghanistan’s current labor market. The
survey results suggest that obstacles for TVET
include low awareness of training centers, poor
perceptions of trained graduates and an
unwillingness to spend money on training.
Openings for opportunities for TVET programs
include high levels of the perception that training
employees in specialized skills can increase SME
profits, as well as a willingness of SMEs to allow
time away from work for their employees to
receive training.
An additional two obstacles for TVET, which were not identified in this survey, were revealed in a 2003 labor
market survey conducted by the IRC and MoLSAMD. This labor market survey identified the weak qualifications
of the training centers’ teaching staff and the centers’ inability to create formal training curricula as two
significant downfalls of TVET in Afghanistan.42 Given that the IRC/MoLSAMD survey was conducted nine years
ago, it is possible that some attitudes have changed. This survey focused on perceptions of the quality of
training graduates in order to ascertain perceptions of training centers in general, it is likely that perceptions of
teachers’ qualifications and perceptions of the training centers’ curricula, as identified by the IRC/MoLSAMD
survey, also affect SMEs’ perceptions of TVET.
7.1 Barriers for TVET
This survey identified three barriers or obstacles for future TVET programs in Afghanistan: (1) SME awareness of
TVET; (2) negative perceptions of TVET; and (3) SME unwillingness to pay for TVET.
7.1.1 Awareness
Awareness of TVET amongst SMEs presents an obstacle for future TVET programs. Nationally, 75% of SME
respondents indicated that they are unaware of TVET opportunities in their locations. The success of future
TVET programs likely rests on increasing awareness of TVET opportunities across the nation.
42
Ibid

46
Awareness by City
The majority of SME respondents in all six cities indicated that they are not aware of TVET in their locales (Figure
22). The highest percentage of SMEs who indicated that they are aware of TVET in the area was from Herat
(34%), while the highest percentage of SMEs who indicate that they are not aware were located in Kandahar
(87%). Kandahar’s relatively high levels of unawareness of TVET may be due to the high percentage of SMEs
working in the Agribusiness industry, who also indicated relatively high levels of unawareness of TVET.
Figure 22: Are you aware of private training centers or institutes in your area that offer job skills training? (SME Survey, Q15, Base: 934, Breakdown by city)
0%
10%
20%
30%
40%
50%
60%
70%
80%
90%
100%
Kabul Jalalabad Mazar Herat Kandahar Kundoz NationalAverage
% o
f R
esp
on
de
nts
in e
ach
cit
y
Yes
No
Undefined/Unknown

47
Awareness by Industry
Just as with the city breakdown, the majority of SMEs across all industries stated that they were not aware of
TVET opportunities in their area. The industry with the highest percentage of SMEs who reported being aware
of training in their locale participated in the Medical and Cosmetology Industry. This may be due to the
education requirements expected of people working in hospital, clinics or laboratories. The Agribusiness and
Non-clothing/Non-electronic Consumer Goods industries had the highest levels of SMEs who stated they were
unaware of training centers in their area. Agribusiness’ low awareness corresponds with its relatively high
presence in Kandahar and Kundoz, which recorded the first and second highest levels of unawareness of TVET
amongst the six major urban centers.
Figure 23: Are you aware of private training centers or institutes in your area that offer job skills training? (SME Survey, Q15, Base: 934, Breakdown by industry)
7.1.2 Perception toward TVET Services
In this survey, perceptions toward TVET were measured by SMEs’ opinions of the graduates of local TVET
programs. Opinions of the quality of graduates of local TVET programs likely influences SMEs’ desire to hire
those graduates and/or to send their employees to these centers for training. If SMEs’ perceptions of the local
graduates are poor, they will be less likely to hire them and thus, less likely to fill their open positions with
qualified applicants unless skilled workers can be found through other means, such as foreign workers or skilled
Afghans who are willing to move to the city center. At the national level, 63% of SME respondents indicate that
their local TVET programs do not produce high quality graduates. Notably, this percentage is exactly the same
as the percentage of SMEs who reported being “only sometimes” or “never” able to hire employees with the
necessary training and skills: 63%.
0%
10%
20%
30%
40%
50%
60%
70%
80%
90%
% o
f R
esp
on
de
nts
in e
ach
ind
ust
ry
Yes
No
Undefined/Unknown

48
Perception by City
The majority of all SME respondents in all cities reported that they do not know of any training centers and
institutes that produce high quality graduates. The highest percentage of SME respondents who reported not
knowing training centers that produce high quality graduates were in Kandahar (79%). Jalalabad had the highest
percentage of SMEs who report being able to identify training centers that produce high quality graduates
(38%). Herat had the second highest percentage of SMEs who said that their local training center produce high
quality graduates, which could be due to the high percentage of SMEs participating in the Textiles Industry,
which in addition to the Medical and Cosmetology industry, recorded the highest levels of high quality graduates
from local training centers.
Figure 24: Are there any training centers or institutes that you think produce graduates of high quality? (SME Survey, Q17, Base: 799, Breakdown by city)
0%
10%
20%
30%
40%
50%
60%
70%
80%
90%
Kabul Jalalabad Mazar Herat Kandahar Kundoz NationalAverage
% o
f R
esp
on
de
nts
in e
ach
cit
y
Yes
No
Undefined/Unknown

49
Perception by Industry
At least half of all SME respondents in each of the eight defined industries indicated that they do not think the
local training centers produce high quality graduates. SMEs in some industries, such as the Electronics and
Technology industry (72%) and the Non-clothing/Non-technological Consumer Goods industry (71%), reported
much higher levels of believing local training centers do not produce high quality graduates. The Textiles
industry and the Medical and Cosmetology industry had the highest levels of SME respondents state that they
believed training centers produced high quality graduates. 20% of respondents in the Construction industry
stated that they believed training centers produce high quality graduates. This may be linked to the relatively
high level of Construction Industry SMEs based in Jalalabad, which reported the highest levels of SMEs who
believe training centers produce high quality graduates.
Figure 25: Are there any training centers or institutes that you think produce graduates of high quality? (SME Survey, Q17, Base: 799, Breakdown by industry)
Other reasons that may contribute to poor perceptions of TVET include low student attendance levels and
training centers employing poorly qualified teachers as reported by the Labor Market Survey conducted by IRC
and MoLSAMD in 2003.43
7.1.3 Financial Motivation
The SME survey’s results indicate that the cost of training is a potential barrier for business owners/managers
who wish for their employees to increase their skills and education. At the national level, 60% of SME
respondents indicated that they are unwilling to pay a training center to train their employees to improve their
job skills. Unwillingness to pay for training may be a result of a precedent set over the past years in Afghanistan,
in which 97% of training centers paid students to attend.44 SMEs may feel that this is the most appropriate
manner for employees or potential employees to receive training: receiving a stipend from the training centers
43
Ibid 44
Ibid
0%
10%
20%
30%
40%
50%
60%
70%
80%
% o
f R
esp
on
de
nts
in e
ach
ind
ust
ry
Yes
No
Undefined/Unknown

50
themselves. In order to create a sustainable TVET market in Afghanistan, the issue of paying for training must be
resolved amongst the SME owners/managers as well as laborers in the workforce.
The level of willingness on the part of employees to pay for training is likely linked to their past knowledge of,
and experience with, free training. 60% of respondents of the LM survey who had participated in past trainings
said that these trainings had been free of charge. 30% of employees stated that they believed their employer
was either “very likely” or “somewhat likely” to pay for training, which this survey’s results contradict. Rather,
the results indicate that employers paying for their employees training is highly unlikely. Overcoming the
perception that training should be free to the participants will be one of the most difficult challenges in building
a sustainable private training and vocational education industry in Afghanistan (See Table 28 in Appendix 2).
Figuring out a financing strategy that meets the expectations of employers and trainees about who will pay for
training and how much it should cost will be the key factor in the success or failure of any sustainable workforce
development program.
Financial Motivation by City
More than half of SME respondents stated their objection to paying for their employees’ training in all cities
except for Kabul and Jalalabad. In these two cities, the majority indicated that they are willing to pay for training
for their employees (See Figure 26). In accordance with the survey-wide trend of negative responses, Kundoz
had the highest percentage of SMEs who stated they were unwilling to pay for training for their employees
(89%).
Figure 26: Would you be willing to pay a training center or institute to train your employees and improve their job skills (SME Survey, Q22, Base: 927, Breakdown by city)
0%
10%
20%
30%
40%
50%
60%
70%
80%
90%
100%
Kabul Jalalabad Mazar Herat Kandahar Kundoz NationalAverage
% o
f R
esp
on
de
nts
in e
ach
cit
y
Yes
No
Undefined/Unknown

51
Financial Motivation by Industry
The majority of SMEs in all industries reported being unwilling to pay for training for their employees (Figure
27). The industry with the highest percentage of SMEs who were unwilling to pay for training was the Textiles
Industry (64%). Given that Textiles is the dominant industry in Herat, these results may explain why Herat has
the third highest percentage of SMEs who will not pay for training (as shown above). The Energy and
Transportation industry (46%) as well as the Medical and Cosmetology industry (43%) had the highest
percentages of SMEs willing to pay for training for their employees.
Figure 27: Would you be willing to pay a training center or institute to train your employees and improve their job skills (SME Survey, Q22, Base: 927, Breakdown by industry)
7.2 Opportunities for TVET
Despite the significant barriers for TVET, SME survey results indicate that there are at least two opportunities for
TVET across cities and industries: (1) perceived profitability of TVET for SMEs and (2) SMEs willingness to allow
time for training.
7.2.2 Perceived Profitability
Despite the lack of awareness and negative sentiments toward training programs for workers, a vast majority of
SME respondents believed that hiring employees with specialized skills from a training center or institute would
make the businesses more profitable. These results indicate that while there is little faith in the abilities of
current TVET graduates (as discussed above), SME respondents still perceive skills training in and of itself to be
good for business. Thus, SME respondents have not given up on the idea of TVET despite its apparently
0%
10%
20%
30%
40%
50%
60%
70%
% o
f R
esp
on
de
nts
in e
ach
ind
ust
ry
Yes
No

52
disappointing results thus far. Identifying why current graduates are perceived to be poorly prepared for the
work force by SMEs will likely aid in the design and effectiveness of future TVET programs.
Perceived Profitability by City
The majority of SME respondents in all six cities indicated their belief that training would make their business
more profitable. However, the highest amount of “no” responses in a city was 16% in Kundoz, accounting for
50% of all cities’ “no” responses. High levels of negative perceptions of training’s profitability for SMEs’
businesses in Kundoz matches the generally more negative responses collected from Kundoz across all survey
questions. Notably, no SMEs in Kandahar indicated having a perception that training would not improve their
business’ profitability. Positive perceptions of training’s effects on business’ profitability were generally spread
evenly across all cities. The results suggest that future TVET programs may be greeted warmly by SMEs in all
cities if they are designed in a way that produces better graduates. However, TVET programs may experience
heavier resistance in Kundoz unless they are marketed to address the higher levels of negative perceptions
there.
Figure 28: Do you think that hiring employees with specialized training at a training center or institute would make your business more profitable? (SME survey, Q19, Base: 869, Breakdown by city)
0%
10%
20%
30%
40%
50%
60%
70%
80%
90%
100%
Kabul Jalalabad Mazar Herat Kandahar Kundoz NationalAverage
% o
f R
esp
on
de
nts
in e
ach
cit
y
Yes
No
Undefined/Unknown

53
Perceived Profitability by Industry
SMEs in all eight industries indicated their belief that training would make their businesses more profitable. The
industry with the highest level of negative responses was the Non-clothing/Non-electronic Consumer Goods
industry (10%). Given that this industry was most heavily concentrated in Kundoz, it may explain in part why
perceptions of TVET in Kundoz were so poor. The highest levels of positive responses were spread almost
evenly across all industries, the highest being in the Medical and Cosmetology industry (94%).
Figure 29: Do you think that hiring employees with specialized training at a training center or institute would make your business more profitable? (SME survey, Q19, Base: 869, Breakdown by industry)
7.2.1 Time
In addition to positive perceptions of TVET’s impact on business profits, the survey results indicate that SMEs are
also willing to give their employees time away from work in order to complete specialized training courses that
improve their job skills. 69% of SME respondents indicated that they would allow time away from work for
training; 27% indicated that they would not allow time away from work for specialized training. In a survey of
the labor market, conducted in 2003, the IRC and MoLSAMD found that the average length of course delivery
was eight months. However, student attendance was for only half the day. This effectively reduces the actual
training time to about four months and demonstrates the poor utilization of training resources.45 Thus, while
this survey indicates that SMEs are willing to allow time for training, TVET programs may work to improve
student attendance and efficient use of training centers’ resources.
In the Labor Market survey 35% of respondents said that they had, in the past, completed some sort of training
program. These programs ranged from one day to more than a year in length. In fact, almost a quarter of
45
Ibid
0%
10%
20%
30%
40%
50%
60%
70%
80%
90%
100%
% o
f R
esp
on
de
nts
in e
ach
ind
ust
ry
Yes
No
Undefined/Unknown

54
respondents who said that they had participated in a training program said that the program had been for one
year or longer. This offers at least anecdotal evidence that members of the labor force are willing to commit
significant amounts of time to a training program (See Table 26 in Appendix 2). Responses to the Labor Market
survey support this theory, as those who were interested in participating in training also expressed a willingness
to participate in an extended period of training.
Respondents to the Labor Market survey were also asked to assess the likelihood that their current employer
would give time away from work or pay for training. Approximately 50% of respondents said that their
employer was unlikely to provide assistance for training either in the form of time away from work or paying for
training.
Breakdown by City
The majority of SMEs in every city except for Kundoz indicated that they would allow time away from work for
training. In Kundoz, more than half (54%) of SME respondents stated that they would not allow time away from
work for training (Figure 30). This contradicts evidence above in which SME respondents stated that they
believed training would make their businesses more profitable. However, these results are in step with lower
levels of awareness and higher levels of negative perceptions of TVET in Kundoz compared to most other cities
in Afghanistan. Willingness to allow time for training was highest in Kandahar (87%), which corresponds to the
relatively high amounts of SMEs in Kandahar who participated in the Medical and Cosmetology industry as well
as the Agribusiness industry.
Figure 30: Would you be willing to allow employees time away from work to complete specialized training course that will improve their job skills? (SME Survey, Q20, Base: 916, Breakdown by city)
0%
10%
20%
30%
40%
50%
60%
70%
80%
90%
100%
Kabul Jalalabad Mazar Herat Kandahar Kundoz NationalAverage
% o
f R
esp
on
de
nts
in e
ach
cit
y
Yes
No
Undefined/Unknown

55
Breakdown by Industry
The majority of SME respondents across all industries indicated that they are willing to allow time off from work
for specialized training (Figure 31). The industry with the highest level of negative responses was the Non-
clothing/Non-electronic Consumer Goods industry (31%) followed closely by the Textiles Industry (30%). The
high amount of negative responses in the Non-clothing/Non-electronic Consumer Goods industry corresponds
with the majority of SMEs in Kundoz who also gave negative responses to allowing time for training.
Additionally, the high level of “no” answers in the Textiles industry matches relatively high “no” responses in
Herat, where Textiles is the leading industry. Positive responses were spread evenly across industries.
Figure 31: Would you be willing to allow employees time away from work to complete specialized training course that will improve their job skills? (SME Survey, Q20, Base: 916, Breakdown by industry)
0%
10%
20%
30%
40%
50%
60%
70%
80%
% o
f R
esp
on
de
nts
in e
ach
ind
ust
ry
Yes
No
Undefined/Unknown

56
PRELIMINARY CONCLUSIONS Geographic Limitations: Location of participants does not appear to pose any considerable difficulties to
the implementation of TVET programs. However, consistently negative indicators from Kundoz,
including poor perceptions of the local economy, decreasing security, low demand for skilled workers,
and relatively low interest in training programs and expending time/money on skills training may
present significant obstacles to TVET programs’ entry into the private training and vocational education
industry in the Kundoz region. TVET initiatives that seek to have greater impacts on specific cities may
consider targeting the industries that are relatively more concentrated in a given location; for example,
targeting the Textiles industry to improve livelihoods in Herat or the Non-Technical Services and
Hospitality industry to increase skilled workers in Mazar-i Sharif.
TVET Marketing and Image Shaping: Poor awareness of training opportunities was a prevalent problem
amongst both SMEs surveyed and LM survey participants. Increasing knowledge of TVET programs,
locations and the services they offer will be essential in creating a sustainable, well-regarded workforce
development initiative. Persistently negative ratings of training centers by SME respondents (63%
believe training centers did not produce high quality graduates) may threaten the appeal of future TVET
programs. Therefore, marketing campaigns designed to promote the benefits of TVET (via real-world
case studies for example) and/or counter the perception that new training courses are low quality while
highlighting the benefits to participants and their employers will be necessary.
Dependence on Free Trainings: Both SME and LM survey participants appear to be time rich and money
poor. The oversaturation of the vocational education industry with free programs appears to have
created a cycle of dependence on complimentary courses. Overcoming the unwillingness on the part of
SME owners/operators and potential trainees to pay for training programs may be key to the success of
introducing new TVETs.
Target Textiles and Construction: TVET may find success in the Afghan labor market if programs target
medium-sized SMEs in the Construction and Textiles industries. These are the industries in which
respondents from the LM seem to desire skills and in which SMEs want their employees to gain more
skills. Targeting these industries with TVET may also reduce the need of Afghan SMEs to hire non-
Afghan employees.
Focus on females in the Textiles industry: Though increasing women’s participation in all industries is an
overarching goal, targeting the Textiles industries may prove to reap the most immediate successes.
The Textiles industry appears to be the easiest industry for Afghan women to enter. Women who
undergo TVET training for the sake of entering the Textiles industry may have the opportunity to learn
business skills that are beneficial in not only the Textiles industry but also in other industries, should
they ever get the opportunity to enter those industries.

57
Focus on business skills instead of trade skills: The survey results show that across all cities and all
industries, business skills are desired by SME owners and managers. SMEs in only one city, Herat, and
two industries, the Textiles industry and the Medical and Cosmetology industries, demanded more trade
skills than General Knowledge or business skills.
Promote literacy training: The desire for literacy was prevalent across all cities, all industries and
amongst both SME and LM respondents. The benefits of increased levels of literacy on economic
growth and human development are well documented. TVET initiatives that ignore the demand for
literacy and the lack of supply in Afghanistan will not have a sustainable impact on Afghanistan’s
economic development.
Understanding the importance of Agribusiness: As the most evenly distributed industry across all six
major cities and one of the two most important contributors to Afghanistan’s economy, the Agribusiness
industry has the potential to affect the livelihoods of all Afghans. Despite its importance in the Afghan
economy, the Agribusiness industry garners considerably low marks in this survey; consisting of mostly
self-employed, very young or very old, unskilled or semi-skilled laborers; having a low intent to hire
among SMEs and relatively low interest in receiving training, perhaps due to the industry’s generally low
awareness of training, poor perceptions of current TVET opportunities and widely held beliefs amongst
Agribusiness SMEs that training will not make businesses more profitable. Furthermore, the
Agribusiness industry is complicated by its vulnerability to the seasons and international food and fuel
prices. A more in-depth understanding of the Agribusiness will be necessary to develop effective TVET
initiatives for this essential industry in Afghanistan.

58
APPENDIX 1 – GRAPHS AND TABLES BY CITY AND INDUSTRY – SME Survey
Figure 32: How many people does your business employ? (SME survey, Q6, Base: 959, National)
Figure 33: How many people does your business employ? (SME survey, Q6, Base: 959, Breakdown by City)
0%
10%
20%
30%
40%
50%
60%
1 6-10 21-50 Undefined/Unknown
% o
f R
esp
on
de
nts
0%
10%
20%
30%
40%
50%
60%
70%
80%
Kabul Jalalabad Mazar Herat Kandahar KundozNational Average
% R
esp
on
de
nts
in e
ach
cit
y
1
2-5
6-10
11-20
21-50
More than 50
Undefined/Unknown
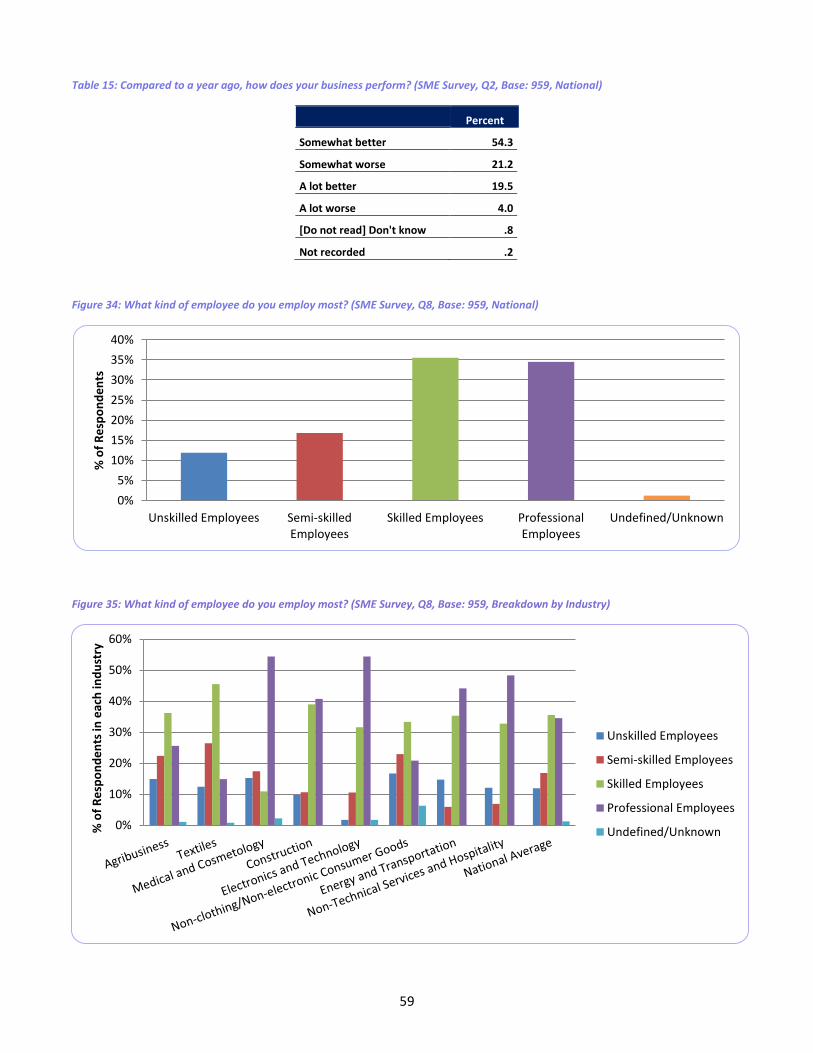
59
Table 15: Compared to a year ago, how does your business perform? (SME Survey, Q2, Base: 959, National)
Percent
Somewhat better 54.3
Somewhat worse 21.2
A lot better 19.5
A lot worse 4.0
[Do not read] Don't know .8
Not recorded .2
Figure 34: What kind of employee do you employ most? (SME Survey, Q8, Base: 959, National)
Figure 35: What kind of employee do you employ most? (SME Survey, Q8, Base: 959, Breakdown by Industry)
0%
5%
10%
15%
20%
25%
30%
35%
40%
Unskilled Employees Semi-skilledEmployees
Skilled Employees ProfessionalEmployees
Undefined/Unknown
% o
f R
esp
on
de
nts
0%
10%
20%
30%
40%
50%
60%
% o
f R
esp
on
de
nts
in e
ach
ind
ust
ry
Unskilled Employees
Semi-skilled Employees
Skilled Employees
Professional Employees
Undefined/Unknown

60
Figure 36: What kind of employee do you employ most (SME Survey, Q8, Base: 959, Breakdown by City)
Figure 37: How much interest would you have in receiving training assistance for your employees? (SME Survey, Q13, Base: 927, National)
0%
10%
20%
30%
40%
50%
60%
Kabul Jalalabad Mazar Herat Kandahar Kundoz NationalAverage
% o
f R
esp
on
de
nts
in e
ach
cit
y
Unskilled Employees
Semi-skilled Employees
Skilled Employees
Professional Employees
Undefined/Unknown
0%
10%
20%
30%
40%
50%
60%
A great deal A fair amount Not very much None at all Undefined/Unknown
% o
f R
esp
on
de
nts

61
Figure 38: How much interest would you have in receiving training assistance for your employees? (SME Survey, Q13, Base: 927, Breakdown by City)
Table 16: In what skill do your employees most need training? (SME Survey, Q14, Base: 959, National)
Skills Percent of Respondents
General Knowledge 13.3%
Literacy, Language and General Education 12.0%
Management and Administration 10.4%
Marketing and Sales 10.3%
Clothing Production/Tailoring 9.4%
Computer/IT, Electronics Programming and Repair 6.9%
Not recorded/Illegible 6.8%
Business Development and Customer Relations 3.9%
Furniture and Craft Manufacturing 3.3%
Electrician/Plumber 3.0%
Food Processing and Packaging 3.0%
Carpet Making 2.3%
Quality Assurance and Quality Check 2.1%
Metalworker 2.1%
Hair and Skin Treatments 2.1%
Import/Export and Economics 1.1%
0%
10%
20%
30%
40%
50%
60%
70%
80%
Kabul Jalalabad Mazar Herat Kandahar Kundoz
% o
f R
esp
on
de
nts
in e
ach
like
rt c
ate
gory
A great deal
A fair amount
Not very much
None at all
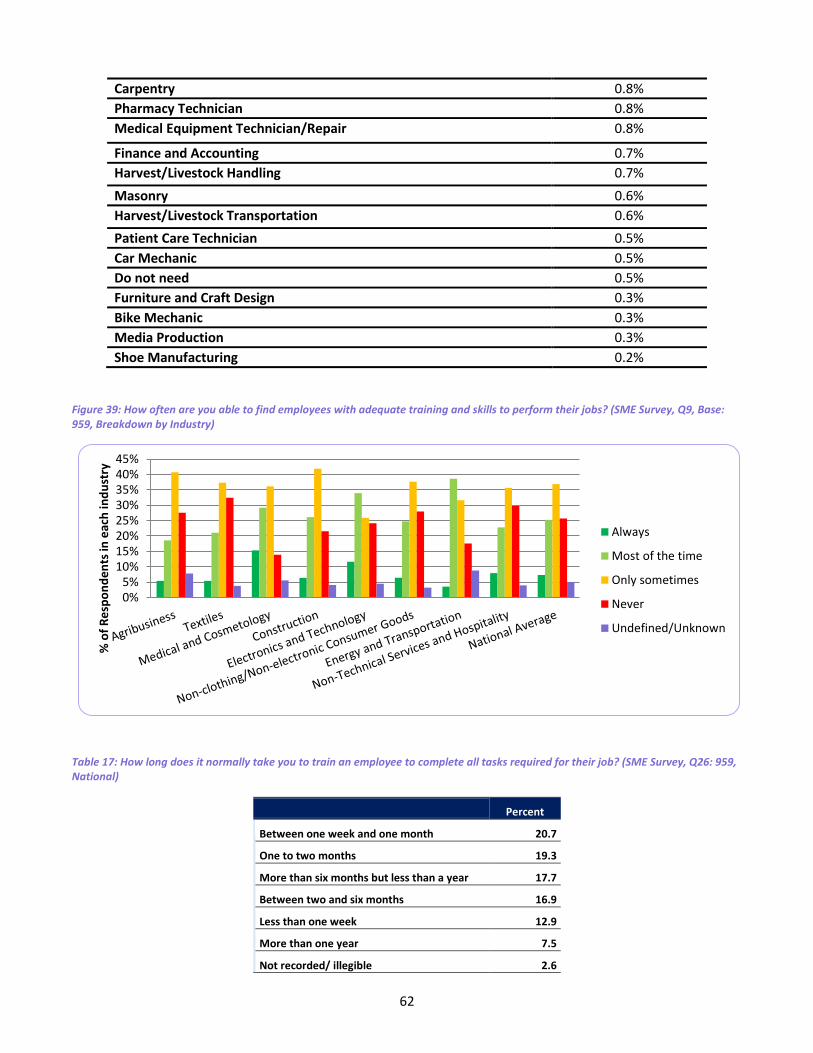
62
Carpentry 0.8%
Pharmacy Technician 0.8%
Medical Equipment Technician/Repair 0.8%
Finance and Accounting 0.7%
Harvest/Livestock Handling 0.7%
Masonry 0.6%
Harvest/Livestock Transportation 0.6%
Patient Care Technician 0.5%
Car Mechanic 0.5%
Do not need 0.5%
Furniture and Craft Design 0.3%
Bike Mechanic 0.3%
Media Production 0.3%
Shoe Manufacturing 0.2%
Figure 39: How often are you able to find employees with adequate training and skills to perform their jobs? (SME Survey, Q9, Base: 959, Breakdown by Industry)
Table 17: How long does it normally take you to train an employee to complete all tasks required for their job? (SME Survey, Q26: 959, National)
Percent
Between one week and one month 20.7
One to two months 19.3
More than six months but less than a year 17.7
Between two and six months 16.9
Less than one week 12.9
More than one year 7.5
Not recorded/ illegible 2.6
0%5%
10%15%20%25%30%35%40%45%
% o
f R
esp
on
de
nts
in e
ach
ind
ust
ry
Always
Most of the time
Only sometimes
Never
Undefined/Unknown

63
Don't know 1.6
No answer/ refused to say .8
Table 18: Would you be willing to pay a training center or institute to train your employees and improve their job skills? (SME Survey, Q22, Base: 959, Breakdown by Industry)
Agribusiness
Textiles Medical and Cosmetology
Construction
Electronics and Technology
Non-clothing/Non-electronic Consumer Goods
Energy and Transportation
Non-Technical Services and Hospitality
National Average
Yes 39.5%
31.4% 43.1% 38.4% 32.1% 37.6% 45.6% 35.6% 36.9%
No 56.3%
64.3% 55.6% 59.9% 62.5% 58.1% 52.6% 62.4% 59.7%
Undefined/Unknown 4.2% 4.3% 1.4% 1.7% 5.4% 4.3% 1.8% 2.0% 3.3%
Table 19: Do you think that hiring employees with specialized training at a training center or institute would make your business more profitable? (SME Survey, Q19, Base: 959, Breakdown by City)
Kabul Jalalabad Mazar Herat Kandahar Kundoz National Average
Yes 80.9% 95.5% 93.7% 84.6% 93.3% 64.4% 85.4%
No 2.5% 3.2% 3.8% 6.2% 0.0% 15.6% 5.2%
Undefined/Unknown 16.6% 1.3% 2.5% 9.3% 6.7% 20.0% 9.4%
Table20: able21: Do you think that hiring employees with specialized training at a training center or institute would make your business more profitable? (SME Survey, Q19, Base: 959, Breakdown by Industry)
Agribusiness
Textiles
Medical and Cosmetology
Construction
Electronics and Technology
Non-clothing/Non-electronic Consumer Goods
Energy and Transportation
Non-Technical Services and Hospitality
National Average
Yes 82.0% 85.4%
94.4% 90.1% 78.6% 81.7% 84.2% 88.1% 85.4%
No 7.8% 2.7% 4.2% 3.5% 7.1% 9.7% 3.5% 4.0% 5.2%
Undefined/Unknown
10.2% 11.9%
1.4% 6.4% 14.3% 8.6% 12.3% 7.9% 9.4%

64
Figure 40: (SME Survey, D1, Base 959, Gender Breakdown by City)
Figure 41: In which field is your business? (SME Survey, Q5, Base 959, Breakdown by City)
0%
10%
20%
30%
40%
50%
60%
70%
80%
90%
100%
Kabul Jalalabad Mazar Herat Kandahar Kundoz NationalAverage
% o
f R
esp
on
de
nts
in e
ach
cit
y
Male
Female
0%
5%
10%
15%
20%
25%
30%
35%
40%
45%
Kabul Mazar Kandahar NationalAverage
% o
f R
esp
on
de
nts
in e
ach
cit
y
Agribusiness
Textiles
Medical and Cosmetology
Construction
Electronics and Technology
Non-clothing/Non-electronicConsumer Goods
Energy and Transportation

65
APPENDIX 2 – GRAPHS AND TABLES BY CITY AND INDUSTRY – LM Survey
Table 22: What job skills to you currently possess? (LM Survey, Q4, Base: 307, Breakdown by Age)
Business, trade, and management
Medical
Work with fabric, cloth wool, and
other textiles
Technical and industrial
skills
Education (including
literacy and language courses)
Less than 21 17.6% 11.8% 32.4% 11.8% 26.5%
22-34 21.4% 9.5% 33.3% 10.7% 25.0%
35-44 10.5% 26.3% 26.3% 0.0% 36.8%
45-54 50.0% 0.0% 12.5% 12.5% 25.0%
55-64 50.0% 25.0% 0.0% 25.0% 0.0%
Table 23: Compared to a year ago, how is your business performing? (LM Survey, Q1, Base: 307, National)
Percent
Somewhat better 54.3
Somewhat worse 21.2
A lot better 19.5
A lot worse 4.0
[Do not read] Don't know .8
Not recorded .2
Table 24: How interested would you be in participating in a training program that increases you job skills? (LM Survey, Q12, Base: 307, Breakdown by City)
Kabul Mazar Herat Kandahar Kundoz Jalalabad
Very Interested 61.4% 55.6% 71.2% 69.1% 11.5% 40.0%
Somewhat Interested
25.0% 24.1% 5.8% 20.0% 17.3% 10.0%
Somewhat disinterested
9.1% 3.7% 21.2% 5.5% 46.2% 40.0%
Not interested at all
2.3% 9.3% 1.9% 5.5% 17.3% 8.0%
Not recorded 2.3% 5.6% 0.0% 0.0% 0.0% 2.0%
Don't know 0.0% 1.9% 0.0% 0.0% 5.8% 0.0%
No answer/refused to say
0.0% 0.0% 0.0% 0.0% 1.9% 0.0%

66
Table 25: For which skills would you be interested in participating in training at a training center or institute? (LM Survey, Q13, Base: 307, National)
Business, trade, and management
Medical
Work with fabric, cloth wool, and
other textiles
Technical and industrial
skills
Education (including
literacy and language courses)
Less than 21 17.6% 11.8% 32.4% 11.8% 26.5%
22-34 21.4% 9.5% 33.3% 10.7% 25.0%
35-44 10.5% 26.3% 26.3% 0.0% 36.8%
45-54 50.0% 0.0% 12.5% 12.5% 25.0%
55-64 50.0% 25.0% 0.0% 25.0% 0.0%
Table 26: How would you describe the length of the last formal training at a training center or institute that you participated in? Did it last for one day or less, one week or less, one month or less, between one and six months, more than six months, or more than one year? (LM Survey, Q8, Base: 307, National)
Percent
More than 1 year 25.2
Between 1 and 6 months 24.3
One week or less 17.4
One month or less 14.8
More than 6 months 8.7
One day or less 4.3
Not recorded 2.6
No response/ refused to say 1.8
Don't know .9
Table 27: Have you in the past moved to another city/town/village in order find employment? (LM Survey, Q12, Base: 307, National)
Percent
No 59.9
Yes 36.2
Not recorded/ illegible 3.6
No answer/refused to say .3
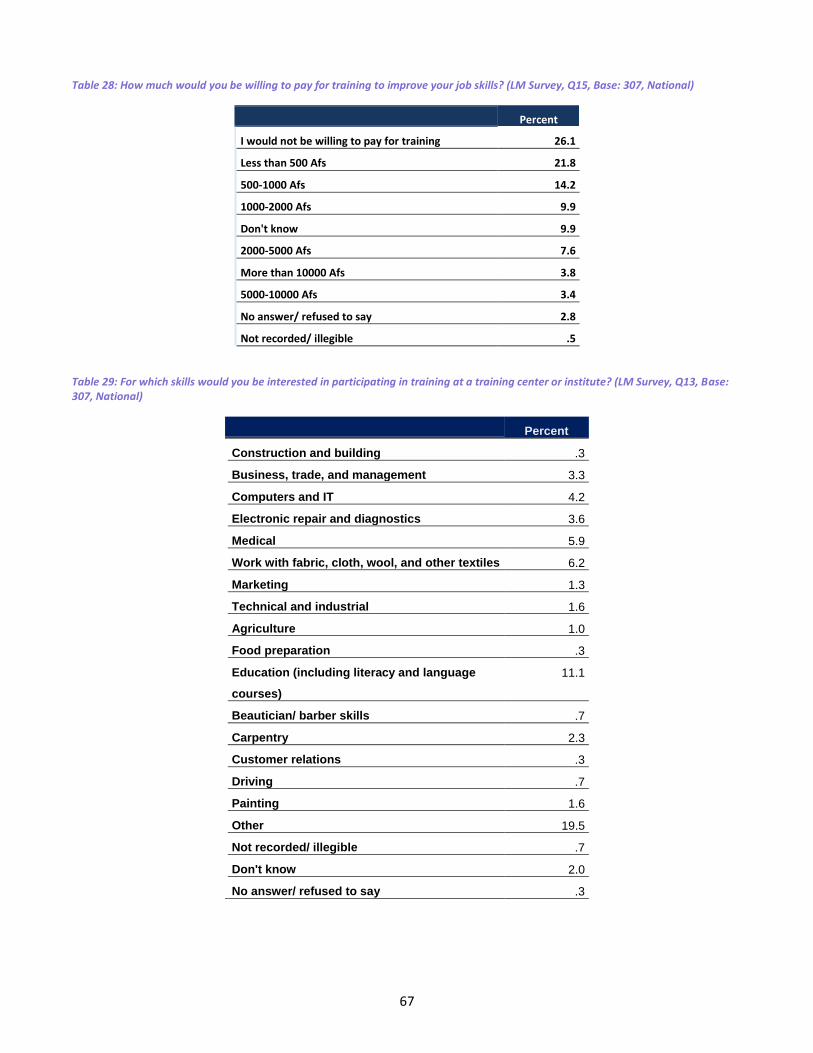
67
Table 28: How much would you be willing to pay for training to improve your job skills? (LM Survey, Q15, Base: 307, National)
Percent
I would not be willing to pay for training 26.1
Less than 500 Afs 21.8
500-1000 Afs 14.2
1000-2000 Afs 9.9
Don't know 9.9
2000-5000 Afs 7.6
More than 10000 Afs 3.8
5000-10000 Afs 3.4
No answer/ refused to say 2.8
Not recorded/ illegible .5
Table 29: For which skills would you be interested in participating in training at a training center or institute? (LM Survey, Q13, Base: 307, National)
Percent
Construction and building .3
Business, trade, and management 3.3
Computers and IT 4.2
Electronic repair and diagnostics 3.6
Medical 5.9
Work with fabric, cloth, wool, and other textiles 6.2
Marketing 1.3
Technical and industrial 1.6
Agriculture 1.0
Food preparation .3
Education (including literacy and language
courses)
11.1
Beautician/ barber skills .7
Carpentry 2.3
Customer relations .3
Driving .7
Painting 1.6
Other 19.5
Not recorded/ illegible .7
Don't know 2.0
No answer/ refused to say .3

68
APPENDIX 3 – BIBLIOGRAPHY
Afghanistan Information Management Services (2011), Mazar-i-Sherif, Kabul, Herat, Kandahar, Jalalabad and Kunduz City Maps, AIMS, Kabul, Afghanistan AISA (2008), Doing Business in Afghanistan: Investors Directory, Afghanistan Investment Support Agency, Kabul, Afghanistan Agnew, M. (2003), Afghanistan Labor Market Information Survey, International Rescue Committee, Kabul, Afghanistan Asia Foundation (2011), Afghanistan in 2011: A Survey of the Afghan People, The Asia Foundation, Kabul, Afghanistan Beal, J. & Schutte, S. (2006), Urban Livelihoods in Afghanistan, Afghanistan Research and Evaluation Unit, Kabul, Afghanistan Centre for International Private Enterprise (2010), 2009-2010 Afghan Business Survey Final Report, National Endowment for Democracy, Kabul, Afghanistan
CSO (2011), Afghanistan Statistical Yearbook 2010-11, Central Statistics Organization, Kabul, Afghanistan
European Commission to Afghanistan (2011), National Risk and Vulnerability Assessment 2007/8, European Union, Kabul, Afghanistan International Bank for Reconstruction and Development (2012), Doing Business in Afghanistan: 2012, International Finance Corporation & The World Bank, Washington, DC, United States.
Islamic Republic of Afghanistan (2007), Afghanistan National Development Strategy 1387-1391, Islamic Republic of Afghanistan, Kabul, Afghanistan
Labor Market Information and Analysis Unit (2008), An Urban Primary Source Study of Supply and Demand in the Labor Market, Ministry of Labor and Social Affairs, Martyrs and Disables. USAID (2007), Labor Markets, Livelihood Strategies, and Food Security in Afghanistan, USAID, Kabul, Afghanistan USAID (2009), SME Development Workshop Report, USAID, Kabul, Afghanistan USAID (2011), Why Economic Growth Matters in Afghanistan, USAID, Kabul, Afghanistan The World Bank (2008), Afghanistan Country Profile 2008, The World Bank (2010), Afghanistan Economic Update, The World Bank, Kabul, Afghanistan The World Bank (2011). Afghanistan Economic Update 2011 The World Bank (2012), Afghanistan at a Glance

69
APPENDIX 4 – VISITED WEBSITES
http://www.adb.org/publications/afghanistan-fact-sheet
http://afghanistan.usaid.gov/en/USAID/Activity/32/Afghanistan_Small_and_Medium_Enterprise_Development
_ASMED
http://afghanistan.usaid.gov/en/USAID/Activity/207/Afghanistan_Workforce_Development_Program_AWDP
http://asiafoundation.org/resources/pdfs/TAF2011AGSurvey.pdf
https://www.cia.gov/library/publications/the-world-factbook/geos/af.html
http://data.worldbank.org/country/afghanistan
http://siteresources.worldbank.org/AFGHANISTANEXTN/Resources/305984-
1297184305854/AFGEconUpdate2011.pdf
http://www.worldliteracyfoundation.org/literacy-achieve.html