tv viewing trends
DESCRIPTION
TV Viewing Trends. Ottawa-Gatineau EM - Diary. Updated Spring 2014. Market Info. Maps & Demographics. Ottawa-Gatineau EM. Where is it?. YT. NT. NU. BC. AB. NL. MB. SK. NL. QC. PE. ON. NB. NS. EM Map. Ottawa-Gatineau EM Demographics. Population Estimates (000). - PowerPoint PPT PresentationTRANSCRIPT

1
TV Viewing TrendsOttawa-Gatineau EM - Diary
Updated Spring 2014

2
Maps & Demographics
Market Info

3
Ottawa-Gatineau EMWhere is it?
BC
ABSK MB
ONQC
NL
NBNS
PE
NL
YT
NTNU

4
EM Map

5
Ottawa-Gatineau EM Demographics
P2+
P2-11
P12-17
P18+
P18-34
P18-49
P25-54
P35-54
P55+
F18+
F18-34
F18-49
F25-54
F35-54
F55+
M18+
M18-34
M18-49
M25-54
M35-54
M55+
0 200 400 600 800 1,000 1,200 1,400 1,600
1,442.0
156.9
102.6
1,182.4
349.2
676.2
651.4
444.3
388.9
607.1
173.7
338.7
328.8
224.5
209.0
575.3
175.6
337.4
322.6
219.9
179.9
Population Estimates (000)
Source: BBM Canada Geographical Reference Guide 2011-2012

6
Reach, Time Spent, Average Quarter Hour Audience
People Aged 2+

7
People 2+ - Weekly Reach %
Run of Schedule: M-Su 6a-2a
Source: BBM Canada ; InfoSys+TV Diary; Ottawa-Gatineau EM; Total TV
Spring Fall0
102030405060708090
10094.3 95.095.3 93.994.6 95.095.4 94.294.1 94.192.9 93.290.1
93.592.4 93.693 200620072008200920102011201220132014
8
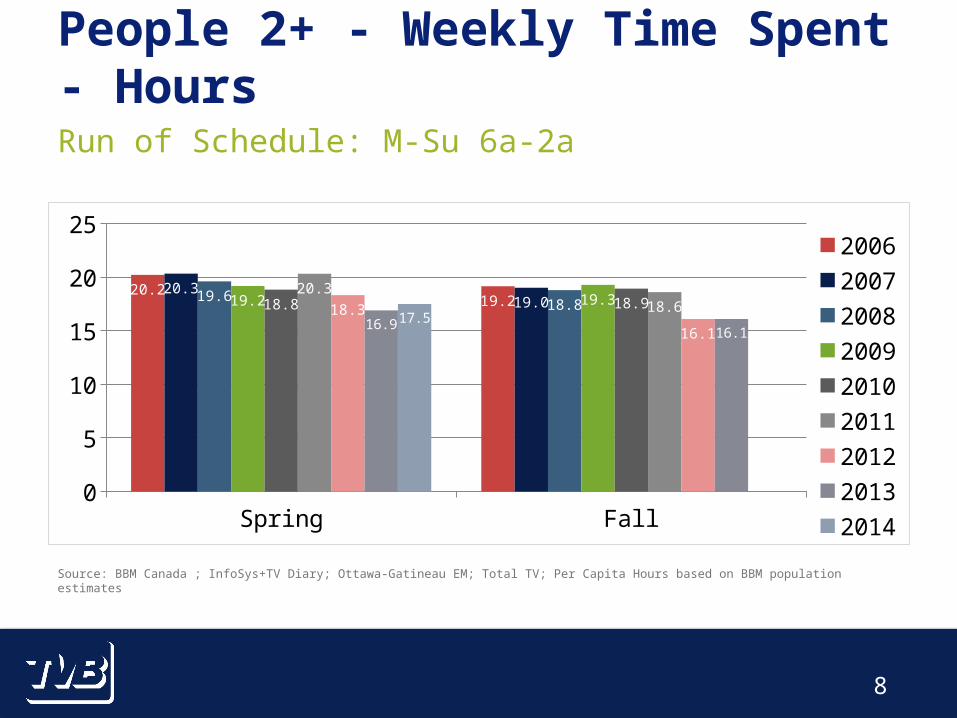
People 2+ - Weekly Time Spent - Hours
Run of Schedule: M-Su 6a-2a
Source: BBM Canada ; InfoSys+TV Diary; Ottawa-Gatineau EM; Total TV; Per Capita Hours based on BBM population estimates
Spring Fall0
5
10
15
20
25
20.219.2
20.319.019.6 18.819.2 19.318.8 18.9
20.318.618.3
16.116.916.1
17.5
200620072008200920102011201220132014

9
People 2+ - AQH Audience (000)
Run of Schedule: M-Su 6a-2a
Source: BBM Canada ; InfoSys+TV Diary; Ottawa-Gatineau EM; Total TV; AQH = Average Quarter Hour Audience
Spring Fall0
50
100
150
200
250
195.8188.5
200.3186.7192.4 188.6192.1 195.8191.4 191.3
205.8191.6188.5
170.6180.1 174.7
191
200620072008200920102011201220132014

10
People 2+ - Weekly Reach %
Prime: M-Su 7p-11p
Source: BBM Canada ; InfoSys+TV Diary; Ottawa-Gatineau EM; Total TV
Spring Fall0
102030405060708090
100
90.2 90.390.3 88.888.8 88.590.5 89.387.7 88.588.7 87.984.3
87.587.5 87.887.7200620072008200920102011201220132014
11
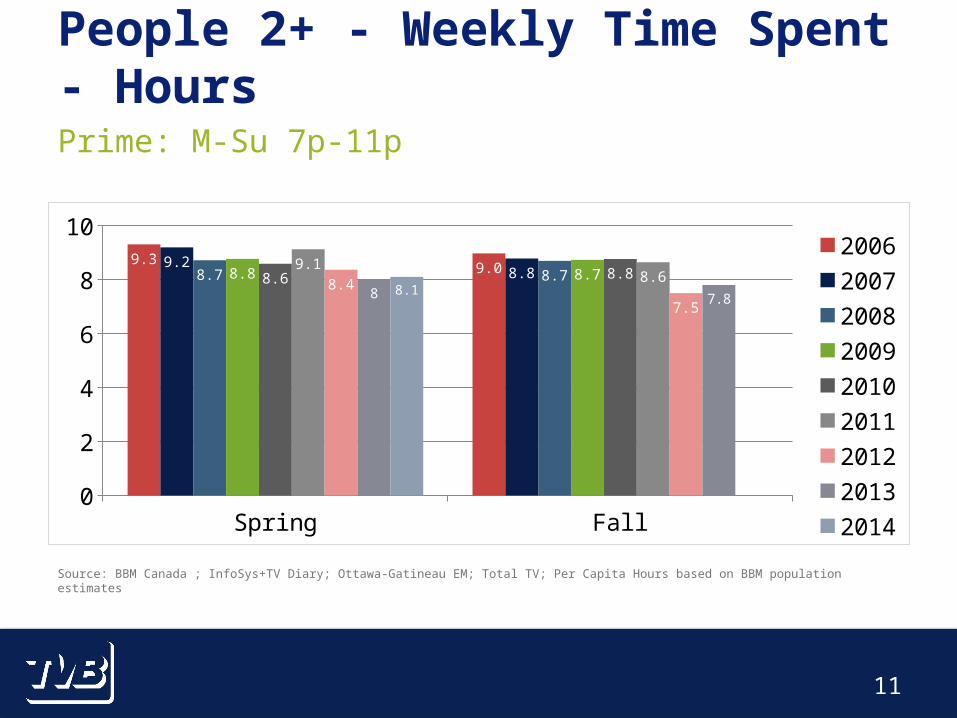
People 2+ - Weekly Time Spent - Hours
Prime: M-Su 7p-11p
Source: BBM Canada ; InfoSys+TV Diary; Ottawa-Gatineau EM; Total TV; Per Capita Hours based on BBM population estimates
Spring Fall0123456789
109.3
9.09.28.88.7 8.78.8 8.78.6 8.8
9.18.68.4
7.58 7.8
8.1
200620072008200920102011201220132014

12
People 2+ - AQH Audience (000)
Prime: M-Su 7p-11p
Source: BBM Canada ; InfoSys+TV Diary; Ottawa-Gatineau EM; Total TV; AQH = Average Quarter Hour Audience
Spring Fall0
50100150200250300350400450500
450.8 441.5452.9431.2427.8 436.3439.0 443.5436.4 443.0
462.1445.1
430.2400.1
427.2 422.8441.4
200620072008200920102011201220132014

13
Reach, Time Spent, Average Quarter Hour Audience
Children Aged 2-11

14
Source: BBM Canada ; InfoSys+TV Diary; Ottawa-Gatineau EM; Total TV
Spring Fall0
102030405060708090
10093.4 94.594.1 93.994.1 94.896.8 95.793.0 95.092.3 91.989.3 91.391.9 9491.5
200620072008200920102011201220132014
People 2-11 - Weekly Reach %
Run of Schedule: M-Su 6a-2a

15
Source: BBM Canada ; InfoSys+TV Diary; Ottawa-Gatineau EM; Total TV; Per Capita Hours based on BBM population estimates
Spring Fall0
2
4
6
8
10
12
14
12.0 11.611.811.111.1 10.711.1 11.111.4 11.111.3 11.111.2
7.1
8.3
7.2
8.3
200620072008200920102011201220132014
People 2-11 - Weekly Time Spent - Hours
Run of Schedule: M-Su 6a-2a

16
Source: BBM Canada ; InfoSys+TV Diary; Ottawa-Gatineau EM; Total TV; AQH = Average Quarter Hour Audience
Spring Fall02468
10121416
13.4 13.013.112.212.3
11.712.2 12.012.4 12.212.4 12.512.6
8.3
9.58.7
10
200620072008200920102011201220132014
People 2-11 - AQH Audience (000)
Run of Schedule: M-Su 6a-2a

17
Source: BBM Canada ; InfoSys+TV Diary; Ottawa-Gatineau EM; Total TV
Spring Fall0
102030405060708090
100
75.7 75.969.2 71.273.4
66.9
78.7 79.2
65.8
75.175.868.166.2 63.2
72.165.467.7
200620072008200920102011201220132014
People 2-11 - Weekly Reach %
Prime: M-Su 7p-11p

18
Source: BBM Canada ; InfoSys+TV Diary; Ottawa-Gatineau EM; Total TV; Per Capita Hours based on BBM population estimates
Spring Fall0
0.51
1.52
2.53
3.54
3.1 3.23.0 3.0
2.8 2.7
3.5
2.82.83.03.0 3.1
2.8
1.8
2.3
1.81.9
200620072008200920102011201220132014
People 2-11 - Weekly Time Spent - Hours
Prime: M-Su 7p-11p
19
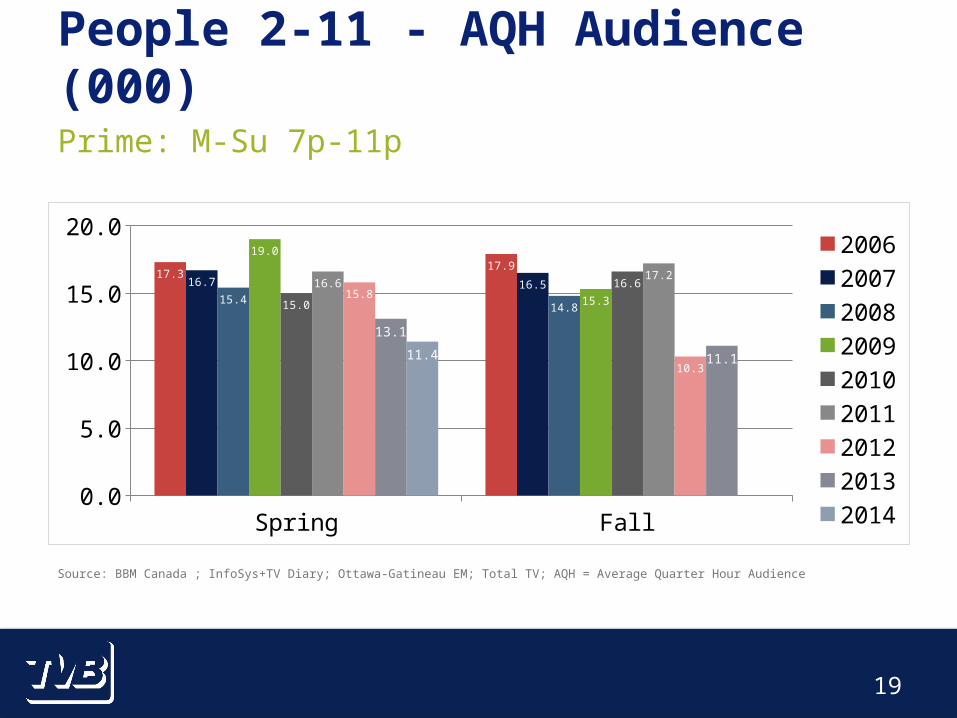
Source: BBM Canada ; InfoSys+TV Diary; Ottawa-Gatineau EM; Total TV; AQH = Average Quarter Hour Audience
Spring Fall0.02.04.06.08.0
10.012.014.016.018.020.0
17.317.9
16.7 16.515.4
14.8
19.0
15.315.0
16.616.617.2
15.8
10.3
13.1
11.111.4
200620072008200920102011201220132014
People 2-11 - AQH Audience (000)
Prime: M-Su 7p-11p

20
Reach, Time Spent, Average Quarter Hour Audience
Teens Aged 12-17

21
Source: BBM Canada ; InfoSys+TV Diary; Ottawa-Gatineau EM; Total TV
Spring Fall0
102030405060708090
10092.8 92.691.7 92.390.2
93.791.3 92.093.9 91.987.9 89.0
85.6 87.388.4 89.890.4 200620072008200920102011201220132014
People 12-17 - Weekly Reach %
Run of Schedule: M-Su 6a-2a

22
Source: BBM Canada ; InfoSys+TV Diary; Ottawa-Gatineau EM; Total TV; Per Capita Hours based on BBM population estimates
Spring Fall0.0
2.0
4.0
6.0
8.0
10.0
12.0
14.0
12.0
10.2
12.5
11.411.010.39.9
10.411.5
10.9
9.38.7
9.5
8.17.88.79.0
200620072008200920102011201220132014
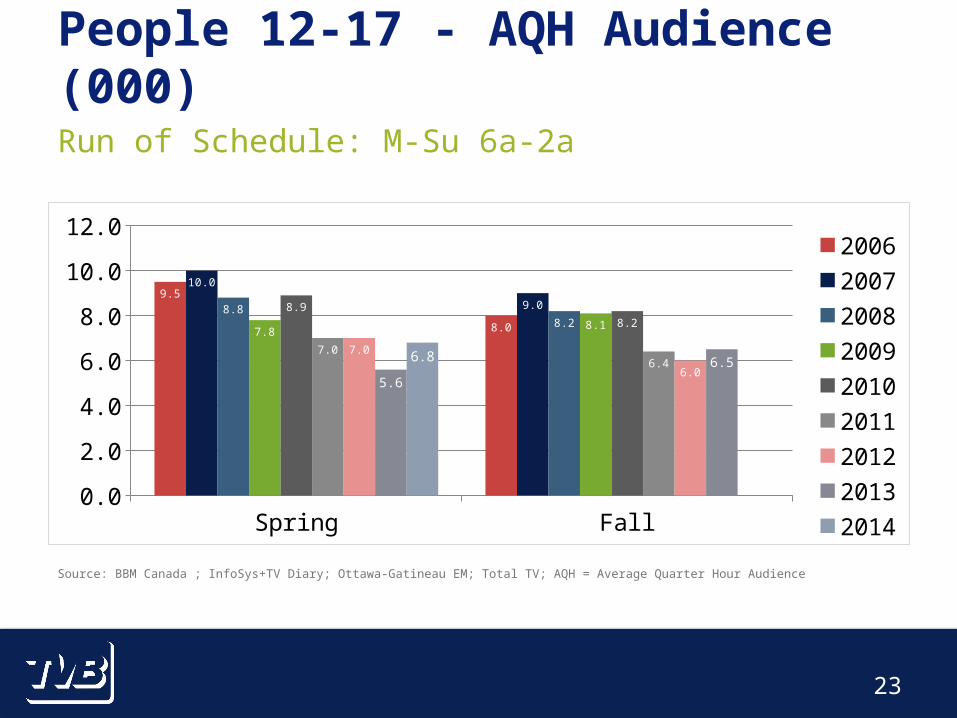
People 12-17 - Weekly Time Spent - Hours
Run of Schedule: M-Su 6a-2a
23
Source: BBM Canada ; InfoSys+TV Diary; Ottawa-Gatineau EM; Total TV; AQH = Average Quarter Hour Audience
Spring Fall0.0
2.0
4.0
6.0
8.0
10.0
12.0
9.5
8.0
10.0
9.08.88.2
7.88.1
8.98.2
7.06.4
7.0
6.05.6
6.56.8
200620072008200920102011201220132014
People 12-17 - AQH Audience (000)
Run of Schedule: M-Su 6a-2a
24
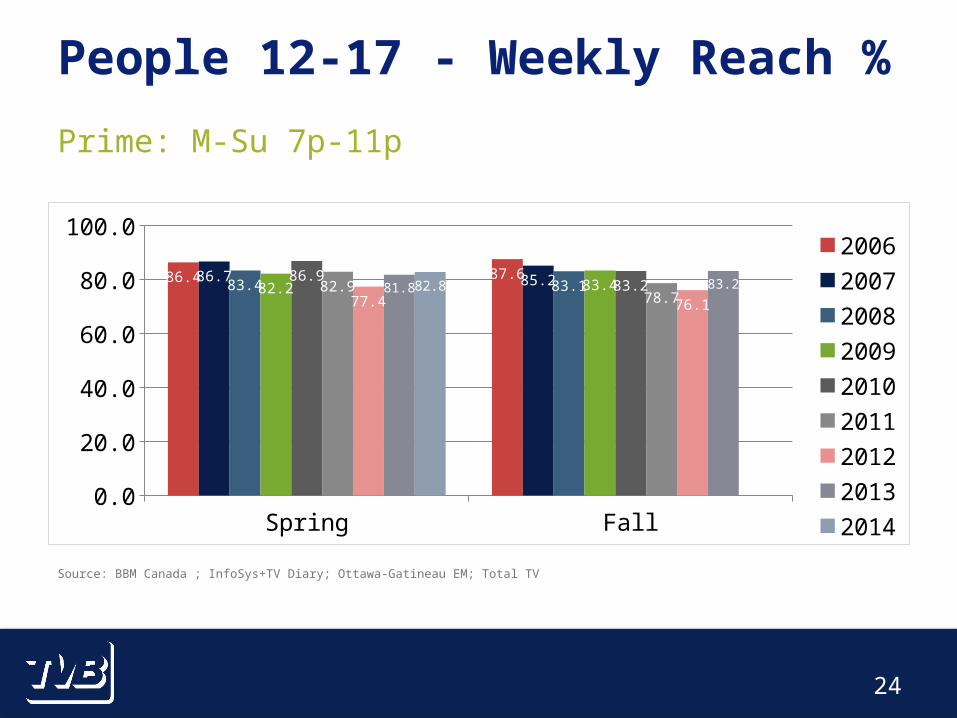
Source: BBM Canada ; InfoSys+TV Diary; Ottawa-Gatineau EM; Total TV
Spring Fall0.0
10.020.030.040.050.060.070.080.090.0
100.0
86.4 87.686.7 85.283.4 83.182.2 83.486.9
83.282.978.777.4 76.1
81.8 83.282.8
200620072008200920102011201220132014
People 12-17 - Weekly Reach %
Prime: M-Su 7p-11p

25
Source: BBM Canada ; InfoSys+TV Diary; Ottawa-Gatineau EM; Total TV; Per Capita Hours based on BBM population estimates
Spring Fall0.0
1.0
2.0
3.0
4.0
5.0
6.0
7.0
5.8 5.55.65.25.1
4.74.3
4.94.9 5.2
4.6
4.04.13.84 4.2
3.9
200620072008200920102011201220132014
People 12-17 - Weekly Time Spent - Hours
Prime: M-Su 7p-11p

26
Source: BBM Canada ; InfoSys+TV Diary; Ottawa-Gatineau EM; Total TV; AQH = Average Quarter Hour Audience
Spring Fall0.0
5.0
10.0
15.0
20.0
25.022.8
21.722.6
20.720.3
18.617.2
19.019.3 19.4
17.2
14.615.113.914.3
15.814.6
200620072008200920102011201220132014
People 12-17 - AQH Audience (000)
Prime: M-Su 7p-11p

27
Reach, Time Spent, Average Quarter Hour Audience
Adults 18+

28
Source: BBM Canada ; InfoSys+TV Diary; Ottawa-Gatineau EM; Total TV
Spring Fall0.0
10.020.030.040.050.060.070.080.090.0
100.094.6 95.395.9 94.095.1 95.295.7 94.294.4 94.293.5 93.790.6
94.292.8 93.993.3 200620072008200920102011201220132014
Adults 18+ - Weekly Reach %
Run of Schedule: M-Su 6a-2a

29
Source: BBM Canada ; InfoSys+TV Diary; Ottawa-Gatineau EM; Total TV; Per Capita Hours based on BBM population estimates
Spring Fall0.0
5.0
10.0
15.0
20.0
25.0
22.221.1
22.320.921.6
20.721.2 21.220.5 20.722.5
20.520.0
17.918.8
17.919.5
200620072008200920102011201220132014
Adults 18+ - Weekly Time Spent - Hours
Run of Schedule: M-Su 6a-2a

30
Source: BBM Canada ; InfoSys+TV Diary; Ottawa-Gatineau EM; Total TV; AQH = Average Quarter Hour Audience
Spring Fall0.0
20.040.060.080.0
100.0120.0140.0160.0180.0200.0
172.8167.5
177.2165.4
171.3 168.8172.1 175.6170.1 170.9
186.4
172.8169.0
156.3164.9 159.5
174.2200620072008200920102011201220132014
Adults 18+ - AQH Audience (000)
Run of Schedule: M-Su 6a-2a

31
Source: BBM Canada ; InfoSys+TV Diary; Ottawa-Gatineau EM; Total TV
Spring Fall0.0
10.020.030.040.050.060.070.080.090.0
100.092.7 92.693.6 91.791.4 91.992.9 91.490.8 90.891.0 91.3
87.391.590 91.390.7
200620072008200920102011201220132014
Adults 18+ - Weekly Reach %
Prime: M-Su 7p-11p

32
Source: BBM Canada ; InfoSys+TV Diary; Ottawa-Gatineau EM; Total TV; Per Capita Hours based on BBM population estimates
Spring Fall0.0
2.0
4.0
6.0
8.0
10.0
12.0
10.610.110.4
9.99.9 9.99.9 9.99.7 9.910.3
9.89.58.6
9.1 8.99.3
200620072008200920102011201220132014
Adults 18+ - Weekly Time Spent - Hours
Prime: M-Su 7p-11p

33
Source: BBM Canada ; InfoSys+TV Diary; Ottawa-Gatineau EM; Total TV; AQH = Average Quarter Hour Audience
Spring Fall0.0
50.0100.0150.0200.0250.0300.0350.0400.0450.0
410.6 401.9413.6
394.0392.0402.9402.9 409.2402.1 407.1
428.3413.3
399.4375.9
399.8 395.9415.4 2006
20072008200920102011201220132014
Adults 18+ - AQH Audience (000)
Prime: M-Su 7p-11p

34
Reach, Time Spent, Average Quarter Hour Audience
Adults 18-34

35
Source: BBM Canada ; InfoSys+TV Diary; Ottawa-Gatineau EM; Total TV
Spring Fall0.0
10.020.030.040.050.060.070.080.090.0
100.0
88.8 91.090.8 88.188.9 90.490.486.9
91.1 88.184.5
88.082.2
88.286.9 87.887.3200620072008200920102011201220132014
Adults 18-34 - Weekly Reach %
Run of Schedule: M-Su 6a-2a

36
Source: BBM Canada ; InfoSys+TV Diary; Ottawa-Gatineau EM; Total TV; Per Capita Hours based on BBM population estimates
Spring Fall02468
10121416
14.515.2
14.613.7
12.7 13.113.2 13.613.412.612.9 12.8
11.010.0
11.110.1
11.8
200620072008200920102011201220132014
Adults 18-34 - Weekly Time Spent - Hours
Run of Schedule: M-Su 6a-2a

37
Source: BBM Canada ; InfoSys+TV Diary; Ottawa-Gatineau EM; Total TV; AQH = Average Quarter Hour Audience
Spring Fall0.05.0
10.015.020.025.030.035.040.0
33.7 34.033.731.3
29.331.130.7
32.8
29.9 30.131.3 30.9
26.5 25.9
29.126.3
31.2
200620072008200920102011201220132014
Adults 18-34 - AQH Audience (000)
Run of Schedule: M-Su 6a-2a

38
Source: BBM Canada ; InfoSys+TV Diary; Ottawa-Gatineau EM; Total TV
Spring Fall0.0
10.020.030.040.050.060.070.080.090.0
100.0
85.9 86.487.2 84.782.4 84.784.880.683.2 81.581.0 83.5
74.3
83.682.7 82.983.1200620072008200920102011201220132014
Adults 18-34 - Weekly Reach %
Prime: M-Su 7p-11p

39
Source: BBM Canada ; InfoSys+TV Diary; Ottawa-Gatineau EM; Total TV; Per Capita Hours based on BBM population estimates
Spring Fall0.01.02.03.04.05.06.07.08.09.0
7.4 7.67.3
6.96.3
6.76.67.0
6.4 6.56.6 6.6
5.6 5.46
5.2
6.4
200620072008200920102011201220132014
Adults 18-34 - Weekly Time Spent - Hours
Prime: M-Su 7p-11p

40
Source: BBM Canada ; InfoSys+TV Diary; Ottawa-Gatineau EM; Total TV; AQH = Average Quarter Hour Audience
Spring Fall0.0
10.020.030.040.050.060.070.080.090.0
100.0
85.8 85.584.479.6
73.378.777.6
84.0
71.3
78.479.5 79.8
67.069.6
78.3
67.3
84.6
200620072008200920102011201220132014
Adults 18-34 - AQH Audience (000)
Prime: M-Su 7p-11p

41
Reach, Time Spent, Average Quarter Hour Audience
Adults 18-49

42
Source: BBM Canada ; InfoSys+TV Diary; Ottawa-Gatineau EM; Total TV
Spring Fall0.0
10.020.030.040.050.060.070.080.090.0
100.092.8 93.694.6 91.792.8 93.494.1 91.692.8 91.590.4 91.0
87.191.989.4 91.490.6
200620072008200920102011201220132014
Adults 18-49 - Weekly Reach %
Run of Schedule: M-Su 6a-2a

43
Source: BBM Canada ; InfoSys+TV Diary; Ottawa-Gatineau EM; Total TV; Per Capita Hours based on BBM population estimates
Spring Fall0.02.04.06.08.0
10.012.014.016.018.020.0
17.1 16.817.016.015.8 15.816.0 15.415.3 14.9
16.314.814.3
12.712.713.413.4
200620072008200920102011201220132014
Adults 18-49 - Weekly Time Spent - Hours
Run of Schedule: M-Su 6a-2a

44
Source: BBM Canada ; InfoSys+TV Diary; Ottawa-Gatineau EM; Total TV; AQH = Average Quarter Hour Audience
Spring Fall0.0
10.020.030.040.050.060.070.080.090.0
82.7 81.882.3
75.975.3 76.276.5 74.674.370.8
78.0
71.368.9
58.163.1
60.3
67.1
200620072008200920102011201220132014
Adults 18-49 - AQH Audience (000)
Run of Schedule: M-Su 6a-2a
45
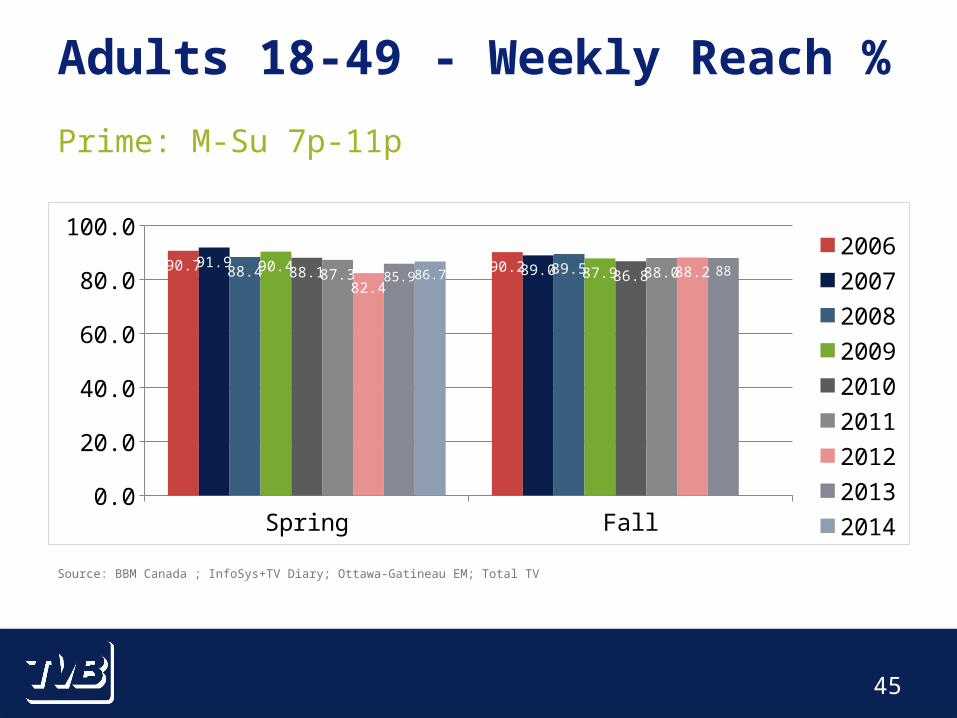
Source: BBM Canada ; InfoSys+TV Diary; Ottawa-Gatineau EM; Total TV
Spring Fall0.0
10.020.030.040.050.060.070.080.090.0
100.090.7 90.291.9 89.088.4 89.590.4 87.988.1 86.887.3 88.0
82.488.285.9 8886.7
200620072008200920102011201220132014
Adults 18-49 - Weekly Reach %
Prime: M-Su 7p-11p
46
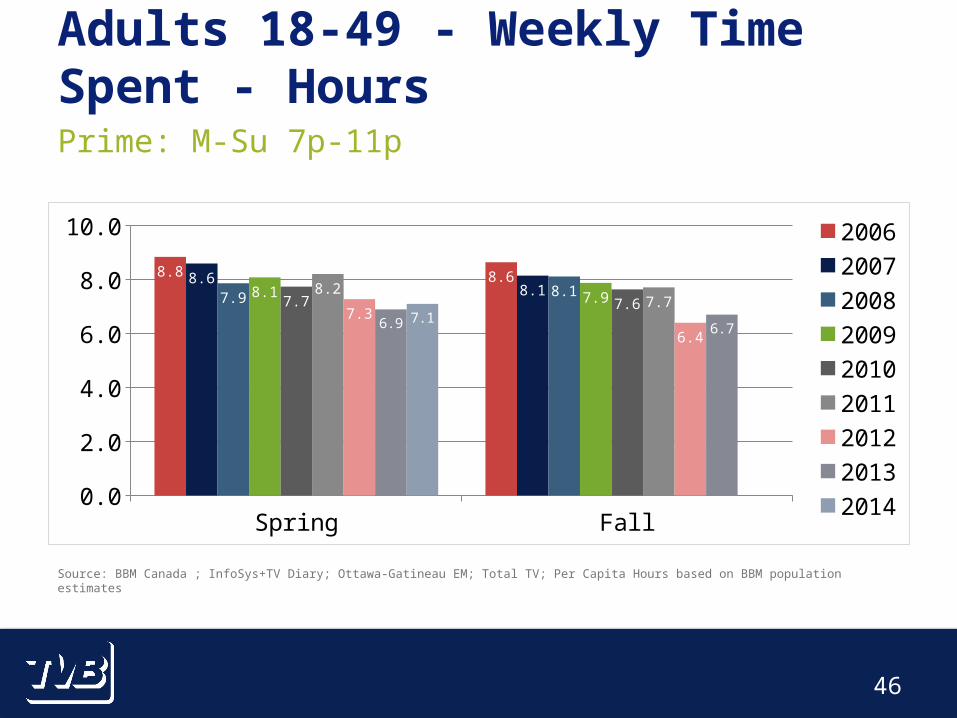
Source: BBM Canada ; InfoSys+TV Diary; Ottawa-Gatineau EM; Total TV; Per Capita Hours based on BBM population estimates
Spring Fall0.01.02.03.04.05.06.07.08.09.0
10.0
8.8 8.68.68.17.9 8.18.1 7.97.7 7.6
8.27.7
7.3
6.46.9 6.7
7.1
200620072008200920102011201220132014
Adults 18-49 - Weekly Time Spent - Hours
Prime: M-Su 7p-11p

47
Source: BBM Canada ; InfoSys+TV Diary; Ottawa-Gatineau EM; Total TV; AQH = Average Quarter Hour Audience
Spring Fall0.0
50.0
100.0
150.0
200.0
250.0
213.1 209.9208.2193.8
187.1195.7193.7 191.1187.6 181.7
196.1186.2
175.2
158.4171.5 166.1
178.6
200620072008200920102011201220132014
Adults 18-49 - AQH Audience (000)
Prime: M-Su 7p-11p

48
Reach, Time Spent, Average Quarter Hour Audience
Adults 25-54

49
Source: BBM Canada ; InfoSys+TV Diary; Ottawa-Gatineau EM; Total TV
Spring Fall0.0
10.020.030.040.050.060.070.080.090.0
100.095.7 95.796.8 94.596.1 95.696.7 95.093.9 94.393.3 94.291.7
95.592 94.393.4 2006
20072008200920102011201220132014
Adults 25-54 - Weekly Reach %
Run of Schedule: M-Su 6a-2a

50
Source: BBM Canada ; InfoSys+TV Diary; Ottawa-Gatineau EM; Total TV; Per Capita Hours based on BBM population estimates
Spring Fall0.0
5.0
10.0
15.0
20.0
25.0
19.618.819.3
18.218.818.018.1 18.4
17.3 17.519.2
17.117.5
14.014.6 14.415.2
200620072008200920102011201220132014
Adults 25-54 - Weekly Time Spent - Hours
Run of Schedule: M-Su 6a-2a

51
Source: BBM Canada ; InfoSys+TV Diary; Ottawa-Gatineau EM; Total TV; AQH = Average Quarter Hour Audience
Spring Fall0
102030405060708090
10092.2
89.291.6
84.685.7 84.183.586.5
83.979.1
87.2
79.680.5
66.369.5 67.873.4
200620072008200920102011201220132014
Adults 25-54 - AQH Audience (000)
Run of Schedule: M-Su 6a-2a

52
Source: BBM Canada ; InfoSys+TV Diary; Ottawa-Gatineau EM; Total TV
Spring Fall0.0
10.020.030.040.050.060.070.080.090.0
100.094.2 93.894.7 93.093.5 92.794.7 93.991.3 90.590.9 91.889.1
93.089.2
92.590.8200620072008200920102011201220132014
Adults 25-54 - Weekly Reach %
Prime: M-Su 7p-11p

53
Source: BBM Canada ; InfoSys+TV Diary; Ottawa-Gatineau EM; Total TV; Per Capita Hours based on BBM population estimates
Spring Fall0.0
2.0
4.0
6.0
8.0
10.0
12.0
10.0 9.69.79.29.3 9.29.2 9.2
8.7 8.99.5
8.98.7
7.67.8 87.9
200620072008200920102011201220132014
Adults 25-54 - Weekly Time Spent - Hours
Prime: M-Su 7p-11p

54
Source: BBM Canada ; InfoSys+TV Diary; Ottawa-Gatineau EM; Total TV; AQH = Average Quarter Hour Audience
Spring Fall0.0
50.0
100.0
150.0
200.0
250.0234.3 228.5231.2
214.1211.4 216.2212.9 215.1211.2200.8
217.1207.6201.6
179.8186.6 187.4190.9
200620072008200920102011201220132014
Adults 25-54 - AQH Audience (000)
Prime: M-Su 7p-11p

55
Reach, Time Spent, Average Quarter Hour Audience
Adults 35-54

56
Source: BBM Canada ; InfoSys+TV Diary; Ottawa-Gatineau EM; Total TV
Spring Fall0.0
10.020.030.040.050.060.070.080.090.0
100.096.5 95.998.1 95.497.1 96.597.9 96.394.9 95.696.8 94.893.3 95.793.4 95.494.5 2006
20072008200920102011201220132014
Adults 35-54 - Weekly Reach %
Run of Schedule: M-Su 6a-2a

57
Source: BBM Canada ; InfoSys+TV Diary; Ottawa-Gatineau EM; Total TV; Per Capita Hours based on BBM population estimates
Spring Fall0.0
5.0
10.0
15.0
20.0
25.0
20.619.0
20.319.1
20.219.119.2 18.818.1 18.6
20.8
18.019.0
15.115.5 15.516.3
200620072008200920102011201220132014
Adults 35-54 - Weekly Time Spent - Hours
Run of Schedule: M-Su 6a-2a

58
Adults 35-54 - AQH Audience (000)
Run of Schedule: M-Su 6a-2a
Source: BBM Canada ; InfoSys+TV Diary; Ottawa-Gatineau EM; Total TV; AQH = Average Quarter Hour Audience
Spring Fall0.0
10.0
20.0
30.0
40.0
50.0
60.0
70.065.9
63.566.5
61.364.4
62.361.6 61.361.358.2
65.4
58.060.8
48.850.1 50.652.8
200620072008200920102011201220132014

59
Adults 35-54 - Weekly Reach %
Prime: M-Su 7p-11p
Source: BBM Canada ; InfoSys+TV Diary; Ottawa-Gatineau EM; Total TV
Spring Fall0.0
10.020.030.040.050.060.070.080.090.0
100.095.2 93.796.1 93.694.7 94.596.0 95.492.7 93.094.3 93.191.5 93.590.8 93.591.7 2006
20072008200920102011201220132014

60
Adults 35-54 - Weekly Time Spent - Hours
Prime: M-Su 7p-11p
Source: BBM Canada ; InfoSys+TV Diary; Ottawa-Gatineau EM; Total TV; Per Capita Hours based on BBM population estimates
Spring Fall0.0
2.0
4.0
6.0
8.0
10.0
12.0
10.59.8
10.39.79.8 9.89.8
9.39.3 9.310.2
9.49.5
8.18.3 8.68.3
200620072008200920102011201220132014

61
Adults 35-54 - AQH Audience (000)
Prime: M-Su 7p-11p
Source: BBM Canada ; InfoSys+TV Diary; Ottawa-Gatineau EM; Total TV; AQH = Average Quarter Hour Audience
Spring Fall0.0
20.040.060.080.0
100.0120.0140.0160.0180.0
168.8163.7
168.2
155.2156.9 160.5156.8152.0
157.8
145.7
160.0151.1151.3
131.0134.5141
135.2
200620072008200920102011201220132014

62
Reach, Time Spent, Average Quarter Hour Audience
Adults 55+

63
Source: BBM Canada ; InfoSys+TV Diary; Ottawa-Gatineau EM; Total TV
Spring Fall0.0
10.020.030.040.050.060.070.080.090.0
100.097.9 98.497.7 97.898.2 98.097.9 97.896.5 98.097.5 97.494.6
97.897.7 97.597.1 200620072008200920102011201220132014
Adults 55+ - Weekly Reach %
Run of Schedule: M-Su 6a-2a
64
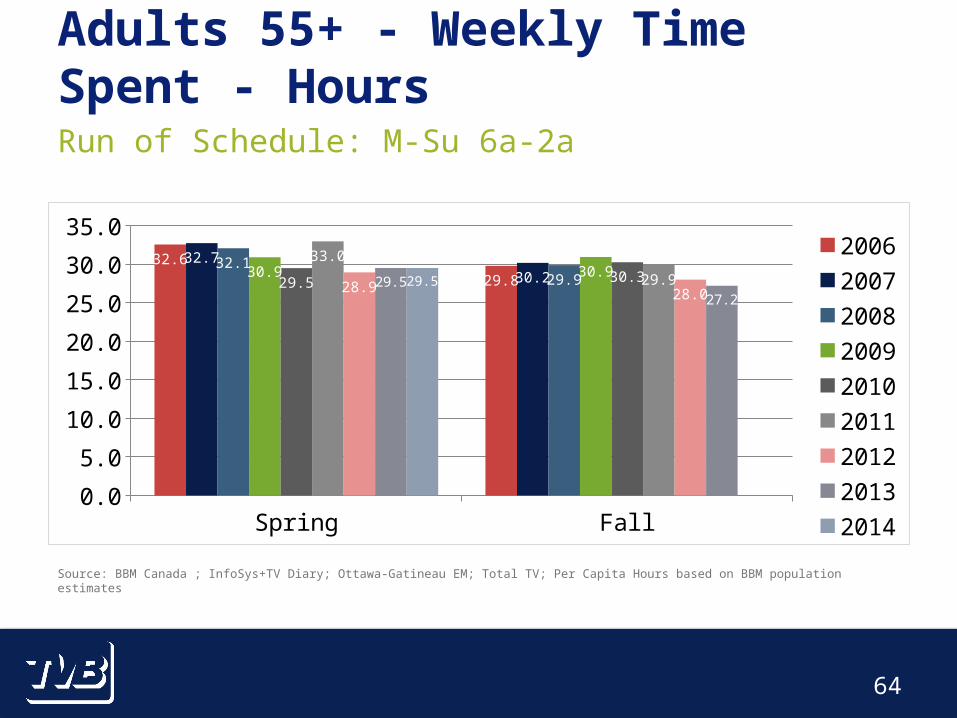
Source: BBM Canada ; InfoSys+TV Diary; Ottawa-Gatineau EM; Total TV; Per Capita Hours based on BBM population estimates
Spring Fall0.0
5.0
10.0
15.0
20.0
25.0
30.0
35.032.6
29.8
32.730.2
32.129.930.9 30.9
29.5 30.333.0
29.928.9 28.029.5
27.229.5
200620072008200920102011201220132014
Adults 55+ - Weekly Time Spent - Hours
Run of Schedule: M-Su 6a-2a

65
Source: BBM Canada ; InfoSys+TV Diary; Ottawa-Gatineau EM; Total TV; AQH = Average Quarter Hour Audience
Spring Fall0.0
10.020.030.040.050.060.070.080.090.0
100.0
73.270.0
76.972.8
77.7 75.479.7 81.6
79.082.6
89.783.981.6 81.6
85.682.6
90.2200620072008200920102011201220132014
Adults 55+ - AQH Audience (000)
Run of Schedule: M-Su 6a-2a
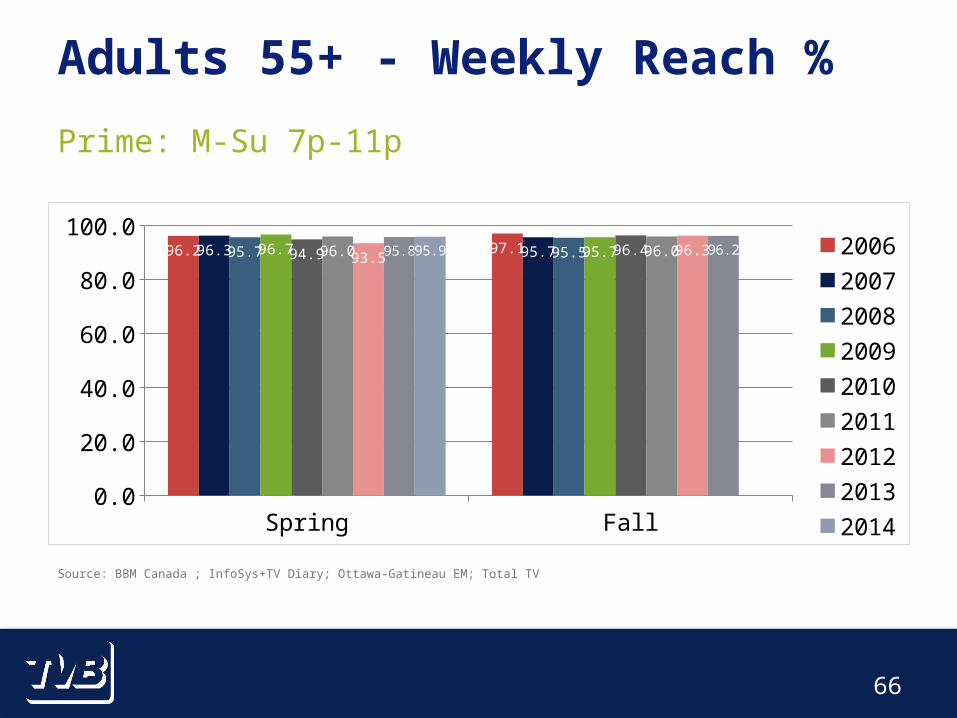
66
Source: BBM Canada ; InfoSys+TV Diary; Ottawa-Gatineau EM; Total TV
Spring Fall0.0
10.020.030.040.050.060.070.080.090.0
100.096.2 97.196.3 95.795.7 95.596.7 95.794.9 96.496.0 96.093.5 96.395.8 96.295.9 2006
20072008200920102011201220132014
Adults 55+ - Weekly Reach %
Prime: M-Su 7p-11p

67
Source: BBM Canada ; InfoSys+TV Diary; Ottawa-Gatineau EM; Total TV; Per Capita Hours based on BBM population estimates
Spring Fall0.02.04.06.08.0
10.012.014.016.0
13.913.0
13.7 13.213.4 13.013.1 13.112.9 13.413.913.012.8
12.012.9 12.412.8
200620072008200920102011201220132014
Adults 55+ - Weekly Time Spent - Hours
Prime: M-Su 7p-11p

68
Source: BBM Canada ; InfoSys+TV Diary; Ottawa-Gatineau EM; Total TV; AQH = Average Quarter Hour Audience
Spring Fall0.0
50.0
100.0
150.0
200.0
250.0
156.0 152.7160.9 159.1161.9 163.7168.4 173.2173.0
183.0188.8182.5181.1 175.3
187 187.6195.6
200620072008200920102011201220132014
Adults 55+ - AQH Audience (000)
Prime: M-Su 7p-11p