turnpike trusts and the transportation revolution in 18th century
TRANSCRIPT

Turnpike Trusts and the Transportation Revolution in18th Century England
Dan Bogart
October 13, 2004
Abstract
There is a long debate in economic history about the causes of the transportationrevolution and its economic impact. This study examines the effects of the TurnpikeTrust System in 18th century England. Turnpike trusts were organizations that fi-nanced road improvements by levying tolls. They replaced the authority of parishes,which financed road improvements using local taxes. This study shows that turnpiketrusts contributed to lower freight charges and improved the quality of services. It alsoshows that all road transport innovations, including turnpike trusts, generated a socialsavings of more than 1% of national income in 1800 and 1820.
1

1. Introduction
The transportation revolution of the 18th and 19th centuries embodied dramatic reductions
in transport costs and improvements in the quality of services. These changes had a profound
effect on economic development by contributing to globalization and industrialization.1 In
spite of its historical implications, there are still many questions about what caused the
transportation revolution. Some scholars argue that technological change was the most
important factor, whereas others suggest that organizational change was equally important.2
This study investigates the impact of a specific organizational change by examining the effects
of turnpike trusts in 18th century England.
A turnpike trust was an organization that financed road improvements by levying tolls
and issuing mortgage debt. They were created by Acts of Parliament, which named a
body of trustees and gave them authority over a particular roadway, which was previously
managed by individual parishes located along the road. Unlike turnpike trusts, parishes did
not have access to external sources of funding, such as tolls or bonds. Instead, they financed
road improvements by levying local property taxes and by claiming up to six days of labor
per year from their residents. Parishes were also different because they were part of the
traditional hierarchy of local government, whereas turnpike trusts were statutory authorities
that were promoted and managed by local property owners.
The diffusion of turnpike trusts spanned the 17th, 18th, and early 19th centuries. The
most significant period of adoption occurred during the 1750s and 1760s, when over 300
trusts were created along 10,000 miles of road (see Figure 1). By the 1830s, the turnpike
network expanded further to include 1000 trusts managing around 20,000 miles, or 17% of
the entire road network in England and Wales.3
Aside from controlling a substantial portion of the road network, turnpike trusts also
managed the most heavily traveled routes. As early as 1770, they were responsible for all of
the major highways leading into London, as well as a dense network of roads in the industrial
regions of the West Midlands and the North (Pawson, 1977).
The transition from parishes to turnpike trusts was important because it resulted in a
substantial increase in road investment. Turnpike trusts spent between 10 and 20 times
1See Williamson and O’Rourke (1999), Estevadeordal, Frantz, and Taylor (2003), and Ville (1990).2See North (1968), Shepherd and Walton (1972); Harley (1988), Menard (1991), Kaukiainen (2001),
Mohammed and Williamson (2004).3For information of the length of the road network in England and Wales, see the Parliamentary Papers,
Appendix to the Report of Commissioners appointed to inquire into the State of the Roads.
1

more than the parishes they replaced. They were also the driving force behind a four-fold
increase in aggregate road expenditure between 1730 and 1800 (Bogart, 2004).
There are a number of reasons why turnpike trusts invested more than parishes. One
factor was that parishes were forced to rely on local taxes, and therefore they were less
likely to undertake road improvements that largely benefited road-users passing through
their jurisdiction. Turnpike trusts addressed this problem by levying tolls and thereby
forcing road-users to contribute to the costs of investment. Turnpike trusts also resolved a
number of other problems in the parish system. For example, they improved coordination by
replacing a multitude of parishes with a single body of trustees who could direct investment
over an entire roadway or a network of roads. Turnpike trusts also resolved borrowing
constraints faced by parishes because they could issue debt at a low cost. Finally, turnpike
trusts resolved intra-parish bargaining problems by transferring authority to local property
owners, who had a common interest in carrying out road improvements.
The expansion of turnpike trusts and greater road investment coincided with a number
of revolutionary changes in the road transport sector. The most important were a dramatic
decline in freight charges and passenger travel times, along with a substantial growth in
freight and passenger services.
The coincidence between turnpike trusts and the transportation revolution has spurred a
substantial literature investigating the relationship between the two. A number of scholars,
such as W. T. Jackman (1916), William Albert (1972), Phillip Bagwell (1974), and Eric
Pawson (1977), have argued that turnpike trusts contributed to lower freight charges and
faster travel speeds by smoothing road surfaces and reducing inclines. However, these views
have been challenged by Dorian Gerhold (1996), who argued that other innovations were
more important than turnpike trusts. For instance, Gerhold suggested that improvements
in horse breeding and increases in the size of carriage firms contributed to over half of the
total reduction in freight charges during this period.
Gerhold’s findings raise a more general concern that turnpike trusts were induced by
a variety of innovations that were responsible for the reductions in transport costs. For
example, it is possible that technological changes initially caused transport costs to fall and
that turnpike trusts were adopted once traffic volumes increased. If this was the case, then
turnpike trusts may have made a smaller contribution to the transportation revolution than
previously thought.
There is also the question of whether turnpike trusts raised fares and freight charges by
2

introducing tolls. The tolls may have offset the benefits of better roads simply because
the investment and maintenance costs were large. Alternatively, the tolls may have been
too high because trustees exploited their monopoly power. Parliament tried to eliminate
such abuses by setting a maximum schedule of tolls and by forbidding trustees from earning
profits. Parliament also tried to give trustees an incentive to keep the tolls low by requiring
that they own property, which could potentially earn higher income from lower transport
costs. However, monopoly abuses may still have persisted if the maximum schedules were
not designed properly and if trustees could earn greater returns by supplying materials and
lending to the trust.
This study addresses these questions and reassesses the impact of turnpike trusts on the
transportation revolution and economic development in 18th Century England. It begins
by reviewing the major changes in the road transport sector during this period, including a
40% reduction in real freight charges and a 60% reduction in passenger travel times. Next,
this study demonstrates that turnpike trusts lowered freight charges by an average of 20%
and that they had an even larger impact along the heavily-traveled London routes. Finally,
this study evaluates the broader significance of the road transportation revolution and shows
that it generated a social savings of more than 1% of national income in 1800 and 1820.
In order to develop these conclusions, this study combines new information with a number
of data sets in the literature. The first data set is a collection of land carriage rates from
130 city-pairs covering the period from 1695 to 1825. Land carriage rates were regulated
freight charges set by local magistrates. They represented the maximum price that a carrier
could charge for the shipment of goods between two cities. A number of scholars, such as
William Albert (1972) and Dorian Gerhold (1996), have used land carriage rates to measure
the impact of turnpike trusts on freight charges. They are a popular source because they
track freight charges for individual city-pairs over a long time period. However, none of
the earlier studies have analyzed land carriage rates across a large number of city-pairs, nor
have they tested whether rates were lower for city-pairs after turnpike trusts were established
along their route.
This study uses a new data set of over 5000 land carriage rates from 130 city-pairs to
estimate whether turnpike trusts lowered freight charges. After controlling for a number of
factors, the analysis shows that land carriage rates were stable before turnpike trusts. It
also shows land carriage rates declined by around 20% after trusts were established. These
findings are important because they show that turnpike trusts did not raise freight charges
3

and that they were not induced by other innovations. The results also suggest that turnpike
trusts contributed to approximately half of the total reduction in freight charges between
1750 and 1820.
This paper also provides two additional pieces of evidence that turnpike trusts lowered
freight charges. First, it shows that the tolls on wagons declined by more than 20% in
real terms between 1730 and 1800. This finding is important because it indicates that the
burden of the tolls diminished at the same time that freight charges declined. Second, this
study analyzes the differences between winter and summer land carriage rates and shows that
winter rates converged to summer rates between 1750 and 1800. This second finding is also
significant because it cannot be explained by contemporaneous factors, such as increases in
firm-size or changes in technology. However, it is consistent with the argument that turnpike
trusts lowered freight charges by making the roads more durable in the rainy season.
Aside from measuring the effect of turnpike trusts along the average route, this study also
examines whether trusts had a greater impact on freight and passenger services to London.
The London transportation market deserves special attention because it was the largest and
most important in the British economy. It is also possible that turnpike trusts had a larger
effect along the London routes because they were able to finance greater investment and
spread the costs across larger numbers of road-users.
This study uses the data on land carriage rates to show that turnpike trusts lowered
freight charges by an additional 10% along the London routes. It also draws upon informa-
tion from travel directories to measure changes in the number and types of transport services
leaving from London. The evidence indicates that the number of freight and passenger ser-
vices grew substantially between 1760 and 1800, after most turnpike trusts were established.
It also shows that turnpike trusts preceded the diffusion of fly-machine services, which were
high-speed passenger services between London and major provincial cities.
The analysis concludes with an assessment of the impact of road transport innovations on
economic development in England and Wales. The major finding is that the social savings
from all innovations, including turnpike trusts, equaled 1.2% of national income in 1800 and
2.1% in 1820. These estimates suggest that the effects of road transport innovations were
comparable with canals, which are often considered to be the most important transport
improvements before railroads (Hawke and Higgins, 1983). The estimates also suggest
that the road transport revolution made an important contribution to the early Industrial
4

Revolution.4
More generally, the results of this study address the larger debate on the relative im-
portance of technological and organizational change in the transportation revolution. This
debate has been most pronounced in ocean shipping, where Douglass North, Gary Walton,
and James Shepherd (1968, 1972) have argued that the decline of piracy and changes in load-
ing and packaging procedures contributed to lower freight rates during the 18th and 19th
centuries. However, many of their claims have been challenged by Knick Harley (1988), who
argued that the introduction of steam power and metal hulls was more important.
The case of 18th century road transport offers an interesting comparison with ocean ship-
ping because there were no technological changes that can compare with the introduction of
steam power or metal hulls. However, the English road transport sector clearly experienced
a number of organizational changes, which played an important role in lowering transport
costs. Turnpike trusts represent one of the most interesting organizational changes because
they required a broader set of institutions. For example, the turnpike system required a
political system that allowed new trusts to be established whenever local demand for road
improvements increased. In addition, the turnpike system depended on formal and informal
rules to ensure that the tolls would be enforced and that they would be directed towards
road improvements. As a result, the turnpike system provides one of the best illustrations
of how institutions affected economic development during the 18th and 19th Centuries.
2. The Road Transportation Revolution
There is a common perception that road transport was inefficient during the 18th century
and that canals and later railroads were the vanguard of the transportation revolution. This
negative view of road transport may be applicable to the early 18th century, but it is not
accurate for the second half of the 18th century. During this later period, there are a number
of indications that the road transport sector increased both its efficiency and its capacity.
These developments included increases in travel speeds, reductions in freight charges, and a
substantial growth in road traffic.
One of the most important changes in the road transport sector was a rise in passenger
travel speeds. To illustrate the trends, Figure 2 combines the data from W.T. Jackman
4For an elaboration of the hypothesis that road transport improvements played an important role in theIndustrial Revolution see Szostak (1991) and Ville (1990).
5

(1916) and Eric Pawson (1977) and plots the average journey miles per hour across a sample
of 225 city-pairs between 1750 and 1829.5 Over the whole period, average journey miles per-
hour increased from 2.6 to 8.0, with the most dramatic changes occurring between 1750 and
1780. In a few cases, it is also possible to measure the decline in travel times for individual
city-pairs over the entire 18th century. For instance, the travel time between London and
Manchester decreased from around 90 hours in 1700 to 60 hours in 1760, 24 hours in 1787,
and 19 hours in 1821 (Pawson, 1977).
The rise in travel speeds represented a substantial increase in the quality of passenger
services, and therefore it could have coincided with an increase in passenger fares. To
estimate the trends in passenger fares, this study combines the data of Jackman (1916) and
Gerhold (1996) with new information on a large number of passenger fares in 1760 and 1770.6
Figure 3 uses the new data to plot an index of real passenger fares between 1750 and 1830.
It is equal to an index of average passenger fares divided by Greg Clark’s consumer price
index (2001a). The series shows that real passenger fares fluctuated; however they were
lower by an average of 7.5% between 1790 and 1809. As a result, it is clear that passengers
were paying a lower fare in the early 19th century, while enjoying a much faster service.
Another important development in the road transport sector was the decline in freight
charges. The best source of information on freight charges during this period are land carriage
rates, which represent the maximum price that a carrier could charge for the shipment of a
certain weight of goods between two particular cities. Land carriage rates were introduced
by legislation passed in the 1690s. The legislation gave local magistrates the authority to
set maximum freight charges in order to prevent carriers from colluding and raising their
prices. It also gave magistrates discretion over which markets to regulate. In most cases,
magistrates set the rates on goods shipped from London, but in other cases they also set
rates on goods shipped from other cities.
A number of scholars have investigated whether land carriage rates are a useful measure
of actual freight charges.7 Most of the available evidence suggests that actual freight charges
were very similar to land carriage rates. For example, Michael Freeman (1977) has shown
that between London and Portsmouth both advertised and actual freight charges were very
5Journey miles per hour are defined as the total journey distance divided by the total journey time. Forinformation on the data see Table 10 in the appendix.
6The new data come from the London directory, The New and Complete Guide to all Persons who haveany Trade or Concern with the City of London. For more information see Table 11 in the appendix.
7For example, see Willan (1962), Albert (1972), Freeman (1977), Turnbull (1985), and Gerhold (1996).
6

close to land carriage rates between 1775 and 1800. Gerard Turnbull (1985) has also shown
that carriers in the North of England often charged freight rates that were identical to
land carriage rates. Turnbull has also documented that magistrates in the West Riding of
Yorkshire raised land carriage rates in 1800 because rising feed prices were forcing carriers
to suspend services at the previous price ceiling. Therefore, the evidence suggests that land
carriage rates represented a binding constraint on carriers and that they were adjusted when
underlying costs changed.
This study builds on this earlier literature and uses a new data set of over 5000 land
carriage rates from 130 city-pairs between 1695 and 1827.8 The data set is particularly
useful because it tracks the trends in freight charges over the entire 18th century. Figure
4 plots an index of real land carriage rates between 1700 and 1819 and compares it with
Dorian Gerhold’s productivity index for London to Leeds.9 The two series have similar
trends, except that average freight charges fell by about 40% between 1750 and 1800, while
the rates between London and Leeds fell by 50%. The decline in freight charges between
London and Leeds was not exceptional among freight services to London. For example,
land carriages rates between London and Newcastle also fell by 50% between 1750 and 1800.
However, the changes were often less dramatic for freight services between provincial cities
such as Leeds and York, where land carriage rates fell by around 25% during this period.
Unlike the passenger sector, the freight sector did not experience a substantial reduction
in travel times. The only cases where travel times did decrease were along routes where ‘fly-
wagon’ services were introduced. Fly-wagon services were distinctive because they traveled
at a greater speed than standard freight services. However, they were not very common
along most routes before 1800.
Aside from the changes in freight charges and travel times, the road transport sector also
witnessed a dramatic increase in road traffic, especially between London and the provinces.
John Chartres and Gerard Turnbull (1977, 1983) provided the first estimates of traffic growth
by comparing the number of weekly freight and passenger services listed in London travel
directories. For example, if directories indicate that between Birmingham and London the
number of weekly passenger services increased from 2 to 3 between 1750 and 1760, then
Chartres and Turnbull inferred that the number of services between these cities grew by
50% over this period. Using this methodology for a sample of major cities, they estimated
8The data set and the manuscript references are described in the appendix.9The real land carriage index is equal to an index of average land carriage rates divided by Clark’s
consumer price index (2001a). See Table 8 in the appendix for more information.
7

that the number of freight and passenger services grew at an average annual rate of 1.2%
and 2.9% respectively between 1715 and 1796.10
Chartres and Turnbull’s estimates have been challenged by Dorian Gerhold (1988), who
argues that their methodology overstates the number of actual services, because most direc-
tories did not distinguish between services to a single city versus multiple cities.11 To deal
with this problem, Gerhold proposed an alternative approach which combines all services to
a particular county that departed from the same inn, on the same day. Using this method,
Gerhold estimated that the number of freight services grew at an average annual rate of
0.2% between 1705 and 1798, which is far below Chartres and Turnbull’s estimate of 1.2%.
Dorian Gerhold’s findings are rather surprising because they suggest that the number
of freight services grew very slowly, at the same time that freight charges fell by around
40%. Therefore, to assess whether the number of freight and passenger services increased
when transport costs fell, this study examines a collection of London travel directories for
the years 1715, 1740, 1749, 1760, 1770, 1779, 1783, 1790, and 1800.12 Columns (1) and
(2) in Table 1 present the raw data on the total number of weekly services at each of these
dates. The estimates suggest that the number of services grew dramatically, especially in
the passenger sector. Across the entire period, the average annual growth rate was 2.7%
for freight and 3.6% for passenger services. More importantly, the figures suggest that the
growth in services increased between 1760 and 1800, when transport costs fell substantially.
To check whether the previous series overstate the actual growth in services, Table 1 also
includes data on the number of weekly services between London and 45 major cities with
a population above 2500 in 1700.13 Among others, the major cities include Birmingham,
Leeds, Manchester, Liverpool, and Bristol. Presumably, these cities should have been large
enough to support their own wagon and coach services, and therefore they would be less
likely to have over-lapping services with other major cities. The figures in columns (3) and
(4) show that freight and passenger services to major cities displayed similar patterns as in
the larger sample. In particular, between 1715 and 1800 the average annual growth rate was
2.3% for freight and 3.1% for passenger services, which is slightly lower than the growth rate
10In 1715, Chartres and Turnbull estimate that there were 158 weekly passenger services and 108 freightservices between London and a sample of major cities. By 1796, they estimate that the number of passengerand freight services grew to 1596 and 294, respectively.11For example, suppose a single wagon service traveled to two cities, but was listed under each separately.
In this case, the number of listed services would be two, while in reality there was only a single service.12See the appendix for more information on the sample of directories.13The list of major cities is drawn from Corfield (1982).
8
in services across all cities. This finding suggests that there is some bias from over-lapping
services, but not enough to overturn the conclusion that road traffic grew substantially,
especially after 1760.
The estimates of service growth are important because they provide evidence that road
traffic grew and that the number of ton-miles and passenger-miles increased during this
period. In principle, output could grow because load sizes increased or because more wagons
and coaches were traveling greater distances. As the data in Table 1 suggests, a substantial
portion of the growth in the passenger sector came from greater numbers of coaches along
the road. In part, this followed from limitations on the number of passengers that could
travel in a single coach, but it was also due to traveler’s preferences for less crowding.
By contrast, carriers did not have to accommodate passengers’ demands for comfort, and
therefore they could enlarge output by increasing load-sizes as well as adding more wagons.
Both of these effects are apparent in Table 1, which shows that the number of services grew
substantially between 1749 and 1770, when Parliament limited the maximum load size of a
wagon to 3 tons. However, between 1770 and 1783, the number of freight services grew more
slowly, when Parliament raised the maximum load size to 6 tons in 1765 (Jackman 1916).
Considering all the evidence, it is clear that the road transport sector was expanding and
becoming much more efficient over the 18th century. It is worth noting that the decline in
road transport costs was similar to the decline in transport costs in ocean shipping during
the 19th century. For example, freight rates declined by around 40% in real terms between
1870 and 1914 (Mohammed and Williamson, 2004). In that case, technological change is
often cited as the most significant factor in driving down freight charges. Was it also the
most important factor in 18th century road transport, or were organizational changes, such
as the adoption of turnpike trusts, more important?
3. Turnpike Trusts and the Road Transport Revolution
Turnpike trusts are often identified as an influential factor in the road transport revolution
in 18th Century England. For example, scholars such as Jackman (1916), Albert (1972),
and Pawson (1977), have all argued that turnpike trusts contributed to lower transport costs
by improving road quality. However, these conclusions may be premature because turnpike
trusts could have raised transport costs by introducing tolls. In addition, turnpike trusts may
have been induced by other innovations that were ultimately responsible for improvements
9

in efficiency.
The idea that turnpike trusts lowered transport costs is based on the argument that
they widened and improved the road surfaces by increasing maintenance and investment.
Wider roads were important because they decreased congestion and they enabled wagons
to replace packhorses along roads that were previously too narrow (Pawson, 1977). Better
road surfaces were also crucial because they lessened the wear on wagons and allowed horses
to haul larger loads and to carry passengers at a greater speed (Gerhold, 1996).
The benefits of better roads were well-known during the early 18th Century, when parishes
managed most of the major roadways in England.14 One reason why turnpike trusts ulti-
mately financed greater investment is that they were able to levy tolls and issue debt, while
parishes had to rely on local labor and property taxes. Debt financing was important be-
cause it allowed trusts to finance projects with high fixed costs. The ability to levy tolls was
also important because it forced road-users to contribute to the costs of investment. In par-
ticular, the tolls shifted the cost of improving major highways to road-users, who benefited
more than the residents of parishes.
Aside from resolving fiscal constraints, turnpike trusts were also more effective because
they resolved coordination problems. Coordination was important because parishes col-
lectively managed the road network. Therefore, it was possible that individual parishes
did not invest in their own road segment because they expected that other parishes would
not make similar investments. Turnpike trusts addressed this issue by centralizing decision
making authority over an entire roadway, and by forming inter-locking bodies of trustees,
which helped to coordinate investments across trusts.15
Turnpike trusts were also successful in financing road investment because they resolved
bargaining problems within parishes. For example, there may have been disputes between
laborers and landowners concerning the level of investment and the relative tax burden paid
by each group. Turnpike trusts resolved this problem because they transferred control rights
to local property owners, who had a common interest in financing investment.
In general, the turnpike system had a number of attributes which allowed it to finance
greater road investment. However, it also introduced the potential for rent-seeking because
turnpike trusts were granted a monopoly right over the provision of a particular road ser-
vice. Parliament was aware of the potential abuses from monopoly power, and therefore
14For example, see Daniel Defoe, A Tour Through the Great Britain, volume II, pp. 439-40.15For examples of inter-locking bodies of trustees, see Albert (1972).
10

they imposed a maximum schedule of tolls and forbade trustees from earning direct profits.
Parliament also pursed more indirect strategies by allowing competing trusts to enter the
market and by requiring that trustees own property. The latter policy was particularly
important because it provided trustees with an incentive to keep the tolls as low as possible,
so that they could maximize the value of their property holdings, including land, houses,
mines, and factories.
Although these measures were intended to reduce rent-seeking, it is not clear that they
were effective. There was great suspicion among contemporaries that trustees were earning
profits through construction contracts and by lending to the trust. For example, in The
Wealth of Nations, Adam Smith suggested that abuses by trustees made the tolls twice
as large as was necessary to properly maintain the road network.16 Smith’s views were
shared by the pamphleteer Robert Phillips, who complained that travelers “pay a great
deal of money to the Turnpikes; and then they find the roads daily grow worse.”17 While
these views may not be representative, they clearly raise the possibility that trustees were
interested in maximizing toll revenues, rather than keeping the tolls as low as possible. The
behavior of trustees has important implications for the changes in transport costs, because
higher tolls may have offset the benefits from road improvements.
Another important issue is whether technological or organizational changes influenced
the adoption of turnpike trusts by lowering transport costs and increasing traffic volumes.
In some cases, it is clear that turnpike trusts preceded certain innovations, and therefore
they were unlikely to affect their adoption. For instance, most of the major improvements
in wagon and carriage design occurred after 1800, when most turnpike trusts were already
established (Strauss, 1912; Stratton, 1972). Similarly, most of the major innovations in road
building techniques came after 1800, when James Macadam and Thomas Telford introduced
the idea of building roads with convex surfaces and layers of gravel of different sizes.
However, there are also cases where innovations occurred during the same time period
or along the same roads where turnpike trusts were created. For example, the size and
strength of shire horses increased during the second half of the 18th Century, when domestic
breeds were combined with breeds from Holland. In addition, larger carriage firms emerged
after 1750 and tended to be most common in London transportation services.
The potential link between turnpike trusts and stronger horses is significant because the
16See p. 1726 for Smith’s views on this issue.17Quoted in Pawson (1977), p. 265.
11

new breeds may have played an important role in raising load sizes and increased travel
speeds. Similarly, larger firms may have contributed to lower costs by making better use of
capacity and by saving on inputs such as labor and horse feed (Gerhold, 1996). Therefore,
it is also possible that turnpike trusts were simply a consequence of these alternative factors,
and that they did not make an important contribution to the transport revolution.
4. Did Turnpike Trusts Lower Transport Costs?
One of the important questions in the literature on turnpike trusts is whether they con-
tributed to lower freight charges. Previous scholars, such as William Albert (1972), have
noted that freight charges declined during the 1750s and 1760s, when many turnpike trusts
were established. However, Albert did not examine whether turnpike trusts were induced
by other innovations or whether turnpike trusts may have raised freight charges by levying
tolls. In order to revaluate the impact of turnpike trusts on freight charges, this study
draws on a new data set of land carriage rates. Recall that land carriage rates represent
the maximum price paid by the road-user, and they include the effects of the tolls as well
as road improvements. Therefore, if the tolls offset the benefits of road improvements, then
we would expect that land carriage rates would stay the same or rise after turnpike trusts
were established. Also, if trusts were induced by other innovations, then we would expect
that land carriage rates should decline before trusts were established.
One of the challenges in evaluating the effects of turnpike trusts is that they were not
established instantly along the routes connecting city-pairs. For example, along the 275
mile route between Newcastle and London, 17 separate turnpike trusts were established
at various times between 1710 and 1776. Therefore, this study measures the adoption of
turnpike trusts by the fraction of route mileage managed by turnpike trusts in each year.18
For instance, in the Newcastle to London case, the fraction of turnpike mileage was 0.51
in 1740, 0.87 in 1745, and 0.92 in 1750. If turnpike trusts lowered freight charges in this
particular case, then land carriage rates should have declined after 1740 as turnpike trusts
became more common along the route between London and Newcastle.
18To link turnpike trusts with city-pairs, I first identified when and where turnpike trusts were establishedusing the comprehensive studies of Albert (1972) and Pawson (1977). Next, I matched turnpike trusts withcity-pairs using the travel guide, Britannia Depicta (Bowen 1970) and Paterson’s Roads (Mogg 1826). In afew cases, a route could not be identified for a city-pair, in which case I used the maps from the PhillimoreAtlas (Humphrey-Smith, 1984).
12

As a first step, we can test whether freight charges declined after turnpike trusts were
established by estimating the following equation:
ln(real land carriage rateijt) = β(fraction turnpikeit) + δ1 ln(real wagejt)+ (1)
δ2 ln(real feed pricejt) + γ + αi +εijt
where i represents each city-pair, j represents one of four regions (Southeast, Southwest,
North, and Midlands), and t represents each year (t = 1695, 1696, ..1827). The variable
ln(real land carriage rateijt) is the natural log of the real land carriage rate for city-pair i
in region j in year t; fraction turnpike is the fraction of city-pair i0s route mileage managed
by turnpike trusts in year t; ln(real wage)jt is the log of the real wage in region j in year t;
ln(real feed price)jt is the log of the price of horse feed in region j in year t; γ is a constant;
αi is a city-pair dummy, and εijt is the error term.19
The regression includes the real wage and the real feed price because it was an important
determinate of real freight charges (Gerhold, 1993). In addition, the regression includes
a city-pair dummy variable, which captures all time-invariant, unobservable characteristics
associated with each city-pair. For example, it controls for the distance between city-pairs
as well as geographic factors. However, the inclusion of the city-pair dummy also implies
that the effect of turnpike trusts is measured by changes in land carriage rates within city-
pairs, rather than differences across city-pairs. As a result, the coefficient on the variable,
fraction turnpikeit, can be interpreted as the percentage change in real land carriage rates
after turnpike trusts were established along 100% of the route mileage for a city-pair.
The results are presented in column (1) of Table 2. The estimates suggest that real land
carriage rates declined by 50% after turnpike trusts were established. This finding casts
substantial doubt on the hypothesis that turnpike raised freight charges by levying tolls. At
the same time, it probably over-states the impact of turnpike trusts, because it does not
account for other factors that affected land carriage rates. For example, it does not account
for the possibility that a new breed of horse was introduced in a particular year and caused
land carriage rates to fall for many city-pairs. Also, it does not incorporate the long-run
effects from such innovations.
To control for some of these unobservable changes, we estimate a second regression:
19For more information on the variables see the appendix.
13

ln(real land carriage rateijt) = β1(fraction turnpikeit) + λt + θ(yeart) + (2)
β2(fraction turnpikeit)(yeart) + δ1 ln(real wagejt)+
δ2 ln(real feed pricejt) + γ + αi +εijt
where λt is a year dummy variable and yeart is the actual year (i.e. t = 1695, 1696, ..1827).
The year dummies will capture short-run effects, such as a brief rise in the price level or the
introduction of a new breed of horse in a particular year. The year variable will measure
the trend reduction in real land carriage rates across all city-pairs and will capture the long
run-effects from innovations that were not exclusive to city-pairs with turnpike trusts.
Regression equation (2) also includes an interaction between the fraction of route mileage
managed by turnpike trusts and the year. This variable tests whether the trend in land
carriage rates changed after trusts were established. It is important to include this variable
in the regression because the introduction of the year dummy variables implies that the
coefficient on the fraction of turnpike mileage will only capture the impact of turnpike trusts
during the year that they were established. However, trusts were unlikely to have such an
immediate effect, because it often took several years to remake the road.20
The results from the second regression are reported in column (2) of Table 2. In this
case, the effect of turnpike trusts can only be measured at a particular date. For instance,
by 1800, the estimates indicate that city-pairs with turnpike trusts had 16.8% lower land
carriages rates than city-pairs without turnpike trusts; and by 1820, this difference increased
to 23.5%.21 Another way of measuring the effect of turnpike trusts is calculate their share
of the total reduction in real land carriage rates. For instance, if a city-pair had no turnpike
trusts along its route, then the estimates imply that real land carriage rates would decline
by a total of 14.2% between 1750 and 1800. By contrast, if a city-pair had a turnpike
trust established along its route, then real land carriage rates would have declined by a total
of 31% between 1750 and 1800.22 Therefore, the estimates suggest that turnpike trusts
accounted for approximately half of the total decline in real land carriage rates.
20For instance, Bogart (2004) shows that turnpike trusts made road investments over their first two years.21The 16.8% figure comes from the following calculation, 5.9131-1800×0.0033784. Similarly, the 23.5%
figure comes from the calculation 5.9131-1820×0.0033784.22The 14.2% figure comes from the calculation, (−0.0028437)× (1800− 1750). The 31% figure is equal to
14.2% + 16.8%.
14
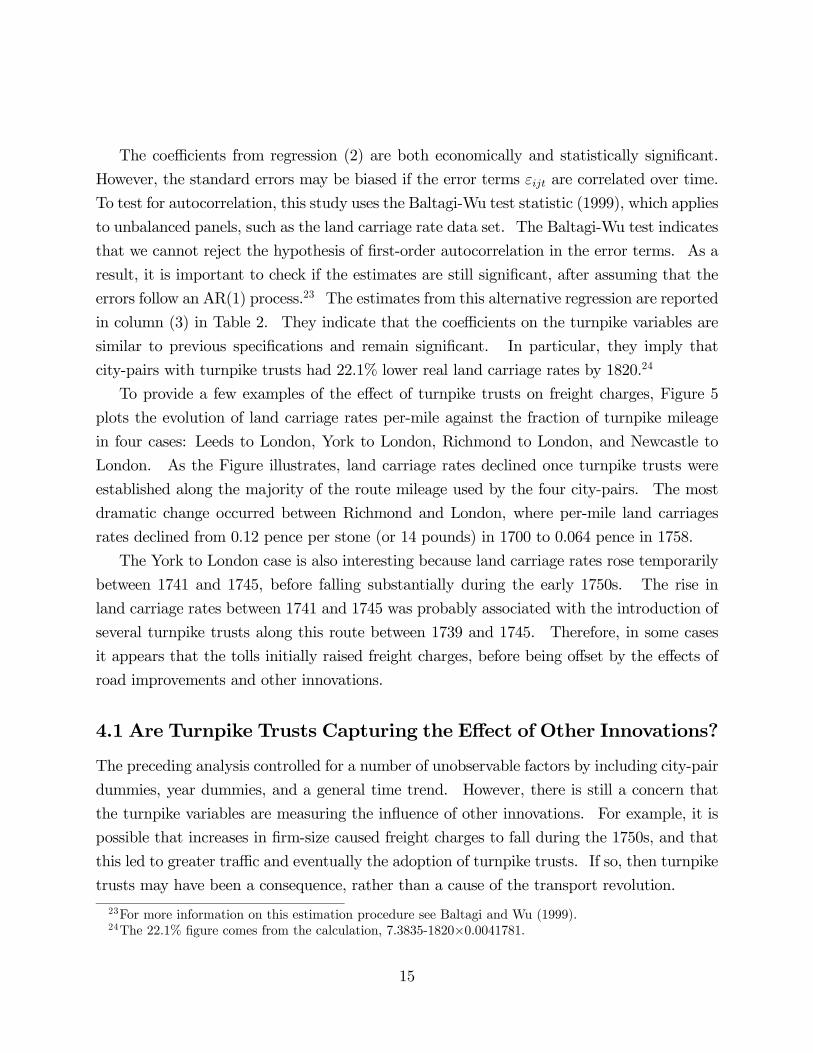
The coefficients from regression (2) are both economically and statistically significant.
However, the standard errors may be biased if the error terms εijt are correlated over time.
To test for autocorrelation, this study uses the Baltagi-Wu test statistic (1999), which applies
to unbalanced panels, such as the land carriage rate data set. The Baltagi-Wu test indicates
that we cannot reject the hypothesis of first-order autocorrelation in the error terms. As a
result, it is important to check if the estimates are still significant, after assuming that the
errors follow an AR(1) process.23 The estimates from this alternative regression are reported
in column (3) in Table 2. They indicate that the coefficients on the turnpike variables are
similar to previous specifications and remain significant. In particular, they imply that
city-pairs with turnpike trusts had 22.1% lower real land carriage rates by 1820.24
To provide a few examples of the effect of turnpike trusts on freight charges, Figure 5
plots the evolution of land carriage rates per-mile against the fraction of turnpike mileage
in four cases: Leeds to London, York to London, Richmond to London, and Newcastle to
London. As the Figure illustrates, land carriage rates declined once turnpike trusts were
established along the majority of the route mileage used by the four city-pairs. The most
dramatic change occurred between Richmond and London, where per-mile land carriages
rates declined from 0.12 pence per stone (or 14 pounds) in 1700 to 0.064 pence in 1758.
The York to London case is also interesting because land carriage rates rose temporarily
between 1741 and 1745, before falling substantially during the early 1750s. The rise in
land carriage rates between 1741 and 1745 was probably associated with the introduction of
several turnpike trusts along this route between 1739 and 1745. Therefore, in some cases
it appears that the tolls initially raised freight charges, before being offset by the effects of
road improvements and other innovations.
4.1 Are Turnpike Trusts Capturing the Effect of Other Innovations?
The preceding analysis controlled for a number of unobservable factors by including city-pair
dummies, year dummies, and a general time trend. However, there is still a concern that
the turnpike variables are measuring the influence of other innovations. For example, it is
possible that increases in firm-size caused freight charges to fall during the 1750s, and that
this led to greater traffic and eventually the adoption of turnpike trusts. If so, then turnpike
trusts may have been a consequence, rather than a cause of the transport revolution.
23For more information on this estimation procedure see Baltagi and Wu (1999).24The 22.1% figure comes from the calculation, 7.3835-1820×0.0041781.
15

One way to evaluate whether turnpike trusts are confounding these other factors is to
test whether land carriage rates fell during the 5-year period before turnpike trusts were
established.25 To perform this test, a variable was constructed that measures the fraction
of turnpike mileage that will be created within the next five years. For instance, suppose
that a city-pair had a turnpike trust established on half of its route in 1745, and along the
other half in 1755. In this case, the new variable will take the value 0.5 from 1740 to 1744,
0 from 1745 to 1749, 0.5 from 1750 to 1754, and 0 for every year after 1755. Therefore, if
turnpike trusts were induced by other innovations, then land carriage rates should decline
during the years 1740 to 1744 and 1750 to 1754, just before turnpike mileage increased.
Following this approach, Table 3 reports the estimates from three different specifications,
all of which include the variable measuring the fraction of turnpike mileage that will be
created within the next five years. Across all the specifications, the estimates show that
land carriage rates did not fall before trusts were established. For example, in column
(1), the estimates indicate that land carriages were not any lower during the 5-year period
preceding turnpike trusts. In columns (2) and (3), the estimates also indicate that the trend
in land carriage rates did not change just before trusts were established.26 As a result, there
is no direct evidence that turnpike trusts were induced by other innovations that caused
transport costs to fall.
The effect of turnpike trusts can also be measured by changes in the tolls over time.
Early in the 18th Century, it was expected that the tolls would be temporary, and that
once the road was improved they would be eliminated (Albert, 1972; Pawson, 1977). In
practice, the tolls were not eliminated because very few turnpike trusts were dissolved before
the mid-19th century. Nevertheless, the price of accessing roads may still have declined over
time, if the tolls fell in real terms.
The only available information on the changes in tolls comes from the maximum schedules
published in the Acts of Parliament. The maximum schedules were first introduced in the
initial Act establishing the trust and were subsequently updated by renewal Acts, at least
every 21 years. The maximum schedules did not necessarily equal the tolls paid by road-
users because trustees had the option to levy lower tolls. However, trustees were less likely
to levy lower tolls after their initial Act was passed because there was less traffic and the
expenses of the trust were higher. Trustees were also likely to charge the maximum toll
25In other words, we can test whether the adoption of turnpike trusts in any of the years t+1, t+2, t+3,t+ 4, or t+ 5, implied lower land carriage rates for a city-pair at date t.26The results are similar if we measure the changes in rates 10 years before trusts are established.
16

during the early 19th century, when there was substantial price inflation. Therefore, this
study examines the changes in maximum schedules across a sample of 70 Acts between 1730
and 1744, which includes 43 initial Acts and 27 renewal Acts. It also examines another
sample of 58 Acts between 1800 and 1801, which is largely comprised of renewal Acts.27
Among all 70 Acts between 1730 and 1744, the average toll for a wagon drawn by four
horses was 0.91 shillings and among the initial Acts, the average toll was 0.98 shillings. In
the 1800 to 1801 period, the average toll on a wagon drawn by four horses increased to 1.80
shillings. However, the toll on wagons declined in real terms by more than 20% because
the price level increased by around 150% between 1730 to 1744 and 1800 to 1801.28 This
finding is important because it indicates that the burden of the tolls diminished over the
same time period that freight charges were falling. Also, it may suggest that trustees were
willing to set lower tolls by 1800, because they were earning indirect benefits from lower
transport costs.
Additional evidence on the effect of turnpike trusts comes from the seasonal variation in
land carriage rates over the 18th Century. Seasonality is relevant because travelers often
remarked on the poor condition of the roads in winter, when the rains increased. Therefore,
if turnpike trusts lowered freight charges by improving the road, then it should be the case
that winter freight charges declined relative to summer charges.
The effects of seasonality can be measured by the difference between winter and summer
land carriage rates. During the 1730s and 1740s, winter land carriage rates were on average
35% higher than summer land carriages rates; however by the 1750s and 1760s, they were
only 20% higher and by 1800 they were essentially equal to summer rates.29 The decline
in winter versus summer land carriage rates is important because it cannot be explained by
contemporaneous factors, such as improvements in horse breeding and increases in firm size,
because each of these factors should affect freight charges similarly throughout the year. By
contrast, this evidence is consistent with the argument that turnpike trusts lowered freight
charges by improving road quality.
The land carriage rates between Leeds and Selby, in theWest Riding of Yorkshire, provide
27See the appendix for a description of the sources.28The figures on inflation come from Clark (2001a). The difference in average tolls between 1730 to 1744
and 1800 to 1801 is statistically significant (t-statistic, 4.69).29For information on average land carriage rates in winter and summer see table 9 in the appendix. The
relative decline in winter land carriage rates after 1750 is statistically significant within the sample of city-pairs where seasonal rates were set. For example, in a regression of the ratio of winter to summer rates ona set of decade dummy variables, all decade dummies are negative and significant beginning in the 1750s.
17

an excellent example of the effect of turnpike trusts on winter freight charges. Beginning
in the 1690s, the summer rate between Leeds and Selby was 6.5 shillings per four horseback
(896 pounds), while the winter rate was 15.5 shillings. These rates continued until 1744,
when the summer rate was reduced to 6 shillings and the winter rate was reduced to 10.5
shillings. The greater decline in winter rates (32% versus 8%) is significant because it came
shortly after the adoption of the Leeds and Selby Turnpike Trust in 1741. The timing of
these changes is unlikely to be coincidental, because the parishes which preceded the Leeds
and Selby trust did not make any major road investments prior to 1741.30
4.2 Did Trusts Have a Greater Impact in the London Market?
The impact of turnpike trusts on London freight and passenger services deserves special at-
tention because it was the largest and most important transportation market in the British
economy. It is possible that turnpike trusts had a greater impact on the London roads be-
cause trustees could capitalize on greater traffic volumes by financing more road investment,
and by lowering the tolls on individual road-users. Also, turnpike trusts may have had a
greater impact along the London routes, either because Parliament had different regulatory
policies or because there was greater competition between trusts. Finally, London carrier
and passenger firms may have been more likely to adopt new technologies and services that
were complementary with the road improvements of turnpike trusts.
One way of evaluating the effects of turnpike trusts in the London market is to test
whether land carriage rates declined by a greater amount after trusts were established along
the London routes. Table 4 presents estimates from regression equation (2), after including
an interaction between the fraction of turnpike mileage and a dummy variable that equals
1 if London is included in the city-pair. In column (1), the results indicate that London
city-pairs experienced an additional 30.7% reduction in land carriage rates after trusts were
established. While this estimate provides suggestive evidence that turnpike trusts had
a larger impact on the London routes, it probably overstates the effect because it does
not include year dummies and a time trend. However, after these controls are included
(column 2), the estimates still suggest that trusts had a larger effect along the London
routes. In particular, they indicate that London city-pairs with turnpike trusts experienced
an additional reduction in land carriage rates of 9.3% by 1800 and 12.2% by 1820.31
30For more information on the investment behavior of parishes before turnpike trusts see Bogart (2004).31The 9.3% estimate comes from the calculation, 2.5556-1800×(0.0014714) and 12.2% comes from the
18

Besides lowering freight charges, turnpike trusts may have also contributed to greater
travel speeds between London and the provinces. One of the best indicators of increasing
speed is the diffusion of ‘fly-machine’ services. These services were unique because they
traveled continuously at a speed of around 8 miles an hour. According to London directories,
fly-machine services were relatively rare before 1750, and were only available along a handful
of London routes. However, by 1770 they comprised around 20% of all London passenger
services and were available to most major cities.32
The information on fly-machine services is useful because it provides an indicator of
when travel speeds increased between London and most provincial cities. Therefore, we can
evaluate the contribution of turnpike trusts to greater travel speeds by investigating whether
they preceded the adoption of fly-machine services. Table 5 lists all cities where fly-machine
services to London were first identified in the 1770 London directory, as well as the first year
when trusts were established on at least 80% of their route mileage. The table shows that in
64 out of the 71 cities, turnpike trusts preceded the adoption of fly-machines. This evidence
suggests that turnpike trusts were not a consequence of fly-machine services and that they
may have contributed to their adoption.
Last but not least, turnpike trusts made an additional contribution to London trans-
portation services by increasing road capacity. The evidence on service growth in Table 1
shows that road traffic between London and the provinces increased substantially after most
turnpike trusts were established in the 1740s, 1750s, and 1760s. Trusts enabled the growth
in traffic by widening roads and adding more routes to London. As a result, they lessened
the effects of congestion, which might have severely limited the reductions in freight charges
and passenger travel times between 1750 and 1800.
5. The Transportation Revolution and Economic Growth
in England and Wales
Aside from turnpike trusts, the road transport sector experienced a number of innovations,
including developments in wagon and carriage design, changes in the technique of road
calculation, 2.5556-1820×(0.0014714). However, these results are not significant after assuming first orderautocorrelation in the errors (see column (3) of Table 4). Therefore, the hypothesis that turnpike trustshad a larger impact along the London routes is only partially supported by the evidence.32It is important to note that fly-wagon services comprised less than 1% of all freight services in 1770.
They became much more common by 1800, when they made up nearly 6% of all services.
19

building, improvements in horse breeding, and increases in firm-size. The cumulative effect
of all these innovations was a 40% reduction in freight charges, a 7.5% reduction in passenger
fares, and a 60% reduction in passenger travel times. Given the large magnitude of these
effects, it is natural to ask whether they made a significant contribution to economic growth
in England and Wales. The traditional way in which economic historians evaluate the
effects of transport innovations is to calculate their social savings, or the fraction of national
income that would be lost had the transport innovations not been developed (see Fogel 1965;
Fishlow, 1965; O’Brien 1983).
A social savings calculation requires information on ton miles and passenger miles as well
as the change in freight charges, fares, and travel times. In our case, there is reasonably
good information on the changes in transport costs, but no direct information on the total
volume of services. Therefore, to measure the social savings from road transport this study
provides new estimates of total passenger miles and ton miles in 1800 and 1820.33 The new
volume estimates are based on figures for the total cost of freight and passenger services.
According to Theo Barker and Dorian Gerhold (1995), the tolls equaled between 10 and 15%
of total costs for a sample of freight and passenger firms in the 1820s. If these figures are
representative, then total toll revenues divided by either 0.1 or 0.15 would yield an estimate
of the total cost of services. In 1800, total toll revenues in England and Wales were around
£0.76 million, which would imply that the total cost of transport services using turnpike
roads was between £5.09 million and £7.64 million. A similar calculation suggests that the
total cost was between £7.43 million and £1.11 million in 1820.34
The previous estimates only apply to services on turnpike roads where tolls were levied.
Therefore, to estimate the total cost of parish traffic, this study multiplies the total cost
on turnpike roads by the ratio of parish road expenditure to turnpike road expenditure. A
substantial portion of road expenditure in the early 19th Century was devoted to maintenance
(Bogart, 2004). As a result, the relative amount of parish spending should represent a decent
approximation of the relative cost of parish traffic. In 1800, total parish expenditure was
around 53% of total turnpike expenditure, which would imply that the total cost of parish
road services was at least £2.68 million in 1800. By 1820, parish road expenditure increased
and was approximately 70% of turnpike expenditure, which would imply a total cost of at
33R. Dudley Baxter (1866) has provided estimates of passenger miles and ton miles in 1834. However,these figures are too late to properly evaluate the impact of road transport innovations because canals hadclaimed a large portion of freight traffic by 1834.34The figures on turnpike revenues and expenditure come from Bogart (2004).
20

least £5.20 million.
The relative accuracy of the total cost figures can be substantiated by their proportion in
national income or GDP. According to Greg Clark’s estimates, GDP in England and Wales
was £229 million in 1800 and £322 million in 1820 (2001b). If we choose the lower bound
estimate for total costs, this would imply that road transport accounted for approximately
3.4% of GDP in 1800 and 3.9% in 1820. Both of these estimates are reasonable given that
the total cost of canal services was around £4.4 million or 2% of national income in 1800.35
Table 6 summarizes the social savings estimates from all road transport innovations.
Columns (1) to (4) provide the figures for the total cost of road services using the lower
bound estimates in 1800 and 1820. Columns (5) to (7) list the estimates of total ton miles
and passenger miles for turnpike roads and parish roads. The volume estimates are equal to
the total cost of services divided by either the average freight charge per-mile or the average
passenger fare per-mile in each year.36
There are two key assumptions in the volume calculations. First, total costs are assumed
to be equal to the total value of services. This assumption will lead to a downward bias
in ton-miles and passenger-miles because the total value of services includes profits as well
as costs. Second, the volume estimates assume that freight represented half of the value
of all services using turnpike roads and the entire value of services using parish roads. In
the case of parish roads, freight was likely to dominate because most of these roads served
local traffic between farmers and their markets. By contrast, most inter-city freight and
passenger services used the major roadways, which were all managed by turnpike trusts.
Columns (8) to (11) list the social savings estimates for freight and their proportion in
GDP. For 1800, the social savings are based on a 31% reduction in freight charges along
turnpike roads and a 14.2% reduction in freight charges along parish roads. For 1820, the
savings are based on a 43.4% reduction in freight charges on turnpike roads and a 19.9%
reduction along parish roads. All of these figures come from the regression estimates in
Table 2, which identify the trends for city-pairs with and without turnpike trusts.37 The
35According to Hawke and Higgins (1983), the total number of ton miles on canals in 1800 was 442 million,assuming a average lead of 50 miles. If canal rates were half of road freight charges, then the total value ofcanal services would be £4.42 million.36The average freight rate per ton-mile was £0.085 in 1800 and £0.082 in 1820. The average passenger
fare per-mile was taken to be £0.020 in 1800 and £0.0165 in 1820. These figures come from the land carriagerate and passenger fare data sets. See the appendix for more information.37In particular, it is assumed that along turnpike roads freight charges would be £0.124 in 1800 without
the 31% reduction in freight charges between 1750 and 1800. Similarly, they would be £0.145 in 1820without the 43.4% reduction in freight charges between 1750 and 1820.
21

estimates indicate that in the freight sector, road transport innovations generated a social
savings of around 0.7% of GDP in 1800 and 1.3% in 1820.
Columns (12) to (15) summarize the social savings in the passenger sector, which totaled
around 0.5% of GDP in 1800 and 0.8% in 1820. In this case, most of the benefits came from
lower travel times, rather than reductions in fares. The social savings on passenger fares
are based on a 7.5% reduction in fares, while the time savings are based on an increase in
journey miles per hour from 2.6 in 1750 to 6.2 in 1800 and 7.4 by 1820.38 The benefits from
greater speed were assumed to be equal to the total number of hours saved while traveling,
multiplied by the hourly income for white collar workers.39 Laborers were excluded because
most travelers were either landowners or skilled professionals.
Overall, the estimates suggest that road transport innovations generated a social savings
of around £2.6 million or 1.2% of GDP in 1800 and £6.6 million or 2.1% of GDP in 1820.
The rising level of social savings between 1800 and 1820 is consistent with the view that
road transport made an increasing contribution to economic development during the early
stages of the Industrial Revolution. When the effects of road transport are combined with
canals, it is clear that both transport improvements made an even larger contribution to
growth. According to Gary Hawke and Jim Higgins (1983), canals generated a social
savings of around 4.7 million in 1800. This implies that the combined social savings from
canals and road transport was approximately £7.3 million or 3.2% of GDP in 1800. To put
these figures into perspective, Pol Antras and Hans Joachim Voth (2003) estimate that total
factor productivity growth averaged 0.3% per annum in the British economy between 1770
and 1800. This would imply that canals and road transport accounted for roughly a third
of all productivity growth between 1770 and 1800.40
How much did turnpike trusts contribute to the social savings? While it is difficult to
38The 7.5% reduction in passenger fares represents an average of the 11% and 4% reduction in realpassenger fares in 1790-99 and 1800-09 respectively. The social savings calculation assumes that withoutany innovations fares would be £0.022 in 1800 and £0.018 in 1820.39According to the passenger mile estimates, faster speeds implied a savings of 28 million hours in 1800
and 56 million hours in 1820. The nominal annual income for white collar workers was assumed to be£100 in 1800 and £130 in 1820. Peter Lindert and Jeffrey Williamson (1983) show that there is substantialvariation across white collar occupations. Therefore this study uses a figure which is 2/3 of the averageincome across white collar occupations in 1805 and 1819. To arrive at an estimate of the hourly wage, thesefigures were divided by Hans Joachim Voth’s (2001) estimates of the average annual number of hours forprofessionals in 1800.40A T.F.P. growth rate of 0.3% would generate a social savings of 9.4% between 1770 and 1800. Therefore,
roads and canals would account for approximately a third of the social savings from all innovations in theBritish economy.
22

make precise statements about the passenger sector, it is possible to provide some answers
in the case of freight. According to the regression estimates in Table 2, turnpike trusts
lowered freight charges by 16.8% as of 1800 and 23.5% by 1820. This would imply that they
accounted for around 30% of the total social savings in freight for 1800 and 1820. However,
these estimates are likely to understate the effect of turnpike trusts because they do not
incorporate the greater impact of turnpike trusts along the more heavily traveled London
routes. The social savings also understates the effect of turnpike trusts because it does not
account for the impact of additions to road capacity. Without these investments, it is likely
that growing traffic volumes would have led to greater congestion and severely limited the
observed reductions in passenger travel times and freight charges.
More generally, the social savings calculation does not incorporate changes in technology,
organization, and the location of economic activity resulting from lower transport costs.
For example, Rick Szostak (1991) argues that lower road transport costs contributed to
increased regional specialization, greater product standardization, and the rise of factories.
Road transport innovations may have also encouraged greater integration of agricultural
markets as well as changes in farming practice. Therefore, after including these broader
effects, turnpike trusts and all other road transport innovations probably made an even larger
contribution to economic development.
6. Conclusion
The rise of turnpike trusts transformed the organization and financing of road infrastructure
in 18th Century England. In total, nearly 1000 turnpike trusts were established along
20,000 miles of road, resulting in one of the most expansive toll road networks in history.
At the same time, the road transport sector experienced a number of revolutionary changes,
including a 40% reduction in freight charges and a 60% reduction in passenger travel times.
This study examines the relationship between turnpike trusts and the transportation
revolution using a number of new data sets. The analysis shows that turnpike trusts
did not raise freight charges by levying tolls, and that trusts were not induced by other
innovations that lowered transport costs. Instead, the evidence suggests that turnpike
trusts contributed to approximately half of the 40% reduction in freight charges during this
period. In addition, this study provides evidence that turnpike trusts had their greatest
impact on London transport services, which were the largest and most important in the
23

British economy. Finally, this study provides evidence that all road transport innovations
contributed to a social savings of more than 1% of national income in 1800 and 1820.
This study also has a number of implications for the debate over the relative importance
of organizational and technological changes in the transportation revolution. The key con-
clusion is that turnpike trusts represent an important example of an organizational change
that contributed to lower transport costs and improvements in the quality of services. How-
ever, it is also important to recognize that turnpike trusts had a greater impact because of
other organizational and technological changes. For example, turnpike trusts were more ef-
fective because carriage and passenger firms increased their scale and efficiency. In addition,
turnpike trusts benefited from improvements in horse breeding and the development of new
road construction techniques during the early 19th Century.
The turnpike trust system also illustrates how institutional changes were linked with
the process of economic development during the 18th and 19th Centuries. Ever since the
work of Douglass North (1991), economic historians have debated whether institutions cause
economic development or whether they are simply a consequence of it. The turnpike trust
system represents one of the best of examples of an institution that was both a cause and
a consequence of growth. Turnpike trusts clearly responded to the expanding economy
by satisfying existing or potential demand for road transport services. However, they also
created demand for such services by lowering freight charges and travel times. As a result,
they made an independent contribution to the process of development.
Appendix: Data Sources
Information on land carriage rates are drawn from Quarter Session Order Books and the
Returns Submitted to the Clerks of the Peace in Middlesex. The Returns are held at the
LondonMetropolitan Archives (MR/WC/1-970). Quarter Sessions Order Books are available
on microfilm in the Family History Library in Salt Lake City. The references are York
(#2045901-5, #2045938-9), West Riding of Yorkshire (#1657872-4, #1657913-5), North
Riding of Yorkshire (#469697—99, #547724-27), Newcastle (#1886204-05), Hull (#1894997-
98), Leicestershire (#1470041-42), and Cheshire (# 1502213-28). Additional information
was drawn from the Order Books in the Northamptonshire and Shropshire Record offices
as well as Michael Freeman (1977) and William Albert (1972). Table 7 lists all city-pairs.
Table 8 lists average land carriage in shillings per ton-mile, along with the standard deviation
24

and the number of unique observations. I averaged over unique observations in order to
avoid biases from city-pairs with more observations. Finally, Table 9 lists the average ratio
of winter and summer land carriage rates across city-pairs that set seasonal rates.
For the regressions, the wage data come from Greg Clark’s farm laborer wage series
(2001). Horse feed prices come from Quarter sessions records for Hull and from secondary
sources, such as Thirsk (1985), Hill (1966), and Rogers (1963). Feed prices are assumed to
be equal to an average of oat prices and bean prices. The general procedure was to match
city-pairs with wage and feed prices from one of four regions: the Southeast, the Southwest,
the Midlands, and the North. All city-pairs that included London were matched with the
input price series from the Southeast, regardless of the final destination.
The information on average passenger travel times and fares comes from Jackman (1916),
Pawson (1977), and Gerhold (1996). Additional information on fares comes from the 1760
and 1770 London travel directory, A New and Complete Guide to all persons who have any
trade or Concern with the City of London. Tables 10 and 11 provide summary statistics.
The information on freight and passenger services comes from a series of London direc-
tories including, The Merchant and Trader’s Necessary Companion (1715), The New and
Complete Guide (1740, 1749, 1760, 1770, 1783), and The Shopkeeper’s and Tradesman’s As-
sistant (1779, 1790, and 1800). All of these directories are available in the microfilm series,
the Eighteenth Century.
The information on toll schedules comes from the series, Acts of Parliament and Local
and Personal Acts. Acts of Parliament are available in the Clark Library in Los Angeles
and Local and Personal Acts are available in the University of Minnesota, Law Library.
References
[1] Albert, William (1972). The Turnpike Road System in England 1663-1840. Cambridge:Cambridge University Press.
[2] Antras, Pol and Hans-Joachim Voth (2003). Factor Prices and Productivity GrowthDuring the British Industrial Revolution. Explorations in Economic History 38.
[3] Bagwell, P.S. (1974). The Transport Revolution from 1770 : London: Batsford.
[4] Baltagi, Badi and Ping Wu (1999). Unequally Spaced Panel Data Regressions withAR(1) Disturbances. Econometric Theory 15: 814-823.
25

[5] Barker, Theo and Dorian Gerhold (1995). The Rise and Rise of Road Transport 1700-1990. Cambridge: Cambridge University Press.
[6] Baxter, R. Dudley (1866). Railway Extension and its Results. Journal of the StatisticalSociety of London. 29:549-595.
[7] Bogart, Dan (2004). Did Turnpike Trusts Increase Transportation Investment in Eigh-teenth Century England? Working Paper, Department of Economics, UC Irvine.
[8] Bowen Emanuel (1970). Britannia Depicta. Newcastle: Frank Graham.
[9] Chartres, John (1977). Road Carrying in England in Seventeenth Century: Myth andReality. Economic History Review. 15:73-94.
[10] Chartres, John and Turnbull, Gerard (1983). Road Transport. In Aldcroft, Derekand Freeman, Michael (eds). Transport in the Industrial Revolution. Manchester:Manchester University Press.
[11] Clark, Greg (2001a). Farm Wages and Living Standards in the Industrial Revolution:England, 1670-1869. Economic History Review. 3:477-505.
[12] Clark, Greg (2001b). Debt, Deficits, and Crowding-Out: England, 1727-1840. EuropeanReview of Economic History 5: 403-436.
[13] Corfield, Penelope (1982). The Impact of English Towns, 1700-1800. Oxford: OxfordUniversity Press.
[14] Defoe, Daniel (1726). A Tour Through the Whole Island of Great Britain.
[15] Estevadeordal, Antoni, Frantz, Brian, and Taylor, Alan M (2003). The Rise and Fall ofWorld Trade, 1870-1939. The Quarterly Journal of Economics 118:359-407.
[16] Fishlow, Albert (1965). American Railroads and the Transformation of the Ante-BellumEconomy. Cambridge: Harvard University Press.
[17] Fogel, Robert (1964). Railroads and American Economic Growth: Essays in Economet-ric History. Baltimore: John Hopkins University Press.
[18] Freeman, Michael J. (1977). The Carrier System of South Hampshire, 1775-1851. TheJournal of Transport History 4:61-85.
[19] Gerhold, Dorian (1988). The Growth of the London Carrying Trade, 1681-1838. Eco-nomic History Review 41: 392-410.
[20] Gerhold, Dorian (1993). Road Transport Before the Railways: Russell’s London FlyingWaggons. Cambridge: Cambridge University Press.
26

[21] Gerhold, Dorian (1996). Productivity Change in Road Transport before and afterTurnpiking, 1690-1840. Economic History Review 49:491-515.
[22] Great Britain, House of Commons (1841). Report of the Commisioners for inquiry intothe state of the Roads in England and Wales, Sessional Papers, Vol XXVII.
[23] Harley, Knick (1988). Ocean Freight Rates and Productivity, 1740-1913: the Primacyof Mechanical Invention Reaffirmed. Journal of Economic History 42: 797-823.
[24] Hawke, Gary and Jim Higgins (1983). Britain, in O’Brien, Patrick (ed.) Railways andthe Economic Development of Western Europe, 1830-1914. London: St. Anthony’s.
[25] Hill, Francis (1966). Georgian Lincoln. Cambridge: Cambridge University Press.
[26] Humphery-Smith (1984). The Phillimore Atlas and Index of Parish Registers. Chich-ester: Phillimore.
[27] Jackman, W. T. (1916). The Development of Transportation in Modern England. Cam-bridge: Cambridge University Press.
[28] Kaukiainen, Yrjo (2001). Shrinking the World: Improvements in the Speed of Informa-tion Transmission. European Review of Economic History 5: 1-29.
[29] Linder, Peter and Jeffrey Williamson (1983). English Workers Living Standards Duringthe Industrial Revolution: A New Look. The Economic History Review 36: 1983.
[30] Menard, Russell (1991). Transport Costs and Long-Range Trade: Was there a EuropeanTransport Revolution in the Early Modern Era? in Tracy, James D. (ed. ) The PoliticalEconomy of Merchant Empires. Cambridge: Cambridge University Press.
[31] Mogg, Edward (1826). Paterson’s Roads. London A. & R. Spottiswoode.
[32] Mohammed, Saif I. Shah and JeffreyWilliamson (2004). Freight Rates and ProductivityGains in British Tramp Shipping 1869-1950. Explorations in Economic History 41:172-203.
[33] North, Douglass (1968). Sources of Productivity Change in Ocean Shipping, 1600-1850.Journal of Political Economy 76: 953-970.
[34] North, Douglass (1991). Institutions, Institutional Change, and Economic Performance.Cambridge: Cambridge University Press.
[35] O’Brien, Patrick (1983). Railways and the Economic Development of Western Europe,1830-1914. London: St. Anthony’s.
[36] O’Rourke, Kevin and Williamson, Jeff (1999). Globalization and History. Cambridge:M.I.T. Press.
27

[37] Pawson, Eric (1977). Transport and Economy: The Turnpike Roads of Eighteenth Cen-tury Britain. New York: Academic Press.
[38] Rogers, James Thorold. (1963). A History of Agriculture and Prices in England.Oxford: Clarendon Press.
[39] Shepherd, James and Gary Walton. (1972). Shipping, Maritime Trade, and the Eco-nomic Development of Colonial North America. Cambridge: Cambridge UniversityPress.
[40] Smith, Adam (1976). An Inquiry Into the Nature and Causes of the Wealth of Nations.Indianapolis: Liberty Classics
[41] Stratton, Ezra (1972). The World on Wheels. New York: Benjamin Blom.
[42] Straus, Ralph (1912). Carriages and Coaches, Their History and their Evolution. Lon-don: Martin Secker.
[43] Szostak, Rick (1991). The Role of Transportation in the Industrial Revolution. Mon-treal: McGill.
[44] Thirsk, Joan (1985). The Agrarian History of England And Wales, Vol 6. London:Cambridge University Press.
[45] Turnbull, Gerard (1977). Provincial Road Carrying in England in the Eighteenth Cen-tury. Journal of Transportation History. 4:17-39
[46] Turnbull, Gerard (1985). State Regulation in the Eighteenth Century English Economy:Another look at Carriers’ Rates. Journal of Transport History 6: 18-36.
[47] Ville, Simon (1990). Transport and the Development of the European Economy, 1750-1918. New York: St. Martin’s Press.
[48] Voth, Hans-Joachim, (2001). The Longest Years: New Estimates of Labor Input inBritain, 1760-1830. Journal of Economic History 61.
[49] Willan, T. S. (1962). The Justices of the Peace and the Rates of Land Carriage, 1692-1827. Journal of Transport History 5:197-204.
28

Tables
Table 1: The Growth of Passenger and Freight Services Leaving from London, 1715-1800
Year
(1) Number of Listed Weekly Freight Services, All Cities
(2) Number of Listed Weekly Passenger Services, All Cities
(3) Number of Listed Weekly Freight Services, Major Cities
(4) Number of Listed Weekly Passenger Services, Major Cities
1715
840
620
140
150
1740
1570
780
220
110
1749
1610
760
230
140
1760
1950
940
340
210
1770
2960
1960
390
410
1779
3100
3190
340
820
1783
3360
3820
370
860
1790
4590
8010
520
1590
1800
7790
12,210
970
1960
1715-1800 1760-1800
Average Annual Growth Rate 2.7% 3.5%
Average Annual Growth Rate 3.6% 6.6%
Average Annual Growth Rate 2.3% 2.7%
Average Annual Growth Rate 3.1% 5.7%
Sources: The figures for 1715 come from the Merchant and Traders Necessary Companion. The figures for 1740, 1749, 1760, 1770, and 1783 come from the New and Complete Guide to all Persons who have any Trade or Concern with the City of London. Lastly, the figures for 1779, 1790, and 1800 come from the Shopkeepers and Tradesman’s Assistant. Notes: Figures are rounded to the nearest ten and all years exclude services to cities in Middlesex County. Major cities are defined as cities with a population greater than 2500 in 1700, see Corfield (1982).

Table 2: The Effect of Turnpike trusts on Land Carriage Rates: Baseline Specifications
(1) (2) (3) Variable
Coefficient (Standard Error)
Coefficient (Standard Error)
Coefficient (Standard Error)
Fraction Turnpike
-0.500 (0.125)*
5.9131 (0.7710)*
7.3835 (1.3354)*
(Fraction Turnpike)*(year)
-0.0033784 (0.0004)*
-0.0041781 (.0007)*
Year
-0.0028437 (0.0009)*
ln(real wage)
0.557 (0.021)*
0.1943 (0.0374)*
0.4862 (0.0241)*
ln(real feed price)
-0.269 (0.024)*
0.0609 (0.0400)
0.1198 (0.0140)*
Constant
1.198 (0.082)*
5.7925 (1.6202)*
-0.0142 (0.0026)*
City-pair dummies
Yes
Yes
Yes
Year dummies No Yes Yes AR(1) disturbances No No Yes Baltagi-Wu LBI statistic R2
0.319
0.801
0.822 0.786
City-Pairs 130 130 120 Total observations 5071 5071 4941 Notes: Dependent variable is the natural log of the real land carriage rate for city-pair i in year t. * indicates statistical significance at the 95% level.

Table 3: Did Land Carriage Rates Fall before Turnpike Trusts Were Adopted?
(1) (2) (3) Variable
Coefficient (Standard Error)
Coefficient (Standard Error)
Coefficient (Standard Error)
Fraction Turnpike
-0.4896 (0.0142)*
5.8779 (0.7761)*
7.408616 (1.3354)*
Fraction Turnpike within the next 5 years
0.0407 (0.0276)
(Fraction Turnpike)*(year)
-0.0033564 (0.0004)*
-0.0041802 (.00076)*
(Fraction Turnpike within the next 5 years)*(year)
0.0000042 (0.00001)
0.0000128 (0.0000088)
Year
-0.002876 (0.0009)*
ln(real wage)
0.5521 (0.0210)*
0.1935 (0.0374)*
0.4822 (0.0243)*
ln(real feed price)
-0.2724 (0.0238)*
0.0605 (0.0400)
0.1191 (0.0140)*
Constant
1.2093 (0.0823)*
5.8497 (1.6268)*
-0.0148 (0.0027)*
City-pair dummies
Yes
Yes
Yes
Year dummies No Yes Yes AR(1) disturbances No No Yes Baltagi-Wu LBI statistic R2
0.319
0.801
0.822 0.786
City-Pairs 130 130 120 Total observations 5071 5071 4941 Notes: Dependent variable is the natural log of the real land carriage rate for city-pair i in year t. * indicates statistical significance at the 95% level.

Table 4: Did Turnpike Trusts Have a Larger Effect along the Roads Leading into London?
(1) (2) (3) Variable
Coefficient (Standard Error)
Coefficient (Standard Error)
Coefficient (Standard Error)
Fraction Turnpike
-0.4579 (0.0133)*
4.4440 (0.0793)*
6.5232 (1.3865)*
(Fraction Turnpike)*London dummy
-0.3076 (0.0276)*
2.5556 (0.4324)*
2.1804 (1.3757)
(Fraction Turnpike)*(year)
-0.0025512 (0.0004)*
-0.0037085 (.00078)*
(Fraction Turnpike)*(London dummy)*(year)
-0.0014714 (0.0002)*
-0.0010766 (0.000781)
Year
-0.0017917 (0.0009)*
ln(real wage)
0.5521 (0.0210)*
0.0873 (0.0400)*
0.4587 (0.0243)*
ln(real feed price)
-0.2582 (0.0235)*
0.0575 (0.0398)
0.1182 (0.0139)*
Constant
1.2227 (0.0814)*
4.19079 (1.6291)*
0.0341 (0.0027)*
City-pair dummies
Yes
Yes
Yes
Year dummies No Yes Yes AR(1) disturbances No No Yes Baltagi-Wu LBI statistic R2
0.329
0.812
0.814 0.789
City-Pairs 130 130 120 Total observations 5071 5071 4941 Notes: Dependent variable is the natural log of the real land carriage rate for city-pair i in year t. * indicates statistical significance at the 95% level.

Table 5: Turnpike Trusts and the Diffusion of Fly-Machine Services
Cities with fly-machine Services to London beginning in 1770
First year when trusts were established on at least 80% of the route mileage
Cities with fly-machine Services to London beginning in 1770
First year when trusts were established on at least 80% of the route mileage
Maidenhead
1727
Peterborough
1754
Oakingham 1759 Newport Pagnell 1728 Reading 1736 Nottingham 1738 Windsor 1759 Oxford 1719 Sunninghill 1759 Burford 1751 Swaffam 1725 Ipswich 1785 Chester 1744 Falkenham 1785 Stockport 1738 Shrewsbury 1748 Blandford 1766 Ludlow 1751 Derby 1738 Bath 1727 Buxton 1738 Taunton 1753 Chelmsford 1725 Wells 1753 Harlow 1725 Wolverhampton 1727 Stifford 1808 Walsall 1766 Cheltenham 1751 Brighton 1770 Tewkesbury 1756 Chichester 1749 Portsmouth 1749 Horsham 1756 Southampton 1758 Epsom 1755 Winchester 1762 Godalming 1757 Romsey 1764 Guildford 1749 Ware 1725 Kingston 1718 Deal 1802 Weybridge 1767 Maidstone 1752 Witney 1751 Margate 1802 Birmingham 1724 Sittingbourne 1738 Marlborough 1728 Asfhord 1793 Salisbury 1753 Manchester 1738 Trowbridge 1728 Warrington 1753 Devizes 1728 Lincoln 1756 Hull 1765 Sleaford 1756 Leeds 1739 Stamford 1749 Wakefield 1739 Barton Humber 1765 Sheffield 1765 Bourne 1756 Tadcaster 1739 Norwich 1769 Chestnut 1725 Yarmouth 1769 Worcester 1731 Northampton 1728 Total Number of Cities
71
Number of Cites Where Turnpike Trusts Preceded Fly Machine Services
64
Source: Information on fly-machine services comes from the London Directory, The New and Complete Guide.

Table 6: Social Savings Estimates from all Road Transport Innovations: 1800 and 1820
Year
(1) Total Cost of Road Services, Turnpike Roads
(2) Total Cost of Road Services, Parish Roads
(3) Total Cost of Road Services, All Roads
(4) Total Cost of Road Services as % of GDP
1800
£5,093,000
£2,680,000
£7,773,000
3.4%
1820 £7,427,000 £5,199,000 £12,625,000 3.9%
(5) Number of Ton miles, Turnpike Roads
(6) Number of Ton miles, Parish Roads
(7) Number of Passenger Miles, Turnpike Roads
1800
29,786,000
31,345,000
126,385,000
1800 45,285,000 63,398,000 225,051,000
(8) Social savings on Freight, turnpike Roads
(9) % of G.D.P.
(10) Social Savings on Freight, Parish Roads
(11) % of GDP
1800
£1,143,000
0.5%
£445,000
0.2%
1820 £2,848,000 0.9% £1,289000 0.4%
(12) Social Savings on Passenger fares, Turnpike Roads
(13) % of G.D.P.
(14) Social Savings on Passenger Travel Times, Turnpike Roads
(15) % of GDP
1800
£206,000
0.1%
£844,000
0.4%
182 £301,000 0.1% £2,169,000 0.7%
(16) Total Social Savings, All Roads
(17) % of G.D.P.
1800 1820
£2,638,000 £6,607,000
1.2% 2.1%
Notes: For details on the calculations see the text. The G.D.P. figures come from Clark (2001b).

Table 7: The Land Carriage Rate Data Set
City One
City Two
First Year
Last Year
City One
City Two
First Year
Last Year
Askrigg York 1719 1825 Manchester Newcastle 1800 1821 Beverley York 1697 1825 Berwick Newcastle 1802 1821 Barnsley York 1814 1825 Alnwick Newcastle 1802 1821 Bradford York 1697 1825 Morpeth Newcastle 1802 1821 Bedale York 1697 1825 Durham Newcastle 1802 1821 Bridlington York 1730 1825 Darlington Newcastle 1802 1821 Carlisle York 1814 1815 Barnard Newcastle 1821 1821 Coln York 1757 1825 London Richmond 1695 1820 Driffield York 1814 1825 London Leeds 1695 1821 Durham York 1719 1825 London Boroughbridge 1695 1820 Doncaster York 1719 1825 London Settle 1731 1805 Darlington York 1810 1825 York Wakefield 1695 1820 Easingwold York 1814 1825 Newcastle Pontefract 1763 1820 Gainsbrough York 1757 1825 Sheffield Wakefield 1763 1820 Halifax York 1697 1825 Skipton Leeds 1773 1820 Hull York 1697 1825 Skipton Tadcaster 1773 1820 Huddersfield York 1757 1825 Leeds Sheffield 1773 1820 Howden York 1757 1825 Sheffield Pontefract 1773 1820 Helmsley York 1757 1825 Leeds Selby 1695 1799 Kendal York 1757 1825 Selby Leeds 1695 1799 Keighley York 1814 1825 Wakefield Tunbridge 1695 1799 Knaresborough York 1757 1825 Tunbridge Wakefield 1695 1799 Lancaster York 1814 1825 York Hull 1707 1795 London York 1697 1825 Scarborough Hull 1717 1795 Leeds York 1697 1825 Leeds Hull 1725 1795 Middleham York 1697 1825 Wakefield Hull 1725 1795 Masham York 1757 1825 London Hull 1749 1795 Nottingham York 1765 1825 Lincoln Hull 1749 1795 Newcastle York 1705 1825 Beverley Hull 1795 1795 North Allerton York 1810 1825 Brigg Hull 1795 1795 Otley York 1757 1825 Bridlington Hull 1795 1795 Pontefract York 1785 1825 North Cave Hull 1795 1795 Pocklington York 1814 1825 Hedon Hull 1795 1795 Pickerington York 1814 1825 Hornsea Hull 1795 1795 Rochdale York 1814 1825 Louth Hull 1795 1795 Rotherham York 1815 1825 Patrington Hull 1795 1795 Ripon York 1697 1825 Weighton Hull 1795 1795 Richmond York 1697 1825 Welton Hull 1795 1795 Snaith York 1814 1825 London Boston 1749 1780 Selby York 1815 1825 London Horncastle 1752 1823 Sheffield York 1787 1825 London Lincoln 1764 1825 Stockton York 1814 1825 London Louth 1751 1827 Skipton York 1697 1825 London Spalding 1749 1826 Scarborough York 1719 1825 Boston Spilsby 1752 1821 Stamford York 1795 1813 Barton Lincoln 1765 1821 Stokesley York 1757 1825 Horncastle Spilsby 1795 1821 Tadcaster York 1814 1825 Boston Alford 1751 1821 Thorne York 1814 1825 Horncastle Alford 1795 1821 Thirsk York 1757 1825 Boston Louth 1763 1821 Wakefield York 1697 1825 Lincoln Horncastle 1752 1821 Weighton York 1803 1825 Chester London 1695 1814 Wetherby York 1814 1825 Shrewsbury London 1695 1794 Whitby York 1719 1825 Leicester London 1695 1824 Yarm York 1719 1825 Harborough London 1695 1824 London Newcastle 1744 1826 Lutterworth London 1695 1824 Doncaster Newcastle 1766 1821 Hinckley London 1695 1824 York Newcastle 1755 1821 Ashby London 1695 1824 Pontefract Newcastle 1768 1821 Melton London 1695 1824 Leeds Newcastle 1758 1821 Northampton London 1710 1781 Ripon Newcastle 1774 1821 Wellingborough London 1754 1781 Hexham Newcastle 1772 1821 Daventry London 1754 1781 Carlisle Dorchester
Newcastle London
1772 1750
1821 1786
Tiverton Bridgport Portsmouth
London London London
1758 1758 1718
1782 1786 1786
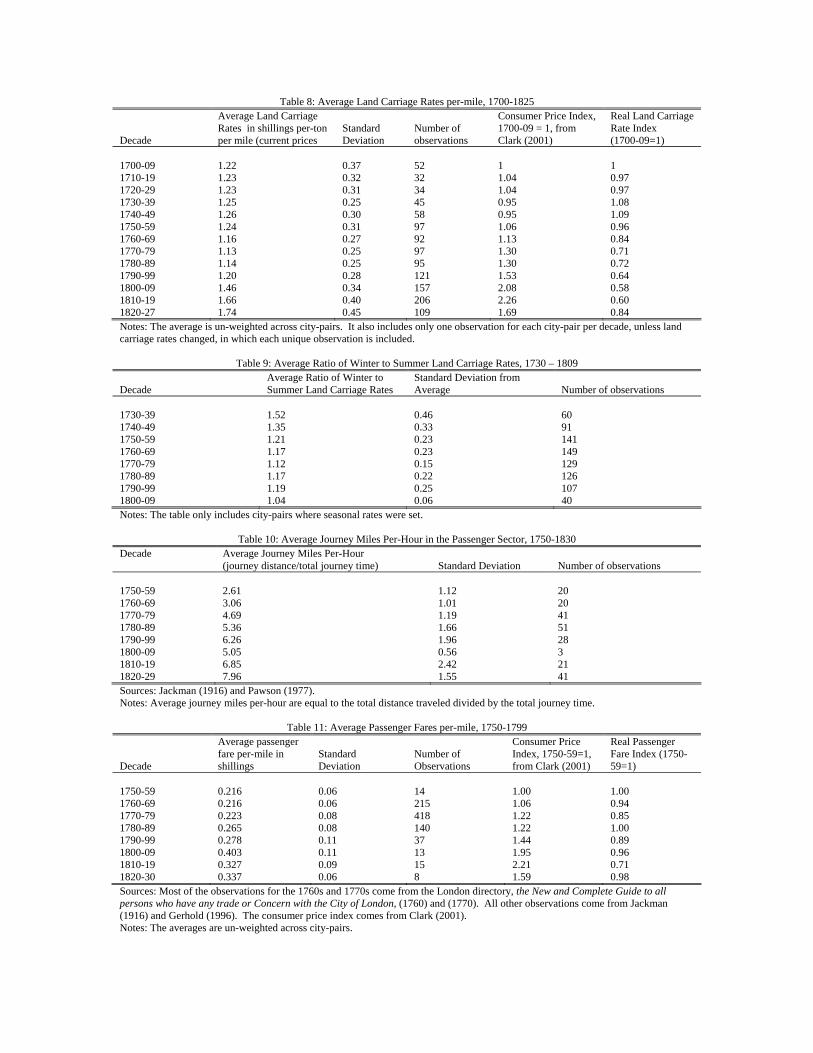
Table 8: Average Land Carriage Rates per-mile, 1700-1825 Decade
Average Land Carriage Rates in shillings per-ton per mile (current prices
Standard Deviation
Number of observations
Consumer Price Index, 1700-09 = 1, from Clark (2001)
Real Land Carriage Rate Index (1700-09=1)
1700-09 1.22 0.37 52 1 1 1710-19 1.23 0.32 32 1.04 0.97 1720-29 1.23 0.31 34 1.04 0.97 1730-39 1.25 0.25 45 0.95 1.08 1740-49 1.26 0.30 58 0.95 1.09 1750-59 1.24 0.31 97 1.06 0.96 1760-69 1.16 0.27 92 1.13 0.84 1770-79 1.13 0.25 97 1.30 0.71 1780-89 1.14 0.25 95 1.30 0.72 1790-99 1.20 0.28 121 1.53 0.64 1800-09 1.46 0.34 157 2.08 0.58 1810-19 1.66 0.40 206 2.26 0.60 1820-27 1.74 0.45 109 1.69 0.84 Notes: The average is un-weighted across city-pairs. It also includes only one observation for each city-pair per decade, unless land carriage rates changed, in which each unique observation is included.
Table 9: Average Ratio of Winter to Summer Land Carriage Rates, 1730 – 1809
Decade
Average Ratio of Winter to Summer Land Carriage Rates
Standard Deviation from Average
Number of observations
1730-39 1.52 0.46 60 1740-49 1.35 0.33 91 1750-59 1.21 0.23 141 1760-69 1.17 0.23 149 1770-79 1.12 0.15 129 1780-89 1.17 0.22 126 1790-99 1.19 0.25 107 1800-09 1.04 0.06 40 Notes: The table only includes city-pairs where seasonal rates were set.
Table 10: Average Journey Miles Per-Hour in the Passenger Sector, 1750-1830 Decade Average Journey Miles Per-Hour
(journey distance/total journey time) Standard Deviation
Number of observations
1750-59 2.61 1.12 20 1760-69 3.06 1.01 20 1770-79 4.69 1.19 41 1780-89 5.36 1.66 51 1790-99 6.26 1.96 28 1800-09 5.05 0.56 3 1810-19 6.85 2.42 21 1820-29 7.96 1.55 41 Sources: Jackman (1916) and Pawson (1977). Notes: Average journey miles per-hour are equal to the total distance traveled divided by the total journey time.
Table 11: Average Passenger Fares per-mile, 1750-1799 Decade
Average passenger fare per-mile in shillings
Standard Deviation
Number of Observations
Consumer Price Index, 1750-59=1, from Clark (2001)
Real Passenger Fare Index (1750-59=1)
1750-59
0.216
0.06
14
1.00
1.00
1760-69 0.216 0.06 215 1.06 0.94 1770-79 0.223 0.08 418 1.22 0.85 1780-89 0.265 0.08 140 1.22 1.00 1790-99 0.278 0.11 37 1.44 0.89 1800-09 0.403 0.11 13 1.95 0.96 1810-19 0.327 0.09 15 2.21 0.71 1820-30 0.337 0.06 8 1.59 0.98 Sources: Most of the observations for the 1760s and 1770s come from the London directory, the New and Complete Guide to all persons who have any trade or Concern with the City of London, (1760) and (1770). All other observations come from Jackman (1916) and Gerhold (1996). The consumer price index comes from Clark (2001). Notes: The averages are un-weighted across city-pairs.

Figure 1: The Diffusion of Turnpike Trusts in England and Wales, 1700-1840
0
100
200
300
400
500
600
700
800
900
1000
1700
1710
1720
1730
1740
1750
1760
1770
1780
1790
1800
1810
1820
1830
1840
Year
Num
ber o
f Tru
sts
0
5000
10000
15000
20000
25000
Num
ber o
f Mile
s
cumulative trusts cumulative mileage Sources: Albert (1972) and Pawson (1977).
Figure 2: Average Journey Miles Per-Hour, 1750-1829
0
1
2
3
4
5
6
7
8
9
1750-59 1760-69 1770-79 1780-89 1790-99 1800-09 1810-19 1820-29
Ave
rage
Jou
rney
Mile
s Pe
r Hou
r
Sources: Jackman (1916) and Pawson (1977). Notes: Average journey miles per-hour is equal to the total journey distance in miles divided by the total journey time.

Figure 3: An Index of Real Passenger Fares, 1750-1830
0
0.2
0.4
0.6
0.8
1
1.2
1750-59 1760-69 1770-79 1780-89 1790-99 1800-09 1810-19 1820-30
Inde
x of
Rea
l Pas
seng
er F
ares
(175
0-60
= 1
)
Sources: see the appendix.
Figure 4: An Index of Real Freight Charges, 1700-1819
0
0.2
0.4
0.6
0.8
1
1.2
1700-09
1710-19
1720-29
1730-39
1740-49
1750-59
1760-69
1770-79
1780-89
1790-99
1800-09
1810-19
real
frei
ght c
harg
e in
dex
(170
0-09
=1)
Land Carriage Rates Gerhold, London to Leeds Source: For details on Land Carriage Rate data see the appendix. The London to Leeds index comes from Gerhold (1996).

Figure 5: Turnpike Trusts and the Evolution of Land Carriage Rates Between 1700 and 1766: Some Examples
0
0.02
0.04
0.06
0.08
0.1
0.12
0.14
0 0.2 0.4 0.6 0.8 1
Fraction Of Turnpike Mileage
Land
Car
riage
Rat
es P
er S
tone
Per
Mile
(in
Penc
e)
leeds-london york-london newcastle-london richmond-london Sources: see text.