trust board paper f - library.leicestershospitals.nhs.uk we... · trust board paper f th title: ......
TRANSCRIPT

Trust Board paper F
Title:
Emergency Care Transformation
Co-Author/Responsible Director: S.Hinchliffe, Chief Operating Officer/Chief Nurse Purpose of the Report: To provide members with a summary of May performance and summary of progress over recent weeks. The Report is provided to the Board for:
Trust Board From: Suzanne Hinchliffe Date: 7th July 2011 CQC regulation All
Summary / Key Points:
UHL Type 1 & 2 performance against the 4 hour target for the month of May 2011 is 92.1% and including UCC is 93.7% - a slow but improving performance.
Attendance levels (ED and UCC) are similar to last years attendances Further guidance in relation to performance management of the NHS A&E
services using the clinical quality indicators was published by the Department of Health (DoH) on the 23rd June 2011.
Interviews and 3 appointments have been made for Consultant Acute Physicians
Ambulatory care - pathways have been developed and implemented in Pleural Effusion, Pulmonary Embolism and Abdominal Pain with further pathways in Headaches and Chest Pain developed awaiting commencement.
There were 48 ‘re-beds’ for May. A task and finish group has completed the first stage of its work in
identifying a footprint for the department to accommodate both activity levels and revised patient pathways.
Recommendations: Members to note and receive the report Considered at another corporate UHL Committee ? Verbal discussion Finance and Performance Committee 29 June 2011 Strategic Risk Register Yes Performance KPIs year to date
CQC/MONITOR Resource Implications (eg Financial, HR) Under review as part of workforce plans and transformation funds Assurance Implications N/A Patient and Public Involvement (PPI) Implications N/A Equality Impact N/A Information exempt from Disclosure N/A Requirement for further review? Monthly review
Decision Discussion √
Assurance √ Endorsement

UNIVERSITY HOSPITALS OF LEICESTER NHS TRUST REPORT TO: TRUST BOARD DATE: 7th July 2011 REPORT BY: SUZANNE HINCHLIFFE, CHIEF OPERATING OFFICER/CHIEF
NURSE SUBJECT: EMERGENCY CARE TRANSFORMATION 1.0 Introduction The following report offers an overview of activity for May 2011 together with a summary of progress over recent weeks. The following charts provide an overview of the total attendances to ED and Eye Casualty which continue to rise, and, the overall activity post deflection.
EMERGENCY DEPARTMENT, EYE CASUALTY and CCU
2008/2009 2009/2010 2010/2011
% Change 10/11 vs
09/10 2011/2012
% Change 11/12 vs
10/11Apr 12,825 13,301 14,117 6.1% 13,507 -4.3%May 13,771 13,901 14,574 4.8% 13,871 -4.8%Jun 13,587 14,148 13,509 -4.5%Jul 13,224 13,172 12,983 -1.4%Aug 13,172 12,916 12,544 -2.9%Sep 12,893 13,151 12,726 -3.2%Oct 13,004 14,086 12,918 -8.3%Nov 13,027 13,421 13,057 -2.7%Dec 12,418 13,199 13,500 2.3%Jan 11,977 12,940 12,830 -0.9%Feb 11,535 11,913 12,263 2.9%Mar 14,608 14,253 14,100 -1.1%
Sum: 156,041 160,401 159,121 -0.8% 27,378
ED and Eye Casualty
10,000
11,000
12,000
13,000
14,000
15,000
16,000
Apr
May Jun
Jul
Aug
Sep Oct
Nov
Dec Jan
Feb
Mar
2009/20102010/20112011/20122010/11 ED and UCC2011/12 ED and UCC
UHL Type 1 & 2 performance against the 4 hour target for the month of May 2011 is 92.1% and including UCC is 93.7% - a slow but improving performance. During June Type 1 & 2 performance improved to 94.7% and including UCC was 95.8%. As can be seen below, there remains fluctuation of performance and sustainability will only be gained where all actions across the LLR are collaboratively delivered.
Weekly ED 4 Hour Performa
94.1%
92.9%
93.6%
90.0%
91.7%
95.4%
92.8%
90.0%
88.0%88.6%
91.7%
93.3%
94.9% 94.8%95.3%
96.3%
90.8%91.2%
92.1%
86%
88%
90%
92%
94%
96%
98%
03/0
4/20
11 (S
un)
10/0
4/20
11 (S
un)
17/0
4/20
11 (S
un)
24/0
4/20
11 (S
un)
01/0
5/20
11 (S
un)
08/0
5/20
11 (S
un)
15/0
5/20
11 (S
un)
22/0
5/20
11 (S
un)
29/0
5/20
11 (S
un)
05/0
6/20
11 (
Sun)
12/0
6/20
11 (
Sun)
19/0
6/20
11 (
Sun)
26/0
6/20
11 (
Sun)
nce
93.7%
96.2%
94.9%
96.0%
96.9%
95.0%94.4%
UHLUHL +UCCTargetUHL 'Best Fit' Curve
1

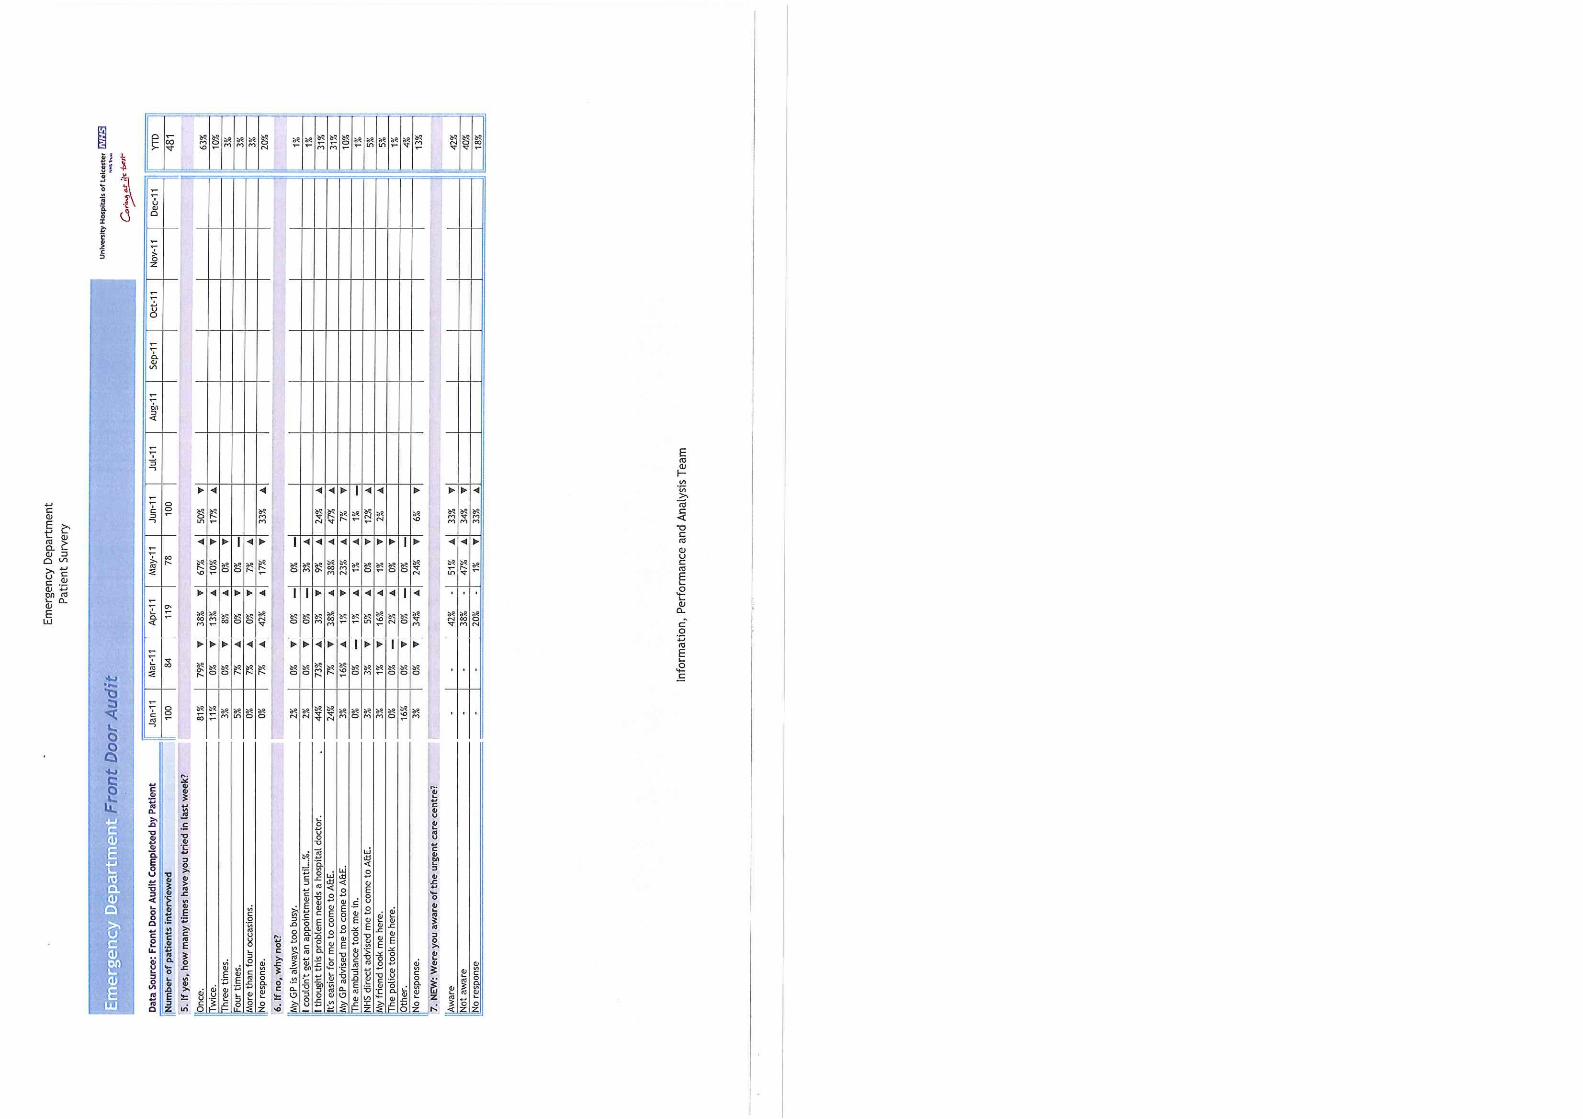
2.0 Arrival Times The following graph below shows the arrivals to the emergency department by hour. Recent attendances have shown a continued pattern of presentations pre and post midnight and during the early hours of the morning. As part of the monthly patient survey, reasons for attendance and knowledge of other health care points are identified. For the last 3 months, less than half of all patients surveyed were aware of the UCC. Graph A - Average arrivals by hour
Average Arrivals by Hour - ED Only
0
5
10
15
20
25
30
00:0
0 - 0
0:59
01:0
0 - 0
1:59
02:0
0 - 0
2:59
03:0
0 - 0
3:59
04:0
0 - 0
4:59
05:0
0 - 0
5:59
06:0
0 - 0
6:59
07:0
0 - 0
7:59
08:0
0 - 0
8:59
09:0
0 - 0
9:59
10:0
0 - 1
0:59
11:0
0- 1
1:59
12:0
0 - 1
2:59
13:0
0 - 1
3:59
14:0
0 - 1
4:59
15:0
0 - 1
5:59
16:0
0 - 1
6:59
17:0
0 - 1
7:59
18:0
0 - 1
8:59
19:0
0 - 1
9:59
20:0
0 - 2
0:59
21:0
0 - 2
1:59
22:0
0 - 2
2:59
23:0
0 - 2
3:59
2003/04
2004/05
2005/06
2006/07
2007/08
2008/09
2009/10
2010/11
Apr andMay 2011
Average Arrivals by Hour - ED Only - Last Three Months
0
5
10
15
20
25
30
00:0
0 - 0
0:59
01:0
0 - 0
1:59
02:0
0 - 0
2:59
03:0
0 - 0
3:59
04:0
0 - 0
4:59
05:0
0 - 0
5:59
06:0
0 - 0
6:59
07:0
0 - 0
7:59
08:0
0 - 0
8:59
09:0
0 - 0
9:59
10:0
0 - 1
0:59
11:0
0- 1
1:59
12:0
0 - 1
2:59
13:0
0 - 1
3:59
14:0
0 - 1
4:59
15:0
0 - 1
5:59
16:0
0 - 1
6:59
17:0
0 - 1
7:59
18:0
0 - 1
8:59
19:0
0 - 1
9:59
20:0
0 - 2
0:59
21:0
0 - 2
1:59
22:0
0 - 2
2:59
23:0
0 - 2
3:59
Mar-11
Apr-11
May-11
Further analysis of attendance continues to show increasing activity between 22.00hrs and 03.59 and between 04.00hrs and 09.59hrs as may be seen below
TYPE 1 ED ATTENDANCEArrival Time ProfileArrival Time Jan - May 2008 Jan - May 2009 Jan - May 2010 Jan - May 20114am to 9:59am 7,329 7,324 7,902 8,16410am to 3:59pm 20,715 20,810 21,852 19,9874pm to 9:59pm 20,553 21,288 22,004 20,64010pm to 3:59am 9,411 9,747 9,820 10,650Sum: 58,008 59,169 61,578 59,441
As a percentage
Arrival Time Jan - May 2008 Jan - May 2009 Jan - May 2010 Jan - May 20114am to 9:59am 13% 12% 13% 14%10am to 3:59pm 36% 35% 35% 34%4pm to 9:59pm 35% 36% 36% 35%10pm to 3:59am 16% 16% 16% 18%
ARRIVAL TIME PROFILE
0
5,000
10,000
15,000
20,000
25,000
4am to9:59am
10am to3:59pm
4pm to9:59pm
10pm to3:59am
Jan - May 2008Jan - May 2009Jan - May 2010Jan - May 2011
Arrivals 10pm to 3:59am
8,6008,8009,0009,2009,4009,6009,800
10,00010,20010,40010,60010,800
10pm to 3:59am
Jan - May 2008Jan - May 2009Jan - May 2010Jan - May 2011
2

The mode of arrival during these periods may also be seen below with the majority of patients’ self-referring to ED, attending with parent or guardian, or via ambulance. The top five primary diagnoses of attendees include the following:
Abdominal pain Head Injury Chest Pain Fall Overdose/ingestion of drugs
Arrival Time Source of Referral Attendance %Midnight to 7:59am AMBULANCE 970 14%
COLLEAGUE/FRIEND 26 0%DEPUTISING SERVICE 26 0%GP WITH LETTER 68 1%GP WITHOUT LETTER 17 0%OTHER 166 2%OTHER HOSPITAL 44 1%OTHER RELATIVE 100 1%PARENT AND/OR GUARDIAN 794 11%POLICE/PRISON 208 3%SCHOOL/COLLEGE 2 0%SELF 4536 63%URGENT CARE CENTRE 157 2%WORK 49 1%
7163 100% 3.0 Time In ED Further to discussions at the June Trust Board, additional analysis has been undertaken in relation to the overall time spent in the department by patients, broken down into clusters of attendance periods and hours between arrival and being seen. As can be seen from the charts below, during the evening periods and into the night, there are increasing periods of patient stay in the department and increasing waits between arrival and being seen.
TIME in DEPARTMENT - MAY 2011
0
100
200
300
400
500
600
700
800
900
1000
0 1 2 3 4 5 67+0 1 2 3 4 5 67+0 1 2 3 4 5 67+0 1 2 3 4 5 67+0 1 2 3 4 5 67+0 1 2 3 4 5 67+
00:00 - 03:59 04:00 - 07:59 08:00 - 11:59 12:00 -15:59 16:00 - 19:59 20:00 - 23:59
No of P
atients
HOURS between ARRIVAL and being SEEN
0
200
400
600
800
1000
1200
1400
1600
1800
2000
0 1 2 3 4 5 6 0 1 2 3 4 5 6 0 1 2 3 4 5 6 0 1 2 3 4 5 6 0 1 2 3 4 6 0 1 2 3 4 5 6
00:00 - 03:59 04:00 - 07:59 08:00 - 11:59 12:00 -15:59 16:00 - 19:59 20:00 - 23:59
No of P
atients
3
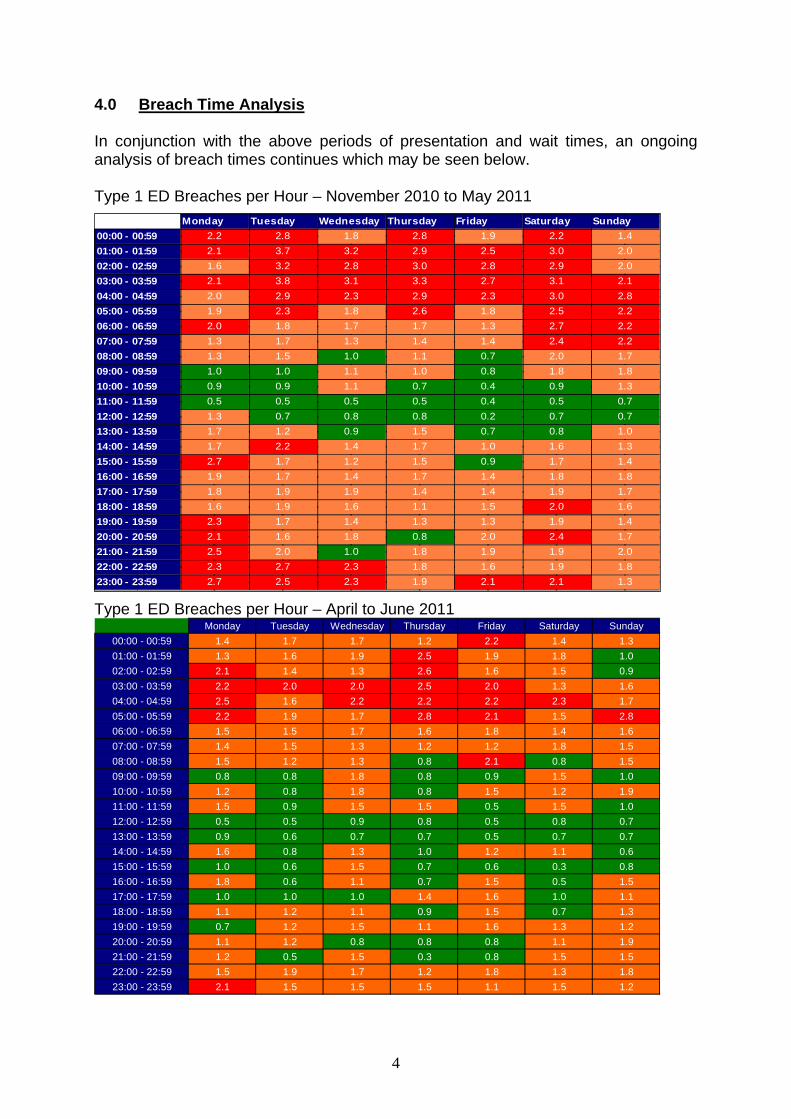
4.0 Breach Time Analysis In conjunction with the above periods of presentation and wait times, an ongoing analysis of breach times continues which may be seen below. Type 1 ED Breaches per Hour – November 2010 to May 2011
Monday Tuesday Wednesday Thursday Friday Saturday Sunday00:00 - 00:59 2.2 2.8 1.8 2.8 1.9 2.2 1.401:00 - 01:59 2.1 3.7 3.2 2.9 2.5 3.0 2.002:00 - 02:59 1.6 3.2 2.8 3.0 2.8 2.9 2.003:00 - 03:59 2.1 3.8 3.1 3.3 2.7 3.1 2.104:00 - 04:59 2.0 2.9 2.3 2.9 2.3 3.0 2.805:00 - 05:59 1.9 2.3 1.8 2.6 1.8 2.5 2.206:00 - 06:59 2.0 1.8 1.7 1.7 1.3 2.7 2.207:00 - 07:59 1.3 1.7 1.3 1.4 1.4 2.4 2.208:00 - 08:59 1.3 1.5 1.0 1.1 0.7 2.0 1.709:00 - 09:59 1.0 1.0 1.1 1.0 0.8 1.8 1.810:00 - 10:59 0.9 0.9 1.1 0.7 0.4 0.9 1.311:00 - 11:59 0.5 0.5 0.5 0.5 0.4 0.5 0.712:00 - 12:59 1.3 0.7 0.8 0.8 0.2 0.7 0.713:00 - 13:59 1.7 1.2 0.9 1.5 0.7 0.8 1.014:00 - 14:59 1.7 2.2 1.4 1.7 1.0 1.6 1.315:00 - 15:59 2.7 1.7 1.2 1.5 0.9 1.7 1.416:00 - 16:59 1.9 1.7 1.4 1.7 1.4 1.8 1.817:00 - 17:59 1.8 1.9 1.9 1.4 1.4 1.9 1.718:00 - 18:59 1.6 1.9 1.6 1.1 1.5 2.0 1.619:00 - 19:59 2.3 1.7 1.4 1.3 1.3 1.9 1.420:00 - 20:59 2.1 1.6 1.8 0.8 2.0 2.4 1.721:00 - 21:59 2.5 2.0 1.0 1.8 1.9 1.9 2.022:00 - 22:59 2.3 2.7 2.3 1.8 1.6 1.9 1.823:00 - 23:59 2.7 2.5 2.3 1.9 2.1 2.1 1.3
Type 1 ED Breaches per Hour – April to June 2011 Monday Tuesday Wednesday Thursday Friday Saturday Sunday
00:00 - 00:59 1.4 1.7 1.7 1.2 2.2 1.4 1.301:00 - 01:59 1.3 1.6 1.9 2.5 1.9 1.8 1.002:00 - 02:59 2.1 1.4 1.3 2.6 1.6 1.5 0.903:00 - 03:59 2.2 2.0 2.0 2.5 2.0 1.3 1.604:00 - 04:59 2.5 1.6 2.2 2.2 2.2 2.3 1.705:00 - 05:59 2.2 1.9 1.7 2.8 2.1 1.5 2.806:00 - 06:59 1.5 1.5 1.7 1.6 1.8 1.4 1.607:00 - 07:59 1.4 1.5 1.3 1.2 1.2 1.8 1.508:00 - 08:59 1.5 1.2 1.3 0.8 2.1 0.8 1.509:00 - 09:59 0.8 0.8 1.8 0.8 0.9 1.5 1.010:00 - 10:59 1.2 0.8 1.8 0.8 1.5 1.2 1.911:00 - 11:59 1.5 0.9 1.5 1.5 0.5 1.5 1.012:00 - 12:59 0.5 0.5 0.9 0.8 0.5 0.8 0.713:00 - 13:59 0.9 0.6 0.7 0.7 0.5 0.7 0.714:00 - 14:59 1.6 0.8 1.3 1.0 1.2 1.1 0.615:00 - 15:59 1.0 0.6 1.5 0.7 0.6 0.3 0.816:00 - 16:59 1.8 0.6 1.1 0.7 1.5 0.5 1.517:00 - 17:59 1.0 1.0 1.0 1.4 1.6 1.0 1.118:00 - 18:59 1.1 1.2 1.1 0.9 1.5 0.7 1.319:00 - 19:59 0.7 1.2 1.5 1.1 1.6 1.3 1.220:00 - 20:59 1.1 1.2 0.8 0.8 0.8 1.1 1.921:00 - 21:59 1.2 0.5 1.5 0.3 0.8 1.5 1.522:00 - 22:59 1.5 1.9 1.7 1.2 1.8 1.3 1.823:00 - 23:59 2.1 1.5 1.5 1.5 1.1 1.5 1.2
4

Taking into account the number of breaches that occurred between during the period, the average number of breaches per hour can be calculated and then RAG profiled as follows:
More than 2 breaches per hour RED 1 to 2 breaches per hour AMBER Less than 1 breach per hour GREEN
From the above graph, one can see a reduction in the number of breaches occurring during the evening and overnight – predicated on the increasing number of senior staff as appointments are made and improving management of both bed and discharge processes.
5.0 Admissions GP bed bureau referrals have been subject to two parallel running pilots since January 2011 for both surgical and medical patients which are both part of transformation bids. The profile of attendances over recent weeks has unaltered and as may be seen below, patterns of attendance remain a focus later in the day. Further to discussion with EMAS, monitoring of patient activity between referral and arrival continues.
Bed Bureau Admission and Discharge Times in May 2011
0
50
100
150
200
250
00:0
0 - 0
0:59
01:0
0 - 0
1:59
02:0
0 - 0
2:59
03:0
0 - 0
3:59
04:0
0 - 0
4:59
05:0
0 - 0
5:59
06:0
0 - 0
6:59
07:0
0 - 0
7:59
08:0
0 - 0
8:59
09:0
0 - 0
9:59
10:0
0 - 1
0:59
11:0
0 - 1
1:59
12:0
0 - 1
2:59
13:0
0 - 1
3:59
14:0
0 - 1
4:59
15:0
0 - 1
5:59
16:0
0 - 1
6:59
17:0
0 - 1
7:59
18:0
0 - 1
8:59
19:0
0 - 1
9:59
20:0
0 - 2
0:59
21:0
0 - 2
1:59
22:0
0 - 2
2:59
23:0
0 - 2
3:59
DischargesAdmissions
6.0 Outflow A focus on out-flow remains key and during the reporting period, continued emphasis has been placed on maximising the use of community provision and liaison with EMAS with regards to transportation. 6.1 Community Provision The graph below shows early data in relation to patients suitable for discharge and awaiting city or county provision. May data suggests a total of 650 bed days were lost during this period with reasons for delay being classified as:
Awaiting for assessment Awaiting public funding
5

Awaiting further non-acute NHS Care Awaiting home care placement Awaiting domiciliary package Awaiting community equipment Awaiting patient/family choice
Number of Beddays for Patients Waiting for City / County Beds W/E 21st
March 2010 to W/E 19th June 2011
0
50
100
150
200
250
300
350
21/0
3/20
10
04/0
4/20
10
18/0
4/20
10
02/0
5/20
10
16/0
5/20
10
30/0
5/20
10
13/0
6/20
10
27/0
6/20
10
11/0
7/20
10
25/0
7/20
10
08/0
8/20
10
22/0
8/20
10
05/0
9/20
10
19/0
9/20
10
03/1
0/20
10
17/1
0/20
10
31/1
0/20
10
14/1
1/20
10
28/1
1/20
10
12/1
2/20
10
26/1
2/20
10
09/0
1/20
11
23/0
1/20
11
06/0
2/20
11
20/0
2/20
11
06/0
3/20
11
20/0
3/20
11
03/0
4/20
11
17/0
4/20
11
29/0
5/20
11
12/0
6/20
11
0
5
10
15
20
25
30
35
40
45
Patients Waiting for City Beds Patients Waiting for County Beds Average daily beds
Beddays
Average daily beds
UHL has received notification form LPT that 1 ward will close at Coalville for capital works to be undertaken which will result in a loss of 24 beds for patient discharges. Discussions have taken place regarding alternative facilities that are currently being explored by LPT. 6.2 Transport Services May has reported a total of 48 re-beds during the month. Transport has also been supplemented through the continuous utilisation of two private ambulance crews at a cost of between £13 – £19k per month to enable patient discharges and transfers.
117 118
116
58
2622 25
3543
65
88
32
41
8
5
61 57 6151
39
78
58 58
68
4837
48
0
20
40
60
80
100
120
140
Mar
-09
Apr-
09
May
-09
Jun-
09
Jul-0
9
Aug-
09
Sep-
09
Oct
-09
Nov
-09
Dec
-09
Jan-
10
Feb-
10
Mar
-10
Apr-
10
May
-10
Jun-
10
Jul-1
0
Aug-
10
Sep-
10
Oct
-10
Nov
-10
Dec
-10
Jan-
11
Feb-
11
Mar
-11
Apr-
11
May
-11
Re-
Beds
Monthly Re-Beds due to Patient Transport Issues (EMAS)
7.0 Transformation Progress 7.1 ED Clinical Quality Indicators Further guidance in relation to performance management of the NHS A&E services using the clinical quality indicators was published by the Department of Health (DoH) on the 23rd June 2011.
From the 1 July, the DoH expects compliance with the minimum thresholds set for the five headline measures. To judge compliance against the thresholds, the five
6
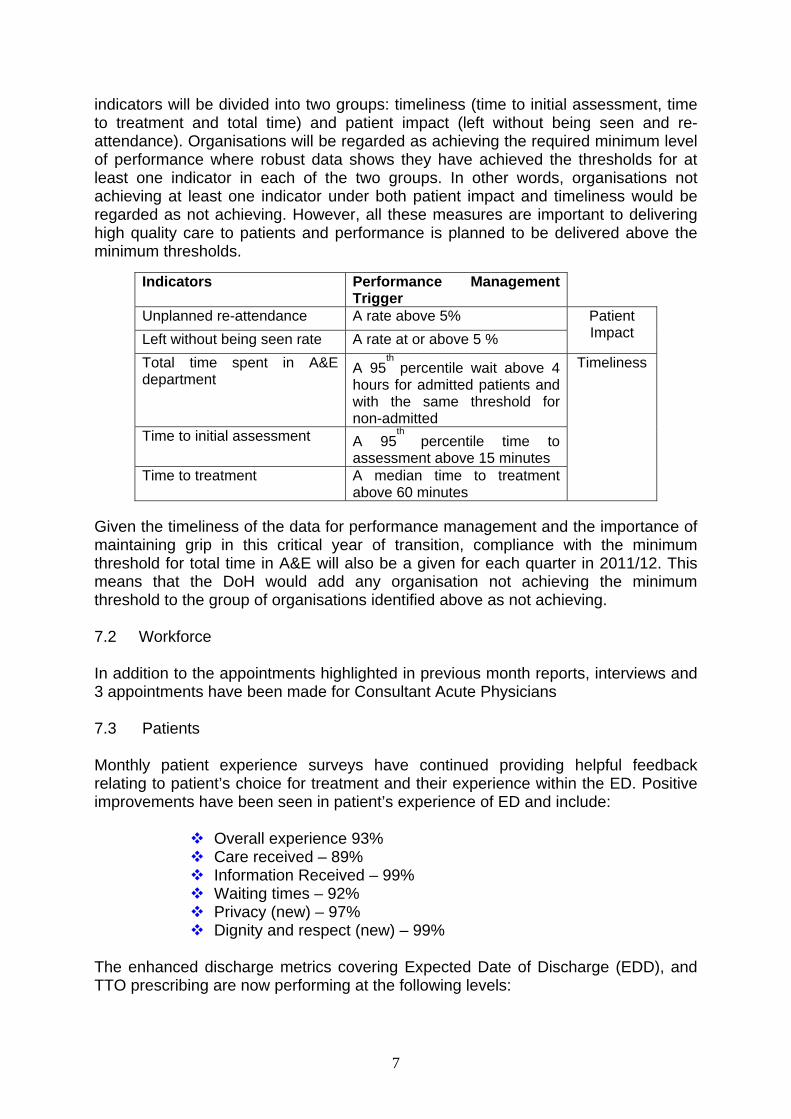
indicators will be divided into two groups: timeliness (time to initial assessment, time to treatment and total time) and patient impact (left without being seen and re-attendance). Organisations will be regarded as achieving the required minimum level of performance where robust data shows they have achieved the thresholds for at least one indicator in each of the two groups. In other words, organisations not achieving at least one indicator under both patient impact and timeliness would be regarded as not achieving. However, all these measures are important to delivering high quality care to patients and performance is planned to be delivered above the minimum thresholds.
Indicators Performance Management
Trigger Unplanned re-attendance A rate above 5% Left without being seen rate A rate at or above 5 %
Patient Impact
Total time spent in A&E department
A 95th
percentile wait above 4 hours for admitted patients and with the same threshold for non-admitted
Time to initial assessment A 95th
percentile time to assessment above 15 minutes
Time to treatment A median time to treatment above 60 minutes
Timeliness
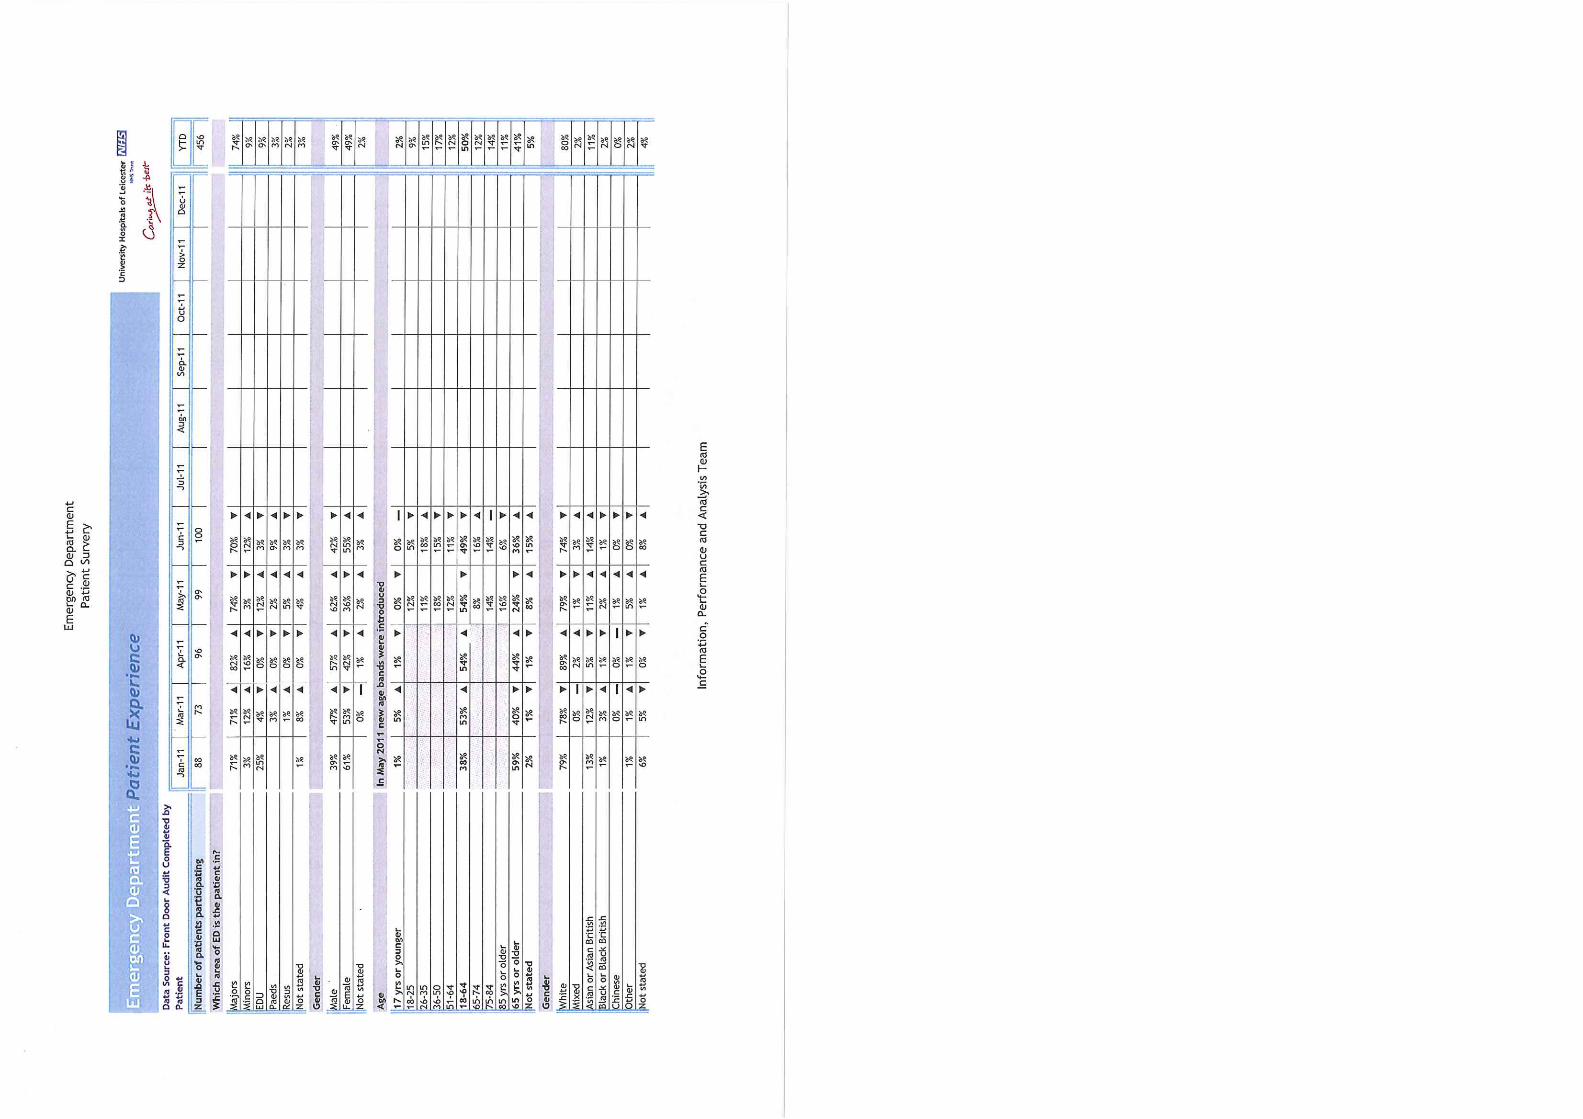
Given the timeliness of the data for performance management and the importance of maintaining grip in this critical year of transition, compliance with the minimum threshold for total time in A&E will also be a given for each quarter in 2011/12. This means that the DoH would add any organisation not achieving the minimum threshold to the group of organisations identified above as not achieving. 7.2 Workforce In addition to the appointments highlighted in previous month reports, interviews and 3 appointments have been made for Consultant Acute Physicians 7.3 Patients Monthly patient experience surveys have continued providing helpful feedback relating to patient’s choice for treatment and their experience within the ED. Positive improvements have been seen in patient’s experience of ED and include:
Overall experience 93% Care received – 89% Information Received – 99% Waiting times – 92% Privacy (new) – 97% Dignity and respect (new) – 99%
The enhanced discharge metrics covering Expected Date of Discharge (EDD), and TTO prescribing are now performing at the following levels:
7

January – 41% March – 60% May – 68% June - 74%
7.4 Footprint A task and finish group has completed the first stage of its work in identifying a footprint for the department to accommodate both activity levels and revised patient pathways. In order to be all embracing, this has also included options and support for the Urgent Care Centre (UCC). A transformation bid has now been submitted which includes the following changes:
Increase of resuscitation cubicles x 2 (8) Expansion to develop an 8 cubicle triage facility Increase in majors from 20 to 28 cubicles including space for
trolleys and chairs Increase children’s ED by 2 cubicles for triage Creation of integrated reception Imaging facilities within the UCC
7.5 Ambulatory Care Progress Pathways have been developed and implemented in Pleural Effusion, Pulmonary Embolism and Abdominal Pain with further pathways in Headaches and Chest Pain developed awaiting commencement.
8.0 Close The Trust is committed to improving the ED performance and alongside the LLR Emergency Care Network (ECN) has an active work-plan to respond to. Further updates by the ECN are due to be provided. S.Hinchliffe Chief Operating Officer/Chief Nurse
8