paper o cover - library.leicestershospitals.nhs.uk we... · qualitative pressure ulcer performance...
TRANSCRIPT

Trust Board Paper O
Title:
Quality & Performance Report
Author/Responsible Director: C Ribbins, Acting Chief Nurse K. Harris, Medical Director R. Mitchell, Chief Operating Officer K. Bradley, HR Director Purpose of the Report: To provide members with an overview of UHL quality and operational performance against national and local indicators for the month of June. The Report is provided to the Board for:
Summary / Key Points: The following paper provides an overview of the June 2013 Quality & Performance report highlighting key metrics and areas of escalation or further development where required. Successes
� Patient Safety - On the whole, June saw a constant improved safety position as measured against scorecard indicators – see Section 3.3
� MRSA - zero cases reported for Quarter 1 � Theatres – 100% WHO compliant � Zero Never Events reported in June � 62 day cancer plan formally accepted by commissioners and May performance on
planned trajectory – see Section 5.4 Areas to watch:-
� Friends and Family Test - Whilst performance on the FFT score has fallen (73.9 in May to 64.9 in June); the June figures are consistent with the 66.4 score achieved in April – see Section 4.2.
� C Difficile – ahead of trajectory to date with 15 reported against cumulative target of 22. Monthly target for the rest of the year is 5 a month with a full year trajectory of 67.
� Imaging – delivered for May and June but target missed in April. Action plan is being monitored to ensure sustainable delivery.
� C&B – performance similar to this time last year and target is still not delivered.
TRUST BOARD From: Carole Ribbins,
Kevin Harris, Richard Mitchell, Kate Bradley
Date: 25 July 2013 CQC regulation All
Decision Discussion √
Assurance √ Endorsement

Exceptions/Contractual Queries:-
� Pressure Ulcers - A contract query notice was raised by commissioners on the 10th July in relation to commissioners concern with UHL’s performance against the qualitative Pressure Ulcer performance metrics over recent months – see Section 3.9.
� ED 4hr target - Performance for June UHL + UCC is 85.3%. Further details focussing on the actions relating to the Emergency Department are included in the ED performance report.
� Cancelled Operations – both the short notice cancellation and rebook target within 28 days were missed in June – exception report attached.
� RTT admitted - The failure to achieve the April target (at a Trust position) has triggered a Contract Query Notice from the Commissioners. Commissioners have requested for our respective teams to work together to develop the Remedial Action Plan – see Section 5.2
� Stroke Performance - A contract query notice was raised by the commissioners on the 28th June in relation to commissioner concerns with UHL’s performance against the qualitative and quantitative stroke metrics raised over recent months. A remedial action plan was submitted to commissioners by the agreed deadline of the 12th July. The plan is being reviewed by commissioners – see Section 5.7.
Recommendations: Members to note and receive the report Strategic Risk Register Performance KPIs year to date CQC/NTDA
Resource Implications (eg Financial, HR) N/A Assurance Implications Underachieved targets will impact on the Provider Management Regime and the FT application Patient and Public Involvement (PPI) Implications Underachievement of targets potentially has a negative impact on patient experience and Trust reputation Equality Impact N/A Information exempt from Disclosure N/A Requirement for further review? Monthly review

Trust Board
Thursday 25th July 2013
Quality and Performance - June 2013

1
UNIVERSITY HOSPITALS OF LEICESTER NHS TRUST
REPORT TO: TRUST BOARD DATE: 25 JULY 2013 REPORT BY: CAROLE RIBBINS, ACTING CHIEF NURSE KEVIN HARRIS, MEDICAL DIRECTOR RICHARD MITCHELL, CHIEF OPERATING OFFICER
KATE BRADLEY, DIRECTOR OF HUMAN RESOURCES SUBJECT: JUNE 2013 QUALITY & PERFORMANCE SUMMARY REPORT 1.0 INTRODUCTION
The following paper provides an overview of the June 2013 Quality & Performance report highlighting key metrics and areas of escalation or further development where required..
2.0 2013/14 NTDA Oversight – Routine Quality and Governance indicators
Performance for the 2013/14 indicators in Delivering High Quality Care for Patients: The Accountability Framework for NHS Trust Boards was published by the NTDA early April. The indicators to be reported on a monthly basis are grouped under the following headings:-
� Outcome Measures � Quality Governance Measures � Access Metrics
*as at 31st March 2013

2
There are a few indicators where additional information is required before publication in the Q&P.
3.0 QUALITY AND PATIENT SAFETY – KEVIN HARRIS
3.1 Quality Commitment
To deliver our vision of 'Caring at its best' we are laying out an ambitious Quality Commitment for our hospitals. Our priorities are being led through three over-arching strategic goals, each with a target to be delivered over the next 3 years. By 2016 we will aim to deliver a programme of quality improvements which will:
� Save 1000 extra lives � Avoid 5000 harm events � Provide patient centred care so that 75% of our patients would recommend us
A Quality Commitment dashboard has been developed includes the 3 core metrics for tracking performance against our 3 goals (save lives, avoid harm and improve care so that our patients recommend us). These 3 metrics will be tracked throughout the programme up to 2015. The dashboard also includes 7 sub-metrics, one to track delivery in each of the 7 work streams. These metrics are selected from a broader group of tracking metrics and were chosen to be representative of the individual workstream targets. These sub-metrics will change during the programme as we achieve are targets and set new focus areas in 2014 and 2015.

3
3.2 Mortality Rates
UHL’s most recently published SHMI value remains at 104.53 (i.e. 105) which is above the England average of 100 but remains within expected.
UHL’s HSMR for April 12 to March 13 was 96.1. Following the annual rebasing (carried out when all Trusts’ data has been submitted for the full year) , Dr Fosters are predicting UHL’s HSMR for 12/13 will be 101 (within expected). The rebased HSMR for 12/13 will be published in the 2013 Hospital Guide. One of the ‘Quality Commitment’ work streams – the Respiratory pathway commenced on 1st July (aimed at increasing the number of patients with respiratory illness being admitted directly to Glenfield). The other main area is to look in more detail at reasons why there is a difference in mortality rates for patients admitted ‘out of hours’ than those admitted ‘in-hours’. Analysis

4
and clinical interrogation of respiratory specific data seemed to suggest that the differences were related more to patients’ clinical condition than to the care provided. Similar analysis and clinical is now taking place for other disease groups. The LLR SHMI (Mortality) Review period has been extended to the end of July as there have been difficulties getting matching Primary Care and UHL notes for all patients included in the review.
3.3 Patient Safety
On the whole, June saw a constant improved safety position as measured against scorecard indicators. Pleasingly there has been a second month showing a reduction in the number of staffing incidents reported, all of which are reviewed by the Divisional Heads of Nursing. The trust continues to improve its performance on completing RCA investigation reports within 45 working days and to share these reports with patients and relatives when they wish to receive them.
At the end of June the Trust had 63 ongoing SUI investigations, 42 of these were related to Hospital Acquired Pressure Ulcers (HAPU), 15 were Patient Safety Incidents (PSI) and 6 were Healthcare Acquired Infections.
21 of these incidents were escalated in June, 17 were HAPUs and 4 were related to PSI, none of which were Never Events.
One of the PSIs was a patient fall that occurred in ED. The patient fell from a trolley and incurred a fractured neck of femur. The initial investigation identified that the patient was in ED for a prolonged period of time (11 hours) whilst a bed was being sought in medicine. The investigation for this incident is ongoing.
June saw continued increased activity in the number of formal complaints received. Additionally June saw an increase in reopened complaints, which is consistent with the increased complaints activity. The trend of complaints is detailed below:-
Formal / Verbal / Concern Complaints received
April 2012 - June 2013
2721
616
2418
41 3829 28
34
5954
25
38
124
147
134128
136
96101
111
98
140 136
163154
164158
95
81 78
43
63 67
112
90 8797
125116
109
89
116
0
20
40
60
80
100
120
140
160
180
2012
04
2012
05
2012
06
2012
07
2012
08
2012
09
2012
10
2012
11
2012
12
2013
01
2013
02
2013
03
2013
04
2013
05
2013
06
Concern Formal Verbal
3.4 5 Critical Safety Actions
The aim of the ‘Critical safety actions' (CSA’s) programme is to see a reduction in avoidable mortality and morbidity. The key indicator being focused upon by commissioners is a reduction in Serious Untoward Incidents related to the CSA's.

5
1. Improving Clinical Handover.
Aim - To provide a systematic, safe and effective handover of care and to provide timely and collaborative handover for out of hours shifts Actions:-
� Pilot work with alternative handover system module (Nerve Centre) continues for use for both nursing and medical handover on the surgical wards at the LRI. ACCA re-audit took place on 13th and 14th June 2013. ACCA report on agenda for QPMG on 7th August for Trust endorsement for publication.
� A business case is being worked up for LRI alone initially and subsequently for the other two sites for UHL to procure a handover system. Nerve Centre would be preferable as will integrate with the 24/7 task allocation system and has shown from trail work it can be easily developed to meet requirements.
2. Relentless attention to Early Warning Score triggers and actions
Aim - To improve care delivery and management of the deteriorating patient
Actions:-
� EWS incidents related to non escalation continue to be monitored and internally disseminated onto divisional dashboards broken down to CBU level.
� Audit work undertaken prior to the implementation of 24/7 at GH site showed very poor results for meeting the pathway response time to patients with an EWS>4 in the out of hours period. Only 10% of those patients notes audited were reviewed within 30 minutes as stated in the pathway. Therefore work this year will focus on improving response times in the out of hours period using the Nerve Centre task allocation system for the reporting data.
� Poor audit results from children’s CBU reviewing compliance with SAR observation chart. Plan for either chart revision or change of scoring system with new chart.
� Agreement of NEWS chart and pathway for implementation into neonatal units and for use on post natal babies in the Womens CBU.
3. Acting upon Results
Aim - No avoidable death or harm as a failure to act upon results and all results to be reviewed and acted upon in a timely manner. Actions
� Minimal response from Divisional Directors with feedback as to how many of their CBU/specialities have a documented agreed process for the management of diagnostic test results against the implementation plan.
� Decision by Dr. Collett to set up a Task and Finish group to assist and support the divisions in the implementation of the Diagnostic Testing policy, improve the interface with radiology, pathology and the specialities and share good practice. This has been agreed at corporate medical board and cross divisional board.

6
4. Senior Clinical Review, Ward Rounds and Notation
Aim -To meet national standards for clinical documentation. To provide strong medical leadership and safe and timely senior clinical reviews and ensure strong clinical governance. Actions
� Ward round safety checklist now finalised for use as a prompting tool across trust. Waiting costs for printing of this in several different formats. Plan to meet with lead from UCLH to discuss barriers and lessons learned with the implementation of their ward round safety checklist.
� Care of the Elderly wards at the LRI have commenced use of the ward round template for documentation in line with the implementation of new ward round standards.
� Dates set for July and August for meetings with identified clinical leads to
review current practice in specialities for consultant led review and ward
round documentation and discuss the use of template and ward round safety
checklist.
3.5 Fractured Neck of Femur ‘Time to Theatre’
Of the 75 patients discharge during June, 32 patients failed to get to theatre within 36 hours (giving the 57.3% performance). All patients are assessed for fitness for anaesthetic by an Orthogeriatrician. Of the 32 patients, 24 were medically unfit for theatre and 8 patients who did not get to theatre within 36 hours entirely due to UHL not having enough capacity. This was mostly due to high admission levels with 20 admissions within a 7 day period (14 to 21 June). The month total was again high at 75 which 10% higher than expected.
3.6 Venous Thrombo-embolism (VTE) Risk Assessment
The 95% threshold for VTE risk assessment within 24 hours of admission was not achieved for April, May or June. The main reason for non achievement of the increased threshold is due to details of the risk assessment not being entered onto Patient Centre. This seems to be related to those areas with high numbers of admissions at weekends/out of hours when there is less ward clerk cover. Additional bank cover is being arranged for these areas. Another possible reason for the deterioration in recording of VTE risk assessment on Patient Centre is believed to be that ward clerks have also been asked to input details of the Dementia Screening Question. Further support is being provided to the admission areas to address this.

7
3.7 CQUIN Schemes Performance is on track for 16 of the 18 CQUIN Schemes.
REF CQUIN Title CQUIN de ta il RAG
Im ple m e ntation o f Fr ie nds and Fam ily Te s t:
1.1 Phas e d Expans ion
1.2 Incre as e d Re s pons e Rate
1.3 Im pr ove d Pe r form ance on Staff Te s t
2.1 Colle ct data on pre s s ure u lce r s , falls and ur inar y
in fe ctions in patie nts w ith a cathe te r (CAUTIs )
2.2 Re duction in Falls and CAUTIs as m e as ure d by
Safe ty The rm om e te r
3.1 .Patie nts age d 75 and ove r adm itte d as an
e m e rge ncy ar e s cre e ne d for de m e ntia, w he re
s cr e e ning is pos itive the y are appr opr iate ly
as s e s s e d and w he r e appropr iate r e fe r re d on to
s pe cialis t s e rvice s /GP.
3.2. Ens ur ing s ufficie nt clinical le ade rs h ip o f
de m e ntia w ith in pr ovide r s and appropr iate tr ain ing
of s taff.
3.3. Ens ur ing car e rs o f pe ople w ith de m e ntia fe e l
ade quate ly s uppor te d
Re duce avo idable de ath ,d is ability and chronic ill
he alth from V e nous thr om boe m bolis m (V TE)
1. V TE r is k as s e s s m e nt
2. V TE RCAs
M ak ing Eve r y Contact Count
Incr e as e d advice and re fe r r al to STOP and ALW
LLR CQUIN Loc 2 End of L ife Care
Im ple m e ntation o f the AM BER care bundle to e ns ure
patie nts and care r s w ill re ce ive the h ighe s t pos s ib le
s tandards o f e nd of life care
Im prove care pathw ay and d is char ge for patie nts
w ith Pne um onia
a) Adm is s ion d ire ctly to r e s pir atory w ard (Gle nfie ld
s ite ) and p ilo ting o f 'pne um onia vir tual clin ic for
patie nts adm itte d to LRI')
b ) Im proving car e pathw ay and d is charge for
patie nts w ith Pne um onia - Im ple m e ntation o f
Pne um onia Car e Bundle
Im proving care pathw ay and d is charge for patie nts
w ith He ar t Failure -
Im ple m e ntation o f Car e Bundle and d is char ge Che ck
L is t and p ilo ting o f 'vir tual w ar d'
Cr itical Safe ty Actions :
5.1 Clinical Handove r ,
5.2 Acting on Re s ults ,
5.3 Se nior Clinical Re vie w , War d Round and Notation
s tandards
5.4 Ear ly War ning Scor e s (EWS)
ED/Em M e dicine Patie nt Flow ? Im pr oving patie nt flow
fr om the ED thr ough e ffe ctive u tilis ation o f AM U type
be ds
?De m ons trating how the e ffe ctive u tilis ation of AM U
type be ds is contr ibuting to ED outflow
EM SCG CQUIN SS1 Quality Das hboar ds
Im ple m e ntation o f Spe cialis e d Se r vice Quality
Das hboards
EM SCG CQUIN SS2
BM T - Donor
acquis ition
Bone M arr ow Trans plant (BM T) – Donor acquis ition
m e as ure s
EM SCG CQUIN SS3
Fe tal M e dicine -
Re fe r ral
Fe tal M e dicine – Rapid ity o f obtain ing a te r tiar y le ve l
fe tal m e dicine op in ion
EM SCG CQUIN SS4
Hae m ophilia –
Hae m track m onitor ing
Incr e as e us e o f Hae m tr ack for m onitor ing clo tting
factor re quire m e nts
NIC –
3. T im e ly s im ple
d is charge
EM SCG CQUIN SS6 IM RT
Radiothe rapy – Im pr oving the pr opor tion o f radical
In te ns ity m odulate d rad io the rapy (e xclud ing bre as t
and br ain ) w ith le ve l 2 im aging – im age gu ide d
r ad io the r apy (IGRT)
EM SCG CQUIN SS7 Re nal - tbc Acute Kidne y In jur y
LLR CQUIN Loc 6 ED/AM U Flow
EM SCG CQUIN SS5
Dis char ge planning is im por tant in im proving the
e fficie ncy o f un its and e ngaging pare nts in the care
o f the ir in fants the r e by im pr oving care r s atis faction
o f NICU s e r vice s .
LLR CQUIN Loc 4 He ar t Failur e
LLR CQUIN Loc 5 CSAs
LLR CQUIN Loc 1 M ECC
LLR CQUIN Loc 3 Pne um onia
Nat CQUIN Nat 3 De m e ntia -
Nat CQUIN Nat 4
V TE - Ris k
As s e s s m e nt & HAT
RCAs
Nat CQUIN Nat 1 Fr ie nds and Fam ily
Nat CQUIN Nat 2 Safe ty The rm om e te r

8
Performance is on track for 16 of the 18 CQUIN Schemes. The 95% threshold for VTE risk assessment within 24 hours of admission was not achieved in April and provisional data suggests the same for May. Reasons for non achievement and actions taken are described in Section 3.6. The ‘National Dementia CQUIN’ requirement is “90% of patients (meeting the criteria) being screened for 3 consecutive months” and therefore this indicator has been Amber RAG’d as the threshold is still achievable before the end of the year.
3.8 Theatres – 100% WHO compliance The National Patient Safety Agency endorsed WHO checklist consists of four stages and is monitored and reported every month to commissioners. For June the checklist stands at 100% and has been fully compliant since January 2013.
3.9 C-sections rates
The C Section thresholds were locally agreed following the Regional ‘Normalising Birth’ CQUIN in 10/11. UHL’s C Section rates have generally benchmarked very well with comparable organisations. For the past 2 months, the overall C Section rate has been higher than expected and so cases are being reviewed through Perinatal governance processes to confirm reasons for this
3.10 Safety Thermometer
An update on the Safety Thermometer has been submitted to the July Quality Assurance Committee. The main headlines and results are detailed below:-
M a y-1 3 J un- 13
Num b er of p atie nt s 1 6 86 1 6 50
All H arm s
Tot al No o f Ha rm s 1 10 1 08
N o of pa tie nts w it h no Harm s
1 5 80 1 5 45
% Ha rm Fre e 9 3 .71 % 93 .64 %
Ne w ly Ac qu ire d
Ha rm s
To ta l N o of N ew ly
Ac qu ired (UHL) Ha rm s 5 1 5 1
No of P a tie nts w it h no Ne w ly Ac quire d Ha rm s
1 6 36 1 6 01
% of UH L Pa tie nts w ith No Ne w ly Ac quire d
Harm s 97 .03 4 % 97 .03 0 %
H arm
On e
All P res su re Ulc e rs (G rade s 2, 3 o r 4 )
7 5 7 3
N o of N ew ly Ac quire d G ra de 2, 3 o r 4 Pu s
2 7 2 6
H arm Tw o
N o of P a tie nts h av ing falle n in hos pita l in
pre v ious 7 2 hrs 8 8
H arm Thre e
No of Pa tie nts w ith Urina ry Ca th et er a nd
Urine Inf ec tion (prior to or pos t ad m iss ion)
2 7 2 7
N ew ly Acqu ired U TIs w ith C atheter
1 6 1 7

9
� The total number of harms recorded in UHL (i.e. old and new) decreased very
slightly from 110 harms in May to 108 in June. � UHL’s overall percentage of harm free care dipped slightly from 93.71% in May to
93.64% in June. The percentage is lower because the number of patients (i.e. denominator) included in the ST audit reduced by 36 for the month of June.
� The total prevalence of newly acquired harms recorded for June was the same as May so remained at 51 harms.
� There was a decrease in the prevalence of newly acquired pressure ulcers for the month of June by one ulcer.
� Falls prevalence remained the same as the previous month which was eight and the prevalence of CAUTIs remained the same at 27.
� The data has been validated with the Audit Team. � UHL have not yet received any communication from the Department of Health
regarding the independent review of the ST tool. The commissioners have issued UHL a Contract Query Notice in order to seek further assurance of the Trust’s ability to achieve zero avoidable grade 2, 3 and 4 pressure ulcers. Although there is recognition of the work that has gone into the prevention of pressure ulcers and the improvements that have been seen over the last two months, there are concerns that the Trust has not achieved its previous recovery trajectories. A remedial action plan will be signed off at the Contract Performance Meeting on the 25th July by the commissioners and will be presented to the August QAC.
4.0 PATIENT EXPERIENCE – CAROLE RIBBINS
4.1 Infection Prevention
YTD Jun-13 Last MonthJune Last
Year
MRSA 0 0 0 0
Clostridium Difficile 15 2 7 3 MRSA – There was 0 MRSA cases reported for June. There is zero tolerance to MRSA cases in 2013/14 and any case reported will result in non payment of the inpatient episode. C Difficile – there were 2 cases reported in June with 15 cases for the first 3 months against a target of 22. The full year target is 67 with a financial penalty of £50,000 per patient above this end of year target.

10
MRSA elective and non-elective screening has continued to be achieved at 100% respectively.
4.2 Patient Polling
Patient Experience Surveys continue across 91 clinical areas and have four bespoke paper surveys for adult inpatient, children’s inpatient, adult day case and intensive care settings. In June 2013, 3,519 Patient Experience Surveys were returned this is broken down to:
• 2,101 paper inpatient surveys
• 602 electronic surveys
• 816 ED paper surveys
Share Your Experience – Electronic Feedback Platform In June 2013, a total of 602 electronic surveys were completed via email, touch screen, our Leicester’s Hospitals web site or handheld devices. A total of 856 emails were sent to patients inviting them to complete a survey. The table below shows how this breaks down across the trust:
Share Your Experience Survey
Email Touch Screen
Hand held
Web
Total Surveys
Emails
sent
Carers Survey 0 0 0 1 1 0
Children’s Urgent & ED Care
1 46 0 0 47 36
A&E Department 22 154 5 7 188 228
Eye Casualty 0 175 0 1 176 0
Glenfield CDU 0 43 0 0 43 0
Glenfield Radiology 10 0 0 0 10 33
IP and Childrens IP 0 0 0 14 14 0
Maternity Survey 13 0 0 6 19 201
Neonatal Unit Survey
0 0 0 2 2 0
Outpatient Survey 80 2 0 1 83 358
Windsor Eye Clinic 0 19 0 0 19 0
Total 126 439 5 32 602 856
The trust has piloted the use of handheld units in specific clinical areas and due to the success of this initiative is in the process of purchasing nine for the launch of the maternity Friends and Family Test in July.

11
Treated with Respect and Dignity
The Trust has maintained a GREEN rating for the question ‘Overall do you think you were you treated with dignity and respect while in hospital’ based on the scoring methodology used in the national survey.
Friends and Family Test
Inpatient The inpatient surveys include the Friends and Family Test question; How likely are you to recommend this ward to friends and family if they needed similar care or treatment?’ Of the 2,101 surveys, 1,514 surveys included a response to this question and were considered inpatient activity (excluding day case / outpatients) and therefore were included in the friends and family test score for NHS England. Overall there were 5,987 patients in the relevant areas within the month of June 2013. The Trust easily met the 15% target achieving coverage of 25.3%. The Friends & Family Test responses broken down to: Extremely likely: 1038 Likely: 383 Neither likely nor unlikely: 39 Unlikely 18 Extremely unlikely 13 Don’t know: 23 Overall Friends & Family Test Score 64.90
Inpatient - Friends and Family Test Score - June 2013
Performance 12 months to date
64.50
73.94
64.90
57.4857.2058.1257.4857.55
53.80
63.34
61.10
66.40
30
35
40
45
50
55
60
65
70
75
80
Jul-1
2
Aug-1
2
Sep-1
2
Oct-1
2
Nov-1
2
Dec-1
2
Jan-1
3
Feb-1
3
Mar-1
3
Apr-1
3
May-1
3
Jun-1
3
Sco
re
FFT
May 2013 compared to June 2013 Whilst performance on the FFT score has fallen (73.9 in May to 64.9 in June); the June figures are consistent with the 66.4 score achieved in April. As the FFT was only introduced in April there is very little historical data to compare performance against and assess whether fluctuations on the FFT score are significant.

12
An analysis of the data revealed that the number of ‘promoters’ as a proportion of responses decreased in June compared to May, whilst the number of ‘passive’ and ‘detractor’ responses increased. This pattern was true for each Division and was also evident at CBU level. Performance Changes The largest drop in the FFT score was seen in the Acute Division, where the score dropped by 10 from 72 to 62 between June and May.
Apr-13 May-13 Jun-13
Point Change in FFT Score
UHL Trust Level Totals
66.4 73.9 64.9 9
Acute Division 64.6 72.2 62.1 10.1
Planned Division 67.5 74.4 67.5 7.9
Women’s and Children’s Division
78.3 80.4 74.1 6.2
Emergency Department & Eye Casualty Electronic and paper surveys are used to offer the Friends and Family Test question; How likely are you to recommend this A&E department to friends and family if they needed similar care or treatment?’ in A&E Minors, Majors and Eye Casualty. Overall there were 6,194 patients who were seen in A&E and then discharged home within the month of June 2013. The Trust surveyed 1,027 eligible patients meeting 16.6% of the footfall. The Friends & Family test responses break down to: Extremely likely: 680 Likely: 272 Neither likely nor unlikely: 29 Unlikely 18 Extremely unlikely 17 Don’t know: 11 Overall Friends & Family Test Score 60.63
Accident & Emergency - Friends and Family Test Score - June 2013
Performance Financial Year 2013/14
43.30
47.26
60.63
30
35
40
45
50
55
60
65
70
75
80
Apr-1
3
May-1
3
Jun-1
3
Jul-1
3
Aug-1
3
Sep-1
3
Oct-1
3
Nov-1
3
Dec-1
3
Jan-1
4
Feb-1
4
Mar-1
4
Sco
re
FFT

13
Details at hospital and ward level for those wards included in the Friends and Family Test Score are included in Appendix 1.
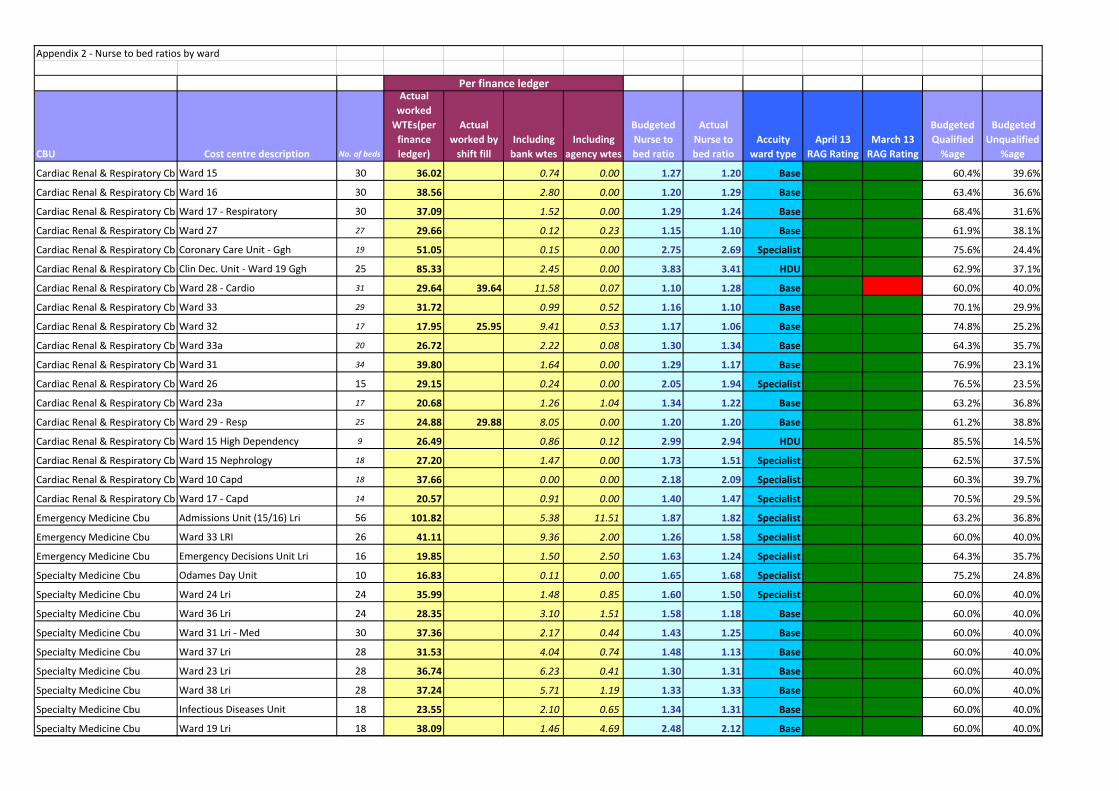
4.3 Nurse to Bed Ratios
Nurse to Bed Ratio by ward are reported in Appendix 2. This is based on a 60% qualified and 40% unqualified skill mix split, with 1 x Band 7 and 2 x Band 6s in the funded establishment:
� General base ward range = 1.1-1.3 WTE � Specialist ward range = 1.4-1.6 WTE � HDU area range = 3.0-4.0 WTE � ITU areas = 5.5-6.0 WTE
A ward summary action plan for the four wards which fall below 1.1 WTE nurse to bed ratio for this month is included in Appendix 3.
4.4 Same Sex Accommodation All UHL wards and intensivist areas continue to offer Same Sex Accommodation (SSA) in line with the UHL SSA Matrix guidance and delivered 100%.
5.0 OPERATIONAL PERFORMANCE – RICHARD MITCHELL
5.1 ED 4hr Wait Performance
85.3%
70%
75%
80%
85%
90%
95%
100%
Jun-
12
Jul-1
2
Aug-
12
Sep-
12
Oct
-12
Nov-
12
Dec-
12
Jan-
13
Feb-
13
Mar
-13
Apr-
13
May
-13
Jun-
13
ED 4 Hour Waits - UHL Incl. UCC
Target - 95%
Performance for June Type 1 & 2 is 81.6% and 85.3% including the Urgent Care Centre (UCC). UHL’s performance for the 4 weeks up to 7th July meant that the Trust was the

14
worst performing Trust in England. In the same period 125 out of 145 Acute Trusts delivered the 95% target Further details focussing on the actions relating to the Emergency Department are included in the ED performance report.
5.2 RTT – 18 week performance
RTT Admitted performance
As expected, admitted performance in June has not been achieved with performance at 85.6%, with 5 specialties failing the target with an estimated automatic fine of £50,000. The failure to achieve the April target (at a Trust position) has triggered a Contract Query Notice from the Commissioners. Commissioners have requested for our respective teams to work together to develop the Remedial Action Plan. After further discussion with the commissioners the deadline for developing action plans has been extended. There will be recovery plans for Ophthalmology, ENT (Adult and Paediatrics), Orthopaedics and General Surgery. The July and August target will not be achieved as the plan is to reduce the 18+ week backlog. The national admitted performance in May was 92.1%. 119 out of the 178 Trusts missed the target at specialty level and 80 Trust's had between 2 and 10 specialty failures. RTT Non Admitted performance

15
The non-admitted target for June has been achieved at 96.0% against a target of 95%. To reduce the non-admitted backlog of patients waiting 18+ weeks, Ophthalmology missed the target with an estimated automatic fine of £11,000. The national non-admitted performance in May was 97.5%. 100 out of the 204 Trusts missed the target at specialty level and 62 Trusts had between 2 and 16 specialty failures.
RTT Incomplete Pathways
The requirement that 92% of patients on an incomplete pathway (i.e. patients waiting for a decision to treat or treatment) should have been waiting no more than 18 weeks was achieved in June with performance at 93.7%. In numerical terms the total number of patients waiting 18+ weeks for treatment (admitted and non-admitted) is 2,497..

16
Four specialties missed the target resulting in an expected contractual penalty estimated at £6,000. The national incomplete pathways performance in May was 93.9%. 109 out of the 204 Trusts missed the target at specialty level and 71 Trusts had between 2 and 10 specialty failures.
5.3 Imaging Waiting Times
The delivery of the diagnostic 6+ week wait target has been delivered in June at 0.5% against a threshold of 1% National performance for May shows that 1.0% of patients were waiting for diagnostic tests longer than 6 weeks.
5.4 Cancer Targets
Two Week Wait
Both 2 week cancer targets have been achieved in May (latest reported month). National performance for both these indicators was at 95.8%.
31 Day Target
All the 31 day cancer targets have been achieved in May (latest reported month). With the exception of the 31 day diagnosis to treatment target National performance is slightly better in May than the UHL performance, with the exception of the 31 day anti cancer drug treatment.

17
62 Day Target
YTD May-13 Last MonthJune Last
Year
80.7% 80.4% 80.9% 77.1%
96.2% 94.3% 98.6% 96.1%62-Day Wait For First Treatment From Consultant Screening
Service Referral: All Cancers
62-Day (Urgent GP Referral To Treatment) Wait For First
Treatment: All Cancers
The 62 day urgent referral to treatment cancer target for May was 80.4% against a national target of 85% and a recovery trajectory of 80.4%. National performance for the 62 day target was 85.7% in May. An exception report was received by the Trust Board last month which outlined a number of key actions for recovery of this standard. Further to this on the 29th May commissioners issued a formal Contract Query Notice in respect of this standard, their requirements include a detailed recovery action plan with clear clinical and managerial leadership. The Trust’s response to this was submitted to the Contract and Performance Meeting on the 25th June, with some minor amendments. The detailed plan and trajectory for recovery of the standard has been formally accepted by commissioners. An updated progress report has been submitted to the commissioners for discussion at the Contract Performance meeting on the 23rd July.
5.5 Choose and Book slot availability
Choose and book slot availability performance for June is 13%, with the national average at 11% Issues with slot availability in June are mainly within the following specialties:
� GI services and ENT, where additional clinics are being run � Orthopaedics, has a recurrent shortfall in capacity for back referrals, this remains
under discussion with commissioners Resolution of slot unavailability requires a reduction in waiting times for 1st outpatient appointments in key specialities, this needs to be a key component of the RTT recovery plan There are no financial penalties applied to the 2013/14 Contract for failure of this indicator.
5.6 Cancelled Operations rebooked in 28 days

18
June performance shows that the percentage of operations cancelled on/after the day of admissions of all elective activity for non clinical reasons was 1.0% against a target of 0.8%. The percentage offered a date within 28 days of the cancellation in June was 86.4% against a threshold of 95%. The consequence of not offering a date to be treated within 28 days of the cancellation in non-payment of re-schedule episode of care. The penalty for June is £10,000.
Further detail of actions to be taken is included in the Cancelled Operation exception report, see Appendix 4.
5.7 Stroke % stay on stroke ward
The percentage of stoke patients spending 90% of their stay on a stroke ward in May (reported one month in arrears) is 79.3% against a target of 80%. The commissioners have issued a contract query for stroke performance indicators which the Trust provided a remedial action plan within the contractual deadline. Commissioners are reviewing the plan. Further detail of actions to be taken is included in the Stroke Quality Indicators exception report – see Appendix 5.
5.8 Stroke TIA

19
The percentage of high risk suspected TIAs receiving relevant investigations and treatment within 24 hours of referral receipt is 72.0% against a national target of 60.0%. The contractual target for this indicator remains under review.
5.9 Delayed Discharges
During June 2013 UHL has seen an improvement in the performance for both city and county patients. There were 211 episodes recorded as a ‘Delayed Transfer of Care’ on the weekly sitreps recorded at midnight each Thursday during June 2013, making the combined average of 7.7 delays per 100,000 population against a target of 2.3 delays per 100,000 population. Numbers of delays by reason for April to June are shown below:-
Delays continue to be escalated internally at bed meetings and externally at daily teleconferences.
6.0 HUMAN RESOURCES – KATE BRADLEY 6.1 Appraisal
The reported June appraisal rate is 90.7% against our target of 95% with appraisal rates being fairly static at around 90%. Support with talent management, succession planning and leadership development work is underway in compiling the talent profiles for the UHL

20
senior leadership team. The release of ward managers from clinical duties for two days per week is predicted to improve both appraisal rates and quality outcomes.
6.2 Sickness
The sickness rate for June is 3.6% and the May figure has now adjusted to 3.35% to reflect closure of absences. This is below the previous SHA’s target of 3.4% but above the Trust stretch target of 3%. The Well Being at Work team hosted an excellent Fun Day on Saturday 6 July. This was funded through Staff Lottery monies. There were many activities for our staff and family and friends to enjoy including bouncy castles and a rodeo bull. There were also races including the sack race and egg and spoon. The caterers provided English and Indian Halal food. As well as receiving positive feedback, £250 was raised for the Kidney Care Appeal.
7.0 2013/14 CONTRACTUAL QUERIES 7.1 A&E 4hr Performance
A failure to agree notice was issued by the Commissioners in relation to the A&E 4hr performance. The deadline for responding to the issues raised in the failure notice is the 24th July. Under the NHS Standard Contract General Conditions 9.19, if there is failure to agree a Remedial Action Plan within 10 Operational Days of this RAP Failure to Agree Notice being issued, then NHS Leicester City Clinical Commissioning Group as Co-ordinating Commissioner may withhold up to 2% of all the monthly sums payable by it under Service Condition until agreement is achieved.

21
7.2 62 Day Cancer Performance A contract query notice was raised by the commissioners on the 7th May 2013 with regards to non-achievement of the 62 day cancer performance. UHL has submitted a recovery plan and trajectory which was formally accepted by the commissioner on the 9th July 2013. The consequences of missing the national standard for Quarter 1 has resulted in an automatic financial penalty of £50,000 to be repaid on recovery of the cumulative performance to 85%. The commissioner has offered of non-recurrent support to help the Trust sustainably resolve issues affecting cancer with a joint meeting arranged to discuss this on 12 August 2013.
7.3 18 Weeks RTT A contract query notice was raised by the commissioners on the 14th June with regards to non- achievement of 18 Week Referral to Treatment performance in April. UHL are required to work on credible plans for backlog reduction that demonstrate associated timescales and impact on performance.
After further discussion with the commissioners the deadline for developing action plans has been extended. There will be recovery plans for Ophthalmology, ENT (Adult and Paediatrics), Orthopaedics and General Surgery.
7.4 Stroke Performance
A contract query notice was raised by the commissioners on the 28th June in relation to commissioner concerns with UHL’s performance against the qualitative and quantitative stroke metrics raised over recent months. A remedial action plan was submitted to commissioners by the agreed deadline of the 12th July. The plan is being reviewed by commissioners.
7.5 Pressure Ulcers A contract query notice was raised by commissioners on the 10th July in relation to commissioners concern with UHL’s performance against the qualitative Pressure Ulcer performance metrics over recent months. Although these matters have been discussed at the Clinical Quality Review Group and latterly at the Contract Performance Meetings, commissioners require further assurances regarding UHL’s ability to meet the avoidable grade 2, 3 & 4 pressure ulcer zero tolerance target. The deadline for submitting the final remedial action plan is the 25th July.

Group
Friends & Family score is calculated as : % promoters minus % detractors.
((promoters-detractors)/(total responses-‘don’t know’ responses))*100
Patients to be surveyed:
- Adult Acute Inpatients (who have stayed at least one night in hospital)
Extemely Likely Promoter
Appendix 1 - Friends & Families Test
What is the Friends & Family test?
The Friends & Family score is obtained by asking patients a single question, "How likely are you to recommend
our <ward/A&E department> to friends and family if they needed similar care or treatment"
Patients can choose from one of the following answers:
Answer
Likely Passive
Neither likely or
unlikely
Detractor
Unlikely Detractor
Extremely Unlikely Detractor
Don't Know Excluded
- Adult Acute Inpatients (who have stayed at least one night in hospital)
- Adult patients who have attended A&E and left without being admitted to hospital or were
transferred to a Medical Assesment Unit and then discharged
Exceptions:
- Daycases
- Maternity Service Users
- Outpatients
- Patients under 16 yrs old
Response Rate:
Current methods of collection:
• Paper survey
• Online : either via web-link or email
• Kiosks
• Hand held devices
It is expected that responses will be received from at least 15% of the Trusts survey group - this will
increase to 20% by the end of the financial year

Jan-13 Feb-13 Mar-13 Apr-13 May-13 Jun-13Total
ResponsesPromoters Passives Detractors Score
GH WD 15 40 67 80 55 - 100 30 30 0 0 100
GH WD 16 Respiratory Unit 92 93 76 88 69 74 19 14 5 0 74
GH WD 17 0 42 100 - - 65 17 12 4 1 65
GH WD 20 60 56 67 - 73 61 38 25 11 2 61
GH WD 23A - 93 - 65 76 100 29 28 0 0 100
GH WD 24 - 90 81 75 87 94 16 15 1 0 94
GH WD 27 44 79 42 - - 66 35 23 12 0 66
GH WD 28 100 86 85 79 85 88 18 15 2 0 88
GH WD 29 EXT 3656 21 19 5 13 1 21
GH WD 31 88 93 100 - 79 79 19 16 2 1 79
GH WD 32 100 50 91 74 85 83 29 26 1 2 83
JUNE SCORE BREAKDOWN
FRIENDS AND FAMILY TEST - January - June '13
GLENFIELD HOSPITAL
GH WD 32 100 50 91 74 85 83 29 26 1 2 83
GH WD 33 77 50 75 85 84 79 28 22 6 0 79
GH WD 33A 77 77 68 94 86 21 18 3 0 86
GH WD Coronary Care Unit 72 72 90 84 86 90 58 52 6 0 90
GH WD Clinical Decisions Unit 86 62 43 48 75 65 58 40 14 3 65
GLENFIELD HOSPITAL

Jan-13 Feb-13 Mar-13 Apr-13 May-13 Jun-13Total
ResponsesPromoters Passives Detractors Score
LGH WD 10 38 71 0 100 48 60 10 6 4 0 60
LGH WD 14 69 82 80 77 71 83 35 29 6 0 83
LGH WD 15A HDU Neph 100 50 4 2 2 0 50
LGH WD 15N Nephrology 43 -75 0 75 8 3 1 0 75
LGH WD 16 71 59 68 67 88 95 21 20 1 0 95
LGH WD 17 Transplant 55 68 100 75 92 84 31 26 5 0 84
LGH WD 19 68 67 67 79 63 59 32 20 11 1 59
LGH WD 22 8 21 25 42 95 45 30 15 12 2 45
LGH WD 23 53 36 21 13 2 53
LGH WD 26 SAU 40 60 100 0 45 52 65 36 24 3 52
LGH WD 27 - 67 42 83 89 57 22 13 7 1 57
FRIENDS AND FAMILY TEST - January - June '13
JUNE SCORE BREAKDOWN
LEICESTER GENERAL HOSPITAL
LGH WD 27 - 67 42 83 89 57 22 13 7 1 57
LGH WD 28 Urology -19 0 33 45 22 55 31 20 5 4 55
LGH WD 31 60 86 54 - 90 79 28 25 0 3 79
LGH WD 8 (Closed) 0 100 33 7 2 4 0 33
LGH WD 29 EMU Urology 70 -13 70 -30 54 50 54 31 16 5 50
LGH WD Young Disabled 75 100 100 2 2 0 0 100
LEICESTER GENERAL HOSPITAL

Jan-13 Feb-13 Mar-13 Apr-13 May-13 Jun-13Total
ResponsesPromoters Passives Detractors Score
LRI WD 7 Bal L3 41 70 70 65 73 70 30 21 9 0 70
LRI WD 17 Bal L5 0 36 - 0 57 -9 11 2 6 3 -9
LRI WD 19 Bal L6 100 61 44 60 5 21 5 11 4 5
LRI WD 21 Bal L6 67 90 86 88 89 91 22 20 2 0 91
LRI WD 22 Bal 6 43 58 16 38 52 48 24 13 8 2 48
LRI WD 23 Win L3 76 63 75 85 95 83 18 16 1 1 83
LRI WD 24 Win L3 83 67 31 58 67 47 17 8 9 0 47
LRI WD 25 Win L3 100 87 100 95 95 60 20 13 6 1 60
LRI WD 26 Win L3 88 69 91 92 75 58 19 12 6 1 58
LRI WD 27 Win L4 - 83 50 60 100 33 3 1 2 0 33
FRIENDS AND FAMILY TEST - January - June '13
JUNE SCORE BREAKDOWN
LEICESTER ROYAL INFIRMARY
LRI WD 27 Win L4 - 83 50 60 100 33 3 1 2 0 33
LRI WD 29 Win L4 42 73 58 61 100 65 20 14 5 1 65
LRI WD 31 Win L5 82 80 - - 70 48 23 11 12 0 48
LRI WD 32 Win L5 0 33 - 86 73 43 7 3 4 0 43
LRI WD 33 Win L5 59 20 43 71 67 58 19 13 4 2 58
LRI WD 36 Win L6 68 50 20 20 61 0 20 5 9 5 0
LRI WD 37 Win L6 -41 22 38 68 86 90 21 19 2 0 90
LRI WD 38 Win L6 91 40 19 94 100 100 33 33 0 0 100
LRI WD 39 Osb L1 61 71 56 70 89 88 26 23 3 0 88
LRI WD 40 Osb L1 -17 32 79 88 89 81 28 22 5 0 81
LRI WD 41 Osb L2 67 60 27 42 50 47 19 10 8 1 47
LRI WD Bone Marrow 0 33 0 100 88 0 2 0 2 0 0
LRI WD Fielding John Vic L1 67 0 - - - 60 20 13 6 1 60
LRI WD GAU Ken L1 50 50 59 - 65 70 30 22 7 1 70
LRI WD IDU Infectious Diseases 48 73 73 65 67 69 14 9 4 0 69
LRI WD Kinmonth Unit Bal L3 73 59 69 65 68 80 20 16 4 0 80
LRI WD Osborne Assess Unit 65 74 68 88 88 25 22 3 0 88
Ward RRAU 40 33 31 49 15 34 0 31
LRI WD 8 SAU Bal L3 45 18 42 35 51 70 33 25 6 2 70
Ward RSSA 52 88 58 47 29 13 3 58
LEICESTER ROYAL INFIRMARY

Jan-13 Feb-13 Mar-13 Apr-13 May-13 Jun-13Total
ResponsesPromoters Passives Detractors Score
ED - Majors - - - 35 45 42 187 104 53 27 42
ED - Minors - - - 38 37 64 641 436 170 29 64
ED - (not stated) - - - 64 60 60 52 32 19 1 60
Emergency Decisions Unit (EDU) - - - 33 - - - - - - -
Eye Casualty - - - 65 75 70 147 108 30 7 70
FRIENDS AND FAMILY TEST - January - June '13
JUNE SCORE BREAKDOWN
EMERGENCY
DEPARTMENT
Appendix 2 - Nurse to bed ratios by ward
CBU Cost centre description No. of beds
Actual
worked
WTEs(per
finance
ledger)
Actual
worked by
shift fill
Including
bank wtes
Including
agency wtes
Budgeted
Nurse to
bed ratio
Actual
Nurse to
bed ratio
Accuity
ward type
April 13
RAG Rating
March 13
RAG Rating
Budgeted
Qualified
%age
Budgeted
Unqualified
%age
Cardiac Renal & Respiratory CbuWard 15 30 36.02 0.74 0.00 1.27 1.20 Base 60.4% 39.6%
Cardiac Renal & Respiratory CbuWard 16 30 38.56 2.80 0.00 1.20 1.29 Base 63.4% 36.6%
Cardiac Renal & Respiratory CbuWard 17 - Respiratory 30 37.09 1.52 0.00 1.29 1.24 Base 68.4% 31.6%
Cardiac Renal & Respiratory CbuWard 27 27 29.66 0.12 0.23 1.15 1.10 Base 61.9% 38.1%
Cardiac Renal & Respiratory CbuCoronary Care Unit - Ggh 19 51.05 0.15 0.00 2.75 2.69 Specialist 75.6% 24.4%
Cardiac Renal & Respiratory CbuClin Dec. Unit - Ward 19 Ggh 25 85.33 2.45 0.00 3.83 3.41 HDU 62.9% 37.1%
Cardiac Renal & Respiratory CbuWard 28 - Cardio 31 29.64 39.64 11.58 0.07 1.10 1.28 Base 60.0% 40.0%
Cardiac Renal & Respiratory CbuWard 33 29 31.72 0.99 0.52 1.16 1.10 Base 70.1% 29.9%
Cardiac Renal & Respiratory CbuWard 32 17 17.95 25.95 9.41 0.53 1.17 1.06 Base 74.8% 25.2%
Cardiac Renal & Respiratory CbuWard 33a 20 26.72 2.22 0.08 1.30 1.34 Base 64.3% 35.7%
Cardiac Renal & Respiratory CbuWard 31 34 39.80 1.64 0.00 1.29 1.17 Base 76.9% 23.1%
Cardiac Renal & Respiratory CbuWard 26 15 29.15 0.24 0.00 2.05 1.94 Specialist 76.5% 23.5%
Cardiac Renal & Respiratory CbuWard 23a 17 20.68 1.26 1.04 1.34 1.22 Base 63.2% 36.8%
Cardiac Renal & Respiratory CbuWard 29 - Resp 25 24.88 29.88 8.05 0.00 1.20 1.20 Base 61.2% 38.8%
Cardiac Renal & Respiratory CbuWard 15 High Dependency 9 26.49 0.86 0.12 2.99 2.94 HDU 85.5% 14.5%
Cardiac Renal & Respiratory CbuWard 15 Nephrology 18 27.20 1.47 0.00 1.73 1.51 Specialist 62.5% 37.5%
Cardiac Renal & Respiratory CbuWard 10 Capd 18 37.66 0.00 0.00 2.18 2.09 Specialist 60.3% 39.7%
Cardiac Renal & Respiratory CbuWard 17 - Capd 14 20.57 0.91 0.00 1.40 1.47 Specialist 70.5% 29.5%
Emergency Medicine Cbu Admissions Unit (15/16) Lri 56 101.82 5.38 11.51 1.87 1.82 Specialist 63.2% 36.8%
Emergency Medicine Cbu Ward 33 LRI 26 41.11 9.36 2.00 1.26 1.58 Specialist 60.0% 40.0%
Emergency Medicine Cbu Emergency Decisions Unit Lri 16 19.85 1.50 2.50 1.63 1.24 Specialist 64.3% 35.7%
Specialty Medicine Cbu Odames Day Unit 10 16.83 0.11 0.00 1.65 1.68 Specialist 75.2% 24.8%
Specialty Medicine Cbu Ward 24 Lri 24 35.99 1.48 0.85 1.60 1.50 Specialist 60.0% 40.0%
Specialty Medicine Cbu Ward 36 Lri 24 28.35 3.10 1.51 1.58 1.18 Base 60.0% 40.0%
Specialty Medicine Cbu Ward 31 Lri - Med 30 37.36 2.17 0.44 1.43 1.25 Base 60.0% 40.0%
Specialty Medicine Cbu Ward 37 Lri 28 31.53 4.04 0.74 1.48 1.13 Base 60.0% 40.0%
Specialty Medicine Cbu Ward 23 Lri 28 36.74 6.23 0.41 1.30 1.31 Base 60.0% 40.0%
Specialty Medicine Cbu Ward 38 Lri 28 37.24 5.71 1.19 1.33 1.33 Base 60.0% 40.0%
Specialty Medicine Cbu Infectious Diseases Unit 18 23.55 2.10 0.65 1.34 1.31 Base 60.0% 40.0%
Specialty Medicine Cbu Ward 19 Lri 18 38.09 1.46 4.69 2.48 2.12 Base 60.0% 40.0%
Per finance ledger

Appendix 2 - Nurse to bed ratios by ward
CBU Cost centre description No. of beds
Actual
worked
WTEs(per
finance
ledger)
Actual
worked by
shift fill
Including
bank wtes
Including
agency wtes
Budgeted
Nurse to
bed ratio
Actual
Nurse to
bed ratio
Accuity
ward type
April 13
RAG Rating
March 13
RAG Rating
Budgeted
Qualified
%age
Budgeted
Unqualified
%age
Per finance ledger
Specialty Medicine Cbu Ward 2 Lgh 24 35.32 0.25 34.07 0.00 1.47 Base 60.0% 40.0%
Specialty Medicine Cbu Ward 8 Lgh 15 23.58 1.84 0.00 1.62 1.57 Specialist 60.0% 40.0%
Specialty Medicine Cbu Stroke Unit - Ward 25 & 26 Lri 36 54.34 3.99 1.10 1.67 1.51 Specialist 62.3% 37.7%
Specialty Medicine Cbu Ydu Wakerley Lodge Lgh 8 19.24 0.45 0.00 2.40 2.41 Specialist 60.0% 40.0%
Specialty Medicine Cbu Brain Injury Unit Lgh 7 21.38 1.51 0.72 3.21 3.05 Specialist 60.0% 40.0%
Specialty Medicine Cbu Fielding Johnson - Medicine 20 27.57 11.82 3.26 1.38 1.38 Base 60.0% 40.0%
Specialty Medicine Cbu Ward 34 Lri 21 35.19 3.71 0.68 1.60 1.68 Specialist 60.0% 40.0%
Cancer Haem & Onc Cbu Onc Ward East 19 22.40 0.65 0.27 1.21 1.18 Base 65.8% 34.2%
Cancer Haem & Onc Cbu Osbourne Assessment Unit 6 9.31 1.15 0.09 1.64 1.55 Base 67.0% 33.0%
Cancer Haem & Onc Cbu Onc Ward West 19 24.12 0.52 0.07 1.19 1.27 Base 72.5% 27.5%
Cancer Haem & Onc Cbu Haem Ward 22 27.97 1.70 0.07 1.37 1.27 Specialist 71.5% 28.5%
Cancer Haem & Onc Cbu Bmtu 5 12.02 0.52 0.00 3.04 2.40 HDU 96.7% 3.3%
Gi Medicine Surgery Cbu Ward 29 Lri 28 34.00 0.47 1.00 0.00 1.21 Base 60.0% 40.0%
Gi Medicine Surgery Cbu Ward 30 Lri 30 34.63 0.88 2.00 0.00 1.15 Base 60.0% 40.0%
Gi Medicine Surgery Cbu Ward 26 Lgh 25 22.47 29.47 9.01 0.00 1.07 1.18 Base 65.7% 34.3%
Gi Medicine Surgery Cbu Sau - Lri 30 38.36 1.14 0.00 1.33 1.28 Base 56.3% 43.7%
Gi Medicine Surgery Cbu Ward 22 - Lri 30 37.44 0.11 5.00 1.19 1.25 Base 63.3% 36.7%
Gi Medicine Surgery Cbu Ward 27 - Lgh 20 24.87 22.11 10.73 0.00 1.24 1.20 Base 62.1% 37.9%
Gi Medicine Surgery Cbu Ward 29 - Lgh 27 32.01 0.59 0.00 1.43 1.19 Base 58.1% 41.9%
Gi Medicine Surgery Cbu Ward 22 - Lgh 20 25.17 0.41 0.00 1.31 1.26 Base 61.8% 38.2%
Gi Medicine Surgery Cbu Ward 28 - Lgh 25 34.11 1.92 0.00 1.34 1.36 Base 62.4% 37.6%
Gi Medicine Surgery Cbu Ward 20 - Lgh 20 24.54 3.16 0.00 1.24 1.23 Base 60.8% 39.2%
Gi Medicine Surgery Cbu Sacu - Lgh 6 17.13 0.60 0.00 2.71 2.86 Specialist 68.5% 31.5%
Itaps Cbu Itu Lri 15 91.40 0.07 1.20 7.57 6.09 ITU 90.3% 9.7%
Itaps Cbu Itu Lgh 8 54.79 0.21 0.00 7.46 6.85 ITU 95.2% 4.8%
Itaps Cbu Itu Gh 19 116.07 0.00 0.00 6.93 6.11 ITU 92.7% 7.3%
Musculo Skeletal Cbu Ward 17 Lri 30 42.27 1.13 0.70 1.40 1.41 Base 57.5% 42.5%
Musculo Skeletal Cbu Ward 18 Lri 30 38.51 1.70 0.00 1.27 1.28 Base 55.8% 44.2%
Musculo Skeletal Cbu Ward 32 Lri 24 38.73 1.26 0.44 1.62 1.61 Base 56.9% 43.1%
Musculo Skeletal Cbu Ward 19 Lgh 24 26.48 24.23 0.40 0.15 1.10 1.04 Base 60.2% 39.8%

Appendix 2 - Nurse to bed ratios by ward
CBU Cost centre description No. of beds
Actual
worked
WTEs(per
finance
ledger)
Actual
worked by
shift fill
Including
bank wtes
Including
agency wtes
Budgeted
Nurse to
bed ratio
Actual
Nurse to
bed ratio
Accuity
ward type
April 13
RAG Rating
March 13
RAG Rating
Budgeted
Qualified
%age
Budgeted
Unqualified
%age
Per finance ledger
Musculo Skeletal Cbu Ward 14 Lgh 20 21.90 0.15 0.00 1.10 1.10 Base 60.0% 40.0%
Specialist Surgery Cbu Ward 7 - Lri 30 28.49 36.49 10.25 0.35 1.00 1.22 Base 58.2% 41.8%
Specialist Surgery Cbu Kinmouth Unit 14 24.48 2.69 0.11 1.81 1.75 Specialist 65.7% 34.3%
Specialist Surgery Cbu Ward 21 - Lri 22 26.56 1.26 0.00 1.53 1.21 Base 61.5% 38.5%
Specialist Surgery Cbu Ward 23 - Ggh 14 17.15 0.14 0.00 1.13 1.23 Base 67.1% 32.9%
Childrens Cbu Childrens Ward 30 13 17.11 0.11 0.00 1.32 1.32 Base 84.6% 15.4%
Childrens Cbu Paediatric Itu 6 41.06 0.21 0.00 6.78 6.84 ITU 100.0% 0.0%
Childrens Cbu Ward 11 12 23.79 0.12 0.00 2.33 1.98 Specialist 64.6% 35.4%
Childrens Cbu Ward 12 5 22.53 0.05 0.00 5.40 4.51 HDU 86.7% 13.3%
Childrens Cbu Children'S Intensive Care Unit 6 41.56 0.00 5.50 6.30 6.93 ITU 94.4% 5.6%
Childrens Cbu Children'S Admissions Unit 9 23.62 0.00 0.00 2.51 2.62 Specialist 63.9% 36.1%
Childrens Cbu Ward 27 - Childrens 9 22.37 0.00 0.00 2.55 2.49 Specialist 86.3% 13.7%
Childrens Cbu Ward 28 - Childrens 14 19.08 0.85 0.00 1.83 1.36 Specialist 73.2% 26.8%
Childrens Cbu Ward 10 14 20.47 0.00 0.00 1.74 1.46 Specialist 65.2% 34.8%
Childrens Cbu Ward 14 19 28.03 0.00 0.00 1.47 1.48 Specialist 70.4% 29.6%
Womens Cbu Neo-Natal Unit (Lri) 24 85.94 0.00 0.00 3.79 3.58 HDU 86.4% 13.6%
Womens Cbu N.I.C.U. (Lgh) 12 28.81 0.00 0.00 2.72 2.40 HDU 64.3% 35.7%
Womens Cbu Ward 5 Obstetrics (Lri) 26 43.02 0.00 0.00 1.53 1.65 Specialist 59.5% 40.5%
Womens Cbu Ward 6 Obstetrics (Lri) 26 44.32 0.00 0.00 1.64 1.70 Specialist 63.0% 37.0%
Womens Cbu Lgh Delivery Suite & Ward 30 32 103.18 0.00 0.00 3.53 3.22 HDU 76.2% 23.8%
Womens Cbu Gau 20 26.29 0.60 0.10 1.45 1.31 Base 67.1% 32.9%
Womens Cbu Lgh Ward 31 Gynae 21 28.23 0.17 0.00 1.33 1.34 Base 59.7% 40.3%

Appendix 3
University Hospitals of Leicester NHS Trust Ward Summary May 2013
Wards Identified Where Nursing Establishment Does Not Reach Minimum Nurse to Bed Ratios
Division/Location Speciality Bed Capacity
Health-Check Data Issue Action
Planned Care LGH Ward 19
MusculoSkeletal 24 Harm Free Rate =100% Net Promoter = 79% Nursing Metrics = Green Complaints = 2
1 wte waiting to start 1.5 HCA vacancies
• Recruitment 1wte HCA vacant, MSK are part of the planned recruitment programme
• 1wte RN waiting to start
• Establishment review in process, via Matron, Lead Nurse and GM to ensure establishment is set at correct level.
• Ward will be reducing bed capacity from 24 to 17 beds as some stage this year, therefore establishment review is essential.
• Matron ensures movement of staff internally maintain a daily N2Bed ratio of 1.1.
RISK RATING = GREEN
RN Recruitment Update, 57 RN’s in process and waiting to start from recent recruitment days. 9 Adverts were placed for RN’s on 3rd
June 2013 with a closing date of 16
th June. 83 HCA recruited in May and in process.
All Divisions attending RCN Jobs Fair in Manchester July 2nd and 3rd. Key NET Promoter = bottom ten lowest scoring areas Nursing metrics = 5 or more areas below green ( 90%) Complaints = > 2 monthly Harm Free Rate = < 90% Overall Risk Key Red = staffing risk red, plus more than two other key performance indicators Amber = staffing risk red, plus up to two other key performance indicators Green = staffing risk red

Page | 1
Appendix 4 - OPERATIONAL PERFORMANCE EXCEPTION REPORT
REPORT TO: TRUST BOARD
DATE: JULY 2013 REPORT BY: RICHARD MITCHELL, CHIEF OPERATING OFFICER AUTHOR: NIGEL KEE, DIVISIONAL MANAGER, PLANNED CARE DIVISIONAL DIRECTOR: ANDREW FURLONG SUBJECT: CANCELLED OPERATIONS
1.0 Present state
The Trust is required to ensure that the percentage of operations cancelled on or after the day of admission of all elective activity for non-clinical reasons is no more than 0.8%.
June’s performance shows that the percentage of operations cancelled on/after the day of admissions of all elective activity for non-clinical reasons was 1.0% against a target of 0.8%. Performance is June was an improvement from May. A significant reason for the short notice cancellations during the month continues to be emergency medicine demand creating pressure on the bed capacity and elective bed capacity not being ‘protected’. The percentage offered a date within 28 days of the cancellation was 86.4% against a threshold of 95%.
1.0%
0.0%
0.2%
0.4%
0.6%
0.8%
1.0%
1.2%
1.4%
1.6%
1.8%
Jun-12
Jul-12
Aug-1
2
Sep-12
Oct-1
2
Nov-1
2
Dec-1
2
Jan-13
Feb-13
Mar-1
3
Apr-1
3
May-1
3
Jun-13
Operations cancelled at short notice for non-clinical reasons
Target
'Best Fit' Trend

Page | 2
The summary of reasons for these cancellations is as below which shows that there has been little improvement in the cancellations due to capacity issues since last month.
Total 'On the Day' Hospital Cancellations for Non Clinical Reason
30/04/2013 31/05/2013 30/06/2013
HOSPITAL CANCEL - HDU
BED UNAVAILABLE 4 6 11
HOSPITAL CANCEL - ITU
BED UNAVAILABLE 3 4 5
HOSPITAL CANCEL -PT
DELAYED TO ADM HIGH
PRIORITY PATIENT
12 14 12
Capacity Pressures
HOSPITAL CANCEL -
WARD BED UNAVAILABLE 61 55 22
Capacity Pressures TOTAL 80 79 50
HOSPITAL CANCEL -
CASENOTES MISSING 2 4 1
HOSPITAL CANCEL - LACK
ANAESTHETIC STAFF 3 4
HOSPITAL CANCEL - LACK
SURGEON 10 4 2
HOSPITAL CANCEL - LACK
THEATRE EQUIPMENT 1 4 2
HOSPITAL CANCEL - LACK
THEATRE STAFF 5 2
HOSPITAL CANCEL - LACK
THEATRE TIME / LIST
OVERRUN
31 34 22
Other
UNREASONABLE OFFER
TO PATIENT 1 1
Other TOTAL 45 55 33
ALL TOTAL 125 134 83
The % of cancelled patients offered a date within 28 days has not yet improved; this measure is impacted on by cancellations in the previous month. The Trust is expected to offer patients treatment at alternative providers if it is unable to meet the 28 days standard.

Page | 3
A new indicator introduced in 2013-14 requires a zero tolerance of urgent cancellations for a second time. The Trust has had no incidents of this since December 2012.
2.0 Action plan
The actions remain as in the previous report:
• The theatre transformation programme
• Additional recovery ‘chairs’ have finally been delivered and will be commissioned from July and will increase the day case capacity on the LRI site.
• Improvements are being made to data quality with regard to what’s recorded in HISS (reasons for cancelled ops).
• Very recent agreement to give back to the Division 2 bays on ward 19 (a planned care ward). This will significantly improve this performance with an expectation that the target will be delivered in August as a result.
• Proposal being finalised to install a temporary Vanguard theatre at the LGH to support activity (ahead of the ambulatory care centre development and service reconfiguration).
• Continual escalation and challenge to the Acute Division is regularly undertaken and to Duty Managers
• Reiteration of the Trust escalation policy for cancellations on the day of surgery via the daily bed management meetings
Risks:
The main risk is that the Acute Division does not keep within their agreed bed base and that elective capacity is not ‘protected’.
3.0 Date when recovery of target or standard is expected
• Operations cancelled on/after the day of admissions of all elective activity for non-clinical reasons – August 2013
• Patients offered a date within 28 days of the cancellation – September 2013
• Zero tolerance of urgent cancellations for a second time – the Trust is compliant

Page | 4
4.0 Details of senior responsible officer
Divisional Clinical Director: Mr Andrew Furlong
Divisional SRO: Nigel Kee, Divisional Manager, Planned Care
Page | 1
UNIVERSITY HOSPITALS OF LEICESTER NHS TRUST
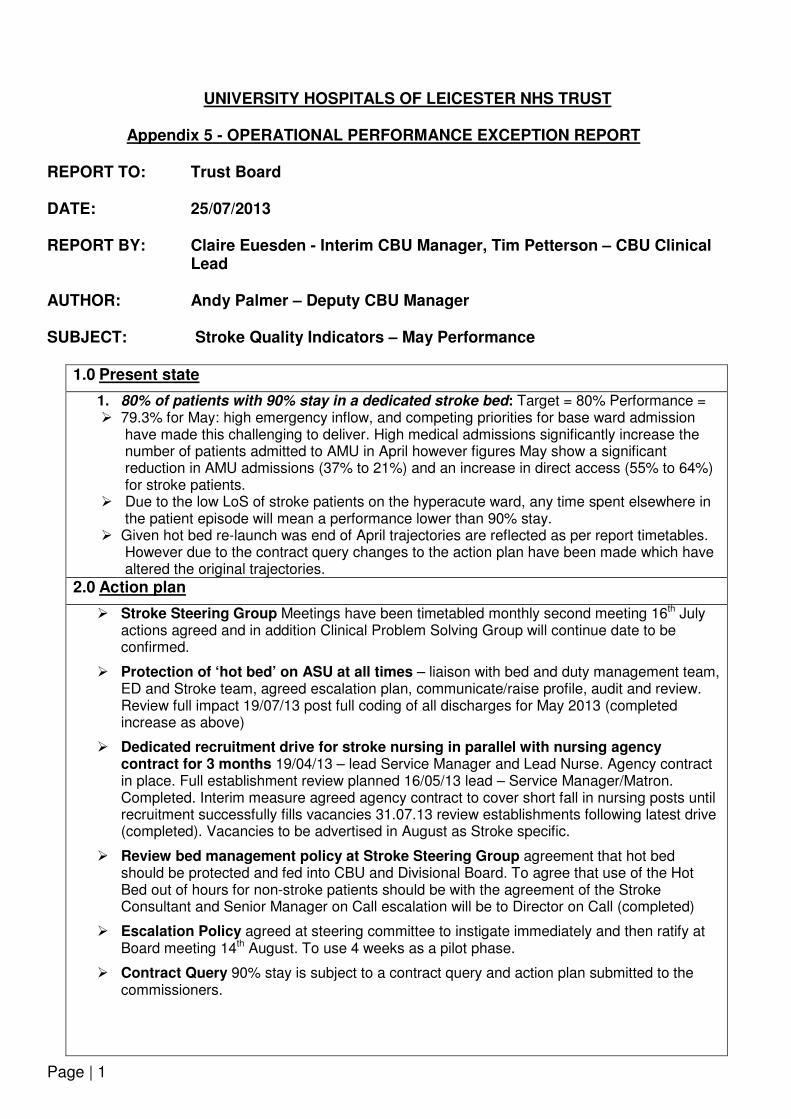
Appendix 5 - OPERATIONAL PERFORMANCE EXCEPTION REPORT
REPORT TO: Trust Board
DATE: 25/07/2013 REPORT BY: Claire Euesden - Interim CBU Manager, Tim Petterson – CBU Clinical
Lead AUTHOR: Andy Palmer – Deputy CBU Manager SUBJECT: Stroke Quality Indicators – May Performance
1.0 Present state
1. 80% of patients with 90% stay in a dedicated stroke bed: Target = 80% Performance = � 79.3% for May: high emergency inflow, and competing priorities for base ward admission
have made this challenging to deliver. High medical admissions significantly increase the number of patients admitted to AMU in April however figures May show a significant reduction in AMU admissions (37% to 21%) and an increase in direct access (55% to 64%) for stroke patients.
� Due to the low LoS of stroke patients on the hyperacute ward, any time spent elsewhere in the patient episode will mean a performance lower than 90% stay.
� Given hot bed re-launch was end of April trajectories are reflected as per report timetables. However due to the contract query changes to the action plan have been made which have altered the original trajectories.
2.0 Action plan
� Stroke Steering Group Meetings have been timetabled monthly second meeting 16th July actions agreed and in addition Clinical Problem Solving Group will continue date to be confirmed.
� Protection of ‘hot bed’ on ASU at all times – liaison with bed and duty management team, ED and Stroke team, agreed escalation plan, communicate/raise profile, audit and review. Review full impact 19/07/13 post full coding of all discharges for May 2013 (completed increase as above)
� Dedicated recruitment drive for stroke nursing in parallel with nursing agency contract for 3 months 19/04/13 – lead Service Manager and Lead Nurse. Agency contract in place. Full establishment review planned 16/05/13 lead – Service Manager/Matron. Completed. Interim measure agreed agency contract to cover short fall in nursing posts until recruitment successfully fills vacancies 31.07.13 review establishments following latest drive (completed). Vacancies to be advertised in August as Stroke specific.
� Review bed management policy at Stroke Steering Group agreement that hot bed should be protected and fed into CBU and Divisional Board. To agree that use of the Hot Bed out of hours for non-stroke patients should be with the agreement of the Stroke Consultant and Senior Manager on Call escalation will be to Director on Call (completed)
� Escalation Policy agreed at steering committee to instigate immediately and then ratify at Board meeting 14th August. To use 4 weeks as a pilot phase.
� Contract Query 90% stay is subject to a contract query and action plan submitted to the commissioners.

Page | 2
3.0 Date when recovery of target or standard is expected
Indicator Performance Trajectory 19.07.13
Performance Trajectory 19.08.13
80% of patients staying 90% of their time in a dedicated stroke bed
80% performance for July Target
82% performance for August Target
4.0 Details of senior responsible officer
Name and position of SRO
Monica Harris, Acute Divisional Manager.