true-luxury global consumer insight - upa · true-luxury global consumer insight note: markets...
TRANSCRIPT

Copyr
ight
© 2
015 b
y T
he B
osto
n C
onsultin
g G
roup,
Inc.
All
rights
reserv
ed.
True-Luxury Global Consumer Insight
Milan, February 10th, 2016
Antonio Achille, Partner & Managing Director

Copyr
ight
© 2
015 b
y T
he B
osto
n C
onsultin
g G
roup,
Inc.
All
rights
reserv
ed.
True-Luxury Global Consumer Insight
Note: Markets included: Italy, France, Germany, UK, US, China, Brazil, South Korea, Japan, Russia and Middle East
21K€+ Average spend • Top 30% spending 40K€
10.000+ Consumers
11 Markets
1
Copyr
ight
© 2
015 b
y T
he B
osto
n C
onsultin
g G
roup,
Inc.
All
rights
reserv
ed.
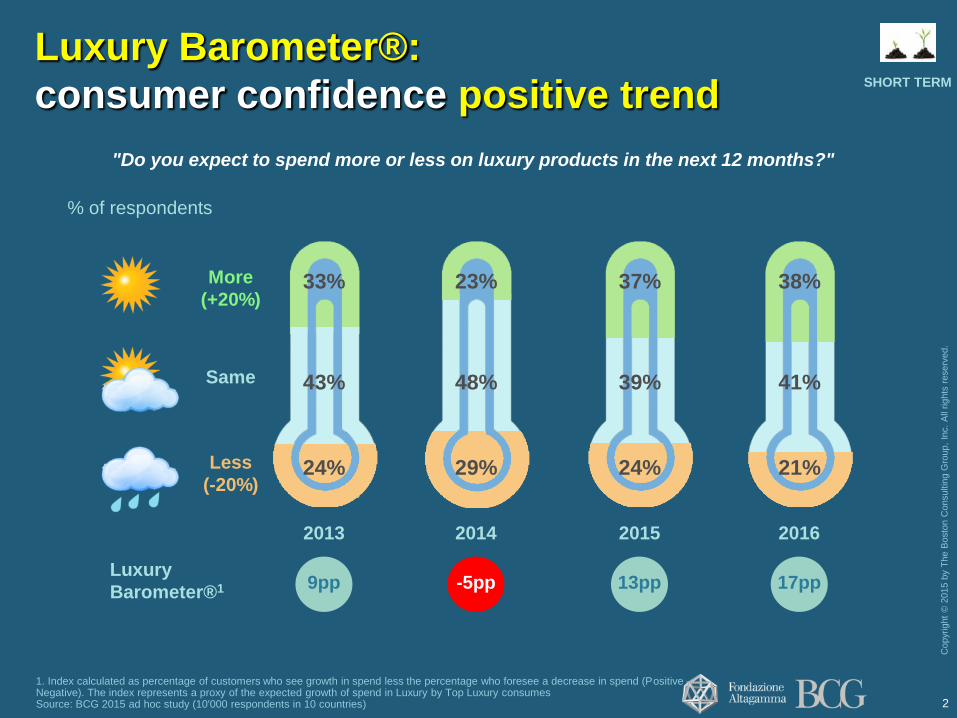
Luxury Barometer®:
consumer confidence positive trend
"Do you expect to spend more or less on luxury products in the next 12 months?"
Less
(-20%)
Same
More
(+20%)
Luxury
Barometer®1 9pp -5pp 13pp 17pp
SHORT TERM
% of respondents
2016 2015 2013
39% 41%
24% 21%
2014
23%
48%
29%
37% 38% 33%
24%
43%
1. Index calculated as percentage of customers who see growth in spend less the percentage who foresee a decrease in spend (Positive – Negative). The index represents a proxy of the expected growth of spend in Luxury by Top Luxury consumes Source: BCG 2015 ad hoc study (10'000 respondents in 10 countries) 2

Copyr
ight
© 2
015 b
y T
he B
osto
n C
onsultin
g G
roup,
Inc.
All
rights
reserv
ed.
Ultra
Beyond money
Very high
4
2
10
6
2
12
Total Top Luxury 16 20
CLUSTER 2015
# (M) Bn(€)1 Bn(€)1 # (M)
2022
Top Aspirational 20 26
Aspirational 365 435
~400
1. Including Experiential and Personal luxury, excluding cars and Yachts Note: rounded numbers Source: BCG Analysis
~480 Total Luxury
Consumers1
+4
+76
MID TERM
+80
2 k€
5 k€
20 k€
10 k€
400M Luxury Consumers in 2015
to become 480M in 2022
3

Copyr
ight
© 2
015 b
y T
he B
osto
n C
onsultin
g G
roup,
Inc.
All
rights
reserv
ed.
Ultra
Very high
4
2
10
6
2
12
Total Top Luxury 16 20
CLUSTER 2015
# (M) Bn(€)1 Bn(€)1
2022
92
50
103
245
135
90
140
365
Top Aspirational 20 26 61 86
Aspirational 365 538 684
+120
+170
~400 ~845 ~1135
+290
1. Including Experiential and Personal luxury, excluding cars and Yachts Note: rounded numbers Source: BCG Analysis
MID TERM
2 k€
5 k€
20 k€
10 k€
Personal and Experiential luxury market to
grow from today 845Bn€ to 1135Bn€ in 2022
Beyond money
Total Luxury
Consumers1
# (M)
~480
435
4

Copyr
ight
© 2
015 b
y T
he B
osto
n C
onsultin
g G
roup,
Inc.
All
rights
reserv
ed.
Evolving consumer values
Copyr
ight
© 2
015 b
y T
he B
osto
n C
onsultin
g G
roup,
Inc.
All
rights
reserv
ed.
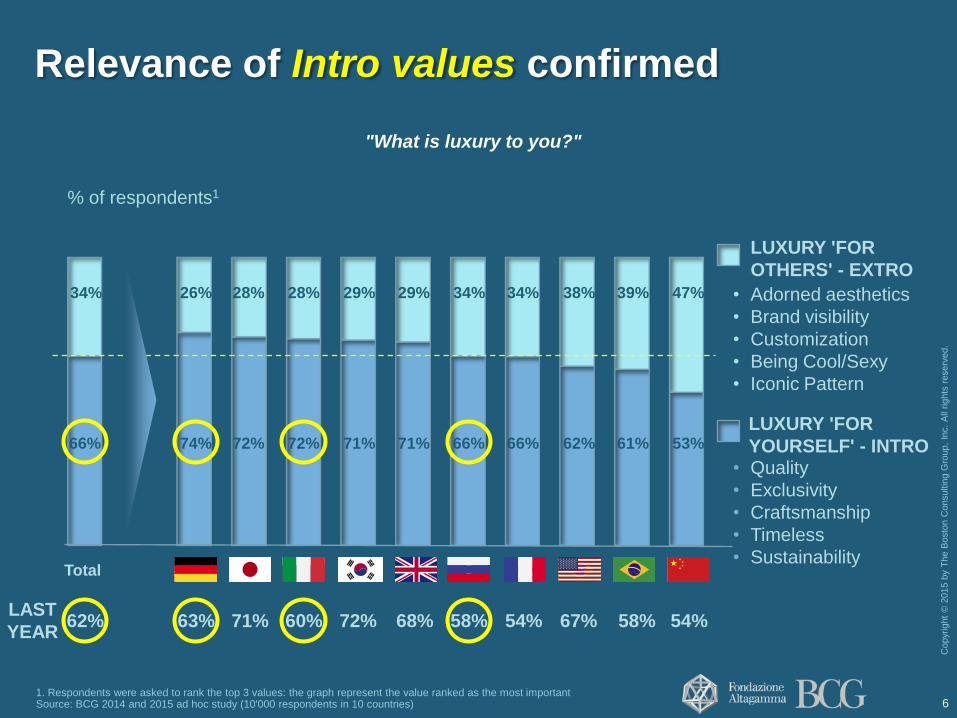
Relevance of Intro values confirmed
1. Respondents were asked to rank the top 3 values: the graph represent the value ranked as the most important Source: BCG 2014 and 2015 ad hoc study (10'000 respondents in 10 countries)
"What is luxury to you?"
% of respondents1
LUXURY 'FOR
OTHERS' - EXTRO
34% 38% 34% 28% 28% 26% 34% 29% 29% 47% 39%
66% 62% 66% 72% 72% 74% 66% 71% 71% 53% 61%
LAST
YEAR 71% 68% 67% 72% 60% 58% 54% 54% 63%
Total
58%
LUXURY 'FOR
YOURSELF' - INTRO
62%
• Adorned aesthetics
• Brand visibility
• Customization
• Being Cool/Sexy
• Iconic Pattern
• Quality
• Exclusivity
• Craftsmanship
• Timeless
• Sustainability
6

Copyr
ight
© 2
015 b
y T
he B
osto
n C
onsultin
g G
roup,
Inc.
All
rights
reserv
ed.
How to stay relevant on Intro values?
Total 2015
QUALITY
+ EXCLUSIVITY
+ CRAFTSMANSHIP
+ SUSTAINABILITY
Relevance
14%
(Other)
86%
% on respondents who have selected intro values
=
Source: BCG 2015 ad hoc study (10'000 respondents in 10 countries) 7

Copyr
ight
© 2
015 b
y T
he B
osto
n C
onsultin
g G
roup,
Inc.
All
rights
reserv
ed.
Losing exclusivity = material risk
especially for mature generations
Baby B. & Silver
(51+ yr.)
Gen. X
(36-50 yr.)
Millennials
(18-35 yr.)
32%
31%
37%
16%
68% 76% 84%
Total
Continue
buying
Stop
buying
Buy less
frequently
27%
29%
44%
73%
24%
29%
47%
21%
63%
EXCLUSIVITY
"How do you react when you perceive that a Brand is losing or has lost part of its exclusivity?"
1. % of the respondents indicating at least one brand losing / risking to lose its exclusivity Source: BCG 2015 ad hoc study (10'000 respondents in 10 countries)
% of respondents1
8

Copyr
ight
© 2
015 b
y T
he B
osto
n C
onsultin
g G
roup,
Inc.
All
rights
reserv
ed.
30% of brands at risk of losing Exclusivity
1. Analysis on top brands included in the survey with at least 200 respondents purchasing their products : ~100 brands 2.Brands losing exclusivity: brands with at least 100 respondents declaring that the brand is losing exclusivity 3. Brands with 50 to 100 respondents declaring that the brand is losing exclusivity Source: BCG 2015 ad hoc study (10'000 respondents in 10 countries))
"Is there any brand you think is losing or has lost part of its exclusivity?"
Brands not at risk Brands risking to
lose exclusivity3
Brands already
losing exclusivity2
Total brands1
28%
72%
11%
17% 100% % of top brands analyzed
EXCLUSIVITY
9

Copyr
ight
© 2
015 b
y T
he B
osto
n C
onsultin
g G
roup,
Inc.
All
rights
reserv
ed.
0%
20%
40%
60%
1. Brands that have already lost or are expected to lose exclusivity from a consumer point of view Source: BCG 2015 ad hoc study (10'000 respondents in 10 countries), company's annual reports
Size (Revenues 2015) – €Bn
Risk of losing exclusivity1 (%)
Luxury brand
EXCLUSIVITY
"Is there any brand you think is losing or has lost part of its exclusivity?"
Possible to grow without losing exclusivity?
10

Copyr
ight
© 2
015 b
y T
he B
osto
n C
onsultin
g G
roup,
Inc.
All
rights
reserv
ed.
"Which of the following situations would stop you from buying a brand?"
EXCLUSIVITY
23%
29% Fake copies
23%
27%
24%
25%
25%
23%
% of respondents
28%
26%
21%
19%
22%
23%
11%
36%
14%
19% 20%
21% 28%
22%
19%
35%
19%
31%
28%
37%
39%
31%
39%
31%
Unethical
Production
process
Inadequate
communication
Poor
distribution
Note: Multiple answer possible Source: BCG 2015 ad hoc study (10'000 respondents in 10 countries)
Total
Work on disaffection triggers
to prevent exclusivity loss
11

Copyr
ight
© 2
015 b
y T
he B
osto
n C
onsultin
g G
roup,
Inc.
All
rights
reserv
ed.
Note:1. Sustainability ranked among top 3 values (multiple answer possible) Source: BCG 2015 ad hoc study (10'000 respondents in 10 countries)
SUSTAINABILITY
"What is luxury to you?"
% of respondents who have selected Sustainability as a value
15% 17%
2013 2014 2015
8%
+5pp
+4pp
19% 17%
13%
Baby B. & Silver Gen. X Millennials
Sustainability a growing value,
especially for Millennials
12

Copyr
ight
© 2
015 b
y T
he B
osto
n C
onsultin
g G
roup,
Inc.
All
rights
reserv
ed.
Sustainability an articulated meaning for
Consumers; facade initiatives not accepted “What is more important to you about sustainability?"
Animal friendliness 30%
29%
26%
Usage of safe products
Respect of Environment
Social initiatives
29%
30%
27%
42%
48%
31%
24%
30%
44%
50%
17%
29%
33%
54%
48%
Baby B. & Silver Millennials Gen. X Total
48%
44%
Safeguard of the workers
% of respondents1
SUSTAINABILITY
Note:1. Sustainability ranked among top 3 values (multiple answer possible) Source: BCG 2015 ad hoc study (10'000 respondents in 10 countries) 13

Copyr
ight
© 2
015 b
y T
he B
osto
n C
onsultin
g G
roup,
Inc.
All
rights
reserv
ed.
"Would you be willing to pay more for a
sustainable product?"
"Would you be ready to leave a Brand
if not sustainable?"
Purchase
Booster
No
Yes
Purchase
Breaker
2
1
3
Higher quality
Positive
consideration of
my acquaintances
Safer for my health 16%
1%
IF...
7%
10%
2
1
Unethical
production
process
Non sustainable
products
No
Yes
% of respondents1
Sustainability becoming a Purchase Booster;
Might become also a Purchase Breaker?
SUSTAINABILITY
1. Only respondents for which sustainability is a value considered Source: BCG 2015 ad hoc study (10'000 respondents in 10 countries) 14

Copyr
ight
© 2
015 b
y T
he B
osto
n C
onsultin
g G
roup,
Inc.
All
rights
reserv
ed.
not yet
a clear leader on sustainable manufacturing
"Which country of manufacturing do you
consider the best for luxury products?"
"Which country do you think could become the
leader in manufacturing sustainable products?"
% of respondents for Made-In % of respondents for Sustainability
9% 6%
20%
12%
2%
16% 17% 17%
10%
3%
11%
...
40%
x2
...
15
Italy clear leader on Made-in; CRAFTSMANSHIP
+
SUSTAINABILITY
Source: BCG 2015 ad hoc study (10'000 respondents in 10 countries)

Copyr
ight
© 2
015 b
y T
he B
osto
n C
onsultin
g G
roup,
Inc.
All
rights
reserv
ed.
Millennials: the 6th continent
16

Copyr
ight
© 2
015 b
y T
he B
osto
n C
onsultin
g G
roup,
Inc.
All
rights
reserv
ed.
1. Total world population 7,2 Bn; 1,8 Bn people under 18 years old not included Source: Economist intelligence unit 2015, BCG 2014-2015 ad hoc study (10'000 respondents in 10 countries), BCG analysis
Millennials Gen. X Silver
18 - 34 Age 35 - 50 51 - 65 65+
2.300 M
(~32%)
Total #
2015 (M)1 1.500 M 1.000 M 600 M
Baby Boomers
Millennials the 6th continent: 2.3bn people
17
Copyr
ight
© 2
015 b
y T
he B
osto
n C
onsultin
g G
roup,
Inc.
All
rights
reserv
ed.
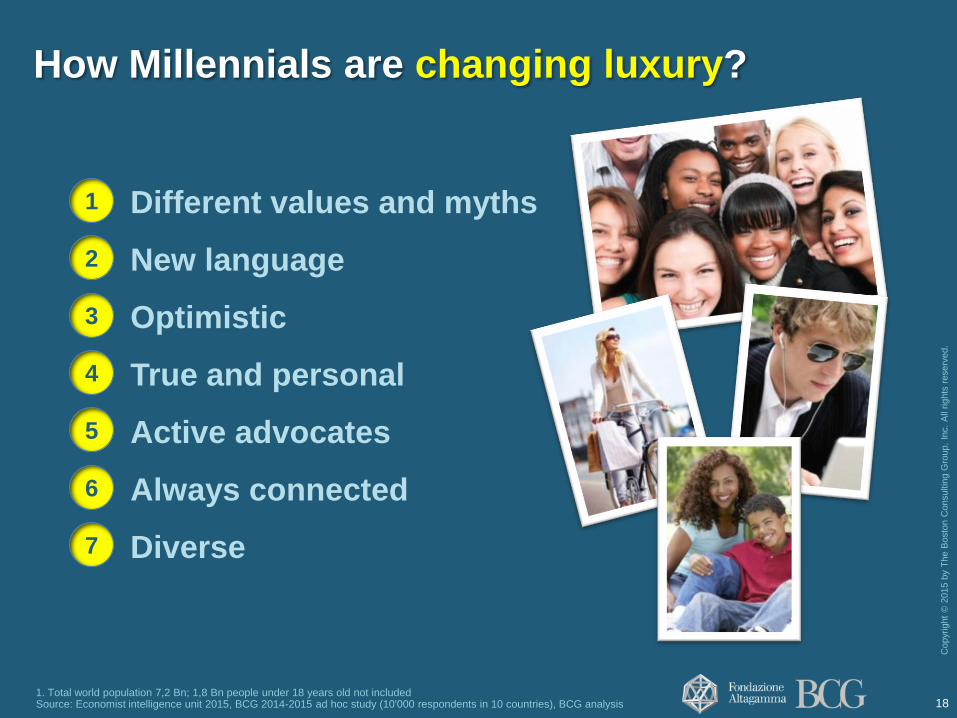
How Millennials are changing luxury?
1. Total world population 7,2 Bn; 1,8 Bn people under 18 years old not included Source: Economist intelligence unit 2015, BCG 2014-2015 ad hoc study (10'000 respondents in 10 countries), BCG analysis
Different values and myths
New language
Optimistic
True and personal
Active advocates
Always connected
Diverse
1
2
3
4
5
6
7
18
Copyr
ight
© 2
015 b
y T
he B
osto
n C
onsultin
g G
roup,
Inc.
All
rights
reserv
ed.
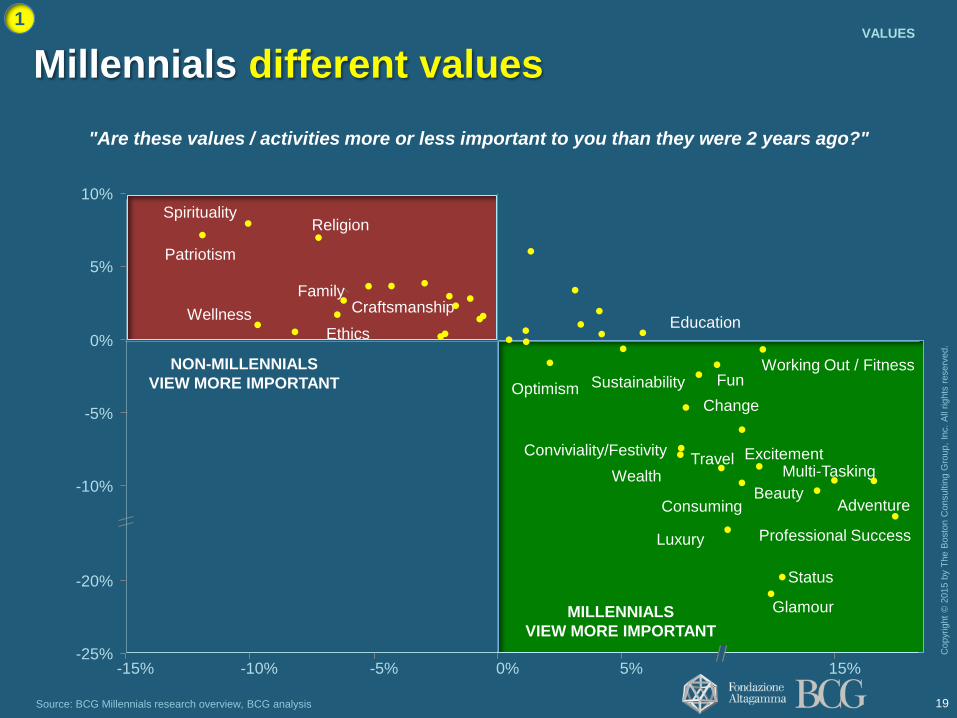
Source: BCG Millennials research overview, BCG analysis
"Are these values / activities more or less important to you than they were 2 years ago?"
Millennials different values
1 VALUES
19
10%
5%
-10%
0%
-5%
-20%
-25%
Wellness
Travel
Fun
Patriotism
Religion Spirituality
Ethics
Conviviality/Festivity
Status
Wealth
Education
Family
Working Out / Fitness
Consuming
Craftsmanship
Luxury
Change
Glamour
Beauty
Optimism
Excitement
Sustainability
Adventure
Multi-Tasking
MILLENNIALS
VIEW MORE IMPORTANT
NON-MILLENNIALS
VIEW MORE IMPORTANT
Professional Success
-10% -15% 15% 5% 0% -5%
Copyr
ight
© 2
015 b
y T
he B
osto
n C
onsultin
g G
roup,
Inc.
All
rights
reserv
ed.
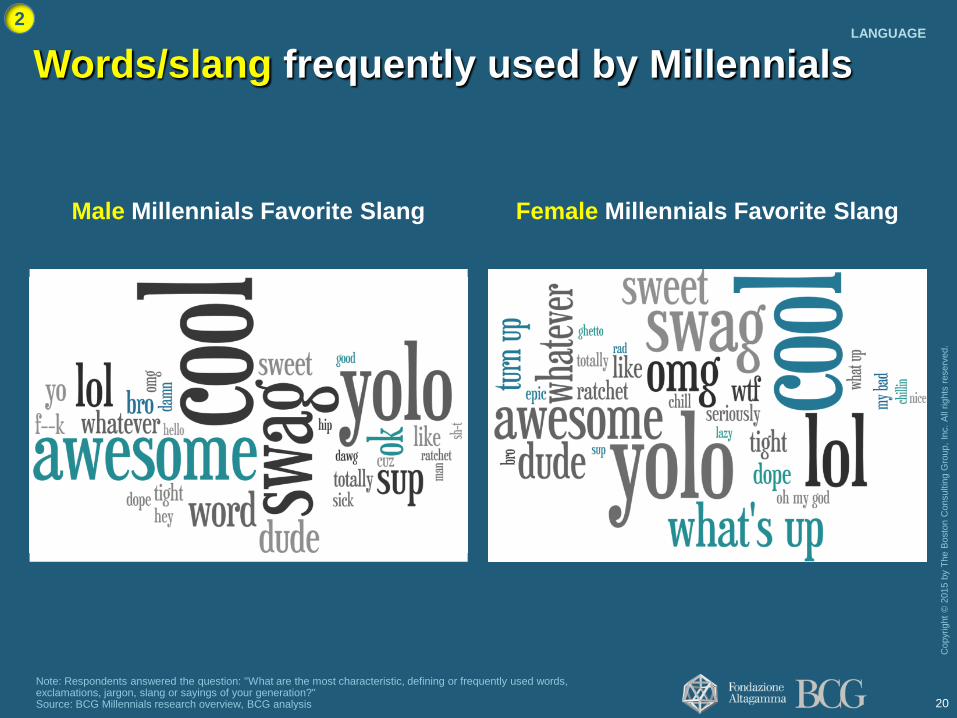
Note: Respondents answered the question: "What are the most characteristic, defining or frequently used words, exclamations, jargon, slang or sayings of your generation?" Source: BCG Millennials research overview, BCG analysis
LANGUAGE
Male Millennials Favorite Slang Female Millennials Favorite Slang
Words/slang frequently used by Millennials
2
20

Copyr
ight
© 2
015 b
y T
he B
osto
n C
onsultin
g G
roup,
Inc.
All
rights
reserv
ed.
Note: Respondents answered the question: "What are your favorite or frequently used abbreviations or so-called "text speak" (e.g. LOL, OMG)?" Source: BCG Millennials research overview, BCG analysis
LANGUAGE
Male Millennials Favorite Text-Speak Female Millennials Favorite Text-Speak
Top 10 abbreviations/text-speak
frequently used by Millennials
2
21
Copyr
ight
© 2
015 b
y T
he B
osto
n C
onsultin
g G
roup,
Inc.
All
rights
reserv
ed.
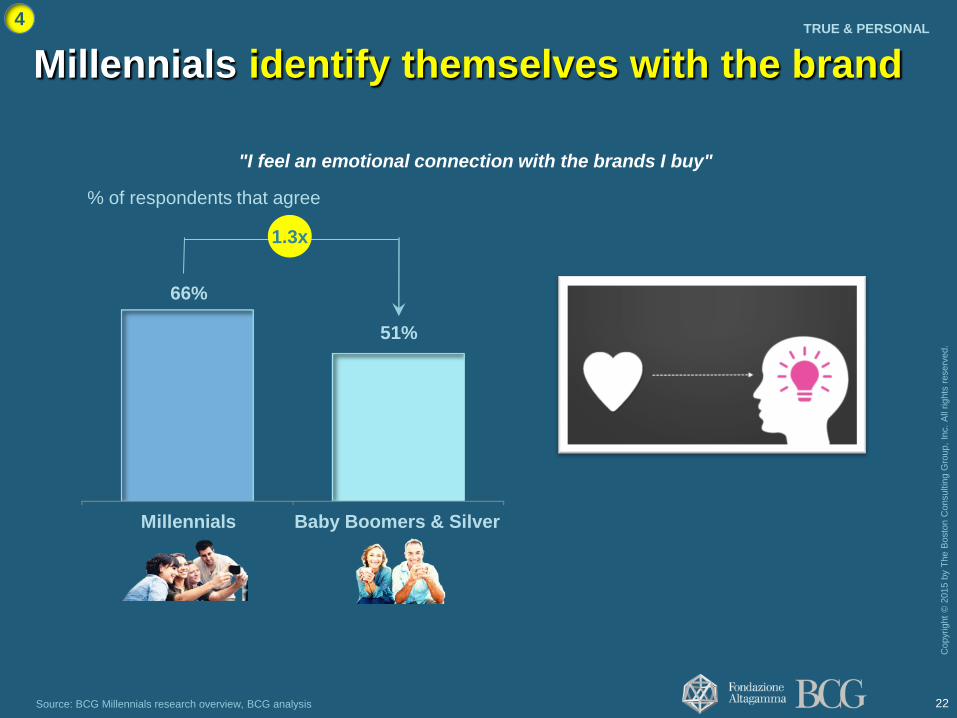
Source: BCG Millennials research overview, BCG analysis
TRUE & PERSONAL
"I feel an emotional connection with the brands I buy"
Baby Boomers & Silver
51%
Millennials
66%
% of respondents that agree
1.3x
4
Millennials identify themselves with the brand
22

Copyr
ight
© 2
015 b
y T
he B
osto
n C
onsultin
g G
roup,
Inc.
All
rights
reserv
ed.
Millennials expect a two-ways dialogue
with brands
Source: BCG 2015 ad hoc study (10.000 core luxury Consumers in 10 countries)
"Thinking to the communication opportunities offered by digital,
which ones do you value the most?"
Baby B. & Silver Gen. X Millennials
% of respondents
Avg.
42%
• Gather product info
• Access brand content
• Price & Product
comparison
One way
• Opinion sharing
• Feedback sharing
• Dialogue with brands
• Influence trends
Two-ways
ACTIVE ADVOCATES 5
23

Copyr
ight
© 2
015 b
y T
he B
osto
n C
onsultin
g G
roup,
Inc.
All
rights
reserv
ed.
8 out of 10 Millennials are active advocates
“Have you recommended a Brand in the last 12 months?"
% of respondents
Avg. 76%
Baby B. & Silver Gen. X Millennials
Advocates
when
prompted
Advocates
spontaneously
Non Advocates
5
Source: BCG 2015 ad hoc study (10.000 core luxury Consumers in 10 countries)
ACTIVE ADVOCATES
24

Copyr
ight
© 2
015 b
y T
he B
osto
n C
onsultin
g G
roup,
Inc.
All
rights
reserv
ed.
Rate products and
services on the web Upload content to the web
Have their
own website / blog
Millennials
46%
Non-Millennials
60% 60%
Millennials
29%
Non-Millennials Non-Millennials Millennials
% of respondents
2.1x 1.8x
29%
12%
1.7x
5
Millennials actively broadcast their thoughts ACTIVE ADVOCATES
Source: BCG Millennials research overview, BCG analysis 25

Copyr
ight
© 2
015 b
y T
he B
osto
n C
onsultin
g G
roup,
Inc.
All
rights
reserv
ed.
Millennials always connected
also when in store
Check prices via mobile
when in store
Look at the product
information in store
Look for coupons or
promotions online
when in store
Millennials
22%
Non-Millennials
45% 44%
Millennials
24%
Non-Millennials Non-Millennials Millennials
2.1x 1.8x
43%
25%
1.7x
6 ALWAYS CONNECTED
% of respondents
Source: BCG Millennials research overview, BCG analysis 26
Copyr
ight
© 2
015 b
y T
he B
osto
n C
onsultin
g G
roup,
Inc.
All
rights
reserv
ed.
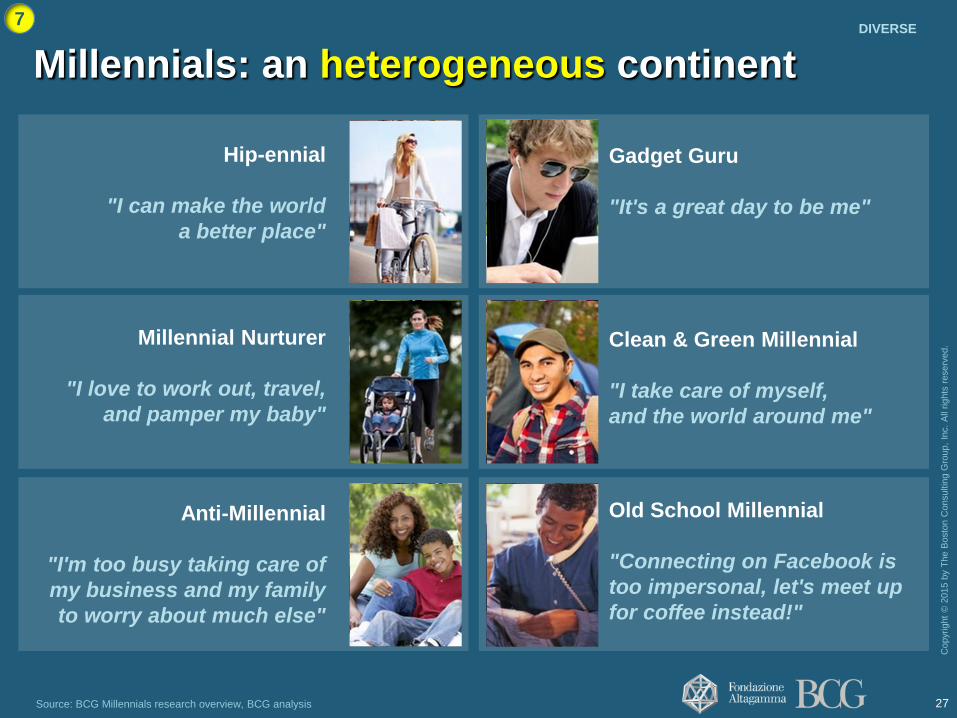
Hip-ennial
"I can make the world
a better place"
Gadget Guru
"It's a great day to be me"
Clean & Green Millennial
"I take care of myself,
and the world around me"
Old School Millennial
"Connecting on Facebook is
too impersonal, let's meet up
for coffee instead!"
Millennial Nurturer
"I love to work out, travel,
and pamper my baby"
Anti-Millennial
"I'm too busy taking care of
my business and my family
to worry about much else"
7
Millennials: an heterogeneous continent
Source: BCG Millennials research overview, BCG analysis 27
DIVERSE

Copyr
ight
© 2
015 b
y T
he B
osto
n C
onsultin
g G
roup,
Inc.
All
rights
reserv
ed.
Personal luxury saturation

Copyr
ight
© 2
015 b
y T
he B
osto
n C
onsultin
g G
roup,
Inc.
All
rights
reserv
ed.
30% of consumers at saturation point
on personal luxury
1. Question focused on handbags, shoes, dresses & suits and watches only Source: BCG 2015 ad hoc study (10'000 respondents in 10 countries)
Total No, at all
conditions
No, but I might
be tempted
Yes
28%
100%
13%
72%
15% % of respondents
"Do you plan to buy more items in the near future1?"
29

Copyr
ight
© 2
015 b
y T
he B
osto
n C
onsultin
g G
roup,
Inc.
All
rights
reserv
ed.
"Do you plan to buy more items in the near future1?"
Millennials
Baby B.
& Silver
Gen. X
1. Question focused on handbags, shoes, dresses & suits and watches only Source: BCG 2015 ad hoc study (10'000 respondents in 10 countries)
Saturation growing from shoes
to watches and with seniority
30
% of respondents declaring to be at saturation
30
50
20
40
60
Dresses and suits Watches Shoes Handbags

Copyr
ight
© 2
015 b
y T
he B
osto
n C
onsultin
g G
roup,
Inc.
All
rights
reserv
ed.
1/4 of saturated consumers willing to swap,
mainly Millennials and on Shoes and Dresses
CONSUMERS AT SATURATION ONLY2
"You told us you are NOT planning to buy more items. Would you be willing to swap your luxury items1?"
Who are the swappers? On which category? % of respondents
23% 15%
Baby B.
& Silver
Gen. X Millennials Total Watches Handbags Dresses
& Suits
Shoes
77%
23% 26% 28% 26% Yes
No
1. Question focused on handbags, shoes, dresses & suits and watches only 2. 2. Includes respondents who answered both "No” and "No but I might be tempted" Source: BCG 2015 ad hoc study (10'000 respondents in 10 countries) 31

Copyr
ight
© 2
015 b
y T
he B
osto
n C
onsultin
g G
roup,
Inc.
All
rights
reserv
ed.

Copyr
ight
© 2
015 b
y T
he B
osto
n C
onsultin
g G
roup,
Inc.
All
rights
reserv
ed.
From owning to being: ~50% of Consumers
shifting toward Experiences
Source: BCG 2015 ad hoc study (10'000 respondents in 10 countries)
"Do you have the feeling you are buying less products and more experiences in last years?"
% of respondents
Millennials Gen. X Baby B. & Silver
% of spend in
Experiential luxury
last year
Yes
45%
7%
Total
No
Keeping
same mix
Avg.
48% 53%
36% 34% 41%
6%
33

Copyr
ight
© 2
015 b
y T
he B
osto
n C
onsultin
g G
roup,
Inc.
All
rights
reserv
ed.
Store wars
MM 05.feb.16:
Store wars

Copyr
ight
© 2
015 b
y T
he B
osto
n C
onsultin
g G
roup,
Inc.
All
rights
reserv
ed.
80
100
120
140
160
180
200
220
2009 2010 2011 2012 2013 2014 2015
Hong Kong
Tokyo
London
Paris
Milan
New York
12.2
5.5
12.6
7.7
5.4
6.7
23.3
10.4
23.0
13.3
8.1
8.5
Note: Hong Kong: Causeway Bay; London: New Bond Street; New York: 5th Avenue; Paris: Champs Elizée; Tokyo: Ginza; Milan: Montenapoleone Source: Cushman and Wakefield Main Global Street; BCG analysis
Trend 2009-2015 of rent / mq cost in high luxury streets
(Index 100 = 2009) Rent/ mq (K€)
2009 2015
Rent exploding

Copyr
ight
© 2
015 b
y T
he B
osto
n C
onsultin
g G
roup,
Inc.
All
rights
reserv
ed.
Note: Analysis based on a database of more than 6.500 luxury stores in the world Source: Bernstein / BCG analysis
RoW
48% 50%
Japan
50%
100%
Americas
52% 42%
APAC
61%
47%
Europe
61%
47%
Total
49%
2015 2014
% of stores by
region
CLOSURES = OPENINGS
IN 2014
Luxury Stores closures as % of openings by geography
How to stay relevant to consumer?
How to maximize store returns?
39% 23% 21% 12% 5%
+8pp
57%
From retail rush to portfolio rationalization
36

Copyr
ight
© 2
015 b
y T
he B
osto
n C
onsultin
g G
roup,
Inc.
All
rights
reserv
ed.
Copyr
ight
© 2
015 b
y T
he B
osto
n C
onsultin
g G
roup,
Inc.
All
rights
reserv
ed.
>50% of Luxury Consumers are frequent
visitors; "Newness" key to keep interest alive
1. Multiple answer possible Source: BCG 2015 ad hoc study (10'000 respondents in 10 countries)
"How often do you visit a store
of your favorite Brand?"
"What are the key reasons for you to visit
your favorite Brand in a store?"
Once per year
Once every two
or three months
Total
Twice per year
6%
30%
Once a month 29%
A few times
a month
12%
23%
% of respondents
Buy more from brand
Need for specific item
33%
35%
New product
Reward myself 42%
43%
Peers recommendations 18%
New commercials 25%
Invited to special event 25%
Services 28%
New VM / Experience 36%
% of respondents1
52%
37
Copyr
ight
© 2
015 b
y T
he B
osto
n C
onsultin
g G
roup,
Inc.
All
rights
reserv
ed.
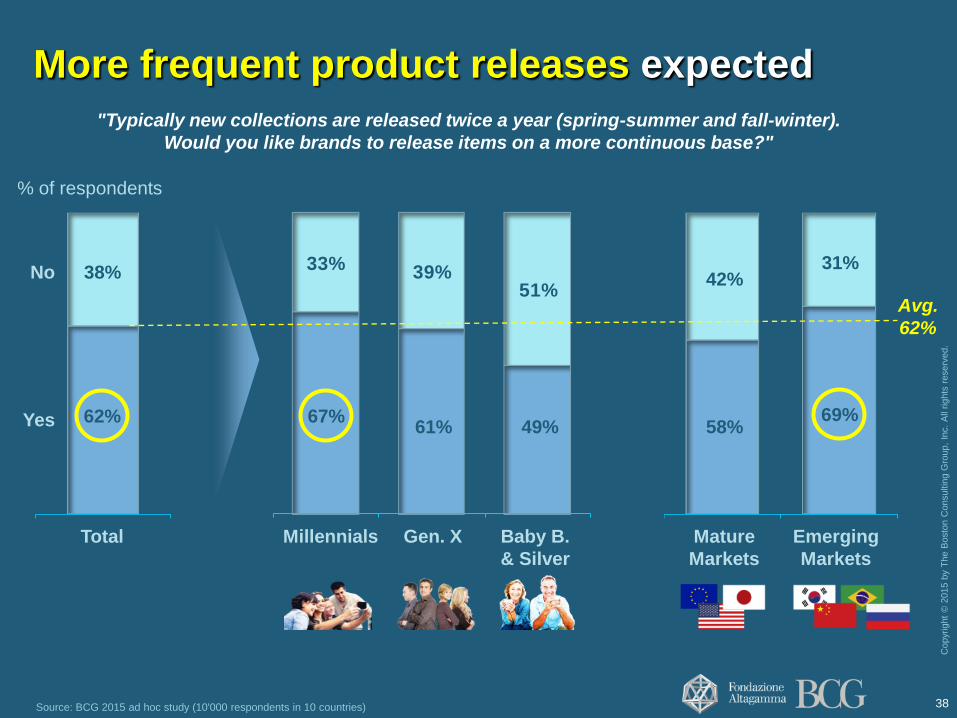
More frequent product releases expected
Source: BCG 2015 ad hoc study (10'000 respondents in 10 countries)
"Typically new collections are released twice a year (spring-summer and fall-winter).
Would you like brands to release items on a more continuous base?"
Yes
38% No
Total
% of respondents
33% 39%51%
Baby B.
& Silver
Gen. X Millennials
Avg.
62%
Emerging
Markets
31%
Mature
Markets
58%
42%
62% 67% 69% 61% 49%
38

Copyr
ight
© 2
015 b
y T
he B
osto
n C
onsultin
g G
roup,
Inc.
All
rights
reserv
ed.
From a boring box to an intriguing experience:
free tips from consumers...
Source: BCG 2015 ad hoc study (10'000 respondents in 10 countries)
"Which innovative services should your ideal store offer?"
Art & Culture
Digital in store
Possibility to buy
luxury experiences
Interest ratio (# of supporters vs. opponents)
1.8x
1.3x
1.2x
39

Copyr
ight
© 2
015 b
y T
he B
osto
n C
onsultin
g G
roup,
Inc.
All
rights
reserv
ed.
Millennials more interested in
experimenting new store realities
1. Number of supporters divided the number of opponents Source: BCG 2015 ad hoc study (10'000 respondents in 10 countries)
Gen. X Baby B.
& Silver
Millennials Total
1.3x
Total Millennials
1.2x
Gen. X Baby B.
& Silver
0.7x
Interest ratio1:
Digital In-store
Interest ratio1:
Art display & Cultural events
1.9x
1.8x 1.7x
1.5x 1.4x
"Which innovative services should your ideal store offer?"
40
Copyr
ight
© 2
015 b
y T
he B
osto
n C
onsultin
g G
roup,
Inc.
All
rights
reserv
ed.
Copyr
ight
© 2
015 b
y T
he B
osto
n C
onsultin
g G
roup,
Inc.
All
rights
reserv
ed.
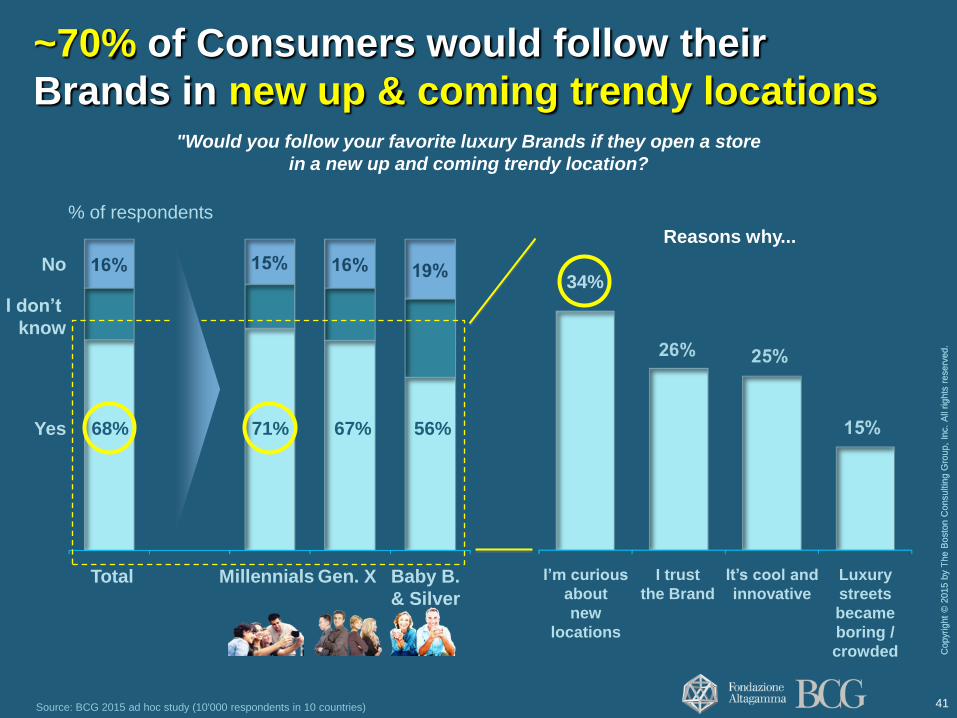
~70% of Consumers would follow their
Brands in new up & coming trendy locations
Source: BCG 2015 ad hoc study (10'000 respondents in 10 countries)
"Would you follow your favorite luxury Brands if they open a store
in a new up and coming trendy location?
Gen. X Millennials Total
Yes
I don’t
know
No
Baby B.
& Silver
% of respondents
It’s cool and
innovative
I trust
the Brand
I’m curious
about
new
locations
Luxury
streets
became
boring /
crowded
Reasons why...
68% 71% 67% 56%
34%
41

Copyr
ight
© 2
015 b
y T
he B
osto
n C
onsultin
g G
roup,
Inc.
All
rights
reserv
ed.
Copyr
ight
© 2
015 b
y T
he B
osto
n C
onsultin
g G
roup,
Inc.
All
rights
reserv
ed.
Department Stores & Wholesale rebirth?
Source: BCG 2015 ad hoc study (10'000 respondents in 10 countries)
"What was the first channel for you luxury
purchases in the past 12 months?"
"Do you have the feeling that you are purchasing
more or less frequently in Multibrand?"
CONSUMERS BUYING FROM MULTI-BRAND
Avg. 50%
Downtown duty free
Off-price and factory outlet 7%
8%
Travel Retail duty free 9%
Online websites 11%
Multi-brand 12%
Shopping malls 13%
Mono-brand 17%
High end department store 25%
No shift
More
frequently
BB &
Silver
Less
frequently
Gen.X Millennials Total
% of respondents % of respondents
50% 58% SHIFTING
FROM
MONO
BRAND
42

Copyr
ight
© 2
015 b
y T
he B
osto
n C
onsultin
g G
roup,
Inc.
All
rights
reserv
ed.
Why Department Stores & Wholesale
are winning?
"What are the main reasons for you for shifting from mono-brand stores to..."
...Multi-brand stores? ...High end Department stores?
% of respondents
19% Peers
recommendations
Product assortment 34%
Additional services1
Brands choice 45%
33%
41%
Convenient location
Saving of time
Product assortment
Brands choice
34%
26%
25%
1. E.g. food court, hair stylist, beauty spa,.. Source: BCG 2015 ad hoc study (10'000 respondents in 10 countries) 43

Copyr
ight
© 2
015 b
y T
he B
osto
n C
onsultin
g G
roup,
Inc.
All
rights
reserv
ed.
Digital: always connected
44

Copyr
ight
© 2
015 b
y T
he B
osto
n C
onsultin
g G
roup,
Inc.
All
rights
reserv
ed.
6 out of 10 luxury sales digitally influenced
Source: BCG 2015 ad hoc study (10'000 respondents in 10 countries)
"Where have you bought the last item purchased? Where have you researched it?"
Researched Online
Purchased Offline
Store solo Online solo
8
Total
100
Showrooming (viewed in store,
purchased on line)
Omnichannel
% of respondents on
last purchase
58%
100
8
45

Copyr
ight
© 2
015 b
y T
he B
osto
n C
onsultin
g G
roup,
Inc.
All
rights
reserv
ed.
Source: BCG 2015 ad hoc study (10'000 respondents in 10 countries)
"From which online store did you buy from?" " Which factors would you consider more
important when buying online?"
17%
9%
25% Online marketplace
21%
Brands website
Luxury-specialized
retailers
Dept. store website
Flash sales sites
% of respondents Δ 2015-2014
5
2
4
1
3
Price discount
Free return
Payments accepted
Quality of customer care
Navigability of website 29% -9pp
-1pp
+5pp
+3pp
+2pp
Brand websites 1st choice;
navigability key driver
46

Copyr
ight
© 2
015 b
y T
he B
osto
n C
onsultin
g G
roup,
Inc.
All
rights
reserv
ed.
~80% of consumers asking for Omnichannel
especially the youngest generations
1. % of respondents for which it is somehow important / very important / not negotiable that a brand can be reached through different channels Source: BCG 2015 ad hoc study (10'000 respondents in 10 countries)
"How important is it for you that a brand can be
reached through different channels?" "What do you expect when dealing
with multiple channels?"
Omnichannel
index1
% of respondents
Millennials Gen. X Baby B.
& Silver
Not negotiable /
Very Important
Somehow
important
Not important
Avg.
44%
Same promotions
& rewards
Integrated
delivery service
Intregrated
CRM
Same product
assortment
13%
Consistent
brand image
10%
22%
% of respondents
31%
24%
86% 84% 75%
47

Copyr
ight
© 2
015 b
y T
he B
osto
n C
onsultin
g G
roup,
Inc.
All
rights
reserv
ed.
Integrated customer journey
Source: BCG analysis
Sees dress in
magazine
advertisement
Ships dress and
receives preferred
size
Inspire Make aware
Help decide
Sell Support
Physical In store
Physical Out of store
Digital In Store
Digital Out of Store
Reward loyalty
Gets
fashion
advice from
store
personnel Checks
loyalty
balance
online
Posts review
on Twitter
Uses iPad App to
find matching
accessories
Checks
Dressfinder
App on
iPhone At home, tries on dress
& prints return label
Scans QR
code for
details
online
Uses
iPhone to
complete
purchase
Customer journey: Designer dress purchase
48
Copyr
ight
© 2
015 b
y T
he B
osto
n C
onsultin
g G
roup,
Inc.
All
rights
reserv
ed.
Price transparency Price transparency
Copyr
ight
© 2
015 b
y T
he B
osto
n C
onsultin
g G
roup,
Inc.
All
rights
reserv
ed.
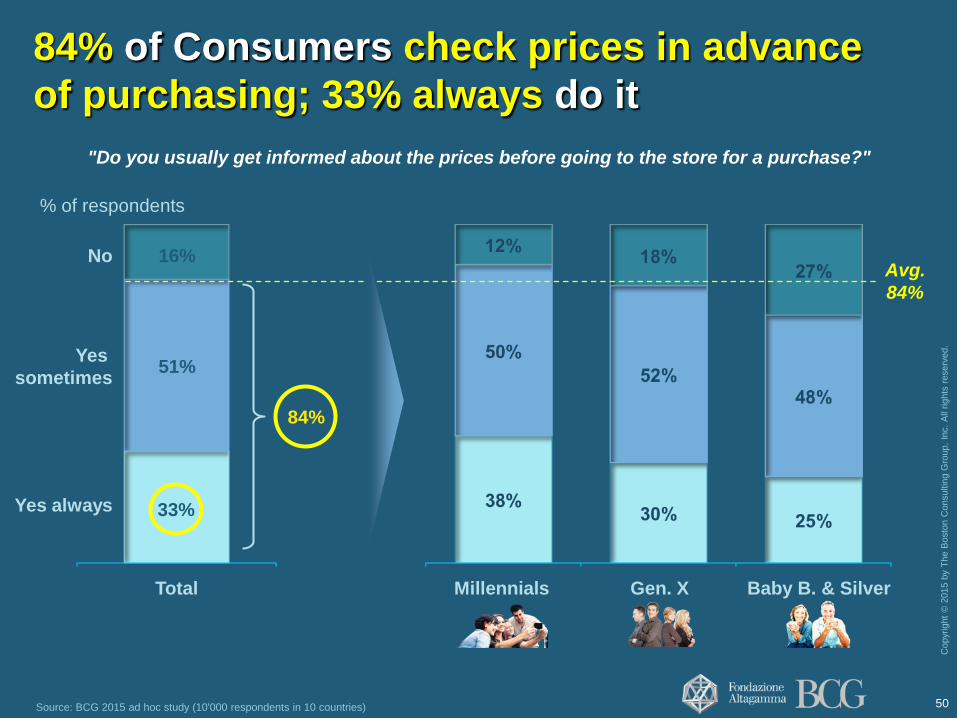
84% of Consumers check prices in advance
of purchasing; 33% always do it
Source: BCG 2015 ad hoc study (10'000 respondents in 10 countries)
"Do you usually get informed about the prices before going to the store for a purchase?"
Millennials Baby B. & Silver Gen. X
16% No
51%
Yes always
Yes
sometimes
Total
% of respondents
Avg.
84%
33%
84%
50

Copyr
ight
© 2
015 b
y T
he B
osto
n C
onsultin
g G
roup,
Inc.
All
rights
reserv
ed.
Copyr
ight
© 2
015 b
y T
he B
osto
n C
onsultin
g G
roup,
Inc.
All
rights
reserv
ed.
% of respondents
Total
6%
11%
31%
22%
30%
8%
12%
28%
21%
32%
4%
12%
30%
27%
26%
3%
9%
34%
27%
28%
5%
12%
38%
20%
25%
19%
8%
29%
6% 14%
6%
17%
29%
35%
27%
22%
33%
9%
9%
48% 55% 51% 49% 48% 46% 46% 43%
37% Still buy it in
home country
I buy it online
at a better price
Wait to buy
it abroad
Might switch
brand
Don't buy the
product
"How would you react if you were to realize a price difference between your Country and another one?"
Strong price differentials
might put at risk ~50% of purchases
51 Note: EU includes respondents from Italy, France, Germany, UK Source: BCG 2015 ad hoc study (10'000 respondents in 10 countries)

Copyr
ight
© 2
015 b
y T
he B
osto
n C
onsultin
g G
roup,
Inc.
All
rights
reserv
ed.
What's happening to Chinese
52
Copyr
ight
© 2
015 b
y T
he B
osto
n C
onsultin
g G
roup,
Inc.
All
rights
reserv
ed.
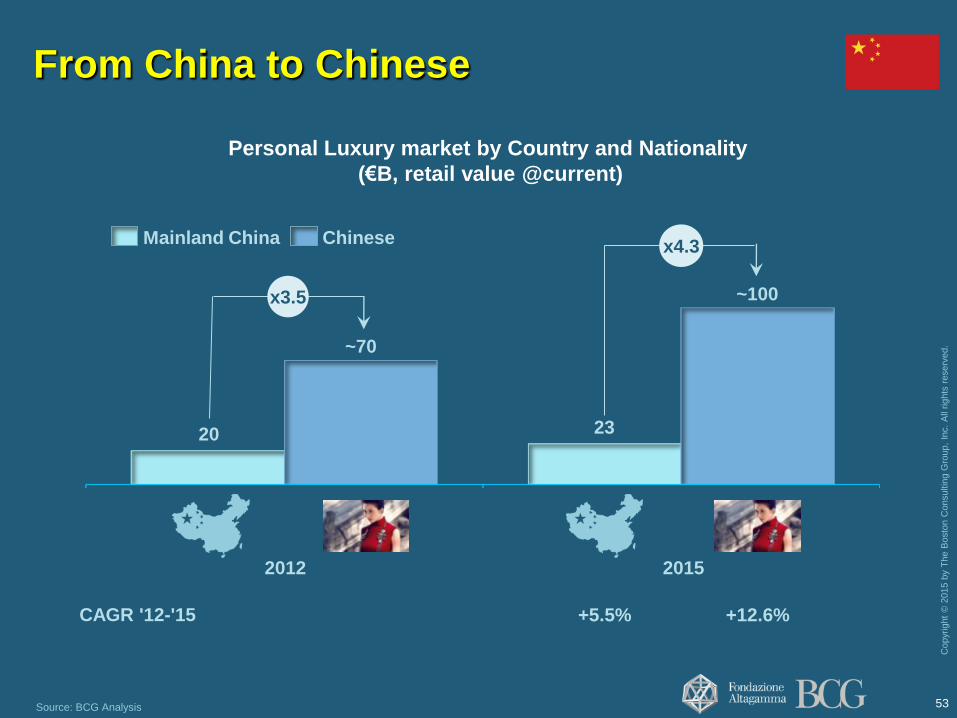
Source: BCG Analysis
Personal Luxury market by Country and Nationality
(€B, retail value @current)
CAGR '12-'15
Chinese Mainland China
+5.5%
x4.3
~100
2012 2015
x3.5
~70
20 23
+12.6%
From China to Chinese
53

Copyr
ight
© 2
015 b
y T
he B
osto
n C
onsultin
g G
roup,
Inc.
All
rights
reserv
ed.
54
Where are Chinese purchasing?
~2
US
~14
Europe
~35
Hong-Kong
~13
Mainland
China
Macau
~100
Total
Chinese
RoW1
~13
Chinese Personal Luxury market by location of purchases
(€B, 2015 retail value @current)
23
1. Russia, Middle East, Other APAC, Other Americas Source: BCG analysis
Copyr
ight
© 2
015 b
y T
he B
osto
n C
onsultin
g G
roup,
Inc.
All
rights
reserv
ed.
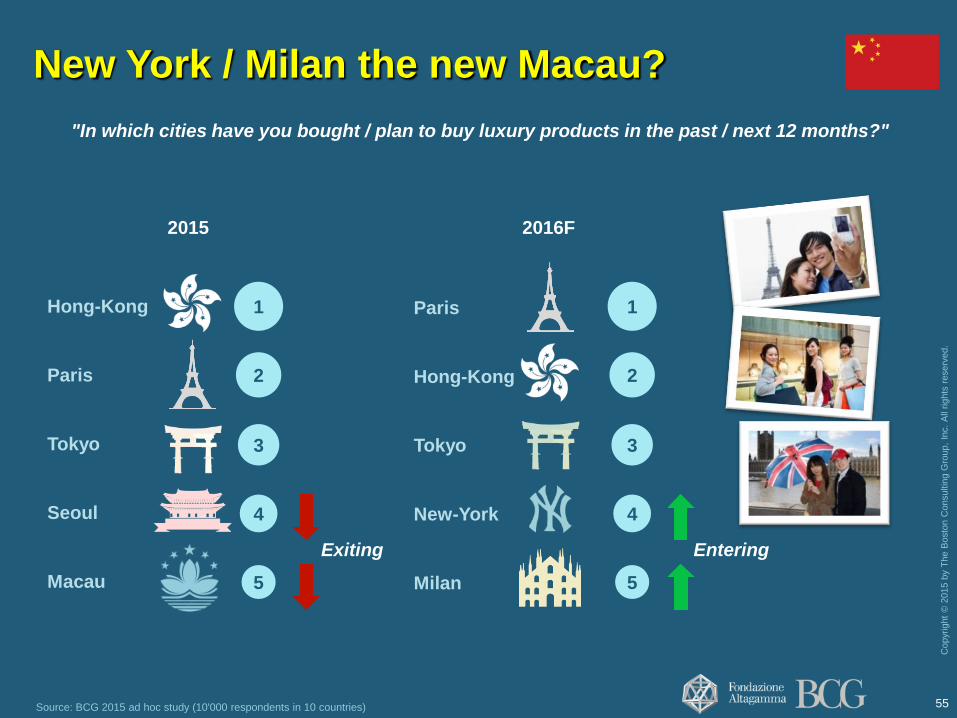
New York / Milan the new Macau?
Source: BCG 2015 ad hoc study (10'000 respondents in 10 countries)
"In which cities have you bought / plan to buy luxury products in the past / next 12 months?"
2015
Paris
Tokyo
Hong-Kong
Macau
Seoul
2
3
4
5
1
2016F
Paris
Milan
Hong-Kong
New-York
Tokyo
Exiting Entering
2
3
4
5
1
55

Copyr
ight
© 2
015 b
y T
he B
osto
n C
onsultin
g G
roup,
Inc.
All
rights
reserv
ed.
"What is your main reason for buying outside your home country?"
Chinese buying in EU % of Chinese
respondents1 Chinese buying in US
∆ EU
vs. US
+6pp
+9pp
-1pp
+10pp
How to capture Chinese
consumers abroad?
Note: Consumer buying both in Europe and US are excluded from the analysis 1. Includes Chinese respondents that spend abroad at least 25% of their personal luxury expenditure Source: BCG 2015 specific survey (10.000 core luxury Consumers in 10 countries) 56
Broader selection
Superior customer
experience
Part of travelling
experience
Buy in the country of
origin of the brand
Lower prices
39%
31%
30%
36%
31%
37%
33%
22%
31%
20%

Copyr
ight
© 2
015 b
y T
he B
osto
n C
onsultin
g G
roup,
Inc.
All
rights
reserv
ed.
"Which luxury products have you bought in the last 12 months and how much have you spent?"
Millennials
% of total P&E Luxury spending
19%
4%
18%
3%
4%
9%
Non-Millennials
20%
15%
3%
3%
11%
3%
18%
25%
22%
24%
Which category they look for?
57 Source: BCG 2015 ad hoc study (10'000 respondents in 10 countries)
Copyr
ight
© 2
015 b
y T
he B
osto
n C
onsultin
g G
roup,
Inc.
All
rights
reserv
ed.
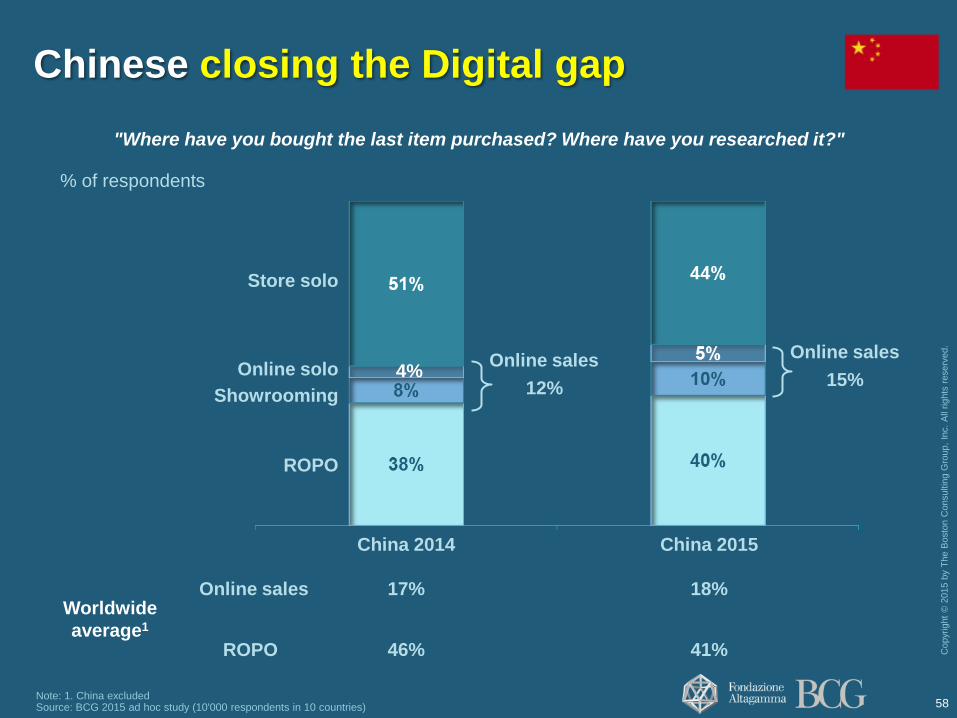
Chinese closing the Digital gap
Note: 1. China excluded Source: BCG 2015 ad hoc study (10'000 respondents in 10 countries)
"Where have you bought the last item purchased? Where have you researched it?"
Showrooming
China 2015
ROPO
Online solo
China 2014
Store solo
4%
% of respondents
Worldwide
average1
Online sales
12%
Online sales
ROPO
17%
46%
18%
41%
Online sales
15%
58

Copyr
ight
© 2
015 b
y T
he B
osto
n C
onsultin
g G
roup,
Inc.
All
rights
reserv
ed.
Milan rebirth

Copyr
ight
© 2
015 b
y T
he B
osto
n C
onsultin
g G
roup,
Inc.
All
rights
reserv
ed.
Note: The calculations excludes consumers in their home country
Source: BCG 2014 and 2015 ad hoc study (10'000 respondents in 10 countries)
Paris
New York
London
Hong-Kong
2014
Paris
New York
London
Milan
2015
Paris
New York
Hong-Kong
Milan
2016F
2
3
4
1
2
3
5
1
2
4
5
1
Hong-Kong
London
"In which cities have you bought / plan to buy luxury products in the past / next 12 months?"
Milan
3
4
5
Milan is rising back
Expo
effect?
60

Copyr
ight
© 2
015 b
y T
he B
osto
n C
onsultin
g G
roup,
Inc.
All
rights
reserv
ed.
Source: BCG 2015 ad hoc study (10'000 respondents in 10 countries)
"Based on your experience in Milan, do you feel that the city is:"
49% 45% 52%
60%
32% 33%
32%
30%
18% 22% 16%
10% Losing grip
Becoming
more cool /
trendy
Neutral
Total
Supporters
Doubters
% of respondents
Paris
London
New-York
2
3
1
They prefer:
Emerging markets Mature
markets
Milan becoming cooler and more trendy,
especially for emerging markets consumers
61
Copyr
ight
© 2
015 b
y T
he B
osto
n C
onsultin
g G
roup,
Inc.
All
rights
reserv
ed.
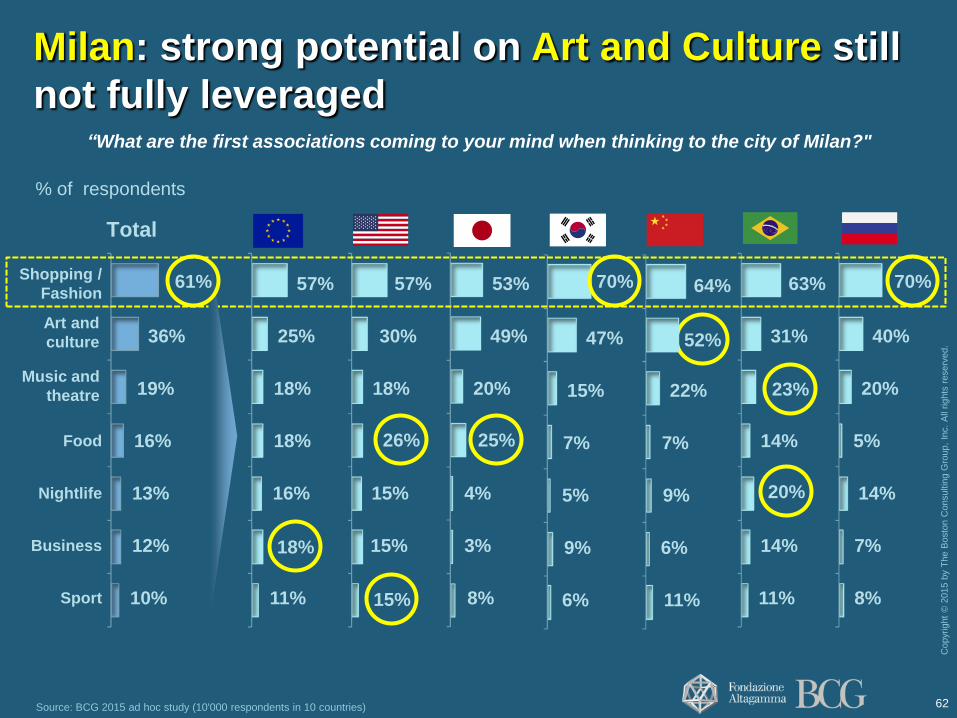
Source: BCG 2015 ad hoc study (10'000 respondents in 10 countries)
“What are the first associations coming to your mind when thinking to the city of Milan?"
% of respondents
Total
16%
Nightlife
12%
13%
Business
Food
19%
36%
Shopping /
Fashion
Sport 10%
15%
15%
18%
30%
57%
18%
16%
11%
18%
25%
57%
11%
14%
14%
31%
63%
11%
6%
9%
7%
22%
64%
3%
8%
4%
20%
49%
53%
8%
7%
14%
5%
20%
40%
9%
6%
5%
7%
15%
47%
61%
18%
26%
15%
25%
70%
52%
70%
23%
20%
Music and
theatre
Art and
culture
Milan: strong potential on Art and Culture still
not fully leveraged
62

Copyr
ight
© 2
015 b
y T
he B
osto
n C
onsultin
g G
roup,
Inc.
All
rights
reserv
ed.
True-Luxury Global Consumer segmentation
63

Copyr
ight
© 2
015 b
y T
he B
osto
n C
onsultin
g G
roup,
Inc.
All
rights
reserv
ed.
64
Growth to continue • Short term (2016): confirmed consumer confidence positive trend
• Mid term (2022): 400M consumers to become 480; market to increase by 290€Bn
New Consumer realities
• Evolving values: Exclusivity not granted, Sustainability growing
• Millennials the 6th continent
• Personal luxury saturation happening
• The "Store War" has begun: newness key to capture the Consumer
• Digital influence era continuing
• Price transparency under the spotlight
• From China to Chinese
• Milan rising back
12 unique segments entering your stores with different expectations • Absolute Luxurer, Megacitier and Experiencer representing 50%+ of the market
• Social Wearer the fastest growing segment
The CONSUMER era: key takeaways
Copyr
ight
© 2
015 b
y T
he B
osto
n C
onsultin
g G
roup,
Inc.
All
rights
reserv
ed.
Antonio Achille Partner and Managing Director - Milan
Antonio Achille is a Partner and Managing Director in the Milan office. He is a senior leader of the Consumer & Retail team and he leads globally the Luxury practice for the firm.
For 20 years, he has been advising National and International Groups on issues that include corporate strategy, organization, digital, supply chain, merchandising, growth acceleration and operational improvement. Within the luxury sector his experience includes apparel, leather goods, eyewear, selective fragrances, jewelry/hard luxury in department stores, franchising and duty free. The geographical scope of his work includes most of the Europe markets, North America, China, Turkey and Korea.
He has developed an extensive knowledge on the Global Luxury Consumer and he is responsible for the database that includes a comprehensive view on over 40.000 consumers from 20 countries, developed in cooperation with Altagamma, the trade association for the Italian luxury industry. The actionable insights of the study are presented at the yearly event “True-Luxury Global Consumer Insight”.
In addition he contributes to the annual Luxury Summit, one of the most valued discussion forum for the sector. He is also member of the Scientific Committee of one the first Italian master on Luxury. He is author and co-author of most of the recent BCG publication on Luxury such as "Luxury ecosystem advantage" , "Shock of the New chic",.. Antonio is extensively quoted, as Luxury and Consumer expert, in Italian and International media, such as NYT, FT, The Economist, WWAD, Bloomberg, CNBC, Il sole 24 ore, Il Corriere della Sera,...

Copyr
ight
© 2
015 b
y T
he B
osto
n C
onsultin
g G
roup,
Inc.
All
rights
reserv
ed.
About BCG and its Luxury practice
The Boston Consulting Group (BCG) is a global management consulting firm and the world’s
leading advisor on business strategy. We partner with clients from the private, public, and
not-for-profit sectors in all regions to identify their highest-value opportunities, address their
most critical challenges, and transform their enterprises.
Our customized approach combines deep insight into the dynamics of companies and
markets with close collaboration at all levels of the client organization. This ensures that our
clients achieve sustainable competitive advantage, build more capable organizations, and
secure lasting results. Founded in 1963, BCG is a private company with 81 offices in 45
countries.
Within the Firm, The Luxury practice, with more than 200 experts worldwide, advises Brands
and Retail companies bringing together the experience of its centers of competence located
in all key must-be geographies for the sector: Milan, New York, Paris, Shanghai, Hong Kong
and Tokyo.
BCG Luxury team has a deep and relevant experience driving profitable growth with leading
Brands and Retail companies, from strategy to marketing and operations, and a unique point
of view on consumer segmentation.

Copyr
ight
© 2
015 b
y T
he B
osto
n C
onsultin
g G
roup,
Inc.
All
rights
reserv
ed.
For a copy of BCG "True-Luxury Global Consumer Insight" please contact:
INTERNATIONAL PRESS:
• Gloria Galimberti email: [email protected] or +39.02.65599444
ITALIAN PRESS:
• Francesco Guidara email: [email protected] or +39.02.65599704
• Francesca Prosperi email: [email protected] or +39.02.65599328
BCG contacts

Thank you
bcg.com | bcgperspectives.com