tritium and deuterium content of atmospheric hydrogen
TRANSCRIPT
Jul'RXAL OF GEOPHYSICAL RESEARCH VOL. 68, No. 13 JULY 1. 1963
Tritium and Deuterium Content of Atmospheric Hydrogen
D. EHHALT, G. ISRAEL,! 'V. ROETHER, AND 'Y. STICH2
II. Physikalisches Insiitut de)" Universiiiit Heidelberg Heidelberg, Germany
Abstract. A substl1ntirLl increase of man-made tritium in at.mospheric hydrogen was first reported by Gonsior in 1\!59. Begema.nn and Friedman, [liso in 1959, pointed out that admixt.ure of industrial hydrogen c[luses lnrge fluctuations in specific tritium activity. In further measurement.s Gonsior was able to show thl1t in at least a few cases large activity peaks were directl,' due to test explosions, thus suggesting th[lt unburned tritium leaves the fire baJI. A series of new measurements on the hydrogen extracted directly from raw neon samples shows quantitl1tively that admixture of industrial hydrogen has indeed a serious effect. In many cases, however, 11 correction b,' mel1ns of a deuterium 118SI1Y 118 suggested by Begem,ulll and Friedman seems practicable. The corrected vl1lues show a steady und relatively steep rise in tritium up to 10· 'I'D in 1962. As there was an extended gap in the test series between H)5S and 1961, this behavior points to an additional source of tritium, presumably the nuclear industry, as is the case with KrS.'.
The concentrations of both T and D in atmosphl'ric H2 vary considerably . Begemann and Friedman [1959J have demonstrated the existence of a linear correlation between these two
isotopes and attributed the effect to the local admixture of H2 from industrial sources. It is
rl':1sonable to cxpeet such H2 to have a relatively
low D concentration and to contain practically no T. Extrapolation to zero T content would thus give the D contcnt of the contaminating H2. GOilsior [196;3J fonnel a correlation coefficient of
about 0.7 between the T and D content in a similar set of samples from Hamburg-Wilhelmsburg in 1957 and 1958. His extrapolnted value for the D content of industrial H2 is about -30 per cent relative to Lake Michigall standard water. This value is in excellent agreement with the value found by Begemann anc! Friedman, in spite of the fact that the samples come from completely different localities. The linear correlation is shown in Figure 1 for a set of samples from Hamburg collected during 1957. Here again, the e,,-trapolated D content of industrial H2 is about -30 per cent.3
1 N"ow at Technische Hochschule Aachen, Geophysik und Meteorologie.
2 Gesellschaft fUr Lindes Eismnschinen A. G. 10hhof, Bavaria.
3 The D concentrations are given here in percentage of deviation from the Heidelberg standard tap water which is -2.4 per cent with respect to 111ke Michigan water, and -6 per cent with respect to standard mean ocean water (SMOW).
In fact, a D value of -30 per cent seems
quite plausible if one assumes the H2 to be produced from tap water at relatively high tem
peratures from reactions like the water-gas
reaction. Unfortunately, it is not possible to deduce the D content of uncontaminated atmospheric H2 from these data, so that neither the D nor the T content is actually known. To obtain these, some additional information is neces
sary. One possibility is to measure the total concentration of H2 in the air sample. A contaminated sample would contain more than tIle normal amount of H2, and the mixing ratio
could be calculated. As the samples are usually collected in air liquefaction plants from the noncondensable fraction of the air by o:\:idizing the H2 to H20 over heated copper, the Ho concentration is usually not known. However, a value for the Ho concentration in the air sample can be obtained by directly measuring the ratio Ho/He in the none on dens able fraction itself. As this
ratio in the atmosphere is relatively well known, it should provide quite a sensitive means of detecting surplus Ho in the sample.
For this purpose several mw Ne samples, i.e. the noncondensable fraction of air, were col
lect ed at two air liquefaction pl:mts in Germany. Two samples were secured from Oberha usen in the Ruhrgebiet and the rest C�lI11e from the factory at Lohhof near J\funich.
The samples consist of some 10 normal liters
of gas, which is 11 miAiure of Ne, He, Ho, and an
3747

3748 EHHALT, ISRAEL, ROETHER, AND STICH
-5 o +5 +10
DEUTERIUM CONTENT IN %
Fig. 1. Correlation of the T and D content of atmospheric molecular Ho of Hamburg samples in 1957. Samples which are obviously influenced by bomb-produced T have been excluded. The T content is given in TU (1 T atom/1Q'-B atoms H,). The D content is expressed as percentage of deviation from Heidelberg standard water. The extrapolation to a tritium content of zero gives a deuterium content of about -30 per cent.
.t T·lo5ru
+
20 • 19 +
• 18 17 16 15 " 13 12 11 0 LOHHOF o 5.3.62 10 .25.4.62 9 + 5.7.62 8 7 6 5 " 3 2
-10 -5 0 5 10 15 ¢%
Fig. 2. Correlation between D and T content in atmospheric Ho for Lohhof samples of 1962. The extrapolation to a T cont.ent of zero gives a D content of -79 per cent.
INTERNATIONAL SYMPOSIUM ON TRACE GASES AND RADIOACTIVITY 3749
[�}e]
J2
)1
.to
.09
o
o
+
LOHHOF 0 5.3.62 .25.�.62 + 5.7.62
- ---------- -- - ------------ -- -- - - -+- - - -+- -- +- - NATURAL [1}]/f!!tJ + . . ��-
� .-t...-. • .07 ..1-___ ,-___ ,-___ ,-....... __ ,.--___ r--__ �5 - 0 +5 +70 +15
DeIlTeR/IIM CONTeNT IN 0J0
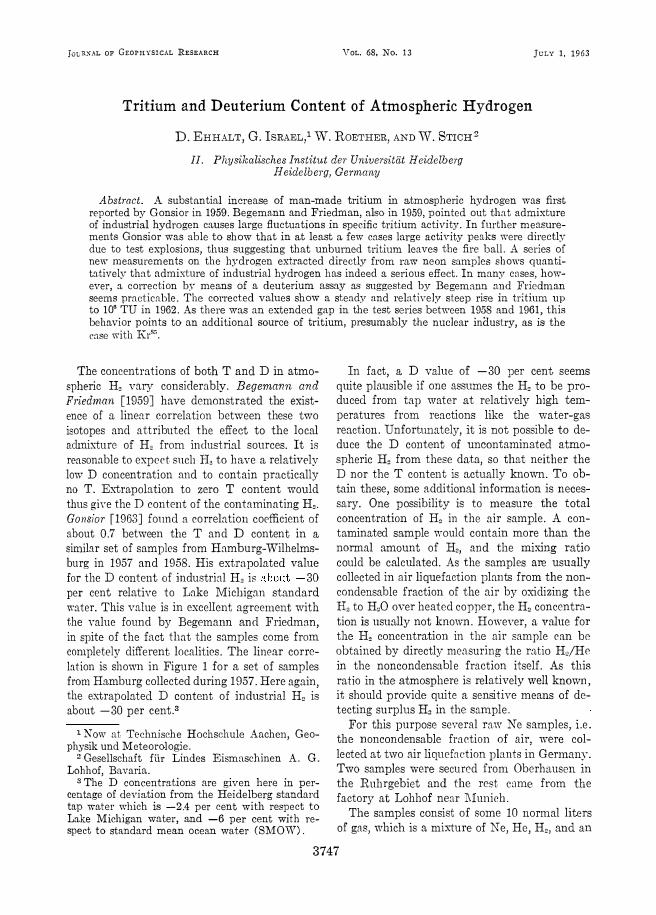
Fig. 3. Relationship between D and H. concentration in air. The full curve is computed with the assumptions that the natural H./He ratio is 0.085, the contaminating H. has a D content of -70 per cent, and the uncontaminated H. a D content of +13 per cent. The points falling on the broken line seem to indicate an isotopic separation during liquefaction.
appreciable amount of N •. The composition was determined by mass spectrometry. For the D 3J1d T analyses the H. was separated by diffusion through a hot Pd tube. The correlation between D and T for the Lohhof samples is shown in Figure 2. In contrast to the previous sets of data, extrapolation to zero T content here gives a D content of about -79 per cent. It seems, therefore, that the atmospheric H. is being contaminated with extremely light H. in this region. In fact, the value of -79 per cent strongly suggests that the contaminating gas is electrolytically produced H •. Normal tank H., which is produced by electrolysis, usually has a D content of -70 per cent. Actually, even small amounts of such gas can contaminate quite large areas. One cubic meter of tank H. released into the air would raise the H. concentration by 20 per cent 3J1d lower the D content by about 15 per cent over an area of 300 X 300 meters to a height of 100 meters.
In Figure 3 the H.jHe ratio of the Lohhof samples is plotted versus the D content of the H2• The natural H,ifHe ratio of 0.085 is indicated by the horizontal line.· In at least one set
• The natural H./He ratio of 0.085 is obtained by averaging over the H./He ratios as given by Panetk [1937] and Gluckauf [1952] and the lowest H./ He ratio found here.
of samples the D content increases with decreasing H.jHe ratio as anticipated, approaching a value of +12 to +14 per cent in the samples containing the natural H,ifHe ratio. Starting from this point and using a D value of -70 per cent for the industrial H., we plotted the expected correlation curve, and it shows a rather good agreement with the experimental results. However, the fitting of the curve could obviously be improved by changing one or more of the parameters: H./He ratio = 0.085, D content of contaminating H, = -70 per cent, and D content of uncontaminated H2 = + 13 per cent . If we assume the first two parameters to be correct, the D content of uncontaminated atmospheric H. would be even higher than + 13 per cent.
To arrive at this conclusion it was assumed that the H.jHe ratio in the sample gas was not seriously altered during collection and that it actually represents the value in the air at the time of sampling . It was also assumed that the contaminating H. is not associated with a corresponding amount of He. Actually, the set of samples with a H.jHe ratio smaller than the natural ratio may indicate an admixture of foreign He, but this does not explain the apparent correlation with the D content. These samples were collected during a period when the air liquefaction plant was operating under some-
3750 EHHALT, ISRAEL, ROETHER, AND STICH
[H4f!e]
! 025
020
015
eO OBERHAUSEII 1960 LOHHOF 5.3.62
5.7.62
____ Till !If TU
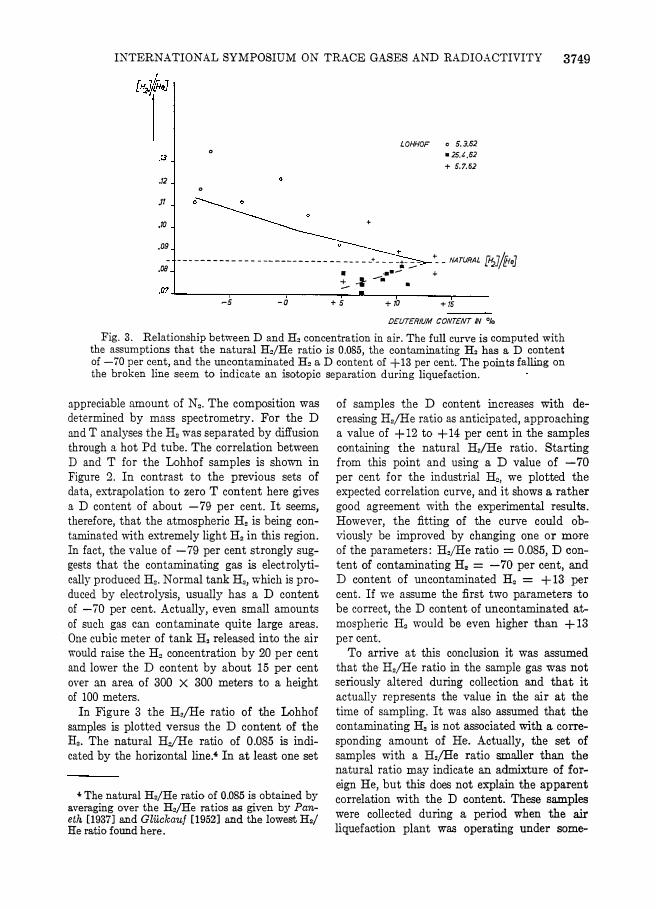
Fig. 4. Rela.tionship between T content and H, conccmtration in air. The drawn curve is computed with the assumptions that the natural Hoi He ratio is 0.085 and the industrially admixed H, contains no T.
what different conditions, and the correlation
may be due to another effect which we haye not yet taken into consideration, that is, the loss of H, by solution in the liquid phase. If consider[(ble amounts of H, were dissolved in the liquid N ::mcl removed from the system with the liquid N, isotope fl'[(ctionation could also occur and the D content of the collected H, would change. Since H, is more soluble in liquid air than He, the H,/He ratio would be decre ased in the manner observed .
An attempt was made to determine the loss of H, in the liquid phase by measuring the Ne concentration in the samples. Ne is also more soluble th[(n He and could be expected to behave in a similar manner to the H,. Unfortunately, no satisfactory correlation was found, and a quantitative explanation is pending further measurements.
Whatever the exact interpretation of these D results may be, it seems reasonably well estab
lished that uncontaminated atmospheric H, has a D content of about +13 per cent and that the main source of fluctuations in D and T can be attributed to the admixture of industrial H, with a D content of about -70 per cent in the case of the Lohhof samples and -30 per cent for samples collected at the other stations. With
this information it is now possible to correct the T value of a sample for industrial contamination
As a further check on these assumptions thE T content is plotted against the Ho!He ratio ir Figure 4. Again, the highest T values are as· sociated with a H,/He ratio close to that of the free atmOE:phere, and samples containing less 1 ha.\"e a higher H,/He ratio, indicating the ad· mixture of tritium-free gas. The two sample: from Oberhausen in the Rulli' area have UL especially low T content and appear to contair nearly three times the natural amount of H: The curve plotted in Figure 4 has been con· structed under the assumption that the naturi l' content in 1962 is 23 X 10" TU (the valUE corresponding to HjHe = 0.085). As in tht case of D, the measurements seem to confim the basic assumptions.
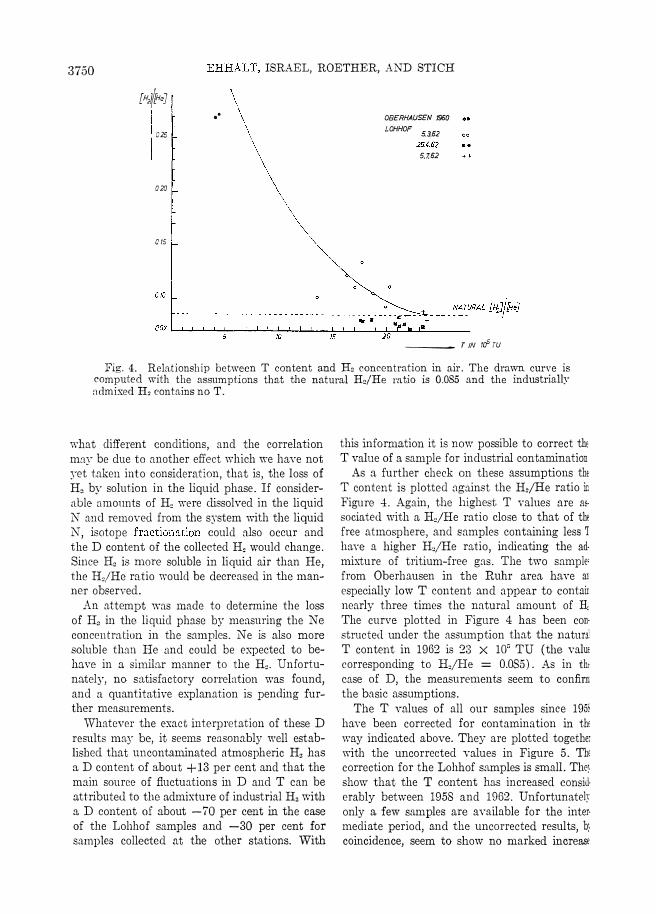
The T values of all our samples since 195f have been corrected for contamination in th, way indicated above. They are plotted togethe: with the uncorrected values in Figure 5. Th, correction for the Lohhof samples is small. The: show that the l' content has increased consid· erably betvieen 1958 and 1962. Unfortunately only a few samples are available for the inter· mediate period, and the uncorrected results, b: coincidence, seem to show no marked increase

INTERNATIONAL SYMPOSIUM ON TRACE GASES AND RADIOACTIVITY 3751 ro5 TU
20
15
/0
o UNCORRECTED T-VALUES • CORRECTED T-VALUES
--L--1957 1958 1959 1960 1961 1962
Fig. 5. The increase of T content of atmospheric H. during the �"ears 1957 to 1962. The uncorrected T values are given by the open circles. The correction for industrially admixed H. with help of D gives the actual T content which is indicated by the triangles. The amount of this correction is given by the arrows. This correction is small for the last two samples which came from Lohhof.
When corrected for contamination, however, the T content in the atmosphere is seen to increase steadily. For inst ance, the points could be fitted to an exponential curve with a doubling time of about 2 years. As samples for 1961 are not available, we cannot decisively exclude the possibility that the high values in 1962 are due to the recent Soviet nuclear weapons test series. If this were true, however, the T in atmospheric H. would be the only radioactive isotope which
shows an extraordinarily large increase. We are therefore much more inclined to assume that a considerable portion of the T in atmospheric H2 is due to sources in nuclear industry. These sources ,yould produce the steady increase irre
spective of the extended interruption of tests between 1958 and 1961. An industrial origin of T has already been suspected by Bishop and Taylol" [1960]. It also resembles the increase in Kr", which is reported by Ehhalt et al. [1963].
REFERENCES
Begemann, F., and 1. Friedman, Tritium and deuterium content of atmospheric hydrogen, Z. Natul·jorsch., 14a, 1024, 1959.
Bishop, K. F., and B. T. Taylor, Growth of the tritium content of atmospheric molecular hydrogen, Natul"e .. 185, 26, 1960.
Ehhalt, D., K. O. �1linnich, W. Roether, J. Scholch, and W. Stich, Artificially produced radioactive noble gases in the atmosphere, J. Geophys. Res., 68(13), 1963 .
Gliickauf, E., Composition of atmospheric air, in Compendium of Mei.eoroloYlI, p. 3, American Meteorological Society, Boston, 1952.
Gonsior, B., 1. Friedmann, and D. Ehhalt, Measurements of the tritium and deuterium concentrations in atmospheric hydrogen, J. Geophys. Res., 68(13), 1963.
Paneth, T. A., The chemicnl composition of the atmosphere, Quart. J. Roy. 11leteorol. Soc., 68, 433, 1937.
(Mnnuscript recei\"ed .Tanunry 25, 1963.)