impact of first-principles properties of deuterium–tritium
TRANSCRIPT

Impact of fIrst-prIncIples propertIes of DeuterIum-trItIum on InertIal confInement fusIon target DesIgns
LLE Review, Volume 141 29
IntroductionInertial confinement fusion (ICF) has been actively pursued in laboratories since the concept1 was invented in 1972. In the conventional “hot-spot” ignition scheme, ICF capsules, con-sisting of a solid deuterium–tritium (DT) layer covered by an ablator, are driven to implode either by x rays in a hohlraum2–4 or directly by lasers.5,6 If properly designed, ICF targets can be compressed by shock waves and the spherical convergence to form an extremely dense (>1000# solid density) shell surround-ing a high-temperature core (hot spot). A properly assembled core with an extremely high pressure (>100 + 300 Gbar) makes it possible not only to produce sufficient a particles from DT fusions but also to “bootstrap” the heat (a-particle stop-ping) in the hot spot.7 If this occurs, a fusion burn wave could quickly propagate through the dense shell8 and a net energy gain would be expected.
Designing and understanding ICF experiments rely on radiation–hydrodynamics simulations,9–12 in which an accurate knowledge of properties of relevant materials (both DT fuel and ablators) under high-energy-density (HED) conditions is a pre-requisite. To be specific, the equation of state (EOS) is needed to close the hydrodynamic equations.13 The compressibility of material is determined by its EOS.14 Besides the static EOS, an accurate knowledge of transport properties, such as thermal conductivity and viscosity, is also necessary for understanding the heat transport15–17 and energy dissipation. In addition, the opacity of imploding capsules determines the radiation energy transport, which is also important in ICF simulations. Finally, the a-particle stopping power18–20 of DT plasmas is also a prerequisite for ICF ignition simulations. The accuracy of these properties can affect the reliability of ICF target designs given that the margin for ignition to occur is usually quite small.
Studies of ICF ignition target designs21–24 have revealed that the minimum laser energy scales as EL ? a1.9, with the adiabat a conventionally defined as the ratio of plasma pres-sure to the Fermi-degenerate pressure. This implies that to reduce the laser energy required for ignition, the imploding DT shell should be kept in a lower adiabat. Namely, maintain-
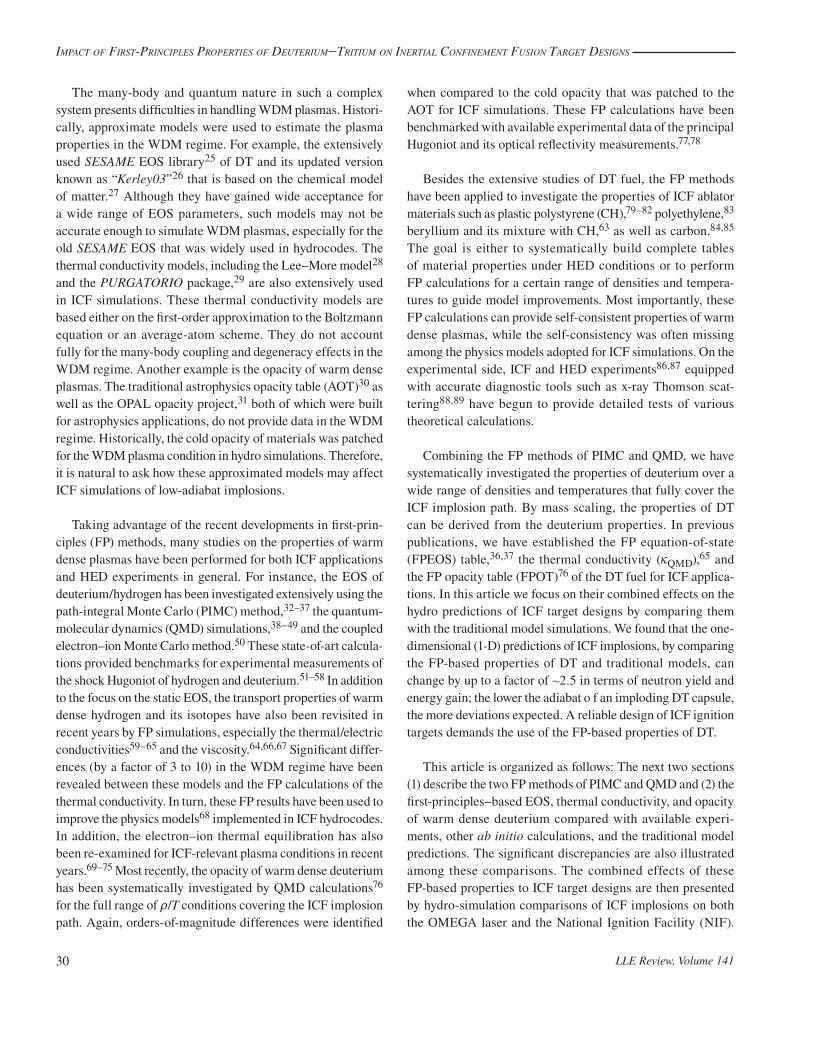
ing a relatively lower temperature (T - 0.1 to 0.2 # TF, where TF is the Fermi temperature) in the imploding DT capsule is key to obtaining higher compression and a larger energy gain for particular laser energy. As an example, the typical “path” of an imploding DT capsule on the temperature and density plane for a low-adiabat implosion (a = 1.5 to 3) is shown in Fig. 141.23. The in-flight DT shell in a low-adiabat implo-sion travels through a plasma region denoted as “warm dense matter” (WDM). Typically, the WDM regime for DT spans a density range from t = 1 to 200 g/cm3 and temperatures of T = 1 to 200 eV, in which strong coupling and electron degen-eracy are expected to be important. Warm dense plasmas are generally characterized by the Coulomb coupling parameter C = q2/(4re0rskBT) and the electron degeneracy parameter i = T/TF, with the charge q, the Boltzmann constant kB, and the interparticle distance rs = (3/4 rn)1/3 for the particle density n. For WDM, C $ 1 and i # 1. Even for the simplest element of hydrogen, accurate calculations of its properties in the WDM regime have been challenging in the past.
Impact of First-Principles Properties of Deuterium–Tritium on Inertial Confinement Fusion Target Designs
TC11490JR
10–4 10–2 100
Density (g/cm3)
Tem
pera
ture
(K
)
102 104 106102
104
106
108ICF ignitionICF ignition
1010Im
plod
ing
DT
caps
ules
Impl
odin
g D
T ca
psul
es
Warm dense matter
Warm dense matterPlasmaPlasma
GasGas SolidSolid
Figure 141.23The density and temperature “path” of a low-adiabat imploding DT capsule to ICF ignition.
Impact of fIrst-prIncIples propertIes of DeuterIum-trItIum on InertIal confInement fusIon target DesIgns
LLE Review, Volume 14130
The many-body and quantum nature in such a complex system presents difficulties in handling WDM plasmas. Histori-cally, approximate models were used to estimate the plasma properties in the WDM regime. For example, the extensively used SESAME EOS library25 of DT and its updated version known as “Kerley03”26 that is based on the chemical model of matter.27 Although they have gained wide acceptance for a wide range of EOS parameters, such models may not be accurate enough to simulate WDM plasmas, especially for the old SESAME EOS that was widely used in hydrocodes. The thermal conductivity models, including the Lee–More model28 and the PURGATORIO package,29 are also extensively used in ICF simulations. These thermal conductivity models are based either on the first-order approximation to the Boltzmann equation or an average-atom scheme. They do not account fully for the many-body coupling and degeneracy effects in the WDM regime. Another example is the opacity of warm dense plasmas. The traditional astrophysics opacity table (AOT)30 as well as the OPAL opacity project,31 both of which were built for astrophysics applications, do not provide data in the WDM regime. Historically, the cold opacity of materials was patched for the WDM plasma condition in hydro simulations. Therefore, it is natural to ask how these approximated models may affect ICF simulations of low-adiabat implosions.
Taking advantage of the recent developments in first-prin-ciples (FP) methods, many studies on the properties of warm dense plasmas have been performed for both ICF applications and HED experiments in general. For instance, the EOS of deuterium/hydrogen has been investigated extensively using the path-integral Monte Carlo (PIMC) method,32–37 the quantum-molecular dynamics (QMD) simulations,38–49 and the coupled electron–ion Monte Carlo method.50 These state-of-art calcula-tions provided benchmarks for experimental measurements of the shock Hugoniot of hydrogen and deuterium.51–58 In addition to the focus on the static EOS, the transport properties of warm dense hydrogen and its isotopes have also been revisited in recent years by FP simulations, especially the thermal/electric conductivities59–65 and the viscosity.64,66,67 Significant differ-ences (by a factor of 3 to 10) in the WDM regime have been revealed between these models and the FP calculations of the thermal conductivity. In turn, these FP results have been used to improve the physics models68 implemented in ICF hydrocodes. In addition, the electron–ion thermal equilibration has also been re-examined for ICF-relevant plasma conditions in recent years.69–75 Most recently, the opacity of warm dense deuterium has been systematically investigated by QMD calculations76
for the full range of t/T conditions covering the ICF implosion path. Again, orders-of-magnitude differences were identified
when compared to the cold opacity that was patched to the AOT for ICF simulations. These FP calculations have been benchmarked with available experimental data of the principal Hugoniot and its optical reflectivity measurements.77,78
Besides the extensive studies of DT fuel, the FP methods have been applied to investigate the properties of ICF ablator materials such as plastic polystyrene (CH),79–82 polyethylene,83
beryllium and its mixture with CH,63 as well as carbon.84,85
The goal is either to systematically build complete tables of material properties under HED conditions or to perform FP calculations for a certain range of densities and tempera-tures to guide model improvements. Most importantly, these FP calculations can provide self-consistent properties of warm dense plasmas, while the self-consistency was often missing among the physics models adopted for ICF simulations. On the experimental side, ICF and HED experiments86,87 equipped with accurate diagnostic tools such as x-ray Thomson scat-tering88,89 have begun to provide detailed tests of various theoretical calculations.
Combining the FP methods of PIMC and QMD, we have systematically investigated the properties of deuterium over a wide range of densities and temperatures that fully cover the ICF implosion path. By mass scaling, the properties of DT can be derived from the deuterium properties. In previous publications, we have established the FP equation-of-state (FPEOS) table,36,37 the thermal conductivity (lQMD),65 and the FP opacity table (FPOT)76 of the DT fuel for ICF applica-tions. In this article we focus on their combined effects on the hydro predictions of ICF target designs by comparing them with the traditional model simulations. We found that the one-dimensional (1-D) predictions of ICF implosions, by comparing the FP-based properties of DT and traditional models, can change by up to a factor of +2.5 in terms of neutron yield and energy gain; the lower the adiabat o f an imploding DT capsule, the more deviations expected. A reliable design of ICF ignition targets demands the use of the FP-based properties of DT.
This article is organized as follows: The next two sections (1) describe the two FP methods of PIMC and QMD and (2) the first-principles–based EOS, thermal conductivity, and opacity of warm dense deuterium compared with available experi-ments, other ab initio calculations, and the traditional model predictions. The significant discrepancies are also illustrated among these comparisons. The combined effects of these FP-based properties to ICF target designs are then presented by hydro-simulation comparisons of ICF implosions on both the OMEGA laser and the National Ignition Facility (NIF).

Impact of fIrst-prIncIples propertIes of DeuterIum-trItIum on InertIal confInement fusIon target DesIgns
LLE Review, Volume 141 31
Finally, these results are summarized and future FP studies on ICF-relevant ablator materials are briefly mentioned.
The First-Principles Methods of PIMC and QMD for Warm Dense Plasmas
Understanding the properties of warm dense plasmas is challenging because of the many-body coupling and quantum degeneracy effects intrinsic to such complicated systems. It demands the full treatment of both effects using the fundamen-tal principles governing a quantum many-body system. Among the various FP methods, PIMC and QMD have been extensively applied for studies of warm dense plasmas. Each of the two FP methods is briefly described in the following subsections.
1. Path-Integral Monte CarloA many-body quantum system in thermodynamic equilibrium
can be described by the density matrix
, ; ,R R R R en nE k T
n
Bnt z zb = -l l_ ^ ^i h h/
with / ,k T1 Bb = zn the eigenstates, and En the eigenenergy of the system. The eigenstates of an interacting quantum system are unknown, however, and no efficient numerical method exists to indirectly compute the density matrix. The fundamental idea of the path-integral approach is based on the convolution property of , ; .R Rt bl_ i Namely, the density matrix at temperature T can be expressed as a convolution of density matrices at an M times higher temperature, M # T :
, ; d d d , ;
, ; , ; .
R R R R R R R
R R R R1 1M
M1 2 1 1
2#
f
g
t
t t
b t b
b b
D
D D
= -
-
l
l
_
_ _
_i
i
i
i
#
(1)
At a high temperature, the correlation effects betwee n particles are small and a very good approximation for the density matrix exists.90 The path integral is needed to recover the full correlation effects at a lower temperature. The integral on the right-hand side of Eq. (1) can be interpreted as a weighted average over all paths that connect the points R and R .l R is a collective variable that denotes the positions of all particles R = {r1,…rN}. b represents the length of the path in “imaginary time,” and Db = b/M is the size of each of the M time steps. In PIMC calculations, electrons and ions are treated on equal footing as paths, which means the quantum effects of both species are included consistently, although for the temperatures under consideration, the zero-point motion and exchange effects of the nuclei are negligible.
One can consequently interpret the positions R1…RM–1 as intermediate points on a path from R and .Rl The multidimen-sional integration over all paths in Eq. (1) can be carried out efficiently by the Monte Carlo method.91 Observables associ-ated with an operator Ot can be derived from
d , ;
d d , ;.
R R R
R R R R R RO
O
t b
t b=
l
l l lt
t
__i
i###
(2)
For the kinetic and potential energies, EK and EP , as well as for pair correlation functions, only diagonal matrix elements R R=l_ i are needed.
Since electrons are fermions, their fermionic character matters for the degenerate plasma conditions under consideration. This implies that one must construct an antisymmetric many-body density matrix, which can be derived by introducing a sum of all permutations P and then also include paths from R to P .Rl While this approach works well for bosons,91 for fermions each permu-tation must be weighted by a factor (-1)P. The partial cancella-tion of contributions with opposite signs leads to an inefficient algorithm when the combined position and permutation space are sampled directly.91 This is known as the Fermion sign problem, and its severity increases as the plasma temperature decreases (becoming more degenerate). In our PIMC calculations, we deal with the Fermion sign problem by using the free-particle nodes,92 although the nodes of a variational density matrix93 have also been employed in other PIMC computations.94,95 The details of our PIMC simulations of warm dense deuterium can be found in previous publications.36,37
In PIMC simulations, we approach the low-T density matrix from the known high-T ones through multidimensional integra-tions along the “temperature path.” As the plasma temperatures decrease, the Fermi-sign problem prevents the efficient evalu-ation of the multidimensional integrations in the combined position and permutation space. Therefore, the lowest tempera-tures in our restricted PIMC calculations have only reached T - 0.1 to 0.2 # TF. For even lower plasma temperatures, other FP methods should be used. The QMD method is one of the FP methods that can handle low-T plasmas.
2. Quantum-Molecular Dynamics The QMD method is based on the finite-temperature density
functional theory.96–98 The many-electron system in a plasma can be described by a wave function W(r1,r2,…rN), which satisfies the following Schrödinger equation (atomic units used throughout):

Impact of fIrst-prIncIples propertIes of DeuterIum-trItIum on InertIal confInement fusIon target DesIgns
LLE Review, Volume 14132
.rr r
V E21 1
i ii ji jii
--
D W W+ + =!
_ i> H/// (3)
The second term in Eq. (3) is the electron–ion interaction, while the third term describes the Coulomb repulsion among electrons. To solve the above Schrödinger equation, a tractable way is to map the many-electron wave function onto a one-electron basis, , , , , , .r r r r r rN NN1 2 1 2"f f} } }W` _ _ _j i i i$ . The Kohn–Sham density functional theory96,97 (DFT) is an efficient “mean-field” theory for many-electron systems, in which the total wave function takes a product form of individual one-electron “orbital,” Wi(r). By doing so, Eq. (3) can be casted into the well-known Kohn–Sham equation for the orbital Wi(r):
,r r r r rV V V E21
z xc i i iH- t t } }D + + + =_ _ _ _ _i i i i i8 8B B' 1 (4)
with the electron density and the Hartree term defined as
; d .r r rr r
rrVi
i
N
1H -
t } tt
= ==
2
l
ll&_ _ _ ^i i i h8 B/ (5)
Since the exchange-correlation term Vxc and the Hartree term depend on the electron density t(r), which is again a function of }(r), the Kohn–Sham equation can be solved in a self-consistent way. Together with the ionic force, the resulting electronic force is then used to drive the classical ionic motion through Newton’s equation under the Born–Oppenheimer approximation (in a QMD step).
Our QMD simulations have been performed within the Mermin’s finite-temperature DFT,98 which was implemented in the Vienna ab initio simulation package (VASP)99,100 using a plane-wave basis. The generalized gradient approximation (GGA) with the Perdew–Burke–Ernzerhof (PBE) exchange-correlation function101 is employed in our QMD simulations. The electron–ion interaction is modeled by either the projector augmented wave (PAW) pseudopotentials or the pure Coulomb potential. The system was assumed to be in local thermody-namic equilibrium with equal electron and ion temperatures (Te = Ti). The isothermal ensemble was used for our QMD simulations in which the number of particles, volume, and tem-perature was kept constant. For periodic boundary conditions, the electron wave function can be described by Bloch waves, consisting of products of plane waves with different momentak and a periodic function of space. Each k point in the first
Brillouin zone uniquely defines every Bloch state. For each QMD step, a set of electronic wave functions for each k point is self-consistently determined for a given ionic configuration. Then, the ions are moved classically with a velocity Verlet algo-rithm, according to the combined ionic and electronic forces. The ion temperature was kept constant through simple velocity scaling. Repeating these QMD steps, a set of self-consistent ion trajectories and electronic wave functions can be found. These trajectories provide a self-consistent set of static, dynamic, and optical properties of warm dense plasmas. The details of our QMD simulations of warm dense deuterium plasmas can be found in recent publications.65,76
3. Calculating Plasma Properties from PIMC and QMD SimulationsFor PIMC simulations, only the EOS was derived. The total
internal energy follows from E = EK + EP , where EK and EP are the kinetic and potential energies, respectively. The pressure P can be obtained from the virial theorem for Coulomb systems, P E E V2 3K P= +_ i with the volume V. The tabulated FPEOS of deuterium from PIMC calculations can be found in Ref. 37. In QMD simulations, the EOS of warm dense deuterium was calculated in a straightforward fashion by evaluating the electron term, then adding the contribution from the classical ions. Using QMD simulations, we have extended the PIMC-derived FPEOS table from the PIMC’s lowest temperature of T = 15,625 K down to a much lower temperature of T = 1000 K for most of the density points (tD $ 0.1 g/cm3). Dynamical and optical properties are determined from the QMD trajectories by calculating the velocity dipole matrix elements. Namely, from the resulting QMD trajectories, we choose uncorrelated snapshots of these configurations to calculate the velocity dipole matrix elements Dmn using the wave functions. The quantity Dmn is then applied to compute the frequency-dependent Onsager coefficients within the Kubo–Greenwood formalism:102
,
LVm
eF D
E EH E E
3
2
2
ij
i j
mn mnmn
m ni j
m n
2
42
2
e
#
-
- - -
~~
r
d ~
=
+
- -
-+
_
e
_
_
ii
o i
/
(6)
where V = 1/t is the atomic volume, Em(En) is the energy of the mth (nth) state, and H is the enthalpy per atom of the system. The quantity of Fmn is the difference between the Fermi–Dirac distributions for states m and n at temperature T. The Onsager coefficients essentially determine the transport and optical properties of the system.

Impact of fIrst-prIncIples propertIes of DeuterIum-trItIum on InertIal confInement fusIon target DesIgns
LLE Review, Volume 141 33
To calculate the electron thermal conductivity of a plasma, the linear response of the plasma to an electric field E and a temperature gradient dT is considered. The resulting electric current je and the heat flux jq can be expressed as
d
,j EeL T
L Te11
12e -= e o (7)
d
.j EeL T
L Teq 21
22-= e o (8)
For plasmas having no electric current (je = 0), the above equa-tions in combination with the definition of jq = –ldT give the thermal conductivity (in atomic units of = me = e = 1):
T
L L L22 122
11-l = (9)
with the Onsager coefficients given by Lij in Eq. (6). If there is no temperature gradient (dT = 0), Eq. (7) reduces to the Ohm’s law with the real electrical conductivity of v1 = L11.
The opacity calculations rely on the evaluation of the frequency-dependent absorption coefficient aK(~), which is related to the electrical conductivity and the index of refraction (n) of the plasma:
cn
4K
1a ~
~
rv ~=_ _
_i i
i (10)
with the speed of light c. To calculate the refractive index n, we start from the real part of the electrical conductivity, v1(~) = L11(~), and determine the imaginary part from the principal value integral:
d .P2
2 2 21
--
v ~ r~ ~
~v ~~=
l
ll_
^i
h# (11)
The dielectric function e(~) = e1(~) + ie2(~) can be calculated from the following expressions:
,
.
14
14
1 2
2 1
-
-
e ~ ~rv ~
e ~ ~rv ~
=
=
_
_
_
_
i
i
i
i
(12)
Using the dielectric function, we compute the real [n(~)] and imaginary [k(~)] parts of the refractive index:
,
.
n
k
2
2
1
1-
~e ~ e ~
~e ~ e ~
=+
=
_
_
_
_
_
_
i
i
i
i
i
i
(13)
The frequency-dependent reflectivity is given by
Rn n k
n n k
02 2
02 2-
~~ ~
~ ~=
+ +
+_
__ _
_i
ii i
i88 B
B (14)
with the refraction index n0 of the ambient environment (n0 = 1 for vacuum). Finally, the mass absorption coefficient (am) is equal to the absorption coefficient (aK) divided by the mass density:103
.ncn
4 1m
1K#a ~ t
a ~
~
rv ~
t= =rr
__
__
ii
ii
(15)
The “bar” over v1 and n stands for averaging over the uncor-related configuration snapshots being sampled. We found that five to ten snapshots generally give a good statistic with varia-tion less than +5%.
Under the multigroup diffusion approximation, the Rosseland (KR) and Planck (KP) mean opacities are used for the radiation transport and emission calculations in hydrodynamic simulations. The grouped Rosseland and Planck mean opacities are defined as
:
d
d
,,
,
K
nT
B T
nT
B T
1m
1 22
2
R
1
2
1
2
2
2
2
2
~ ~
~ a
~~
~~
~
=
~
~
~
~
`_
_ ^
^ji
i h
h#
# (16)
:d
d
,
,
Kn B T
n B Tm
1 22
2
P
1
1
2
2~ ~
~ ~ ~
~ a ~ ~ ~
= ~
~
~
~
$
$`
_
_
_
^
^j
i
i
i
h
h (17)

Impact of fIrst-prIncIples propertIes of DeuterIum-trItIum on InertIal confInement fusIon target DesIgns
LLE Review, Volume 14134
for a group of photon energies between 1~ and .2~ Here, the Planck function ,B T c e4 1 /k T3 3 2 B -~ ~ r= ~_ ` ^i j h depends on the emitting photon energy and the plasma tem-perature. Integrating the frequency from ~1 = 0 to ~2 = 3 , one obtains the total Rosseland and Planck mean opacities.
Comparisons of FP-Based Properties of Deuterium with Experiments and Models
With the PIMC and QMD methods, we have calculated the EOS, thermal conductivity l, and opacity of deuterium for a wide range of densities and temperatures. From the combined PIMC/QMD calculations, the FPEOS table36,37 covers the deuterium plasma conditions of t = 0.002 to 1596 g/cm3 and T = 0.086 eV to 5.5 keV. While for QMD calculations of l and opacity, we have considered the deuterium plasma ranges of t = 0.1 to 673.5 g/cm3 and T = 5000 K up to the Fermi temperature TF. These density and temperature points fully cover the typical shell conditions in low-adiabat ICF implo-sions. It is noted that DFT-based QMD and PIMC results have been combined in the past for the shock Hugoniot studies of hydrogen,34 helium,94,95 carbon,84 and water.81 In this section, we compare the FP-calculated properties of deuterium plasma with both model predictions and available experimental data.
In Fig. 141.24, our PIMC/QMD–predicted (a) pressure and (b) energy are plotted as a function of the plasma tem-perature for the case of tD - 7.391 g/cm3. They are com-pared with a recent ab initio calculation,48 using a different molecular-dynamics code (ABINIT104), which combines both the orbital-based and orbital-free density functional theories (QMD–OFMD). The solid red circles represent
our QMD results, while the open blue squares represent the PIMC calculations and the open green diamonds are those given by Wang et al.48 It is noted that all the internal ener-gies shown are referenced to the ground-state energy (E0 = –15.886 eV) of a D2 molecule. Figure 141.24 shows that in the warm dense regime, where both PIMC and QMD are valid, the two calculations result in almost identical EOS values. The PIMC simulations, however, are applicable only to T + 10 eV for this density because as the plasma temperature decreases, the Fermi-sign problem in PIMC prevents the efficient evaluation of degeneracy effects. In the low-T regime (T < 0.2 # TF), the QMD results are complimentary to the PIMC results. Overall, our combined EOS results from PIMC/QMD simulations compare well with the values given by QMD–OFMD calculations.48 As expected, Fig. 141.24(a) shows almost constant pressures at T % TF. This is attributed to the dominant electron degen-eracy pressure at plasma temperatures well below the Fermi temperature (TF - 61.9 eV for this density).
Figure 141.25 compares the FPEOS-predicted Hugoniot of deuterium with extensively used EOS models of SESAME25
and the updated Kerley03,26 as well as the laser-shock experiments by Hicks et al.57 and by Boehly et al.;105 the Z-machine data by Knudson et al.;54,55 and that of Boriskov et al.106 The pressure of shocked deuterium is plotted as a function of the compression (t/t0). The Hugoniot temperatures are marked in Fig. 141.25(a). Figure 141.25(a) indicates that the FPEOS-predicted Hugoniot is softer than SESAME at P < 2.5 Mbar (1 Mbar = 100 GPa), while it is stiffer in the pressure range of P = 2.5 to 100 Mbar. The
Figure 141.24(a) The pressure and (b) energy as a function of temperature for tD = 7.391 g/cm3 are compared among different first-principles calculations: the current QMD calculations, the PIMC calcula-tions,37 and the QMD–OFMD calculations by Wang et al.48
TC11443JR
QMD, present workPIMCQMD–OFMD
10–1 100 101
Temperature (eV)
(a) (b)
Pres
sure
(M
bar)
102
102
103
104
103 10–1 100 101
Temperature (eV)
Ene
rgy
(eV
/ato
m)
102
0
200
400
600
800
103

Impact of fIrst-prIncIples propertIes of DeuterIum-trItIum on InertIal confInement fusIon target DesIgns
LLE Review, Volume 141 35
improved Kerley03, with including the molecular dissociation, quantum corrections, and a new ionization equilibrium model, gave Hugoniot values that were overall closer to the FPEOS. The slightly softer behavior is still seen, however, in Kerley03 at pressures of P - 2.5 to 10 Mbar, and the similar stiffer behavior at low pressure (P = 0.5 to 2 Mbar) is still less favorably compared with laser shock experiments than the FPEOS in this low-T range, as indicated by Fig. 141.25(b). The FPEOS Hugoniot is a bit closer to, but still not as soft as, what is indicated by the laser-shock experiments. To our best knowledge, this much-softer behavior51,52,57,105 in these laser-shock experiments at P - 1 to 2 Mbar has not yet been fully reproduced by ab initio calculations.
In Figs. 141.26 and 141.27, we compare the FPEOS with SESAME, Kerley03, and the classical Debye plasma model for a wide range of densities and temperatures. In these figures, we have normalized the pressure and energy of deuterium plasma by their ideal values, respectively. The ideal pressure (Pid) and energy (Eid) are the sum of contributions from the noninteracting Fermi electron gas together with classical ions. The deviations from these ideal values indicate the contri-bution from the Coulomb interactions. Figure 141.26 plots the normalized (a) pressure and (b) energy as a function of deuterium density for a plasma temperature of T - 10.77 eV.
Figure 141.25(a) The comparison of principal Hugoniot of deuterium among FPEOS, SESAME, and Kerley03; (b) their comparisons with available experimental data: the single-shock data published in Hicks et al.,57 the OMEGA data derived from double-shock experiments by Boehly et al.,105 the Z-machine data by Knudson et al.,54,55 and the experiment by Boriskov et al.106
TC11445JR
P/P
idea
l
0.8
0.7
0.6
0.9
1.0(a)
10–3 10–1
Density (g/cm3)
E/E
idea
l
101
0.6
0.4
0.8
1.0(b)
FPEOSSESAMEKerley03Debye
Figure 141.26The normalized (a) pressure and (b) energy as a function of deuterium den-sity for a plasma temperature at T - 10.77 eV are compared among FPEOS, SESAME, Kerley03, and the classical Debye plasma model. The normalization is done with Pid and Eid, the total pressure and energy, respectively, for the ideal Fermi gas of electrons and the classical ions.
TC11444JR
3.2101
102
103
3.6 4.0
Compression
Pres
sure
(G
Pa)
101
103
102
105
104
Pres
sure
(G
Pa)
4.4 4.8 5.2
344.5 eV
(a)
(b)
86.18 eV43.09 eV
21.54 eV
10.77 eV
5.39 eV2.69 eV1.35 eV
SESAMEKerley03FPEOS
SESAMEKerley03Hicks et al.Boehly et al.Knudson et al.Boriskov et al.FPEOS

Impact of fIrst-prIncIples propertIes of DeuterIum-trItIum on InertIal confInement fusIon target DesIgns
LLE Review, Volume 14136
One sees that at very low densities the plasma is approaching a classical ideal gas; while as the density increases, both the pressure and energy decrease, which manifests the increasing Coulomb interactions among electrons and ions. Both reach a minimum at densities of several g/cm3 for this temperature (T - 10.77 eV), where the warm dense regime is located. As the density continues to increase, the Fermi degeneracy of electrons starts to become more dominant than electron–ion interactions so that the ideal Fermi gas is being approached. Namely, the ratios of both P/Pid and E/Eid gradually increase toward +1 at high densities. As can be seen in Fig. 141.26, the SESAME model underestimates the electron–ion Coulomb interactions, even in the classical regime (tD < 0.1 g/cm3). The improved Kerley03 and the classical Debye model better agree with the FPEOS in this low-density regime. The Debye model fails as plasma density increases to above 0.1 g/cm3 because of its overestimated electron screening and the lack of electron degeneracy. In the warm dense regime of tD - 1 to 10 g/cm3, both the SESAME and Kerley03 models underestimated the Coulomb interactions between electrons and ions. In contrast to the FPEOS, both gave higher pressure and energy in this regime. The Kerley03 model showed an unphysical pres-sure bump around tD = 1 to 3 g/cm3, which has also been noticed and modified in a recent EOS study at Livermore.46 In Fig. 141.27, the normalized (a) pressure and (b) energy are plotted as a function of plasma temperature for the deuterium density of tD = 7.391 g/cm3. The SESAME model underes-timates the pressure at low temperatures (T < 1 eV). As the plasma temperature increases to the high end, the system
exhibits classical behavior as expected. In the warm dense regime (T - 10 to 50 eV for this density), SESAME disagrees more with the FPEOS than the improved Kerley03, especially for the energies illustrated by Fig. 141.27(b).
For the transport and optical properties of warm dense deuterium, there were no direct measurements of thermal conductivity and opacity for the various densities and tempera-tures explored here. However, the optical reflectivity measure-ments77,78 along the principal Hugoniot have been performed on both Nova and OMEGA, which enable us to make direct comparisons with our QMD calculations. In Figs. 141.28(a) and 141.28(b), the optical reflectivity versus the shock speed has been compared with both the recent OMEGA experiment78
and an earlier Nova experiment77 for different VISAR (veloc-ity interferometer system for any reflector) wavelengths of m = 532 nm and m = 808 nm, respectively. The OMEGA experi-ments were taken from a decayed shock in deuterium for many shots. The experimental results are in good agreement with our QMD calculations. The early Nova experiment also compares well with other ab initio calculations.41,43 This experimental confirmation lends credence to the L11 coefficients produced in our QMD studies of reflectivity and, in turn, to the other self-consistently calculated Onsager coefficients that determine thermal conductivity as well as the opacities.
Next, we compare the QMD-calculated l with the Lee–More model prediction in Figs. 141.29(a) and 141.29(b) as a function of plasma temperature for densities of tD = 7.391 g/cm3 and
Figure 141.27The normalized (a) pressure and (b) energy as a function of plasma temperature for the deuterium density of tD - 7.391 g/cm3 are compared among FPEOS, SESAME, Kerley03, and the Debye model.
TC11446JR
10–1 100 101
Temperature (eV)
(a) (b)
P/P
idea
l
1020.4
0.5
0.6
0.7
0.8
0.9
1.0
103 10–1 100 101
Temperature (eV)
E/E
idea
l
1020.0
0.2
0.4
0.6
0.8
1.0
103
FPEOSSESAMEKerley03Debye

Impact of fIrst-prIncIples propertIes of DeuterIum-trItIum on InertIal confInement fusIon target DesIgns
LLE Review, Volume 141 37
tD = 24.945 g/cm3, respectively. For each density point, the lQMD calculations have been performed to the highest tempera-ture, approaching T - TF. The QMD results are represented by the solid red circles. Comparing with the Lee–More model (lLM) widely used in hydrocodes, we find lQMD is higher by a factor of 3 to 10 in the warm regime (T < TF). Such l enhancement in the WDM regime has also been observed in previous publica-tions.59–64 To apply these FP-based lQMD to ICF simulations, we have fit the lQMD results by the following formula:65
ln.
. .
m Z e
k T
Z
Z
20 2
1 0 24
0 095 0 24 1
/ / /
4
3 2 7 2 5 2
QMDe eff
B
eff
eff
QMD
#
##
#
lr
K
=
+
+
_
_^
i
ih
(18)
with the same Spitzer prefactor as used in lLM and Zeff = 1 for deuterium. The generalized QMD Coulomb logarithm has the following form:
n exp n ln .ll ii
ii
i0
1
5
QMD a a b iK C= + +=
^ ^ ^h h h8 B* 4/ (19)
This fifth-order polynomial function of coupling and degeneracy parameters (C,i) has been fit with the lQMD data using multivariable least-square fit. To allow lQMD to converge to lLM at the ideal plasma conditions (C % 1 and i & 1), we have added high-temperature points from lLM into the data set for the global fitting. The resulting fitting parameters are expressed in Table141.II. Overall, the global fit with the above parameters, depicted by Fig. 141.29, gives only a small error of +5%. The
Figure 141.29The QMD-predicted thermal conductivity l of deuterium as a func-tion of plasma temperature for densities of (a) tD - 7.391 g/cm3 and (b) tD - 24.945 g/cm3, which are compared with the Lee–More model and the fitting formula of Eqs. (19) and (20).
Figure 141.28The comparison of reflectivity along the principal Hugoniot of deuterium between experiments and QMD calculations, for different VISAR wavelengths of (a) m = 532 nm (OMEGA experiments) and (b) m = 800 nm (Nova experiments).
TC11447JR
(a) m = 532 nm
10 20 30 40
Shock speed (km/s)
50 60 700.0
Re�
ectiv
ity
0.2
0.4
0.6
0.8
10 20 30
(b) m = 808 nm
40
Shock speed (km/s)
50 60 70
Nova experimentQMD
OMEGA experimentQMD
Lee–MoreQMD �ttingQMD
TC11448JR
10–1 100 101
Temperature (eV)
(a) (b)
The
rmal
con
duct
ivity
(W
/m/K
)
102102
103
104
105
106
107
108
103 100 101
Temperature (eV)
102 103

Impact of fIrst-prIncIples propertIes of DeuterIum-trItIum on InertIal confInement fusIon target DesIgns
LLE Review, Volume 14138
tabulated lQMD of deuterium can be found in the Supplementary Material of Ref. 65.
Finally, we examine the QMD-predicted opacities by com-paring them to the cold-opacity-patched AOT in Figs. 141.30 and 141.31 for the deuterium density tD = 7.391 g/cm3. It is noted that the cold-opacity–patched AOT is currently used in our hydrocodes for radiation-transport simulations with the multigroup diffusion scheme. The total Rosseland opacity is plotted in Fig. 141.30 as a function of the plasma temperature. As the plasma temperature approaches TF, the QMD opacity at T = 43.09 eV converges to the AOT value. Below +30 eV, no data exist in the AOT for the warm dense regime. Historically, the cold opacity of solid deuterium had been patched into the AOT for ICF hydro simulations. Figure 141.30 illustrates that the QMD opacities in the WDM conditions are much higher than the cold opacities. Namely, the density-scaled cold opaci-ties significantly underestimated the photon absorption of warm dense plasmas. This is understandable because as deuterium
is compressed to this density (>35# compression) from solid D2 and warms up to above +10,000 K, energy gaps are filled and the density of states increases in such systems. As a result, photon absorptions become more probable than the cold solid case, leading to higher opacities. Figures 141.31(a) and 141.31(b) plot the corresponding grouped opacities as a function of the central photon energy in each group for plasma temperatures of T = 10.77 eV and T = 43.09 eV, respectively (48 photon-energy groups were used). Figure 141.31(a) shows that at the low plasma temperature of T = 10.77 eV, the grouped opaci-
TC11449JR
100102
104
105
106
103
101 102
Temperature (eV)
Tota
l Ros
sela
nd o
paci
ty (
cm2 /
g)
AOTQMD
Figure 141.30The total Rosseland opacity of deuterium as a function of the plasma tem-perature at a density of tD - 7.391 g/cm3, which are compared between the cold-opacity–patched AOT and the QMD calculations.
TC11450JR
(a)
(b)
Ros
sela
nd m
ean
opac
ity (
cm2 /
g)
10–2
100
102
104
106
Ros
sela
nd m
ean
opac
ity (
cm2 /
g)
10–2
100
102
104
106
ho (eV)
102 103 104
AOTQMD
Figure 141.31The grouped Rosseland mean opacity as a function of the photon energy hv, for the deuterium density of tD - 7.391 g/cm3 at temperatures of (a) T - 10.77 eV and (b) T - 43.09 eV.
Table 141.II: The fitting parameters for the (ln K)QMD.
i ai bi
0 -0.740148
1 -0.181459 +0.861554
2 +6.396443 # 10–4 -0.105704
3 +1.479543 # 10–3 -6.757829 # 10–3
4 -1.233616 # 10–4 -1.69007 # 10–4
5 -2.581072 # 10–5 +3.492008 # 10–5

Impact of fIrst-prIncIples propertIes of DeuterIum-trItIum on InertIal confInement fusIon target DesIgns
LLE Review, Volume 141 39
ties from QMD calculations become overall higher than the cold-opacity values. For photon-energy groups of hv < 2 keV (important to ICF), the QMD opacity is enhanced by a factor of 3 to 100, depending on hv. When the plasma temperature increases to T = 43.09 eV, Fig. 141.31(b) indicates that both the QMD and AOT opacities begin to agree with each other over a wide range of photon energies, except for the first two groups at hv = 50 eV and hv = 85 eV.
The first-principles opacity tables (FPOT) of deuterium and DT have been built from these QMD calculations for a wide range of densities (tD = 0.5 to 673.518 g/cm3) and tem-peratures (from T = 5000 K up to the Fermi temperature for each density point). For higher temperature points (T > TF), we have incorporated the AOT data into the FPOT table since the FP calculations reproduced the AOT data at high-T plasma conditions, which are shown in Figs. 141.30 and 141.31. To make it compatible with our hydrocodes (LILAC and DRACO), we have created the FPOT in both the Rosseland and Planck mean opacities with 48 photon-energy groups for hydro simulations. The tabulated FPOT of deuterium can be found in the Supple-mentary Material of Ref. 76.
Impact of FP-Based Properties of DT on ICF Target Designs
With these FP-calculated tables of FPEOS, FPOT, and lQMD of DT (mass scaled from the deuterium properties) being implemented into our hydrocodes, we have investi-gated their combined effects on the 1-D prediction of ICF implosions through radiation–hydrodynamics simulations. The traditional physics models used in our 1-D hydrocode LILAC107 were the SESAME for EOS, the Lee–More thermal conductivity (lLM), and the cold-opacity–patched AOT. We first examine a typical OMEGA implosion in Figs. 141.32 and 141.33. The cryogenic DT target with a diameter of z = 865 nm [shown in Fig. 141.32(a)] consists of a thin (7.5-nm) double-layer plastic ablator and a 40-nm layer of DT ice. The 3.7-nm outer layer of Si-doped CH is used to reduce laser imprints.108,109 The OMEGA target is driven by a triple-picket laser pulse12,110,111 with a total energy of +26 kJ, illustrated by Fig. 141.32(b). The peak laser intensity is +1015 W/cm2. The properly timed pickets set up a low-adiabat capsule for the main pulse to implode.
In Fig. 141.33 the hydro simulation results using the FP-based properties of DT (FPEOS/FPOT/lQMD) are compared with the traditional models of SESAME/AOT/lLM. The solid red lines represent the FP simulations, while the dashed blue lines
represent the “standard” model predictions. In Fig. 141.33(a), the density and electron temperature profiles of the imploding DT capsule, at the beginning of the deceleration phase (t = 2.96 ns), are plotted as a function of the target radius. We observe that the FP simulation gives a lower peak density of tD = 8.8 g/cm3 and a higher shell temperature of T - 38 eV, in contrast to the standard model predictions of tD = 10.4 g/cm3 and T - 28 eV, respectively. The major contributions to these changes come from EOS and opacity differences, while the thermal conductivity effect is relatively small at this stage. As previously discussed,36,37,76 the stiffer behavior of DT in FPEOS at P = 10 to 100 Mbar causes part of the density drop; while the enhanced opacity from FPOT gives more radiation preheat in the warm dense DT shell, which increases the electron temperature and decreases the peak density inside the DT shell. Figure 141.33(b) displays the predicted minimum adiabat of the DT shell for the two simulations. It indicates that the FP-based simulation gives a higher adiabat of a - 2.8 in contrast to the model-predicted a - 2. These changes in plasma conditions of the DT shell can have a consequence in the overall target performance. Figure 141.33(c) illustrates the mass density and ion-temperature profiles at the peak compression (t = 3.14 ns). The peak density drops from t = 354 g/cm3 in the SESAME/AOT/lLM model simulation to t = 262 g/cm3 in the case of using FP-based DT properties (FPEOS/FPOT/lQMD). Also, the hot-spot pressure, ion temperature, and target convergence ratio are somewhat reduced in the FP simulation. These differences cause +36% reduction in the 1-D neutron yield prediction for the FPEOS/FPOT/lQMD simulation, which is shown by Fig. 141.33(d). Finally, we compare the compression tR history
Figure 141.32(a) A schematic diagram of cryogenic DT target on OMEGA; (b) the triple-picket pulse shape used for low-adiabat cryogenic DT implosions on OMEGA.
TC11451JR
10
4
6
8
10
(a) (b)CHSi [7.4%]: 3.7 nm
CH3.8 nm
40 n
m
2
Time (ns)
Las
er in
tens
ity (
W/c
m2 )
(×10
14)
3
2
DT gas
DT ice
385 μm

Impact of fIrst-prIncIples propertIes of DeuterIum-trItIum on InertIal confInement fusIon target DesIgns
LLE Review, Volume 14140
in Fig. 141.34 for the two simulations. Consistent with the overall performance reduction, the FPEOS/FPOT/lQMD simulation gives a lower peak tR than the model prediction. The neutron-
averaged GtRHn drops from 266 mg/cm2 (SESAME-AOT-lLM) to 228 mg/cm2 (FPOT/FPOT/lQMD). Namely, the compression tR reduction is +15% for this OMEGA implosion.
Next, we study how the FP-based properties of DT affect the direct-drive–ignition target designs for the NIF. As a hydro-equivalent implosion to the OMEGA target discussed above, Fig. 141.35 shows the NIF target and the pulse shape, which are scaled from the hydro-equivalent OMEGA case shown in Fig. 141.32. The z = 3452-nm target consists of a 36-nm CH/CHSi ablator layer and a 190-nm DT layer. The scaled laser pulse has a total energy of 1.5 MJ. According to the standard model prediction, this NIF ignition design should give a low-adiabat (a - 2) implosion. Again, we performed two 1-D hydro simulations using either the FP-based properties of DT or the standard plasma models. The simulation results are compared in Figs. 141.36 and 141.37. In Figs. 141.36(a) and 141.36(b), the density and temperature (Te/Ti) profiles are plotted for the start of the deceleration stage (t = 13.0 ns) and the peak compression at t = 13.84 ns, respectively. Similar to what we have seen for the typical OMEGA implosion, the NIF results also show the reduced density and hot-spot ion temperature in the FPEOS/FPOT/lQMD simulation. The peak ion tem-
Figure 141.33The hydro-simulation results using our first-principles–calculated properties of DT (solid red lines) are compared with the normal model simulation using SESAME-EOS, AOT, and the Lee–More thermal conductivity (dashed blue lines), for the OMEGA implosion shown in Fig. 141.32. The panels illustrate (a) the density and electron temperature profiles at t = 2.96 ns (the start of deceleration), (b) the minimum adiabat a as a function of time, (c) the density and ion temperature profile at peak compression (t = 3.14 ns), and (d) the neutron yield as a function of time.
TC11453JR
2.8 3.0 3.2 3.4 3.6
0.10
0.20
0.30
0.25
0.15
0.05
0.00
Time (ns)
tR
(g/
cm2 )
SESAME AOT lLMFPEOS FPOT lQMD
Figure 141.34The predicted compression tR’s as a function of time are compared for the two simulations of the cryogenic DT implosion on OMEGA shown by Fig. 141.32. The neutron-averaged areal densities are GtRHn = 266 mg/cm2 (SESAME/AOT/lLM) and GtRHn = 228 mg/cm2 (FPOT/FPOT/lQMD), respectively.
Den
sity
(g/
cm3 )
12
TC11452JR
20
Te
(eV
)
0
4
8
20
40
60
80
60 100 140
Min
imum
adi
abat
0
2
4
2 3
0
Den
sity
(g/
cm3 )
Ti (
keV
)0
100
300
200
400
0
4
8
12
10 20 30 40N
eutr
on y
ield
(×10
14)
0
2
4
6
3.0
Radius (nm) Time (ns)
3.4
(a)
(b)
(c)
(d)
SESAME AOT lLMFPEOS FPOT lQMD

Impact of fIrst-prIncIples propertIes of DeuterIum-trItIum on InertIal confInement fusIon target DesIgns
LLE Review, Volume 141 41
peratures inside the hot spot, illustrated by Fig. 141.36(b), are Ti - 10.9 keV from the FP simulation, which is in contrast to the model-predicted Ti - 12.1 keV. The peak density is also reduced to t = 298 g/cm3 in the FPEOS/FPOT/lQMD simula-tion from the model-predicted t = 371 g/cm3. These variations in ion temperature and peak compression can further affect the ignition burn-wave propagation. Figure 141.37(a) compares the FPEOS/FPOT/lQMD and SESAME/AOT/lLM simulations, at the start of burn-wave propagation (t = 13.86 ns). Now, the burn-wave–generated high pressure “reshocks” the shell and the resulting peak-density has a larger discrepancy: t = 532 g/cm3 [SESAME/AOT/lLM] versus t = 366 g/cm3 [FPEOS/FPOT/lQMD]; the temperature of burning plasmas in the hot spot varies from Ti = 17 keV to Ti = 13.4 keV, respectively. At the end, the total neutron yield changes from Y = 2.1 # 1019 [SESAME/AOT/lLM] to Y = 1.2 # 1019 [FPEOS/FPOT/lQMD], as indicated by Fig. 141.37(b). The energy gain varies accordingly by a factor of +2, dropping from G = 40.0 to G = 23.4.
The degradation in target performance discussed above can be attributed to the plasma condition (t/T) changes in the in-flight DT shell. Namely, the model-predicted low adiabat (a - 2) is not reached in the imploding capsule. Instead, a higher adiabat is inferred from the FPEOS/FPOT/lQMD simu-lation. Therefore, to obtain a high-level gain (G = 40), we must use the FPEOS/FPOT/lQMD tables to retune the laser pulse so that the desired low-adiabat implosion can be recovered. As an
example, we show in Fig. 141.38(a) the fine-tuned pulse shape (solid red line) by using the FPEOS/FPOT/lQMD tables. The dashed blue line represents the original pulse shape predicted by the SESAME/AOT/lLM model. Compared to the original pulse, the retuned pulse has a slightly larger separation between the second and third pickets; also, the height of the main pulse’s “step” is now both higher and longer than the original pulse. All these pulse changes place the target adiabat truly in the low level of a - 2, after the shock coalescence and enhanced radia-tion preheat are taken into account. Figure 141.38(b) indicates that the desired high-gain (G - 40) implosion is now recovered with the retuned pulse using the FP-based properties of DT.
TC11454JR
0 2 4 6 8 10 12 14
4
8
10
6
2
0
Time (ns)
Las
er in
tens
ity (
×10
14 W
/cm
2 )CHSi [7.4%]: 10 nm
CH26 nm
190 n
m
DT gas
DT ice
1500
nm
Figure 141.35The model-predicted pulse shape for a direct-drive, low-adiabat (a - 2) igni-tion design for NIF, which is scaled from the OMEGA implosion shown in Fig. 141.32. The insert is a schematic diagram of a NIF target.
TC11455JR
300 350 400
(a)
Den
sity
(g/
cm3 )
4500 20
25
30
35
40
45
2
4
6
8
10
12
Te
(eV
)
(b)
Den
sity
(g/
cm3 )
12
10
8
6
4
2
00 50 100 150
Ti (
keV
)
0
100
200
300
400
SESAME AOT lLMFPEOS FPOT lQMD
Radius (nm)
Figure 141.36The hydro-simulation results using our first-principles–calculated properties of DT (solid red lines) are compared with the standard model simulation using SESAME-EOS, AOT, and the Lee–More thermal conductivity (dashed blue lines), for the NIF design shown in Fig. 141.35. The two panels indicate (a) the density and electron temperature profiles at t = 13.0 ns (the start of deceleration) and (b) the density and ion temperature as a function of radius at peak compression (t = 13.84 ns).

Impact of fIrst-prIncIples propertIes of DeuterIum-trItIum on InertIal confInement fusIon target DesIgns
LLE Review, Volume 14142
In Figs. 141.39 and 141.40, we further investigate a direct-drive NIF design with a very low adiabat (a - 1.5), which is the adiabat level often encountered in indirect-drive ICF implo-sions.2–4 In such lower-adiabat implosions, the DT shells having higher t and lower T are in more strongly coupled and degenerate plasma conditions. Namely, the DT plasmas are readily in the WDM regime, and bigger differences between FPEOS/FPOT/lQMD and SESAME/AOT/lLM are expected. Here, the direct-drive NIF design uses a thin-layer (11-nm) HDC ablator. The HDC ablator has also been considered for indirect-drive target designs.112 The thickness of DT ice is 180 nm with a target diam-eter of z = 2982 nm. This relatively smaller target is intended to be driven by a low-intensity (+6 # 1014 W/cm2), 1-MJ laser pulse (shown in Fig. 141.39). The implosion velocity is also relatively low: vimp - 3 # 107 cm/s. The use of a mid-Z ablator and low-
intensity pulse could avoid possible fast-electron preheat issues caused by the TPD instability.113–116 The 1-D hydro-simulation results are presented in Fig. 141.40, where the peak density and Ti are compared for both FPEOS/FPOT/lQMD and SESAME/AOT/lLM simulations. Figure 141.40(a) shows the situation at the peak compression (t = 13.11 ns), while Fig. 141.40(b) illus-trates the situation at the beginning of burn-wave propagation (t = 13.20 ns). Larger differences are seen in Fig. 141.40(b): t = 713 g/cm3 versus t = 496 g/cm3 and Ti = 20 keV versus Ti = 15.5 keV, respectively, from the SESAME/AOT/lLM and the FPEOS/FPOT/lQMD simulations. The final energy gain varies from the model-predicted G = 28.3 to G = 11.5 in the FP-based simulation. The variation is about a factor of +2.5 between the two simulations, which is even larger than the a = 2 case dis-cussed above.
Figure 141.37(a) Similar comparisons as shown in Fig. 141.36(b), but for a slightly later time (t = 13.86 ns) when the burn wave starts to propagate. The neutron produc-tion as a function of time is compared in (b) for the two simulations, in which the predicted energy gains are G = 40.0 (SESAME/AOT/lLM) and G = 23.4 (FPEOS/FPOT/lQMD), respectively.
Figure 141.38(a) The pulse shape (solid red line) was tuned by hydro-simulation using the first-principles properties of DT (FPEOS/FPOT/lQMD) to recover the high-gain level of G - 40 for the same NIF target shown by the inset in Fig. 141.35. The dashed blue line indicates the original pulse shape predicted by the SESAME/AOT/lLM model for a similar gain level. The panel (b) shows the corresponding neutron yields predicted by hydro simulations using FPEOS/FPOT/lQMD and SESAME/AOT/ lLM , for the same NIF target but different pulse shapes than illustrated in (a).
TC11456JR
0 50 100
Radius (nm)
(a) (b)
Den
sity
(g/
cm3 )
Neu
tron
yie
ld (
×10
19)
1500 0
5
10
15
20
100
200
300
400
500
600
13 14 15
Time (ns)
Ti (
eV)
0.0
1.0
0.5
1.5
2.0
2.5
SESAME AOT lLMFPEOS FPOT lQMD
TC11457JR
0 2 4
Time (ns)
(a)
Las
er in
tens
ity (
×10
14 W
/cm
2 )
Neu
tron
yie
ld (
×10
19)
6
2
0 0.0
0.5
1.0
1.5
2.0
2.5
4
6
8
8 10 12
(b)
13 14
Time (ns)
15
SESAME AOT lLMFPEOS FPOT lQMD

Impact of fIrst-prIncIples propertIes of DeuterIum-trItIum on InertIal confInement fusIon target DesIgns
LLE Review, Volume 141 43
SummaryCombining the first-principles methods of PIMC and QMD,
we have systematically derived accurate self-consistent proper-ties of deuterium plasmas (or DT plasmas by mass scaling) over a wide range of densities and temperatures for ICF applications. They include the first-principles equation of state (FPEOS), the QMD-derived thermal conductivity (lQMD), and the first-principles opacity table (FPOT). Comparing these FP-based properties with the standard models adopted in hydrocodes, we found large discrepancies in the warm dense plasma regime. Implementing these FP-based tables into our hydrocodes, we have examined their combined effects on predicting ICF implo-sions, through hydro-simulations of both OMEGA targets and NIF ignition target designs. In predicting target performance between the FPEOS/FPOT/lQMD simulation and the usual
models SESAME/AOT/lLM, changes of up to a factor of ~2.5 have been seen. The differences are caused by the adiabat increase, related to the stiffer behavior of DT in the pressure range of P = 10 to 100 Mbar, the enhanced opacity of the warm dense DT shell, and the higher thermal conductivity in the shell. The lower the adiabat of an ICF imploding capsule, the more variations expected. The desired high-gain target, which is truly a low-adiabat implosion, should be designed with the FP-based properties of DT fuel.
The stopping power of a particles in warm dense DT plas-mas, recently attracting much attention in model studies and classical-MD calculations,117,118 remains to be investigated by first-principles methods. We also noted that the ablator materi-als (CH, CHSi, and C) were still simulated with the standard
TC11458JR
0 2 4 6 8 10 12 14
6
7
5
4
3
2
1
0
Time (ns)
Las
er in
tens
ity (
×10
14 W
/cm
2 )HDC: 11 nm
180 n
m
DT gas
DT ice
1300
nm Figure 141.39
A very-low-adiabat (a - 1.5), low-implosion-velocity (vimp = 3.0 # 107 cm/s), direct-drive–ignition design for the NIF, which uses high-density carbon (HDC) as the thin-layer ablator. The target dimensions are illustrated in the inset. The mid-Z ablator and the lower peak intensity (+6 # 1014 W/cm2) can help to reduce the TPD instability to avoid possible fast-electron preheat.
Figure 141.40Simulation results for the thin HDC abla-tor target shown in Fig. 141.39: (a) the density and ion temperature profiles at the peak compression (t = 13.11 ns) and (b) the similar situation for a slightly later time (t = 13.20 ns) when the burn wave starts to propagate. The predicted energy gains are G = 28.3 (SESAME/AOT/lLM) and G = 11.5 (FPOT/FPOT/lQMD), respectively.
TC11459JR
20 60 100
Radius (nm)
(a) (b)
Den
sity
(g/
cm3 )
Den
sity
(g/
cm3 )
1400 0
4
2
6
8
10
12 24
20
16
12
8
4
0
600
500
400
300
200
100
0 60 100 140
Radius (nm)
Ti (
eV)
Ti (
keV
)
0
200
400
600
800
SESAME AOT lLMFPEOS FPOT lQMD

Impact of fIrst-prIncIples propertIes of DeuterIum-trItIum on InertIal confInement fusIon target DesIgns
LLE Review, Volume 14144
models in the current study. Whether or not that might change the prediction of the overall target performance remains to be investigated in future studies. But if we follow the same spirit of systematic work on DT, we could extend such first-principles studies to ICF-relevant ablator materials in the near future. Completely knowing the warm-dense–plasma properties of both DT and ablator materials would not only be beneficial for reliable ICF target designs but also improve our understanding of material behavior under HED conditions in general. We also hope that such first-principles studies will facilitate future experiments in the relevant plasma conditions.
ACKNOWLEDGMENTThis material is based upon work supported by the Department of
Energy National Nuclear Security Administration under Award Number DE-NA0001944, the University of Rochester, and the New York State Energy Research and Development Authority. The support of DOE does not constitute an endorsement by DOE of the views expressed in this article. This work was also supported by Scientific Campaign 10 at the Los Alamos National Laboratory, operated by Los Alamos National Security, LLC for the National Nuclear Security Administration of the U.S. Department of Energy under Contract No. DE-AC52-06NA25396. B. Militzer acknowl-edges support from NSF and NASA.
REFERENCES
1. J. Nuckolls et al., Nature 239, 139 (1972).
2. S. W. Haan, J. D. Lindl, D. A. Callahan, D. S. Clark, J. D. Salmonson, B. A. Hammel, L. J. Atherton, R. C. Cook, M. J. Edwards, S. Glenzer, A. V. Hamza, S. P. Hatchett, M. C. Herrmann, D. E. Hinkel, D. D. Ho, H. Huang, O. S. Jones, J. Kline, G. Kyrala, O. L. Landen, B. J. MacGowan, M. M. Marinak, D. D. Meyerhofer, J. L. Milovich, K. A. Moreno, E. I. Moses, D. H. Munro, A. Nikroo, R. E. Olson, K. Peterson, S. M. Pollaine, J. E. Ralph, H. F. Robey, B. K. Spears, P. T. Springer, L. J. Suter, C. A. Thomas, R. P. Town, R. Vesey, S. V. Weber, H. L. Wilkens, and D. C Wilson, Phys. Plasmas 18, 051001 (2011).
3. M. J. Edwards, J. D. Lindl, B. K. Spears, S. V. Weber, L. J. Atherton, D. L. Bleuel, D. K. Bradley, D. A. Callahan, C. J. Cerjan, D. Clark, G. W. Collins, J. E. Fair, R. J. Fortner, S. H. Glenzer, S. W. Haan, B. A. Hammel, A. V. Hamza, S. P. Hatchett, N. Izumi, B. Jacoby, O. S. Jones, J. A. Koch, B. J. Kozioziemski, O. L. Landen, R. Lerche, B. J. MacGowan, A. J. MacKinnon, E. R. Mapoles, M. M. Marinak, M. Moran, E. I. Moses, D. H. Munro, D. H. Schneider, S. M. Sepke, D. A. Shaughnessy, P. T. Springer, R. Tommasini, L. Bernstein, W. Stoeffl, R. Betti, T. R. Boehly, T. C. Sangster, V. Yu. Glebov, P. W. McKenty, S. P. Regan, D. H. Edgell, J. P. Knauer, C. Stoeckl, D. R. Harding, S. Batha, G. Grim, H. W. Herrmann, G. Kyrala, M. Wilke, D. C. Wilson, J. Frenje, R. Petrasso, K. Moreno, H. Huang, K. C. Chen, E. Giraldez, J. D. Kilkenny, M. Mauldin, N. Hein, M. Hoppe, A. Nikroo, and R. J. Leeper, Phys. Plasmas 18, 051003 (2011).
4. C. Cherfils-Clérouin et al., J. Phys.: Conf. Ser. 244, 022009 (2010).
5. D. D. Meyerhofer, R. L. McCrory, R. Betti, T. R. Boehly, D. T. Casey, T. J. B. Collins, R. S. Craxton, J. A. Delettrez, D. H. Edgell, R. Epstein, K. A. Fletcher, J. A. Frenje, V. Yu. Glebov, V. N. Goncharov, D. R.
Harding, S. X. Hu, I. V. Igumenshchev, J. P. Knauer, C. K. Li, J. A. Marozas, F. J. Marshall, P. W. McKenty, P. M. Nilson, S. P. Padalino, R. D. Petrasso, P. B. Radha, S. P. Regan, T. C. Sangster, F. H. Séguin, W. Seka, R. W. Short, D. Shvarts, S. Skupsky, J. M. Soures, C. Stoeckl, W. Theobald, and B. Yaakobi, Nucl. Fusion 51, 053010 (2011).
6. R. L. McCrory, R. Betti, T. R. Boehly, D. T. Casey, T. J. B. Collins, R. S. Craxton, J. A. Delettrez, D. H. Edgell, R. Epstein, J. A. Frenje, D. H. Froula, M. Gatu-Johnson, V. Yu. Glebov, V. N. Goncharov, D. R. Harding, M. Hohenberger, S. X. Hu, I. V. Igumenshchev, T. J. Kessler, J. P. Knauer, C. K. Li, J. A. Marozas, F. J. Marshall, P. W. McKenty, D. D. Meyerhofer, D. T. Michel, J. F. Myatt, P. M. Nilson, S. J. Padalino, R. D. Petrasso, P. B. Radha, S. P. Regan, T. C. Sangster, F. H. Séguin, W. Seka, R. W. Short, A. Shvydky, S. Skupsky, J. M. Soures, C. Stoeckl, W. Theobald, B. Yaakobi, and J. D. Zuegel, Nucl. Fusion 53, 113021 (2013).
7. O. A. Hurricane et al., Nature 506, 343 (2014).
8. S. X. Hu, V. N. Goncharov, and S. Skupsky, Phys. Plasmas 19, 072703 (2012).
9. D. S. Clark et al., Phys. Plasmas 18, 082701 (2011).
10. T. R. Dittrich et al., Phys. Rev. Lett. 112, 055002 (2014).
11. S. X. Hu, P. B. Radha, J. A. Marozas, R. Betti, T. J. B. Collins, R. S. Craxton, J. A. Delettrez, D. H. Edgell, R. Epstein, V. N. Goncharov, I. V. Igumenshchev, F. J. Marshall, R. L. McCrory, D. D. Meyerhofer, S. P. Regan, T. C. Sangster, S. Skupsky, V. A. Smalyuk, Y. Elbaz, and D. Shvarts, Phys. Plasmas 16, 112706 (2009).
12. S. X. Hu, V. N. Goncharov, P. B. Radha, J. A. Marozas, S. Skupsky, T. R. Boehly, T. C. Sangster, D. D. Meyerhofer, and R. L. McCrory, Phys. Plasmas 17, 102706 (2010).
13. S. Atzeni and J. Meyer-ter-Vehn, The Physics of Inertial Fusion: Beam Plasma Interaction, Hydrodynamics, Hot Dense Matter, International Series of Monographs on Physics (Clarendon Press, Oxford, 2004).
14. S. X. Hu, V. A. Smalyuk, V. N. Goncharov, J. P. Knauer, P. B. Radha, I. V. Igumenshchev, J. A. Marozas, C. Stoeckl, B. Yaakobi, D. Shvarts, T. C. Sangster, P. W. McKenty, D. D. Meyerhofer, S. Skupsky, and R. L. McCrory, Phys. Rev. Lett. 100, 185003 (2008).
15. R. C. Malone, R. L. McCrory, and R. L. Morse, Phys. Rev. Lett. 34, 721 (1975).
16. V. N. Goncharov, T. C. Sangster, P. B. Radha, R. Betti, T. R. Boehly, T. J. B. Collins, R. S. Craxton, J. A. Delettrez, R. Epstein, V. Yu. Glebov, S. X. Hu, I. V. Igumenshchev, J. P. Knauer, S. J. Loucks, J. A. Marozas, F. J. Marshall, R. L. McCrory, P. W. McKenty, D. D. Meyerhofer, S. P. Regan, W. Seka, S. Skupsky, V. A. Smalyuk, J. M. Soures, C. Stoeckl, D. Shvarts, J. A. Frenje, R. D. Petrasso, C. K. Li, F. Séguin, W. Manheimer, and D. G. Colombant, Phys. Plasmas 15, 056310 (2008).
17. S. X. Hu, V. Smalyuk, V. N. Goncharov, S. Skupsky, T. C. Sangster, D. D. Meyerhofer, and D. Shvarts, Phys. Rev. Lett. 101, 055002 (2008).
18. S. Skupsky, Phys. Rev. A 16, 727 (1977).
19. C. K. Li and R. D. Petrasso, Phys. Rev. Lett. 70, 3059 (1993).

Impact of fIrst-prIncIples propertIes of DeuterIum-trItIum on InertIal confInement fusIon target DesIgns
LLE Review, Volume 141 45
20. L. S. Brown, D. L. Preston, and R. L. Singleton, Jr., Phys. Rep. 410, 237 (2005).
21. M. C. Herrmann, M. Tabak, and J. D. Lindl, Nucl. Fusion 41, 99 (2001).
22. C. D. Zhou and R. Betti, Phys. Plasmas 15, 102707 (2008).
23. R. Nora, R. Betti, K. S. Anderson, A. Shvydky, A. Bose, K. M. Woo, A. R. Christopherson, J. A. Marozas, T. J. B. Collins, P. B. Radha, S. X. Hu, R. Epstein, F. J. Marshall, R. L. McCrory, T. C. Sangster, and D. D. Meyerhofer, Phys. Plasmas 21, 056316 (2014).
24. V. N. Goncharov, T. C. Sangster, R. Betti, T. R. Boehly, M. J. Bonino, T. J. B. Collins, R. S. Craxton, J. A. Delettrez, D. H. Edgell, R. Epstein, R. K. Follet, C. J. Forrest, D. H. Froula, V. Yu. Glebov, D. R. Harding, R. J. Henchen, S. X. Hu, I. V. Igumenshchev, R. Janezic, J. H. Kelly, T. J. Kessler, T. Z. Kosc, S. J. Loucks, J. A. Marozas, F. J. Marshall, A. V. Maximov, R. L. McCrory, P. W. McKenty, D. D. Meyerhofer, D. T. Michel, J. F. Myatt, R. Nora, P. B. Radha, S. P. Regan, W. Seka, W. T. Shmayda, R. W. Short, A. Shvydky, S. Skupsky, C. Stoeckl, B. Yaakobi, J. A. Frenje, M. Gatu-Johnson, R. D. Petrasso, and D. T. Casey, Phys. Plasmas 21, 056315 (2014).
25. B. I. Bennett et al., Los Alamos National Laboratory, Los Alamos, NM, Report LA-7130 (1978).
26. G. I. Kerley, Sandia National Laboratory, Albuquerque, NM, Report SAND2003-3613 (2003).
27. G. I. Kerley, Phys. Earth Planet. Inter. 6, 78 (1972).
28. Y. T. Lee and R. M. More, Phys. Fluids 27, 1273 (1984).
29. B. Wilson et al., J. Quant. Spectrosc. Radiat. Transf. 99, 658 (2006).
30. W. F. Huebner et al., Los Alamos National Laboratory, Los Alamos, NM, Report LA-6760-M (1977).
31. C. A. Iglesias and F. J. Rogers, Astrophys. J. 464, 943 (1996).
32. C. Pierleoni et al., Phys. Rev. Lett. 73, 2145 (1994).
33. B. Militzer and D. M. Ceperley, Phys. Rev. Lett. 85, 1890 (2000).
34. B. Militzer et al., Phys. Rev. Lett. 87, 275502 (2001).
35. V. S. Filinov et al., Plasma Phys. Control. Fusion 43, 743 (2001).
36. S. X. Hu, B. Militzer, V. N. Goncharov, and S. Skupsky, Phys. Rev. Lett. 104, 235003 (2010).
37. S. X. Hu, B. Militzer, V. N. Goncharov, and S. Skupsky, Phys. Rev. B 84, 224109 (2011).
38. L. Collins et al., Phys. Rev. E 52, 6202 (1995).
39. J. G. Clérouin and S. Bernard, Phys. Rev. E 56, 3534 (1997).
40. J. Clérouin and J.-F. Dufrêche, Phys. Rev. E 64, 066406 (2001).
41. L. A. Collins et al., Phys. Rev. B 63, 184110 (2001).
42. M. P. Desjarlais, Phys. Rev. B 68, 064204 (2003).
43. B. Holst, R. Redmer, and M. P. Desjarlais, Phys. Rev. B 77, 184201 (2008).
44. L. Caillabet, S. Mazevet, and P. Loubeyre, Phys. Rev. B 83, 094101 (2011).
45. L. A. Collins, J. D. Kress, and D. E. Hanson, Phys. Rev. B 85, 233101 (2012).
46. M. A. Morales et al., High Energy Density Phys. 8, 5 (2012).
47. J. Vorberger, D. O. Gericke, and W. D. Kraeft, High Energy Density Phys. 9, 448 (2013).
48. C. Wang and P. Zhang, Phys. Plasmas 20, 092703 (2013).
49. V. V. Karasiev et al., Phys. Rev. B 88, 161108(R) (2013).
50. J. M. McMahon et al., Rev. Mod. Phys. 84, 1607 (2012).
51. L. B. Da Silva et al., Phys. Rev. Lett. 78, 483 (1997).
52. G. W. Collins et al., Science 281, 1178 (1998).
53. A. N. Mostovych et al., Phys. Rev. Lett. 85, 3870 (2000); A. N. Mostovych et al., Phys. Plasmas 8, 2281 (2001).
54. M. D. Knudson et al., Phys. Rev. Lett. 87, 225501 (2001).
55. M. D. Knudson et al., Phys. Rev. Lett. 90, 035505 (2003).
56. V. E. Fortov et al., Phys. Rev. Lett. 99, 185001 (2007).
57. D. G. Hicks, T. R. Boehly, P. M. Celliers, J. H. Eggert, S. J. Moon, D. D. Meyerhofer, and G. W. Collins, Phys. Rev. B 79, 014112 (2009).
58. P. Loubeyre, S. Brygoo, J. Eggert, P. M. Celliers, D. K. Spaulding, J. R. Rygg, T. R. Boehly, G. W. Collins, and R. Jeanloz, Phys. Rev. B 86, 144115 (2012).
59. V. Recoules et al., Phys. Rev. Lett. 102, 075002 (2009).
60. F. Lambert et al., Phys. Plasmas 18, 056306 (2011).
61. D. E. Hanson et al., Phys. Plasmas 18, 082704 (2011).
62. B. Holst, M. French, and R. Redmer, Phys. Rev. B 83, 235120 (2011).
63. C. E. Starrett et al., Phys. Plasmas 19, 102709 (2012).
64. C. Wang et al., Phys. Rev. E 88, 013106 (2013).
65. S. X. Hu, L. A. Collins, T. R. Boehly, J. D. Kress, V. N. Goncharov, and S. Skupsky, Phys. Rev. E 89, 043105 (2014).
66. J. D. Kress et al., High Energy Density Phys. 7, 155 (2011).
67. J. D. Kress et al., Phys. Rev. E 82, 036404 (2010).
68. G. Faussurier et al., Phys. Plasmas 21, 092706 (2014).
69. G. Dimonte and J. Daligault, Phys. Rev. Lett. 101, 135001 (2008).
70. B. Jeon et al., Phys. Rev. E 78, 036403 (2008).

Impact of fIrst-prIncIples propertIes of DeuterIum-trItIum on InertIal confInement fusIon target DesIgns
LLE Review, Volume 14146
71. J. N. Glosli et al., Phys. Rev. E 78, 025401 (R) (2008).
72. L. X. Benedict et al., Phys. Rev. Lett. 102, 205004 (2009).
73. B. Xu and S. X. Hu, Phys. Rev. E 84, 016408 (2011).
74. L. X. Benedict et al., Phys. Rev. E 86, 046406 (2012).
75. C. Blancard, J. Clérouin, and G. Faussurier, High Energy Density Phys. 9, 247 (2013).
76. S. X. Hu, L. A. Collins, V. N. Goncharov, T. R. Boehly, R. Epstein, R. L. McCrory, and S. Skupsky, Phys. Rev. E 90, 033111 (2014).
77. P. M. Celliers et al., Phys. Rev. Lett. 84, 5564 (2000).
78. T. R. Boehly, D. H. Munro, P. M. Celliers, R. E. Olson, D. G. Hicks, V. N. Goncharov, G. W. Collins, H. F. Robey, S. X. Hu, J. A. Marozas, T. C. Sangster, O. L. Landen, and D. D. Meyerhofer, Phys. Plasmas 16, 056302 (2009); T. R. Boehly, V. N. Goncharov, W. Seka, S. X. Hu, J. A. Marozas, D. D. Meyerhofer, P. M. Celliers, D. G. Hicks, M. A. Barrios, D. Fratanduono, and G. W. Collins, Phys. Plasmas 18, 092706 (2011); T. R. Boehly, V. N. Goncharov, W. Seka, M. A. Barrios, P. M. Celliers, D. G. Hicks, G. W. Collins, S. X. Hu, J. A. Marozas, and D. D. Meyerhofer, Phys. Rev. Lett. 106, 195005 (2011).
79. C. Wang, X.-T. He, and P. Zhang, Phys. Plasmas 18, 082707 (2011).
80. S. Hamel, L. X. Benedict, P. M. Celliers, M. A. Barrios, T. R. Boehly, G. W. Collins, T. Döppner, J. H. Eggert, D. R. Farley, D. G. Hicks, J. L. Kline, A. Lazicki, S. LePape, A. J. Mackinnon, J. D. Moody, H. F. Robey, E. Schwegler, and P. A. Sterne, Phys. Rev. B 86, 094113 (2012).
81. K. P. Driver and B. Militzer, Phys. Rev. Lett. 108, 115502 (2012).
82. S. X. Hu, T. R. Boehly, and L. A. Collins, Phys. Rev. E 89, 063104 (2014).
83. T. R. Mattsson et al., Phys. Rev. B 81, 054103 (2010).
84. L. X. Benedict et al., Phys. Rev. B 89, 224109 (2014).
85. R. F. Smith et al., Nature 511, 330 (2014).
86. S. H. Glenzer et al., Science 327, 1228 (2010).
87. A. L. Kritcher et al., Phys. Rev. Lett. 107, 015002 (2011).
88. S. H. Glenzer et al., Phys. Rev. Lett. 90, 175002 (2003).
89. S. P. Regan, K. Falk, G. Gregori, P. B. Radha, S. X. Hu, T. R. Boehly, B. J. B. Crowley, S. H. Glenzer, O. L. Landen, D. O. Gericke, T. Döppner, D. D. Meyerhofer, C. D. Murphy, T. C. Sangster, and J. Vorberger, Phys. Rev. Lett. 109, 265003 (2012).
90. E. L. Pollock, Comput. Phys. Commun. 52, 49 (1988).
91. D. M. Ceperley, Rev. Mod. Phys. 67, 279 (1995).
92. D. M. Ceperley, in Monte Carlo and Molecular Dynamics of Con-densed Matter Systems, edited by K. Binder and G. Ciccotti (Italian Physical Society, Bologna, Italy, 1996).
93. B. Militzer and E. L. Pollock, Phys. Rev. E 61, 3470 (2000).
94. B. Militzer, Phys. Rev. Lett. 97, 175501 (2006).
95. B. Militzer, Phys. Rev. B 79, 155105 (2009).
96. P. Hohenberg and W. Kohn, Phys. Rev. 136, B864 (1964).
97. W. Kohn and L. J. Sham, Phys. Rev. 140, A1133 (1965).
98. N. D. Mermin, Phys. Rev. 137, A1441 (1965).
99. G. Kresse and J. Hafner, Phys. Rev. B 47, 558 (1993).
100. G. Kresse and J. Hafner, Phys. Rev. B 49, 14,251 (1994).
101. J. P. Perdew, K. Burke, and M. Ernzerhof, Phys. Rev. Lett. 77, 3865 (1996); ibid. 78, 1396(E) (1997).
102. R. Kubo, J. Phys. Soc. Jpn. 12, 570 (1957); D. A. Greenwood, Proc. Phys. Soc. Lond. 71, 585 (1958).
103. F. Perrot, Laser Part. Beams 14, 731 (1996).
104. For details of the ABINIT code, please refer to http://www.abinit.org/.
105. T. R. Boehly, D. G. Hicks, P. M. Celliers, T. J. B. Collins, R. Earley, J. H. Eggert, D. Jacobs-Perkins, S. J. Moon, E. Vianello, D. D. Meyerhofer, and G. W. Collins, Phys. Plasmas 11, L49 (2004).
106. G. V. Boriskov et al., Phys. 48, 553 (2003).
107. J. Delettrez, R. Epstein, M. C. Richardson, P. A. Jaanimagi, and B. L. Henke, Phys. Rev. A 36, 3926 (1987).
108. S. X. Hu, G. Fiksel, V. N. Goncharov, S. Skupsky, D. D. Meyerhofer, and V. A. Smalyuk, Phys. Rev. Lett. 108, 195003 (2012).
109. G. Fiksel, S. X. Hu, V. N. Goncharov, D. D. Meyerhofer, T. C. Sangster, V. A. Smalyuk, B. Yaakobi, M. J. Bonino, and R. Jungquist, Phys. Plasmas 19, 062704 (2012).
110. V. N. Goncharov, T. C. Sangster, T. R. Boehly, S. X. Hu, I. V. Igumenshchev, F. J. Marshall, R. L. McCrory, D. D. Meyerhofer, P. B. Radha, W. Seka, S. Skupsky, C. Stoeckl, D. T. Casey, J. A. Frenje, and R. D. Petrasso, Phys. Rev. Lett. 104, 165001 (2010).
111. T. C. Sangster, V. N. Goncharov, R. Betti, P. B. Radha, T. R. Boehly, D. T. Casey, T. J. B. Collins, R. S. Craxton, J. A. Delettrez, D. H. Edgell, R. Epstein, C. J. Forrest, J. A. Frenje, D. H. Froula, M. Gatu-Johnson, V. Yu. Glebov, D. R. Harding, M. Hohenberger, S. X. Hu, I. V. Igumenshchev, R. Janezic, J. H. Kelly, T. J. Kessler, C. Kingsley, T. Z. Kosc, J. P. Knauer, S. J. Loucks, J. A. Marozas, F. J. Marshall, A. V. Maximov, R. L. McCrory, P. W. McKenty, D. D. Meyerhofer, D. T. Michel, J. F. Myatt, R. D. Petrasso, S. P. Regan, W. Seka, W. T. Shmayda, R. W. Short, A. Shvydky, S. Skupsky, J. M. Soures, C. Stoeckl, W. Theobald, V. Versteeg, B. Yaakobi, and J. D. Zuegel, Phys. Plasmas 20, 056317 (2013).
112. O. L. Landen, D. K. Bradley, D. G. Braun, V. A. Smalyuk, D. G. Hicks, P. M. Celliers, S. Prisbrey, R. Page, T. R. Boehly, S. W. Haan, D. H. Munro, R. G. Wallace, A. Nikroo, A. Hamza, J. Biener, C. Wild, E. Woerner, R. E. Olson, G. A. Rochau, M. Knudson, D. C. Wilson, H. F. Robey, G. W. Collins, D. Ho, J. Edwards, M. M. Marinak, B. A. Hammel, D. D. Meyerhofer, and B. J. MacGowan, J. Phys.: Conf. Ser. 112, 022004 (2008).

Impact of fIrst-prIncIples propertIes of DeuterIum-trItIum on InertIal confInement fusIon target DesIgns
LLE Review, Volume 141 47
113. D. H. Froula, B. Yaakobi, S. X. Hu, P.-Y. Chang, R. S. Craxton, D. H. Edgell, R. Follett, D. T. Michel, J. F. Myatt, W. Seka, R. W. Short, A. Solodov, and C. Stoeckl, Phys. Rev. Lett. 108, 165003 (2012).
114. D. T. Michel, A. V. Maximov, R. W. Short, S. X. Hu, J. F. Myatt, W. Seka, A. A. Solodov, B. Yaakobi, and D. H. Froula, Phys. Rev. Lett. 109, 155007 (2012).
115. S. X. Hu, D. T. Michel, D. H. Edgell, D. H. Froula, R. K. Follett, V. N. Goncharov, J. F. Myatt, S. Skupsky, and B. Yaakobi, Phys. Plasmas 20, 032704 (2013).
116. J. F. Myatt, H. X. Vu, D. F. DuBois, D. A. Russell, J. Zhang, R. W. Short, and A. V. Maximov, Phys. Plasmas 20, 052705 (2013).
117. L. S. Brown and R. L. Singleton, Phys. Rev. E 79, 066407 (2009).
118. P. E. Grabowski et al., Phys. Rev. Lett. 111, 215002 (2013).