trian’s discussion points
TRANSCRIPT

Trian’s Discussion Points
April 21, 2015
© 2015 Trian Fund Management, L.P. All rights reserved.

Disclosure Statement And Disclaimers
2
Additional Information
Trian Fund Management, L.P. (“Trian”) and the investment funds that it manages that hold shares of E.I. du Pont de Nemours and Company (collectively, Trian with such funds, “Trian Partners”) together with other Participants (as defined below), filed a definitive proxy statement and an accompanying proxy card with the Securities and Exchange Commission (the “SEC”) on March 25, 2015 to be used to solicit proxies in connection with the 2015 Annual Meeting of Stockholders of E.I. du Pont de Nemours and Company (the “Company”), including any adjournments or postponements thereof or any special meeting that may be called in lieu thereof (the “2015 Annual Meeting”). Information relating to the participants in such proxy solici tation (the “Participants”) has been included in that definitive proxy statement and in any other amendments to that definitive proxy statement. Stockholders are advised to read the definitive proxy statement and any other documents related to the solicitation of stockholders of the Company in connection with the 2015 Annual Meeting because they contain important information, including additional information relating to the Participants. Trian Partners’ definitive proxy statement and a form of proxy have been mailed to stockholders of the Company. These materials and other materials filed by Trian Partners in connection with the solicitation of proxies are available at no charge at the SEC’s website at www.sec.gov. The definitive proxy statement and other relevant documents f iled by Trian Partners with the SEC are also available, without charge, by directing a request to Trian’s proxy solicitor, MacKenzie Partners, Inc. 105 Madison Avenue, New York, New York 10016 (call collect: 212-929-5500; call toll free: 800-322-2885) or email: [email protected]
General Considerations
This presentation is for general informational purposes only, is not complete and does not constitute an agreement, offer, a solicitation of an offer, or any advice or recommendation to enter into or conclude any transaction or confirmation thereof (whether on the terms shown herein or otherwise). This presentation should not be construed as legal, tax, investment, financial or other advice. The views expressed in this presentation represent the opinions of Trian Partners, and are based on publicly available information with respect to the Company and the other companies referred to herein. Trian Partners recognizes that there may be confidential information in the possession of the companies discussed in this presentation that could lead such companies to disagree with Trian Partners’ conclusions. Certain financial information and data used herein have been derived or obtained from filings made with the SEC or other regulatory authorities and from other third party reports. Trian Partners currently beneficially owns shares of the Company.
Trian Partners has not sought or obtained consent from any third party to use any statements or information indicated herein as having been obtained or derived from statements made or published by third parties. Any such statements or information should not be viewed as indicating the support of such third party for the views expressed herein. Trian Partners does not endorse third-party estimates or research which are used in this presentation solely for illustrative purposes. No warranty is made that data or information, whether derived or obtained from filings made with the SEC or any other regulatory agency or from any third party, are accurate. Past performance is not an indication of future results.
Neither the Participants nor any of their affiliates shall be responsible or have any liability for any misinformation contained in any third party, SEC or other regulatory filing or third party report. Unless otherwise indicated, the figures presented in this presentation, including return on invested capital (“ROIC”) and investment values have not been calculated using generally accepted accounting principles (“GAAP”) and have not been audited by independent accountants. Such figures may vary from GAAP accounting in material respects and there can be no assurance that the unrealized values reflected in this presentation will be realized. This is not meant to be, nor is it, a prediction of the future trading price or market value of securities of the Company. There is no assurance or guarantee with respect to the prices at which any securities of the Company will trade, and such securities may not trade at prices that may be implied herein. The estimates, projections, pro forma information and potential impact of the opportunities identified by Trian Partners herein are based on assumptions that Trian Partners believes to be reasonable as of the date of this presentation, but there can be no assurance or guarantee that actual results or performance of the Company will not differ, and such differences may be material. This presentation does not recommend the purchase or sale of any security.
Trian Partners reserves the right to change any of its opinions expressed herein at any time as it deems appropriate. Trian Partners disclaims any obligation to update the data, information or opinions contained in this presentation.
Note: Disclosure Statement and Disclaimers are continued on the next page

Disclosure Statement And Disclaimers (cont’d)
3
Forward-Looking Statements
This presentation contains forward-looking statements. All statements contained in this presentation that are not clearly historical in nature or that necessarily depend on future events are forward-looking, and the words “anticipate,” “believe,” “expect,” “potential,” “opportunity,” “estimate,” “plan,” and similar expressions are generally intended to identify forward-looking statements. The projected results and statements contained in this presentation that are not historical facts are based on current expectations, speak only as of the date of this presentation and involve risks, uncertainties and other factors that may cause actual results, performance or achievements to be materially different from any future results, performance or achievements expressed or implied by such projected results and statements. Assumptions relating to the foregoing involve judgments with respect to, among other things, future economic, competitive and market conditions and future business decisions, all of which are difficult or impossible to predict accurately and many of which are beyond the control of Trian Partners. Although Trian Partners believes that the assumptions underlying the projected results or forward-looking statements are reasonable as of the date of this presentation, any of the assumptions could be inaccurate and, therefore, there can be no assurance that the projected results or forward-looking statements included in this presentation will prove to be accurate. In light of the significant uncertainties inherent in the projected results and forward-looking statements included in this presentation, the inclusion of such information should not be regarded as a representation as to future results or that the objectives and initiatives expressed or implied by such projected results and forward-looking statements will be achieved. Trian Partners will not undertake and specifically declines any obligation to disclose the results of any revisions that may be made to any projected results or forward-looking statements in this presentation to reflect events or circumstances after the date of such projected results or statements or to reflect the occurrence of anticipated or unanticipated events.
Not An Offer to Sell or a Solicitation of an Offer to Buy
Under no circumstances is this presentation intended to be, nor should it be construed as, an offer to sell or a solicitation of an offer to buy any security. Funds managed by Trian are in the business of trading -- buying and selling -- securities. It is possible that there will be developments in the future that cause one or more of such funds from time to time to sell all or a portion of their holdings in open market transactions or otherwise (including via short sales), buy additional shares (in open market or privately negotiated transactions or otherwise), or trade in options, puts, calls or other derivative instruments relating to such shares. Consequently, Trian Partners’ beneficial ownership of shares of, and/or economic interest in, the Company‘s common stock may vary over time depending on various factors, with or without regard to Trian Partners’ views of the Company’s business, prospects or valuation (including the market price of the Company’s common stock), including without limitation, other investment opportunities available to Trian Partners, concentration of positions in the portfolios managed by Trian, conditions in the securities markets and general economic and industry conditions. Trian Partners also reserves the right to change its intentions with respect to its investments in the Company and take any actions with respect to investments in the Company as it may deem appropriate.
Concerning Intellectual Property
All registered or unregistered service marks, trademarks and trade names referred to in this presentation are the property of their respective owners, and Trian Partners’ use herein does not imply an affiliation with, or endorsement by, the owners of these service marks, trademarks and trade names.

4
Introduction
5
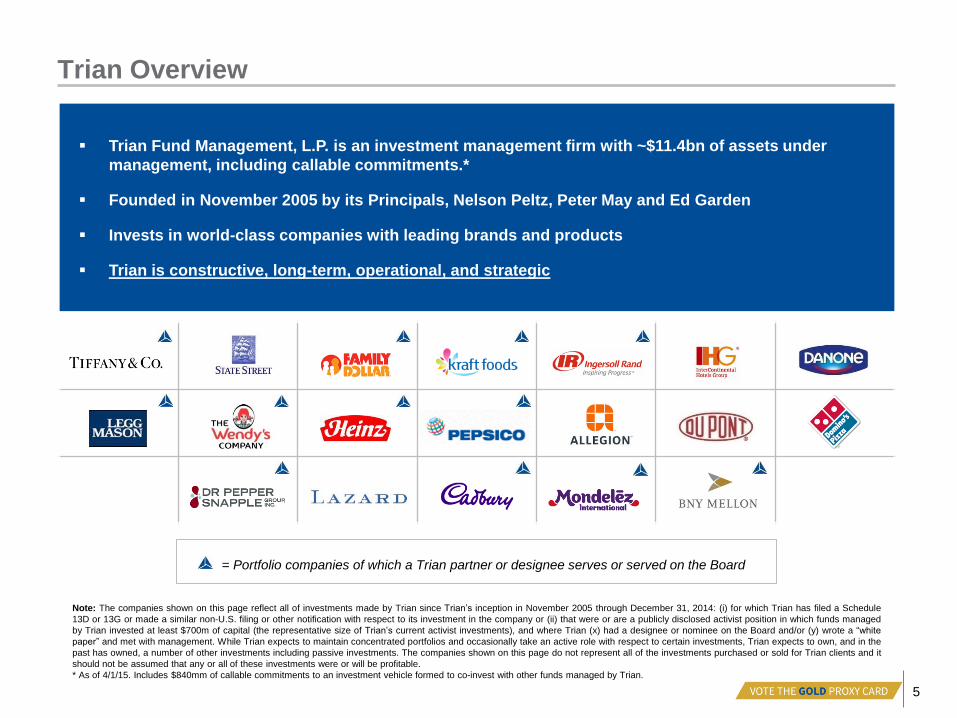
Trian Overview
Trian Fund Management, L.P. is an investment management firm with ~$11.4bn of assets under
management, including callable commitments.*
Founded in November 2005 by its Principals, Nelson Peltz, Peter May and Ed Garden
Invests in world-class companies with leading brands and products
Trian is constructive, long-term, operational, and strategic
Note: The companies shown on this page reflect all of investments made by Trian since Trian’s inception in November 2005 through December 31, 2014: (i) for which Trian has filed a Schedule
13D or 13G or made a similar non-U.S. filing or other notification with respect to its investment in the company or (ii) that were or are a publicly disclosed activist position in which funds managed
by Trian invested at least $700m of capital (the representative size of Trian’s current activist investments), and where Trian (x) had a designee or nominee on the Board and/or (y) wrote a “white
paper” and met with management. While Trian expects to maintain concentrated portfolios and occasionally take an active role with respect to certain investments, Trian expects to own, and in the
past has owned, a number of other investments including passive investments. The companies shown on this page do not represent all of the investments purchased or sold for Trian clients and it
should not be assumed that any or all of these investments were or will be profitable.
* As of 4/1/15. Includes $840mm of callable commitments to an investment vehicle formed to co-invest with other funds managed by Trian.
= Portfolio companies of which a Trian partner or designee serves or served on the Board

Long-Term
Still on the board of early investments (Wendy’s - invested in 9 years ago)
Shareholder/board representation at Heinz until acquisition by 3G Capital and
Warren Buffett/Berkshire Hathaway (2006 through 2013)
Invested in Family Dollar in 2010, on board 2011-present and continued to own
stock through the date shareholders approved sale to Dollar Tree in 2015
Stable capital base: Substantial amount of capital locked up for multi-year periods
Constructive
and Responsible
Management teams at portfolio companies often serve as references for Trian
Only one proxy contest since inception (Heinz - - 2006)
Recently announced Trian Advisory Partners – includes Bill Johnson, former
Chairman & CEO of Heinz, Dennis Reilley, former Chairman & CEO of Praxair, and
Dennis Kass, former Chairman of Legg Mason, each of whom has worked with
Trian in the boardroom
Trian played a leading role in defending Family Dollar Board when dissident
shareholders surfaced as the company pursued a strategic transaction
Publicly expressed support for The Bank of New York Mellon management when
dissident surfaced
See www.DuPontCanBeGreat.com or pages 66-83 for what directors who have
served on boards with Nelson Peltz, CEOs of companies in which Trian has
invested, and prominent investors, business executives and union leaders have to
say about Trian
Track Record
Principals have a 40-year track record building / fixing companies (including a
Harvard Business School case study on Snapple turn-around)(1)
Long track record of working with companies to help drive the income statement
Built and ran a Fortune 100 Industrial company - - Triangle Industries/American
National Can Company
Trian: Key Takeaways
(1) Harvard Business School Case Study: N9-599-126, August 19, 1999 6

Trian’s Highly Qualified Nominees
7
Nelson Peltz CEO & Founding Partner of Trian
John Myers Former President & CEO of GE Asset Management
Arthur Winkleblack Former EVP & CFO at H.J. Heinz
Robert Zatta Former CEO and CFO at Rockwood Holdings
Alternate Nominee(1): Ed Garden CIO & Founding Partner of Trian; Director of Family Dollar, The Bank of New York Mellon, and Wendy’s
(1) As disclosed in Trian’s definitive proxy statement, Edward Garden will serve as an alternate nominee in addition to or in place of Trian’s other nominees under the
following circumstances: (i) the Company purports to increase the number of directorships prior to the 2015 Annual Meeting, (ii) the Company makes or announces
any changes to the Bylaws or takes or announces any other action that purports to have, or if consummated would purport to have, the effect of disqualifying any of
Trian’s nominees and/or (iii) any of Trian’s nominees is unable (due to death, disability or otherwise) or hereafter becomes unwilling for any reason to serve as a
director.

Our Nominees Have The Experience, Skill-Sets and Passion
to Address Underperformance at DuPont
John Nelson Arthur Robert
Oversaw High
Performance Culture
Chemical/ Industrial
Experience
International
Experience
Financial Acumen
Portfolio
Transformation/ M&A
Board Experience
Capital Markets
Experience
Environmental/
Regulatory
8
Highly Qualified Nominees
Independence and
Ownership Mentality
3 Of 4 Have Been
CEOs/CFOs Of Major Public
Companies
Company Chaired By
Nelson Peltz Is An Early
Adopter Of Proxy Access
Chemicals and Industrials
Experience
Exceptional Track Records
20 Public Company Board
Seats in the Aggregate
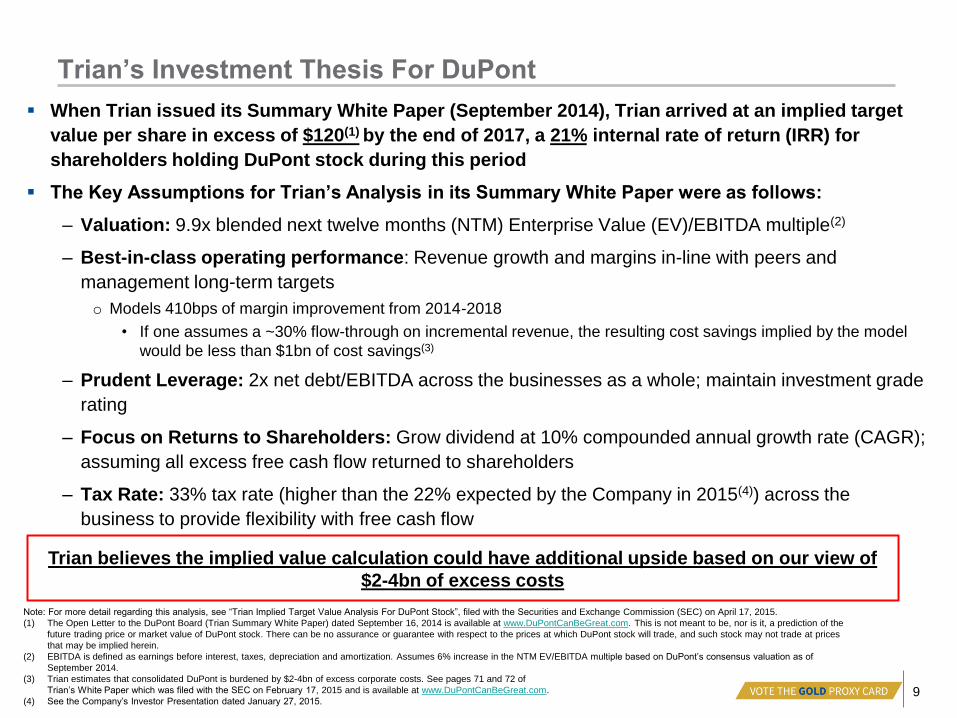
Trian’s Investment Thesis For DuPont
When Trian issued its Summary White Paper (September 2014), Trian arrived at an implied target
value per share in excess of $120(1) by the end of 2017, a 21% internal rate of return (IRR) for
shareholders holding DuPont stock during this period
The Key Assumptions for Trian’s Analysis in its Summary White Paper were as follows:
– Valuation: 9.9x blended next twelve months (NTM) Enterprise Value (EV)/EBITDA multiple(2)
– Best-in-class operating performance: Revenue growth and margins in-line with peers and
management long-term targets
o Models 410bps of margin improvement from 2014-2018
• If one assumes a ~30% flow-through on incremental revenue, the resulting cost savings implied by the model
would be less than $1bn of cost savings(3)
– Prudent Leverage: 2x net debt/EBITDA across the businesses as a whole; maintain investment grade
rating
– Focus on Returns to Shareholders: Grow dividend at 10% compounded annual growth rate (CAGR);
assuming all excess free cash flow returned to shareholders
– Tax Rate: 33% tax rate (higher than the 22% expected by the Company in 2015(4)) across the
business to provide flexibility with free cash flow
9
Note: For more detail regarding this analysis, see “Trian Implied Target Value Analysis For DuPont Stock”, filed with the Securities and Exchange Commission (SEC) on April 17, 2015.
(1) The Open Letter to the DuPont Board (Trian Summary White Paper) dated September 16, 2014 is available at www.DuPontCanBeGreat.com. This is not meant to be, nor is it, a prediction of the
future trading price or market value of DuPont stock. There can be no assurance or guarantee with respect to the prices at which DuPont stock will trade, and such stock may not trade at prices
that may be implied herein.
(2) EBITDA is defined as earnings before interest, taxes, depreciation and amortization. Assumes 6% increase in the NTM EV/EBITDA multiple based on DuPont’s consensus valuation as of
September 2014.
(3) Trian estimates that consolidated DuPont is burdened by $2-4bn of excess corporate costs. See pages 71 and 72 of
Trian’s White Paper which was filed with the SEC on February 17, 2015 and is available at www.DuPontCanBeGreat.com.
(4) See the Company’s Investor Presentation dated January 27, 2015.
Trian believes the implied value calculation could have additional upside based on our view of
$2-4bn of excess costs

Actions Speak Louder Than Words:
The CEO Seems to Lack Confidence In DuPont’s Share Price
10
Source: Capital IQ, Bloomberg and SEC Filings.
(1) Information based on Form 4 filings and Company proxy statements. Trian’s analysis is conducted on a “net share-settled basis”. As such, when calculating ownership and share sales, Trian deducts the cash/shares required to exercise
the options (i.e., Trian uses “treasury stock method” to calculate the CEO’s ownership). For options exercised, Trian uses the share price on the date the options were exercised to estimate the net shares sold / owned . Trian’s analysis
takes into account (i) shares directly owned at the beginning of Trian’s investment, (ii) RSUs that have vested over the period of Trian’s ownership, (iii) performance-based stock units that have vested over the period (net of taxes), and (iv)
net shares from options exercisable over the period.
(2) Information based on DuPont Form 4 filings. The $80 million estimate reflects the gross amount of stock sold by Ellen Kullman for reasons other than the payment of taxes since Trian first invested. The estimate is based on the average
dollar amount specified in the applicable Form 4 multiplied by the number of shares sold. According to SEC filings, most of these sales of DuPont shares were made pursuant to Rule 10b5-1 trading plans. While Rule 10b5-1 trading plans
provide for automatic purchases or sales pursuant to formula or similar method for determining the amount, price and/or date of the transaction, Rule 10b5-1 trading plans may generally be terminated or amended prior to their
predetermined end. For additional information, see page 91 of the Trian White Paper which was filed with the SEC on February 17, 2015, and is available at www.DuPontCanBeGreat.com
Kullman exercises &
sells options worth
~23% of her stake, at
a 15-year high
Option
exercised &
sold
The CEO sold ~54%(1) of her stock (~$80m)(2) after Trian first invested
23%(1) of her equity position was sold in the week after the release of Trian’s
Summary White Paper (September 2014), when the stock hit a new 15-year-high
of $72.83
Despite rhetoric about a “higher growth, higher value strategy,” the CEO is not
willing to “put her money where her mouth is”
Sold from long-term incentives and from stock options she had been granted,
most of which did not expire until 2016 or 2017
We believe the reason management receives equity as part of compensation is
to ensure their interests are aligned with the long-term interests of
shareholders. The intention is not for management to sell prematurely
Ask yourself: If the CEO and Board members truly believed in their strategy
wouldn’t they be buying stock?
Ellen Kullman’s Cumulative Share Sales Over Time
Stockholders award management long-term incentives to ensure an alignment of interests.
The intention is not for management to sell prematurely.
Trian Summary White
Paper released

11
DuPont’s Track Record of
Underperformance

$72.25
$4.32
$3.77 $3.88
$4.01 $4.10
$3.00
$3.50
$4.00
$4.50
$5.00
$5.50
$6.00
$6.50
$7.00
$38.00
$48.00
$58.00
$68.00
$78.00
DuPont Stock Price Actual/Guided EPS
2011 2012 2013 2014 2015E
Recent Stock Price Strength Not Driven By Fundamentals
12
DuPont Stock Price vs. Actual/Guided EPS
Du
Po
nt
Sto
ck
Pri
ce
$
DuPont’s stock price has risen ~45% since Trian’s initial investment, yet EPS is below 2011 levels
− While DuPont boasts about its total return of 266% from 12/31/08 to 12/31/14, 116% of that return resulted from share price
appreciation after Trian invested(1)
We believe DuPont’s recent share price performance reflects the market’s desire for Trian’s involvement(2)
Trian invested in DuPont
Trian Summary White
Paper released
$5bn share repurchase
announced ($2bn in 2014)
DuPont announced
PChem spin
2014 guidance reduced by 6%,
projecting 3-6% growth.
Announced $625m cost savings initiative(3)
Source: Capital IQ, DuPont Press Releases and transcripts of earnings release conference calls.
(1) Source: DuPont presentation filed 1/9/15. 116% accounts for impact of share price appreciation from March 15, 2013 (date of Trian’s initial investment) to December 31, 2014.
(2) While Trian believes that such share price appreciation is attributable to Trian’s involvement as a DuPont stockholder, there is no objective method to confirm what portion of such appreciation was
attributable to Trian’s involvement and what portion may have been attributable to other factors.
(3) Represents announcement of Fresh Start Initiative, a $1bn cost saving plan, at the time, that includes $375m of costs transferred to Performance Chemicals. DuPont increased total program size to
$1.3bn on 1/27/2015.
Ac
tua
l/Gu
ided
EP
S
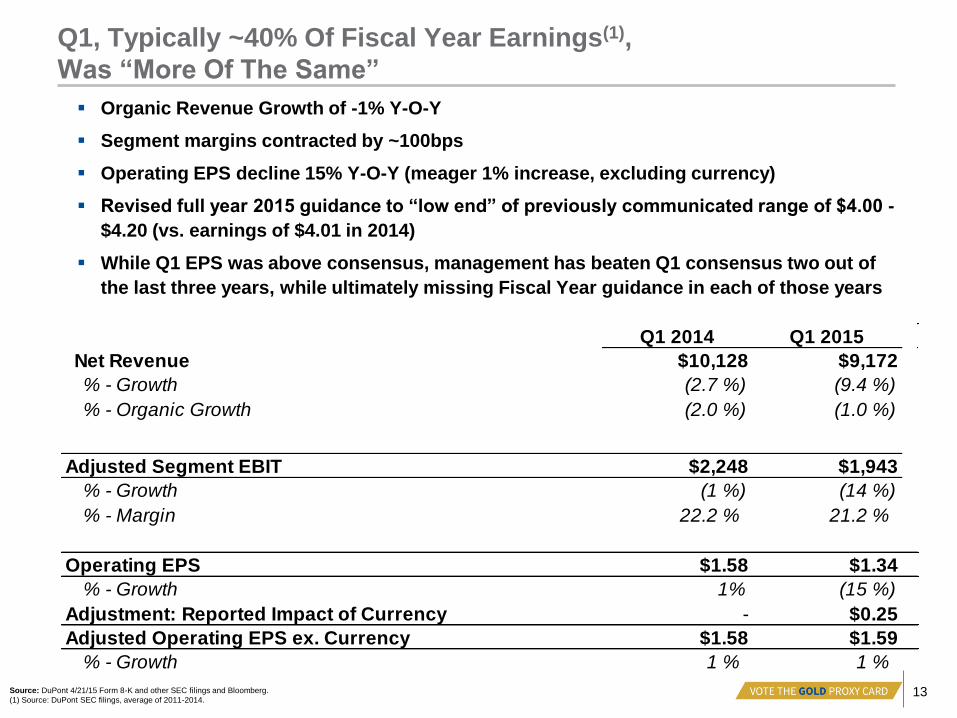
Q1, Typically ~40% Of Fiscal Year Earnings(1),
Was “More Of The Same”
Organic Revenue Growth of -1% Y-O-Y
Segment margins contracted by ~100bps
Operating EPS decline 15% Y-O-Y (meager 1% increase, excluding currency)
Revised full year 2015 guidance to “low end” of previously communicated range of $4.00 -
$4.20 (vs. earnings of $4.01 in 2014)
While Q1 EPS was above consensus, management has beaten Q1 consensus two out of
the last three years, while ultimately missing Fiscal Year guidance in each of those years
Q1 2014 Q1 2015
Net Revenue $10,128 $9,172
% - Growth (2.7 %) (9.4 %)
% - Organic Growth (2.0 %) (1.0 %)
Adjusted Segment EBIT $2,248 $1,943
% - Growth (1 %) (14 %)
% - Margin 22.2 % 21.2 %
Operating EPS $1.58 $1.34
% - Growth 1% (15 %)
Adjustment: Reported Impact of Currency - $0.25
Adjusted Operating EPS ex. Currency $1.58 $1.59
% - Growth 1 % 1 %
Source: DuPont 4/21/15 Form 8-K and other SEC filings and Bloomberg.
(1) Source: DuPont SEC filings, average of 2011-2014. 13

DuPont Will Need 29% Core EPS Growth To Just Meet Lowered Guidance
Source: Company SEC Filings and Trian Estimates.
(1) Represents % decline of operating earnings excluding Pharma, Coatings, Nutrition and Industrial
Biosciences (since the majority of these businesses were acquired in May 2011 through the Danisco
acquisition) and Agriculture between 2011 and 2014.
(2) See Company Form 8-Ks filed on 1/27/15 and 4/21/15. Subtract Q1 2014 EPS from FY2014 EPS.
(3) Includes $36m gain on sale in Agriculture, $23m gain on sale in Performance Chemicals, $23m gain on
sale in Performance Materials, and an $18m gain on termination of Nutrition distribution agreement.
(4) Assumes 22% tax rate consistent with guidance for 2014 and 2015, versus actual Q2-Q4 2014 of 18.4%.
(5) See Company Form 8-Ks filed on 1/27/15 and 4/21/15. Uses low-end of range ($4.00) based on guidance
and subtracts Q1 2015 EPS.
(6) Assumes Company achieves cost savings as per guidance provided per Form 8-K filed 4/21/15.
Assuming that DuPont achieves 40 cents per share of cost-savings in 2015, Trian
estimates that the core business must grow operating earnings by ~29% in Q2-Q4 2015 to
meet its revised 2015 EPS guidance of $4.00 per share (low-end of range)
Trian is skeptical given Agriculture's weakness (e.g. operating earnings down 21% in Q1)
and historically weak growth in the remaining businesses (declined by 26% from 2011-14(1))
Implied Core
Growth Needed
(7) Assumes a mid-year $4bn stock buyback at $72.84 per share (DuPont’s share price as of 4/20/15). This is based on
Company’s guidance of a $4bn midnight dividend from Chemours, which will be used to buy back stock 12-
18 months after the completion of spin-off.
(8) Based on Company guidance.
(9) Assumes $4bn in debt at Chemours with 6% interest rate, outstanding for half a year. DuPont guidance of $4bn
proceeds from midnight dividend from Chemours implies pro forma debt at Chemours of ~$4bn. DuPont currently
guiding that Chemours will be rated BB. Tronox, a TiO2 competitor, currently is rated BB and has 5 year bonds
outstanding with current yield of ~6.4%.
-$0.09 -$0.11 -$0.17 $0.17 $2.43 $2.23 $2.23
Q2-Q4 2014Operating
EPS
One-TimeGains
Norm.Tax (22%)
Q2-Q42014 EPS
Ex One-Time
PerformanceComp
FXHedge
Q2-Q42014
Normalized…
(2) (3) (4) $2.66
-$1.34
-$0.30 -$0.13
$0.55 $0.10
$4.00
$2.88
Q4 2015Guidance
Q1 2015Actual
Q2-Q42015 EPS
Guide
CostSavings
ShareRepurchase
FXHeadwind
InterestExpense
Q2-Q4 2015Core EPS
(5) (6) (7)
(8) (9)
Bridge to Normalized EPS Bridge From 2015 Guidance to Core EPS Needed
Q2-Q4 2015 Core EPS (Ex Savings Growth, FX, etc.) $2.88
Q2-Q4 2014 Normalized EPS (Ex One-Timers)
$2.23
% Implied Growth 29%
14

DuPont’s EPS Growth Since 2011 Is Bottom Quartile,
Regardless Of The Peer Group
Source: SEC filings.
Note: Uses Fiscal Year of each company that most closely approximates the calendar year.
(1) EPS figures for peers adjusted for non-operating pension / OPEB (other post-employment benefits) for comparability with DuPont.
DuPont EPS Growth vs. DuPont Proxy Peers (2011 – 2014)(1)
DuPont EPS Growth vs. Diversified Industrials And Chemicals Peers (2011 – 2014)(1)
73% 64%
39% 38% 30%
24% 21% 20% 18% 15% 14% 13% 6%
1%
-6% -7% -10% -13%
MON BA IR JCI HON UTX DOW MMM JNJ EMR KMB BAX PG APD SYNN DD MRK CAT
44% 39%
34% 30% 29% 29% 26% 24% 21% 21% 20%
15%
2%
-3% -7%
-11%
EMN IR FMC HON DHR GE HUN UTX DOV DOW MMM EMR CE ETN DD BASF
15
Trian Portfolio Company
Trian Portfolio Company

16
DuPont’s EPS Growth Versus Diversified Industrials And
Chemicals And Over The Latest Cycle And Longer Time Horizons
Note: Excludes companies that were not public during the relevant time period.
Note: Uses Fiscal Year of each company that most closely approximates the calendar year.
Source: Trian calculations, SEC filings, EPS figures for peers adjusted for non-operating pension / OPEB (other post-employment benefits) for comparability with DuPont.
417%
313%
218% 161% 149% 144% 141% 128% 113% 93% 69% 53%
25% 10%
FMC EMN DHR DOV EMR BASF UTX HON ETN MMM IR DD DOW GE
1,745%
1,172% 912%
679% 532% 508%
360% 345% 335% 237% 229% 123% 100%
DHR UTX BASF FMC IR DOV MMM ETN EMR HON GE DOW DD
166% 156%
107% 91% 66% 59% 57% 55% 52% 40% 39% 36% 35% 30%
-12% -23%
FMC EMN HUN DHR IR DOV UTX HON MMM CE EMR ETN BASF DD DOW GE
20
-Ye
ar
(19
94
-2014)
10
-Ye
ar
(20
04
-2014)
La
tes
t C
yc
le
(20
07
-2014)

DuPont Has Been Pursuing The “Higher Growth, Higher Value”
Strategy For Years, Which Has Only Led to Declines
$15
$30
$45
$60
$75
$90
May-98 Sep-01 Jan-05 May-08 Sep-11 Jan-15
Sale of Coatings
Sale of INVISTA
Acquires remaining
80% of Pioneer
Separation of Conoco announcement
DuPont completes Conoco split-off
Danisco acquisition
Sale of Pharmaceuticals Trian initial
investment
Day prior
to Trian
ownership
made
public
(7/2013)
Unaffected Stock Price(4) Has Declined -11% Since the Separation of Conoco (16+ years)
And Down -20% From Peak (5/20/98)
Since ’98, DuPont has continually restructured the portfolio to no avail
– Divested >$34bn in revenue(1) and acquired over $11bn in revenue(2) vs DuPont’s current ~$35bn(3) revenue base
Management claimed DuPont would be positioned for higher growth and profitability at the sale of INVISTA:
– "With the anticipated sale of INVISTA, DuPont will be a smaller company with the potential for higher growth and
profitability…But unlocking that potential means doing things differently. If we are to meet our earnings growth objectives – which we will
– we cannot support the complexity and cost entailed by diverse and specialized organizations and processes. The actions we are
announcing today are necessary to ensure the near- and long-term competitiveness of DuPont.” – Press release, 12/1/2003
Yet, DuPont’s stock price has declined over a 16 year period
Source: Bloomberg, Capital IQ as of 4/16/15 and SEC Filings.
(1) Represents significant divestitures. Full year of revenue at DuPont before being separated (Conoco in 1997, Pharmaceuticals in 2000, Textiles in 2003, Coatings in 2011). Does not include the proposed spin-off of
Performance Chemicals which has not yet closed.
(2) Revenue at time of acquisition was nearly $5bn, but is now estimated by Trian to be over $11bn assuming 68% of Agriculture (based on 10-K) and 67% of Nutrition and 100% of Industrial Bio are revenues from acquired
businesses (based on 2013 Data Book).
(3) 2014 revenue includes Performance Chemicals.
(4) Unaffected share price refers to September 16, 2014, the day prior to press reports of Trian’s Summary White Paper.
(5) Total Shareholder Return (TSR) from announcement of Conoco IPO through the day prior to the release of Trian’s Summary White Paper (5/8/1998 – 9/16/2014).
DuPont S&P 500 S&P Chem
TSR(5) 55% 144% 257%
17
18
Root Cause Of DuPont’s
Underperformance

10%-12%
7-9% 6.6%
3.2%
2011Target
2013Target
Novozymes DuPont
Why DuPont Underperformed: Failure To Deliver Target Or Peer
Level Organic Revenue Growth
Source: SEC filings and Wall Street research.
Note: Sales compounded annual growth rates (CAGRs) exclude currency and M&A when possible; as DuPont does not disclose currency per segments, Sales CAGR for DuPont excludes only portfolio
changes. The peers for Performance Materials are Celanese Advanced Engineered Materials and BASF Plastics; the peers for Crop Protection are Syngenta’s crop business, FMC Agriculture, Bayer
CropScience and BASF Agricultural; the peers for Nutrition & Health are Chr. Hansen Cultures and Enzymes, Tate & Lyle Specialty Food, Royal DSM Nutrition, Kerry Ingredients and Flavours and FMC Health
and Nutrition; the peers for Performance Chemicals are Huntsman Pigment, Tronox Pigment, Kronos, Arkema Industrial, Daikin Chemicals and Honeywell Performance Materials.
Note: Uses 3M Safety and Graphics and BASF functions, materials and solutions for 2013 & 2014 as both companies changed segments in FY13.
Note: For companies that have not yet reported full year 2014 results, assumes that year to date organic growth represents full year 2014 organic growth.
(1) Segments presented above contribute 71% of total DuPont revenue base. Agriculture Crop contributes 32% of the Agriculture segment’s revenue (based on 2014 Form 10-K). Excluding Agriculture Crop,
the remaining segments presented above contribute 61% of DuPont’s revenue base.
(2) Timeframe starting the year after DuPont acquired Danisco. Calculates a weighted average organic growth rate over time using reported quarterly metrics.
(3) Begins in 2008 to capture current management tenure.
(4) Agriculture Crop growth does not exclude M&A. Estimates from data book (Crop as a percentage of agriculture or agriculture and nutrition segment for 2008-2013). 2014 revenue from 2014 Form 10-K.
(5) Note: Agriculture growth targets for DuPont’s full segment apply to both seeds and crop protection, not specified for one or the other.
(6) Uses 3M Safety and Graphics for 2013 and 2014 and 3M Safety, Security and Protection segment for the prior years.
Performance Materials
(2008-2014 CAGR(3))
Agriculture – Crop
(2008-2014 CAGR(3)(4)(5))
Industrial Biosciences
(Q212-Q414 CAGR(2))
Nutrition and Health
(Q212-Q414 CAGR(2))
7-9% 7-9%
4.2% 3.0%
2011 Target
2013 Target
Peers DuPont
Safety and Protection
(2008-2014 CAGR(3))
Performance Chemicals
(2008-2014 CAGR(3))
4-6% 3-5%
4.5%
1.9%
2011Target
2013Target
Peers DuPont
8-10%
5-7%
3.2%
-0.2%
2011Target
2013Target
3M Segment DuPont
8-10% 8-10% 8.1%
5.7%
2011 Target 2013 Target Peers DuPont
6-8%
3-5% 3.4%
1.3%
2011 Target 2013 Target Peers DuPont
DuPont’s organic revenue growth has trailed peers in 5 of 7 segments (~71% of revenues)(1) and has rarely
met its own goals
(6)
19

26%
23%
3MSegment
DuPont
35%
21%
Novozymes DuPont
23%
17%
Peers DuPont
Why DuPont Underperformed: Failure To Deliver
Peer Level Margins
30%
22%
28%
23%
Monsanto Crop ProtectionPeers
Blended Peers (3) DuPont
Agriculture(1) Nutrition & Health(1)
24%
16%
Peers DuPont
Source: SEC filings and Wall Street research. EBITDA includes a portion of unallocated corporate costs (allocated by revenue to the respective segment) and is adjusted for impairments and other non-recurring charges.
DuPont, Monsanto, and Syngenta adjusted to exclude non-operating pension and OPEB. Novozymes does not disclose whether is has a defined contribution plan. As the other peers are segments of a company, rather
than the whole company, and pension is not easily allocable, does not add back non-operating pension and OPEB for the other peers. Financials converted to US dollars at average exchange rate for year.
Peers for Electronics are Air Products Materials Technologies, 3M Electronics & Energy, Dow Electronics & Functional Materials. Peers for Agriculture are Monsanto, BASF Agriculture Solutions, Bayer CropScience,
FMC Agriculture Solutions, Syngenta. Peers for Nutrition are Chr Hansen Cultures and Enzymes, Tate & Lyle Specialty Food Ingredients, Royal DSM Nutrition, Kerry Ingredients and Flavours, and FMC Health &
Nutrition.
(1) Uses CY2014 data for each company unless not available. LTM ending 9/30/2014 for Tate and Lyle, which reports semi-annually. LTM 11/30/2014 financial for Chr Hansen. Certain peers only disclose segment-level
depreciation and amortization in annual reports, which may not have been released yet for 2014 (or the relevant period included). As such, Trian assumes each segment’s depreciation is of a similar proportion to the
most recently available full-year figures.
(2) Uses 3M Safety and Graphics.
(3) “Blended Peers” refers to a 68% weighting of Monsanto's margin and a 32% weighting of Crop Protection Peers’ margins, reflecting DuPont’s
Agriculture segment’s business mix (68% seed/32% crop).
DuPont’s EBITDA margins have lagged peers in 5 of 7 segments (~64% of revenues)
(2)
20
Industrial Biosciences(1) Safety & Protection(1) Electronics & Communications(1)

Our Goals
While Trian believes it has already made an impact on value creation at DuPont, there is
much more value to be unlocked; a vote for Trian’s nominees is a vote for four highly
qualified individuals who will seek to work collaboratively with the Board to:
1. Assess the corporate structure and determine whether management is capable of
achieving best-in-class revenue growth and margins with the existing portfolio or whether
there is a need to separate the portfolio; Trian nominees are open-minded as to the best
path forward
2. Eliminate excess corporate costs and ensure productivity initiatives hit the bottom line
3. Assess capital allocation including organic investments (R&D, capital expenditures,
industrial biosciences initiatives), M&A, and balance sheet efficiency / capital return policies
(increasing dividends)
4. Improve corporate governance including transparency of business performance,
alignment of compensation programs with performance, and overall accountability for
promised performance
21

Disparate Businesses And Overwhelming Complexity: New DuPont(1)
Remains A Conglomerate With 44% Of Sales In Low Growth Businesses
22
Sales Growth Has Been Non-Existent (07-14) ($bns)(2) Growth in Adjusted PTOI(3) Has Been Anemic ($bns)
0% CAGR
$2.1
$1.3 $0.7
$2.1 $2.1 $2.1 $2.3 $2.4
0%
5%
10%
15%
20%
25%
$0
$1
$2
$3
2007 2008 2009 2010 2011 2012 2013 2014
2.5% CAGR
This is Despite Performance Materials Over-Earnings As a Result of Record-High Ethylene Spreads
Margin %: 16.5 11.0 7.9 17.5 15.2 16.2 18.2 19.7
Ethylene Spread Profit Over Time (07-14) ($m)(4)
Excluding the ethylene spread
PTOI was flat and margins only
expanded ~58bps
Source: SEC Filings, Investor Presentations, Trian Estimates. PTOI before non-operating pension expense.
(1) “New DuPont” as defined by management (DuPont excluding Performance Chemicals segment).
(2) 2013 and 2014 figures are adjusted for Viton, which is to be transferred to Performance Chemicals in the spin off.
(3) “PTOI” defined as pre-tax operating income.
(4) Ethylene spread calculations from Trian, market data sourced from Bloomberg and JP Morgan research.
Assumes 95% operating rate of 1,500m pound ethylene facility, assumes its cracking 100% ethane vs propane.
The Performance Materials, Safety and Protection and Electronics and Communications segments have historically
been low growth and volatile. Margins have deteriorated despite the significant increase in ethylene spreads
$204 $282
$186 $283 $296
$443 $504 $538
2007 2008 2009 2010 2011 2012 2013 2014
$12.5 $12.1
$9.4
$12.2 $13.7
$12.7 $12.7 $12.4
2007 2008 2009 2010 2011 2012 2013 2014

$5.7
$11.3
2007 2014
12.6%
7.7%
2010 Margins 2014 Margins
Improving Margins(4)
The Other 56%: One Proven Growth Business, Two With Potential
Nutrition &
Health
(12% of sales)
Industrial
Biosciences
(4% of sales)
Agriculture
(40% of sales)
Organic Revenue Growth Has Been
Below Target and Weakening
Organic Revenue Growth Consistently
Below Target
Contracting EBIT Margins
Since Acquisition(1)
Source: SEC Filings, Investor Presentations, Trian Estimates.
Note: Compares organic growth to target growth. Danisco acquisition closed in Q2 2011, organic growth starts a year after acquisition closes.
(1) Margins are post-corporate to make figures comparable. Breaks out Danisco into Industrial Biosciences (its Genencor business) and Nutrition & Health.
(2) Blended margin of DuPont legacy nutrition and Danisco.
(3) Margins are pro forma for announced synergies of $130m. Synergies are allocated to Nutrition & Health and Industrial Biosciences on a % of sales basis.
(4) Adjusted PTOI margins. Starts in 2008, the first year DuPont reported Agriculture on a standalone basis.
7-9%
5.0% 3.1%
1.7%
Target Growth Q2-Q4 '12Growth
2013 Growth 2014 Growth
7-9%
3.4% 3.5% 2.7%
Target Growth Q2-Q4 '12Growth
2013 Growth 2014 Growth
($ bns)
Strong Revenue Growth:
10% CAGR
15.4% 16.7% 17.5%
19.5% 20.5% 21.2% 20.8%
2008 2009 2010 2011 2012 2013 2014
18.1%
13.7%
2010 Margins 2014 Margins
Contracting EBIT Margins
Since Acquisition(1)
Unproven
23

Excess Corporate Costs: The Coatings / Axalta Case Study
In 2012, DuPont announced the sale of Coatings to private equity buyers
At the time, Coatings generated $339m(1) of EBITDA (2011A). Today, that same business, renamed Axalta,
generates $851m(2) of EBITDA, an improvement of >150%
In 2014, the new owners filed a Form S-1 to take Axalta public. The S-1 disclosed that Pro Forma EBITDA
in 2011 was $568m(3), $229m higher than originally reported by DuPont in the same year – this implies that
DuPont burdened the Coatings segment with $229m of excess corporate costs
24
EBITDA Under DuPont
(2007-2011)
$339
$568
2011 (As Reportedby DuPont)
2011 (As Reportedby Axalta S-1)
EBITDA – Different Owners,
Same Year EBITDA Under New Owners –
Improvement (2011-2014)
$380 $339
2007 2011
$568
$851
2011 2014
Source: DuPont and Axalta SEC Filings.
(1) Coatings adjusted PTOI plus depreciation expense less an allocation of unallocated corporate costs plus an addback for non-cash items and certain pension expense in-line with Axalta’s current
addbacks to make it comparable to Axalta’s figures. Assigns unallocated corporate expense at ~2% of sales (DuPont’s FY2011 unallocated corporate expense and Other as % of FY2011
segment sales) to make margins comparable.
(2) Represents Axalta’s Adjusted Operating Income plus Depreciation & Amortization expense for 2014. Metric differs slightly from Axalta’s Adjusted EBITDA (as reported) as it excludes other
expense (income) and dividend to non-controlling interest to make EBITDA comparable.
(3) Represents Axalta’s Adjusted Operating Income plus Depreciation & Amortization expense for 2011. Metric differs slightly from Axalta’s Adjusted EBITDA (as reported) as it excludes other
expense (income) and dividend to non-controlling interest to make EBITDA comparable.
(4) Coatings 2007 EBITDA not adjusted for pension, because non-operating pension / OPEB (other post-employment benefits) expense was not disclosed by DuPont (DuPont had small pension
income in 2007).
(5) Please refer to pages 71 and 72 of Trian’s White Paper, which was filed with the SEC on February 17, 2015 and is available on www.DuPontCanBeGreat.com.
(1)
(3)
(3)
(2)
(1) (4)
DuPont transferred >$6bn of shareholder wealth to private equity owners by not running Coatings
efficiently and selling the business for cash rather than doing a tax-free spin
We estimate that consolidated DuPont is burdened by $2-$4bn of excess corporate costs(5)

Dilutive M&A: Subtraction By Addition Of Danisco
13.8%
15.2%
10.6%
12.5%
9.3%
2010 2010PF ForDaniscoMarginTarget
2014
PF for Synergies Excluding Synergies
Nutrition and Industrial
Biosciences EBIT Margins(4)
Danisco Growth Below
Historical and LT Targets
5.2% 5-7%
8-10% 7-9%
3.1%
DaniscoAvg
GrowthRate
DaniscoLong-term
Target
DuPont2011 Long-
termTarget
DuPont2013 Long-
termTarget
ActualOrganicGrowth
(1)
(2) (5)
Profitability down 33%
Source: Company SEC Filings and Transcripts, Danisco Annual and Quarterly Financial Reports and Transcripts.
(1) Danisco historical growth rate is organic growth from FY2005-2010 or 5.2%. Fiscal year 2006 growth measures only ingredients growth and Fiscal Year 2007 growth
excludes flavours growth (as Danisco sold that business before DuPont acquired Danisco).
(2) 2011 long-term targets weighted by 2011 sales of Nutrition and Health and Industrial Biosciences.
(3) Revenue growth from Q2 2012-Q4 2014.
(4) Margins are before non-operating pension and OPEB expense. Uses Danisco pension expense to estimate non-operating pension and OPEB expense for Danisco
prior to acquisition. For synergy figures, incorporates $130m of synergies based on Company Q4 2012 earnings call transcript (1/22/2013).
(5) 15.2% EBIT margin derived by assuming 15.9% margin for Danisco (estimated to be 76% of combined Nutrition and Industrial Bio revenue) and 4.8% margin for
legacy soy business plus $130m of synergies.
(3)
25

Substantial Agriculture R&D Has Yielded Negative Results
26
Source: SEC filings.
(1) Monsanto press release 8/1/12.
(2) DuPont press release 3/26/2013.
(3) Free Press, “EPA: DuPont failed to warn of popular herbicide’s danger to trees”. Charges taken by DuPont related to customer claims of damage
caused by the Imprelis herbicide.
(4) Pioneer press release, 12/14/2010.
(5) 2010-2014 based on Company Data Book and 2014 Form 10-K.
~$5bn(5) in Agriculture
R&D over last 5 years Results
No new biotech traits, of significance, discovered
$1bn jury verdict against DuPont for patent
infringement
― A federal jury found that DuPont willfully infringed on
Monsanto’s RoundUp Ready 2 patent and owed
Monsanto $1bn in damages(1)
― In lieu of this, DuPont and Monsanto agreed to a
settlement whereby DuPont will pay a minimum of
$1.75bn in royalty payments for Roundup Ready 2 and
dicamba (from 2014 through 2023)(2)
$1.2bn in charges relating to Imprelis, despite
estimated sales of only ~$7m(3)
Paying competitors for science capabilities
― DuPont licenses Bayer’s LibertyLink, Dow’s Herculex,
Monsanto’s Roundup Ready, and Syngenta’s Agrisure
― Agrisure license could exceed $400m in cumulative
payments(4)

$23.7 $24.0
$19.0
$23.7
$28.8
$24.4 $24.0 $23.4
2007 2008 2009 2010 2011 2012 2013 2014
0% CAGR
$4.2
$3.0 $2.5
$4.8
$5.8 $5.3
$4.8 $5.3
2007 2008 2009 2010 2011 2012 2013 2014
27
Uneconomic ROIC On 2/3rds Of The Revenue Base (Ex Ag & Pharma)
Sales ex Agriculture and Pharma (2007-2014)
Pre-R&D EBITDA ex Agriculture and Pharma
(2007-2014)
Source: Company SEC filings, Trian Estimates and Company Data Books.
Trian estimates Agriculture EBITDA for 2007 using average of 2008-2010 Nutrition EBITDA margin (pre-Danisco) and backing out Nutrition EBITDA from segment figures (when DuPont only reported Agriculture and Nutrition as one segment).
Assumes 2013 Company acquisition spending in Agriculture was entirely related to Pannar. For 2007, assumes capex and R&D spend as % of sales for Agriculture & Nutrition segment is the same as for Agriculture standalone.
(1) ROIC defined as change in EBITDA pre-R&D, excluding agriculture and pharma from 2007-2014 divided by the sum of 2008-2014 net capex, R&D and acquisitions. The result is tax-effected at 22%.
(2) Weighted average cost of capital calculated using fully diluted market capitalization as of 4/16/2015. Pre-tax cost of debt assumed to be 2.62% based on the yield of recently issued 8-year debt
(issued 2/15/13) as per Bloomberg as of 4/16/2015. Assumes 22% tax rate. Cost of equity assumes risk free rate of 1.89%, the approximate yield on the 10 year Treasury as of 4/16/2015, a beta of 1.003
(Source: Bloomberg), and an equity risk premium of 7.5% (Trian estimate). Cost of preferred equity assumed to be 4.2%, consistent with weighted average yields on current outstanding preferred.
Capital Expenditures, Net Acquisitions &
Research and Development
($ in Billions)
Cumulative
'08-'14
Net Capital Expenditures $9.1
Acquisitions, Net of Divestitures $1.9
Research and Development $6.3
Total Investment $17.3
8.4%
5.0%
DuPont's Cost of Capital(WACC)
DuPont's ActualROIC
Uneconomic ROIC(1): Significantly Below WACC(2)
DuPont’s inability to generate an attractive return in its non-Agriculture businesses (68% of revenues) is
concerning especially in light of the current headwinds in Agriculture markets

Trian Will Seek To End “Crony” Compensation
The Board’s compensation practices have rewarded management for failing to meet its
targets. In 2013, management’s long-term incentive plan had a payout of 113% of target
despite a TSR in the 25th percentile of DuPont’s peers
That same year, short-term compensation payout was almost 90% despite adjusted EPS
growth of 3%, significantly below the Company’s long-term target of 12% EPS growth
In 2014, the Board’s Human Resources and Compensation Committee acknowledged poor
operating performance as it exercised “negative discretion” and gave management a 0%
payout factor for “corporate performance” under DuPont’s short-term incentive program.
However, the Human Resources and Compensation Committee still found a way to pay
management by giving an 80-100% payout factor for “individual performance”
28
Corporate Performance Rating
0%
Individual Performance Rating
80%-100%
Does this make sense? How can it be that the Company is doing poorly
operationally but management as individuals are each doing great?
Source: Source: DuPont SEC filings and 2011 and 2013 Investor Day Transcripts.
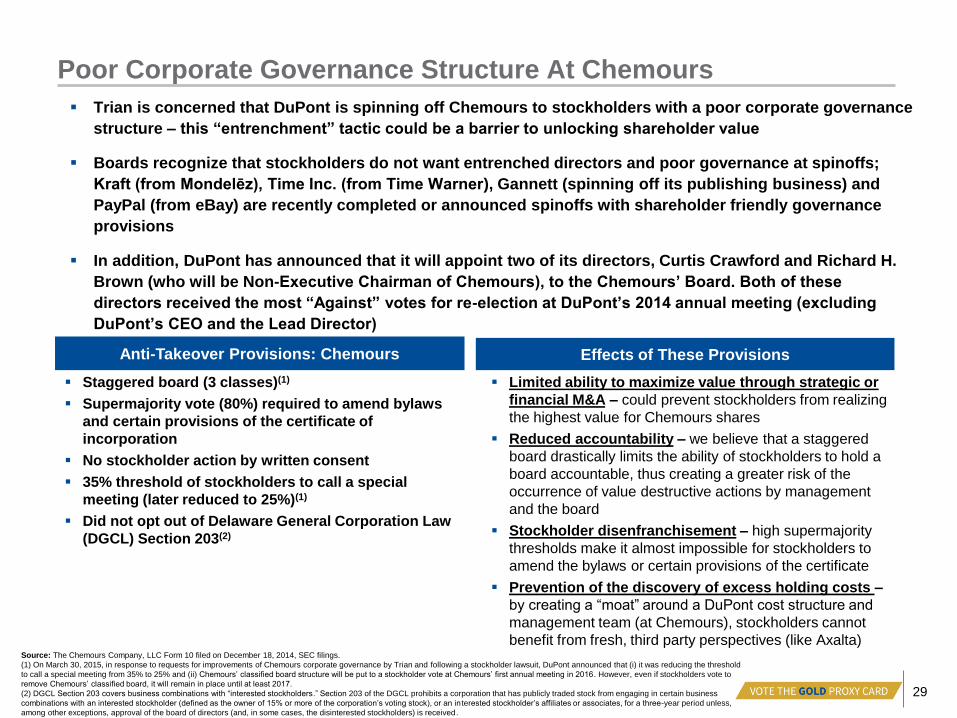
Poor Corporate Governance Structure At Chemours
Trian is concerned that DuPont is spinning off Chemours to stockholders with a poor corporate governance
structure – this “entrenchment” tactic could be a barrier to unlocking shareholder value
Boards recognize that stockholders do not want entrenched directors and poor governance at spinoffs;
Kraft (from Mondelēz), Time Inc. (from Time Warner), Gannett (spinning off its publishing business) and
PayPal (from eBay) are recently completed or announced spinoffs with shareholder friendly governance
provisions
In addition, DuPont has announced that it will appoint two of its directors, Curtis Crawford and Richard H.
Brown (who will be Non-Executive Chairman of Chemours), to the Chemours’ Board. Both of these
directors received the most “Against” votes for re-election at DuPont’s 2014 annual meeting (excluding
DuPont’s CEO and the Lead Director)
Anti-Takeover Provisions: Chemours
Staggered board (3 classes)(1)
Supermajority vote (80%) required to amend bylaws
and certain provisions of the certificate of
incorporation
No stockholder action by written consent
35% threshold of stockholders to call a special
meeting (later reduced to 25%)(1)
Did not opt out of Delaware General Corporation Law
(DGCL) Section 203(2)
Effects of These Provisions
Limited ability to maximize value through strategic or
financial M&A – could prevent stockholders from realizing
the highest value for Chemours shares
Reduced accountability – we believe that a staggered
board drastically limits the ability of stockholders to hold a
board accountable, thus creating a greater risk of the
occurrence of value destructive actions by management
and the board
Stockholder disenfranchisement – high supermajority
thresholds make it almost impossible for stockholders to
amend the bylaws or certain provisions of the certificate
Prevention of the discovery of excess holding costs –
by creating a “moat” around a DuPont cost structure and
management team (at Chemours), stockholders cannot
benefit from fresh, third party perspectives (like Axalta) Source: The Chemours Company, LLC Form 10 filed on December 18, 2014, SEC filings.
(1) On March 30, 2015, in response to requests for improvements of Chemours corporate governance by Trian and following a stockholder lawsuit, DuPont announced that (i) it was reducing the threshold
to call a special meeting from 35% to 25% and (ii) Chemours’ classified board structure will be put to a stockholder vote at Chemours’ first annual meeting in 2016. However, even if stockholders vote to
remove Chemours’ classified board, it will remain in place until at least 2017.
(2) DGCL Section 203 covers business combinations with “interested stockholders.” Section 203 of the DGCL prohibits a corporation that has publicly traded stock from engaging in certain business
combinations with an interested stockholder (defined as the owner of 15% or more of the corporation’s voting stock), or an in terested stockholder’s affiliates or associates, for a three-year period unless,
among other exceptions, approval of the board of directors (and, in some cases, the disinterested stockholders) is received.
29

Other Governance Considerations
Trian believes that DuPont’s Board should ask whether the Lead Director has
the capacity to effectively serve DuPont’s stockholders in that role
– Does a director that currently serves as a CEO and Chairman of a global industrial company and on
the board of one of the nation’s largest bank-based financial services companies, have the ability to
devote the time and effort required to effectively serve DuPont’s stockholders as a strong,
independent Lead Director?
Trend is towards raising mandatory retirement age of public company board
members
– Over the last 10 years, the percentage of boards of S&P 500 companies with a mandatory retirement
age of 75 or older has increased from 5% to 30%(1)
– Among the companies with a retirement age of 75 or older are: Accenture, Aetna, Aflac, Alcoa, Altria,
Apple, Bank of New York Mellon, BlackRock, Bristol-Myers Squibb, General Electric, Ingersoll-Rand,
Lockheed-Martin, Goldman Sachs, Kraft Foods, Marsh & McLennan, Microsoft, Mondelēz, Monsanto,
State Street, Textron(1)
– “[I]t is often the case that older directors are among the savviest and most skilled board members…”
David Katz and Laura McIntosh, Wachtell, Lipton, Rosen & Katz(2)
30
(1) Source: 2014 Spencer Stuart Board Index.
(2) “Renewed Focus on Corporate Director Tenure,” New York Law Journal, May 22, 2014.

31
Why A Trian Principal Needs
To Be On The Board

Why A Trian Principal Needs To Be On The Board
Eliminate management’s rhetoric
Eliminate management’s “information advantage”
Trian believes it already has had a significant impact, but there
is more value to be unlocked
We have a strong track record of creating value
32
1
2
3
4
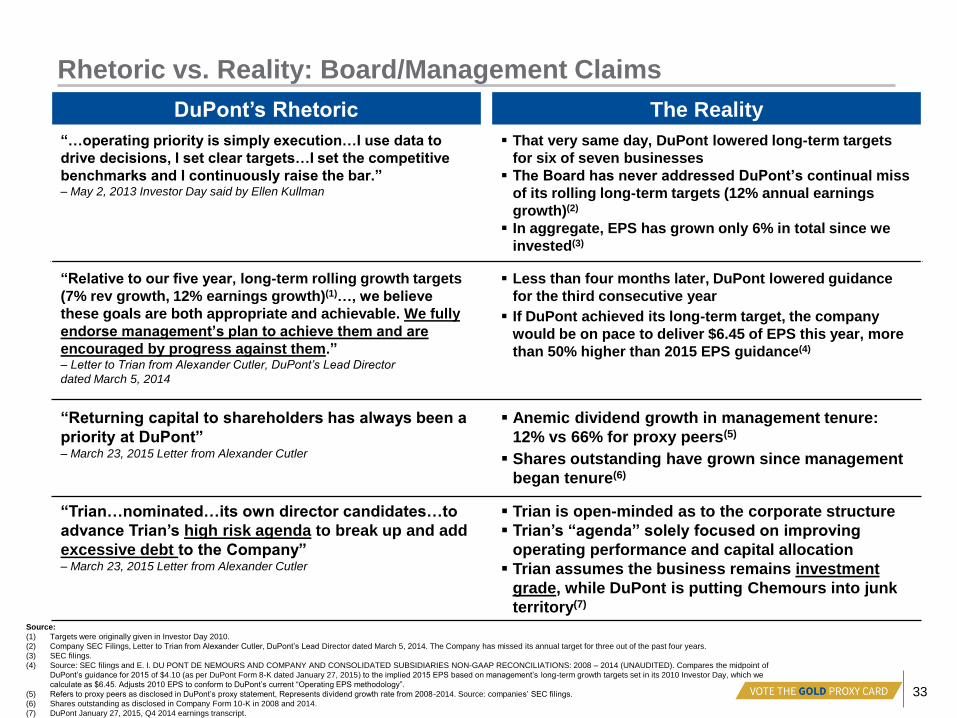
Rhetoric vs. Reality: Board/Management Claims
DuPont’s Rhetoric The Reality
“…operating priority is simply execution…I use data to
drive decisions, I set clear targets…I set the competitive
benchmarks and I continuously raise the bar.” – May 2, 2013 Investor Day said by Ellen Kullman
That very same day, DuPont lowered long-term targets
for six of seven businesses
The Board has never addressed DuPont’s continual miss
of its rolling long-term targets (12% annual earnings
growth)(2)
In aggregate, EPS has grown only 6% in total since we
invested(3)
“Relative to our five year, long-term rolling growth targets
(7% rev growth, 12% earnings growth)(1)…, we believe
these goals are both appropriate and achievable. We fully
endorse management’s plan to achieve them and are
encouraged by progress against them.” – Letter to Trian from Alexander Cutler, DuPont’s Lead Director
dated March 5, 2014
Less than four months later, DuPont lowered guidance
for the third consecutive year
If DuPont achieved its long-term target, the company
would be on pace to deliver $6.45 of EPS this year, more
than 50% higher than 2015 EPS guidance(4)
“Returning capital to shareholders has always been a
priority at DuPont”
– March 23, 2015 Letter from Alexander Cutler
Anemic dividend growth in management tenure:
12% vs 66% for proxy peers(5)
Shares outstanding have grown since management
began tenure(6)
“Trian…nominated…its own director candidates…to
advance Trian’s high risk agenda to break up and add
excessive debt to the Company”
– March 23, 2015 Letter from Alexander Cutler
Trian is open-minded as to the corporate structure
Trian’s “agenda” solely focused on improving
operating performance and capital allocation
Trian assumes the business remains investment
grade, while DuPont is putting Chemours into junk
territory(7)
33
Source:
(1) Targets were originally given in Investor Day 2010.
(2) Company SEC Filings, Letter to Trian from Alexander Cutler, DuPont’s Lead Director dated March 5, 2014. The Company has missed its annual target for three out of the past four years.
(3) SEC filings.
(4) Source: SEC filings and E. I. DU PONT DE NEMOURS AND COMPANY AND CONSOLIDATED SUBSIDIARIES NON-GAAP RECONCILIATIONS: 2008 – 2014 (UNAUDITED). Compares the midpoint of
DuPont’s guidance for 2015 of $4.10 (as per DuPont Form 8-K dated January 27, 2015) to the implied 2015 EPS based on management’s long-term growth targets set in its 2010 Investor Day, which we
calculate as $6.45. Adjusts 2010 EPS to conform to DuPont’s current “Operating EPS methodology”.
(5) Refers to proxy peers as disclosed in DuPont’s proxy statement, Represents dividend growth rate from 2008-2014. Source: companies’ SEC filings.
(6) Shares outstanding as disclosed in Company Form 10-K in 2008 and 2014.
(7) DuPont January 27, 2015, Q4 2014 earnings transcript.

Did the Board Know?
Axalta EBITDA was reported to be $229mm (or 68%) higher in the
same year (2011) under different owners
Ellen Kullman has sold over half of her stock since Trian invested
in 2013
DuPont has reported NINE different EPS figures for 2011
DuPont management suggested that changes in pension
accounting led to lowered margin targets at the May 2013 Investor
Day
Lack of transparency for reporting financial and operating metrics
34
In Trian’s limited interactions with DuPont’s Board, it has become
clear to us that management maintains a significant information
advantage over the Board of Directors

2011 GAAP EPS 2011 Non-GAAP EPS
$3.68(1) $3.30(2) $3.38(3) $3.77(4) $3.93(5) $3.55(6) $4.02(7) $3.63(8) $2.03(9)
2011 10-K
Page F-4
2012 10-K
Page F-4
2012
Databook
Page 4
2013 10-K
Page F-4
1/24/12 8-K
Page 14
1/22/13 8-K
Page 15
2012
Databook
Page 4
12/14
Non-GAAP
Reconcil.
Page 7(10)
DEFA14A
2/17/15
Page 5 (“Important
Facts For
DuPont
Shareholders”)
2/9/2012 2/7/2013 March-2013 2/5/2014 1/24/2012 1/22/2013 March-2013 1/27/2015 2/17/2015
The Saga of DuPont’s 2011 EPS:
Which EPS Number Will DuPont Choose Today?
35
1
DuPont’s Written Statement: “Trian’s analysis relies on a 2011 EPS of $4.32 that is not
reported in DuPont’s public filings…” – DuPont presentation, February 2015
The Reality: DuPont has provided nine different “versions” of 2011 EPS
2 3 4 5 6 7 8
Disclosure /
Filing Date:
Source:
9
Since January 2012, DuPont has provided nine different versions of 2011 EPS.
Can DuPont’s independent directors explain why that is?
Trian’s nominees will seek to ensure that the board holds
management accountable.
Source: Bloomberg, Company Transcripts, SEC filings, Trian calculations.
DuPont labels each of these nine EPS figures as follows: (1) “Diluted earnings per share of common stock”. (2) “Diluted earnings per share of common stock from continuing operations”. (3)
“Income from continuing operations after income taxes – diluted”. (4) “Diluted earnings per share of common stock”. (5) “EPS excluding significant items”. (6) “EPS from continuing operations,
excluding significant items”. (7) “Operating earnings after income taxes – diluted”. (8) “EPS – Excluding Significant Items”. (9) “Adjusted Operating EPS (excluding Performance Chemicals,
Pharma) (Non-GAAP)”.
(10) See: E. I. DU PONT DE NEMOURS AND COMPANY AND CONSOLIDATED SUBSIDIARIES NON-GAAP RECONCILIATIONS: 2008 – 2014, on is available at
www.DuPontCanBeGreat.com 1/27/2015.
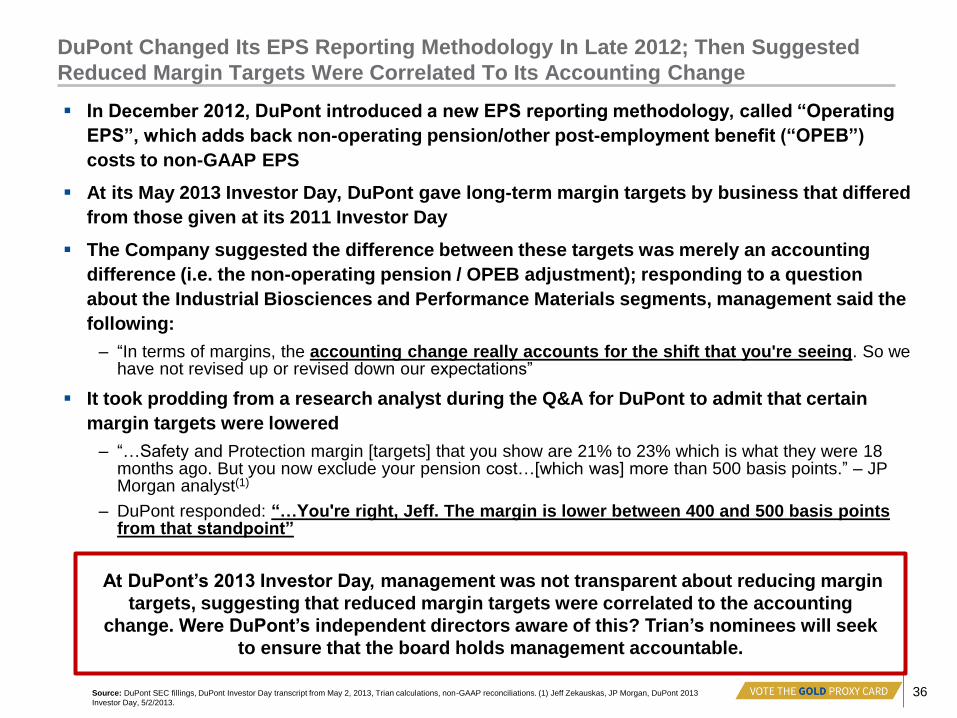
DuPont Changed Its EPS Reporting Methodology In Late 2012; Then Suggested
Reduced Margin Targets Were Correlated To Its Accounting Change
In December 2012, DuPont introduced a new EPS reporting methodology, called “Operating
EPS”, which adds back non-operating pension/other post-employment benefit (“OPEB”)
costs to non-GAAP EPS
At its May 2013 Investor Day, DuPont gave long-term margin targets by business that differed
from those given at its 2011 Investor Day
The Company suggested the difference between these targets was merely an accounting
difference (i.e. the non-operating pension / OPEB adjustment); responding to a question
about the Industrial Biosciences and Performance Materials segments, management said the
following:
– “In terms of margins, the accounting change really accounts for the shift that you're seeing. So we have not revised up or revised down our expectations”
It took prodding from a research analyst during the Q&A for DuPont to admit that certain
margin targets were lowered
– “…Safety and Protection margin [targets] that you show are 21% to 23% which is what they were 18 months ago. But you now exclude your pension cost…[which was] more than 500 basis points.” – JP Morgan analyst(1)
– DuPont responded: “…You're right, Jeff. The margin is lower between 400 and 500 basis points from that standpoint”
36
At DuPont’s 2013 Investor Day, management was not transparent about reducing margin
targets, suggesting that reduced margin targets were correlated to the accounting
change. Were DuPont’s independent directors aware of this? Trian’s nominees will seek
to ensure that the board holds management accountable.
Source: DuPont SEC fillings, DuPont Investor Day transcript from May 2, 2013, Trian calculations, non-GAAP reconciliations. (1) Jeff Zekauskas, JP Morgan, DuPont 2013
Investor Day, 5/2/2013.

Lack Of Transparency In Reporting
Source: Company Press Releases, SEC Filings, 2006 Data Book, Q3 2013 presentation.
(1) From 2010-2011, DuPont split Agriculture & Nutrition into 2 segments, only providing one year of historical information for each. From 2008 -2009, DuPont changed reporting from 6 to 7 segments and adjusted the
businesses included within the pre-existing segments (e.g. Safety & Protection, Electronics & Communications). From 2001-2002, DuPont dramatically realigned its businesses, excluding Agriculture & Nutrition.
(2) “COGS” refers to cost of goods sold.
(3) 2012 implied gross margins increased by ~960bps using the 2013 annual 8-K vs the 2012 annual 8-K (COGS were 61.9% of sales vs 71.5% sales), as the company separated other operating charges from cost of
goods sold. Analysis defines gross margin as sales less COGS.
(4) SG&A expense as a % of sales.
(5) Average cannibalized sales as a percentage of new product sales from 2004-2006 sales. Estimates using the graphs provided on page 16 of the 2006 DuPont data book, entitled “Sales From Products
Commercialized in Last 5 Years” and “Growth Revenue From Products Commercialized in Last Five Years (Net of Cannibalization).”
(6) Claimed $26m gain related to an equity remeasurement of Pannar, yet in 2012 annual press release identified gain on the sale of equity method investment as a one-time gain ($122m gain).
(7) Source: DuPont Shareholder Update Presentation 10/28/14 (page 27).
1. DuPont “shuffles the deck chairs” with operating segments
– Changed segment reporting lines 3 times since 2000(1)
– Constantly re-stated segments (e.g. Viton moved from Performance Materials (PMat) to PChem in 2014)
2. DuPont “shuffles the deck chairs” with the historical income statements
– In 2013 Form 10-K, reported $3.8bn of “other operating charges,” a completely new P&L line, formerly included in
COGS(2), effectively restating the implied gross margin as 960bps higher(3)
– A year later, DuPont restated “other operating charges” again – DuPont reduced the 2013 expense by $2.2bn and
effectively increased the SG&A ratio by >600bps(4)
3. Management stopped reporting new product cannibalization entirely in 2007
– According to DuPont’s prior Data Books, ~63% of new product sales were cannibalized in the years 2004-2006(5)
4. DuPont lacks a consistent reporting methodology for M&A activity
– Gains on asset sales are occasionally included as operating income, e.g. Q3 2013 ~$26m gain on Pannar(6)
– When measuring operating margins between 2008 and 2013, DuPont selectively includes the impact of M&A(7)
o DuPont excludes Coatings (sale announced in 2012) and PChem (not yet spun), but doesn’t exclude Danisco (acquired in
2011), nor does it pro forma adjust the “base” 2008 margin for the Danisco acquisition
37

Trian Believes It Has Already Made An Impact On Value Creation
At DuPont… And That There Is Much More To Be Unlocked
38
Value Destruction
Before Trian’s Involvement
DuPont’s Actions
Since Trian’s Involvement Outstanding Concerns
Operations
EPS down >7% since 2011
Management missed guidance for 3 years in
a row(1)
$2.2bn addbacks during management tenure
Revenue growth and margins underperform
peers in 5 of 7 segments
Announced Fresh Start Initiative,
a $925m cost savings(7)
We estimate $2-$4bn of excess corporate
costs (annually)(8)
Revenue growth and margins still trail peers
in 5 of 7 segments
Limited commitment to flow-through Fresh
Start cost savings to the bottom line(9)
M&A
Transferred >$6bn(2) of value to Private
Equity owners by selling Axalta for cash
versus tax-free spin-off
− Value destruction exacerbated by
excess corporate costs: $339m of 2011
EBITDA under DuPont vs $568
standalone(3)
Danisco margins down 33% since acquired(4)
Spinning Chemours tax
efficiently (vs. selling for cash)
Other divestitures, including:
o Glass Laminating Solutions
o DuPont Hotel/Theatre/
o Copper Fungicide Business
Performance Chemical spinoff announced in
Oct. 2013; completion not expected until mid-
2015, almost two years after announcement
Capital
Allocation &
Governance
Took 10 years to complete the $2bn share
buyback program launched in 2001(5)
Dividend growth rate significantly below that
of peers
Poorly timed capex (e.g. $600m Altamira
investment during TiO2 oversupply)
~$5bn of Agriculture R&D has led to zero
traits and $2.2bn in litigation costs(6)
Poorly constructed compensation programs
Announced a $5bn share
buyback program
Committed to return $4bn of
capital to shareholders from
Chemours dividend
Upgraded the Board
Amended Key Performance
Indicators for 2015 compensation
Limited enhancement of
Chemours proposed corporate
governance
DuPont rejected universal proxy proposal
No deadline on 60% of buyback program
Uneconomic ROIC on R&D and capex in
2/3rds of the business
Failure to meet Applied Bioscience goals
Diluted shares outstanding have risen during
CEO tenure
Misalignment of management incentives
Poor corporate governance structure at
Chemours
Trian questions the appropriateness of a
sitting CEO also serving as a lead director
Source: Company SEC filings, transcripts and press releases.
(1) Excludes one-time gains, the impact of better than expected tax rate and other one-time items.
(2) Axalta’s current enterprise value of ~$10.4bn minus after-tax sale proceeds of $4bn that DuPont received in sale of
Coatings (closed 2013),
(3) EBITDA is defined as earnings before interest, taxes, depreciation and amortization. See
footnotes on page 71 of Trian’s White Paper, which was filed with the SEC on February 17, 2015.
(4) Please refer to page 84 of Trian’s White Paper, which was filed with the SEC on February 17, 2015, for further detail.
Margins in 2010 at Danisco pro forma for synergies were ~13.8% and were 9.3% in 2014.
(5) $2bn plan first authorized in 2001. The final purchase under the program was completed in H1 2012.
(6) See 2013 Form 10-K, and Reuters article on March 26, 2013 “Monsanto, DuPont strike $1.7 billion licensing deal, end
lawsuits”, DuPont had Imprelis charges of $1.2bn and $1bn jury verdict for patent infringement on Roundup Ready 2
patent (Monsanto’s trait). In lieu of $1bn payment to Monsanto, DuPont agreed to pay a minimum of $1.75bn to
Monsanto in long-term royalty payments for Roundup Ready 2 and dicamba.
(7) Represents announcement of Fresh Start Initiative in which $1.3bn cost saving plan
includes $375m of costs transferred to Performance Chemicals.
(8) Please refer to pages 71 and 72 of Trian’s White Paper, which was filed with the SEC
on February 17, 2015.
(9) According to Q4 2014 earnings call. Please refer to page 74 of Trian’s White Paper,
which was filed with the SEC on February 17, 2015 for further details.

Trian’s Board Engagement Is Comprehensive And Adds Value
At large capitalization companies, it is not unusual for Board and Committee
members to receive a thousand pages of material; as a result, it is difficult, if not
impossible, for any director without a team of analysts to thoroughly review all of
the information
When a Trian partner joins a Board, the resources of Trian are mobilized:
1. An operational, financial, strategic and legal diligence request list is sent to the company
2. The appropriate Trian team examines all the information (Trian signs a confidentiality agreement)
3. Trian team interacts with several layers of management
The Trian director is therefore able to:
1. Reduce management’s “information advantage” over Board members
2. Provide thoughtful analysis and recommendations based on material, non-public information
3. Ensure decisions are made by the Board in a dispassionate and clinical fashion
39
While DuPont may portray Trian’s involvement as intrusive, history suggests the result
is enhanced performance and long-lasting, collaborative relationships with
management and other board members; perhaps best evidenced by Trian’s continuing
relationships with Bill Johnson, Arthur Winkleblack and Dennis Reilley (Heinz) and
Dennis Kass (Legg Mason)

Trian Has A Demonstrated Ability To Drive
Operational Improvements and Growth
40
3.5%
8.3%
Trian InvestmentsDuring Prior 5-Year Period
Trian InvestmentsDuring Time Period
Source: Company filings, Bloomberg
(1) Adjusted earnings per share (“EPS”) is defined as net income excluding specifically identified items divided by the weighted average number of diluted shares outstanding during the fiscal year. Trian believes that using EPS on an adjusted
basis for this analysis provides a more accurate representation of a company’s operating performance across time periods. Adjustments to net income include, but are not limited to, certain non-cash items (e.g., impairments, intangibles
amortization, non-cash interest), non-recurring items (e.g., one-time gains and/or losses, restructuring costs, extraordinary items) and non-operational items (e.g., acquisition costs, legal settlements, hedges).
(2) “Core and Other Trian Investments” refers to the same population of Trian investments used for the Total Shareholder Return (TSR) analysis described on page 39 of this presentation. Please refer to the summary chart on such page for the
names of the “Core Trian Investments” and “Other Trian Investments” used in the TSR analysis and the criteria used to select such investments. Such investments do not represent all of the investments purchased or sold for Trian’s clients.
(3) The Annual Adjusted EPS Growth during the “Prior 5-Year Period” represents the compound annual growth rate (“CAGR”) calculated using the company’s Adjusted EPS on the “pre-investment date” versus the Adjusted EPS five years prior to
such date. For purposes of this analysis, the “pre-investment date” for each Trian portfolio company was established as the portfolio company’s (forward or backward-looking) fiscal year-end that was closest to Trian’s initial investment date.
(4) The Annual Adjusted EPS Growth during the Time Period represents the CAGR calculated using the company’s Adjusted EPS on the “pre-investment date” versus the Adjusted EPS through either calendar year 2014 or the last full fiscal year
prior to the last day of public trading of the company’s stock.
Note: While Trian may believe that earnings per share growth during the Time Period is attributable in large part to the cumulative effects of the implementation of operational and strategic initiatives during the
period of Trian’s active involvement and beyond, there is no objective method to confirm what portion of such growth was attributable to Trian’s efforts and what may have been attributable to other factors.
The EPS Growth figures on this page should not be construed as an indication of the performance of the funds managed by Trian and it should not be assumed that any or all of the investments included in this
analysis were or will be profitable in any of the funds managed by Trian. Past performance is not an indication of future results.
Compared to Prior 5-Year Period
Trian has a long track record of working with its portfolio companies to help grow earnings
We have seen the impact of our active involvement and constructive engagement stretch well beyond just
the period of our investment
As the charts below indicate, when measuring annual adjusted EPS growth since the time of Trian’s initial
investment through the present, our portfolio companies have on average generated significant EPS
outperformance
Based on this track record, Trian believes it can help DuPont grow earnings significantly
(3) (4)
Annual Adjusted EPS(1) Growth for Core and Other Trian Investments(2) Time Period: From the Date of Trian’s First Purchase Through the Present (or last day of trading on exchange)

Trian Has A Track Record Of Helping Companies Outperform The
Market Over The Long Term Trian has a track record of adding value in the Boardroom, improving both operating results and
share price performance.
41
Notes
*Denotes a board on which Nelson Peltz serves or has served
(1) Represents the highest percentage of the company's outstanding shares held across all of Trian's equity investment vehicles at any point during the life of the investment.
(2) Time horizon is defined as from the date of Trian’s first purchase through the earlier of 4/16/2015 or last day of public trading.
(3) The TSR figures in the column titled “Stock” reflect the change in the stock price of each company referenced plus the effect of dividends received over the relevant time period. The TSR figures in the Stock column should not be construed as an indication of
the performance of the funds managed by Trian and it should not be assumed that any or all of these investments were or will be profitable in any of the funds managed by Trian.
(4) We highlight the S&P 500 Index (the "Index") here only as widely recognized index, however, for various reasons the performance of the Index and that of the individual companies included in this chart may not be comparable. Reference to the S&P 500 used
in this chart shall mean the S&P 500 Total Return Index, which includes the price changes of all underlying stocks and all dividends reinvested. S&P data is obtained from Bloomberg using the SPX ticker with the inclusion of dividend re-investment.
(5) This category includes all of the investments made by Trian since Trian’s inception in November 2005 (through March 2015): (i ) for which Trian has filed a Schedule 13D or 13G or made a similar non-U.S. filing or other notification with respect to its investment
in the company or (ii) that were or are a publicly disclosed activist position in which funds managed by Trian invested at least $700 million of capital (the representative size of Trian’s current activist investments) and where Trian (x) had a designee or nominee on
the Board and/or (y) wrote a white paper” and met with management. The companies shown on this page do not represent all of the investments purchased or sold for Trian’s clients.
(6) This category includes all other investments made by Trian since Trian’s inception in November 2005 (through March 2015) in which funds managed by Trian held 4.2% or more of the company’s
outstanding shares, the percentage that Trian held in chemical company Chemtura.
Cumulative
Total Shareholder Annual Bps of
Highest % of Total Time Return (TSR) (3) Outperformance
Company Owned Horizon Over Time Horizon Over Time Horizon
Company by Trian (1) (Years) (2) Stock S&P 500 (4) vs. S&P 500
*Wendy's / Tim Hortons 20.3 % 9.4 314% 110% 805bps
Cadbury / Dr Pepper Snapple 4.4 % 8.3 261% 78% 944
Tiffany & Co. 8.7 % 8.2 147% 76% 448
*Mondelez / Kraft Foods 3.1 % 8.0 167% 74% 590
*H.J. Heinz 4.3 % 7.3 177% 53% 890
*Legg Mason 11.4 % 6.2 227% 175% 333
Family Dollar 8.5 % 5.3 183% 105% 720
Domino's Pizza 9.9 % 4.0 518% 72% 4,275
State Street 3.3 % 4.1 90% 77% 201
*Ingersoll-Rand / Allegion 7.1 % 3.2 154% 70% 1,575
Lazard 6.0 % 3.2 128% 68% 1,194
InterContinental Hotels Group 4.0 % 3.1 107% 65% 880
PepsiCo 1.3 % 2.5 50% 57% (211)
Danone 1.0 % 2.5 51% 57% (185)
DuPont 2.7 % 2.1 54% 42% 485
The Bank of New York Mellon 2.7 % 1.1 33% 17% 1,393
Cracker Barrel Old Country Store 4.9 % 9.5 410% 112% 1,054
Cheesecake Factory 14.0 % 7.5 124% 64% 459
Chemtura 4.3 % 4.0 (96%) (7%) (5,320)
Peet's Coffee & Tea 4.8 % 1.8 81% 15% 3,008
Average Outperformance 677bps
Average Outperformance for Companies on which Nelson Peltz Serves or has Served on the Board 839bps
Core Trian
Investments (5)
Other Trian
Investments
(at or above
4.2%) (6)


43
Appendix A: Additional
Credentials For Trian’s Four
Highly Qualified Directors

Nelson Peltz Biography
Chief Executive Officer & founding partner of Trian since its formation in 2005
Serves as a director of Mondelēz International, Inc. (since January 2014), The Madison Square Garden Company
(since December 2014) and The Wendy’s Company, where is he non-executive Chairman (since 2007)
Previously served as a director of Ingersoll-Rand plc (2012 to June 2014), H.J. Heinz Company (2006 until June
2013), Legg Mason, Inc. (2009 until December 2014) and National Propane Corporation (1996 to 1999), the
managing financial partner of National Propane Partners, L.P., where he was Chairman of the Board
Former Chairman and Chief Executive Officer of Triarc Companies, Inc. from 1993 until 2007. During that period,
Triarc owned Arby's Restaurant Group, Inc. and Snapple Beverage Group, as well as other consumer and
industrial businesses
Former Chairman & Chief Executive Officer of Triangle Industries, Inc., a Fortune 100 industrial company and the
parent of American National Can Company from 1983 until December 1988, when it was acquired by Pechiney,
S.A
From 1984 until 1992, Chairman and Chief Executive Officer and a director of Avery, Inc. which, from 1986 to
1989, was primarily engaged in the manufacture and sale of specialty chemicals through Uniroyal Chemical, which
was sold in a management buyout
Mr. Peltz began his business career in 1963 when he joined his family food business
In September 2013, Mr. Peltz was recognized by the National Association of Corporate Directors (NACD) in 2010,
2011 and 2012 as among the most influential persons in the global Corporate Governance arena
Value Proposition: Through Mr. Peltz’s 40 years of experience in investing, turning around and building
companies, he has developed strong operating experience and strategic planning skills that will benefit DuPont’s
operational initiatives and its long-term strategy. Trian believes the attributes, skills and qualifications that Mr. Peltz
possesses through his experience as a hands-on executive and active board member on numerous public
company boards will provide DuPont and its Board with valuable industry knowledge and management experience
44

Nelson Peltz Has Significant Relevant Experience
45
Rationale
Chemical/ Industrial
Experience
Former Chairman & CEO of Triangle Industries (American National Can), a
Fortune 100 industrial company
Former Chairman & CEO of Avery, the parent Company of Uniroyal
Chemical, a producer of agricultural and industrial chemicals
International Markets
Knowledge
Built the world’s largest packaging company in the 1980s
Served as CEO or board member of several multinational companies
including Triangle Industries, Ingersoll-Rand, Heinz and Mondelēz
Financial Acumen Operations-centric investment track record has led to the formation of Trian,
an investment firm with over $11 billion of assets under management,
including callable commitments*
Portfolio
Transformation/ M&A
Oversaw several strategic transactions in a variety of industries including
industrials, chemicals, consumer and financials
Operations/
Manufacturing
Served as CEO of a company with 24,000 employees and 115 manufacturing
facilities worldwide
Board Experience Served as current or former director of 13 public companies
Currently serves as director of Mondelēz, The Madison Square Garden
Company, and Wendy’s
Public Markets
Experience
Served as CEO of six public companies
Four decade track record of investing in public companies
Environmental/
Regulatory
As a result of serving as Chairman & CEO of Triangle Industries and Avery,
Mr. Peltz acquired significant management experience with environmental
standards / regulatory issues
Source: SEC filings.
* As of 4/1/15. Includes $840 of callable commitments to an investment vehicle formed to co-invest with other funds managed by Trian.

Nelson Peltz Case Study:
Triangle/American National Can (Fortune 100)
46
Trian Principals acquired an initial interest in
Triangle in 1983
− Trian Principals were Chairman & CEO and President
& COO
− Created significant value by growing organically and
through M&A, keeping overhead lean and properly
incentivizing management to grow profitably
− Acquired National Can (1985, $420m) and the
packaging business of American Can (1986, $600m)
− Became the world’s largest packaging companies and a
Fortune 100 industrial company
End Result
− In 1988, Triangle Industries was sold to a strategic
buyer (Pechiney) for over $4bn of enterprise value
− In 1988, Fortune magazine ranked Triangle Industries
as the best performer among all Fortune 500 industrial
metal products companies based on "Total Return to
Investors" over the previous decade
Triangle Industries Operating Performance
$137 $170
$1,646
$2,668
$4,336
4.1%
6.2%
10.0% 8.6% 9.7%
1983 1984 1985 1986 1987
Net Revenue EBITDA Margin
Enterprise Value
Investment Overview
Disclaimer: This case study is an example of a discrete investment, which is presented solely to illustrate Trian’s Principals’ investment process and strategies and not to imply that Trian’s
involvement with DuPont will be successful. Market conditions at the times of the events reflected in the case study may differ materially from current and future market conditions. There can be no
guarantee or assurance that Trian’s strategic or operating initiatives if implemented will be successful. The performance of the example should therefore not be construed as an indication of the
performance of DuPont on a go forward basis. Past performance is not an indication of future results.
Source: Bloomberg.
$80
$4,200
1983 1988
($ in millions)

Nelson Peltz Case Study:
Snapple Turnaround (A Harvard Business School Case Study)
Triarc, an investment vehicle controlled by
Trian’s Principals, acquired Snapple from Quaker
Oats in 1997 ($300m purchase)
− Significant operational turnaround involving product
innovation, supply chain investment and marketing
“Blank Sheet of Paper” approach to building an
overhead structure, similar to the recent
turnaround of Axalta in 2013/2014
− Built an efficient overhead structure for senior leadership
and corporate services including finance, accounting HR,
legal, and IT functions
− Eliminated bureaucracy and bloated corporate structure
End Result
− Reversed a multi-year string of volume declines and grew
top and bottom lines
− Returned business back to profitability
− 11 straight quarters of case sales growth
− Sold Beverage business(1) to Cadbury in 2000 for ~$1.5bn
− Became a Harvard Business School case study
(15%) (15%) (25%)
0% 8% 8% 9%
(28%) (37%)
17% 26%
1995 1996 1H97 2H97 1998 1999 1H00
% Cumulative Change
% Change vs. Prior Years
$300
$1,500
1997 2000
Disclaimer: This case study is an example of a discrete investment, which is presented solely to illustrate Trian’s Principals’ investment process and strategies and not to imply that Trian’s involvement with DuPont will be
successful. Market conditions at the times of the events reflected in the case study may differ materially from current and future market conditions. There can be no guarantee or assurance that Trian’s strategic or
operating initiatives if implemented will be successful. The performance of the example should therefore not be construed as an indication of the performance of DuPont on a go forward basis. Past performance is not an
indication of future results.
Source: Company information. Figures are unaudited.
(1) In 1997, when purchased, Snapple Beverage Corp. included only the Snapple brand. In 2000, the Snapple Beverage Group included Snapple as well as three other smaller beverage brands.
The Snapple brand generated approximately 72% of Adjusted EBITDA for the Snapple Beverage Group in 1999.
47
Snapple: Case Sales Trends (Volume)
Enterprise Value(1) Investment Overview
($ in millions)

126%
108%
Wendy's S&P
Nelson Peltz Case Study: Wendy’s
Situation Overview (Oct. 2008 – Apr. 2015)
In 2008, Triarc, which was controlled by Trian’s
Principals, acquired Wendy’s International;
Nelson Peltz became Non-Executive Chairman
Trian’s Principals’ investment thesis for long-
term value creation: 1) increase focus, 2)
invest in organic growth, and 3) expand
margins
Capital expenditures in 2014 have tripled since
2008 as the brand is executing an Image
Activation investment program
Relaunched the entire core menu, including
hamburgers, fries, salads and chicken
sandwiches, resulting in record sales per
store
Rated #1 overall and in food and décor in
Zagat’s Sept. 2012 fast food survey
Improved the quality of earnings through
refranchising: targeting 5% company
ownership by 2016 – down from 21% in 2008
Helped attract new management team led by
Emil Brolick to lead brand reinvigoration
Key Metrics Up Across the Board
TSR 9/30/08-4/16/15(2)
Source: Bloomberg.
48
“Nelson Peltz and Trian have played an important role in Wendy’s brand transformation and financial
improvement. I greatly value the thought leadership and strategic insight that Nelson and the Trian team provide.
Nelson and Trian are passionate advocates for the brand’s growth and success. We work collaboratively on key
strategic decisions and our company benefits from Trian’s insight on financial and global opportunities.”
—Emil J. Brolick, President and CEO, The Wendy’s Company
Disclaimer: This case study is an example of a discrete investment, which is presented solely to illustrate Trian’s Principals’ investment process and strategies and not to imply that Trian’s involvement with
DuPont will be successful. Market conditions at the times of the events reflected in the case study may differ materially from current and future market conditions. There can be no guarantee or assurance that
Trian’s strategic or operating initiatives if implemented will be successful. The performance of the example should therefore not be construed as an indication of the performance of DuPont on a going forward
basis. Past performance is not an indication of future results.
Source: SEC filings, press releases and Bloomberg.
(1) Includes consolidated Arby’s capital expenditures.
(2) “TSR” represents total shareholder return, or the change in stock price of Wendy’s plus the effect of dividends received between 9/30/08-4/16/15.
($mm, except per share) FY09A FY14A Change
Average Co-Op Unit Volume $1.422 $1.593 12%
Net Revenue $2,437 $2,061 -15%
Restaurant Margin 14.8% 15.8% 100bps
G&A $353 $263 -25%
EBITDA $338 $393 16%
% - Margin 13.9% 19.1% 518bps
EPS $0.19 $0.34 79%
Capital Expenditures(1)
$102 $299 193%
Dividend per Share $0.06 $0.21 242%Source: Financials based on company filings, press releases and investor presentations.
Wendy’s Outstanding Shareholder Returns

Nelson Peltz Case Study: Ingersoll-Rand
Situation Overview
Trian invested in IR in February 2012 and met
with management that April to discuss a broad
corporate restructuring seeking:
– Higher margins
– Portfolio optimization
– Efficient capital allocation
In August 2012, Nelson Peltz joined the Board
of Directors
Since then, Ingersoll-Rand has accomplished
the following:
– Increased Focus: Spun-off security business
(Allegion) to shareholders; re-rated to 11.6x
EV/NTM EBITDA(1), 76% above its pre-
investment valuation
– Improved Profitability: EBIT margin
increased ~200bps (from 10%-12%);
expected to be 14% by 2016(2)
– Improved ROIC(3): Improved by 294bps from
2011-2014 (up 27%)
Key Metrics Up Across the Board
Source: Financials based on company filings, press releases and investor presentations.
IR Shareholder Returns Outperform The Market
TSR from 2/2/12-4/16/15(4)
Source: Bloomberg.
Disclaimer: This case study is an example of a discrete investment, which is presented solely to illustrate Trian’s Principals’ investment process and strategies and not to imply that Trian’s involvement with DuPont will be
successful. Market conditions at the times of the events reflected in the case study may differ materially from current and future market conditions. There can be no guarantee or assurance that Trian’s strategic or operating initiatives
if implemented will be successful. The performance of the example should therefore not be construed as an indication of the performance of DuPont on a going forward basis. Past performance is not an indication of future results.
Source: SEC filings and Bloomberg.
(1) EV/NTM EBITDA is defined as Enterprise Value divided by next twelve months EBITDA. Ingersoll-Rand/Allegion re-rated from 6.6x EBITDA to 11.6x on a combined basis.
(2) Source: Bloomberg and SEC filings.
(3) ROIC is defined as return on invested capital, which equals net operating profit after tax divided by average equity plus net debt.
(4) “TSR” represents total shareholder return, or the change in stock price of Ingersoll-Rand plus the effect of dividends received and the distribution of Allegion between 2/2/12-4/16/15.
49
154%
70%
Ingersoll-Rand/Allegion
S&P
(3)
$mm, except per share 2011 2014 Change
On a Consolidated Basis
Revenue $14,782 $15,010 1.5%
Organic Growth 10.4%
Gross Margin 29.0% 32.0% 297bps
EBITDA $1,910 $2,194 14.9%
EBIT $1,507 $1,813 20.3%
EBIT Margin 10.2% 12.1% 188bps
Diluted EPS $2.82 $4.16 47.5%
Annual Dividend $0.59 $1.11 87.6%
After-Tax ROIC 11.1% 14.0% 294bps
John H. Myers Biography
Former President and Chief Executive Officer of GE Asset Management
(General Electric’s asset management subsidiary) from 1996 until 2006
– Responsible for ~$200bn in assets under management, including those held
by General Electric’s pension funds, 401(k) plans, mutual funds and
insurance companies and more than 200 external institutional clients
Held various management positions in General Electric for over 35 years
Serves as director for Legg Mason, Inc. (since June 2013)
Served as a director of Hilton Hotels Corporation from 2000 to 2007
Value Proposition: Trian believes Mr. Myers’ qualifications to serve on
DuPont’s Board include the knowledge and experience he has gained while
serving in various management positions for over 35 years with General Electric.
In addition, he gained extensive financial and leadership experience serving as
President and Chief Executive Officer of GE Asset Management and through his
experience as a director of Legg Mason, Inc. and as a former director of Hilton
Hotels Corporation
50

John H. Myers Has Significant Relevant Experience
51
Rationale
Culture of High
Performance
Grew GE Asset Management (GEAM) AUM from $58bn in 1996 to $200bn
in 2006
Strong investment returns at GEAM made it unnecessary for GE to make
any corporate contributions to the GE Pension Plan during tenure
Chemical/ Industrial
Experience
First half of GE career spent on industrial side of business
Reported directly to GE’s Chairman & CEO
International Markets
Knowledge
Mr. Myers was instrumental in shaping GEAM’s international investment
program and GEAM was one of the first ERISA plans to venture into
international equity investments
Worked abroad in both Germany and Italy while at GE
Financial Acumen
P&L responsibility over entire GEAM business
Implemented “Six Sigma” to create more efficient investing process in
GEAM, optimizing resource allocation
Served on audit committee of Hilton Hotels
Portfolio
Transformation/ M&A
Invested in a broad range of products including real estate, private equity,
domestic and international equities, and fixed income
Significant experience overseeing investment process and managing risk
Board Experience Director of Legg Mason
Previous Director of Hilton Hotels, DoubleTree, Callaway Golf, and Promus
Hotel Corp; Former Member of Warburg Pincus Advisory Committee
Public Markets
Experience
Built lasting relationships with institutional investors; in addition to GE,
managed assets for more than 200 external institutional clients
Environmental/
Regulatory
GEAM, one of the largest pension fund managers in the world, is highly
regulated and is subject to the rules and regulations of the Employee
Retirement Income Security Act (“ERISA”) Source: “GE Asset Management Leverages its Heritage”;4/1/2004, The Business of Running Money, Volume 1, Number 7; GE Boosts Active Management, 3/23/1998, Pension & Investments; “GE Asset
Management’s Sweet Spot”, March 2002, Money Management; “GE Whiz”, December 2003, Institutional Investor; “John Myers, GE Investments”, 5/23/1997, PlanSponsor Magazine; “Myers Out,
Pressman in at GE Asset”, 5/29/2006, Pension & Investments; and Aurora Capital Group http://www.auroracap.com/people/advisors-jmyers.php.

John H. Myers Case Study:
General Electric Asset Management Under John Myers, the GE Asset Management (GEAM) business
expanded rapidly, especially in servicing external clients
As of 2003, “GE owns the biggest pension-fund-turned-asset-
manager” with $30.8bn of external money (General Motors was
the closest with $20bn of external money from less than 10
clients)
Under Myers, the GE pension fund achieved several of GE’s key
performance goals:
− Grew external assets, leveraging costs of running pension portfolio
− No GE corporate contribution needed to be made to GE Pension Plan
between 1987 and 2011
Demonstrated expertise across the investment space
− GEAM had direct investments in real estate, private equity, domestic and
international equities and fixed income
− 70-80% of GEAM assets were internally managed throughout Myers’ time
at GEAM
Implemented “Six Sigma” to create most efficient investing
process
− Cut time to prepare a presentation in half through redesign and automation
− Client report delivery time went from 12-14 days to 8-10 days
Well perceived
− “GE Pension Trust, the company’s defined benefit plan continues to set an
industry standard, as does Myers, who has emerged as one of America’s
most influential pension managers” – Institutional Investor (12/03)
− “General Electric deserves to stand as a model of the defined benefit
system. Other corporations, as well as public retirement systems ought to
examine it for valuable insight in managing their own defined benefit plans”
– Pensions & Investments (1/20/11)
AUM Growth $bn(1)
$58
$200
1996 2006
Source: “GE Asset Management Leverages its Heritage”;4/1/2004, the Business of Running Money, Volume 1, Number 7; GE Boosts Active Management, 3/23/1998,
Pension & Investments; “GE Asset Management’s Sweet Spot”, March 2002, Money Management; “GE Whiz”, December 2003, Institutional Investor
(1) “John Myers, GE Investments”, 5/23/1997, PlanSponsor Magazine and “Myers Out, Pressman in at GE Asset”, 5/29/2006, Pension & Investments
52

Arthur B. Winkleblack Biography
Executive Vice President and Chief Financial Officer of H.J. Heinz
Company from January 2002 until June 2013, when the company was
sold to Berkshire Hathaway/3G Capital
Serves as a director for Church & Dwight Co., Inc. (since 2008) and RTI
International Metals, Inc. (since December 2013) and Performance Food
Group, a Blackstone Company (since February 2015)
Formerly held senior finance positions at C. Dean Metropoulos & Co., the
consumer products arm of Hicks, Muse, Tate and Furst, a private equity
firm (1998 until 1999); Six Flags Entertainment Corporation (1996 until
1998); AlliedSignal, Inc. from 1994 until 1996; and PepsiCo, Inc. from
1982 until 1994
Value Proposition: Trian believes Mr. Winkleblack’s substantial
executive experience, including almost 12 years of service as Executive
Vice President and Chief Financial Officer of H.J. Heinz Company,
provides him with knowledgeable perspectives on strategic planning,
international operations, acquisitions and divestitures and cost and
financial controls. In addition, his experience as CFO of a large
multinational company will enable him to bring important perspectives to
the Board on performance management, compliance, risk management,
public reporting and investor relations
53

Arthur B. Winkleblack Has Significant Relevant Experience
54
Rationale
Oversaw High
Performance Culture
Served as CFO of Heinz for over a decade; built strong performance culture and
delivered consistent top-tier results
Prior to Heinz, 15 years of experience combined at PepsiCo and AlliedSignal and
six years in private equity
Chemical/ Industrial
Experience
Current director of RTI International Metals, a vertically integrated supplier of
advanced titanium
Worked in finance team at AlliedSignal (predecessor to Honeywell International)
International Markets
Knowledge
Grew Heinz to be a leading global player (2/3rds of sales outside U.S.)
At Heinz, emerging markets grew from 11% of sales in 2006 to 21% in 2012, with
strong presence in Latin America, Eastern Europe, Asia and India
Financial Acumen Significant experience overseeing organic growth, portfolio realignment, lean
management initiatives, cash flow optimization, executive comp programs and
transparency with investors
Portfolio
Transformation/ M&A
At Heinz, divested low value commodity businesses tax efficiently, including a
major reverse merger with Del Monte. Implemented disciplined M&A program to
build scale profitably in emerging markets
Heinz ROIC improved 560bps from 2006 to 2012
Board Experience
Director of Church and Dwight (252% TSR vs 78% for S&P 500 during tenure) and
Chair of the Compensation Committee
Director of RTI International Metals (announced sale to Alcoa in March ’15)
Recently joined board of Performance Food Group (a Blackstone company)
Capital Markets
Experience
Decades of experience overseeing all aspects of capital management
Significant interaction and familiarity with leading institutional investors
Environmental/
Regulatory
Strong safety and quality record at Heinz across vast global factory network
Significant interactions with FDA and other regulatory bodies
Source: Heinz SEC filings, Bloomberg.

$mm, except per share FY06A FY12A Change
Net Revenue $8,643 $11,649 35%
Em. Markets (% of Total) 11.0% 21.0% 1,000bps
EBITDA ex Marketing $1,866 $2,486 33%
Marketing Spend $269 $468 74%
SG&A % of Sales (ex Marketing) 18.1% 17.1% -98bps
Diluted EPS $2.10 $3.35 60%
Annual Dividend $1.20 $1.92 60%
FY13A $3.62 73%
FY14E $3.80 81%
After-Tax ROIC 14.8% 20.4% 560bps
178%
109%
40%
Heinz S&P Packaged Foods S&P
Arthur B. Winkleblack Case Study: Heinz
Situation Overview (Feb. 2006 – Feb. 2013)
Trian’s Nelson Peltz and Arthur Winkleblack
first began working collaboratively together in
2006
Trian conducted a proxy contest with Heinz
that year and won two seats on the Board
Trian gained tremendous respect for Art’s
operational and financial skill-set, which
helped achieve the following:
– 32 consecutive quarters of positive organic growth
– Significant EPS, free cash flow and share price
appreciation
– Marketing growth 2x faster than sales
– Zero “addbacks” to EPS for 5 consecutive years(1)
– Substantial improvement to return on capital
In February 2013, Berkshire Hathaway and 3G
Capital entered into an agreement to acquire
Heinz at a 20% premium(2) and a 13.0x NTM
EBITDA(3) multiple
Key Metrics Up Across the Board
Source: Financials based on company filings, press releases and investor presentations.
Heinz Shareholder Returns Led the Peer Group(7)
Returns from 2/06/06-2/14/13
Source: Bloomberg.
Disclaimer: This case study is an example of a discrete investment, which is presented solely to illustrate Trian’s Principals’ investment process and strategies and not to imply that Trian’s
involvement with DuPont will be successful. Market conditions at the times of the events reflected in the case study may differ materially from current and future market conditions. There can be no guarantee or assurance that Trian’s strategic or operating initiatives if implemented will be successful. The performance of the example should therefore not be construed as an indication of the
performance of DuPont on a going forward basis. Past performance is not an indication of future results.
Note: February 6, 2006 represents the date when published reports first surfaced on CNBC of Trian’s proposed activist involvement. While Trian may believe that the rise in share price during the
period of Trian’s active involvement was attributable in large part to the cumulative effects of the implementation of Trian’s proposed operational and strategic changes, there is no objective method to confirm what portion of the stock’s appreciation was attributable to Trian’s efforts during this period and what was attributable to the overall rise in the markets or other factors.
Note: February 14, 2013 was the day the Heinz acquisition was announced. Key metrics from FY 2006-2012 as company doesn’t disclose marketing spend in 2013.
Source: SEC filings, Heinz PREM 14A 3/4/13, 10-Q filed 2/21/13, Capital IQ.
(1) From FY 2007-2011, no addbacks.
(2) 20% premium to stock price the day before announcement of transaction.
(3) Earnings before interest, taxes, depreciation and amortization.
(4) Selling, general and administrative expenses.
(5) Earnings per share. Represents Bloomberg consensus estimates at time of acquisition.
(6) Return on invested capital based on Company calculations.
(7) Shareholder returns from Bloomberg include dividends.
(5)
(4)
(6)
55

Robert J. Zatta Biography
Former Acting Chief Executive Officer and long-time Chief Financial
Officer of Rockwood Holdings, Inc., a specialty chemicals company, from
July 2014 and April 2001, respectively, until January 2015, when
Rockwood was acquired by Albermarle Corporation
Prior to Rockwood, held several significant financial management positions
at the Campbell Soup Company (from 1990 to 2001), most recently Vice
President responsible for Corporate Development and Strategic Planning
Earlier in his career, Mr. Zatta worked for General Foods Corporation and
Thomas J. Lipton, Inc.
Value Proposition: Trian believes Mr. Zatta’s extensive experience in the
specialty chemical sector will allow him to bring valuable industry
experience to the DuPont Board. In addition, Trian believes that DuPont’s
Board will benefit from Mr. Zatta’s expertise in operations, strategic
planning, cost and financial controls and public company reporting, which
he has developed through his experience as a senior executive at several
global companies
56

Robert J. Zatta Has Significant Relevant Experience
57
Rationale
Oversaw High
Performance Culture
Rockwood Chemical had best-in-class TSR and EPS growth since IPO
TSR until Rockwood was acquired in 2014 was 364% vs 197% for S&P Chemicals
over same period
From 2005-12(1), EPS CAGR was 19%, almost 4x EPS CAGR of S&P Chemicals
(5%)
Chemical/ Industrial
Experience
CFO of Rockwood, a chemicals conglomerate, for over a decade
Oversaw a variety of chemical companies ranging from commodities (e.g. TiO2),
mining (e.g. Lithium) to specialties (e.g. surface treatment)
International Markets
Knowledge
In 2012, only 21% of Rockwood’s sales came from the United States
Rockwood had substantial operations in Germany and Chile
Served as international CFO at Campbell Soup Company
Financial Acumen
Long-term CFO experience, in which he oversaw capital allocation (including capex;
R&D; M&A)
Ran a lean company: Rockwood’s businesses had best-in-class margins; Corporate
costs never more than 1% of sales
Portfolio
Transformation/ M&A
During his time as CFO, rolled up several strategic assets to build a leading specialty
chemicals company (>35 M&A transactions)
Drove 48% multiple expansion after pursuing a separation strategy
Board Experience
Established Rockwood’s board structure and interacted extensively with Company’s
Audit Committee
Served on the supervisory board of Rockwood’s German subsidiary and on the board
of its European pension committees
Capital Markets
Experience
Led execution on Rockwood’s IPO and numerous debt financings
Managed Rockwood with prudent net leverage of 1.9x (gross of 3.5x)
Extensive investor interaction as Rockwood CFO
Environmental/
Regulatory
Experience with international regulatory bodies
Worked with European anti-trust agencies for sale of TiO2 business
Interacted with Chilean government due to extensive Lithium operations
Source: Rockwood SEC filings, Bloomberg. (1) CAGR defined as compounded annual growth rate. Since the company sold over half of its business, yet did not close on a significant portion of that divestiture, it is unfair to compare 2013
EPS to historical figures.

Robert J. Zatta Case Study: Rockwood
Source: Rockwood and DuPont SEC Filings, Press Releases and Investor Presentations, Bloomberg and Goldman and Bank of America Research. Specialty peers include Air Products, Airgas, PPG, Sherwin Williams, Praxair, Monsanto, Ecolab, Valspar and FMC
(1) Source: Q4 2012 Form 8-K dated 2/19/13. Looks at corporate and other adjusted EBITDA and September 17, 2013 conference presentation (2) Source: Rockwood press releases and 2013 Form 10-K. In 2013, the business sold its Performance Additives and Advanced Ceramics businesses and agreed to sell its TiO2 business (3) CAGR defined as compounded annual growth rate. Since the company sold over half of its business, yet did not close on a signi ficant portion of that divestiture, it is unfair to compare 2013 EPS to
historical figures (4) TSR defined as total shareholder return. 7/15/2014 represents the date of announcement of acquisition by Albemarle. (5) Reflects a blended (weighted) average EV/EBITDA multiple of Ceramics, Performance Additives & TiO2, and Lithium & Surface Treatment (based on Albemarle announced acquisition price for
Rockwood and sale proceeds, net of tax, for the other businesses). Weights by 2014E EBITDA after allocating corporate as a % of revenue. Uses Bank of America research as of 4/30/13 and Goldman Sachs research as of 5/17/13.
A Best-In-Class Performer
EPS CAGR: 2005-2012(3)
TSR From IPO to Acquisition: (9/30/05-7/15/14)(4)
Significant Value Creation Through 2013 Separation
Re-Rated to A Specialty Multiple
7.4x
10.9x
EV/EBITDA@ Jan. 2013
EV/EBITDABlended(5)
364%
129% 197%
94%
Rockwood DuPont S&P Chemicals S&P 500
Rockwood, a leading specialty chemicals company, generated best-in-class returns and EPS growth led by
CEO Seifi Ghasemi and CFO Bob Zatta
Lean and decentralized structure: 37 people in corporate center and unallocated corporate costs of just
$22m(1), <1% of sales
Track record of strong capital allocation and success with transformative M&A
– Prior to 2013, Rockwood was valued at a discount to specialty peers, despite the fact that ~75% of 2012 sales were generated
from high margin, specialty assets; investors penalized the company for its highly cyclical TiO2 business (25% of sales)
– In 2013, Rockwood divested three of its businesses, including TiO2, which generated 62% of sales(2)
– As a result, investors effectively re-rated Rockwood by 48% to an 11x blended EBITDA multiple
19%
6% 5% 5%
Rockwood DuPont S&P Chemicals S&P 500
58

Edward Garden Biography Chief Investment Officer (CIO) and founding partner of Trian since its formation in
2005
As CIO, Mr. Garden oversees all aspects of Trian’s portfolio management, idea
generation, analysis, and due diligence
Currently serves on the boards of The Wendy’s Company, Family Dollar Stores, and
The Bank of New York Mellon
Former Vice Chairman and Director of Triarc Companies
Prior to joining Triarc, Mr. Garden was a managing director of Credit Suisse First
Boston, where he served as a senior investment banker in the Financial Sponsors
Group responsible for managing relationships with several large private equity firms,
executing financings and providing strategic advisory services
In 2014, Mr. Garden was named to CNBC’s Next List, composed of 100 next
generation “trailblazers” expected to change the face of business over the next 25
years
Value Proposition: As CIO of Trian, Mr. Garden has worked with management teams
and boards of directors at a number of world-class businesses to implement
operational improvements. Mr. Garden played a leading role in defending the Family
Dollar Board when dissident shareholders surfaced as the company pursued a
strategic transaction. We believe Mr. Garden’s demonstrated record of strong
operating experience and his network of significant institutional relationships can be
utilized for the Company’s benefit and makes him extremely well qualified to serve on
the Company’s board.
59

60
Appendix B: Stock Price
Attribution Analysis

Trian Is Responsible For The Two Greatest Days of DuPont’s Share Price
Outperformance Since 2009
1
2
3
4
5
Top 5 Days of DD Share Price Outperformance vs. S&P 500 Since 2009 (Management Tenure)
The two greatest days of DuPont share price outperformance since 2009 were i) the release
of Trian’s White Paper in 2014 and ii) the day Trian’s stake became public in 2013. The next
three ‘top days’ were driven by macro events (cyclical companies outperforming the
market as sentiment improved in the financial crisis) and other exogenous events.
DuPont
1-Day Change 1-Day Change Outperformance
Date DD Share Price S&P Share Price vs. S&P 500 Event / Details
9/17/14 5.2% 0.1% +506bps * Trian released initial White Paper & public letter to the
DuPont Board
* DuPont share price outperformed S&P 500 by ~730 bps
over ensuing one month period
7/17/13 5.3% 0.3% +499bps * Trian stake in DuPont was first reported publicly by CNBC
* DuPont share price outperformed S&P 500 by ~900 bps
over ensuing one month period
4/2/09 7.6% 2.9% +476bps * No company specific news
* S&P 500 rallied 3% on improved macro outlook
* Cylical companies outperformed, including DuPont
3/10/09 11.0% 6.4% +465bps * No company specific news (day prior was market low in financial crisis)
* S&P 500 rallied 6% on improved macro outlook
* Cylical companies outperformed, including DuPont
3/16/09 4.0% (0.3%) +430bps * No material company specific news (S&P Chemicals Index +3%)
* One week after market hit low during financial crisis
* DuPont completed previously announced $100mm capex project
61 Sources: Capital IQ and Bloomberg.

Earnings Events and M&A Announcements, In Our View, Have Led to Value
Destruction, Not Value Creation During Management's Tenure
DuPont Operational Execution Since 2009
(31 Earnings Events in Total)
Trian reviewed all 31 Earnings Events (quarterly earnings,
setting of guidance, changes to guidance, pre-
announcements) during management’s tenure
DuPont’s share price declined by $10 cumulatively over
all 31 Earnings Events, underperforming the S&P 500
Index by even more, suggesting strong operational
execution has not been a primary driver of value creation
Share price has declined in response to 7 of the last 9
Earnings Events, suggesting trends are worsening
This is the case even though some Earnings Events coincided
with supposedly “transformational” announcements, such as
the review of PChem and the Fresh Start cost cutting program
See Table A for details of each event, the resulting change in
DuPont’s share price on an absolute basis and relative to the
S&P 500 Index
Cumulative Change in Share Price: -$10 Per Share Cumulative Change in Share Price: $0 Per Share
Trian reviewed all eight major M&A, divestiture and portfolio
announcements during management’s tenure
DuPont’s share price declined by ~$0.46 cumulatively in
response to all eight of these announcements,
suggesting M&A / portfolio actions have not been a
primary driver of value creation
No single announcement drove so much as 100 bps of share
price outperformance vs. the S&P 500 on that day
See Table B for details of each event, the resulting change in
DuPont’s share price on an absolute basis and relative to the
S&P 500 Index
DuPont M&A / Portfolio Developments Since 2009
(8 Major Portfolio Announcements)
62 Sources: Capital IQ, Bloomberg, Company SEC Filings, and DuPont website news and press releases.

Table A: All Earnings Events Since 2009(1)
63 Source: Company filings; Capital IQ, Bloomberg.
(1) Excludes Q4 2008 earnings reaction which occurred in 2009, because the current CEO was not serving in that position during Q4 2008 period.
Earnings Events
DuPont Stock DuPont Stock
Unaffected Following Change Change vs S&P 500
Date Day Event $ % $ %
4/20/09 4/21/09 Q1'09 Earnings Release 1.32 4.9% 0.75 2.8%
7/20/09 7/21/09 Q2'09 Earnings Release (0.01) (0.0%) (0.11) (0.4%)
10/19/09 10/20/09 Q3'09 Earnings Release (0.75) (2.2%) (0.53) (1.5%)
11/2/09 11/3/09 2010 Outlook Issued At Investor Day 0.28 0.9% 0.20 0.6%
1/25/10 1/26/10 Q4'09 Earning Release (0.02) (0.1%) 0.12 0.4%
4/26/10 4/27/10 Q1'10 Earnings Release (1.55) (3.8%) (0.59) (1.4%)
7/26/10 7/27/10 Q2'10 Earnings Release 1.39 3.6% 1.43 3.7%
10/25/10 10/26/10 Q3'10 Earnings Release (0.48) (1.0%) (0.48) (1.0%)
12/8/10 12/9/10 2011 Outlook Issued At Investor Day (0.56) (1.1%) (0.75) (1.5%)
1/24/11 1/25/11 Q4'10 Earnings Release 0.15 0.3% 0.14 0.3%
4/20/11 4/21/11 Q1'11 Earnings Release 0.54 1.0% 0.25 0.4%
7/27/11 7/28/11 Q2'11 Earnings Release 0.02 0.0% 0.18 0.4%
10/24/11 10/25/11 Q3'11 Earnings Release (1.15) (2.5%) (0.23) (0.5%)
12/8/11 12/9/11 Reduced FY 2011 Earnings to $3.87-$3.95 (1.48) (3.2%) (2.27) (4.9%)
12/12/11 12/13/11 2012 Outlook Issued At Investor Day (0.42) (1.0%) (0.05) (0.1%)
1/23/12 1/24/12 Q4'11 Earnings Release 0.06 0.1% 0.11 0.2%
4/18/12 4/19/12 Q1'12 Earnings Release (0.66) (1.2%) (0.35) (0.7%)
7/23/12 7/24/12 Q2'12 Earnings Release (0.97) (2.0%) (0.53) (1.1%)
10/22/12 10/23/12 Q3'12 Earnings Release (4.51) (9.1%) (3.79) (7.6%)
12/11/12 12/12/12 Announces 2012 EPS will be at high end of range of $3.25-3.30 0.61 1.4% 0.58 1.3%
1/18/13 1/22/13 Q4'12 Earnings Release 0.83 1.8% 0.62 1.3%
4/22/13 4/23/13 Q1'13 earnings 9am 2.08 4.1% 1.55 3.1%
6/12/13 6/13/13 Lowers 2013 guidance to $3.85 at Conference (0.35) (0.6%) (1.16) (2.1%)
7/22/13 7/23/13 Q2'13 Earnings Release / PChem Strategic Alternatives Announcement (0.05) (0.1%) 0.06 0.1%
10/21/13 10/22/13 Q3'13 Earnings Release 0.71 1.2% 0.37 0.6%
1/27/14 1/28/14 Q4'13 Earnings Release (0.67) (1.1%) (1.04) (1.7%)
4/16/14 4/17/14 Q1'14 Earnings Releae (0.74) (1.1%) (0.84) (1.2%)
6/26/14 6/27/14 Lowers Guidance To $4.00-$4.10, Announces Fresh Start (2.26) (3.3%) (2.39) (3.5%)
7/21/14 7/22/14 Q2'14 Earnings Call (0.59) (0.9%) (0.92) (1.4%)
10/27/14 10/28/14 Q3'14 Earnings Release 0.07 0.1% (0.74) (1.1%)
1/26/15 1/27/15 Q4'14 Earnings Relese (0.93) (1.3%) 0.06 0.1%
Total (10.09) (16.2%) (10.35) (16.6%)

Table B: Major M&A / Portfolio Announcements Since 2009
64
Source: Company filings; Capital IQ, Bloomberg.
Note: M&A transactions included in the chart above are only those reported by DuPont in its press releases. Excludes strategic alliances and JVs.
M&A / Portfolio
DuPont Stock DuPont Stock
Unaffected Following Change Change vs S&P 500
Date Day Event $ % $ %
5/13/10 5/14/10 Zhonghao (Fluorochemicals) Interest Announcement (0.94) (2.4%) (0.21) (0.6%)
1/7/11 1/10/11 Danisco acquisition announcement (0.73) (1.5%) (0.66) (1.3%)
4/28/11 4/29/11 Announces Plan To Raise Bid On Danisco 0.04 0.1% (0.09) (0.2%)
4/30/12 5/1/12 Announces Acquisition of Remaining Interest in Solae 0.25 0.5% (0.05) (0.1%)
8/29/12 8/30/12 Coatings Divestiture Announced (0.36) (0.7%) 0.02 0.0%
7/22/13 7/23/13 PChem Strategic Alternatives Announcement (0.05) (0.1%) 0.06 0.1%
10/24/13 10/25/13 Announcement Of PChem Spin-Off 0.52 0.8% 0.25 0.4%
11/20/13 11/21/13 Announce Intent To Sell Glass Laminate Solutions 0.81 1.3% 0.31 0.5%
Total (0.46) (2.0%) (0.38) (1.1%)

65
Appendix C:
Third Party Perspectives
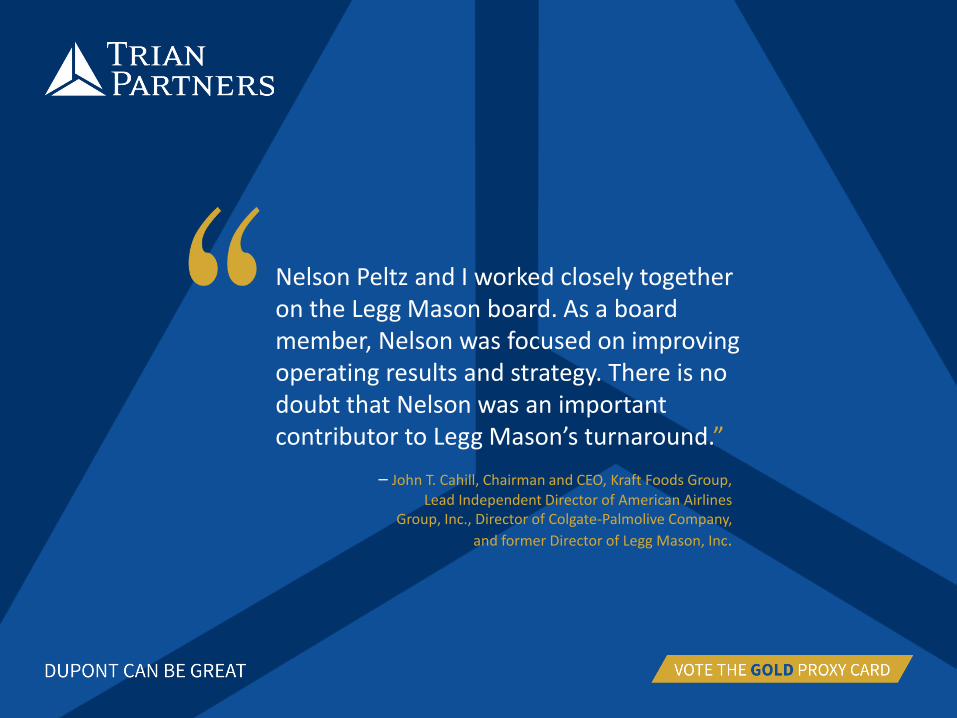
Nelson Peltz and I worked closely together on the Legg Mason board. As a board member, Nelson was focused on improving operating results and strategy. There is no doubt that Nelson was an important contributor to Legg Mason’s turnaround.”
– John T. Cahill, Chairman and CEO, Kraft Foods Group, Lead Independent Director of American Airlines
Group, Inc., Director of Colgate-Palmolive Company,
and former Director of Legg Mason, Inc.

The fact of the matter is that the stocks in which [Mr. Peltz] has been involved, capex has gone up, not down, in nearly all of the cases. The record speaks for something, does it not?”
– Scott Wapner, Host, CNBC’s Halftime Report

We have invested with and alongside Trian and have seen them create long-term value for shareholders. They constructively engage with leadership teams and their analysis of companies is incredibly in-depth. Trian as an active manager plays a beneficial and important role in today’s capital markets as a catalyst for change. We see the performance of the companies they engage on a positive trajectory, from the time Trian initially takes a position to well after they exit. Very simply, Trian is top notch.”
– Anne Sheehan, Director of Corporate Governance, CalSTRS, the largest teacher pension fund in the U.S.
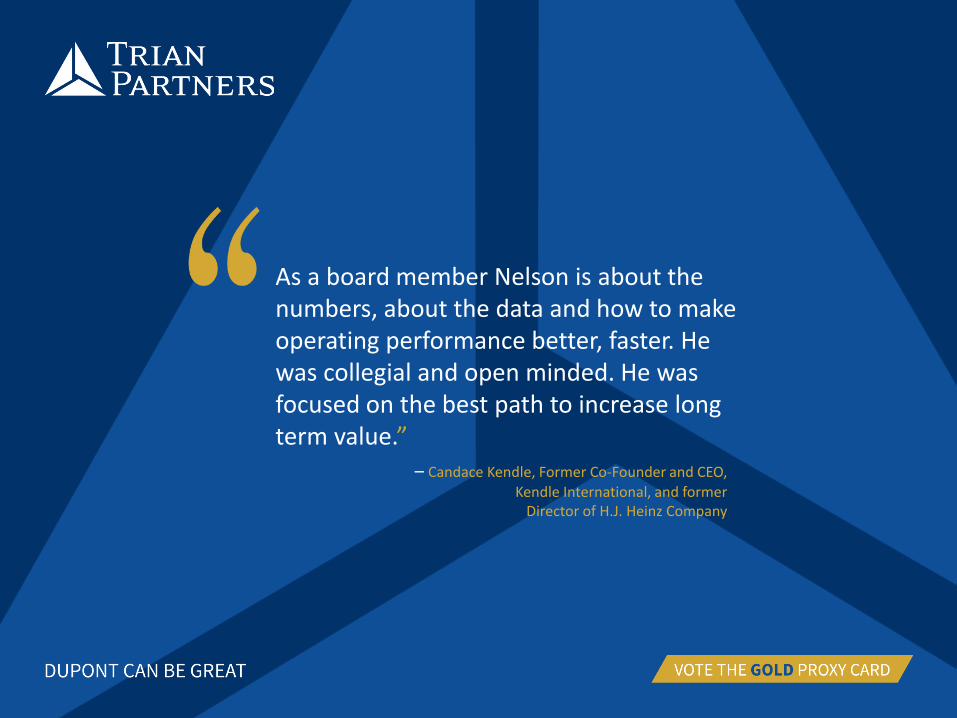
As a board member Nelson is about the numbers, about the data and how to make operating performance better, faster. He was collegial and open minded. He was focused on the best path to increase long term value.”
– Candace Kendle, Former Co-Founder and CEO, Kendle International, and former
Director of H.J. Heinz Company

The key word in describing my relationship with Nelson is that it has been constructive. Nelson and I worked best together by being transparent and candid with each other, leveraging his experiences and that of his team as we worked through various challenges.”
– Joseph A. Sullivan, Chairman and CEO, Legg Mason, Inc.

Trian has been very good for DuPont investors so far, and we think its proposal to strengthen the DuPont Board could extend that helpful boost longer term.”
– CLSA “Gridlock” analyst report on DuPont

I said to another CEO, who I won’t name who had called me and inquired about Nelson, that if I were to form the board today, Nelson would be one of the first directors I’d ask to serve because he is an insightful, communicative, enthusiastic, energetic and available director.”
– William R. Johnson, Former Chairman and CEO, H. J. Heinz Company, current Director of
Emerson Electric Co., United Parcel Service, Inc. and PepsiCo, Inc., and current Trian Advisory Partner

Nelson Peltz seeks to understand other points of view as much as he seeks to be heard. He is an active listener. Having been a CEO, Nelson also has a healthy respect for the difficulties and challenges of leading large public companies…Nelson is collaborative by nature – he is always searching for the best ideas. That makes him a great change agent.”
– Dennis Reilley, Former Chairman and CEO, Praxair, Inc., current Chairman of Marathon Oil Corporation, and
Director of Dow Chemical Company and Covidien Ltd., and current Trian Advisory Partner

Trian is in the business of making good companies a lot better. Their research, analysis, and recommendations are focused on operational and strategic initiatives to build shareholder value over the long term. They ask tough, probing questions, do rigorous fundamental work to understand a company, and develop ideas to help it grow and increase profits. They also are persistent, thoughtful, and creative agents for change.”
– Dennis Kass, Former Chairman and CEO, Jennison Associates, former Chairman and current Director of
Legg Mason, Inc., and current Trian Advisory Partner.

Allegion was spun-off from Ingersoll Rand in December 2013. As an Ingersoll Rand board member, Nelson worked with us to craft a shareholder friendly governance structure that is an important element in keeping our leadership accountable for performance as a standalone entity. Nelson Peltz, the Trian team and Allegion believe that good corporate governance and good operational results go hand in hand. The results speak for themselves.”
– David Petratis, Chairman, President and CEO, Allegion, plc

Trian has a long track record to help investors judge, and its record of short-slate board participation and activism appears positive and constructive, and oriented towards longer-term value creation...”
– Sustainalytics Corporate Governance Company Report on E.I. du Pont de Nemours and Company

Nelson was a terrific colleague on the Heinz Board. His focus was on constructive contribution. He added keen insights and a colorful wit to our board discussions. Nelson is a problem solver who understands strategic opportunities and he works in a collegial manner with his fellow board members to achieve the company’s goals. I relished my experience working with Nelson.”
– Leonard Coleman, Former President, National League of Professional Baseball, and former
Director of H.J. Heinz Company
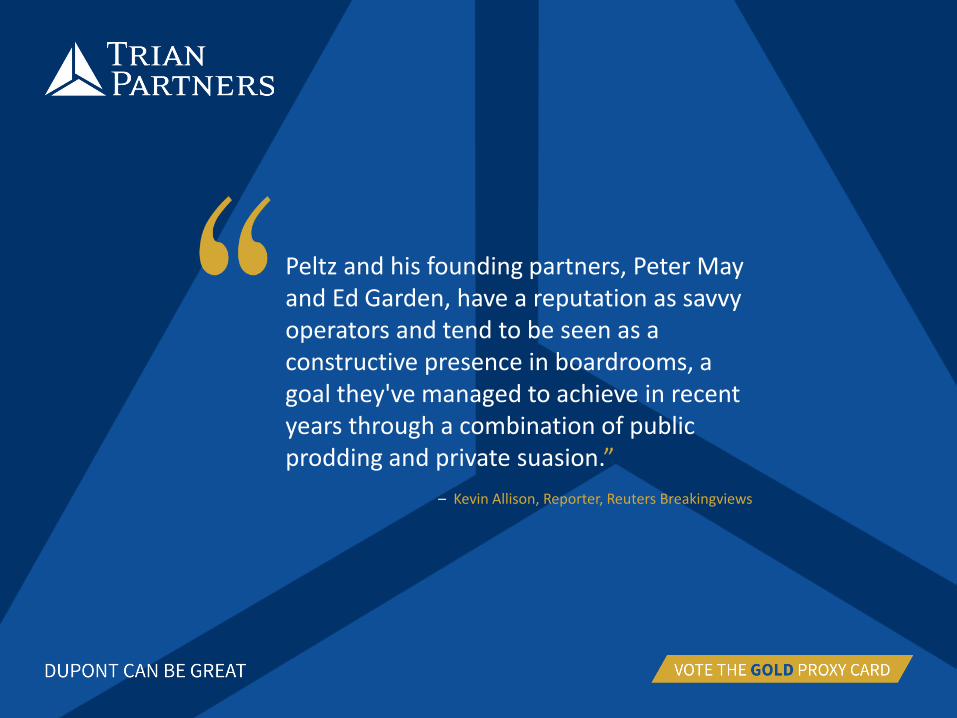
Peltz and his founding partners, Peter May and Ed Garden, have a reputation as savvy operators and tend to be seen as a constructive presence in boardrooms, a goal they've managed to achieve in recent years through a combination of public prodding and private suasion.”
– Kevin Allison, Reporter, Reuters Breakingviews

I have nothing but the highest regard for Nelson Peltz. We served together on the Heinz board and I found him constructive, open-minded and thoughtful. He played by the rules and was a positive influence. He had a lot of good ideas to help make Heinz a better company, including increased marketing and reducing corporate overhead. He definitely added value for all Heinz shareholders.”
– Thomas J. Usher, Former Chairman and CEO, United States Steel Corporation, non-executive Chairman of the board of Marathon Petroleum Corporation,
Director of The PNC Financial Services Group, Inc. and PPG Industries, Inc., and former Director of H.J. Heinz Company

DuPont’s inability to deliver on Kullman’s agenda suggests that she needs more help to overcome the 100+ years of history and the inertia that comes with that; Trian can be Kullman’s best ally. For shareowners, Trian’s impact is already very clear. ”
– CLSA “4Q14: Just the outlook” analyst report on DuPont

Nelson Peltz and I served together on the Heinz board beginning in 2006 and have remained in touch since the company was sold in 2013. Nelson was an insightful and constructive presence on the Heinz board. He approached board and management relationships professionally and collegially. Nelson, in concert with other members of the Heinz board, made excellent strategic and operational recommendations and decisions which helped move Heinz forward.”
– Charles E. Bunch, Chairman and CEO, PPG Industries, Inc., and former Director of H.J. Heinz Company

I think that what Nelson is doing is trying to get things to be as good as possible at DuPont. I think they should put him on the board.”
– Jim Cramer, Host, CNBC’s Mad Money

Based on Mr. Peltz’s track record, he’s not a short-term guy. When he gets on a Board, they stay in the stock for an average of 5.6 years. He’s told me that he’s told the mutual funds that are already in the stock that [Trian] will likely be there longer than they will. His track record in names like...I can go down the list: Wendy’s, they’ve been in Wendy’s since ’05. There’s Pepsi, Kraft, Mondelez, Tiffany’s. These are not fly by night investments from a guy who shows up and then bails 10 minutes later. Doesn’t the track record speak for itself?”
– Scott Wapner, Host, CNBC’s Halftime Report
84
Appendix D: Additional
Performance Coatings
Information

Estimated Excess Corporate Costs:
The Coatings Case Study
Approach #1 - % of sales Approach #2 - % of EBITDA
There is a $229m difference between the 2011 Adjusted EBITDA reported by Axalta and DuPont, for its
Coatings business (same company, same year). We believe much of the difference is excess corporate
expense, which in our view, burdens all of DuPont’s businesses
Trian estimates excess corporate costs using two approaches:
Source: Axalta Coatings Systems Ltd. Form S-1 filed on 8/20/14, Trian estimates, and DuPont SEC Filings.
(1) Represents Axalta’s Adjusted Operating Income plus Depreciation & Amortization expense. Metric differs slightly from Axalta’s Adjusted EBITDA (as reported) as it excludes other expense (income) and dividend to
non-controlling interest to make EBITDA comparable.
(2) Coatings adjusted PTOI plus depreciation expense less an allocation of unallocated corporate costs and adds back non-cash items and certain pension expense in-line with Axalta’s current addbacks to make it
comparable. Assigns unallocated corporate expense at ~2% of sales (DuPont’s FY2011 unallocated corporate expense and other as % of FY2011 segment sales ) to make margins comparable.
(3) Coatings adjusted PTOI plus depreciation expense and adds back non-cash items and certain pension expense (in-line with Axalta’s current addbacks to make it comparable).
(4) 2014 DuPont EBITDA before Unallocated Corporate represents DuPont’s reported Adjusted Segment PTOI less Other PTOI plus segment depreciation for 2014.
(5) Unallocated corporate expenses plus Other adjusted PTOI minus 2014 unallocated corporate and other depreciation and amortization.
(1)
(2) (2)
(3)
(1)
(4)
(5)
85
At Axalta / Coatings
2011 Adj. EBITDA - Axalta $568
- 2011 Adj. EBITDA - DuPont, after Unallocated Corporate 339
Excess Allocated and Unallocated Corporate $229
Excess Allocated and Unallocated Corporate $229
÷ Coatings Segment Sales 4,281
= % of Segment Sales 5.3%
Extrapolation to DuPont
% of Segment Sales 5.3%
x 2014 DuPont Segment Sales 35,006
= Total Excess Corporate Costs $1,869
($ in millions) ($ in millions)
At Axalta / Coatings
2011 Adj. EBITDA - DuPont, before Unallocated Corporate $420
- Unallocated Corporate 80
= 2011 Adj. EBITDA - DuPont, after Unallocated Corporate $339
2011 Adjusted EBITDA - Axalta $568
- 2011 Adj. EBITDA - DuPont, before Unallocated Corporate 420
Excess Allocated Corporate $148
Excess Allocated Corporate $148
÷ 2011 Adj. EBITDA - DuPont, before Unallocated Corporate 420
= % of Segment EBITDA 35.4%
Extrapolation to DuPont
% of Segment EBITDA 35.4%
x 2014 DuPont EBITDA ex Unalloc Corporate $7,777
Excess Allocated Corporate $2,751
+ 2014 Unallocated Corp 907
= Total Excess Corporate Costs $3,658

Estimated Excess Corporate Costs:
DuPont’s Methodology
Approach #3 - % of Employees
DuPont asserts that Trian has used “faulty extrapolations”(1) to arrive at the estimated $2-$4bn of excess costs
DuPont might say that Trian’s methodology (Approach #1 and Approach #2) is flawed because
– i) DuPont allocates corporate costs by employee count, and
– ii) Coatings had an oversized number of employees, thereby inflating the allocated / excess corporate costs at the business
Regardless, by DuPont’s own methodology, there are $1.7bn of excess costs
(1) James Collins, Executive Vice President of DuPont at Bank of America Merrill Lynch US Basic Materials Conference (12/10/2014).
(2) See page 71 of Trian’s White Paper, which was filed with the SEC on February 17, 2015.
(3) Estimated number of employee at Coatings in 2011 as per Trian estimates and two independent Wall Street research analysts (Bank of America and JP Morgan). See i) “Initiate with
Buy; beneficiary of crude oil drop at a discount”, Bank of America initiating coverage report on Axalta, December 22, 2014, and ii) “New Owners: Initiate Coverage of AXTA with
Overweight Rating”, JP Morgan initiating coverage report on Axalta, December 22, 2014.
(4) DuPont 2011 Form 10-K.
(5) Incremental value estimated by multiplying Total Excess Corporate Costs on this page (and prior page) by the approximate last twelve months trading multiple for DuPont (9.8x).
Source: Bloomberg.
(3)
(2)
(4)
(2)
The elimination of just these
excess costs implies 26% to
55% of incremental
shareholder value(5)
86
(2)
($ in millions)
(2)
At Axalta / Coatings
2011 Adj. EBITDA - DuPont, before Unallocated Corporate $420
- Unallocated Corporate 80
= 2011 Adj. EBITDA - DuPont, after Unallocated Corporate $339
2011 Adjusted EBITDA - Axalta $568
- 2011 Adj. EBITDA - DuPont, before Unallocated Corporate 420
Excess Allocated Corporate $148
Axalta Employees 13,000
Total 2011 DuPont Employees 70,000
% of Employees 18.6%
Extrapolation to DuPont
Excess Allocated Corporate $148
÷ % of Employees 18.6%
Implied Excess Allocated Corp Costs $799
+ 2014 Unallocated Corp 907
= Total Excess Corporate Costs $1,706
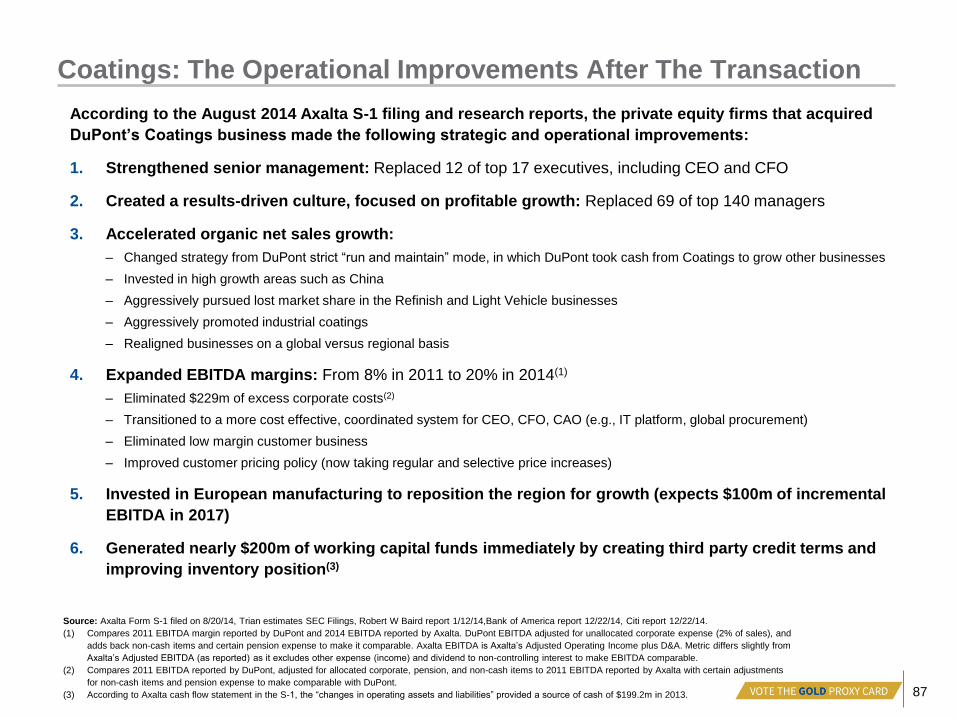
Coatings: The Operational Improvements After The Transaction
According to the August 2014 Axalta S-1 filing and research reports, the private equity firms that acquired
DuPont’s Coatings business made the following strategic and operational improvements:
1. Strengthened senior management: Replaced 12 of top 17 executives, including CEO and CFO
2. Created a results-driven culture, focused on profitable growth: Replaced 69 of top 140 managers
3. Accelerated organic net sales growth:
– Changed strategy from DuPont strict “run and maintain” mode, in which DuPont took cash from Coatings to grow other businesses
– Invested in high growth areas such as China
– Aggressively pursued lost market share in the Refinish and Light Vehicle businesses
– Aggressively promoted industrial coatings
– Realigned businesses on a global versus regional basis
4. Expanded EBITDA margins: From 8% in 2011 to 20% in 2014(1)
– Eliminated $229m of excess corporate costs(2)
– Transitioned to a more cost effective, coordinated system for CEO, CFO, CAO (e.g., IT platform, global procurement)
– Eliminated low margin customer business
– Improved customer pricing policy (now taking regular and selective price increases)
5. Invested in European manufacturing to reposition the region for growth (expects $100m of incremental
EBITDA in 2017)
6. Generated nearly $200m of working capital funds immediately by creating third party credit terms and
improving inventory position(3)
Source: Axalta Form S-1 filed on 8/20/14, Trian estimates SEC Filings, Robert W Baird report 1/12/14,Bank of America report 12/22/14, Citi report 12/22/14.
(1) Compares 2011 EBITDA margin reported by DuPont and 2014 EBITDA reported by Axalta. DuPont EBITDA adjusted for unallocated corporate expense (2% of sales), and
adds back non-cash items and certain pension expense to make it comparable. Axalta EBITDA is Axalta’s Adjusted Operating Income plus D&A. Metric differs slightly from
Axalta’s Adjusted EBITDA (as reported) as it excludes other expense (income) and dividend to non-controlling interest to make EBITDA comparable.
(2) Compares 2011 EBITDA reported by DuPont, adjusted for allocated corporate, pension, and non-cash items to 2011 EBITDA reported by Axalta with certain adjustments
for non-cash items and pension expense to make comparable with DuPont.
(3) According to Axalta cash flow statement in the S-1, the “changes in operating assets and liabilities” provided a source of cash of $199.2m in 2013.
87