trends of viral gastroenteritis in the australian … · web viewtrends of viral gastroenteritis in...
TRANSCRIPT

Trends of viral gastroenteritis in the Australian Capital TerritoryLaura Ford, Sam McEwen and Kathryn Glass
Abstract
Rotavirus, norovirus and adenovirus are common gastroenteritis viruses. To investigate trends of these viruses in the Australian Capital Territory, we analysed routine laboratory data and institutional outbreak data from 2003-2015. We found that after the introduction of rotavirus vaccination, there was a reduction in the proportion positivity in hospitalised cases and young children overall, but little change in cases referred by general practitioners. Proportion positivity of norovirus has been influenced by changes in testing methods and proportion positivity of adenovirus has decreased from the beginning of the study period, with peaks every few years. There were no trends identified in rotavirus, norovirus, and adenovirus outbreaks, but faecal testing during outbreaks has decreased over the study period. The results of this short report indicate that other interventions such as hygiene promotion and reinforced infection control could be targeted at young children, and testing of specimens in outbreaks should be a priority.
IntroductionViral gastroenteritis infections, mainly rotavirus, norovirus, and adenovirus, cause significant morbidity in Australia.1, 2 There were an estimated 1.68 million cases of illness due to these viruses in the Australian community circa 2010.1 Rotavirus, norovirus, and adenovirus are not notifiable in the Australian Capital Territory (ACT), unless as part of an outbreak in a health or care institution or reported as suspected food poisoning, making it difficult to analyse disease trends.
It is particularly important to analyse trends of rotavirus to examine the impact of vaccination. A vaccine for certain strains of rotavirus was first introduced into the National Immunisation Program in Australia for infants in July 2007. 3
Following the introduction of the vaccine, reductions in hospital admissions for rotavirus and all-cause gastroenteritis in infants less than 2 years were observed in Queensland, New South Wales, South Australia and the ACT.4-8
This report uses pathology testing and institutional outbreak data to examine whether there has been a change in the number of community infections and institutional outbreaks of rotavirus following vaccine introduction, and whether there have been changes in trends over time of rotavirus, norovirus, and adenovirus infection and outbreaks. The report aims to increase the understanding of the epidemiology of viral gastroenteritis in the ACT in order to inform the public health response.
MethodsTo examine trends of rotavirus, we used de-identified laboratory pathology results of rotavirus tests from 2 of 3 diagnostic laboratories that service the ACT. We obtained data from 2003-2015 from Provider A, who services the 2 public hospitals in the ACT and about 20% of ACT general practice (GP) pathology. We also used data from 2003-2012 from Provider B, with the majority of requests received by this provider coming from general practice. During the study period, immunochromographic tests (ICT) were used, with Provider A using several kits throughout the study period, but most recently the SD (Bioline) Rota/Adeno Rapid, and Provider B using the VIKIA Rota-Adeno kit throughout.
1 of 13 Commun Dis Intell 2018 42 Epub 45065// health.gov.au/cdi

Original Article Communicable Diseases Intelligence
We excluded rotavirus specimen tests where age or sex was missing (n=21; <1%). Duplicate test results for the same specimen were also excluded (n=30; <1%), except for a small proportion of people who submitted more than one specimen for testing on the same day (n=86 specimens; <1%), which were included. In these cases, results were the same for both specimens.
We used a Fisher’s exact test to examine differences in the proportion of rotavirus tests that were positive. We used negative binomial regression with the rotavirus testing data to estimate an incidence rate of positive rotavirus tests by sex and age group, and the trend over time by age group for the period immediately before the introduction of the vaccine to the end of the period where both laboratories were reporting data (2006-2012). The date of specimen collection was used to determine year of test. The total number of tests performed by the 2 providers by age group and sex was used as a denominator to standardise the positive rotavirus tests to the population tested. Age was categorised into 8 age groups: ≤6 months, 7-11 months, 1 year, 2 years, 3 years, 4 years, 5-64 years, 65 years or older. Analysis was performed using the ‘nbreg’ command in Stata SE statistical package 13 (StataCorp, College Station TX) and graphs were made using Microsoft Excel 2007.
To examine trends of norovirus and adenovirus, we used de-identified laboratory pathology results from 2009-2015 from Provider A. Provider A used the SD (Bioline) Rota/Adeno Rapid kit and the SD (Bioline) Norovirus ICT kit, until switching to a Cepheid GeneXpert polymerase chain reaction (PCR) test for norovirus in 2015. Prior to 2009, Provider A referred norovirus requests to another laboratory for testing. Similar to rotavirus, we excluded duplicate test results for the same specimen (n=5; <1% for norovirus and n=19; <1% for adenovirus), except for a small proportion of people who submitted more than one specimen for testing on the same day (n=2 specimens; <1% for norovirus and n=8 specimens; <1% for adenovirus). In these cases, results were the same for both specimens.
We used data from the ACT OzFoodNet outbreak register, which includes details of all notified gastroenteritis outbreaks in the ACT, to examine trends of outbreaks suspected to be due to person-to-person transmission of viral gastroenteritis pathogens in institutions from 2003-2015. Where faecal specimens were submitted in these outbreaks, testing was undertaken at 1 of the 3 diagnostic laboratories in the ACT (including Provider A and Provider B) using the methods described above. Ethics approval was granted by the ACT Health Human Research Ethics Committee [ETHLR.16.005].
Results and discussion
RotavirusRotavirus was detected in 13% of the 6,125 specimens tested for rotavirus by Provider A between 2003 and 2015, and 8% of the 5,317 specimens tested for rotavirus by Provider B between 2003 and 2012. There was a significant drop in the proportion of positive tests from hospitalised patients between 2003 and 2015 (p<0.001) (Figure 1), consistent with findings from the ACT, other Australian states, and internationally.4-9
2 of 13 Commun Dis Intell 2018 42 Epub 45065// health.gov.au/cdi

Original Article Communicable Diseases Intelligence
Figure 1 : Number of tested specimens and proportion of positive specimens for rotavirus at Provider A, from hospitalised patients and from general practice patients (2003-2015), and at Provider B from general practice patients (2003-2012), Australian Capital Territory. Note: The decrease in the number of tests from 2013-2015 is reflective of the fact that data was only available from one pathology provider for these years.
There was no significant difference in the proportion positive in GP patients referred to either Provider A from the same time period (p=0.53) or GP patients referred to Provider B from 2003-2012 (p=0.10) (Figure 1), indicating that while the introduction of the vaccine may have resulted in fewer hospitalisations, there was a limited effect on the proportion positivity of community GP cases. While Provider A used different ICT kits to test for Rotavirus throughout the period, any change in proportion positivity from kit changes would affect both GP and hospitalised cases equally. In addition, although data was only available from 2 of 3 diagnostic laboratories and changes in the use of providers may appear as trends in the number of tests, the role of the providers has not changed over time.
There was no significant difference in testing and detection between females and males in specimens from 2003-2012 (p=0.09). Fifty eight percent of specimens submitted and 81% of the positive specimens were from children aged 0-4 years.
Between 2006 and 2012, the rate of positivity significantly decreased for children aged 7-11 months and 1 year, and increased in adults aged 65 years and older (Figure 2). This is similar to what was reported in Queensland 7 ; however, the decreasing trend here remains up to 2012 for children aged 7-11 months and 1 year. In all other age groups, there was a decrease in the crude rate of rotavirus positivity in 2007 and 2008 compared to 2006, but there was no significant trend over time, suggesting the effect of the vaccine is greatest directly after children are immunised (Supplementary Table and Figures). The initial decrease in positivity rate in all age groups after the introduction of the vaccine may be related to reduced circulation following reduced infection in those receiving the
3 of 13 Commun Dis Intell 2018 42 Epub 45065// health.gov.au/cdi

Original Article Communicable Diseases Intelligence
vaccine. Time trends should be interpreted with caution and may reflect herd immunity, as well as direct effects of the vaccine.
Figure 2: Significant negative binomial regression margins plot of rotavirus positivity rates per 1000 tests by age group, 2006-2012, ACT
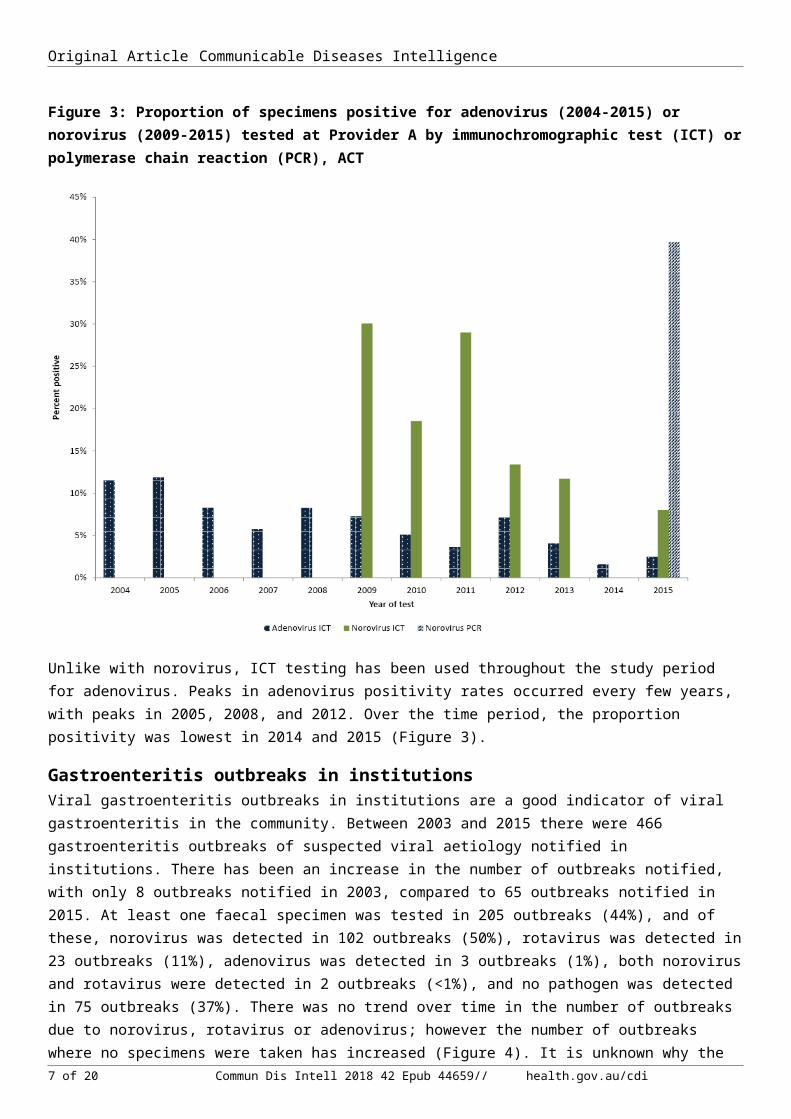
Norovirus and adenovirusNorovirus positivity rates have been impacted by the introduction of PCR. Provider A began testing for norovirus using ICT in 2009 and using PCR in 2015 on an average of 127 specimens per year (annual range 58-284). Norovirus had a declining rate of positivity over time using the ICT testing method, with norovirus detected in 30% and 8% of specimens in 2009 and 2015 respectively (Figure 3). This may be due to a true decrease in the incidence of norovirus, or to other unmeasured factors such as changes in health seeking behaviour or specimen submission. However, in 2015, the use of PCR resulted in the highest proportion positivity, with norovirus detected in 40% of specimens tested using PCR (Figure 3). This is likely due to the increased sensitivity of PCR testing compared to ICT.10
4 of 13 Commun Dis Intell 2018 42 Epub 45065// health.gov.au/cdi

Original Article Communicable Diseases Intelligence
Figure 3: Proportion of specimens positive for adenovirus (2004-2015) or norovirus (2009-2015) tested at Provider A by immunochromographic test (ICT) or polymerase chain reaction (PCR), ACT
Unlike with norovirus, ICT testing has been used throughout the study period for adenovirus. Peaks in adenovirus positivity rates occurred every few years, with peaks in 2005, 2008, and 2012. Over the time period, the proportion positivity was lowest in 2014 and 2015 (Figure 3).
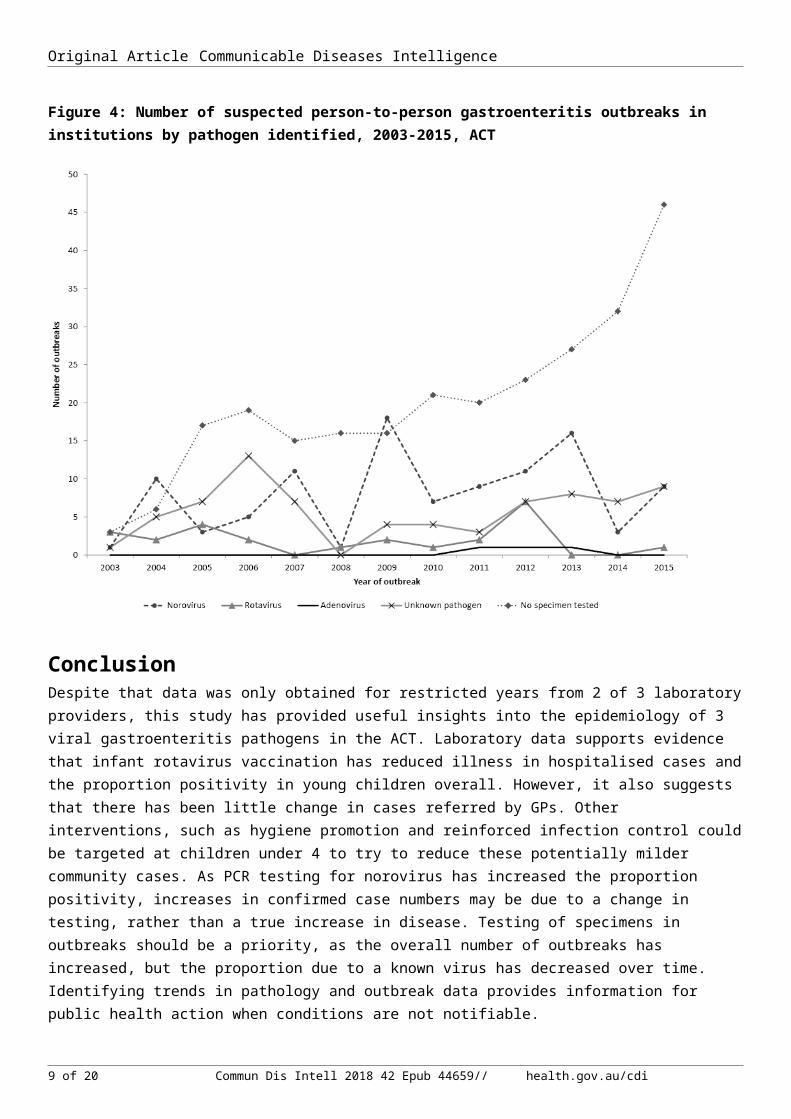
Gastroenteritis outbreaks in institutionsViral gastroenteritis outbreaks in institutions are a good indicator of viral gastroenteritis in the community. Between 2003 and 2015 there were 466 gastroenteritis outbreaks of suspected viral aetiology notified in institutions. There has been an increase in the number of outbreaks notified, with only 8 outbreaks notified in 2003, compared to 65 outbreaks notified in 2015. At least one faecal specimen was tested in 205 outbreaks (44%), and of these, norovirus was detected in 102 outbreaks (50%), rotavirus was detected in 23 outbreaks (11%), adenovirus was detected in 3 outbreaks (1%), both norovirus and rotavirus were detected in 2 outbreaks (<1%), and no pathogen was detected in 75 outbreaks (37%). There was no trend over time in the number of outbreaks due to norovirus, rotavirus or adenovirus; however the number of outbreaks where no specimens were taken has increased (Figure 4). It is unknown why the increase in outbreaks overall and the decrease in outbreaks where specimens are tested has occurred as there have been no changes in notification requirements, but increases may be affected by changes in health seeking behaviour, GP testing, or facilitation of specimen collection within the facility. The decrease in the number of outbreaks with testing suggests that public health action to encourage testing may be needed.
5 of 13 Commun Dis Intell 2018 42 Epub 45065// health.gov.au/cdi

Original Article Communicable Diseases Intelligence
Figure 4: Number of suspected person-to-person gastroenteritis outbreaks in institutions by pathogen identified, 2003-2015, ACT
ConclusionDespite that data was only obtained for restricted years from 2 of 3 laboratory providers, this study has provided useful insights into the epidemiology of 3 viral gastroenteritis pathogens in the ACT. Laboratory data supports evidence that infant rotavirus vaccination has reduced illness in hospitalised cases and the proportion positivity in young children overall. However, it also suggests that there has been little change in cases referred by GPs. Other interventions, such as hygiene promotion and reinforced infection control could be targeted at children under 4 to try to reduce these potentially milder community cases. As PCR testing for norovirus has increased the proportion positivity, increases in confirmed case numbers may be due to a change in testing, rather than a true increase in disease. Testing of specimens in outbreaks should be a priority, as the overall number of outbreaks has increased, but the proportion due to a known virus has decreased over time. Identifying trends in pathology and outbreak data provides information for public health action when conditions are not notifiable.
6 of 13 Commun Dis Intell 2018 42 Epub 45065// health.gov.au/cdi
Original Article Communicable Diseases Intelligence
Corresponding AuthorLaura Ford
National Centre for Epidemiology and Population Health
The Australian National University Acton ACT 2601
Phone: 02 6125 0681 Fax: 02 6125 0740 Email: [email protected]
Authors: Laura Ford 1, 2, Sam McEwen 1, 2, and Kathryn Glass 2
1. Communicable Disease Control, Health Protection Service, ACT Health2. National Centre for Epidemiology and Population Health, Research School of Population Health, Australian
National University
AcknowledgementsWe would like to thank the laboratory providers for performing the testing and supplying the data for adenovirus, norovirus and rotavirus.
We would also like to thank Ginny Sargent and Milica Stefanovic for their contributions.
This report was funded by an ACT Health Population Health Development Grant.
References
1. Kirk M, Ford L, Glass K, Hall G. Foodborne illness, Australia, circa 2000 and circa 2010. Emerg Infect Dis. 2014;20(11):1857-64.
2. Fletcher S, Van Hal S, Andresen D, McLaws ML, Stark D, Harkness J, et al. Gastrointestinal pathogen distribution in symptomatic children in Sydney, Australia. J Epidemiol Glob Health. 2013;3(1):11-21.
3. Immunise Australia Program: Rotavirus [Online]. 20 April 2015. Accessed on 28 November 2016. Available from http://www.immunise.health.gov.au/internet/immunise/publishing.nsf/Content/immunise-rotavirus.
4. Buttery JP, Lambert SB, Grimwood K, Nissen MD, Field EJ, Macartney KK, et al. Reduction in rotavirus-associated acute gastroenteritis following introduction of rotavirus vaccine into Australia’s National Childhood vaccine schedule. Pediatr Infect Dis J. 2011; 30(1 Suppl):S25-9.
5. Clarke MF, Davidson GP, Gold MS, Marshall HS. Direct and indirect impact on rotavirus positive and all-cause gastroenteritis hospitalisations in South Australian children following the introduction of rotavirus vaccination. Vaccine. 2011; 29(29-30):4663-7.
6. Macartney KK, Porwal M, Dalton D, Cripps T, Maldigri T, Isaacs D, et al. Decline in rotavirus hospitalisations following introduction of Australia’s national rotavirus immunisation programme. J Paediatr Child Health. 2011;47(5):266-70.
7. Lambert SB, Faux CE, Hall L, Birrell FA, Peterson KV, Selvey CE, et al. Early evidence for direct and indirect effects of the infant rotavirus vaccine program in Queensland. Med J Aust. 2009;191(3):157-60.
8. David RL, Kirk MD. Rotavirus gastroenteritis hospitalisations following introduction of vaccination, Canberra. Commun Dis Intell Q Rep. 2014; 38(1):E3-8.
9. Curns AT, Steiner CA, Barrett M, Hunter K, Wilson E, Parashar UD. Reduction in acute gastroenteritis hospitalizations among US children after introduction of rotavirus vaccine: analysis of hospital discharge data from 18 US states. J Infect Dis. 2010; 201(11): 1617-24.
10. Centre for Disease Control and Prevention. Norovirus: Diagnostic Methods [Online]. 1 February 2017. Accessed on 1 May 2017. Available from https://www.cdc.gov/norovirus/lab-testing/diagnostic.html.
7 of 13 Commun Dis Intell 2018 42 Epub 45065// health.gov.au/cdi

Original Article Communicable Diseases Intelligence
Supplementary Table 1: Incident rate ratios calculated using negative binomial regression of rotavirus testing results by age group, sex, and trend by age over time, 2006-2012
Incident rate ratio 95% Confidence intervals p-valueAge group (reference = ≤6 months)7-11 months 2.42 (1.33-4.39) <0.011 year 2.81 (1.59-4.95) <0.0012 years 2.38 (1.29-4.39) <0.013 years 1.85 (0.93-3.70) 0.084 years 1.31 (0.51-3.35) 0.575-64 years 0.70 (0.38-1.29) 0.25≥65 years 0.22 (0.07-0.66) <0.01Sex (reference = females)Males 0.94 (0.77-1.15) 0.54Trend by age over time (2003-2012)≤6 months 1.02 (0.91-1.16) 0.707-11 months 0.79 (0.69-0.91) 0.0011 year 0.83 (0.74-0.92) 0.0012 years 0.87 (0.75-1.01) 0.063 years 0.96 (0.80-1.14) 0.614 years 1.01 (0.79-1.29) 0.935-64 1.00 (0.89-1.11) 0.93≥65 years 1.26 (1.02-1.57) 0.03
Supplementary Figure 1: Crude rates of positivity (dots) and negative binomial regression margin plots (lines with 95% CI) of rotavirus detections in children ≤6 months of age, ACT, 2006-2012
Supplementary Figure 2: Crude rates of positivity (dots) and negative binomial regression margin plots (lines with 95% CI) of rotavirus detections in 7-11 month children, ACT, 2006-2012
8 of 13 Commun Dis Intell 2018 42 Epub 45065// health.gov.au/cdi
Original Article Communicable Diseases Intelligence
Supplementary Figure 3: Crude rates of positivity (dots) and negative binomial regression margin plots (lines with 95% CI) of rotavirus detections in 1 year old children, ACT, 2006-2012
9 of 13 Commun Dis Intell 2018 42 Epub 45065// health.gov.au/cdi

Original Article Communicable Diseases Intelligence
Supplementary Figure 4: Crude rates of positivity (dots) and negative binomial regression margin plots (lines with 95% CI) of rotavirus detections in 2 year old children, ACT, 2006-2012
Supplementary Figure 5: Crude rates of positivity (dots) and negative binomial regression margin plots (lines with 95% CI) of rotavirus detections in 3 year old children, ACT, 2006-2012
10 of 13 Commun Dis Intell 2018 42 Epub 45065// health.gov.au/cdi
Original Article Communicable Diseases Intelligence
Supplementary Figure 6: Crude rates of positivity (dots) and negative binomial regression margin plots (lines with 95% CI) of rotavirus detections in 4 year old children, ACT, 2006-2012
Supplementary Figure 7: Crude rates of positivity (dots) and negative binomial regression margin plots (lines with 95% CI) of rotavirus detections in people aged 5-64 years, ACT, 2006-2012
11 of 13 Commun Dis Intell 2018 42 Epub 45065// health.gov.au/cdi

Original Article Communicable Diseases Intelligence
Supplementary Figure 8: Crude rates of positivity (dots) and negative binomial regression margin plots (lines with 95% CI) of rotavirus detections in people aged 65 years and older, ACT, 2006-2012
12 of 13 Commun Dis Intell 2018 42 Epub 45065// health.gov.au/cdi

Original Article Communicable Diseases Intelligence
© Commonwealth of Australia 2018 - ISSN: 2209-6051 (Online)
This work is copyright. You may download, display, print and reproduce the whole or part of this work in unaltered form for your own personal use or, if you are part of an organisation, for internal use within your organisation, but only if you or your organisation do not use the reproduction for any commercial purpose and retain this copyright notice and all disclaimer notices as part of that reproduction. Apart from rights to use as permitted by the Copyright Act 1968 or allowed by this copyright notice, all other rights are reserved and you are not allowed to reproduce the whole or any part of this work in any way (electronic or otherwise) without first being given the specific written permission from the Commonwealth to do so. Requests and inquiries concerning reproduction and rights are to be sent to the Online, Services and External Relations Branch, Department of Health, GPO Box 9848, Canberra ACT 2601, or by email to [email protected]
Communicable Diseases Intelligence aims to disseminate information on the epidemiology and control of communicable diseases in Australia. Communicable Diseases Intelligence invites contributions dealing with any aspect of communicable disease epidemiology, surveillance or prevention and control in Australia. Submissions can be in the form of original articles, short reports, surveillance summaries, reviews or correspondence. Instructions for authors can be found in Commun Dis Intell 2016;40(1):E189–E193.
Communicable Diseases Intelligence contributes to the work of the Communicable Diseases Network Australia
http://www.health.gov.au/cdna
This journal is indexed by Index Medicus and Medline
Disclaimer: Opinions expressed in Communicable Diseases Intelligence are those of the authors and not necessarily those of the Australian Government Department of Health or the Communicable Diseases Network Australia. Data may be subject to revision.
Editor: Cindy TomsDeputy Editor: Phil WrightEditorial and Production Staff: Leroy Trapani, Kasra YousefiEditorial Advisory Board: Peter McIntyre (Chair), David Durrheim, Mark Ferson, John Kaldor, Martyn KirkWebsite: http://www.health.gov.au/cdi
Communicable Diseases Intelligence is produced by Health Protection Policy Branch, Office of Health Protection, Australian Government, Department of Health, GPO Box 9848, (MDP 6) CANBERRA ACT 2601;
Email: [email protected]
13 of 13 Commun Dis Intell 2018 42 Epub 45065// health.gov.au/cdi