trends in the state of computer science in u.s. k-12 schools · trends in the state of computer...
TRANSCRIPT
Trends in the State of Computer Science in U.S. K-12 Schools2016

2
Trends in the State of Computer Science in U.S. K-12 Schools2016
Table of Contents
Executive Summary 3
Introduction 5
Value of Computer Science in Schools 6
Opportunities to Learn Computer Science 9
Perceptions of Computer Science 14
Challenges and Opportunities forComputer Science in K-12 Schools 17
Conclusion 25
About Google 26
About Gallup 26
Appendix A: Methodology 27
Appendix B: Full Results 29
Suggested citation: Google Inc. & Gallup Inc. (2016). Trends in the State of Computer Science in U.S. K-12 Schools. Retrieved from http://goo.gl/j291E0
Additional reports from Google’s Computer Science Education Research are available at g.co/cseduresearch.

3Trends in the State of Computer Science in U.S. K-12 Schools
Executive Summary
This report presents findings from the second year of Gallup and Google’s multiyear, comprehensive research effort to better understand perceptions of CS and access to CS learning opportunities in K-12 schools in the U.S. More than 16,000 seventh- to 12th-grade students, parents of seventh- to 12th-grade students and K-12 teachers, principals and superintendents were surveyed for Year 2 of this study. This report focuses on changes from Year 1 on key K-12 indicators for opportunities to learn CS (including awareness of and access to CS), perceptions of CS, demand for CS, and challenges for CS in K-12 schools.
Key Points
» Students, parents, teachers and administrators continue to value CS learning in Year 2. More than nine in 10 parents feel that opportunities to learn CS are a good use of school resources.
• The vast majority of parents (84%) and majorities of teachers (71%), principals (66%) and superintendents (65%) say that offering CS is more important than or just as important as required courses like math, science, history and English. A majority of educators feel that students should be required to take CS in schools when it is available (60% of teachers, 62% of principals and 56% of superintendents say this).
» While support for CS learning continues to be strong, all students do not yet have access to CS learning opportunities in school classes. However, many get exposure to CS through school-sponsored clubs or activities and when CS is incorporated into other classes at school.
• More than three-fourths of K-12 principals (76%), including 88% of high school principals, say some form of CS learning opportunities is available to their students whether through classes or clubs. Six in 10 K-12 principals (60%) say their school offers at least one CS course. Schools with higher grade levels are more likely to offer CS, with 78% of high school principals in the U.S. saying their school offers a CS class.
» While CS learning opportunities are not universally accessible, they are increasing. Specifically, 40% of principals in Year 2 report having at least one CS class available in which students can learn computer programming or coding — up from 25% in Year 1.
• Principals at large schools (1,000 or more students), schools with higher grade levels (particularly high schools) and those in the Northeast and West are more likely to say their CS classes include programming and coding.
4Trends in the State of Computer Science in U.S. K-12 Schools
» Although the majority of parents value CS, few have approached school officials to specifically express support for CS in the classroom, and educators do not report that CS is a priority at their school/district, which may be hampering CS offerings.
• About three in 10 parents (28%) or teachers (30%) have specifically expressed support for CS education to school officials. While a majority of principals (56%) and superintendents (62%) have expressed at least some support for CS to their superiors, just one-third or fewer agree that CS is a top priority in their school or district. Principals at larger schools, private schools and high schools are more likely to agree that their school board is committed to offering CS and that their guidance counselors think it is important to offer it.
» Similar to Year 1, schools report a lack of qualified teachers and funds as key barriers to offering CS. Additionally, schools continue to report that they have too many other classes that support required testing for students, which may immobilize some schools from adding CS offerings, especially in lower grade levels.
• Sixty-three percent of K-12 principals and 74% of superintendents who do not have CS in their school or district say a reason they do not offer CS is the lack of teachers available at their school with the necessary skills to teach it. Additionally, at least half of principals and superintendents (50% and 55%, respectively) note that they must devote most of their time to other courses that are related to testing requirements.
• High school principals without CS classes are more likely to cite a lack of qualified teachers (22%) and lack of student demand (19%) as the main reason for not offering CS than they are to cite too many classes related to testing requirements (14%).
Students, parents and educators in the U.S. continue to place a high value on computer science (CS) education, often viewing CS as important for students’ future success. However, access to CS learning is still not universal in K-12 schools. Despite the lack of full accessibility, there are positive signs of growth, with more principals in Year 2 than in Year 1 saying their school offers a CS class with programming or coding. Additionally, a variety of CS concepts, including computational thinking (CT), are being incorporated into classes at many schools.
A companion report, Diversity Gaps in Computer Science: Exploring the Underrepresentation of Girls, Blacks and Hispanics, focuses on exposure to computer technology and access to CS learning opportunities across underrepresented groups. Its goal is to identify the structural and social barriers these groups face at home, in schools and in society that could influence their likelihood to enter the CS field.

5Trends in the State of Computer Science in U.S. K-12 Schools
Introduction
Current National Outlook of Computer Science Education
Computers, websites and the applications that enrich and help make our lives easier and more entertaining are ubiquitous today. According to Common Sense Census: Media Use by Tweens and Teens1, the average American teen (aged 13 to 18) spends more than six hours per day on computer media (including smartphones, computers, tablets or video games) while tweens (aged 8 to 12) spend more than three hours per day on these devices. According to the Bureau of Labor Statistics2, the number of people in the computer science (CS) industry who create and support these programs has grown 38% in the past decade and is expected to increase to keep up with increasing demand. Further, some cities (such as New York City and Chicago), as well as 28 states and Washington, D.C.3, now require CS offerings for high school students, while others are adding CS learning to their core standards. As use of computers and online technology continues to grow, many in fields traditionally not directly linked to CS now have need for more advanced computer and programming skills for their day-to-day job functions.
Offering early exposure and opportunities to learn CS will allow more students to learn foundational skills and consider future learning and careers in the computing fields. To shed light on these issues, Google commissioned Gallup to conduct a multiyear, comprehensive research effort to better understand these factors among students, parents and K-12 educators in the U.S.
The findings from the first year of the study are in two separate reports. Searching for Computer Science: Access and Barriers in U.S. K-12 Education examines student exposure to computer technology, demand for CS in schools, opportunities for students to learn CS and barriers to offering CS in schools. The second report, Images of Computer Science: Perceptions Among Students, Parents
1 Retrieved from https://www.commonsensemedia.org/research/the-common-sense-census-media-use-by-tweens-and-teens2 Retrieved from http://www.bls.gov/opub/mlr/2005/11/art5full.pdf; http://www.bls.gov/emp/ep_table_102.htm 3 Retrieved from https://code.org/action; http://www1.nyc.gov/office-of-the-mayor/education-vision-2015-computer-science.page; https://techcrunch.com/2016/02/24/computer-science-is-now-a-high-school-graduation-requirement-in-chicagos-public-school-district/
and Educators in the U.S., explores the confusion between CS activities and general computer literacy, perceptions of CS careers, stereotypes about who engages in CS and the demographic profiles of students who have learned CS.
This report re-examines the key areas identified in the first year of the study, including perceptions about the value of CS education as well as awareness of and access to CS offerings in schools, searching for directional changes in CS offerings. The focus is on identifying implications for school systems, policymakers and parents to help students become more involved in CS before college.
The companion report from the second year, Diversity Gaps in Computer Science: Exploring the Underrepresentation of Girls, Blacks and Hispanics, focuses on access to and participation in CS learning opportunities among girls and underrepresented racial and ethnic groups to identify the structural and social barriers these groups face at home, in schools and in society that could influence their likelihood to enter the CS field.
In Year 2 of the study, Gallup interviewed nationally representative samples of 1,672 seventh- to 12th-grade students, 1,677 parents of seventh- to 12th-grade students and 1,008 first- to 12th-grade teachers via telephone in December 2015 and January 2016. Gallup also surveyed nationally representative samples of 9,805 K-12 principals and 2,307 school district superintendents in the U.S. via the web. The data for all five samples were weighted to be representative of their respective groups, and all comparisons between Year 1 and Year 2 data reflect weighted, representative data. Gallup researchers tested all differences noted (as higher or lower than other groups) between samples and demographic subgroups for statistical significance and, in many cases, used models to ensure that the differences noted are still significant after controlling for other factors such as education and income.
See Appendix A for more details on the methodology and the sampling frames for each group. This report includes a selection of key findings from the second year of the expansive research project, including comparisons with the first year.
VALUE OF COMPUTER SCIENCE IN SCHOOLS

7Trends in the State of Computer Science in U.S. K-12 Schools
Large majorities in all groups continue to support offering computer science in schools and view its importance, on par with both elective and required courses. Majorities of school and district administrators, as well as teachers, say students should be required to take computer science in school when it is available.
High Value of CS Learning Continues In Year 2 Among Parents, Teachers and Administrators
The vast majority of parents (84%) and majorities of teachers (71%), principals (66%) and superintendents (65%) say that offering CS is more important than or just as important as required courses like math, science, history and English. About one-quarter of parents (24%) say CS is more important than these required core classes. These perceptions are similar to those found in Year 1 (see Figure 1).
To ensure a consistent understanding of what is meant by “computer science,” the following definition was given at the beginning of the survey: “For the purposes of this survey, computer science is the study of how computers are designed and how to write step-by-step instructions to get them to do what you want them to do. This often includes computer programming or coding as a tool to create things like software, apps, games, websites and electronics and managing large databases of information. For the purposes of this survey, computer science does NOT include using a computer to do everyday things, such as browsing the internet. Please keep this definition in mind.”
Figure 1.OFFERING OPPORTUNITIES TO LEARN COMPUTER SCIENCE IS MORE IMPORTANT, JUST AS IMPORTANT OR LESS IMPORTANT TO A STUDENT'S FUTURE SUCCESS THAN ...
YEAR 1
YEAR 2
REQUIRED COURSES LIKE MATH, SCIENCE, HISTORY AND ENGLISH OTHER ELECTIVE COURSES LIKE ART, MUSIC AND FOREIGN LANGUAGES
JUST AS IMPORTANT MORE IMPORTANT
PARENTS(n=1,677)
TEACHERS(n=1,008)
PRINCIPALS(n=9,776)
SUPERINTENDENTS(n=2,233)
15%
14%
16%
30%
69%
77%
73%
79%
65%
78%
80%
63%
10%
10%
12%
29% 92%
91%
90%
88%
95%
89%
91%
84%
YEAR 1
YEAR 2
6%
6%
8%
21%
56%
62%
67%
67%
64%
3%
4%
24%
62%
63%
60%
62%
3%
68%
75%
85%
65%
66%
71%
84%
PARENTS(n=1,686)
TEACHERS(n=1,013)
PRINCIPALS(n=8,879)
SUPERINTENDENTS(n=1,785)
PARENTS(n=1,677)
TEACHERS(n=1,008)
PRINCIPALS(n=9,776)
SUPERINTENDENTS(n=2,233)
PARENTS(n=1,686)
TEACHERS(n=1,013)
PRINCIPALS(n=8,879)
SUPERINTENDENTS(n=1,785)
8Trends in the State of Computer Science in U.S. K-12 Schools
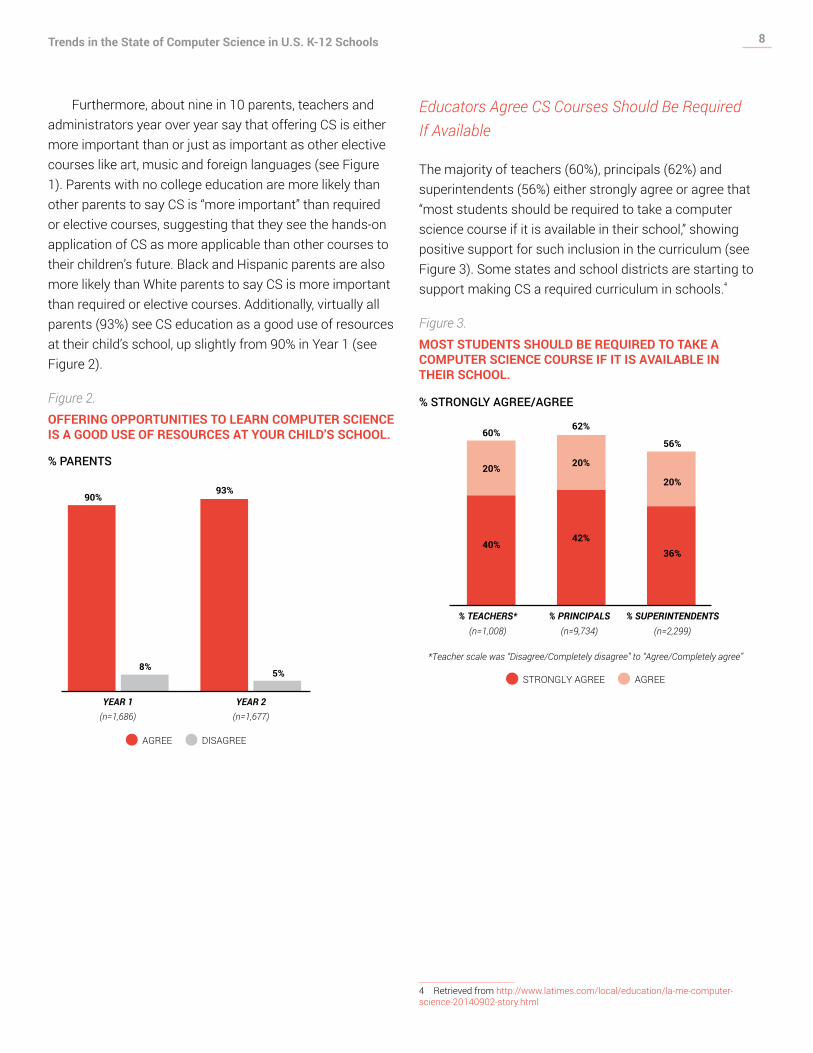
Furthermore, about nine in 10 parents, teachers and administrators year over year say that offering CS is either more important than or just as important as other elective courses like art, music and foreign languages (see Figure 1). Parents with no college education are more likely than other parents to say CS is “more important” than required or elective courses, suggesting that they see the hands-on application of CS as more applicable than other courses to their children’s future. Black and Hispanic parents are also more likely than White parents to say CS is more important than required or elective courses. Additionally, virtually all parents (93%) see CS education as a good use of resources at their child’s school, up slightly from 90% in Year 1 (see Figure 2).
Figure 2.OFFERING OPPORTUNITIES TO LEARN COMPUTER SCIENCE IS A GOOD USE OF RESOURCES AT YOUR CHILD’S SCHOOL.
% PARENTS
DISAGREEAGREE
YEAR 1(n=1,686)
YEAR 2(n=1,677)
93%90%
8%5%
Educators Agree CS Courses Should Be Required If Available
The majority of teachers (60%), principals (62%) and superintendents (56%) either strongly agree or agree that “most students should be required to take a computer science course if it is available in their school,” showing positive support for such inclusion in the curriculum (see Figure 3). Some states and school districts are starting to support making CS a required curriculum in schools.41
Figure 3.MOST STUDENTS SHOULD BE REQUIRED TO TAKE A COMPUTER SCIENCE COURSE IF IT IS AVAILABLE IN THEIR SCHOOL.
% STRONGLY AGREE/AGREE
*Teacher scale was “Disagree/Completely disagree” to “Agree/Completely agree”
AGREESTRONGLY AGREE
% SUPERINTENDENTS(n=2,299)
% PRINCIPALS(n=9,734)
62%
56%60%
% TEACHERS*(n=1,008)
20%
20%20%
36%42%
40%
4 Retrieved from http://www.latimes.com/local/education/la-me-computer-science-20140902-story.html

OPPORTUNITIES TO LEARN COMPUTER SCIENCE

10Trends in the State of Computer Science in U.S. K-12 Schools
While many parents, educators and administrators think computer science education is important, data show that many students still do not have opportunities to learn computer science in their school. Despite continued accessibility challenges, opportunities for students to learn computer programming or coding show an increase over last year.
Availability and Participation in CS Learning Opportunities
Overall, more than three-fourths of all K-12 principals (76%) report that their school offers some form of CS learning — through a course, school-sponsored club or after-school activity, or CS content included as part of another class. While almost two-thirds (65%) of elementary school principals say some type of CS learning opportunity is available to their students, the number increases to 88% among high school principals.
The percentage of seventh- to 12th-grade students who say they have learned any CS (such as using programming to create software, apps, games, websites or electronics) is relatively consistent from Year 1 (53%) to Year 2 (55%). The proportion of these students who say they learned CS in a class at school, however, increased from 73% in Year 1 to 80% in Year 2, suggesting that increased CS class offerings in schools is leading to increased participation (see Figure B1, Appendix B).
Figure 4.
% PRINCIPALS
YEAR 2 HIGHEST GRADE LEVEL
TOTAL (n=9,774)
5th and lower (n=2,783)
6th-8th (n=2,617)
9th and higher (n=2,105)
About how many different types of computer science courses are available in your school this year?
0 39% 58% 41% 22%
1-2 42% 35% 46% 43%
3-5 14% 4% 11% 27%
More than 5 4% 1% 2% 8%
At least 1 60% 40% 59% 78%
(n=9,750) (n=2,774) (n=2,616) (n=2,097)
Approximately how many school-sponsored clubs or after-school activities that expose students to computer science are available to students in your school?
0 45% 55% 42% 37%
1-2 48% 40% 52% 53%
3-5 6% 3% 5% 8%
More than 5 1% 1% 1% 2%
(n=9,713) (n=2,762) (n=2,606) (n=2,092)
As far as you know, is computer science taught as part of any other classes at your school?
Yes 39% 35% 40% 39%
No 58% 63% 58% 57%
Offer any computer science learning as course, part of other class or after-school club 76% 65% 80% 88%

11Trends in the State of Computer Science in U.S. K-12 Schools
The percentage of K-12 principals reporting that their school offers specific CS classes increased from 54% in Year 1 to 60% in Year 2 (see Figure 5). The reported availability and number of CS classes increases with grade level, with three-quarters of high school principals saying their school offers at least one type of CS class, compared with 41% of elementary school principals and 58% of middle school principals. More than one-third of high school principals say their school offers at least three different types of classes, compared with just 5% for elementary schools. Teachers report similar levels of CS offerings in their school by grade, providing validity for principal reporting (see Figure B28, Appendix B).
Figure 5.ABOUT HOW MANY DIFFERENT TYPES OF COMPUTER SCIENCE COURSES ARE AVAILABLE IN YOUR SCHOOL THIS YEAR?
% PRINCIPALS
YEAR 1 YEAR 2
(n=8,811) (n=9,774)
0 43% 39%
1-2 39% 42%
3-5 12% 14%
More than 5 3% 4%
At least 1 54% 60%
Principals whose schools offer CS courses also report an increase in opportunities to learn CS through informal (extracurricular) programs, widening opportunities for students. Nearly half of principals (47%) with at least one CS class at their school also report that CS content is taught as part of other classes, up from just over two in five (41%) in Year 1 (see Figure 6). About two-thirds of principals with a CS class (67%) also report that their school offers at least one school-sponsored club or after-school activity that exposes students to CS — an increase from 59% of principals in Year 1 who said the same.
Figure 6.AVAILABILITY OF COMPUTER SCIENCE CLASSES
% PRINCIPALS
YEAR 1 YEAR 2
(Among principals with at least one CS class) (n=4,700) (n=5,858)
As far as you know, is computer science taught as part of any other classes at your school? % Yes
41% 47%
Approximately how many school-sponsored clubs or after-school activities that expose students to computer science are available to students in your school? % 1 or more
59% 67%
Principals Report an Increase in Classes With Programming or Coding, as Well as Robotics and Artificial Intelligence (AI)
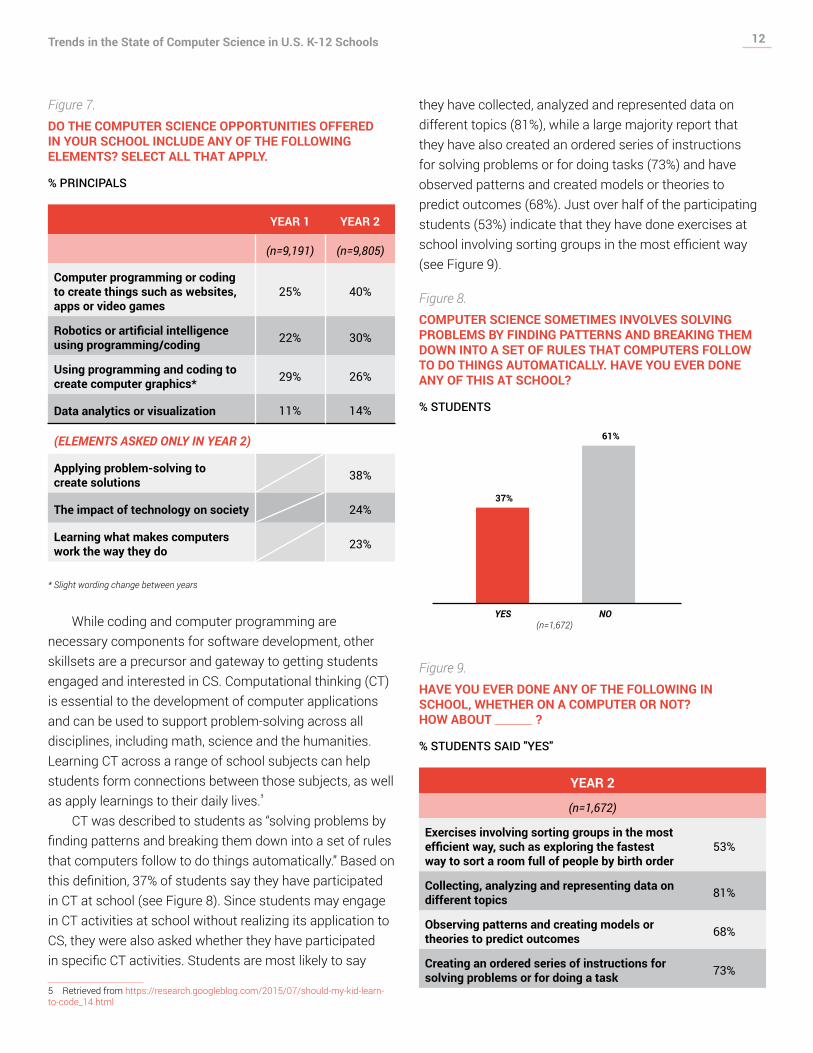
In addition to the increase in the percentage of principals who report that their school has any CS courses, the percentage saying CS classes include computer programming or coding has also increased in Year 2. Four in 10 principals in Year 2 (40%) report having at least one CS class available where students can learn computer programming or coding, compared with 25% in Year 1 (see Figure 7).
Principals at large schools (1,000 or more students), schools with higher grade levels (particularly high schools) and those in the Northeast and West are more likely to say their CS classes include programming and coding (see Figure B29, Appendix B).
Additionally, 30% of principals report that opportunities to learn robotics or artificial intelligence using programming or coding are available in their school, compared with 22% in Year 1. Sizable percentages of principals also report that their school’s CS offerings include other key elements such as applying problem-solving to create solutions (38%), the impact of technology on society (24%) and learning what makes computers work the way they do (23%) (see Figure 7).
12Trends in the State of Computer Science in U.S. K-12 Schools
Figure 7.DO THE COMPUTER SCIENCE OPPORTUNITIES OFFERED IN YOUR SCHOOL INCLUDE ANY OF THE FOLLOWING ELEMENTS? SELECT ALL THAT APPLY.
% PRINCIPALS
YEAR 1 YEAR 2
(n=9,191) (n=9,805)
Computer programming or coding to create things such as websites, apps or video games
25% 40%
Robotics or artificial intelligence using programming/coding 22% 30%
Using programming and coding to create computer graphics* 29% 26%
Data analytics or visualization 11% 14%
(ELEMENTS ASKED ONLY IN YEAR 2)
Applying problem-solving to create solutions 38%
The impact of technology on society 24%
Learning what makes computers work the way they do 23%
* Slight wording change between years
While coding and computer programming are necessary components for software development, other skillsets are a precursor and gateway to getting students engaged and interested in CS. Computational thinking (CT) is essential to the development of computer applications and can be used to support problem-solving across all disciplines, including math, science and the humanities. Learning CT across a range of school subjects can help students form connections between those subjects, as well as apply learnings to their daily lives.51
CT was described to students as “solving problems by finding patterns and breaking them down into a set of rules that computers follow to do things automatically.” Based on this definition, 37% of students say they have participated in CT at school (see Figure 8). Since students may engage in CT activities at school without realizing its application to CS, they were also asked whether they have participated in specific CT activities. Students are most likely to say
5 Retrieved from https://research.googleblog.com/2015/07/should-my-kid-learn-to-code_14.html
they have collected, analyzed and represented data on different topics (81%), while a large majority report that they have also created an ordered series of instructions for solving problems or for doing tasks (73%) and have observed patterns and created models or theories to predict outcomes (68%). Just over half of the participating students (53%) indicate that they have done exercises at school involving sorting groups in the most efficient way (see Figure 9).
Figure 8.COMPUTER SCIENCE SOMETIMES INVOLVES SOLVING PROBLEMS BY FINDING PATTERNS AND BREAKING THEM DOWN INTO A SET OF RULES THAT COMPUTERS FOLLOW TO DO THINGS AUTOMATICALLY. HAVE YOU EVER DONE ANY OF THIS AT SCHOOL?
% STUDENTS
YES NO(n=1,672)
61%
37%
Figure 9.HAVE YOU EVER DONE ANY OF THE FOLLOWING IN SCHOOL, WHETHER ON A COMPUTER OR NOT? HOW ABOUT ?
% STUDENTS SAID "YES"
YEAR 2
(n=1,672)
Exercises involving sorting groups in the most efficient way, such as exploring the fastest way to sort a room full of people by birth order
53%
Collecting, analyzing and representing data on different topics 81%
Observing patterns and creating models or theories to predict outcomes 68%
Creating an ordered series of instructions for solving problems or for doing a task 73%

13Trends in the State of Computer Science in U.S. K-12 Schools
More than two-thirds of teachers (68%) say they incorporate CT in some way in their classes (see Figure 10). The vast majority of teachers (86%) say they have taught activities involving creating an ordered series of instructions for solving problems or for doing tasks. Three-quarters (75%) say they have asked students to observe patterns and create models or theories to predict outcomes (a number slightly higher than what students report, 68%). Three in five teachers (60%) say they have taught exercises involving sorting groups in the most efficient way (see Figure 11).
Figure 10.COMPUTER SCIENCE SOMETIMES INVOLVES SOLVING PROBLEMS BY FINDING PATTERNS AND BREAKING THEM DOWN INTO A SET OF RULES THAT COMPUTERS FOLLOW TO DO THINGS AUTOMATICALLY. HAVE YOU EVER INCLUDED THIS TYPE OF LEARNING IN YOUR CLASSES, WHETHER USING A COMPUTER OR NOT?
% TEACHERS
YES NOYear 2
(n=1,008)
32%
68%
Figure 11.HAVE YOU EVER DONE ANY OF THE FOLLOWING IN YOUR CLASSES, WHETHER ON A COMPUTER OR NOT? HOW ABOUT ?
% TEACHERS SAID "YES"
YEAR 2
(n=1,008)
Exercises involving sorting groups in the most efficient way, such as exploring the fastest way to sort a room full of people by birth order
60%
Observing patterns and creating models or theories to predict outcomes 75%
Creating an ordered series of instructions for solving problems or for doing a task 86%
Awareness of CS Learning Offerings Is Not Ubiquitous, With Parents Even Less Likely Than Students to Be Aware of Such Opportunities
To increase CS learning, it is critical to broaden awareness of the offerings both inside and outside of school. Just over half of seventh- to 12th-grade students (55%) say they are aware of opportunities to learn CS in their communities, consistent with findings from Year 1 (see Figure 12). A majority of teachers (58%) but less than half of parents (43%) are aware of such opportunities (see Figure B22, Appendix B), and both may be able to help increase awareness among students. While parents may not be the primary way students learn about CS learning opportunities outside of school, increasing the awareness level of all parties can only help increase use among students.
In contrast to awareness of opportunities to learn CS in their community, more students (66%) and parents (54%) are aware of specific websites where students can learn CS online (see Figure B23, Appendix B). Regarding both community resources and specific websites, younger students are more likely than older students to be aware that those resources exist. These results may stem from the possibility that students in higher grades (because of time pressures from more advanced classes or greater access to CS classes in school) rely on in-school learning and are not as likely to seek outside opportunities. Another possibility is that many of the CS opportunities available outside of school are geared more toward a younger audience.
Figure 12.
% STUDENTS
YEAR 2 HIGHEST GRADE LEVEL
TOTAL (n=1,672)
7th or 8th (n=613)
9th or 10th (n=582)
11th or 12th (n=477)
Are there opportunities in your community for students like you to learn computer science outside of your school? % Yes
55% 60% 58% 47%
You are aware of specific websites where you could learn computer science on the internet. % Agree
66% 73% 61% 62%

PERCEPTIONS OF COMPUTER SCIENCE
15Trends in the State of Computer Science in U.S. K-12 Schools
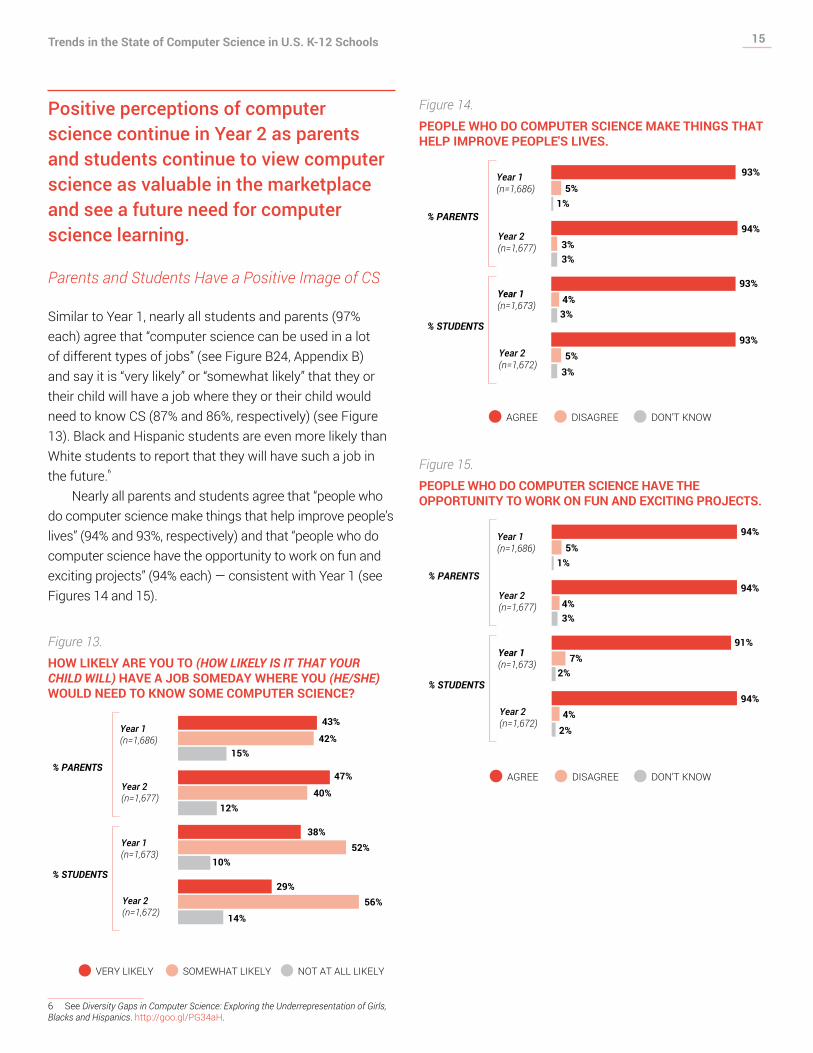
Positive perceptions of computer science continue in Year 2 as parents and students continue to view computer science as valuable in the marketplace and see a future need for computer science learning.
Parents and Students Have a Positive Image of CS
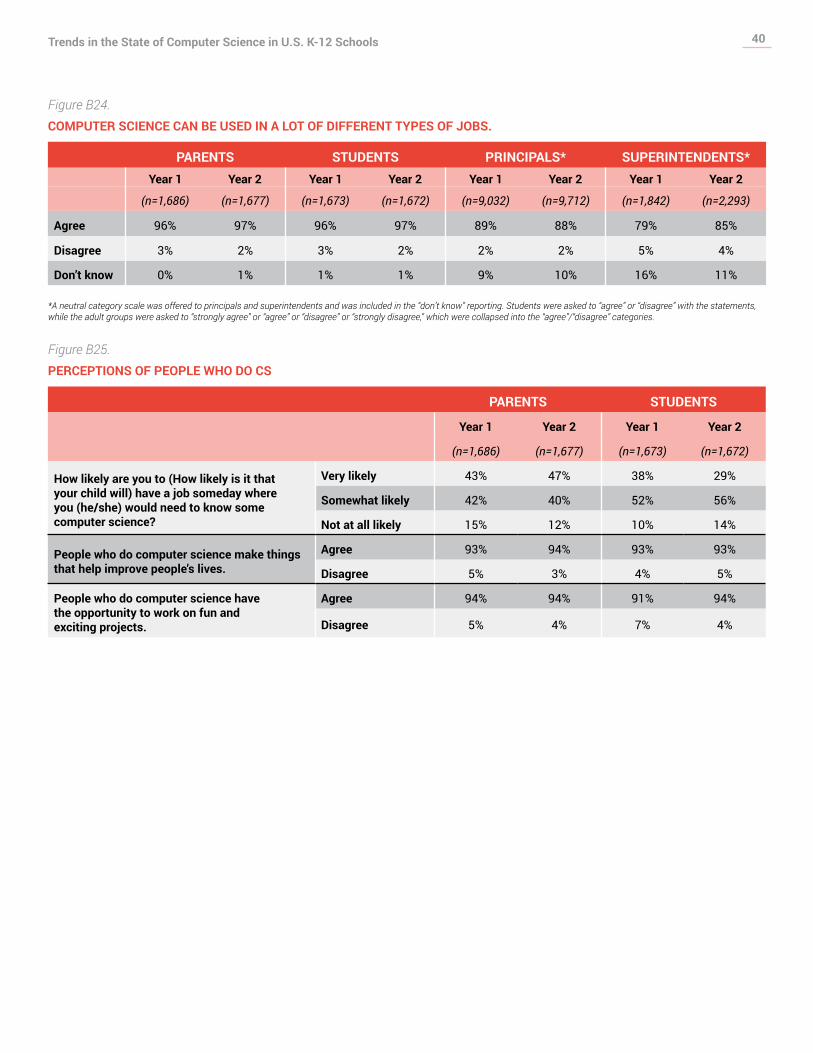
Similar to Year 1, nearly all students and parents (97% each) agree that “computer science can be used in a lot of different types of jobs” (see Figure B24, Appendix B) and say it is “very likely” or “somewhat likely” that they or their child will have a job where they or their child would need to know CS (87% and 86%, respectively) (see Figure 13). Black and Hispanic students are even more likely than White students to report that they will have such a job in the future.61
Nearly all parents and students agree that “people who do computer science make things that help improve people’s lives” (94% and 93%, respectively) and that “people who do computer science have the opportunity to work on fun and exciting projects” (94% each) — consistent with Year 1 (see Figures 14 and 15).
Figure 13.HOW LIKELY ARE YOU TO (HOW LIKELY IS IT THAT YOUR CHILD WILL) HAVE A JOB SOMEDAY WHERE YOU (HE/SHE) WOULD NEED TO KNOW SOME COMPUTER SCIENCE?
NOT AT ALL LIKELYSOMEWHAT LIKELYVERY LIKELY
43%
42%15%
12%
47%
40%
38%52%
10%
14%
29%56%
Year 1(n=1,686)
Year 2(n=1,677)
% PARENTS
% STUDENTS
Year 1(n=1,673)
Year 2(n=1,672)
6 See Diversity Gaps in Computer Science: Exploring the Underrepresentation of Girls, Blacks and Hispanics. http://goo.gl/PG34aH.
Figure 14.PEOPLE WHO DO COMPUTER SCIENCE MAKE THINGS THAT HELP IMPROVE PEOPLE'S LIVES.
DON’T KNOWDISAGREEAGREE
Year 1(n=1,686)
Year 2(n=1,677)
% PARENTS
% STUDENTS
Year 1(n=1,673)
Year 2(n=1,672)
93%
93%
93%
94%
5%1%
3%3%
4%3%
3%5%
Figure 15.PEOPLE WHO DO COMPUTER SCIENCE HAVE THE OPPORTUNITY TO WORK ON FUN AND EXCITING PROJECTS.
Year 1(n=1,686)
Year 2(n=1,677)
% PARENTS
% STUDENTS
Year 1(n=1,673)
Year 2(n=1,672)
94%
91%
94%
94%
5%1%
4%3%
7%2%
2%4%
DON’T KNOWDISAGREEAGREE
16Trends in the State of Computer Science in U.S. K-12 Schools
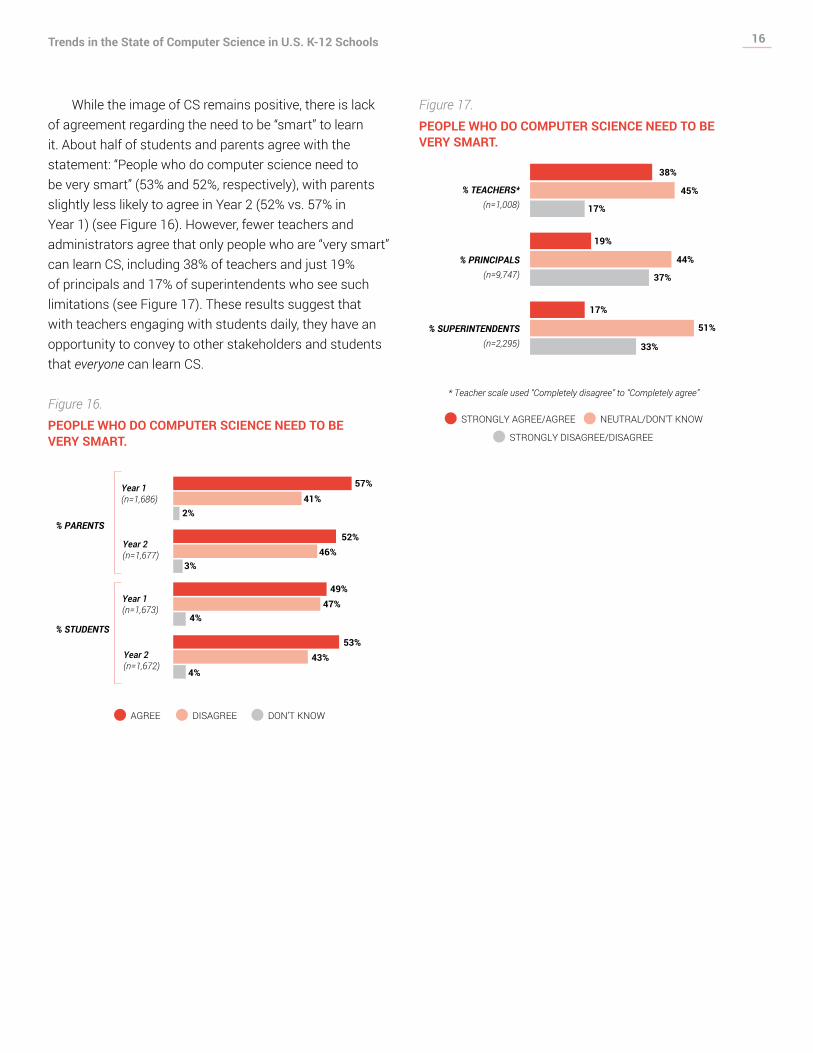
While the image of CS remains positive, there is lack of agreement regarding the need to be “smart” to learn it. About half of students and parents agree with the statement: “People who do computer science need to be very smart” (53% and 52%, respectively), with parents slightly less likely to agree in Year 2 (52% vs. 57% in Year 1) (see Figure 16). However, fewer teachers and administrators agree that only people who are “very smart” can learn CS, including 38% of teachers and just 19% of principals and 17% of superintendents who see such limitations (see Figure 17). These results suggest that with teachers engaging with students daily, they have an opportunity to convey to other stakeholders and students that everyone can learn CS.
Figure 16.PEOPLE WHO DO COMPUTER SCIENCE NEED TO BE VERY SMART.
DON’T KNOWDISAGREEAGREE
Year 1(n=1,686)
Year 2(n=1,677)
% PARENTS
% STUDENTS
Year 1(n=1,673)
Year 2(n=1,672)
57%
49%
53%
52%
41%2%
46%3%
47%4%
4%43%
Figure 17.PEOPLE WHO DO COMPUTER SCIENCE NEED TO BE VERY SMART.
51%
17%
33%
45%
38%
17%
19%
44%
37%
% SUPERINTENDENTS(n=2,295)
% PRINCIPALS(n=9,747)
% TEACHERS*(n=1,008)
* Teacher scale used “Completely disagree” to “Completely agree”
STRONGLY DISAGREE/DISAGREE
NEUTRAL/DON'T KNOWSTRONGLY AGREE/AGREE
CHALLENGES AND OPPORTUNITIES FOR COMPUTER SCIENCE IN K-12 SCHOOLS
18Trends in the State of Computer Science in U.S. K-12 Schools
While the image of computer science remains positive among all groups, there is a lack of vocalized support for computer science learning among parents and teachers. Further, while a majority of administrators say they express interest to their superiors, that support is not felt at higher levels. The lack of vocalized support to administrators for computer science learning may lead to diminished administrator perceptions.
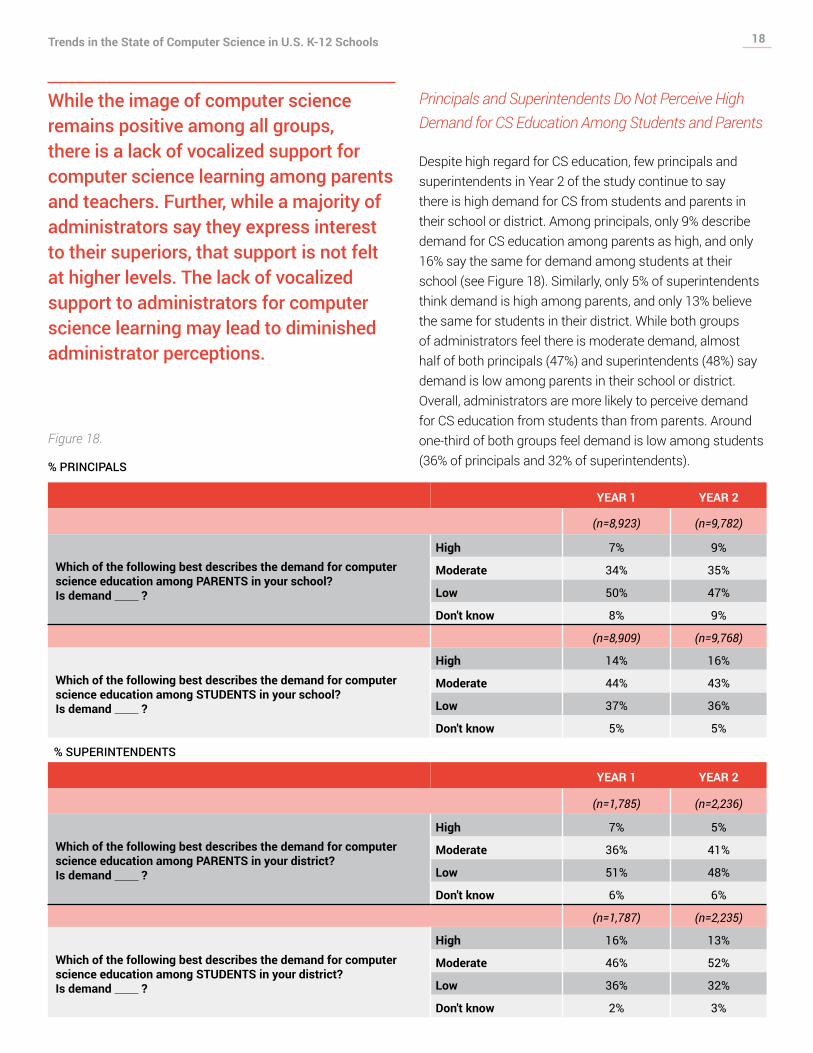
Principals and Superintendents Do Not Perceive High Demand for CS Education Among Students and Parents
Despite high regard for CS education, few principals and superintendents in Year 2 of the study continue to say there is high demand for CS from students and parents in their school or district. Among principals, only 9% describe demand for CS education among parents as high, and only 16% say the same for demand among students at their school (see Figure 18). Similarly, only 5% of superintendents think demand is high among parents, and only 13% believe the same for students in their district. While both groups of administrators feel there is moderate demand, almost half of both principals (47%) and superintendents (48%) say demand is low among parents in their school or district. Overall, administrators are more likely to perceive demand for CS education from students than from parents. Around one-third of both groups feel demand is low among students (36% of principals and 32% of superintendents).
Figure 18.
% PRINCIPALS
YEAR 1 YEAR 2
(n=8,923) (n=9,782)
Which of the following best describes the demand for computer science education among PARENTS in your school? Is demand ?
High 7% 9%
Moderate 34% 35%
Low 50% 47%
Don't know 8% 9%
(n=8,909) (n=9,768)
Which of the following best describes the demand for computer science education among STUDENTS in your school? Is demand ?
High 14% 16%
Moderate 44% 43%
Low 37% 36%
Don't know 5% 5%
% SUPERINTENDENTS
YEAR 1 YEAR 2
(n=1,785) (n=2,236)
Which of the following best describes the demand for computer science education among PARENTS in your district? Is demand ?
High 7% 5%
Moderate 36% 41%
Low 51% 48%
Don't know 6% 6%
(n=1,787) (n=2,235)
Which of the following best describes the demand for computer science education among STUDENTS in your district? Is demand ?
High 16% 13%
Moderate 46% 52%
Low 36% 32%
Don't know 2% 3%
19Trends in the State of Computer Science in U.S. K-12 Schools
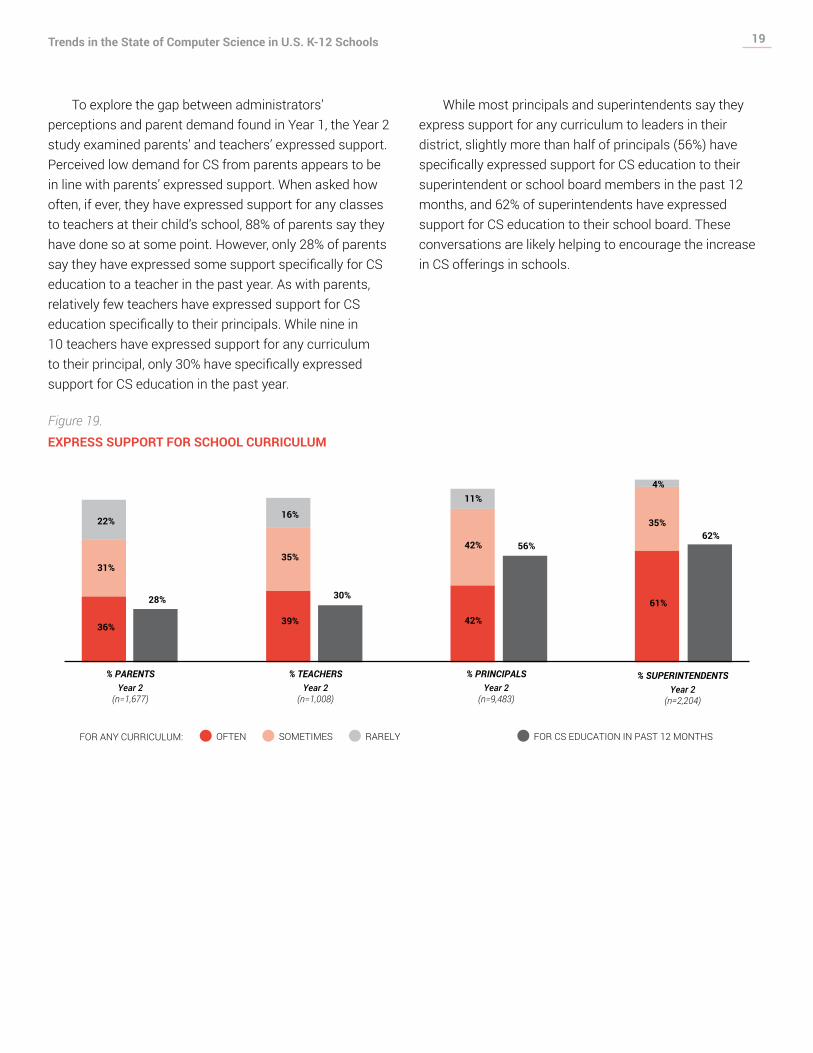
To explore the gap between administrators’ perceptions and parent demand found in Year 1, the Year 2 study examined parents’ and teachers’ expressed support. Perceived low demand for CS from parents appears to be in line with parents’ expressed support. When asked how often, if ever, they have expressed support for any classes to teachers at their child’s school, 88% of parents say they have done so at some point. However, only 28% of parents say they have expressed some support specifically for CS education to a teacher in the past year. As with parents, relatively few teachers have expressed support for CS education specifically to their principals. While nine in 10 teachers have expressed support for any curriculum to their principal, only 30% have specifically expressed support for CS education in the past year.
While most principals and superintendents say they express support for any curriculum to leaders in their district, slightly more than half of principals (56%) have specifically expressed support for CS education to their superintendent or school board members in the past 12 months, and 62% of superintendents have expressed support for CS education to their school board. These conversations are likely helping to encourage the increase in CS offerings in schools.
Figure 19.EXPRESS SUPPORT FOR SCHOOL CURRICULUM
RARELY FOR CS EDUCATION IN PAST 12 MONTHSSOMETIMESOFTEN
% TEACHERSYear 2
(n=1,008)
39%
35%
16%
30%
% PARENTSYear 2
(n=1,677)
36%
31%
22%
28%
FOR ANY CURRICULUM:
% SUPERINTENDENTSYear 2
(n=2,204)
61%
35%
4%
62%
% PRINCIPALSYear 2
(n=9,483)
42%
42%
11%
56%

20Trends in the State of Computer Science in U.S. K-12 Schools
Principals Perceive Mixed Support for and Commitment to CS Among Their Staff and School Board
While a majority of teachers believe that students should take a CS course if it is available in their school, principals do not necessarily perceive this sentiment among teachers. Rather, principals feel there is mixed support for CS in schools from teachers, as well as from school board members and guidance counselors. Only about four in 10 principals strongly agree or agree that the majority of teachers (41%) and counselors (40%) in their school feel it “is important to offer opportunities to learn computer science,” indicating a point of disconnect between teachers’ beliefs and perceptions of teachers’ beliefs among administrators (see Figure 20). Similarly, four in 10 principals (40%) agree that their school board is committed to offering CS in district schools. Just under half of superintendents (46%) agree that their school board is committed to offering CS in schools (see Figure 21).
Principals at schools with 1,000 or more students, private schools, high schools and suburban schools are more likely to agree that their school board is committed to offering CS, with about half of principals from these school types saying this. With the exception of suburban principals, these same principals also are more likely to say a majority of their guidance counselors believe that offering CS education is important (see Figure B15, Appendix B).
Because guidance counselors can influence which classes students choose to take, especially in high school, increasing counselors’ perceptions that CS is an important class to offer might increase student CS participation. Additionally, more principals might push for CS education in their schools if they were encouraged to seek input on the importance of and support for CS education among their constituencies, including parents, teachers and guidance counselors.
Additional communication efforts among parents, teachers, administrators and school boards may be a key leverage point in aligning expectations and application to provide and promote more CS learning in the classroom.
Figure 20.THE MAJORITY OF AT MY SCHOOL THINK IT IS IMPORTANT TO OFFER OPPORTUNITIES TO LEARN COMPUTER SCIENCE.
% PRINCIPALS
“TEACHERS” “GUIDANCE COUNSELORS”Year 2
(n=9,710)Year 2
(n=9,696)
36%41%
23%
40%43%
18%
STRONGLY DISAGREE/DISAGREE
NEUTRAL/DON'T KNOWSTRONGLY AGREE/AGREE
Figure 21.MY SCHOOL BOARD IS COMMITTED TO OFFERING COMPUTER SCIENCE IN OUR SCHOOLS.
34%
46%
21%
40% 37%
23%
% SUPERINTENDENTSYear 2
(n=2,293)
% PRINCIPALSYear 2
(n=9,743)
STRONGLY DISAGREE/DISAGREE
NEUTRAL/DON'T KNOWSTRONGLY AGREE/AGREE
21Trends in the State of Computer Science in U.S. K-12 Schools
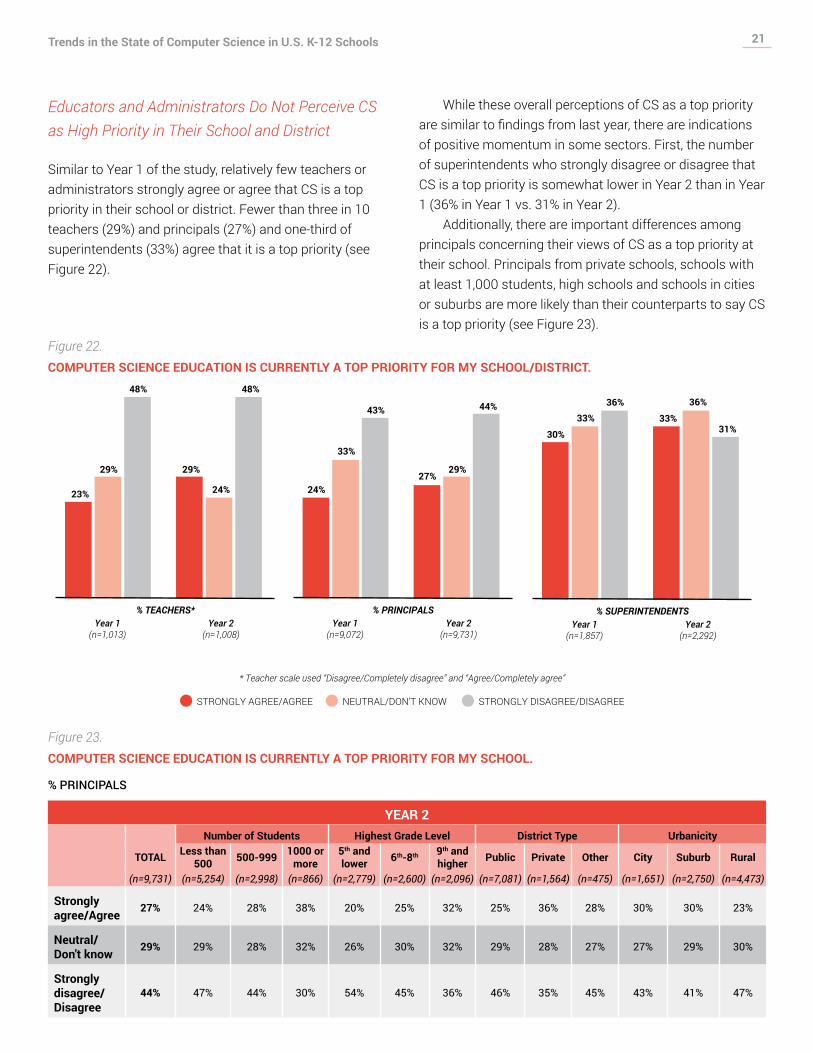
Educators and Administrators Do Not Perceive CS as High Priority in Their School and District
Similar to Year 1 of the study, relatively few teachers or administrators strongly agree or agree that CS is a top priority in their school or district. Fewer than three in 10 teachers (29%) and principals (27%) and one-third of superintendents (33%) agree that it is a top priority (see Figure 22).
While these overall perceptions of CS as a top priority are similar to findings from last year, there are indications of positive momentum in some sectors. First, the number of superintendents who strongly disagree or disagree that CS is a top priority is somewhat lower in Year 2 than in Year 1 (36% in Year 1 vs. 31% in Year 2).
Additionally, there are important differences among principals concerning their views of CS as a top priority at their school. Principals from private schools, schools with at least 1,000 students, high schools and schools in cities or suburbs are more likely than their counterparts to say CS is a top priority (see Figure 23).
Figure 22.COMPUTER SCIENCE EDUCATION IS CURRENTLY A TOP PRIORITY FOR MY SCHOOL/DISTRICT.
* Teacher scale used “Disagree/Completely disagree” and “Agree/Completely agree”
Year 1(n=1,857)
36%
30%
33%
Year 2(n=2,292)
31%33%
36%
% SUPERINTENDENTSYear 1
(n=9,072)
43%
24%
33%
Year 2(n=9,731)
44%
27%29%
% PRINCIPALSYear 1
(n=1,013)
48%
23%
29%
Year 2(n=1,008)
48%
29%
24%
% TEACHERS*
STRONGLY DISAGREE/DISAGREENEUTRAL/DON'T KNOWSTRONGLY AGREE/AGREE
Figure 23.COMPUTER SCIENCE EDUCATION IS CURRENTLY A TOP PRIORITY FOR MY SCHOOL.
% PRINCIPALS
YEAR 2Number of Students Highest Grade Level District Type Urbanicity
TOTAL Less than 500 500-999 1000 or
more5th and lower 6th-8th 9th and
higher Public Private Other City Suburb Rural
(n=9,731) (n=5,254) (n=2,998) (n=866) (n=2,779) (n=2,600) (n=2,096) (n=7,081) (n=1,564) (n=475) (n=1,651) (n=2,750) (n=4,473)
Strongly agree/Agree 27% 24% 28% 38% 20% 25% 32% 25% 36% 28% 30% 30% 23%
Neutral/Don't know 29% 29% 28% 32% 26% 30% 32% 29% 28% 27% 27% 29% 30%
Strongly disagree/Disagree
44% 47% 44% 30% 54% 45% 36% 46% 35% 45% 43% 41% 47%

22Trends in the State of Computer Science in U.S. K-12 Schools
Lack of teachers and funds, as well as competing priorities, are barriers to offering computer science.
Beyond a perceived lack of demand for CS education, school administrators face very real barriers to offering CS in schools. Consistent with barriers found in Year 1, almost two-thirds of principals (63%) and about three-quarters of superintendents (74%) who do not have CS in their school or district report that there are no teachers available in their school with the necessary skills to teach it (see Figure 24). This problem is especially prevalent in the West, with seven in 10 principals citing this as the reason their school does not offer CS (see Figure B16, Appendix B).
Also consistent with Year 1, a majority of principals and superintendents report that there is not enough money to train or hire a CS teacher (55% of principals and 57% of superintendents) and that they have to devote most educational time to courses related to testing requirements (50% of principals and 55% of superintendents) as reasons they do not offer CS.
High school principals (40%) and principals at schools with fewer than 500 students (48%) are much less likely than principals at lower-grade schools (58% in elementary schools and 55% in middle schools) or larger schools (58% in schools with 500 or more students) to indicate testing requirements as a reason for not offering CS (see Figure B26, Appendix B). In fact, high school principals are more likely to cite a lack of demand from students as a reason they do not offer CS, with over half of high school principals (52%) saying this compared with 38% of elementary school principals and 37% of middle school principals. The greater flexibility among students in higher grades for incorporation of electives and the greater number of overall courses taken each week may emphasize perceived lack of demand from students rather than the need for courses to meet testing requirements.
While there are a number of reasons to not offer CS classes, when asked about their main reason for not offering CS, the largest proportion of principals (30%) and superintendents (23%) at schools or districts that do not have CS report that they have to devote most of their time
to other courses that are related to testing requirements, and CS is not one of those courses (see Figure 25). Only half as many principals (15%) cite a lack of teachers with the necessary skills as the primary reason, even though it is the most frequently reported reason overall. This suggests that spending time on courses that fulfill standardized testing requirements may be the primary barrier to offering CS, rather than finding qualified teachers for some schools. High school principals, however, are less likely to report devoting time to testing required courses (14%) and more likely to note lack of student demand (19%) or lack of available teachers (22%) (see Figure B17, Appendix B).
Figure 24.AS FAR AS YOU KNOW, WHY DOESN’T YOUR DISTRICT OFFER ANY WAYS TO LEARN COMPUTER SCIENCE? SELECT ALL THAT APPLY. (ASKED ONLY OF THOSE WITHOUT ANY CS)
% PRINCIPALS
YEAR 1 YEAR 2
(n=3,912) (n=2,225)
There are no teachers available at my school with the necessary skills to teach computer science.
42% 63%
There is not enough money to train or hire a teacher. 44% 55%
We have to devote most of our time to other courses that are related to testing requirements, and computer science is not one of them.
47% 50%
% SUPERINTENDENTS
YEAR 1 YEAR 2
(n=289) (n=313)
There are no teachers available in my district with the necessary skills to teach computer science.
71% 74%
There is not enough money to train or hire a teacher. 55% 57%
We have to devote most of our time to other courses that are related to testing requirements, and computer science is not one of them.
52% 55%

23Trends in the State of Computer Science in U.S. K-12 Schools
Figure 25.MAIN REASON YOUR DISTRICT DOES NOT OFFER WAYS TO LEARN COMPUTER SCIENCE (ASKED ONLY OF THOSE WHO DO NOT HAVE COMPUTER SCIENCE IN THEIR DISTRICT)
YEAR 2 PRINCIPALS SUPERINTENDENTS
(n=2,217) (n=310)
We have to devote most of our time to other courses that are related to testing requirements, and computer science is not one of them. 30% 23%
There are no teachers available in my district with the necessary skills to teach computer science. 15% 19%
There is not enough money to train or hire a teacher. 14% 13%
There is not enough demand from students. 6% 13%
There are too many other courses that students have to take in order to prepare for college. 8% 7%
There is not enough demand from parents. 6% 4%
There are no teachers available to hire with the necessary skills to teach computer science. 1% 9%
Don't know 7% 3%
We do not have sufficient budget to purchase the necessary computer equipment. 5% 4%
We do not have sufficient budget to purchase the necessary computer software. 2% 2%
We do not have the necessary computer equipment. 2% 1%
Internet connectivity is poor in my district. 1% 1%
There is not enough classroom space. 1% 0%
We do not have the necessary computer software. 1% 0%

24Trends in the State of Computer Science in U.S. K-12 Schools
Incorporating computer science into other classes and supporting teachers' willingness to learn about computer science are ways to broaden learning opportunities.
More than seven in 10 principals (73%) and superintendents (71%) either strongly agree or agree that it is a good idea to try to incorporate CS education into other subjects at school (see Figure 26). Given competing priorities with other classes in the curriculum and scheduling, incorporating CS education into other subjects is one way for schools to ensure that students receive some basic CS learning.
Figure 26.IT IS A GOOD IDEA TO TRY TO INCORPORATE COMPUTER SCIENCE EDUCATION INTO OTHER SUBJECTS AT SCHOOL.
% SUPERINTENDENTSYear 2
(n=2,290)
21%
71%
8%
% PRINCIPALSYear 2
(n=9,732)
73%
20%
8%
STRONGLY DISAGREE/DISAGREE
NEUTRAL/DON'T KNOWSTRONGLY AGREE/AGREE
Further, since many teachers highly value CS education but feel it is not a top priority for their school, some may seek alternative ways to incorporate it into other classes. Among teachers who have never taught CS, 29% say they have incorporated CS learning into their teaching (see Figure 27).
About three in five teachers also indicate that they know where they can go to find information about incorporating CS into their classroom (62%) and are willing to spend time outside of school hours to learn more about it (58%).
Teachers with 21 or more years of experience (72%) are more likely than teachers with less experience (58%) to say they know where to find information about incorporating CS into their classrooms, but are less likely to want to spend their time outside of school learning more about it (47% for teachers with 21 or more years of experience, 59% for 11-20 years and 65% for 10 or less years) (see Figure B27, Appendix B). Because finding qualified teachers is one of the most common barriers to offering CS in schools, encouraging teachers to pursue alternative methods of incorporating CS into their classroom and making resources more accessible to teachers could help increase CS participation. As a majority of teachers are willing to spend their own time learning CS, and many know where to find information on CS education, it is important to find ways to help support teachers in these efforts, especially in schools and districts where official CS classes are not yet available.
Figure 27.OPPORTUNITIES FOR COMPUTER SCIENCE AMONG TEACHERS (ASKED ONLY OF THOSE WHO HAVE NEVER TAUGHT CS)
% TEACHERS SAID "YES"
YEAR 2
(n=818)
Have you ever incorporated any computer science learning into your classroom teaching? 29%
Do you know where you can go to find information about incorporating computer science into your classroom?
62%
Would you be willing to spend some of your own time outside of school to learn more about computer science?
58%

25Trends in the State of Computer Science in U.S. K-12 Schools
Conclusion
Schools appear to be making progress in offering CS opportunities for students, with an increase in the proportion of principals saying their school offers CS opportunities, including key concepts such as coding and programming.
However, while there is a positive increase in CS offerings and availability in the nation’s schools, access is still far from universal, with just over half of seventh- to 12th-grade students reporting that their school has CS-specific classes and 55% saying they have learned CS skills.
While increasing CS offerings can help, encouraging participation in CS learning, supporting pathways and belonging for all students, and increasing awareness of opportunities either in the community or online to expand CS education will also likely boost student CS exposure. The Diversity Gaps in Computer Science: Exploring the Underrepresentation of Girls, Blacks and Hispanics report found that students who were encouraged by teachers or parents were more likely to be interested in learning CS. Fewer than one in 20 students see someone they identify with “doing computer science” in the media. Currently, just over half of students are aware of community-based opportunities, and two-thirds are aware of specific websites where they can learn CS. However, with many available opportunities from private and public organizations, all students should at least be aware of CS opportunities, and they need more support in those opportunities. Increasing parents’ awareness of informal education opportunities may improve students’ awareness.
While teachers, principals and superintendents all see CS as valuable to students in schools, principals and superintendents do not necessarily perceive demand from parents and students. In Year 2, we found that few parents expressed specific support for CS to school officials. Despite some teachers having expressed support for CS courses to their principal, and principals and superintendents having expressed support higher up, overall demand and prioritization for more CS at higher levels in the education hierarchy is lacking and clearly would be one mechanism for increasing CS offerings in schools. Vocalized interest for CS learning opportunities from parents and teachers can help push CS offerings,
particularly in high schools where a greater proportion of principals cite lack of demand or lack of qualified teachers as the main reason for not offering CS courses. While some schools, districts and even states are now requiring CS at the high school level and below, stronger communication from parents and educators to their school leaders could contribute to greater learning opportunities.
Schools continue to face barriers to increasing CS offerings, including a lack of skilled teachers, a lack of money to hire and train teachers and the reported primary barrier of competition with other classes required for standardized testing. Increasing awareness and strengthening the quality of available training opportunities for teachers from support groups can potentially make school administrators more comfortable with training teachers without breaking budgets. Additionally, identifying opportunities to attract and retain teachers and exploring new opportunities to fill learning gaps for students through incorporation of CS into other subjects, online classes and after-school programs can introduce CS learning opportunities in schools where none are currently available.

26Trends in the State of Computer Science in U.S. K-12 Schools
About Google
Google’s core mission is to organize the world’s information and make it universally accessible and useful. Google creates products to increase access to opportunity, break down barriers and empower people through technology. To help reach these goals, Google works to inspire young people around the world not just to use technology but to create it. There is a need for more students to pursue an education in computer science, particularly girls and minorities, who have historically been underrepresented in the field. More information on Google’s computer science education efforts is available at g.co/csedu.
About Gallup
Gallup delivers analytics and advice to help leaders and organizations solve their most pressing problems. Combining more than 80 years of experience with its global reach, Gallup knows more about the attitudes and behaviors of employees, customers, students and citizens than any other organization in the world. Gallup works with leaders and organizations to achieve breakthroughs in customer engagement, employee engagement, organizational culture and identity, leadership development, talent-based assessments, entrepreneurship and well-being. Gallup’s 2,000 professionals include noted scientists, renowned subject-matter experts and bestselling authors who work in a range of industries, including banking, finance, healthcare, consumer goods, automotive, real estate, hospitality, education, government and business-to-business. For more information, visit www.gallup.com or education.gallup.com.

27Trends in the State of Computer Science in U.S. K-12 Schools
Appendix A: Methodology
Results for the Trends in the State of Computer Science in U.S. K-12 Schools report are based on surveys conducted with students, parents, teachers, principals and superintendents in the U.S.
Telephone interviews were conducted with students, parents and teachers currently living in all 50 states and the District of Columbia, based on samples drawn using the nationally representative Gallup Daily tracking recontact sample. Each night, Gallup completes 1,000 nationally representative interviews of adults aged 18 and older, living in all 50 states and the District of Columbia. Daily tracking interviews are conducted with respondents on landlines and cellphones, with interviews conducted in Spanish for respondents who are primarily Spanish-speaking. At the end of each interview, respondents are asked if they would be willing to be recontacted to participate in a future Gallup survey. Approximately 80% of respondents agree to be recontacted for a future survey.
Eligible Gallup Daily tracking survey respondents who previously agreed to future contact were contacted to participate in this study. Individuals who previously answered that they are teachers were assigned to the teacher sample. For the student survey, a parent was first recontacted from the Gallup Daily tracking sample and permission was granted before speaking to the student.
Student and parent interviews were conducted in English and Spanish. Teacher interviews were conducted in English only.
Student interviews were conducted Dec. 7, 2015-Jan. 17, 2016, with a sample of 1,672 students in grades seven to 12.
Parent interviews were conducted Dec. 7, 2015-Jan. 14, 2016, with a sample of 1,677 parents with at least one child in grades seven to 12.
Teacher interviews were conducted Dec. 3, 2015-Jan. 13, 2016, with a sample of 1,008 first- to 12th-grade teachers.
Student and parent samples are weighted to correct
for unequal selection probability and nonresponse. Student data are weighted to match national demographics of age, gender, race, ethnicity and region. Parent data are weighted to match national demographics of age, gender, education, race, ethnicity and region. Demographic weighting targets are based on the most recent Current Population Survey.
Teacher samples are weighted to correct for unequal selection probability and nonresponse. The data are weighted to match national demographics of age, gender, education, race, ethnicity and region. Demographic weighting targets are based on Gallup Daily tracking information.
All reported margins of sampling error include the computed design effects for weighting.
For results based on the total sample of students, the margin of sampling error is ±3.4 percentage points at the 95% confidence level. The design effect is ±2.1 percentage points.
For results based on the total sample of parents, the margin of sampling error is ±3.4 percentage points at the 95% confidence level. The design effect is ±2.0 percentage points.
For results based on the total sample of teachers, the margin of sampling error is ±3.9 percentage points at the 95% confidence level. The design effect is ±1.6 percentage points.
Web surveys were completed by principals and superintendents contacted using a sample provided by established education sample providers. The sample sources are representative of all principals and superintendents currently in the U.S. Interviews were conducted in English only.
Results for principals and superintendents in Year 1 were not weighted when Year 1 reports were written. Those data are now weighted for comparison with weighted Year 2 data.
Principal surveys were completed Jan. 5-Jan. 26, 2016, with a sample of 9,805 principals at the elementary, middle and high school levels.
Principal data are weighted to match national demographics of school ZIP code, school enrollment size and census region.
Superintendent surveys were conducted Jan. 5- Jan. 26, 2016, with a sample of 2,307 school district superintendents.

28Trends in the State of Computer Science in U.S. K-12 Schools
Superintendent data are weighted to match national demographics of school urbanicity, school enrollment size and census region.
All reported margins of sampling error include the computed design effects for weighting.
For results based on the total sample of principals, the margin of sampling error is ±1.0 percentage point at the 95% confidence level.
For results based on the total sample of superintendents, the margin of sampling error is ±2.7 percentage points at the 95% confidence level.
In addition to sampling error, question wording and practical difficulties in conducting surveys can introduce error or bias into the findings of public opinion polls. It should also be noted that differences between telephone respondents and web respondents are not perfectly comparable because of modal differences and the representativeness of the samples.
All Hispanic students are categorized as Hispanic in this report. Non-Hispanic Black students and non-Hispanic White students are categorized as Black and White, respectively.
The following states make up the Census regions reported as “Regions” in this report:
Region 1: Northeast • Connecticut, Maine, Massachusetts, New
Hampshire, Rhode Island, Vermont, New Jersey, New York and Pennsylvania
Region 2: Midwest • Illinois, Indiana, Michigan, Ohio, Wisconsin, Iowa,
Kansas, Minnesota, Missouri, Nebraska, North Dakota and South Dakota
Region 3: South • Delaware, Florida, Georgia, Maryland, North
Carolina, South Carolina, Virginia, Washington, D.C., West Virginia, Alabama, Kentucky, Mississippi, Tennessee, Arkansas, Louisiana, Oklahoma and Texas
Region 4: West • Arizona, Colorado, Idaho, Montana, Nevada, New
Mexico, Utah, Wyoming, Alaska, California, Hawaii, Oregon and Washington
Some data in tables in this report may not total 100% due to rounding or the non-inclusion of “don’t know” or “refused” responses to aid in simplifying the report. Full data tables are available upon request.

29Trends in the State of Computer Science in U.S. K-12 Schools
Appendix B: Full Results
Computer Science Learning
Figure B1.DO THE COMPUTER SCIENCE OPPORTUNITIES OFFERED IN YOUR SCHOOL INCLUDE ANY OF THE FOLLOWING ELEMENTS? (ASKED ONLY OF THOSE WITH AT LEAST ONE CS CLASS — REBASED TO ALL PRINCIPALS)
% PRINCIPALS
YEAR 1 YEAR 2
(n=9,191) (n=9,805)
Don't know 3% 4%
Computer programming or coding to create things such as websites, apps or video games 25% 40%
Applying problem-solving to create solutions 38%
Learning what makes computers work the way they do 23%
The impact of technology on society 24%
Data analytics or visualization 11% 14%
Robotics or artificial intelligence using programming/coding 22% 30%
Using programming and coding to create computer graphics 29% 26%
Figure B2.OFFERING OPPORTUNITIES TO LEARN COMPUTER SCIENCE IS MORE IMPORTANT, JUST AS IMPORTANT OR LESS IMPORTANT TO A STUDENT’S FUTURE SUCCESS THAN …
SUPERINTENDENTS PRINCIPALS TEACHERS PARENTS
Year 1 (n=1,785)
Year 2 (n=2,233)
Year 1 (n=8,879)
Year 2(n=9,776)
Year 1(n=1,013)
Year 2(n=1,008)
Year 1(n=1,686)
Year 2(n=1,677)
Required courses like math, science, history and English
More important 6% 3% 6% 3% 8% 4% 21% 24%
Just as important 56% 62% 62% 63% 67% 67% 64% 60%
Less important 35% 32% 29% 31% 25% 28% 15% 16%
Other elective courses like art, music and foreign languages
More important 15% 10% 14% 10% 16% 12% 30% 29%
Just as important 69% 78% 77% 80% 73% 79% 65% 63%
Less important 13% 9% 8% 8% 11% 9% 6% 8%
30Trends in the State of Computer Science in U.S. K-12 Schools
Figure B3.MOST STUDENTS SHOULD BE REQUIRED TO TAKE A COMPUTER SCIENCE COURSE IF IT IS AVAILABLE IN THEIR SCHOOL.
YEAR 2 SUPERINTENDENTS PRINCIPALS TEACHERS
(n=2,299) (n=9,734) (n=1,008)
Strongly disagree/Disagree 18% 15% 18%
Neutral/Don't know 26% 23% 22%
Strongly agree/Agree 56% 62% 60%
Figure B4.OFFERING OPPORTUNITIES TO LEARN COMPUTER SCIENCE IS A GOOD USE OF RESOURCES AT YOUR CHILD’S SCHOOL.
% PARENTS
YEAR 1 YEAR 2
(n=1,686) (n=1,677)
Agree 90% 93%
Disagree 8% 5%
Figure B5.ABOUT HOW MANY DIFFERENT TYPES OF COMPUTER SCIENCE COURSES ARE AVAILABLE IN YOUR SCHOOL THIS YEAR?
% PRINCIPALS
YEAR 2
Highest Grade Level Number of Students Urbanicity
TOTAL 5th and lower 6th-8th 9th and higher
Less than 500 500-999 1000 or
more City Suburb Town/Rural
(n=9,774) (n=2,783) (n=2,617) (n=2,105) (n=5,275) (n=3,015) (n=867) (n=1,661) (n=2,759) (n=4,491)
0 39% 58% 41% 22% 44% 40% 18% 43% 35% 42%
1-2 42% 35% 46% 43% 43% 41% 40% 41% 43% 42%
3-5 14% 4% 11% 27% 10% 15% 30% 12% 15% 13%
More than 5 4% 1% 2% 8% 2% 4% 11% 4% 5% 3%
At least 1 60% 40% 59% 78% 55% 60% 82% 57% 64% 57%
31Trends in the State of Computer Science in U.S. K-12 Schools
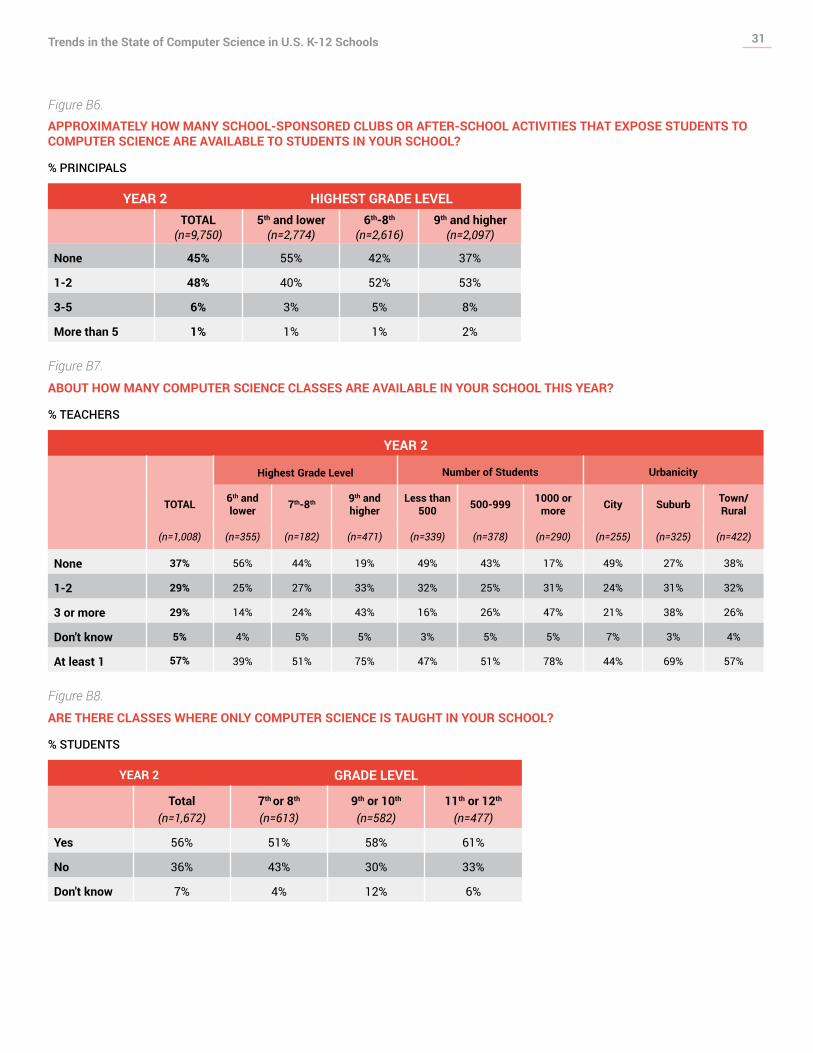
Figure B6.APPROXIMATELY HOW MANY SCHOOL-SPONSORED CLUBS OR AFTER-SCHOOL ACTIVITIES THAT EXPOSE STUDENTS TO COMPUTER SCIENCE ARE AVAILABLE TO STUDENTS IN YOUR SCHOOL?
% PRINCIPALS
YEAR 2 HIGHEST GRADE LEVELTOTAL 5th and lower 6th-8th 9th and higher
(n=9,750) (n=2,774) (n=2,616) (n=2,097)
None 45% 55% 42% 37%
1-2 48% 40% 52% 53%
3-5 6% 3% 5% 8%
More than 5 1% 1% 1% 2%
Figure B7.
ABOUT HOW MANY COMPUTER SCIENCE CLASSES ARE AVAILABLE IN YOUR SCHOOL THIS YEAR?
% TEACHERS
YEAR 2
Highest Grade Level Number of Students Urbanicity
TOTAL 6th and lower 7th-8th 9th and
higherLess than
500 500-999 1000 or more City Suburb Town/
Rural
(n=1,008) (n=355) (n=182) (n=471) (n=339) (n=378) (n=290) (n=255) (n=325) (n=422)
None 37% 56% 44% 19% 49% 43% 17% 49% 27% 38%
1-2 29% 25% 27% 33% 32% 25% 31% 24% 31% 32%
3 or more 29% 14% 24% 43% 16% 26% 47% 21% 38% 26%
Don't know 5% 4% 5% 5% 3% 5% 5% 7% 3% 4%
At least 1 57% 39% 51% 75% 47% 51% 78% 44% 69% 57%
Figure B8.
ARE THERE CLASSES WHERE ONLY COMPUTER SCIENCE IS TAUGHT IN YOUR SCHOOL?
% STUDENTS
YEAR 2 GRADE LEVEL
Total 7th or 8th 9th or 10th 11th or 12th
(n=1,672) (n=613) (n=582) (n=477)
Yes 56% 51% 58% 61%
No 36% 43% 30% 33%
Don't know 7% 4% 12% 6%

32Trends in the State of Computer Science in U.S. K-12 Schools
Figure B9.AVAILABILITY OF COMPUTER SCIENCE CLASSES
% PRINCIPALS
YEAR 1 YEAR 2
(n=8,780) (n=9,713)
As far as you know, is computer science taught as part of any other classes at your school? (Rebased to be among all principals)
Yes 22% 39%
No 75% 58%
(n=4,700) (n=5,858)
Among principals with at least one CS class 41% 47%
(n=8,780) (n=9,713)
Approximately how many school-sponsored clubs or after-school activities that expose students to computer science are available to students in your school? (Rebased to be among all principals)
0 67% 59%
1-2 28% 35%
3-5 3% 5%
More than 5 1% 1%
At least 1 32% 41%
(n=4,700) (n=5,858)
Among principals with at least one CS class 59% 67%
Figure B10.ABOUT HOW MANY DIFFERENT TYPES OF COMPUTER SCIENCE COURSES ARE AVAILABLE IN YOUR SCHOOL THIS YEAR?
% PRINCIPALS
YEAR 1 YEAR 2
(n=8,811) (n=9,774)
0 43% 39%
1-2 39% 42%
3-5 12% 14%
More than 5 3% 4%
At least 1 54% 60%
33Trends in the State of Computer Science in U.S. K-12 Schools
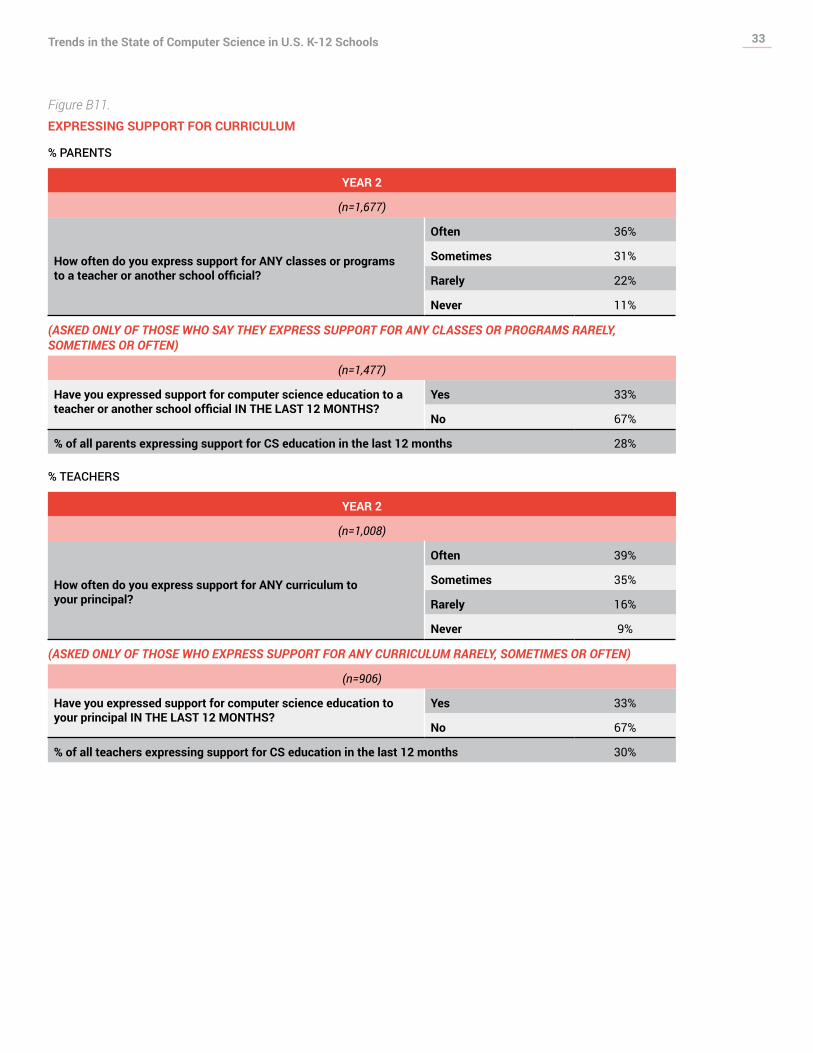
Figure B11.EXPRESSING SUPPORT FOR CURRICULUM
% PARENTS
YEAR 2
(n=1,677)
How often do you express support for ANY classes or programs to a teacher or another school official?
Often 36%
Sometimes 31%
Rarely 22%
Never 11%
(ASKED ONLY OF THOSE WHO SAY THEY EXPRESS SUPPORT FOR ANY CLASSES OR PROGRAMS RARELY, SOMETIMES OR OFTEN)
(n=1,477)
Have you expressed support for computer science education to a teacher or another school official IN THE LAST 12 MONTHS?
Yes 33%
No 67%
% of all parents expressing support for CS education in the last 12 months 28%
% TEACHERS
YEAR 2
(n=1,008)
How often do you express support for ANY curriculum to your principal?
Often 39%
Sometimes 35%
Rarely 16%
Never 9%
(ASKED ONLY OF THOSE WHO EXPRESS SUPPORT FOR ANY CURRICULUM RARELY, SOMETIMES OR OFTEN)
(n=906)
Have you expressed support for computer science education to your principal IN THE LAST 12 MONTHS?
Yes 33%
No 67%
% of all teachers expressing support for CS education in the last 12 months 30%
34Trends in the State of Computer Science in U.S. K-12 Schools
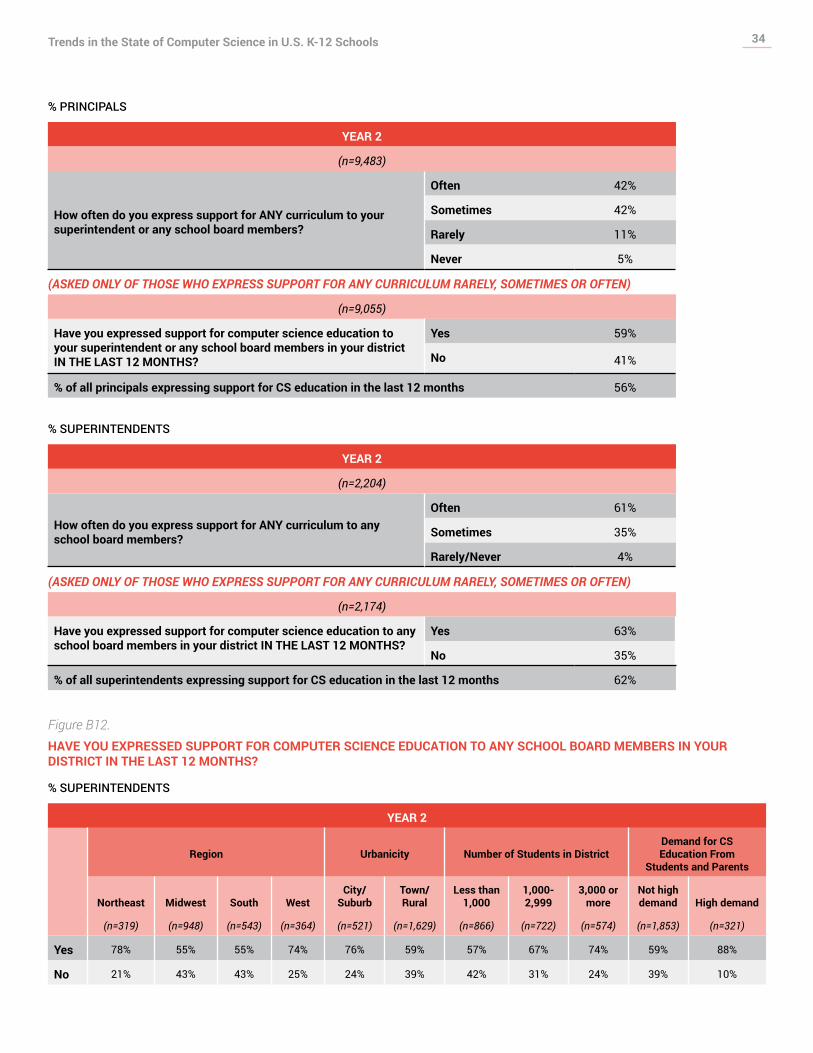
% PRINCIPALS
YEAR 2
(n=9,483)
How often do you express support for ANY curriculum to your superintendent or any school board members?
Often 42%
Sometimes 42%
Rarely 11%
Never 5%
(ASKED ONLY OF THOSE WHO EXPRESS SUPPORT FOR ANY CURRICULUM RARELY, SOMETIMES OR OFTEN)
(n=9,055)
Have you expressed support for computer science education to your superintendent or any school board members in your district IN THE LAST 12 MONTHS?
Yes 59%
No 41%
% of all principals expressing support for CS education in the last 12 months 56%
% SUPERINTENDENTS
YEAR 2
(n=2,204)
How often do you express support for ANY curriculum to any school board members?
Often 61%
Sometimes 35%
Rarely/Never 4%
(ASKED ONLY OF THOSE WHO EXPRESS SUPPORT FOR ANY CURRICULUM RARELY, SOMETIMES OR OFTEN)
(n=2,174)
Have you expressed support for computer science education to any school board members in your district IN THE LAST 12 MONTHS?
Yes 63%
No 35%
% of all superintendents expressing support for CS education in the last 12 months 62%
Figure B12.HAVE YOU EXPRESSED SUPPORT FOR COMPUTER SCIENCE EDUCATION TO ANY SCHOOL BOARD MEMBERS IN YOUR DISTRICT IN THE LAST 12 MONTHS?
% SUPERINTENDENTS
YEAR 2
Region Urbanicity Number of Students in DistrictDemand for CS Education From
Students and Parents
Northeast Midwest South WestCity/
SuburbTown/Rural
Less than 1,000
1,000-2,999
3,000 or more
Not high demand High demand
(n=319) (n=948) (n=543) (n=364) (n=521) (n=1,629) (n=866) (n=722) (n=574) (n=1,853) (n=321)
Yes 78% 55% 55% 74% 76% 59% 57% 67% 74% 59% 88%
No 21% 43% 43% 25% 24% 39% 42% 31% 24% 39% 10%

35Trends in the State of Computer Science in U.S. K-12 Schools
Figure B13.COMPUTER SCIENCE EDUCATION IS CURRENTLY A TOP PRIORITY FOR MY SCHOOL.
TEACHERS PRINCIPALS SUPERINTENDENTSYear 1 Year 2 Year 1 Year 2 Year 1 Year 2
(n=1,013) (n=1,008) (n=9,072) (n=9,731) (n=1,857) (n=2,292)
Strongly agree/Agree* 23% 29% 24% 27% 30% 33%
Neutral/Don't know 29% 24% 33% 29% 33% 36%
Strongly disagree/Disagree* 48% 48% 43% 44% 36% 31%
*Teacher scale was “Completely disagree/Disagree” and “Completely agree/Agree”
Figure B14.COMPUTER SCIENCE EDUCATION IS CURRENTLY A TOP PRIORITY FOR MY SCHOOL.
% PRINCIPALS
YEAR 2
Number of Students Highest Grade Level District Type Urbanicity
TOTAL Less than 500 500-999 1000 or
more5th and lower 6th-8th 9th and
higher Public Private Other City Suburb Rural
(n=9,731) (n=5,254) (n=2,998) (n=866) (n=2,779) (n=2,600) (n=2,096) (n=7,081) (n=1,564) (n=475) (n=1,651) (n=2,750) (n=4,473)
Strongly agree/Agree
27% 24% 28% 38% 20% 25% 32% 25% 36% 28% 30% 30% 23%
Neutral/Don't know 29% 29% 28% 32% 26% 30% 32% 29% 28% 27% 27% 29% 30%
Strongly disagree/Disagree
44% 47% 44% 30% 54% 45% 36% 46% 35% 45% 43% 41% 47%
36Trends in the State of Computer Science in U.S. K-12 Schools
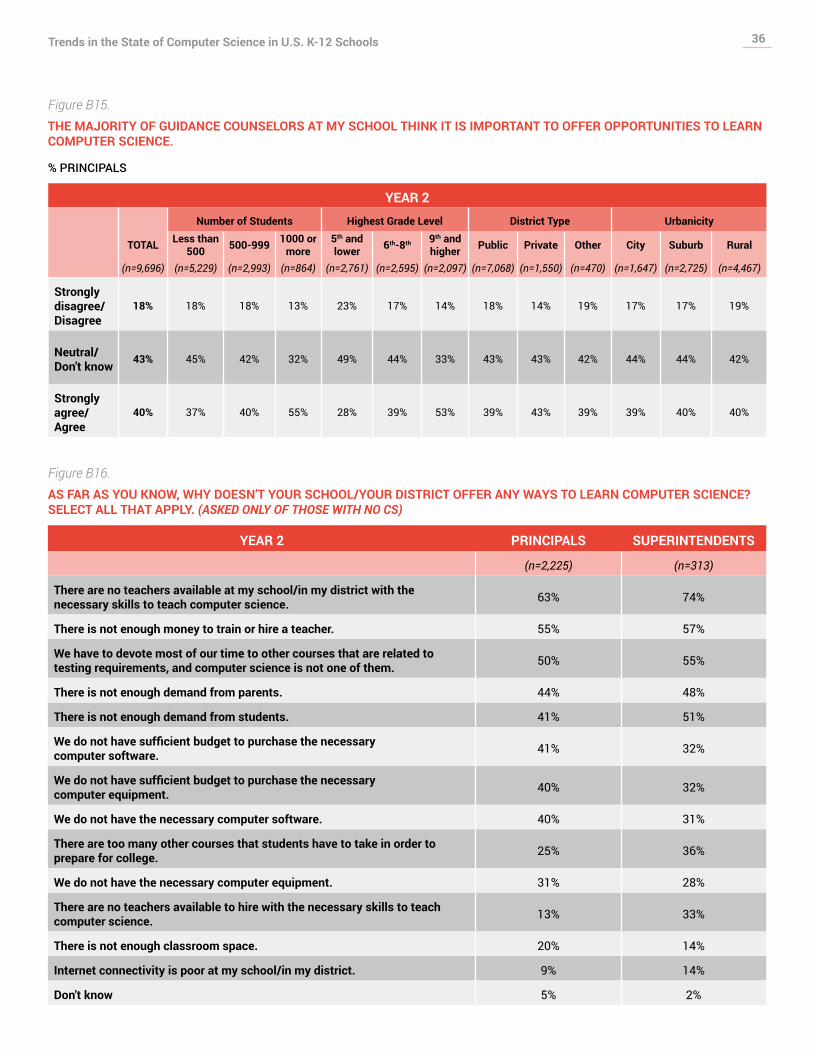
Figure B15.THE MAJORITY OF GUIDANCE COUNSELORS AT MY SCHOOL THINK IT IS IMPORTANT TO OFFER OPPORTUNITIES TO LEARN COMPUTER SCIENCE.
% PRINCIPALS
YEAR 2
Number of Students Highest Grade Level District Type Urbanicity
TOTAL Less than 500 500-999 1000 or
more5th and lower 6th-8th 9th and
higher Public Private Other City Suburb Rural
(n=9,696) (n=5,229) (n=2,993) (n=864) (n=2,761) (n=2,595) (n=2,097) (n=7,068) (n=1,550) (n=470) (n=1,647) (n=2,725) (n=4,467)
Strongly disagree/Disagree
18% 18% 18% 13% 23% 17% 14% 18% 14% 19% 17% 17% 19%
Neutral/Don't know 43% 45% 42% 32% 49% 44% 33% 43% 43% 42% 44% 44% 42%
Strongly agree/Agree
40% 37% 40% 55% 28% 39% 53% 39% 43% 39% 39% 40% 40%
Figure B16.AS FAR AS YOU KNOW, WHY DOESN’T YOUR SCHOOL/YOUR DISTRICT OFFER ANY WAYS TO LEARN COMPUTER SCIENCE? SELECT ALL THAT APPLY. (ASKED ONLY OF THOSE WITH NO CS)
YEAR 2 PRINCIPALS SUPERINTENDENTS
(n=2,225) (n=313)
There are no teachers available at my school/in my district with the necessary skills to teach computer science. 63% 74%
There is not enough money to train or hire a teacher. 55% 57%
We have to devote most of our time to other courses that are related to testing requirements, and computer science is not one of them. 50% 55%
There is not enough demand from parents. 44% 48%
There is not enough demand from students. 41% 51%
We do not have sufficient budget to purchase the necessary computer software. 41% 32%
We do not have sufficient budget to purchase the necessary computer equipment. 40% 32%
We do not have the necessary computer software. 40% 31%
There are too many other courses that students have to take in order to prepare for college. 25% 36%
We do not have the necessary computer equipment. 31% 28%
There are no teachers available to hire with the necessary skills to teach computer science. 13% 33%
There is not enough classroom space. 20% 14%
Internet connectivity is poor at my school/in my district. 9% 14%
Don't know 5% 2%

37Trends in the State of Computer Science in U.S. K-12 Schools
Figure B17.MAIN REASON YOUR SCHOOL DOES NOT OFFER WAYS TO LEARN COMPUTER SCIENCE (ASKED ONLY OF THOSE WHO DO NOT HAVE CS IN THEIR SCHOOL)
% PRINCIPALS
YEAR 2 HIGHEST GRADE LEVEL
TOTAL (n=2,217)
5th and lower
(n=985)
6th-8th (n=556)
9th and higher (n=249)
We have to devote most of our time to other courses that are related to testing requirements, and computer science is not one of them.
30% 40% 35% 14%
There are no teachers available at my school with the necessary skills to teach computer science. 15% 11% 15% 22%
There is not enough money to train or hire a teacher. 14% 13% 17% 13%
There are too many other courses that students have to take in order to prepare for college. 8% 7% 5% 11%
There is not enough demand from students. 6% 4% 4% 19%
There is not enough demand from parents. 6% 6% 3% 3%
We do not have sufficient budget to purchase the necessary computer equipment. 5% 4% 5% 4%
We do not have the necessary computer equipment. 2% 2% 3% 1%
We do not have sufficient budget to purchase the necessary computer software. 2% 2% 2% 1%
There are no teachers available to hire with the necessary skills to teach computer science. 1% 1% 2% 3%
There is not enough classroom space. 1% 1% 1% 1%
We do not have the necessary computer software. 1% 0% 1% 2%
Internet connectivity is poor at my school. 1% 0% 1% 0%
Don’t know 7% 9% 6% 7%
Figure B18.THE MAJORITY OF TEACHERS AT MY SCHOOL THINK IT IS IMPORTANT TO OFFER OPPORTUNITIES TO LEARN COMPUTER SCIENCE.
% PRINCIPALS
YEAR 2
(n=9,710)
Strongly disagree/Disagree 23%
Neutral/Don't know 36%
Strongly agree/Agree 41%

38Trends in the State of Computer Science in U.S. K-12 Schools
Figure B19.MY SCHOOL BOARD IS COMMITTED TO OFFERING COMPUTER SCIENCE IN OUR SCHOOLS.
YEAR 2 SUPERINTENDENTS PRINCIPALS PRINCIPALS
TOTAL TOTALUrbanicity
City Suburb Town/Rural
(n=2,293) (n=9,743) (n=1,652) (n=2,750) (n=4,483)
Strongly disagree/Disagree 21% 23% 24% 19% 26%
Don't know/Neutral 34% 37% 36% 36% 39%
Strongly agree/Agree 46% 40% 40% 45% 35%
Figure B20.LEARNING COMPUTER SCIENCE
% STUDENTS
YEAR 1 YEAR 2
(n=1,673) (n=1,672)
Have you ever learned ANY COMPUTER SCIENCE, such as using programming to create software, apps, games, websites or electronics?
Yes 53% 55%
No 46% 45%
(n=910) (n=951)
Have you ever learned computer science in ANY of the following ways? In a class at school (Asked only of students who HAVE learned CS)
Yes 73% 80%
No 27% 19%

39Trends in the State of Computer Science in U.S. K-12 Schools
Figure B21.LEARNING COMPUTATIONAL THINKING
% STUDENTS
YEAR 2 HIGHEST GRADE LEVEL
TOTAL 7th or 8th 9th or 10th 11th or 12th
(n=1,672) (n=613) (n=582) (n=477)
Computer science sometimes involves solving problems by finding patterns and breaking them down into a set of rules that computers follow to do things automatically. Have you ever done any of this at school?
Yes 37% 38% 39% 33%
No 61% 59% 60% 65%
HAVE YOU EVER DONE ANY OF THE FOLLOWING IN SCHOOL, WHETHER ON A COMPUTER OR NOT? HOW ABOUT ?
Exercises involving sorting groups in the most efficient way, such as exploring the fastest way to sort a room full of people by birth order
Yes 53% 52% 56% 51%
No 46% 46% 43% 49%
Collecting, analyzing and representing data on different topics
Yes 81% 77% 84% 82%
No 19% 22% 15% 18%
Observing patterns and creating models or theories to predict outcomes
Yes 68% 64% 72% 69%
No 31% 35% 27% 30%
Creating an ordered series of instructions for solving problems or for doing a task
Yes 73% 71% 75% 72%
No 26% 27% 25% 27%
Figure B22.(AS FAR AS YOU KNOW), ARE THERE OPPORTUNITIES IN YOUR COMMUNITY (FOR STUDENTS/FOR STUDENTS LIKE YOU/FOR YOUR CHILD) TO LEARN COMPUTER SCIENCE OUTSIDE OF (YOUR/YOUR/HIS/HER) SCHOOL?
STUDENTS PARENTS TEACHERS Year 1 Year 2 Year 1 Year 2 Year 1 Year 2
(n=1,673) (n=1,672) (n=1,685) (n=1,677) (n=1,013) (n=1,008)
Yes 54% 55% 47% 43% 54% 58%
No 35% 30% 43% 42% 36% 31%
Don't know 11% 15% 11% 15% 10% 10%
Figure B23.YOU ARE AWARE OF SPECIFIC WEBSITES WHERE YOUR CHILD COULD LEARN COMPUTER SCIENCE ON THE INTERNET.
% PARENTS
YEAR 2
(n=1,677)
Agree 54%
Disagree 41%
Don't know 5%
40Trends in the State of Computer Science in U.S. K-12 Schools
Figure B24.COMPUTER SCIENCE CAN BE USED IN A LOT OF DIFFERENT TYPES OF JOBS.
PARENTS STUDENTS PRINCIPALS* SUPERINTENDENTS* Year 1 Year 2 Year 1 Year 2 Year 1 Year 2 Year 1 Year 2
(n=1,686) (n=1,677) (n=1,673) (n=1,672) (n=9,032) (n=9,712) (n=1,842) (n=2,293)
Agree 96% 97% 96% 97% 89% 88% 79% 85%
Disagree 3% 2% 3% 2% 2% 2% 5% 4%
Don’t know 0% 1% 1% 1% 9% 10% 16% 11%
*A neutral category scale was offered to principals and superintendents and was included in the “don’t know” reporting. Students were asked to “agree” or “disagree” with the statements, while the adult groups were asked to “strongly agree” or “agree” or “disagree” or “strongly disagree,” which were collapsed into the “agree”/“disagree” categories.
Figure B25.PERCEPTIONS OF PEOPLE WHO DO CS
PARENTS STUDENTS
Year 1 Year 2 Year 1 Year 2
(n=1,686) (n=1,677) (n=1,673) (n=1,672)
How likely are you to (How likely is it that your child will) have a job someday where you (he/she) would need to know some computer science?
Very likely 43% 47% 38% 29%
Somewhat likely 42% 40% 52% 56%
Not at all likely 15% 12% 10% 14%
People who do computer science make things that help improve people's lives.
Agree 93% 94% 93% 93%
Disagree 5% 3% 4% 5%
People who do computer science have the opportunity to work on fun and exciting projects.
Agree 94% 94% 91% 94%
Disagree 5% 4% 7% 4%

41Trends in the State of Computer Science in U.S. K-12 Schools
Figure B26.AS FAR AS YOU KNOW, WHY DOESN’T YOUR SCHOOL OFFER ANY WAYS TO LEARN COMPUTER SCIENCE? SELECT ALL THAT APPLY. (ASKED ONLY OF THOSE WITH NO CS)
% PRINCIPALS
YEAR 2
Number of Students Region
Less than 500
500 or more Northeast Midwest South West
(n=1,459) (n=662) (n=249) (n=682) (n=858) (n=436)
There are no teachers available at my school with the necessary skills to teach computer science. 65% 61% 59% 63% 60% 70%
There are no teachers available to hire with the necessary skills to teach computer science. 13% 13% 9% 11% 13% 18%
There is not enough classroom space. 18% 24% 19% 21% 19% 20%
There is not enough money to train or hire a teacher. 58% 52% 52% 59% 51% 59%
We do not have the necessary computer equipment. 31% 31% 30% 31% 29% 35%
We do not have the necessary computer software. 41% 38% 40% 40% 37% 46%
We do not have sufficient budget to purchase the necessary computer equipment. 42% 38% 40% 40% 38% 44%
We do not have sufficient budget to purchase the necessary computer software. 42% 38% 36% 42% 39% 44%
Internet connectivity is poor at my school. 9% 9% 8% 9% 8% 13%
There is not enough demand from students. 42% 39% 36% 43% 38% 46%
There is not enough demand from parents. 46% 42% 42% 46% 39% 51%
There are too many other courses that students have to take in order to prepare for college. 26% 24% 20% 26% 25% 29%
We have to devote most of our time to other courses that are related to testing requirements, and computer science is not one of them.
48% 57% 40% 50% 55% 46%
Don't know 4% 5% 7% 5% 6% 1%
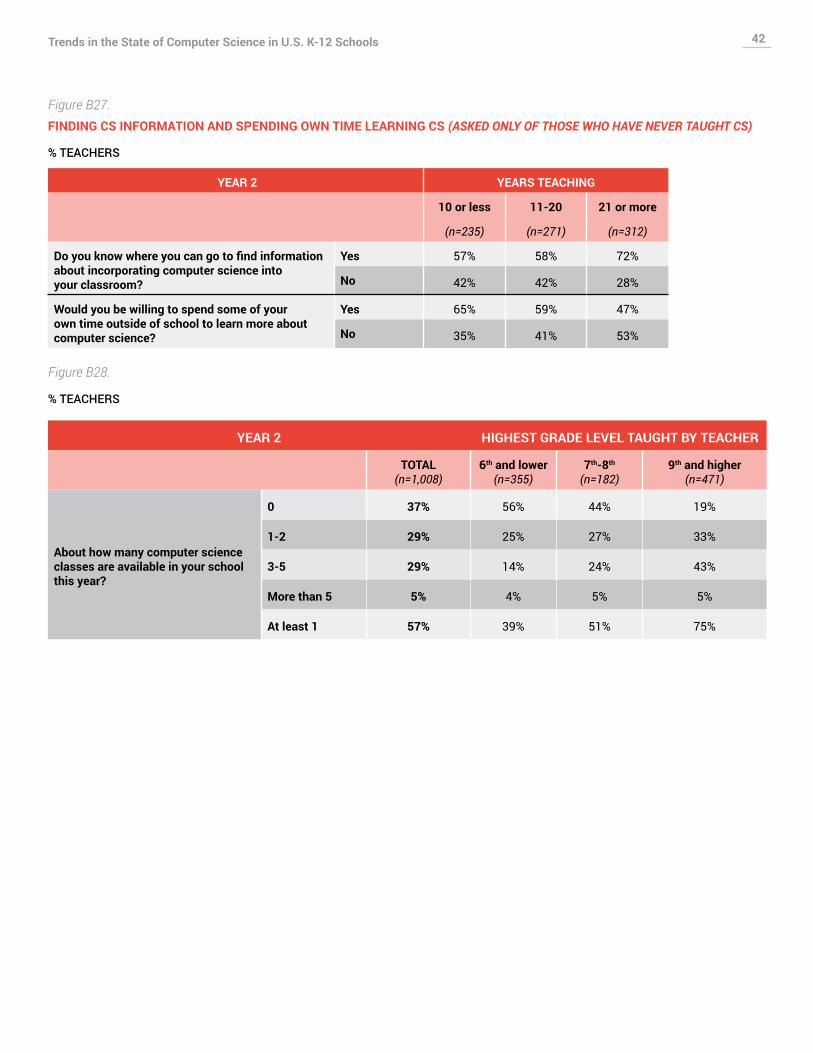
42Trends in the State of Computer Science in U.S. K-12 Schools
Figure B27.FINDING CS INFORMATION AND SPENDING OWN TIME LEARNING CS (ASKED ONLY OF THOSE WHO HAVE NEVER TAUGHT CS)
% TEACHERS
YEAR 2 YEARS TEACHING
10 or less 11-20 21 or more
(n=235) (n=271) (n=312)
Do you know where you can go to find information about incorporating computer science into your classroom?
Yes 57% 58% 72%
No 42% 42% 28%
Would you be willing to spend some of your own time outside of school to learn more about computer science?
Yes 65% 59% 47%
No 35% 41% 53%
Figure B28.
% TEACHERS
YEAR 2 HIGHEST GRADE LEVEL TAUGHT BY TEACHER
TOTAL (n=1,008)
6th and lower (n=355)
7th-8th (n=182)
9th and higher (n=471)
About how many computer science classes are available in your school this year?
0 37% 56% 44% 19%
1-2 29% 25% 27% 33%
3-5 29% 14% 24% 43%
More than 5 5% 4% 5% 5%
At least 1 57% 39% 51% 75%

43Trends in the State of Computer Science in U.S. K-12 Schools
Figure B29.DO THE COMPUTER SCIENCE OPPORTUNITIES OFFERED IN YOUR SCHOOL INCLUDE ANY OF THE FOLLOWING ELEMENTS? (SELECT ALL THAT APPLY) (ASKED ONLY OF THOSE WITH AN OPPORTUNITY TO LEARN CS AT SCHOOL WHETHER IN CLASS OR IN AN AFTER-SCHOOL PROGRAM)
% PRINCIPALS
YEAR 2
Number of Students Highest Grade Level Region
Less than 500 500-999 1000 or
more5th and lower 6th-8th 9th and
higher Northeast Midwest South West
(n=3,721) (n=2,386) (n=802) (n=1,697) (n=1,983) (n=1,789) (n=1,114) (n=2,097) (n=2,466) (n=1,552)
Don't know 6% 4% 3% 8% 4% 5% 4% 6% 5% 4%
Computer programming or coding to create things such as websites, apps or video games
62% 68% 80% 57% 65% 71% 72% 63% 62% 69%
Applying problem-solving to create solutions
61% 64% 71% 55% 62% 67% 67% 62% 62% 60%
Learning what makes computers work the way they do
34% 32% 51% 21% 29% 46% 37% 32% 36% 36%
The impact of technology on society
37% 37% 44% 23% 38% 46% 37% 39% 40% 33%
Data analytics or visualization 20% 19% 32% 9% 17% 32% 23% 20% 22% 20%
Robotics or artificial intelligence using programming/coding
44% 59% 68% 43% 57% 55% 53% 49% 52% 55%
Using programming and coding to create computer graphics
39% 44% 60% 33% 40% 53% 50% 41% 40% 45%