trends in discretionary spending - unt digital library/67531/metadc463072/m1/1/high_re… · trends...
TRANSCRIPT
CRS Report for CongressPrepared for Members and Committees of Congress
Trends in Discretionary Spending
D. Andrew Austin Analyst in Economic Policy
April 15, 2013
Congressional Research Service
7-5700 www.crs.gov
RL34424
Trends in Discretionary Spending
Congressional Research Service
Summary Discretionary spending is provided and controlled through appropriations acts, which fund many of the activities commonly associated with such federal government functions as running executive branch agencies, congressional offices and agencies, and international operations of the government. Essentially all spending on federal wages and salaries is discretionary. Spending can be measured by budget authority (BA; what agencies can legally obligate the government to pay) or outlays (disbursements from the U.S. Treasury). This report mostly discusses trends in outlays.
Federal spending in fiscal year (FY) 2012 was just under a quarter (23%) of the U.S. economy, as measured as a share of gross domestic product (GDP). Federal spending since 1962 has averaged about a fifth of GDP. (Years denote federal fiscal years unless otherwise noted.) Discretionary spending accounted for 34% of total outlays in 2012 ($3,538 billion), well below mandatory spending’s share (60% of outlays in 2012). Weak economic conditions in recent years as well as long-term demographic trends have increased spending on mandatory income support and retirement programs, while policy makers have taken steps to constrain the growth of discretionary spending. Net interest costs were 6.3% of federal outlays in 2012, but are projected to rise sharply as interest rates return to historic levels.
Discretionary spending’s share of total federal spending has fallen over time largely due to rapid growth of entitlement outlays. In 1962, discretionary spending accounted for 47% of total outlays and was the largest component of federal spending until the mid-1970s. Since then, discretionary spending as a share of federal outlays and as a share of GDP has fallen. Under current law projections, discretionary spending’s share of GDP will fall to 5.5% in FY2023. Discretionary spending can be split into various categories to reflect broad national priorities or how federal spending decisions are made. In 1962, discretionary spending was 12.3% of GDP, with defense spending making up 9.0% of GDP. In 2012, discretionary spending was 8.3% of GDP, with defense spending (including war) totaling 4.3% of GDP. Defense spending can be divided between base budget and war expenditures, both of which grew sharply over the last decade. On average, defense outlays grew 6.8% per year in real terms from 2000 to 2010, while real non-defense discretionary outlays grew 5.6% per year. Discretionary spending has also been divided into various security and non-security categories. Non-defense security spending, which rose sharply after 2001 and Hurricane Katrina in 2005, was 1.1% of GDP in 2012, about twice its pre-2001 level. Non-defense non-security outlays, which ranged between 3% and 3.5% of GDP since the mid-1980s, were 2.9% of GDP in 2012. Security spending, which includes almost all defense spending, was 5.3% of GDP in 2012.
The Budget Control Act of 2011 (BCA; P.L. 112-25) reintroduced statutory limits on discretionary spending by imposing a series of caps on discretionary BA from FY2012 through FY2021. The American Taxpayer Relief Act of 2012 (ATRA; P.L. 112-240) modified those limits for FY2013 and FY2014. The FY2013 full-year funding bill (H.R. 933) enacted March 26, 2013, conformed to those limits. Many believe that previous discretionary spending limits helped achieve federal surpluses in the late 1990s.
The direction of fiscal policy has been the focus of contention among macroeconomists. Some contend that more spending would help reduce high unemployment levels, while others call for imposing greater budgetary stringency. Over the long term, future growth in entitlement program outlays may put severe pressure on discretionary spending unless policy changes are enacted or federal revenues are increased. This report will be updated as events warrant.
Trends in Discretionary Spending
Congressional Research Service
Contents What Does Discretionary Spending Include? .................................................................................. 1
Budget Authority and Outlays ................................................................................................... 1 Categories of Federal Spending ....................................................................................................... 2 Recent Fiscal Policy and Discretionary Spending ........................................................................... 3
Fiscal Policy Complicated by Slow Recovery........................................................................... 3 Financial Crisis and Recession .................................................................................................. 4 Faster Growth on the Horizon? ................................................................................................. 5
Discretionary Spending Limits Reimposed in 2011 ........................................................................ 5 Budget Control Act of 2011 (BCA) ........................................................................................... 5 FY2013 Sequestration Triggered ............................................................................................... 6 The Initial FY2013 Continuing Resolution ............................................................................... 7 Scaling Down Sequestration and the Fiscal Cliff ...................................................................... 7 Attempts to Avoid the Effects of Sequestration ......................................................................... 8 BCA Sequester Issued March 1, 2013 ..................................................................................... 10 Full-Year Funding for FY2013 ................................................................................................ 10
Long-Term Trends in Discretionary Spending .............................................................................. 11 Discretionary Spending Now a Smaller Share of Federal Spending ....................................... 11 Discretionary Spending As a Share of GDP ............................................................................ 13
Discretionary Spending and National Priorities ............................................................................ 15 Defense and Non-Defense Spending ....................................................................................... 15
Discretionary Defense Spending ....................................................................................... 18 Non-Defense Discretionary Spending ............................................................................... 20 International Discretionary Spending ................................................................................ 21
Discretionary Security and Non-Security Spending ................................................................ 21 What Is “Homeland Security” or “Security” Spending? ................................................... 21 Trends in “Security” and “Non-Security” Discretionary Spending .................................. 24
Discretionary Spending by Functional Category ..................................................................... 26 Conclusion: Is the Declining Share of Discretionary Spending a Problem? ................................. 28
Figures Figure 1. Outlays by Category as a Percentage of Total Outlays ................................................... 12 Figure 2. Components of Federal Spending, FY1962-FY2017 ..................................................... 14 Figure 3. Defense and Non-Defense Discretionary Spending, FY1977-FY2021 .......................... 16 Figure 4. Discretionary Budget Authority as % of GDP ............................................................... 17 Figure 5. How Defense and Security Intersect: A Schematic View ............................................... 23 Figure 6. Discretionary Budget Authority by Security Category................................................... 25 Figure 7. Discretionary Outlays by Security.................................................................................. 25 Figure 8. Non-Defense Security Outlays by Component .............................................................. 26 Figure 9. Average Growth Rates for Discretionary BA by Subfunction ........................................ 27
Trends in Discretionary Spending
Congressional Research Service
Tables Table 1. Schematic Division of Budget Categories ......................................................................... 3 Table A-1. National Defense and Non-Defense Spending, FY1977-FY2012 ............................... 29
Appendixes Appendix. Defense and Non-Defense Spending, FY1977-FY2012 .............................................. 29
Contacts Author Contact Information........................................................................................................... 30

Trends in Discretionary Spending
Congressional Research Service 1
What Does Discretionary Spending Include? Discretionary spending cover the costs of the routine activities commonly associated with such federal government functions as running executive branch agencies, congressional offices and agencies, and international operations of the government.1 Essentially all spending on federal wages and salaries is discretionary. 2 Discretionary spending also funds grants, purchases of equipment and other assets, and contractor services that support various federal programs and activities.
Congress provides and controls discretionary funding through annual appropriations acts, which grant federal agencies the legal authority to obligate the U.S. government to make payments. Budget authority (BA) is the amount that can be legally obligated. Outlays are the payments made by the U.S. Treasury to satisfy those obligations. This report mostly discusses trends in outlays.
Budget Authority and Outlays The distinction between outlays and BA is important to understanding the federal budget and, particularly, discretionary spending. Appropriations legislation controls discretionary funding and provides budget authority to fund specific programs. Congress exercises its constitutional power of the purse by deciding what funds federal agencies can obligate on behalf of the U.S. government, for what purposes and for specified time periods. While budget authority is available for just a single year (such as for most personnel compensation costs), some appropriations (such as for many military construction projects) provide budget authority for multiple years, or indefinitely. 3 Agencies obligate funds by signing contacts or hiring employees or contractors or in other ways. Budget authority has been compared to funds deposited into a checking account, which then can be used for specified federal purposes.
Outlays are disbursed federal funds. Outlays are recorded when the U.S. Treasury disburses appropriated funds to purchase goods and services, pay employees, issue benefits, or make interest payments. Agencies typically do not spend all of their budget authority in the year it becomes available, which implies that outlays will lag behind budget authority.
Outlay data are used to assess the macroeconomic effects of the federal budget, whereas budget analysis of specific federal programs is often based on budget authority, because that is what Congress controls directly. Limits on discretionary spending set by the Budget Control Act of 2011 (BCA; P.L. 112-25) are defined in terms of BA.
1 Annual appropriations acts fall within the jurisdiction of the House and Senate Appropriations Committees. 2 Exceptions exist. For example, salaries for Members of Congress, the President, and federal judges are classified as mandatory spending, as are essentially all federal retirement and disability costs. Direct spending is controlled by committees with legislative jurisdiction. 3 While federal officials often have some discretion to choose how quickly appropriated funds are spent, they face constraints imposed by legislation designed to protect Congress’s power of the purse. According to the Anti-Deficiency Act, a federal official cannot spend government money beyond what is available through appropriations or a fund by law. See Government Accountability Office, Antideficiency Act Background, available at http://www.gao.gov/ada/antideficiency.htm for code citations and explanations. The Congressional Budget Act and Impoundment Control Act of 1974 (P.L. 93-344) limits the ability of federal officials to withhold or delay spending of appropriated funds without Congressional approval.
Trends in Discretionary Spending
Congressional Research Service 2
Categories of Federal Spending Federal spending can be divided into three basic budget categories:
• discretionary spending ($1,285 billion in FY2012 outlays);
• mandatory spending ($2,031 billion in FY2012 outlays); and
• net interest costs ($223 billion in FY2012).
Mandatory programs and net interest costs are the other components of federal spending.4 Mandatory spending, also known as direct spending, funds entitlement programs, the Supplemental Nutrition Assistance Program (SNAP; formerly known as the Food Stamps program), and other spending controlled by laws other than appropriation acts.5 Spending levels for mandatory programs generally depend on eligibility criteria, size of the eligible population, and participation rates.
Different types of mandatory programs are set up in diverse ways, reflecting historical influences, technical demands, and specific legislative authorities. While the term “entitlement” can be defined to coincide with the mandatory programs, many would distinguish programs providing benefits to large populations meeting set eligibility requirements from more special payments, such as salaries of judges covered by Article III of the Constitution.
In some cases, mandatory and discretionary spending support similar activities. For example, Medicare health care benefits are classified as mandatory spending, while most health care benefits for veterans and military personnel are classified as discretionary spending.
Legislative procedures for funding discretionary programs differ from those for mandatory programs.6 Congress provides discretionary funds (BA) each year through the annual appropriations process. Other types of legislation, such as authorization measures, control mandatory spending. Some mandatory programs, such as Social Security, are financed outside the annual appropriations process. Other mandatory programs, such as Medicaid, are funded through appropriations measures, while the level of spending reflects eligibility requirements and other provisions set in authorizing legislation, as well as the pool of potential beneficiaries and program participation rates.7
Table 1 provides a simple division of federal spending (i.e., mandatory and discretionary spending) by contrasting the type of budget authority needed for specific purposes.
4 These categories are called BEA categories in some Office of Management and Budget (OMB) publications, because they are defined in the Budget Enforcement Act of 1990 (P.L. 101-508). 5 The Government Accountability Office (GAO) notes that “A mandatory program is simply one that Congress directs (rather than merely authorizes) the agency to conduct, but within the limits of available funding.” Principles of Federal Appropriations Law (Red Book), GAO-040261SP, vol. 1, p. 3-52. For an overview of mandatory spending trends, see CRS Report RL33074, Mandatory Spending Since 1962, by D. Andrew Austin and Mindy R. Levit. 6 For an overview, see CRS Report 98-721, Introduction to the Federal Budget Process, coordinated by Bill Heniff Jr. 7 CRS Report RS20129, Entitlements and Appropriated Entitlements in the Federal Budget Process, by Bill Heniff Jr. For one listing of permanent appropriations, see GAO, Inventory of Accounts With Spending Authority and Permanent Appropriations, 1997, OGC-98-23, January 19, 1998, available at http://www.gao.gov/assets/230/225159.pdf.

Trends in Discretionary Spending
Congressional Research Service 3
Table 1. Schematic Division of Budget Categories
Budget Authority Provided by Law Other than Appropriation Acts
Budget Authority Provided by Appropriation Acts
Entitlement Medicare Social Security
Appropriated entitlements (e.g., veterans’ compensation, Medicaid, TANFa) SNAPb (with caveats)
Not an Entitlement
Salaries for Article III Judges Mandatory non-entitlements (e.g., Forest Service payments to states)
Discretionary spending
(defense, non-defense discretionary; covers most costs of running agencies)
Source: Compiled by CRS.
a. Temporary Assistance for Needy Families.
b. The Supplemental Nutrition Assistance Program (SNAP) was formerly known as the Food Stamps program.
Recent Fiscal Policy and Discretionary Spending Policy disagreements about fiscal policy challenges continue to influence trends in discretionary spending. Fiscal policy describes how a government chooses to balance spending and revenues, which can be used to influence the level of economic activity.8 Substantial evidence suggests that fiscal policy can stimulate economic activity when an economy is operating below its potential level of output and when short-term interest rates are near zero.9
Discretionary spending, which is controlled through an annual budget process, is potentially a more flexible fiscal instrument than mandatory spending. Some features of mandatory programs have often been changed to respond to economic conditions. For example, the period of eligibility for unemployment insurance benefits has often been changed during recessions.10 Tax policy changes have also been used to respond to macroeconomic conditions. In addition, as incomes fall during recessions, tax revenues fall and more families become eligible for means-tested mandatory programs, deficits rise which helps dampen economic shocks.11 When economic growth resumes, those changes run in the opposite direction. Therefore those changes are known as automatic stabilizers.
Fiscal Policy Complicated by Slow Recovery Addressing short-term and long-term challenges simultaneously is difficult because additional government outlays, according to most economic research, would boost economic recovery, while reducing spending could help enhance fiscal sustainability—as would increases in federal revenues. Some have called for linking a package of policies to provide short-term fiscal stimulus
8 Monetary policy, which affects the money supply, interest rates, and credit conditions, is another key instrument of macroeconomic management. 9 Estimates of the magnitude of stimulus effects vary. For a review of the literature, see CRS Report RL33657, Running Deficits: Positives and Pitfalls, by D. Andrew Austin. 10 A recession occurs when an economy contracts. See National Bureau of Economic Research, “The NBER’s Business Cycle Dating Committee,” available at http://www.nber.org/cycles/recessions.html. 11 CBO, The Effects of Automatic Stabilizers on the Federal Budget as of 2013, March 8, 2013, available at http://www.cbo.gov/publication/43977.

Trends in Discretionary Spending
Congressional Research Service 4
with longer-term measures aimed at fiscal sustainability, although designing such packages to ensure credibility and effectiveness could be challenging.12
Financial Crisis and Recession The 2007-2009 financial crisis and the recession that followed continue to color current fiscal policy debates. During the economic recession that followed the 2007-2009 financial crisis, the federal government took several measures to stimulate the economy, in addition to an extraordinary set of measures aimed at housing and credit markets. Some policymakers have called for expansion or continuation of programs intended to alleviate economic vulnerabilities of households and businesses, while other policymakers have argued that discretionary spending should revert to pre-crisis levels. Whether the federal government should take immediate steps to close the gap between spending and receipts or wait until the economy is more fully recovered has been subject to debate among economists.
While much of the funds made available by measures responding to the financial crisis or the subsequent recession were classified as mandatory or revenue reductions, discretionary spending also rose sharply. Most notably, Congress in early 2009 responded to weak economic conditions and dramatic job losses that sharply increased unemployment rates by passing a major fiscal stimulus package. The resulting measure, the American Recovery and Reinvestment Act of 2009 (ARRA; H.R. 1, P.L. 111-5), enacted on February 17, 2009, included stimulus spending and tax cuts estimated at the time to total $787.2 billion, including about $300 billion in discretionary spending.13 ARRA included funds for discretionary spending on education initiatives, support for state governments, public housing, infrastructure, and health care.14 In 2012, CBO estimated the total budgetary effect of ARRA at $831 billion between 2009 and 2019.15
The recovery after the deep recession that followed the 2007-2009 financial crisis has been relatively slow. Economic growth in the United Stated, however, has been faster in recent years than in many other advanced economies.16 Economic recoveries following major financial crises can be much less robust than recoveries following more cyclical downturns.17 Some continue to call for a more expansionary fiscal policy to respond to high unemployment levels, which would entail larger budget deficits in the short run.18 Other economists are skeptical that such fiscal
12 Peter R. Orszag, “History Shows U.S. Can Stimulate Now, Cut Later,” Bloomberg.com, May 22, 2012, available at http://www.cfr.org/geoeconomics/history-shows-us-can-stimulate-now-cut-later/p28338. 13 The original CBO score of ARRA is available at http://www.cbo.gov/sites/default/files/cbofiles/ftpdocs/99xx/doc9989/hr1conference.pdf. 14 Certain Supplemental Nutrition Assistance Program (SNAP) benefits were cut by P.L. 111-226 (H.R. 1546). For details, see CRS Report R41374, Reducing SNAP (Food Stamp) Benefits Provided by the ARRA: P.L. 111-226 and P.L. 111-296, by Randy Alison Aussenberg, Jim Monke, and Gene Falk; and CBO, “Budgetary Effects of Senate Amendment 4575,” cost estimate, August 4, 2010, available at http://www.cbo.gov/ftpdocs/117xx/doc11756/sa4575.pdf. 15 U.S. Congressional Budget Office, Budget and Economic Outlook, January 2012, Box 1-1, available at http://www.cbo.gov/sites/default/files/cbofiles/attachments/01-31-2012_Outlook.pdf. 16 IMF, World Economic Outlook: Coping with High Debt and Sluggish Growth, October 2012, available at http://www.imf.org/external/pubs/ft/weo/2012/02/pdf/text.pdf. 17 See Carmen M. Reinhart and Kenneth S. Rogoff, This Time is Different: Eight Centuries of Financial Folly, (Princeton, 2009); and “Sorry, U.S. Recoveries Really Aren’t Different,” Bloomberg News, October 15, 2012, available at http://www.bloomberg.com/news/2012-10-15/sorry-u-s-recoveries-really-aren-t-different.html. 18 Christina Romer, “Not My Father’s Recession: The Extraordinary Challenges and Policy Responses of the First (continued...)

Trends in Discretionary Spending
Congressional Research Service 5
policies would ameliorate deeper problems caused by high personal and federal debt levels, and therefore call for fiscal restraint as a first step towards addressing longer-term fiscal challenges, or at least a transition to a less expansionary fiscal policy.19 A 2012 International Monetary Fund (IMF) survey found that the experience of advanced countries during the recent recession suggests that active fiscal policy can stimulate economic growth when economic resources are not being fully used and when the effectiveness of standard monetary policy tools is constrained by very low interest rates.20
Faster Growth on the Horizon?
Some 2013 forecasts show signs of faster growth. Reductions in government spending are expected to dampen economic growth in the short run, although the recovery of key economic sectors such as housing are expected to strengthen.21 Serious risks to economic recovery persist, such as those linked to the Eurozone and signs of decelerating growth in other countries such as China.
Discretionary Spending Limits Reimposed in 2011 Recent trends in discretionary spending have been controlled by statutory limits reestablished in the Budget Control Act of 2011 (BCA), enacted on August 2, 2011. Those limits, which extend until FY2021, are expected to shape future trends in discretionary spending.
Budget Control Act of 2011 (BCA) Provisions of the BCA are projected to bring discretionary spending as a share of GDP to levels well below that seen in recent decades. In terms of real dollars (i.e., adjusting for inflation but not for growth in population or the economy), discretionary base defense spending would revert to a level slightly above its FY2007 level, while non-defense discretionary spending would revert a level near its 2002 level.22
(...continued) Twenty Months of the Obama Administration,” remarks at the National Press Club, September 1, 2010, available at http://www.whitehouse.gov/sites/default/files/microsites/100901-National-Press-Club.pdf. 19 Kenneth Rogoff, “Why America Isn’t Working,” Project Syndicate, September 1, 2010, available at http://www.project-syndicate.org/commentary/rogoff72/English. 20 IMF, World Economic Outlook: Coping with High Debt and Sluggish Growth, October 2012, available at http://www.imf.org/external/pubs/ft/weo/2012/02/pdf/text.pdf. See discussion in Box 1.1 written by IMF chief economist Olivier Blanchard and Daniel Leigh (pp. 41-43). 21 Kris Dawsey and Hui Shan, “Housing Sector Jobs Poised for a Comeback,” Goldman Sachs US Daily, February 11, 2013; Mark Zandi, “U.S. Macro Outlook: Restarting the Engines,” Moody’s Analytics Dismal Scientist Blog, February 6, 2013, available at http://www.economy.com/dismal/article_free.asp?cid=237408&tid=5FCB4BBF-D759-422D-BD25-BFF7D505D457. 22 For details, see Congressional Research Service, “The Budget Control Act and Alternate Defense and Non-Defense Spending Paths, FY2012-FY2021,” by Amy Belasco and Andrew Austin, November 16, 2012, available from authors. This comparison is made in terms of budget authority. Before passage of ATRA, BCA provisions were slated to bring discretionary base defense spending to its FY2007 level and non-defense spending to near its level in FY2003 or FY2004. Inflation adjustments made using GDP price index.
Trends in Discretionary Spending
Congressional Research Service 6
The BCA set limits on discretionary spending that were initially estimated to save about $900 billion over the next decade relative to a pre-BCA baseline.23 The BCA also established a Joint Select Committee on Deficit Reduction (JSC), known as the “Super Committee,” to develop and present a plan to Congress and the President that would achieve an additional $1.2 trillion or more in savings. The BCA, in return, allowed a set of increases to the debt limit, subject to congressional disapproval, enabling the government to borrow through February 2013.24 The BCA tied the expected reduction in spending achieved through those discretionary spending limits and other budget enforcement measures to increases in the debt limit of the same magnitude.25
FY2013 Sequestration Triggered The Super Committee (JSC) reached a deadlock shortly before a key November 2011 deadline, thus triggering backup enforcement mechanisms set up in the BCA to reduce spending by $1.2 trillion. Those backup enforcement mechanisms have been modified by ATRA (more below). The original BCA caps were then superseded by revised caps, which imposed separate limits on defense (budget function 050) and non-defense spending. The sum of total discretionary spending under the original and revised caps was the same. Further reductions of $109 billion for each year from the revised cap levels, split between defense and non-defense, were slated to occur in each year from FY2013 through FY2021. Those reductions, along with interest savings, were designed to capture the $1.2 trillion in budget savings in the absence of a Super Committee plan.
For FY2013, the BCA had required a sequester on January 2, 2013—a cancellation of budget authority relying on pro-rata cuts to most discretionary budget authority, Medicare, and certain other mandatory outlays. Most mandatory spending was exempt from sequestration and Medicare patient care reductions are limited to 2%. Thus, the bulk of sequestration reductions apply to discretionary programs.
For later years—from FY2014 through FY2021—the BCA-specified mechanisms set lowered spending caps that would apply to discretionary funding levels. Amounts above those caps, according to budget law, would be sequestered.26 Within limits set by those caps, however, Congress would have flexibility to tailor the budget to suit its policy priorities.
23 CBO, “Letter to the Honorable John A. Boehner and the Honorable Harry Reid Estimating the Impact on the Deficit of the Budget Control Act of 2011,” August 1, 2011, available at http://www.cbo.gov/ftpdocs/124xx/doc12414/09-12-BudgetControlAct.pdf. 24 For an analysis of the provisions of the BCA, see CRS Report R41965, The Budget Control Act of 2011, by Bill Heniff Jr., Elizabeth Rybicki, and Shannon M. Mahan. For details on debt limit provisions, see CRS Report RL31967, The Debt Limit: History and Recent Increases, by D. Andrew Austin and Mindy R. Levit. 25 For two versions of the negotiations that led to the BCA, see Peter Wallsten et al., “Obama’s Evolution: Behind the Failed ‘Grand Bargain’ on the Debt,” Washington Post, March 17, 2012, p. A1, available at http://www.washingtonpost.com/politics/obamas-evolution-behind-the-failed-grand-bargain-on-the-debt/2012/03/15/gIQAHyyfJS_story.html; Matthew Bai, “Obama vs. Boehner: Who Killed the Debt Deal?” New York Times Magazine, March 28, 2012, p. MM22, available at http://www.nytimes.com/2012/04/01/magazine/obama-vs-boehner-who-killed-the-debt-deal.html. 26 A sequester would affect budgetary resources in addition to new budget authority as well, such as defense unobligated balances. Non-exempted mandatory programs would continue to be sequestered from FY2014 to FY2021 under provisions of the BCA.

Trends in Discretionary Spending
Congressional Research Service 7
In addition to the FY2013 sequester triggered by the absence of a Super Committee plan, BCA discretionary limits are enforced by a separate sequester mechanism.27 That mechanism is therefore called the cap enforcement sequester.
The Initial FY2013 Continuing Resolution A continuing resolution (CR; H.J.Res. 117; P.L. 112-175) was enacted on September 28, 2012, to fund the federal government for the first six months of the fiscal year.28 In general, funding levels were set 0.612% above FY2012 levels, with exceptions for war funding and certain disaster relief programs.29
Discretionary spending in the CR was scored at $1,047 billion, which equaled the sum of the revised defense and non-defense caps. Base budget discretionary defense funding, however, was scored at $557 billion (in BA), or $11 billion above the revised BCA cap, while nondefense discretionary spending (BA) was scored at $490 billion, or $11 billion below its BCA revised cap.30 Funding in the CR above cap levels would have been subject to a cap enforcement sequester, absent subsequent changes.31 The American Taxpayer Relief Act (see below) delayed both the Super Committee sequester and the potential cap enforcement sequester, in addition to other changes in budget enforcement mechanisms.
Scaling Down Sequestration and the Fiscal Cliff The American Taxpayer Relief Act (ATRA; H.R. 8; P.L. 112-240) delayed the sequester triggered by the absence of a Super Committee (JSC) plan by two months, from January 2, 2013 to March 1, 2013.32 In addition, the size of those FY2013 sequestration cuts was reduced from $109 billion to $85 billion.33 The remaining $85 billion sequester, as before, is divided equally between defense and non-defense spending. Nearly all of the sequester reductions in defense spending fall within discretionary spending, while about a third of non-defense sequester reductions fall within the mandatory category.
Half of the $24 billion reduction in the size of the FY2013 sequester was offset by lowering discretionary spending limits for FY2013 by $4 billion ($2 billion in security spending; $2 billion in non-security spending) and lowering limits for FY2014 by $8 billion ($4 billion in defense; $4 27 Amounts above cap levels would be sequestered as specified in Balanced Budget and Emergency Deficit Control Act of 1985 (BBEDCA; P.L. 99-177, as amended), §251(a)(1). 28 H.J.Res. 117 passed on a 329-91 vote in the House on September 13, 2012, and passed on a 62-30 vote in the Senate on September 22. 29 See CRS Report R42647, Continuing Resolutions: Overview of Components and Recent Practices, by Jessica Tollestrup. 30 CBO, “Budget authority subject to $1,407 (sic) billion cap: CR as introduced,” September 2012. 31 BBEDCA (P.L. 99-177), §251(a)(1). For details, see House Appropriations Committee Ranking Member Norman Dicks, “A Report on the Consequences of Sequestration,” Dear Colleague Letter, October 9, 2012, available at http://www.naph.org/Links/ADV/House-Sequestration-Letter-10-9-12.aspx. Also see Amy Belasco and D. Andrew Austin, The Budget Control Act and Alternate Defense and Non-Defense Spending Paths, FY2012-FY2021, congressional distribution memorandum, available from authors. 32 For details, see CRS Report R42949, The American Taxpayer Relief Act of 2012: Modifications to the Budget Enforcement Procedures in the Budget Control Act, by Bill Heniff Jr. 33 Thus the size of the FY2013 sequester was reduced by $24 billion.
Trends in Discretionary Spending
Congressional Research Service 8
billion in non-defense). The remaining $12 billion was offset by revenue changes affecting retirement accounts. 34
ATRA also altered discretionary spending limits on FY2013 discretionary spending. ATRA delayed a potential cap enforcement sequester to enforce discretionary spending limits from early January 2013 to March 27, 2013.35 The cap enforcement sequester was modified by ATRA to apply to security/non-security categories, rather than the defense/non-defense categories previously in effect.36 Because the full-year funding measure (H.R. 933; P.L. 113-6) was designed to conform to these modified discretionary spending limits, the cap sequester has been avoided.37 The discretionary spending limits enforced by that sequester, however, affected the structure of the FY2013 full-year funding measure.
The change in the FY2013 discretionary limits from defense/non-defense to security/non-security may have shifted the allocation of spending reductions. Because the security category is broader than the defense category, cap enforcement sequester reductions would have applied to a larger pool of programs. The cap enforcement sequester would have reduced spending within security programs by more than within non-security programs because the CR funded defense programs above BCA cap levels. Without changes in spending levels, the cap enforcement sequester, according to CBO estimates, would have reduced security spending by $7 billion and non-security spending by $1 billion.38
ATRA also put in place a less restrictive fiscal policy by extending various expiring tax provisions and extended unemployment benefits, while postponing across-the-board sequestration until March 2013.39 Those increases in federal revenues and decreases in spending, often known as the “fiscal cliff,” would have lowered the federal deficit dramatically, but could have led to a new recession in 2013, according to CBO and other forecasters.40 Others, however, had expected more modest macroeconomic consequences from those changes.41
Attempts to Avoid the Effects of Sequestration Many have objected to the consequences for federal programs and fiscal policy of the BCA’s sequestration measures. Various proposals to delay, replace, or modify sequestration have been 34 See CBO, “Estimate of the Budgetary Effects of H.R. 8, the American Taxpayer Relief Act of 2012, as passed by the Senate on January 1, 2013,” January 1, 2013, available at http://www.cbo.gov/sites/default/files/cbofiles/attachments/American%20Taxpayer%20Relief%20Act.pdf. 35 BBEDCA (P.L. 99-177), §251(a)(1) states that “(w)ithin 15 calendar days after Congress adjourns to end a session, there shall be a sequestration to eliminate a budget-year breach, if any, within any category.” 36 The definition of the security and non-security categories is explained in more detail below. 37 Jeffrey D. Zients, Acting OMB Director, letter to President Barack Obama, March 27, 2013. 38 CBO, Budget and Economic Outlook, February 2013, Table 1-4, available at http://www.cbo.gov/sites/default/files/cbofiles/attachments/43907-BudgetOutlook.pdf. 39 For details, see CRS Report R42894, An Overview of the Tax Provisions in the American Taxpayer Relief Act of 2012 , by Margot L. Crandall-Hollick; CRS Report R42884, The “Fiscal Cliff” and the American Taxpayer Relief Act of 2012, coordinated by Mindy R. Levit. 40 CBO, Economic Effects of Policies Contributing to Fiscal Tightening in 2013, November 8, 2012; Alex Phillips, “And Now, on to the Fiscal Cliff,” Goldman Sachs Global Economics, Commodities and Strategy Research U.S. Daily, November 7, 2012. 41 CRS Report R42700, The “Fiscal Cliff”: Macroeconomic Consequences of Tax Increases and Spending Cuts, by Jane G. Gravelle.

Trends in Discretionary Spending
Congressional Research Service 9
put forth. The potential effects of defense and non-defense cuts have also been discussed in various committee hearings.42
The President’s FY2013 budget request essentially conformed to the original BCA caps, but argues that the January 2013 sequester and other backup enforcement measures should be cancelled because Administration proposals would achieve savings in other ways. In February 2013, President Obama called for avoiding sequestration by substituting tax increases and targeted spending cuts.43
The House-passed FY2013 budget resolution (H.Con.Res. 112; agreed to on March 29, 2012, on a 228-191 vote) called for the cancellation of the January 2013 sequester, conditional on achieving savings in domestic programs through reconciliation procedures.44 Such reconciliation procedures, however, would only come into play with the agreement of the Senate. On May 10, 2012, the House took another step to modify sequestration by passing the Sequester Replacement Reconciliation Act of 2012 (H.R. 5652; 218-199, 1 present). The measure, according to CBO’s analysis, would limit the effect of sequestration by an estimated $72.2 billion over the next 10 years, largely by protecting defense unobligated balances and certain non-defense advance appropriations.45 The measure would also reduce the cap on FY2013 discretionary spending by $19 billion, from its current level of $1,047 billion.
On December 19, House Majority Whip Eric Cantor introduced H.R. 6684, the Spending Reduction Act of 2012. That measure resembles H.R. 5652, except that a flood insurance title, which had been enacted separately, was omitted. In addition, certain effective dates were also changed.46 In the 113th Congress, Representative Ellison introduced one bill to avoid sequestration (H.R. 505) and Senator Whitehouse introduced two measures to replace the Budget Control Act (S. 277 and S. 278).
On the day before that sequester was issued, Congress considered other measures that would have modified or replaced it. The Senate considered S. 16, a sequester replacement bill introduced by Senator Inhofe, and S. 388, introduced by Senator Mikulski. Neither measure was passed. The budget resolution measure reported by the Senate Budget Committee (S.Con.Res. 8) on March 14, 2013, proposed replacing sequestration reduction with a mix of other spending reductions and revenue increases.
42 For example, see H.R. 3662, “Amending the Balanced Budget and Emergency Deficit Control Act,” December 14, 2011, available at http://armedservices.house.gov/index.cfm/files/serve?File_id=71803a67-5d45-4bfa-88b9-80c6f5b42d82k2. See also U.S. Congress, House Budget Committee, Hearing on the 2011 Budget Control Act and Potential Sequestration, 112th Cong., 2nd sess., April 25, 2012. Also see U.S. Congress, Senate Committee on Appropriations, The Impacts of Sequestration, 113th Cong., 1st sess., February 14, 2013 (documents available at http://www.appropriations.senate.gov/ht-full.cfm?method=hearings.view&id=17d3dc99-c065-4bec-a7c8-cfd374bf41a3); U.S. Congress, Senate Committee on Armed Services, Impacts of Sequestration and/or CR, 113th Cong., 1st sess., February 12, 2013 (documents available athttp://www.armed-services.senate.gov/hearings/event.cfm?eventid=75b85d4058863364782faf917d08a08a). 43 White House, Office of the Press Secretary, “Averting the Sequester and Finding a Balanced Approach to Deficit Reduction,” February 8, 2013; available at http://www.whitehouse.gov/the-press-office/2013/02/08/averting-sequester-and-finding-balanced-approach-deficit-reduction. 44 H.Con.Res. 112, §201, §202. 45 CBO, “Sequester Replacement Reconciliation Act,” Letter to Rep. David Drier, May 9, 2012, available at http://www.cbo.gov/publication/43234. 46 See “Summary of Changes between H.R. 6684 and H.R. 5652,” December 19, 2012, available at http://www.rules.house.gov/Media/file/PDF_112_2/PDF/HR6684SummChang.pdf.

Trends in Discretionary Spending
Congressional Research Service 10
Numerous other measures to replace or modify the BCA sequester were also introduced in both the 112th and 113th Congresses.
BCA Sequester Issued March 1, 2013 On March 1, 2013, the President signed a sequester order that cancelled $85 billion in budgetary resources, a measure triggered by the absence of a JSC (“Super Committee”) plan to reduce the federal deficit.47 Reductions were split equally between defense and non-defense categories.
Nearly all the defense reductions were taken in discretionary programs because less than a $1 billion in defense mandatory spending was sequestrable.48 The President chose to exempt Military Personnel accounts from sequestration, which required larger reductions in other defense accounts. Non-exempt defense discretionary accounts were reduced by 7.8% for a total reduction of $42.6 billion in budgetary resources. While war (Overseas Contingency Operations; OCO) funding was not subject to BCA caps, it was not exempted from sequestration. In addition, unobligated balances in defense accounts were also sequestered.
The sequester reduced non-defense discretionary program funding by 5.0%, which reflected a $25.8 billion reduction in budgetary resources.49 The remainder of non-defense reductions ($16.9 billion) was absorbed by non-defense mandatory programs. A 2% reduction in Medicare patient care accounted for most of the non-defense mandatory savings ($11.3 billion), while a 5.1% sequester was applied to other non-exempt mandatory programs, yielding another $5.5 billion in budgetary savings.
The Super Committee sequester will reduce federal outlays by considerably less than the total reduction applied to budgetary resources. This reflects the usual lag between reductions in budget authority and reductions in obligations and outlays, as well as the time agencies require to implement plans to reduce their spending. In addition, special budgetary rules delay the start of the sequester of Medicare patient care outlays by a month.50 CBO has estimated that the BCA sequester would reduce FY2013 outlays by $42 billion in FY2013.51
Full-Year Funding for FY2013 On March 6, 2013, the House passed a measure (H.R. 933) to fund the government for the remainder of FY2013 by a 267-151 vote. The measure provided detailed appropriations levels for Defense and Military Construction-Veterans’ programs. Other programs, with some exceptions, were funded near FY2012 levels before taking into account a series of across-the-board
47 See OMB, Report to the Congress on the Joint Committee Sequestration for Fiscal Year 2013, March 1, 2013, http://www.whitehouse.gov/sites/default/files/omb/assets/legislative_reports/fy13ombjcsequestrationreport.pdf. 48 Ibid., Table 2, p. 4. 49 Ibid., Table 3, pp. 6. 50 BBEDCA section 256. See CRS Report R42051, Budget Control Act: Potential Impact of Sequestration on Health Reform Spending, by C. Stephen Redhead. 51 CBO, letter to Senator Sessions, March 12, 2013, available at http://www.cbo.gov/sites/default/files/cbofiles/attachments/Sessions_Sequester_CR.pdf. Note that FY2013 outlays estimates may change to reflect details of the OMB sequestration order of March 1, 2013.

Trends in Discretionary Spending
Congressional Research Service 11
reductions.52 Spending reductions in the bill would not have affected the amount of reductions in spending made through the March 1, 2013 (JSC/Super Committee) sequester.53
On March 11, 2013, a substitute measure for H.R. 933 was posted on the Senate Committee on Appropriations website. According to Senate Appropriations Chair Barbara Mikulski, defense and military construction-veterans provisions of the substitute measure matched those in the House-passed H.R. 933.54 The measure would have provided more detailed spending adjustments in other areas.
Both H.R. 933 and the Senate alternative were scored as conforming with discretionary spending caps as revised by ATRA (totaling $1,043 billion for regular appropriations) and thus avoided a cap enforcement sequester.55 That scored total did not include war funding, emergency-designated spending, and program integrity funding.
The Senate passed an amended version of H.R. 933 by a 73-26 vote on March 20, 2013. The Senate version of H.R. 933 included detailed changes in spending levels for programs within the Agriculture, Commerce-Justice-Science, and Homeland Security areas, in addition to the changes in Defense, Military Construction-Veterans that the House measure had included. Most other programs received funding close to FY2012 levels. The House agreed to Senate changes the next day on a 318-109 vote. While some of the effects of sequestration were adjusted by reallocating spending reductions, the amount of the March 1 sequester cuts remained in place. The President signed the measure (P.L. 113-6) on March 26, 2013.
Long-Term Trends in Discretionary Spending
Discretionary Spending Now a Smaller Share of Federal Spending The composition of the federal budget has changed dramatically since the early 1960s. Figure 1 shows discretionary and mandatory spending and net interest payments since 1962 as a share of total outlays.56 Discretionary spending will thus have gone from comprising two-thirds of federal
52 H.R. 933, Sec. 1101 specifies an 0.16% across-the-board rescission the Department of the Interior, Environment, and Related Agencies; a 0.189% across-the-board rescission the Departments of Labor, Health and Human Services, and Education, and Related Agencies. In addition, a 0.109% rescission would apply to security programs (as defined in the BCA) and a 0.0098% rescission in non-security programs (Sec. 3001). 53 See H.R. 933, Sec. 3002. 54 Senator Barbara Mikulski, floor statement, March 12, 2013, text available at http://www.appropriations.senate.gov/news.cfm?method=news.view&id=5c19a6a3-4263-4cb6-99a6-38517e1cb00f. 55 For House version, see CBO, Total Discretionary Appropriations for FY2013, Including H.R. 933, the Department of Defense, Military Construction and Veterans Affairs, and Full‐Year Continuing Appropriations Act, 2013 as Introduced on March 4, 2013, and P.L. 113‐2, the Disaster Relief Appropriations Act, 2013, March 4, 2013, available at https://www.cbo.gov/sites/default/files/cbofiles/attachments/hr933.pdf. For Senate version, see CBO, Total Discretionary Appropriations for Fiscal Year 2013, Including the Consolidated and Continuing Appropriations Act, 2013 (an Amendment in the Nature of a Substitute to H.R. 933) as Posted on the Senate Committee on Appropriations Web Site on March 11, 2013 and Public Law 113‐2, the Disaster Relief Appropriations Act, 2013, March 12, 2013, available at https://www.cbo.gov/sites/default/files/cbofiles/attachments/hr933AmendmentintheNatureofaSubstitute.pdf. 56 These categories are defined in the Budget Enforcement Act (P.L. 101-508).

Trends in Discretionary Spending
Congressional Research Service 12
spending in FY1962 to under one-quarter (24%) of spending in FY2023, according to CBO baseline projections.57
Figure 1. Outlays by Category as a Percentage of Total Outlays FY1962-FY2018
Source: CRS calculations based on OMB FY2014 data.
Notes: FY2012 values estimated; FY2013-FY2018 values reflect President’s budget proposals.
Over time, discretionary spending as a share of the federal budget has fallen, while mandatory spending’s share has steadily increased. Discretionary spending accounted for 68% of total outlays in 1962, but only 36% of total outlays in 2012.58 Mandatory spending, by contrast, has risen from 26% of total outlays in 1962 to 57% in 2012. Net interest accounted for 6% of federal outlays in FY2012. Net interest costs, according to CBO baseline projections, are expected to rise
57 CBO, Budget and Economic Outlook, February 2013, Table 1-1, available at http://www.cbo.gov/sites/default/files/cbofiles/attachments/43907-BudgetOutlook.pdf. 58 Years in this report refer to federal fiscal years unless otherwise noted. Since 1977, federal fiscal years have started on October 1. Figures for FY1962-FY1968 from U.S. Office of Management and Budget, Budget for FY2013, Historical Tables, available at http://www.whitehouse.gov/omb/budget/Historicals/. Figures for FY1969 and beyond from the U.S. Congressional Budget Office, Historical Tables, available at http://www.cbo.gov/sites/default/files/cbofiles/attachments/HistoricalBudgetData.xls.

Trends in Discretionary Spending
Congressional Research Service 13
sharply to over 14% in FY2023 as interest rates return to more normal levels and the federal debt continues to expand.
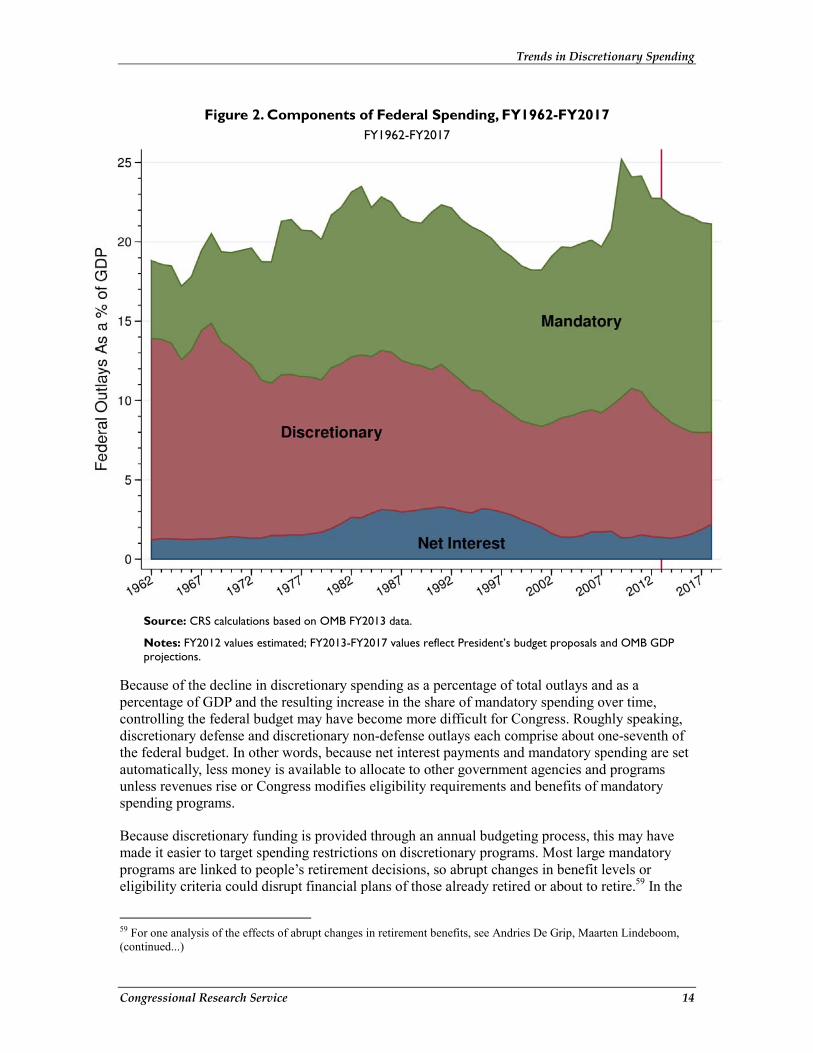
Discretionary Spending As a Share of GDP Trends in discretionary spending as a share of gross domestic product (GDP) provide another perspective on how the composition of federal outlays has changed. Measuring budget components as a share of GDP compares their size to the economy as a whole, and implicitly incorporates inflation and population growth. When GDP falls, however, the percentage of outlays to GDP tends to rise. Figure 2 shows components of federal spending as a percentage of GDP since 1962.
Total federal outlays as a share of GDP peaked in 2009 as a result of the current economic situation and federal interventions. While discretionary outlays declined as a percentage of total outlays in 2009, they rose as a percentage of GDP because the economy shrank in 2008 and early 2009. Since 2010, discretionary outlays have been falling, both in current dollar terms and as a percentage of GDP.
If caps on discretionary spending remain in place, discretionary spending will continue to fall as a share of GDP. CBO projects that under current law, discretionary spending will fall to 5.5% of GDP by FY2023, about half a percentage point below levels it reached in the late 1990s.
Trends in Discretionary Spending
Congressional Research Service 14
Figure 2. Components of Federal Spending, FY1962-FY2017 FY1962-FY2017
Source: CRS calculations based on OMB FY2013 data.
Notes: FY2012 values estimated; FY2013-FY2017 values reflect President’s budget proposals and OMB GDP projections.
Because of the decline in discretionary spending as a percentage of total outlays and as a percentage of GDP and the resulting increase in the share of mandatory spending over time, controlling the federal budget may have become more difficult for Congress. Roughly speaking, discretionary defense and discretionary non-defense outlays each comprise about one-seventh of the federal budget. In other words, because net interest payments and mandatory spending are set automatically, less money is available to allocate to other government agencies and programs unless revenues rise or Congress modifies eligibility requirements and benefits of mandatory spending programs.
Because discretionary funding is provided through an annual budgeting process, this may have made it easier to target spending restrictions on discretionary programs. Most large mandatory programs are linked to people’s retirement decisions, so abrupt changes in benefit levels or eligibility criteria could disrupt financial plans of those already retired or about to retire.59 In the
59 For one analysis of the effects of abrupt changes in retirement benefits, see Andries De Grip, Maarten Lindeboom, (continued...)

Trends in Discretionary Spending
Congressional Research Service 15
past, mandatory programs such as Social Security and Medicare have enjoyed broad bipartisan support. Those considerations may complicate efforts to reduce funding for mandatory programs.
Costs linked to the retirement of the baby-boom generation, born in the years following World War II, are a major cause of rising mandatory spending. As the U.S. population has aged, the composition of federal outlays has evolved to reflect needs of the elderly. On the other hand, the current trajectory of federal spending on health care appears unsustainable, and could place heavy fiscal burdens on younger generations and generations not yet born.60
Discretionary Spending and National Priorities Discretionary spending can be categorized in several different ways. These divisions provide a rough indicator of national priorities as reflected in federal spending decisions. Some of these categories play or have played a role in budget enforcement mechanisms.
Defense and Non-Defense Spending One basic division of discretionary spending separates defense programs (budget function 050) from non-defense programs (everything else). Discretionary spending caps now in place due to the Budget Control Act set separate limits for base budget defense funding and non-defense funding. Defense spending is often divided between base budget and war spending, which supports activities within Overseas Contingency Operations (OCO) or Global War on Terror (GWOT).61 Figure 3 shows trends in discretionary defense and non-defense BA in real (i.e., inflation-adjusted) terms since FY1977.62 Spending trends can also be measured as shares of GDP, which reflects how federal spending compares with the size of the economy.
(...continued) and Raymond M. Montizaan, “Shattered Dreams: The Effects of Changing the Pension System Late in the Game,” Economic Journal, vol. 122, pp. 1-25, 2012. 60 For additional discussion, see CRS Report RL33623, Long-Term Measures of Fiscal Imbalance, by D. Andrew Austin. 61 For details, see CRS Report RL33110, The Cost of Iraq, Afghanistan, and Other Global War on Terror Operations Since 9/11, by Amy Belasco. 62 Inflation adjustments calculated using GDP price index. Prices for some categories of goods and services purchased by the government, such as health care, tend to rise faster than the overall price level. Maintaining current levels of government services will require funding levels that increase faster than the overall price level, as measured by the GDP price index. Figure does not reflect changes in ATRA (FY2013 caps reduced by $4 billion, FY2014 caps reduced by $8 billion) or the supplemental funding (P.L. 113‐2) for disaster relief for damage caused by Hurricane Sandy (scored at $41.7 billion in emergency-designated budget authority). See discussion about of FY2013 full-year funding measures for budget scoring information.

Trends in Discretionary Spending
CRS-16
Figure 3. Defense and Non-Defense Discretionary Spending, FY1977-FY2021 In Billions of FY2012 Dollars of Budget Authority
Source: CRS calculations based on CBO and OMB FY2013 historical budget data. See “An Update to the Budget and Economic Outlook: FY2012 to FY2022, August 2012, available at http://www.cbo.gov/sites/default/files/cbofiles/attachments/43539-08-22-2012-Update_One-Col.pdf. OMB data are available at http://www.whitehouse.gov/omb/budget/Supplemental/. Estimates of war costs taken from CRS Report RL33110, The Cost of Iraq, Afghanistan, and Other Global War on Terror Operations Since 9/11, by Amy Belasco. Figure does not reflect changes in ATRA or Sandy supplemental (P.L. 113‐2).
0
50
100
150
200
250
300
350
400
450
500
550
600
650
700
750
800
850
1977
1979
1981
1983
1985
1987
1989
1991
1993
1995
1997
1999
2001
2003
2005
2007
2009
2011
2013
2015
2017
2019
2021
USSR invades
Afghanistan
GRH enacted
dot-com boom
USSR dissolves
Berlin Wall opens
BEA expires
BEA enacted
Recovery Act
(ARRA)
Recession beginsHurricane
Katrina
Defense Base Budget
Non-Defense Budget
FY11 Extrapolated
FY13Seq./Lowered Caps
Defense w/WarIraq war
starts
Afghan war
starts
9/11 attacks
HISTORICAL PROJECTIONS

Trends in Discretionary Spending
Congressional Research Service 17
Figure 4 shows trends in base defense and non-defense discretionary BA as a share of GDP over the period 1969-2017. BA as a percentage of GDP reflects changes in population and growth in per-capita income, which may affect the costs of federal programs. How population changes affect federal spending may also depend on whether specific governmental services are subject to scale economies. For instance, a 10% increase in population might require resources devoted to individual health care services to rise by 10% in order to maintain the same level of service, other things equal. For many governmental services, one might expect to find substantial scale economies. For example, an increase in population would likely not be expected to raise the costs of information-generating activities, such as medical and scientific research, or national defense activities.
Figure 4. Discretionary Budget Authority as % of GDP FY1977-FY2012
2%
3%
4%
5%
6%
7%
8%
1977
1979
1981
1983
1985
1987
1989
1991
1993
1995
1997
1999
2001
2003
2005
2007
2009
2011
2013
2015
2017
2019
2021
FY13 Seq/ Lowered Caps
HISTORICAL PROJECTIONS
Defense Base
Non-Defense Historical
Source: CRS analysis of OMB historical data and March 2012 CBO data.
Notes: Defense is base discretionary funding within function 050; all other budget functions are defined as non-defense discretionary spending. FY2013-FY2021 reflect January 2013 sequester and later lowered caps. Estimates of war costs, which were subtracted, are taken from CRS Report RL33110, The Cost of Iraq, Afghanistan, and Other Global War on Terror Operations Since 9/11, by Amy Belasco.
The Reagan Administration when it took office in 1981 sought to increase defense spending and reduce spending on domestic programs.63 Budget enforcement measures were introduced in the
63 For an account written by President Reagan’s first budget director, see David A. Stockman, The Triumph of Politics, (New York: Harper & Row, 1986).

Trends in Discretionary Spending
Congressional Research Service 18
mid-1980s to control rising federal deficits. In 1985, the Gramm-Rudman-Hollings (GRH) deficit control legislation and subsequent measures were enacted with the aim of constraining federal spending. In 1990, the Budget Enforcement Act (BEA; P.L. 101-508) set statutory caps on discretionary spending and imposed other budgetary enforcement mechanisms, which many analysts view as having helped constrain federal spending, increase federal revenues, and thus, reduce deficits. In the decade after the attacks of September 11, 2001, however, both defense and non-defense discretionary spending rose in real terms. Trends in defense and non-defense spending are discussed in more detail below.
Discretionary Defense Spending
Base budget defense spending in real terms has risen and fallen to reflect national security challenges and changes in policy priorities.64 Defense spending increased sharply in the mid-1960s as the United States’ involvement in Vietnam deepened. After large-scale withdrawals of American troops from Vietnam began in 1969, defense spending as a share of GDP fell for the next decade. In the mid-1970s, when the United States took a less confrontational diplomatic stance towards the Soviet Union, termed détente, defense spending grew modestly. The Soviet invasion of Afghanistan in 1979, however, prompted the Carter Administration, and then the Reagan Administration during the early 1980s to boost military expenditures. By the mid-1980s, however, concerns about large deficits helped constrain defense spending. After the fall of most European communist regimes in 1989 and the dissolution of the Soviet Union in 1991, defense spending declined. Costs of the first Iraq War (1990-1991) were shouldered by U.S. coalition partners.65
After the attacks of September 11, 2001, defense spending rose sharply as the United States began military operations in Afghanistan, but also included dramatic increases in non-war or base budget funding. War in Iraq, which began in 2003, amplified demands for higher defense spending. War costs have fallen since the drawdown of troops participating in the 2007 surge of forces in Iraq and the withdrawal of combat troops from Iraq at the end of calendar 2011. Further reductions in war costs are expected as troops are withdrawn from Afghanistan.66 Decisions about major procurement programs and possible changes in Budget Control Act budget enforcement mechanisms could also affect trends in defense spending.
Ups and downs in defense spending have primarily reflected changes in investment funding for modernization of weapon systems and support equipment, and conducting Research, Development, Test & Evaluation (RDT&E) on new systems.67 Defense investment typically grows when support for defense spending is high, such as in wartime or the early 1980s, and then falls as support dips and other issues become more pressing, with peaks in investment offsetting later valleys. Trends in base defense spending over the past decade may not reflect the full extent of the growth in defense costs, because it does not include about $300 billion in war-related investment in weapon systems, which will likely remain in the inventory for many years to come.
64 This section draws upon contributions from Amy Belasco, CRS Specialist in U.S. Defense Policy and Budget. 65 See CRS Report RS22926, Costs of Major U.S. Wars, by Stephen Daggett, Table 1, note b. 66 For details, see CRS Report RL33110, The Cost of Iraq, Afghanistan, and Other Global War on Terror Operations Since 9/11, by Amy Belasco; and CRS Report R40682, Troop Levels in the Afghan and Iraq Wars, FY2001-FY2012: Cost and Other Potential Issues, by Amy Belasco. 67See Figure 1 in CRS Report R42334, A Historical Perspective on “Hollow Forces,” by Andrew Feickert and Stephen Daggett.
Trends in Discretionary Spending
Congressional Research Service 19
By contrast, wartime operating costs, such as training and support of personnel, do not contribute to modernization.
Defense Spending as a Percentage of GDP
Discretionary defense spending accounts for a much smaller share of GDP in recent years than during World War II, the Korean War, or the Vietnam war.68 At the height of the Vietnam War in FY1969, defense outlays were 8.7% of GDP. Moreover, with compulsory military service, which was in effect until 1973, the budgetary costs of war understated the full economic costs of national defense, because many draftees were prevented from pursuing other opportunities.69
As noted above, defense spending fell during the 1970s, rose rapidly following the Soviet invasion of Afghanistan, and fell after the collapse of most of the USSR’s Warsaw Pact allied governments in 1989 and the dissolution of the USSR itself in 1991. Discretionary defense outlays, which had fallen to 3.0% of GDP by the late 1990s, rose sharply to 4.0% of GDP in 2005, and reached 4.7% of GDP in 2011, divided between 3.6% for the base defense budget and 1.1% for war funding (Overseas Contingency Operations; OCO).
Increased defense outlays accounted for 53% of the real increase in total discretionary outlays over the decade of 2000-2010, rising 6.8% per year on average in real terms.70
How Much Defense Spending Is Appropriate?
The appropriate size of the defense budget has long been a lively topic of debate. In 2007, General Mike Mullen, then chairman of the Joint Chiefs of Staff, said that he considered 4% of GDP “an absolute floor” for future defense spending.71 Some analysts have expressed some doubts about the sustainability of current defense budget plans.72 Others contend that defense expenditures as a proportion of GDP should fall over the long term because the cost of defending the nation depends on factors that are largely independent of economic growth. Geopolitical challenges, wars, major procurement programs, and changes in national spending priorities have spurred swings in defense spending in past decades.
Former Secretary of Defense Robert Gates called for cost-cutting measures within the Department of Defense (DOD), although the stated aim is not to reduce the Department’s top-line budget number.73 Secretary of Defense Leon Panetta has raised concerns that cuts required by the 68 See Table 1 in CRS Report RS22926, Costs of Major U.S. Wars, by Stephen Daggett. 69 RAND, The Evolution of the All-Volunteer Force, issue brief, 2006; available at http://www.rand.org/content/dam/rand/pubs/research_briefs/2006/RAND_RB9195.pdf. For an analysis of the full economic costs of the draft, see Walter Oi, “The Economic Cost of the Draft,” American Economic Review vol. 27, no. 2 (1967), pp. 39-62. 70 Defense discretionary spending includes enacted supplemental requests. OMB, Budget for Fiscal Year 2011, Historical Tables, Table 8.2, available at http://www.whitehouse.gov/omb/budget/Historicals/. 2010 spending includes proposed $41.1 billion supplemental appropriation. 71 New York Times, October 22, 2007. Transcript available at http://www.nytimes.com/2007/10/22/washington/22mullen-text.html. 72 Testimony of CBO Assistant Director J. Michael Gilmore, in U.S. Congress, House Budget Committee, The 2009 Future Years Defense Program: Implications and Alternatives, hearings, 111th Cong., 1st sess., February 4, 2009; Testimony of CRS Specialist in Defense Policy and Budgets Stephen Daggett, in U.S. Congress, House Budget Committee, Sustainability of Current Defense Plans, hearings, 111th Cong., 1st sess., February 4, 2009. 73 U.S. Secretary of Defense, Memorandum for Secretaries of the Military Departments, OSD 09637-10, August 16, (continued...)

Trends in Discretionary Spending
Congressional Research Service 20
Budget Control Act could have serious effects.74 On the other hand, the Budget Control Act would have brought discretionary base defense spending in inflation-adjusted terms back to its FY2007 level. With modifications made in the American Taxpayer Relief Act of 2012 (see above), real discretionary base defense spending after sequestration would revert to a level between its FY2007 and FY2008 levels.
In early 2013, DOD leaders have issued guidance on budget strategies to handle uncertainties raised by sequestration and the FY2013 continuing resolution (P.L. 112-175) that provides funding through March 27.75 DOD budget guidance includes protection of war operations and programs associated with new strategic priorities; reduction of administrative and civilian personnel costs; and deferring less critical maintenance. Some analysts argue that budgetary constraints may require a larger reconsideration of strategic goals of DOD.76
Non-Defense Discretionary Spending
Non-defense spending supports the largest number of federal agencies and programs, including science and technology research, natural resources, energy, education, and numerous others. None of the individual programs within the non-defense discretionary category have approached 1% of GDP since 1962, and funding for most of these programs was less than 0.5% of GDP during that period.
Non-defense discretionary spending has typically ranged between 3% and 4% of GDP. In 1969, during the Vietnam War, non-defense spending was 3.2% of GDP. After rising to a peak of 4.8% in 1978, non-defense discretionary spending’s share of GDP fell during the Reagan Administration, reaching 3.1% of GDP in 1987.77 Since then it has fluctuated between 3.0% and 3.6% of GDP.78 Non-defense discretionary spending in 2009 spiked to 5.7% of GDP, before falling to 3.5% of GDP in 2012. According to CBO current-law projections, non-defense discretionary spending will fall to 2.8% in 2023.79
(...continued) 2010. 74 Secretary of Defense, Leon Panetta, “Letter to Senator McCain and Senator Lindsey Graham,” November 14, 2011; http://www.politico.com/static/PPM205_11_14_11_panetta_respsonse_to_mccain_graham_ltr.html (sic). 75 Deputy Secretary of Defense Ashton B. Carter, Memorandum on Handling Budgetary Uncertainty in Fiscal Year 2013, January 10, 2013. 76 Michael O’Hanlon, “What Cutting Defense Really Means,” Wall Street Journal, January 30, 2013, p. A13. See also Gordon Adams, “Behind the Rhetoric: The Pentagon Starts to Manage the Defense Drawdown,” Foreign Policy, January 15, 2013, available at http://www.foreignpolicy.com/articles/2013/01/15/behind_the_rhetoric. 77 For one view of the federal budget during the first years of the Reagan Administration, see David Stockman, The Triumph of Politics (New York: Harper&Row, 1986), pp. 401-411. 78 In FY2000, discretionary non-defense spending was 2.9% of GDP. 79 CBO, Budget and Economic Outlook, February 2013, Table 1-5, available at http://www.cbo.gov/sites/default/files/cbofiles/attachments/43907-BudgetOutlook.pdf.

Trends in Discretionary Spending
Congressional Research Service 21
International Discretionary Spending
Some discretionary spending constraints in the 1980s and 1990s set separate caps for defense, domestic, and international (budget function 150) spending.80 Demands for funding international programs have varied dramatically with changing geopolitical conditions.
In the past decade, international spending (budget function 150) has been strong affected by wars in Afghanistan and Iraq. Discretionary spending for international programs since 1969 has averaged 0.3% of GDP, reaching its peak of 0.5% of GDP in 1975. Since that time, international spending has generally trended downward until the start of the Iraq war in 2003. Between 2001 and 2010, spending on international programs rose from 0.2% of GDP to 0.3% of GDP. The majority of the funding in this category in recent times has been devoted to diplomatic missions, foreign aid, and international finance. The future trajectory of international funding may depend on how the role of the United States evolves in Iraq, Afghanistan, and in neighboring countries.
Discretionary Security and Non-Security Spending The G. W. Bush and Obama Administrations have each created their own division of security and non-security discretionary spending as a way of communicating their budgetary priorities. The Obama and Bush Administration budgets have presented summaries of discretionary funding that split out security spending from non-security spending.81 Unlike the division of discretionary spending into the categories of domestic, international, and defense, which has become routine in budget analyses, several ways of dividing security spending from non-security spending have been used. In particular, the G. W. Bush and Obama Administration definitions vary in significant ways.
The Budget Control Act of 2011 includes two definitions of security spending: an original definition (explained below) and a revised definition corresponding to the national defense budget function (050) and non-defense (all other programs).82 These BCA security categories set up “firewalls” to ensure that reductions in security spending cannot be used to fund increases in non-security spending, and vice versa.
What Is “Homeland Security” or “Security” Spending?
Any division of spending into security and non-security components would likely present conceptual and practical difficulties.83 Moreover, the widely used term “homeland security,” which comprises some but not all non-defense security spending, does not already readily
80 For instance, the Budget Enforcement Act of 1990 (P.L. 101-508) set separate caps on defense, domestic, and international spending through 1993, with caps on total spending for later years. 81 For details, see U.S. Office of Management and Budget, Budget of the U.S. Government, FY2009, Tables S-2 and S-4, and the “Homeland Security Funding Analysis” chapter in the Analytic Perspectives volume. In circular A-11, OMB defines federal homeland security activities as those that “focus on combating and protecting against terrorism, and that occur within the United States and its territories or outside of the United States and its territories if they support domestically-based systems or activities. Such activities include efforts to detect, deter, protect against, and, if needed, respond to terrorist attacks.” 82 BCA limits also include separate cap adjustments for program integrity and disaster assistance. 83 For a discussion of defining security or homeland security, see U.S. Congressional Budget Office, “Federal Funding for Homeland Security: An Update,” Economic and Budget Issue Brief, July 20, 2005.

Trends in Discretionary Spending
Congressional Research Service 22
translate in budgetary categories.84 Figure 5 provides a schematic view of the relationship between defense spending (budget function 050) and security spending as defined in the Budget Control Act. That definition nearly coincides with the security definition used by the Obama Administration. The Obama Administration has defined security spending as funding for
• Department of Defense-Military;
• Department of Energy’s National Nuclear Security Administration;
• International Affairs (function 150; includes State Department and U.S. AID);85
• Department of Homeland Security; and
• Department of Veterans Affairs.86
The Budget Control Act of 2011 (BCA), in addition to items on that list, includes the Intelligence Community Management Account, which is far smaller than the other items. The BCA “revised security” category for discretionary spending, as noted above, is national defense (budget function 050) and non-defense (everything else).
Activities within budget subfunction 053 (Atomic Energy Defense Activities), aside from the National Nuclear Security Administration (NNSA) by this definition are classed as non-security. While the G. W. Bush Administration defined parts of the Department of Homeland Security within its “security” classification, the Obama Administration includes all of that department’s funding.
The G. W. Bush Administration defined security funding as spending on the “Department of Defense, Homeland Security activities Government-wide; and International Affairs.”87 The Obama Administration includes funding for the Department of Veterans Affairs and excludes Justice Department agencies such as the Federal Bureau of Investigation (FBI) under its security rubric, while the Bush Administration’s definition included the FBI and other law enforcement bureaus and excluded the Department of Veterans Affairs.
Most homeland security spending, by either definition, takes place in the Department of Defense, the Department of Homeland Security, and the Department of Energy. Many other federal agencies spend at least some portion of their budget on what are arguably homeland security tasks, so that a significant amount of homeland security spending takes place in agencies and programs whose primary focus is not security oriented. Some federal activities, such as Coast Guard patrols and research at the Centers for Disease Control and Prevention, advance interests clearly linked to security objectives as well as those which are not. Moreover, some federal programs tasked with non-security aims in normal times may respond to specific homeland security challenges. These issues complicate budgetary analyses of homeland security spending.
84 CRS Report R42462, Defining Homeland Security: Analysis and Congressional Considerations, by Shawn Reese. 85 U.S. Agency for International Development. 86 See notes to U.S. Office of Management and Budget, Budget of the U.S. Government, FY2013, Tables S-11. 87 U.S. Office of Management and Budget, Budget of the U.S. Government, FY2009, Table S-2.

CRS-23
Figure 5. How Defense and Security Intersect: A Schematic View
Source: OMB, Dept. of Defense, CRS. See text for explanations.
Trends in Discretionary Spending
Congressional Research Service 24
The President’s budget submission must report homeland security spending.88 This definition, drawn more narrowly than “security,” can exclude some DOD activities not closely tied to security concerns, such as military bands, while including certain non-DOD activities such as National Institutes of Health research on countermeasures against chemical or biological weapons. OMB’s security spending estimates are based on reports from 32 agencies with homeland security responsibilities. Those agencies provide OMB with budget reports that provide a level of detail unavailable in publicly available data.
Trends in “Security” and “Non-Security” Discretionary Spending
Figure 6 shows trends in discretionary spending, divided into defense, non-defense security, and non-security categories in terms of budget authority, while Figure 7 shows the same categories in terms of outlays. Because budget authority can translate into outlays that stretch over several years, changes in outlays tend to be more gradual. For example, a spike in non-defense security spending for 2005, reflecting disaster spending following Hurricane Katrina and other catastrophic events, appears in the budget authority figure, but not in the outlays figure. Similarly, the spending spike reflecting Recovery Act spending is narrower for BA than for outlays.
Trends in non-defense security spending can also be decomposed to show how its components have changed over time. Figure 8 shows outlays for non-defense security spending programs since 1976.89
Various non-defense security programs have been affected by a wide range of policy developments. International program spending fell in the 1980s and 1990s, but increased sharply after the events of September 11, 2001. Spending on federal operations now contained within DHS also increased dramatically after that date. The costs of discretionary veterans’ programs also has risen rapidly in the past decade, although more driven by the aging of Korean War and Vietnam War era veterans and expanded access to VA medical care. Only a small part of the increase in VA discretionary costs is due to the costs of treating veterans from the wars in Afghanistan and Iraq.90
88 The Homeland Security Act of 2002 (P.L. 107-296) requires this report, which supersedes a report on anti-terrorism activities mandated by the National Defense Authorization Act of 1998 (P.L. 105-85). An appendix (Homeland Security Mission Funding by Agency and Budget Account) is contained in the FY2013 Budget, Analytical Perspectives volume, available at http://www.whitehouse.gov/sites/default/files/omb/budget/fy2013/assets/homeland_supp.pdf. 89 Funding levels prior to the establishment of Department of Homeland Security (DHS) and National Nuclear Security Administration (NNSA) shown in Figure 7 reflect imputations calculated by OMB or the author. Congress established the DHS in 2003 (P.L. 107-296), which combined dozens of security-related offices under one agency, including the Transportation Security Agency (TSA) to monitor airport security, a new high priority after the 9/11 attacks. DHS began operating on March 1, 2003. The NNSA, which handles nuclear weapon programs within the Energy Department, was established in the FY2000 National Defense Authorization Act (P.L. 106-65, Title XXXII). 90 Department of Veterans Affairs, “FY2012 Budget Rollout,” February 14, 2011.

Trends in Discretionary Spending
Congressional Research Service 25
Figure 6. Discretionary Budget Authority by Security Category FY1976-FY2018, as a Percentage of GDP
Source: CRS analysis of OMB and BEA data.
Notes: The security category reflects BCA original definition, except that war funding (OCO) is included. Defense here includes Dept. of Defense-Military spending. Non-defense security includes Dept. of Energy’s National Nuclear Security Admin., International Affairs (function 150), Dept. of Homeland Security and Dept. of Veterans Affairs, and Intelligence Community Management account. FY2012 values estimated; FY2013-FY2018 levels requested by the President. Historical data reflects certain OMB imputations.
Figure 7. Discretionary Outlays by Security FY1976-FY2018, as a Percentage of GDP
Source: OMB and BEA.
Note: See notes for Figure 6.

Trends in Discretionary Spending
Congressional Research Service 26
Figure 8. Non-Defense Security Outlays by Component BCA Definition; as a Percentage of GDP, FY1976-FY2018
Source: CRS analysis of OMB data.
Notes: Dept. of Defense-Military is budget function 051; NNSA is the Dept. of Energy’s National Nuclear Security Administration; International Affairs are function 150; DHS is the Dept. of Homeland Security. FY2013 values estimated; FY2014-FY2018 are President’s requested levels.
Discretionary Spending by Functional Category Federal activities are classified among budget functions. Analyzing trends by budget function provides a more detailed view of how federal spending has evolved. Figure 9 shows average annual changes in discretionary spending for the last three decades and for FY2011-FY2017.91
Spending in some policy areas, such as community and regional development, agriculture, natural resources and environment, and general government, has grown very slowly or has been cut. Spending in other areas, such as war costs, veterans’ programs, international affairs, and Medicare administration, has expanded rapidly in the last decade.92 Unless this trend is restrained or reversed, security-related non-defense spending could displace funding for other non-defense programs. Similarly, protecting non-defense programs that have benefited from broad bipartisan support could lead to deeper reductions in less prominent programs.
91 Spending levels for FY2013-FY2017 reflect the Administration’s FY2013 budget proposals. 92 For a more detailed analysis of spending trends, see CRS Report R41726, Discretionary Budget Authority by Subfunction: An Overview, by D. Andrew Austin.

Trends in Discretionary Spending
Congressional Research Service 27
Figure 9. Average Growth Rates for Discretionary BA by Subfunction Average Annual Percentage Change by Decade and for FY2011-FY2017
-9% -6% -3% 0% 3% 6% 9%
Defense Base budget
Intl. affairs
Gen. science, space, & tech
Energy
Natural resources & environment
Agriculture
Commerce & housing credit
Transportation
Community & regional dev.
Educ., training, empl. & soc. services
Health
Medicare
Income security
Social security
Veterans benefits & services
Admin. of justice
Gen. government
1981-19911991-20012001-20112011-2017
Source: CRS calculations based on FY2013 OMB data and projections.
Notes: Values for FY2011-FY2017 incorporate OMB projections that presume the Administration’s proposals for FY2013-FY2017 are adopted. The Administration proposes modifications to BCA as part of a package of budgetary changes. All years are fiscal years. The budgetary treatment of federal credit programs changed in 1990, affects comparisons of programs that include loans and loan guarantees. See CRS Report R42632, Budgetary Treatment of Federal Credit (Direct Loans and Loan Guarantees): Concepts, History, and Issues for the 112th Congress, by James M. Bickley. Budget function data were designed to reflect funding for policy objectives across various agencies. For example, the Department of Homeland Security includes programs that fall within many budget functions, including Transportation, Administration of Justice, Community and Regional Development.
Trends in Discretionary Spending
Congressional Research Service 28
Conclusion: Is the Declining Share of Discretionary Spending a Problem? While discretionary spending, which chiefly funds the operations of federal agencies, accounts for about two-sevenths of federal outlays, it has been at the center of efforts to restrain federal spending. In addition, long-term trends—to large extent baby-boom demographics and health care costs—have helped tilt federal spending towards mandatory programs.
Under current law, discretionary spending is projected to shrink to 24% of federal outlays by FY2013.93 In that year, discretionary spending is projected at $1.4 trillion (current dollars), while the deficit is projected to total about $1 trillion. Closing the gap between federal spending and receipts through reductions in discretionary spending, therefore, may be difficult.
The shift toward mandatory spending and away from discretionary spending may raise concerns for two reasons. First, as the portion of the federal budget controlled on a year-by-year basis shrinks, making adjustments in spending levels may become more difficult. Mandatory spending, which requires changes in authorizing legislation, is not normally considered on an annual basis. Moreover, existing budget enforcement mechanisms are largely designed to constrain discretionary spending, while measures that can be used to reduce mandatory spending have been more difficult to apply in recent years.
Second, the rise of mandatory programs’ share of federal spending reflects an aging population. Policymakers may choose to adapt the structure of the federal budget to reflect the needs of a growing segment of retired or elderly Americans. Such shifts in resource allocation, however, could affect intergenerational equity and the federal government’s ability to respond to the needs of future generations.
93 CBO, Budget and Economic Outlook, February 2013, Table 1-1, available at http://www.cbo.gov/sites/default/files/cbofiles/attachments/43907-BudgetOutlook.pdf.

Trends in Discretionary Spending
Congressional Research Service 29
Appendix. Defense and Non-Defense Spending, FY1977-FY2012 Table A-1 shows National Defense (budget function 050) and Non-Defense (all other) spending (BA) in current dollars and in constant FY2012 dollars (i.e., adjusted for inflation). These figures exclude funding for the Iraq and Afghan wars and related activities.
Table A-1. National Defense and Non-Defense Spending, FY1977-FY2012
National Defense without Afghan and Iraq Wars Non-Defense without Afghan and Iraq Wars
In Billions of Dollars of Budget Authority In Billions of Dollars of Budget Authority
Fiscal Year In Current $ In $FY2012 Fiscal Year In Current $ In $FY2012
1977 110.4 340.6 1977 136.5 421.1
1978 117.3 339.3 1978 142.6 412.3
1979 126.9 339.5 1979 149.1 399.0
1980 144.5 355.3 1980 166.7 409.9
1981 180.4 403.8 1981 160.5 359.2
1982 217.2 454.9 1982 138.4 289.9
1983 245.0 491.6 1983 143.3 287.6
1984 265.6 513.9 1984 158.1 305.8
1985 294.9 552.6 1985 161.7 303.1
1986 289.6 530.5 1986 148.3 271.6
1987 288.0 513.7 1987 157.8 281.5
1988 292.5 505.6 1988 160.8 277.9
1989 300.1 499.3 1989 171.0 284.6
1990 303.9 487.8 1990 192.8 309.4
1991 332.2 513.7 1991 213.9 330.7
1992 299.1 450.8 1992 232.3 350.1
1993 276.1 407.2 1993 247.2 364.5
1994 262.2 378.7 1994 250.3 361.5
1995 262.9 371.8 1995 238.5 337.3
1996 265.2 367.9 1996 235.8 327.1
1997 266.2 362.7 1997 245.0 333.7
1998 272.4 366.4 1998 257.2 346.0
1999 288.3 382.8 1999 293.5 389.7
2000 300.8 391.5 2000 283.6 369.2
2001 313.4 398.6 2001 332.1 422.4
2002 346.2 433.1 2002 373.1 466.9
2003 377.6 463.0 2003 390.7 479.1
2004 413.3 494.2 2004 401.1 479.6
2005 397.2 460.1 2005 482.7 559.0
2006 439.7 492.5 2006 435.5 487.8
2007 457.5 497.7 2007 443.9 482.8

Trends in Discretionary Spending
Congressional Research Service 30
National Defense without Afghan and Iraq Wars Non-Defense without Afghan and Iraq Wars
In Billions of Dollars of Budget Authority In Billions of Dollars of Budget Authority
Fiscal Year In Current $ In $FY2012 Fiscal Year In Current $ In $FY2012
2008 506.7 538.8 2008 487.3 518.2
2009 546.7 573.0 2009 790.2 828.2
2010 551.9 573.3 2010 538.0 558.7
2011 552.2 562.2 2011 498.0 507.2
2012 554.3 554.3 2012 489.0 489.0
Sources: OMB and CBO.
Notes: Deflated with OMB’s GDP price index. War funding estimates from CRS Report RL33110, The Cost of Iraq, Afghanistan, and Other Global War on Terror Operations Since 9/11, by Amy Belasco.
Author Contact Information D. Andrew Austin Analyst in Economic Policy [email protected], 7-6552