trend following analytics - pearsoncmg.comptgmedia.pearsoncmg.com/images/9780131875647/sam… ·...
TRANSCRIPT


Trend Following Analytics
Performance Proof for the World’s Most Controversial & Successful Black Swan Trading Strategy
Michael W. Covel

Vice President, Publisher: Tim MooreAssociate Publisher and Director of Marketing: Amy NeidlingerExecutive Editor: Jim BoydEditorial Assistant: Pamela BolandOperations Manager: Jodi KemperMarketing Manager: Megan GraueCover Designer: Chuti PrasertsithManaging Editor: Kristy HartProject Editor: Betsy HarrisCopy Editor: Paula LowellCompositor: Brad ChinnManufacturing Buyer: Dan Uhrig
© 2013 by Pearson Education, Inc.Publishing as FT PressUpper Saddle River, New Jersey 07458
This book is sold with the understanding that neither the author nor the pub-lisher is engaged in rendering legal, accounting, or other professional services or advice by publishing this book. Each individual situation is unique. Thus, if legal or financial advice or other expert assistance is required in a specific situ-ation, the services of a competent professional should be sought to ensure that the situation has been evaluated carefully and appropriately. The author and the publisher disclaim any liability, loss, or risk resulting directly or indirectly, from the use or application of any of the contents of this book.
FT Press offers excellent discounts on this book when ordered in quantity for bulk purchases or special sales. For more information, please contact U.S. Corporate and Government Sales, 1-800-382-3419, [email protected]. For sales outside the U.S., please contact International Sales at [email protected].
Company and product names mentioned herein are the trademarks or registered trade-marks of their respective owners.
All rights reserved. No part of this book may be reproduced, in any form or by any means, without permission in writing from the publisher.
ISBN-10: 0-13-187564-7ISBN-13: 978-0-13-187564-7
Pearson Education LTD.Pearson Education Australia PTY, Limited.Pearson Education Singapore, Pte. Ltd.Pearson Education Asia, Ltd.Pearson Education Canada, Ltd.Pearson Educación de Mexico, S.A. de C.V.Pearson Education—JapanPearson Education Malaysia, Pte. Ltd.

AcknowledgementsSpecial thanks for their efforts and contributions: Michelle Sanks; Altegris Advisors; Barchart.com; dshort.com; DUNN Capital Management, LLC; IASG; and ISAM Management.

This page intentionally left blank
I . Professional Trend Following Performance Track Records by IASG3D Capital Management, LLC—Blend Program—ClientAbraham Investment Management—Diversified Trading Program (Proprietary)Abraham Investment Management—Global Diversified Trading (Proprietary) Abraham Trading Company—Diversified ProgramACE Investment Strategists—Energy Sector Hybrid Approach (ESHA)ACE Investment Strategists—Multi-Market Hybrid Approach (MMHA)Adalpha Asset Management, LLC—Adalpha Diversified Short-Term ProgramAdamah Capital, LLC—Diversified ProgramAdamah Capital, LLC—Global Macro ProgramAdamah Capital, LLC—Short-Term ProgramAIMhedge Management Ltd.—AIMhedge GDF Classic EUR (Institutional)AIMhedge Management Ltd.—AIMhedge GDF Opportunity EUR (Institutional)AIS Capital and AIS Futures MGT—MAAP (2x–4x) CompositeAIS Capital and AIS Futures MGT—MAAP (3x–6x) CompositeALFAKRAFT—ALFA Commodity FundALFAKRAFT—ALFA Energy FundAlgoMetrix Asset Management—Diversified Alpha1 Futures onlyAlis Capital Management—AAA FundAllMountain Capital AG—Mount Denali Global TrendsAlpina Investments—MOD2Altradis Capital AG—AlphAlgoAmati Global Investors Ltd—Systematic Trend FundAmplitude—Amplitude Klassik Fund A-ClassAmplitude—Amplitude Sinfonie Fund A-Class
v
Contents

Trend Fol lowing Analyt icsvi
Ancile Capital Management—Global Markets ProgramAngle Capital Management, LLC—AIP ProgramAshley Capital—Global FinancialAuctos Capital Management—Global DiversifiedAuspice Capital Advisors Ltd—Auspice Broad Commodity Excess Return IndexAuspice Capital Advisors Ltd—Auspice Broad Commodity Total Return IndexAuspice Capital Advisors Ltd—Auspice Diversified ProgramAuspice Capital Advisors Ltd—Auspice Managed Futures Excess Return IndexAvaileth Capital—Small ProgramBalgac Capital Management—John Galt ProgramBayland Capital Management, LLC—The Bayland Trading Program (P)Bayside Pacific Advisors, LLC—Global Managed Futures AggressiveBayside Pacific Advisors, LLC—Global Managed Futures ProgramBeach Horizon LLP—Managed AccountBear Commodities Corporation—Bear Commodities Corporation Level 2 (Prop)Becker Asset Management, LLC—Program 1—ClientBecker Asset Management, LLC—Program 1—Proprietary ABecker Asset Management, LLC—Program 1—Proprietary BBlackheath Fund Management Inc.—Blackheath Futures Fund LP Class ABlackheath Fund Management Inc.—Blackheath Offshore Limited Class ABlackwater Capital Management—Global ProgramBlue Fin Capital Pty Ltd—Blue Fin Compact Omega ProgramBlue Fin Capital Pty Ltd—Blue Fin Omega ProgramBouchard Capital, LLC—Bouchard Short Term Multi Market (C)Bouchard Capital, LLC—Bouchard Short Term Multi Market (P)Brandywine Asset Management—Brandywine’s Symphony Program (Prop)Briarwood Capital Management, Inc.—Diversified 2XLBriarwood Capital Management, Inc.—Diversified Trading ProgramCamkay Capital Management, LLC—Stock Indices IntradayCandor Capital Advisors—CandorFX Series 1.1Capricorn Currency Management—Capricorn FXG10 EURCapricorn Currency Management—Capricorn FXG10 USDCapricorn Currency Management—Capricorn FXG10Capricorn Currency Management—Capricorn fxSTCapricorn Currency Management—Capricorn fxST (MAP)Capricorn Currency Management—Capricorn fxST (VOL+)Cardwell Investment Technologies—Cardwell Investment Technologies Global FundChadwick Investment Group—Global Trend Following—Large Account Chesapeake Capital—DiversifiedCipher Investment Management—Cipher Diversified Trading ProgramCity Fund Management—DXF01 StrategyCity Fund Management—GST StrategyClarke Capital Management—FX Plus

Clarke Capital Management—Global BasicClarke Capital Management—Global MagnumClarke Capital Management—JupiterClarke Capital Management—MillenniumClarke Capital Management—OrionClarke Capital Management—WorldwideClaughton Capital—Auto-Reactive PositioningClinamen Financial Group, LLC—VIX Portfolio Hedging (VXH) Program-ProprietaryCommodity Capital Inc.—Inflation Protector Trading Program (P)Concorde Finance S. A.—Concorde Diversified FuturesConquest Capital Group—Conquest MacroConquest Capital Group—Conquest Managed Futures SelectCorepoint Capital AG—EDGE—Tail Risk ProtectionCovenant Capital Management of Tennessee, LLC—Aggressive ProgramCovenant Capital Management of Tennessee, LLC—Long Commodity ProgramCovenant Capital Management of Tennessee, LLC—Original ProgramCrabel Capital Management—Crabel Multi-ProductCrabel Capital Management—Crabel Two Plus ProgramCypress Capital Management, LLC—Cypress Classic AG ProgramDiamond Capital Management—Enhanced S&P Program—ProprietaryDiamond Capital Management—Enhanced S&P ProgramDiamond Peak Capital, LLC—Northstar Aggressive (2x) ProgramDistrict Capital Management Inc—Diversified ProgramDix Hills Partners—Dynamic Term Structure StrategyDix Hills Partners—Alternative Treasury StrategyDixon Midland Company, LLC—Dixon Midland Managed Futures, LLCDQS—Absolute Return FundDreiss Research Corporation—Diversified ProgramDrury Capital—Diversified Trend-Following ProgramDUNN Capital Management—DUNN Combined Fund (DCF)DUNN Capital Management—World Monetary and Agriculture Program (WMA)Eckhardt Trading Company—Standard PlusEckhardt Trading Company—StandardEclipse Capital Management—Global MonetaryEndeavour Capital LLP—Endeavour PembrokeEquilibrium Asset Management ltd.—FTIA (Proprietary)Estlander & Partners—Alpha Trend II—Class PEstlander & Partners—Alpha TrendEstlander & Partners—FreedomEstlander & Partners—Global MarketsEstlander & Partners—Global XLEsulep LLC MAX—Esulep, LLC MAXeverTrend Global, LLC—everTrend Global, LLC
Contents vii
Trend Fol lowing Analyt icsviii
Fall River Capital—Global OpportunitiesFinancial Commodity Investments—FX Premium Program (Prop)FORT LP—Fort Global DiversifiedFour Capital GmbH—FX StrategyFour Capital GmbH—Global Macro StrategyFTC Capital GmbH—FTC Futures Fund ClassicFTC Capital GmbH—FTC Commodity Fund AlphaFTC Capital GmbH—FTC Futures Fund DynamicFTC Capital GmbH—FTC Systematic Macro EURFTC Capital GmbH—FTC Systematic Macro USDFuture Gate Capital Management—Future Gate Investment Fund, L.P.Gap Partners, LLC—GapGenesis Research & Asset Management—Genesis Multi Manager Futures FundGenuine Trading Solutions—Genuine USA IndexGlobal Advisors—Global Commodity DiscretionaryGlobal Edge Capital Management—Kondor EdgeGlobal Wealth Analytics, Inc.—ALPHA ProgramGreenwave Capital Management—GDS (Dollar Short) AlphaGreenwave Capital Management—GDS (Dollar Short) BetaGreenwave Capital Management—Greenwave Alpha PlusGreenwave Capital Management—Greenwave Flagship (Futures Only)Greenwave Capital Management—Greenwave FlagshipGT CAPITAL CTA—GT CAPITAL CTAGT CAPITAL CTA—GT Dynamic Day Trading ProgramHalion Capital Ltd.—Conservative StrategyHamer Trading—Diversified ProgramHawksbill Capital Management—Global DiversifiedHedgeForward, LLC—Directional Trading System (DTS)Heritage Ltd—High Frequency Options StrategyHeritage Ltd—Var5 FundHeyden & Steindl GmbH—TOMAC2IDS Capital—F&F Systematic Trading FundIncline Investment Management, LLC—The Tahoe StrategyInCube Capital—InCube Promoveo Fund CHFInCube Capital—InCube Promoveo Fund EURInsch Capital Management AG—Interbank Currency Program—3X LeverageInsignia Futures & Options, Inc.—MedallionIntegrated Managed Futures Corp—IMFC Global ConcentratedIntegrated Managed Futures Corp—IMFC Global Investment ProgramISAM—ISAM Systematic Fund Class A (USD)ISAM—ISAM Systematic GoldISATYS Advisory AG—SINGULARITY Managed Futures ProgramIssumboshi Assets Management—Issumboshi (Proprietary)iTTa Asset Management Ltd.—iTTa CTA

James River Capital Corp.—James River Navigator Fund Ltd., Class 2XJames River Capital Corp.—James River Navigator Fund Ltd., Class AJames River Capital Corp.—James River Navigator Futures Fund LLC, Class 2XJames River Capital Corp.—James River Navigator Futures Fund LLC, Class AJKI-Futures, LLC—ETIRON AccessJKI-Futures, LLC—ETIRON Large 2xJLC Futures Management Company—JLC Managed Futures Fund I, LP.John Locke Investments—Cyril Systematic ProgramJohn Locke Investments—High Frequency ProgramJohn Locke Investments—JL Commodity Long Flat ProgramJohn W. Henry & Company—Global Analytics ProgramJPD Enterprises, Inc.—Global Diversified ProgramKeck Capital Management, LLC—The Keck ProgramKelly Angle Inc.—Genesis ProgramKeyQuant—Key TrendsKMJ Capital—KMJ Capital CurrencyLenapi Advisors, LLC—Lenapi Quantitative Long/Short Commodity 2XLexington Asset Management—Lexington Keystone Trading ProgramLiberty Funds Group, Inc—Liberty Diversified Option StrategyLiberty Funds Group, Inc—Liberty Global FundLiberty Funds Group, Inc—Liberty Wealth Protection FundLynx Asset Management AB—Lynx ProgramMacrotheme Capital Management, LLC—Commercial Hedge GrantorMalachi Capital Management—Malachi Red Deer ProgramMelissinos Trading—Eupatrid Commodity ProgramMERIT Alternative Investments GmbH—AWAMetolius Capital, LLC—Metolius DiversifiedMillburn Corporation—Commodity ProgramMillburn Corporation—Multi-Markets ProgramMKC Global Investments, LLC—MKC Global Fund, LPM.S. Capital Management—Global Diversified ProgramM.S. Capital Management—Proprietary ProgramMulvaney Capital Management—Global Diversified ProgramNeural Capital—Sentinel Trading ProgramNoho Capital Management Ltd—Managed Futures on Asian Equity IndicesOpes Capital Group, LLC—Opes Capital Group Trading ProgramOsmanov, Roman—UniversalPacific Capital Advisors—Vanguard ProgramPardo Capital Limited—XT-99 ProgramParizek Capital—Currency ProgramParizek Capital—Futures Trading ProgramPaskewitz Asset Management, LLC—Multi-strategy Futures ProgramPersistent Capital Management—Global Diversified 2X Program
Contents ix
Trend Fol lowing Analyt icsx
Poseidon Advisors Ltd.—Sea Express Futures FundPurple Valley Capital, Inc.—Diversified Trend 1Qbasis Fund Management—Qbasis Futures Fund BQbasis Fund Management—Qbasis Futures Fund AQbasis Fund Management—Qbasis MF Trend Plus (Proprietary)QTR Invest—QTR FundQuality Capital Management—DB Platinum IV QCM GDP UCITS Index FundQuality Capital Management—Enhanced Commodity Beta ProgrammeQuality Capital Management—Global Diversified ProgrammeQuality Capital Management—Global Natural Resources ProgrammeQuantam—Quantam GSA Multistrategy x1Quantica Capital AG—Quantica Diversified FXQuantica Capital AG—Quantica Managed FuturesQuantum Leap Capital Management—Managed Account ProgramQuest Partners, LLC—AlphaQuest Long Term ProgramQuicksilver Trading—Diversified ProgramRabar Market Research—Diversified ProgramRabar Market Research—Short-Term ProgramRafaello Investments Limited—SAFI2 ProgramRAM Management Group—MRTP AggressiveRAM Management Group—RAM MRTP 1X—ConservativeRed Rock Capital Management—Diversified ProgramReech AiM Partners LLP—Rochester MAPRehn Capital Management, LLC—ULTRENDRhicon Currency Management—Rhicon Systematic Currency ProgramRho Asset Management—Rho Altius 1XL Program (EUR)Rho Asset Management—Rho Citius 1XL Program (EUR)Rho Asset Management—Rho Fortius 1:2 Program (EUR)Robinson-Langley Capital Management, LLC—Managed Account ProgramRymer Wealth Management, LLC—Diversified Futures (Prop)Saxon Investment Corporation—Aggressive Diversified ProgramSaxon Investment Corporation—Diversified ProgramSchindler Trading—International Equity PlusSCT Capital Management—The Adaptive Quant Trading (AQT) ProgramSeneca Invest AG—Procyon Galaxy Trading (P)Seneca Invest AG—Vienna Global—Klimt Fund (P)Silicon Valley Quantitative Advisors—US Quantitative Portfolio (UQP)SMN Investment Services—smn Diversified Futures FundSnowbridge Asset Management, LLC—Projective Trend ProgramSomers Brothers Capital—Diversified Futures Program #1Sona Trading Strategies, LLC—Investment ProgramSouthwest Managed Investments, LLC—Global DiversifiedSparta Administradora de Recursos Ltda.—Sparta Cíclico Fundo de Investimento Multimercado

Stein Investment Management—Trading Edge LTStein Investment Management—Trading Edge SelectStein Investment Management—Trading Edge STStein Investment Management—Trading EdgeStenger Capital Management, LLC—Diversified Trading ProgramStonehenge Asset Management, LLC—Stonehenge Diversified IStrat Asset Management, LLC—Global Diversified ProgramStrategic Global Advisors, LLC—Global Select L/SSunrise Capital Partners—Sunrise Capital Diversified, Ltd.Sunrise Capital Partners—Sunrise Select Davco Fund, L.P.Superfund Group—Superfund Green Gold A (SPC)Superfund Group—Superfund Green Gold B (SPC)Superfund Group—Superfund Green Gold C (SPC)Superfund Group—Superfund Blue SPC Class A (Gold)Superfund Group—Superfund Blue SPC Class A (EUR)Superfund Group—Superfund Gold L.P. Series A-1Superfund Group—Superfund Gold L.P. Series B-1Superfund Group—Superfund Green GCT USDSuperfund Group—Superfund Green L.P. Series ASuperfund Group—Superfund Green L.P. Series BSuperfund Group—Superfund Green MasterSuperfund Group—Superfund Green Q-AGSYSTEMA Capital (a subsidiary of Taler Asset Management)—SYSTEMA Trend FundTactical Investment Management—Tactical Institutional Commodity ProgramTamarkin Managed Futures, LLC—Investment ProgramThe SEMA4 Group, LLC—The SEMA4 eMini S&P MidCap 400 Index ProgramThe SEMA4 Group, LLC—The SEMA4 Mini Russell 2000 Index ProgramTranstrend B.V.—Transtrend Diversified Trend Program—Enhanced Risk (EUR)Transtrend B.V.—Transtrend Diversified Trend Program—Enhanced Risk (JPY)Transtrend B.V.—Transtrend Diversified Trend Program—Standard Risk (EUR)Transtrend B.V.—Transtrend Diversified Trend Program—Standard Risk (USD)Transtrend B.V.—Transtrend Diversified Trend Program—Standard Risk (JPY)Transworld Capital Management—High LiquidityTransworld Capital Management—Transworld ForexTRYCON G.C.M. AG—TRYCON Basic Invest HAIG, Class C (UCITS IV)Typhon Capital Management, LLC—Plutus Grain StrategyUNISystems Research Inc.—ODI Index ProgramVaca Capital Management—Global Diversified Program 2XVaca Capital Management—Global Diversified ProgramVergho Asset Management, LLC—KinematicsVikström & Andersson Asset Management AB—Density ProgramWallwood Consultants LTD—Swing FX Forex ProgrammeWaypoint Capital Management—Diversified Program
Contents xi
Trend Fol lowing Analyt icsxii
Welton Investment Corp—GDP ProgramWestphal Trading—Trend-following ProprietaryWhite Indian—SCSWichler Group, Inc.—Reversal ProgramWichler Group, Inc.—Reversal—PropWinton Capital Management—DiversifiedXiva Asset Management Limited—Vector Long-Short Futures
II . Historical Market Charts by Barchart and DshortSection 1: CurrenciesAustralian Dollar (P)—OHLC ChartAustralian Dollar—OHLC Chart
British Pound (P)—OHLC ChartBritish Pound—OHLC Chart
Canadian Dollar—OHLC ChartEuro FX (P)—OHLC ChartEuro FX—OHLC ChartJapanese Yen (P)—OHLC ChartJapanese Yen—OHLC ChartMexican Peso (P)—OHLC ChartMexican Peso—OHLC ChartNew Zealand Dollar (P)—OHLC ChartNew Zealand Dollar—OHLC ChartSouth African (P)—OHLC ChartSouth African Rand—OHLC ChartSwiss Franc (P)—OHLC ChartSwiss Franc—OHLC ChartU.S. Dollar Index—OHLC ChartSection 2: EnergiesCrude Oil Brent—OHLC ChartCrude Oil WTI—OHLC ChartEthanol Futures—OHLC ChartGasoline RBOB—OHLC ChartHeating Oil—OHLC ChartNatural Gas—OHLC ChartSection 3: Financials2-Year T-Note (P)—OHLC Chart2-Year T-Note—OHLC Chart5-Year Swaps (P)—OHLC Chart5-Year Swaps—OHLC Chart5-Year T-Note (P)—OHLC Chart5-Year T-Note—OHLC Chart
Brazilian Real (P)—OHLC Chart
Canadian Dollar (P)—OHLC Chart
Brazilian Real—OHLC Chart

10-Year Swaps (P)—OHLC Chart10-Year Swaps—OHLC Chart10-Year T-Note (P)—OHLC Chart10-Year T-Note—OHLC Chart30-Day Fed Funds (P)—OHLC Chart30-Day Fed Funds—OHLC ChartEurodollar (P)—OHLC ChartEurodollar—OHLC ChartT-Bond (P)—OHLC ChartT-Bond—OHLC ChartUltra T-Bond (P)—OHLC ChartUltra T-Bond—OHLC ChartSection 4: GrainsCanola—OHLC ChartCorn (P) —OHLC ChartCorn—OHLC ChartKCBT Red Wheat (P)—OHLC ChartKCBT Red Wheat—OHLC ChartOats (P)—OHLC ChartOats—OHLC ChartRough Rice (P)—OHLC ChartRough Rice—OHLC ChartSoybean Meal (P)—OHLC ChartSoybean Meal—OHLC ChartSoybean Oil (P)—OHLC ChartSoybean Oil—OHLC ChartSoybeans (P) —OHLC ChartSoybeans—OHLC ChartSpring Wheat—OHLC ChartWheat (P)—OHLC ChartWheat—OHLC ChartSection 5: IndicesCBOE S&P 500 VIX—OHLC ChartCRB CCI INDEX—OHLC ChartDJIA (E)—OHLC ChartDJIA Mini-Sized—OHLC ChartDJIA—OHLC ChartE-Mini Nasdaq 100—OHLC ChartE-Mini S&P 500—OHLC ChartE-Mini S&P Midcap—OHLC ChartE-Mini S&P Smallcap—OHLC ChartNasdaq 100—OHLC ChartRussell 2000 Mini—OHLC ChartS&P 500 Index—OHLC Chart
Contents xiii

Trend Fol lowing Analyt icsxiv
Section 6: MeatsClass III Milk (P)—OHLC ChartClass III Milk—OHLC ChartFeeder Cattle (P)—OHLC ChartFeeder Cattle—OHLC ChartLean Hogs (P)—OHLC ChartLean Hogs—OHLC ChartLive Cattle (P)—OHLC ChartLive Cattle—OHLC ChartSection 7: MetalsGold Mini-Sized—OHLC ChartGold—OHLC ChartHigh-Grade Copper—OHLC ChartPalladium—OHLC ChartPlatinum—OHLC ChartSilver Mini-Sized—OHLC ChartSilver—OHLC ChartSection 8: SoftsCocoa—OHLC ChartCoffee—OHLC ChartCotton #2—OHLC ChartLumber—OHLC ChartOrange Juice—OHLC ChartSugar #11—OHLC ChartSugar #16—OHLC ChartSection 9: Dshort S&P 500 Index: Current Market Snapshot 10/9/2007–2012S&P 500 Index: Current Market Snapshot with 50- and 200-day moving averages 10/9/2007–2012Inflation, 10-Year Treasury Yields and the Federal Funds RateS&P 500, 10-Year Treasury Yields, FFR and RecessionsReal S&P 500, 10-Year Treasury Yields, FFR and RecessionsDaily Treasury Yields Since 2007 and the Effective Federal Funds RateThe “Real” (Inflation-Adjusted) Mega-BearsThe Nominal Mega-Bears“Real” Inflation-Adjusted Mega-Bear Quartet ExtendedComparing Major World Indexes Since March 9, 2009Comparing Major World Indexes Since January 2000The Dow and the S&P Composite Since 1896S&P Composite Real Price 10-Year Annualized Real Rate of Return with Dividends ReinvestedS&P Composite Real Price 20-Year Annualized Real Rate of Return with Dividends Reinvested

S&P Composite Real Price 30-Year Annualized Real Rate of Return with Dividends ReinvestedSixteen Real Dow Recoveries Since 1896 (1,000 market days from a low [approximately 4 years])Sixteen Real Dow Recoveries Since 1896 (5,000 market days from a low [approximately 20 years])Sixteen Real Dow Recoveries and the Percent Gain/Loss Days=Business DaysThe Inflation-Adjusted Dow Jones Industrial Average: The First 500 Days of Sixteen RecoveriesFour Bad BearsFour Bad Bears Adjusted for InflationFour Bad Bears Total ReturnsFour Bad Bears Total Returns Adjusted for InflationS&P 500 Total Return and Real Total Return on $1,000 Invested on March 24, 2000
III . AppendixDUNN Composite Performance: 10 Drawdowns Greater Than –25%—DUNN Capital Management, LLCWorld Monetary & Agriculture (“WMA”) Program—DUNN Capital Management, LLCDUNN Capital Management, LLC—DUNN Capital Management, LLC ISAM Systematic—December 2011—ISAM Systematic
The Summer Shock—Fertile Ground for “Crisis Alpha”—Altegris AdvisorsManaged Futures— Past, Present, and Future—Altegris Advisors
IV. Definit ions and Formulas
Contents xv
Managed Futures—Is the Trend Your Friend?—Altegris Advisors

This page intentionally left blank

PrefaceTrend following is not a luxury. It is a need. In an investment world dominated by
mutual funds, buy and hold, long-only investment approaches, CNBC gurus, 24/7 news stories, Warren Buffett fan clubs, and governmentally manipulated markets, trend following is a truth to believe in.
My 15-year ride in trend following currents has had its share of ups, downs, and unpredictable directions. I have had the good fortune to watch everyday people and experts alike immerse in trend following and begin million-dollar careers. My work has linked together untold multiples of traders, igniting associations and friendships across the world. Could I have speculated this would be my life passion upon launching a simple four-page website in 1996? No way. That said, my trend following network and teaching career revolves around two core foundations: stories and data.
Let me be clear: This book is not stories. It is data and data only. This book was designed as strictly a companion piece for my four prior books—books that include stories, data and context:
• Trend Following (FT Press)
• Trend Commandments (FT Press)
• The Complete TurtleTrader (HarperCollins)
• The Little Book of Trading (Wiley)
Some readers will have enough experience to derive useful value from this work, but many will need context to make best use of data herein. The context is not here—by design. That means my four prior books (all four, or just one) are prerequisites. Said another way: This work could have been a massive appendix for any one of my prior books. Looking at data is one issue, but knowing the stories behind that data is a different issue (and book).
My Drive
Snowballing a new thought process such as trend following is not about asking for permission from mainstream Wall Street or academic PHD’s who think very different (i.e. Efficient Market Theory proponents). It’s not a noble calling either. It’s a primal, visceral, and deep in the gut desire. Just look around and you’ll notice that the freaks and visionaries are often the winners in life. Those kindred spirits have been and still are my teachers. They are the ones out on a ledge drawing an investment picture no one else wants to see or who might be too scared to see.
When the first edition of Trend Following was published in 2004, trend trading was not clearly defined in a comprehensive way. Investors needed it even if they did not know. Trend Following has become a bestseller with four editions and translations into

Trend Fol lowing Analyt icsxviii
13 languages. It has received praise from some of the most successful traders alive today. Although Trend Following and my other three books have been wildly successful, a demand exists for more data. More proof that trend following works has been the siren’s call for a minority of skeptics as well as a confidence call for those trend following evangelists already on my side. For some there can never be enough proof and for those performance junkies this book fulfills that desire.
Over the years I have amassed one of the largest trend following research libraries in the world. That library has been the foundation for four books and a documentary film (see http://www.brokemovie.com). These works were the result of my belief that investors must understand the psychology behind the success of individual winning trend traders before delving into a data-driven research text.
Information alone, such as that in Trend Following Analytics, provides base data, but not actionable trend trading strategies. However, whittling down raw data and seeing prior performance are part of the confidence game. You can’t skip that step, but actionable systems are equally important.
Trend Following Analytics is a massive one-of-a-kind reference guide. It was not created to be consumed in one sitting. Reading from beginning to end in a straight line is not recommended. That would be serious information overload. The proper use of this text is as a reference encyclopedia.
Trend Following Analytics cuts through the jargon and gets straight to the point: data proof that trend following works. This book provides you with more than 1,000 pages of pure graphs, charts, and research revolving around trend following. It is a treasure trove of numbers conveniently packaged in one eBook for your Kindle or iPad.
Specifics
Trend Following Analytics is broken down into four parts:
• Part I, “Professional Trend Following Performance Track Records by IASG”: Trend following needs markets to excel. If you don’t have trending markets (like those discussed in Part II), then correspondingly you have no trend following performance. Who are the trend followers over the past decade? Who are the winners? What does their performance look like? This section includes individual performance histories of professional trend followers. They all don’t trade exactly alike, and they don’t always trade the same level of risk or markets, but their trend following performance is proof for those investors new to trend following. Whether you desire to invest with a trend following trader or develop your own trend following system, this section can help with both.

• Part II, “Historical Market Charts by Barchart and Dshort”: Trend following involves trading all markets (that is, stocks, futures, currencies, commodities, metals, grains, ETFs, and so on). It is an agnostic trading style to any particular market as the strategy is based only on price movement—either up or down. Historical market charts are the price movement proof that investing can never be viewed as a linear straight-up function. Markets trend up and they trend down. This chart compilation is the foundation of the performance histories discussed in Part I.
• Part III, “Appendix”:
DUNN Composite Performance: 10 Drawdowns Greater Than –25%
DUNN Capital Management
World Monetary & Agriculture (“WMA”) Program
DUNN Capital Management
DUNN Capital Management, LLC
DUNN Capital Management, LLC
ISAM Systematic—December 2011
ISAM Systematic
Managed Futures—Is the Trend Your Friend?
Altegris Advisors
The Summer Shock—Fertile Ground for “Crisis Alpha”
Altegris Advisors
Managed Futures—Past, Present, and Future
Altegris Advisors
• Part IV, “Definitions and Formulas.”
Preface xix

This page intentionally left blank

Part IProfessional Trend Following Performance Track Records by IASG
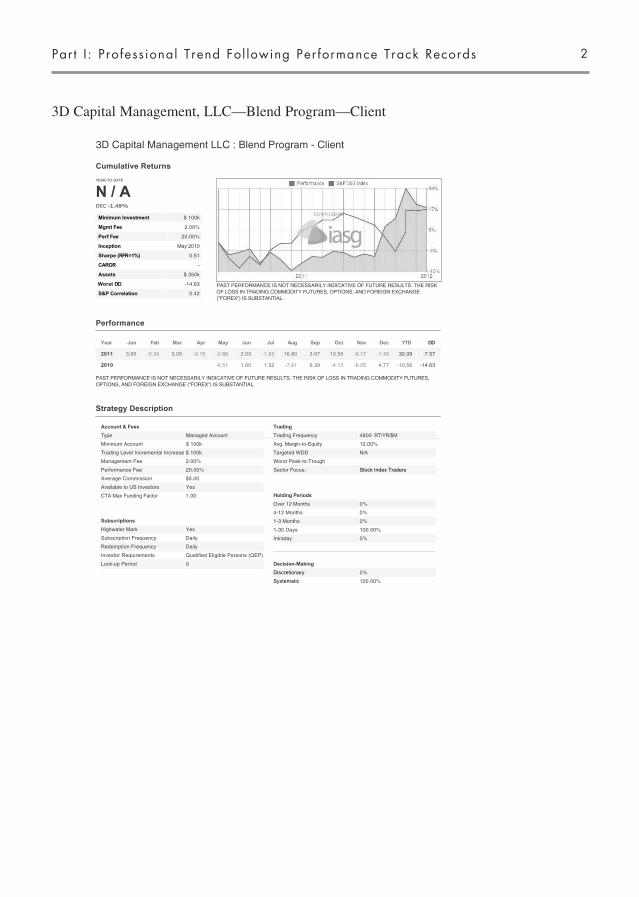
3D Capital Management, LLC—Blend Program—Client
Part I : Professional Trend Fol lowing Performance Track Records 2
Cumulative Returns
Performance
PAST PERFORMANCE IS NOT NECESSARILY INDICATIVE OF FUTURE RESULTS. THE RISK OF LOSS IN TRADING COMMODITY FUTURES, OPTIONS, AND FOREIGN EXCHANGE ("FOREX") IS SUBSTANTIAL.
Strategy Description
3D Capital Management LLC : Blend Program - Client
YEAR-TO-DATE
N / A-1.49%
Minimum Investment $ 100k
Mgmt Fee 2.00%
Perf Fee 20.00%
Inception May 2010
Sharpe (RFR=1%) 0.51
CAROR -
Assets $ 350k
Worst DD -14.63
S&P Correlation 0.42
PAST PERFORMANCE IS NOT NECESSARILY INDICATIVE OF FUTURE RESULTS. THE RISK OF LOSS IN TRADING COMMODITY FUTURES, OPTIONS, AND FOREIGN EXCHANGE ("FOREX") IS SUBSTANTIAL.
Year Jan Feb Mar Apr May Jun Jul Aug Sep Oct Nov Dec YTD DD
2011 3.65 -0.34 3.05 -0.15 -2.86 2.03 -1.63 16.80 3.97 13.56 -6.17 -1.49 32.09 -7.57
2010 -6.51 1.60 1.52 -7.61 6.39 -4.13 -6.05 4.77 -10.56 -14.63
Account & Fees
Type Managed Account
Minimum Account $ 100k
Trading Level Incremental Increase $ 100k
Management Fee 2.00%
Performance Fee 20.00%
Average Commission $5.00
Available to US Investors Yes
CTA Max Funding Factor 1.00
Subscriptions
Highwater Mark Yes
Subscription Frequency Daily
Redemption Frequency Daily
Investor Requirements Qualified Eligible Persons (QEP)
Lock-up Period 0
Trading
Trading Frequency 4800
Avg. Margin-to-Equity 12.00%
Targeted WDD N/A
Worst Peak-to-Trough
Sector Focus: Stock Index Traders
Holding Periods
Over 12 Months 0%
4-12 Months 0%
1-3 Months 0%
1-30 Days 100.00%
Intraday 0%
Decision-Making
Discretionary 0%
Systematic 100.00%

Trend Fol lowing Analyt ics3 Trend Fol lowing Analyt ics3
3D Capital Management, LLC—Blend Program—Client
Summary
The 3D Blend program is a systematic diversified and disciplined global macro view of the S&P 500 and is either long or short the S&P 500 future; seeking to profit from stock market moves both up and down with relatively lower volatility than in the broader market index.
Investment Strategy
The 3D Blend program attempts to identify global market trends and counter trends in multiple asset classes and is based on technical analysis in which historical market data, correlations and momentum models identify historical recurring patterns and market opportunities in the SP 500.
Risk Management
There is a constant position size per unit of nominal value and stop losses are built into the models using daily price action and volatility.
Statistics & Ratios
PAST PERFORMANCE IS NOT NECESSARILY INDICATIVE OF FUTURE RESULTS. THE RISK OF LOSS IN TRADING COMMODITY FUTURES, OPTIONS, AND FOREIGN EXCHANGE ("FOREX") IS SUBSTANTIAL.
Note: Figures shown in the Monthly column are the greatest figures (or worst for losses/drawdowns) for any particular month. The Annual figures are the greatest for any calendar year.
Reward Monthly Annual
Compound RoR: - -
Average RoR: - -
Max Gain: 16.80% 32.09%
Gain Frequency: 50.00% 60.00%
Average Gain: - -
Gain Deviation: 5.25% 18.19%
Risk
Standard Deviation: 6.33% 21.93%
Worst Loss: -7.61% -10.56%
Loss Frequency: 50.00% 40.00%
Average Loss: -3.69% -15.83%
Loss Deviation: 2.76% 9.57%
Reward/Risk
Sharpe Ratio: (RF=1%) 0.15 0.51
Correlation
S&P 500 Index 0.42
Composition
Stock Indices 100.00%
Strategy
Counter-trend 10.00%Momentum 20.00%Pattern Recognition 50.00%Trend-following 20.00%

3D Capital Management, LLC—Blend Program—Client
Part I : Professional Trend Fol lowing Performance Track Records 4
Drawdown Report
Time Windows Analysis
Depth Length (Months) Recovery (Months) Start End
-14.63 7 9 1/1/0001 11/1/2010
-7.57 2 0 10/1/2011 12/1/2011
Consecutive Gains
Run-up Length (Mos.) Start End
37.90 3 8/1/2011 10/1/2011
8.59 2 12/1/2010 1/1/20116.39 1 9/1/2010 9/1/2010
3.14 2 6/1/2010 7/1/20103.05 1 3/1/2011 3/1/2011
Consecutive Losses
Run-up Length (Mos.) Start End
-9.93 2 10/1/2010 11/1/2010
-7.61 1 8/1/2010 8/1/2010-7.57 2 11/1/2011 12/1/2011
-6.51 1 5/1/2010 5/1/2010-3.01 2 4/1/2011 5/1/2011
1 Month 3 Month 6 Month 12 Month
Number of Periods 20.00 18.00 15.00 9.00
Percent Profitable 50.00 50.00 66.67 55.56
Average Period Return 1.02 4.55 7.99 15.85
Average Gain 5.73 12.18 14.74 30.70
Average Loss -3.69 -3.07 -5.51 -2.71
Best Period 16.80 37.90 34.45 40.66
Worst Period -7.61 -5.77 -9.13 -4.93
Standard Deviation 6.33 11.18 13.97 19.09
Gain Standard Deviation 5.25 11.39 12.06 10.30
Loss Standard Deviation 2.76 2.23 3.75 2.01
Sharpe Ratio (1%) 0.15 0.38 0.54 0.78
Average Gain / Average Loss
1.55 3.96 2.68 11.34
Profit / Loss Ratio 1.55 3.96 5.35 14.17
Downside Deviation (10%)
3.44 3.38 5.02 5.27
Downside Deviation (5%) 3.25 2.78 3.97 2.73
Downside Deviation (0%) 3.20 2.63 3.72 2.15
Sortino Ratio (10%) 0.18 0.98 1.10 2.06
Sortino Ratio (5%) 0.29 1.55 1.89 5.44
Sortino Ratio (0%) 0.32 1.73 2.15 7.38
Compiled by IASG. Copyright 2012. Redistribution or reproduction is prohibited without written permission.
Com
piled by IASG
(ww
w.iasg.com
). Copyright 2012. R
edistribution or reproduction is prohibited without w
ritten permission.
Trend Fol lowing Analyt ics5
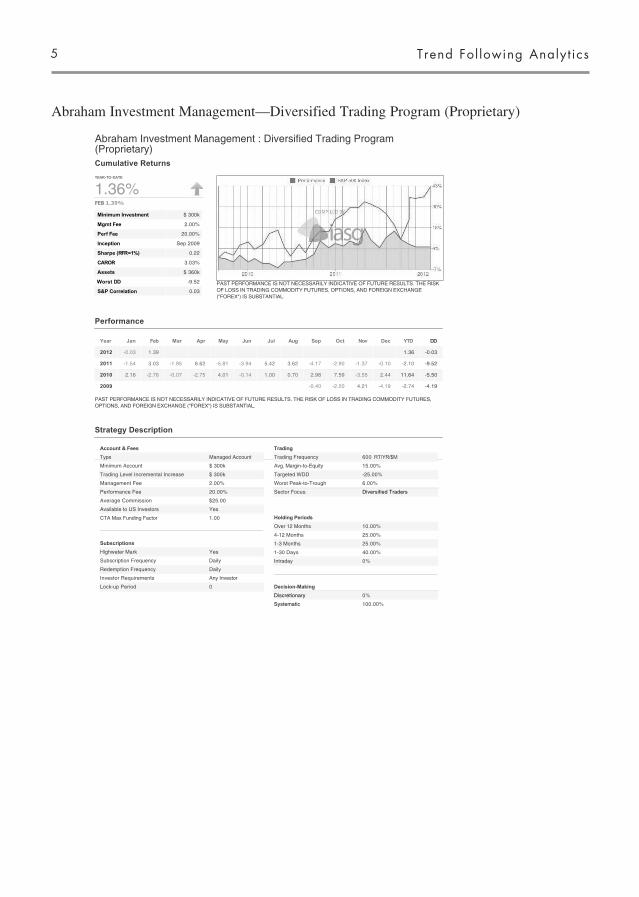
Abraham Investment Management—Diversified Trading Program (Proprietary)
Cumulative Returns
Performance
PAST PERFORMANCE IS NOT NECESSARILY INDICATIVE OF FUTURE RESULTS. THE RISK OF LOSS IN TRADING COMMODITY FUTURES, OPTIONS, AND FOREIGN EXCHANGE ("FOREX") IS SUBSTANTIAL.
Strategy Description
Abraham Investment Management : Diversified Trading Program (Proprietary)
YEAR-TO-DATE
1.36%1.39%
Minimum Investment $ 300k
Mgmt Fee 2.00%
Perf Fee 20.00%
Inception Sep 2009
Sharpe (RFR=1%) 0.22
CAROR 3.03%
Assets $ 360k
Worst DD -9.52
S&P Correlation 0.03
PAST PERFORMANCE IS NOT NECESSARILY INDICATIVE OF FUTURE RESULTS. THE RISK OF LOSS IN TRADING COMMODITY FUTURES, OPTIONS, AND FOREIGN EXCHANGE ("FOREX") IS SUBSTANTIAL.
Year Jan Feb Mar Apr May Jun Jul Aug Sep Oct Nov Dec YTD DD
2012 -0.03 1.39 1.36 -0.03
2011 -1.54 3.03 -1.95 8.62 -5.81 -3.94 5.42 3.62 -4.17 -2.90 -1.37 -0.10 -2.10 -9.52
2010 2.16 -2.76 -0.07 -2.75 4.01 -0.14 1.00 0.70 2.98 7.59 -3.55 2.44 11.64 -5.50
2009 -0.40 -2.20 4.21 -4.19 -2.74 -4.19
Account & Fees
Type Managed Account
Minimum Account $ 300k
Trading Level Incremental Increase $ 300k
Management Fee 2.00%
Performance Fee 20.00%
Average Commission $25.00
Available to US Investors Yes
CTA Max Funding Factor 1.00
Subscriptions
Highwater Mark Yes
Subscription Frequency Daily
Redemption Frequency Daily
Investor Requirements Any Investor
Lock-up Period 0
Trading
Trading Frequency 600
Avg. Margin-to-Equity 15.00%
Targeted WDD -25.00%
Worst Peak-to-Trough 6.00%
Sector Focus: Diversified Traders
Holding Periods
Over 12 Months 10.00%
4-12 Months 25.00%
1-3 Months 25.00%
1-30 Days 40.00%
Intraday 0%
Decision-Making
Discretionary 0%
Systematic 100.00%

Abraham Investment Management—Diversified Trading Program (Proprietary)
Part I : Professional Trend Fol lowing Performance Track Records 6
Summary
Abraham Investment Management utilizes a medium term, systematic, technical model developed to capture trends in global futures and FX markets. The managed futures program is based on trend followingobserved over many years of research and trading. The model is designed to establish positions when markets exhibit a high probability of a developing, sustained move.Proprietary indicators reduce trading in range bound, trendless markets. Abraham Investment Management includes strict money management techniques based on the individual market, sector, and overall portfolio levels.
Statistics & Ratios
PAST PERFORMANCE IS NOT NECESSARILY INDICATIVE OF FUTURE RESULTS. THE RISK OF LOSS IN TRADING COMMODITY FUTURES, OPTIONS, AND FOREIGN EXCHANGE ("FOREX") IS SUBSTANTIAL.
Note: Figures shown in the Monthly column are the greatest figures (or worst for losses/drawdowns) for any particular month. The Annual figures are the greatest for any calendar year.
Reward Monthly Annual
Compound RoR: 0.25% 3.03%
Average RoR: 0.31% 3.26%
Max Gain: 8.62% 11.64%
Gain Frequency: 43.33% 46.67%
Average Gain: 3.63% 11.14%
Gain Deviation: 2.40% 8.32%
Risk
Standard Deviation: 3.58% 12.39%
Worst Loss: -5.81% -2.74%
Loss Frequency: 56.67% 53.33%
Average Loss: -2.23% -3.63%
Loss Deviation: 1.75% 6.07%
Reward/Risk
Sharpe Ratio: (RF=1%) 0.06 0.22
Correlation
S&P 500 Index 0.03
Composition
Currency Futures 15.00%Industrial Metals 10.00%Precious Metals 10.00%Energy 10.00%Grains 15.00%Interest Rates 10.00%Livestock 5.00%Softs 15.00%Stock Indices 10.00%
Strategy
Trend-following 100.00%

Trend Fol lowing Analyt ics7
Abraham Investment Management—Diversified Trading Program (Proprietary)
Drawdown Report
Time Windows Analysis
Depth Length (Months) Recovery (Months) Start End
-9.52 2 - 4/1/2011 6/1/2011
-7.50 5 5 11/1/2009 4/1/2010-3.55 1 3 10/1/2010 11/1/2010
-2.59 2 1 1/1/0001 10/1/2009-1.95 1 1 2/1/2011 3/1/2011
Consecutive Gains
Run-up Length (Mos.) Start End
12.69 4 7/1/2010 10/1/2010
9.24 2 7/1/2011 8/1/20118.62 1 4/1/2011 4/1/2011
4.21 1 11/1/2009 11/1/20094.01 1 5/1/2010 5/1/2010
Consecutive Losses
Run-up Length (Mos.) Start End
-9.52 2 5/1/2011 6/1/2011
-8.34 5 9/1/2011 1/1/2012-5.50 3 2/1/2010 4/1/2010
-4.19 1 12/1/2009 12/1/2009-3.55 1 11/1/2010 11/1/2010
1 Month 3 Month 6 Month 12 Month 18 Month
Number of Periods 30.00 28.00 25.00 19.00 13.00
Percent Profitable 43.33 57.14 60.00 73.68 100.00
Average Period Return
0.31 0.92 2.16 7.58 11.85
Average Gain 3.63 4.15 6.33 10.82 11.85
Average Loss -2.23 -3.39 -4.08 -1.50
Best Period 8.62 11.57 17.04 24.94 20.43
Worst Period -5.81 -8.22 -8.03 -2.18 7.89
Standard Deviation 3.58 4.73 6.36 7.69 4.41
Gain Standard Deviation
2.40 3.27 4.48 6.21 4.41
Loss Standard Deviation
1.75 2.24 2.14 0.74
Sharpe Ratio (1%) 0.06 0.14 0.26 0.86 2.34
Average Gain / Average Loss
1.63 1.23 1.55 7.20
Profit / Loss Ratio 1.25 1.63 2.33 20.15
Downside Deviation (10%)
2.36 3.34 4.38 3.56
Downside Deviation (5%)
2.16 2.76 3.17 1.34
Downside Deviation (0%)
2.11 2.63 2.88 0.84
Sortino Ratio (10%) -0.04 -0.09 -0.07 0.72
Sortino Ratio (5%) 0.11 0.24 0.53 4.92
Sortino Ratio (0%) 0.15 0.35 0.75 8.98
Compiled by IASG. Copyright 2012. Redistribution or reproduction is prohibited without written permission.
Com
pile
d by
IA
SG (
ww
w.ia
sg.c
om).
Cop
yrig
ht 2
012.
Red
istr
ibut
ion
or r
epro
duct
ion
is p
rohi
bite
d w
ithou
t wri
tten
perm
issi
on.
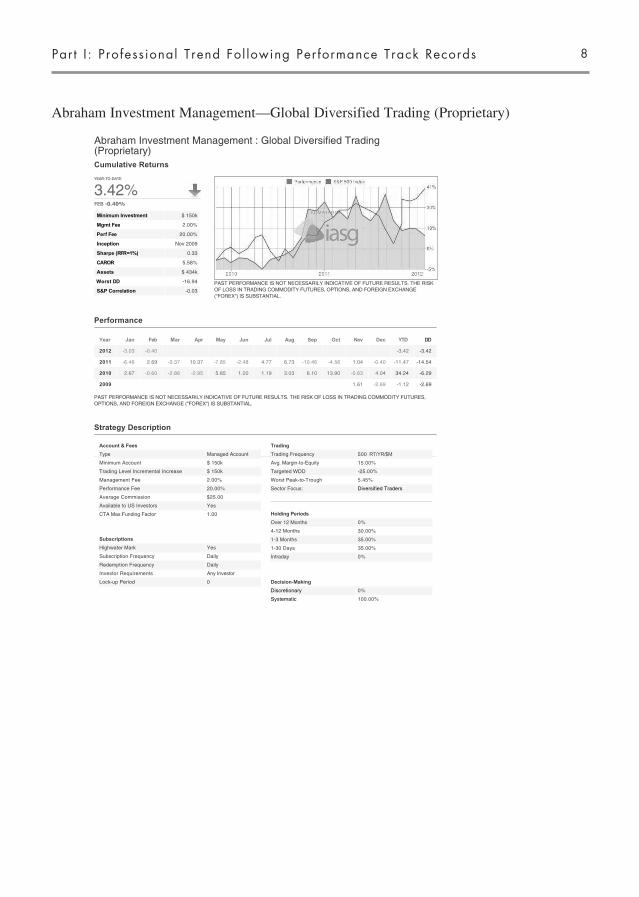
Abraham Investment Management—Global Diversified Trading (Proprietary)
Part I : Professional Trend Fol lowing Performance Track Records 8
Cumulative Returns
Performance
PAST PERFORMANCE IS NOT NECESSARILY INDICATIVE OF FUTURE RESULTS. THE RISK OF LOSS IN TRADING COMMODITY FUTURES, OPTIONS, AND FOREIGN EXCHANGE ("FOREX") IS SUBSTANTIAL.
Strategy Description
Abraham Investment Management : Global Diversified Trading (Proprietary)
YEAR-TO-DATE
3.42%-0.40%
Minimum Investment $ 150k
Mgmt Fee 2.00%
Perf Fee 20.00%
Inception Nov 2009
Sharpe (RFR=1%) 0.33
CAROR 5.58%
Assets $ 434k
Worst DD -16.94
S&P Correlation -0.03
PAST PERFORMANCE IS NOT NECESSARILY INDICATIVE OF FUTURE RESULTS. THE RISK OF LOSS IN TRADING COMMODITY FUTURES, OPTIONS, AND FOREIGN EXCHANGE ("FOREX") IS SUBSTANTIAL.
Year Jan Feb Mar Apr May Jun Jul Aug Sep Oct Nov Dec YTD DD
2012 -3.03 -0.40 -3.42 -3.42
2011 -6.46 2.69 -3.37 10.37 -7.85 -2.48 4.77 6.73 -10.46 -4.56 1.04 -0.40 -11.47 -14.54
2010 2.67 -0.60 -2.86 -2.95 5.85 1.20 1.19 3.03 6.10 13.90 -0.63 4.04 34.24 -6.29
2009 1.61 -2.69 -1.12 -2.69
Account & Fees
Type Managed Account
Minimum Account $ 150k
Trading Level Incremental Increase $ 150k
Management Fee 2.00%
Performance Fee 20.00%
Average Commission $25.00
Available to US Investors Yes
CTA Max Funding Factor 1.00
Subscriptions
Highwater Mark Yes
Subscription Frequency Daily
Redemption Frequency Daily
Investor Requirements Any Investor
Lock-up Period 0
Trading
Trading Frequency 500
Avg. Margin-to-Equity 15.00%
Targeted WDD -25.00%
Worst Peak-to-Trough 5.45%
Sector Focus: Diversified Traders
Holding Periods
Over 12 Months 0%
4-12 Months 30.00%
1-3 Months 35.00%
1-30 Days 35.00%
Intraday 0%
Decision-Making
Discretionary 0%
Systematic 100.00%

Trend Fol lowing Analyt ics9
Abraham Investment Management—Global Diversified Trading (Proprietary)
Summary
Abraham Investment Management utilizes a medium term, systematic, technical model developed to capture trends in global futures and FX markets. The managed futures program is based on trend followingobserved over many years of research and trading. The model is designed to establish positions when markets exhibit a high probability of a developing, sustained move.Proprietary indicators reduce trading in range bound, trendless markets. Abraham Investment Management includes strict money management techniques based on the individual market, sector, and overall portfolio levels.
Statistics & Ratios
PAST PERFORMANCE IS NOT NECESSARILY INDICATIVE OF FUTURE RESULTS. THE RISK OF LOSS IN TRADING COMMODITY FUTURES, OPTIONS, AND FOREIGN EXCHANGE ("FOREX") IS SUBSTANTIAL.
Note: Figures shown in the Monthly column are the greatest figures (or worst for losses/drawdowns) for any particular month. The Annual figures are the greatest for any calendar year.
Reward Monthly Annual
Compound RoR: 0.45% 5.58%
Average RoR: 0.59% 7.81%
Max Gain: 13.90% 34.24%
Gain Frequency: 50.00% 42.86%
Average Gain: 4.66% 34.24%
Gain Deviation: 3.75% 13.00%
Risk
Standard Deviation: 5.31% 18.41%
Worst Loss: -10.46% -11.47%
Loss Frequency: 50.00% 57.14%
Average Loss: -3.48% -12.01%
Loss Deviation: 2.98% 10.34%
Reward/Risk
Sharpe Ratio: (RF=1%) 0.09 0.33
Correlation
S&P 500 Index -0.03
Composition
Currency Futures 15.00%Industrial Metals 10.00%Precious Metals 10.00%Energy 10.00%Grains 15.00%Interest Rates 10.00%Livestock 10.00%Softs 10.00%Stock Indices 10.00%
Strategy
Trend-following 100.00%
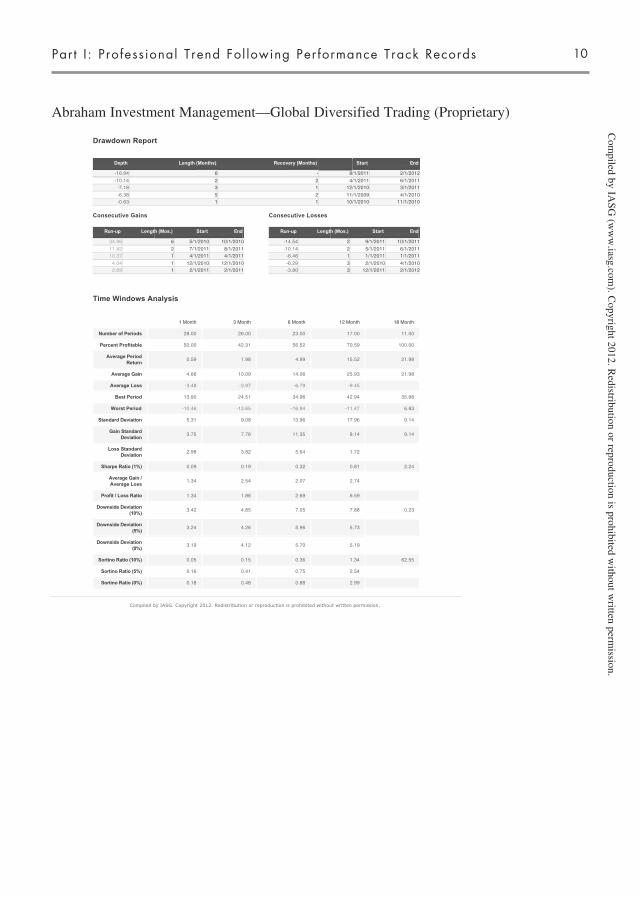
Abraham Investment Management—Global Diversified Trading (Proprietary)
Part I : Professional Trend Fol lowing Performance Track Records 10
Drawdown Report
Time Windows Analysis
Depth Length (Months) Recovery (Months) Start End
-16.94 6 - 8/1/2011 2/1/2012
-10.14 2 2 4/1/2011 6/1/2011-7.18 3 1 12/1/2010 3/1/2011
-6.38 5 2 11/1/2009 4/1/2010-0.63 1 1 10/1/2010 11/1/2010
Consecutive Gains
Run-up Length (Mos.) Start End
34.96 6 5/1/2010 10/1/2010
11.82 2 7/1/2011 8/1/201110.37 1 4/1/2011 4/1/2011
4.04 1 12/1/2010 12/1/20102.69 1 2/1/2011 2/1/2011
Consecutive Losses
Run-up Length (Mos.) Start End
-14.54 2 9/1/2011 10/1/2011
-10.14 2 5/1/2011 6/1/2011-6.46 1 1/1/2011 1/1/2011
-6.29 3 2/1/2010 4/1/2010-3.80 3 12/1/2011 2/1/2012
1 Month 3 Month 6 Month 12 Month 18 Month
Number of Periods 28.00 26.00 23.00 17.00 11.00
Percent Profitable 50.00 42.31 56.52 70.59 100.00
Average Period Return
0.59 1.98 4.99 15.52 21.98
Average Gain 4.66 10.09 14.06 25.93 21.98
Average Loss -3.48 -3.97 -6.79 -9.45
Best Period 13.90 24.51 34.96 42.94 35.98
Worst Period -10.46 -13.65 -16.94 -11.47 6.83
Standard Deviation 5.31 9.08 13.96 17.96 9.14
Gain Standard Deviation
3.75 7.76 11.35 8.14 9.14
Loss Standard Deviation
2.98 3.82 5.64 1.72
Sharpe Ratio (1%) 0.09 0.19 0.32 0.81 2.24
Average Gain / Average Loss
1.34 2.54 2.07 2.74
Profit / Loss Ratio 1.34 1.86 2.69 6.59
Downside Deviation (10%)
3.42 4.85 7.05 7.88 0.23
Downside Deviation (5%)
3.24 4.26 5.96 5.73
Downside Deviation (0%)
3.19 4.12 5.70 5.19
Sortino Ratio (10%) 0.05 0.15 0.36 1.34 62.55
Sortino Ratio (5%) 0.16 0.41 0.75 2.54
Sortino Ratio (0%) 0.18 0.48 0.88 2.99
Compiled by IASG. Copyright 2012. Redistribution or reproduction is prohibited without written permission.
Com
piled by IASG
(ww
w.iasg.com
). Copyright 2012. R
edistribution or reproduction is prohibited without w
ritten permission.
Trend Fol lowing Analyt ics11
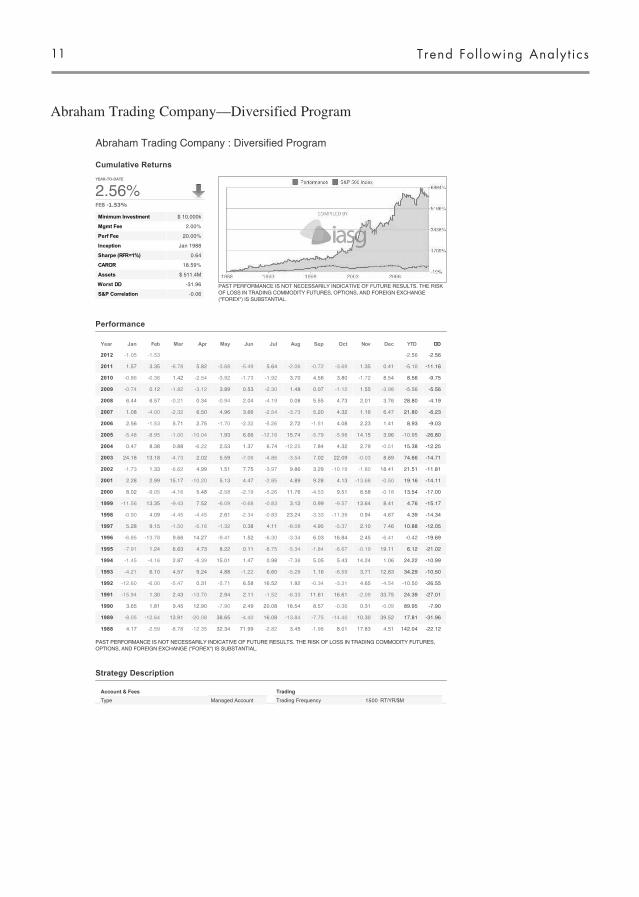
Abraham Trading Company—Diversified Program
Cumulative Returns
Performance
PAST PERFORMANCE IS NOT NECESSARILY INDICATIVE OF FUTURE RESULTS. THE RISK OF LOSS IN TRADING COMMODITY FUTURES, OPTIONS, AND FOREIGN EXCHANGE ("FOREX") IS SUBSTANTIAL.
Strategy Description
Abraham Trading Company : Diversified Program
YEAR-TO-DATE
2.56%-1.53%
Minimum Investment $ 10,000k
Mgmt Fee 2.00%
Perf Fee 20.00%
Inception Jan 1988
Sharpe (RFR=1%) 0.64
CAROR 18.59%
Assets $ 511.4M
Worst DD -31.96
S&P Correlation -0.06
PAST PERFORMANCE IS NOT NECESSARILY INDICATIVE OF FUTURE RESULTS. THE RISK OF LOSS IN TRADING COMMODITY FUTURES, OPTIONS, AND FOREIGN EXCHANGE ("FOREX") IS SUBSTANTIAL.
Year Jan Feb Mar Apr May Jun Jul Aug Sep Oct Nov Dec YTD DD
2012 -1.05 -1.53 -2.56 -2.56
2011 1.57 3.35 -6.78 5.82 -3.68 -5.49 5.64 -2.06 -0.72 -3.69 1.35 0.41 -5.10 -11.16
2010 -0.86 -0.36 1.42 -2.54 -3.92 -1.73 -1.92 3.70 4.56 3.80 -1.72 8.54 8.56 -9.75
2009 -0.74 0.12 -1.82 -3.12 3.89 0.53 -2.30 1.48 0.07 -1.12 1.55 -3.98 -5.56 -5.56
2008 6.44 6.57 -0.21 0.34 -0.94 2.04 -4.19 0.08 5.55 4.73 2.01 3.76 28.80 -4.19
2007 1.08 -4.00 -2.32 6.50 4.96 3.66 -2.54 -3.73 5.20 4.32 1.16 6.47 21.80 -6.23
2006 2.56 -1.53 5.71 2.75 -1.70 -2.32 -5.26 2.72 -1.51 4.08 2.23 1.41 8.93 -9.03
2005 -5.48 -8.95 -1.00 -10.04 1.93 6.66 -12.16 15.74 -5.79 -5.98 14.15 3.96 -10.95 -26.80
2004 0.47 8.38 0.88 -6.22 2.53 1.37 6.74 -12.25 7.84 4.32 2.79 -0.51 15.38 -12.25
2003 24.18 13.18 -4.73 2.02 5.59 -7.06 -4.86 -3.54 7.02 22.09 -0.03 8.69 74.66 -14.71
2002 -1.73 1.33 -6.62 4.99 1.51 7.75 -3.97 9.86 3.29 -10.19 -1.80 18.41 21.51 -11.81
2001 2.28 2.99 15.17 -10.20 5.13 4.47 -2.85 4.89 9.28 4.13 -13.68 -0.50 19.16 -14.11
2000 8.02 -9.05 -4.16 5.48 -2.58 -2.19 -5.26 11.76 -4.53 9.51 8.58 -0.18 13.54 -17.00
1999 -11.56 13.35 -9.43 7.52 -6.09 -0.68 -0.83 3.12 0.99 -9.57 13.64 8.41 4.76 -15.17
1998 -0.90 4.09 -4.45 -4.45 2.61 -2.34 -0.83 23.24 -3.33 -11.39 0.94 4.67 4.39 -14.34
1997 5.28 9.15 -1.50 -5.16 -1.32 0.38 4.11 -8.08 4.95 -5.37 2.10 7.46 10.88 -12.05
1996 -6.85 -13.78 9.66 14.27 -9.41 1.52 -6.30 -3.34 6.03 16.84 2.45 -6.41 -0.42 -19.69
1995 -7.91 1.24 6.63 4.73 8.22 0.11 -8.75 -5.34 -1.84 -6.67 -0.19 19.11 6.12 -21.02
1994 -1.45 -4.16 2.87 -8.39 15.01 1.47 0.98 -7.38 5.05 5.43 14.24 1.06 24.22 -10.99
1993 -4.21 6.10 4.57 9.24 4.88 -1.22 6.60 -5.28 1.16 -6.59 3.71 12.83 34.29 -10.50
1992 -12.60 -6.00 -5.47 0.31 -5.71 6.58 16.52 1.92 -0.34 -3.31 4.65 -4.54 -10.50 -26.55
1991 -15.94 1.30 2.43 -13.70 2.94 2.11 -1.52 -6.33 11.61 16.61 -2.09 33.75 24.39 -27.01
1990 3.65 1.81 9.45 12.90 -7.90 2.49 20.08 18.54 8.57 -0.36 0.31 -0.09 89.95 -7.90
1989 -8.05 -12.64 13.91 -20.08 38.65 -4.40 16.08 -13.84 -7.75 -14.40 10.30 39.52 17.81 -31.96
1988 4.17 -2.59 -8.78 -12.35 32.34 71.99 -2.82 3.45 -1.98 8.01 17.83 4.51 142.04 -22.12
Account & Fees
Type Managed Account
Trading
Trading Frequency 1500

Abraham Trading Company—Diversified Program
Part I : Professional Trend Fol lowing Performance Track Records 12
Strategy Description
Account & Fees
Type Managed Account
Trading
Trading Frequency 1500
Minimum Account $ 10,000k
Trading Level Incremental Increase $ 0k
Management Fee 2.00%
Performance Fee 20.00%
Average Commission $5.00
Available to US Investors Yes
CTA Max Funding Factor
Subscriptions
Highwater Mark No
Subscription Frequency
Redemption Frequency
Investor Requirements Any Investor
Lock-up Period 0
Avg. Margin-to-Equity 9.00%
Targeted WDD -25.00%
Worst Peak-to-Trough 0%
Sector Focus: Diversified Traders
Holding Periods
Over 12 Months 0%
4-12 Months 36.00%
1-3 Months 64.00%
1-30 Days 0%
Intraday 0%
Decision-Making
Discretionary 0%
Systematic 100.00%

Trend Fol lowing Analyt ics13
Abraham Trading Company—Diversified Program
Summary
Abraham Trading Company s trading methodology is a systematic approach blending long-term trend following, medium-term trendfollowing, short-term momentum, stock momentum, and mean reversion strategies in an effort to reduce volatility while maintaining a return target of 20-25%. Each strategy is further divided into sub-systems to facilitate smoother entries and exits. We have also implemented filtering techniques in some strategies to avoid trades with adverse risk/reward characteristics. Abraham Trading trades a diversified portfolio of 60 global futures markets, with a 60% weighting to physical commodities and a 40% divided between currencies, interest rates, and stock indicies.
Statistics & Ratios
PAST PERFORMANCE IS NOT NECESSARILY INDICATIVE OF FUTURE RESULTS. THE RISK OF LOSS IN TRADING COMMODITY FUTURES, OPTIONS, AND FOREIGN EXCHANGE ("FOREX") IS SUBSTANTIAL.
Note: Figures shown in the Monthly column are the greatest figures (or worst for losses/drawdowns) for any particular month. The Annual figures are the greatest for any calendar year.
Reward Monthly Annual
Compound RoR: 1.43% 18.59%
Average RoR: 1.82% 22.18%
Max Gain: 71.99% 142.04%
Gain Frequency: 55.52% 78.62%
Average Gain: 7.30% 30.06%
Gain Deviation: 8.71% 30.18%
Risk
Standard Deviation: 9.32% 32.29%
Worst Loss: -20.08% -10.95%
Loss Frequency: 44.48% 21.38%
Average Loss: -5.02% -6.79%
Loss Deviation: 4.06% 14.06%
Reward/Risk
Sharpe Ratio: (RF=1%) 0.19 0.64
Correlation
S&P 500 Index -0.06
Composition
Currency Futures 17.00%Precious Metals 11.00%Energy 8.00%Grains 10.00%Interest Rates 22.00%Livestock 6.00%Softs 16.00%Stock Indices 10.00%
Strategy
Counter-trend 34.00%Trend-following 45.00%Other 21.00%

Abraham Trading Company—Diversified Program
Part I : Professional Trend Fol lowing Performance Track Records 14
Drawdown Report
Time Windows Analysis
Depth Length (Months) Recovery (Months) Start End
-31.96 3 2 7/1/1989 10/1/1989
-27.18 8 22 11/1/2004 7/1/2005-27.12 11 4 9/1/1990 8/1/1991
-26.87 4 1 12/1/1988 4/1/1989-26.55 5 11 12/1/1991 5/1/1992
Consecutive Gains
Run-up Length (Mos.) Start End
127.61 2 5/1/1988 6/1/1988
100.67 6 11/1/1989 4/1/199066.42 3 12/1/2002 2/1/2003
58.39 4 6/1/1990 9/1/199038.65 1 5/1/1989 5/1/1989
Consecutive Losses
Run-up Length (Mos.) Start End
-31.96 3 8/1/1989 10/1/1989
-23.75 5 12/1/2004 4/1/2005-22.34 3 1/1/1992 3/1/1992
-22.12 3 2/1/1988 4/1/1988-21.02 5 7/1/1995 11/1/1995
1 Month 3 Month 6 Month 12 Month 18 Month 2 Year 3 Year 4 Year 5 Year
Number of Periods
290.00 288.00 285.00 279.00 273.00 267.00 255.00 243.00 231.00
PercentProfitable
55.52 57.64 68.77 78.14 84.25 91.39 96.86 99.18 100.00
AveragePeriodReturn
1.82 5.50 11.01 21.19 31.65 44.51 69.20 99.05 130.38
AverageGain
7.30 14.31 19.41 29.43 38.63 49.03 71.53 99.88 130.38
AverageLoss
-5.02 -6.48 -7.50 -8.22 -5.72 -3.38 -2.93 -0.88
BestPeriod
71.99 121.19 142.26 191.68 205.34 358.29 441.63 573.75 762.88
WorstPeriod
-20.08 -31.96 -24.56 -26.11 -16.17 -10.29 -5.63 -1.28 7.50
StandardDeviation
9.32 16.83 22.21 31.27 35.73 49.68 66.84 87.28 104.87
GainStandardDeviation
8.71 16.91 21.75 30.54 34.67 49.64 66.62 87.16 104.87
LossStandardDeviation
4.06 5.57 6.35 5.72 4.34 2.59 1.68 0.56
SharpeRatio (1%)
0.19 0.31 0.47 0.65 0.84 0.86 0.99 1.09 1.19
AverageGain /
AverageLoss
1.45 2.21 2.59 3.58 6.76 14.50 24.43 113.09
Profit / Loss Ratio
1.81 3.00 5.70 12.79 36.13 153.83 754.41 13627.78
DownsideDeviation
(10%)4.51 6.19 6.60 6.78 5.71 4.78 4.31 2.61 2.25
DownsideDeviation
(5%)4.34 5.68 5.69 5.06 3.34 1.75 1.13 0.45
DownsideDeviation
(0%)4.30 5.55 5.48 4.67 2.84 1.24 0.59 0.09
SortinoRatio (10%)
0.31 0.69 1.29 2.39 4.22 7.17 12.39 29.68 45.76
SortinoRatio (5%)
0.40 0.92 1.85 3.99 9.04 24.22 58.67 211.14
SortinoRatio (0%)
0.42 0.99 2.01 4.54 11.16 35.91 117.62 1129.65
Compiled by IASG. Copyright 2012. Redistribution or reproduction is prohibited without written permission.
Com
piled by IASG
(ww
w.iasg.com
). Copyright 2012. R
edistribution or reproduction is prohibited without w
ritten permission.

Trend Fol lowing Analyt ics15
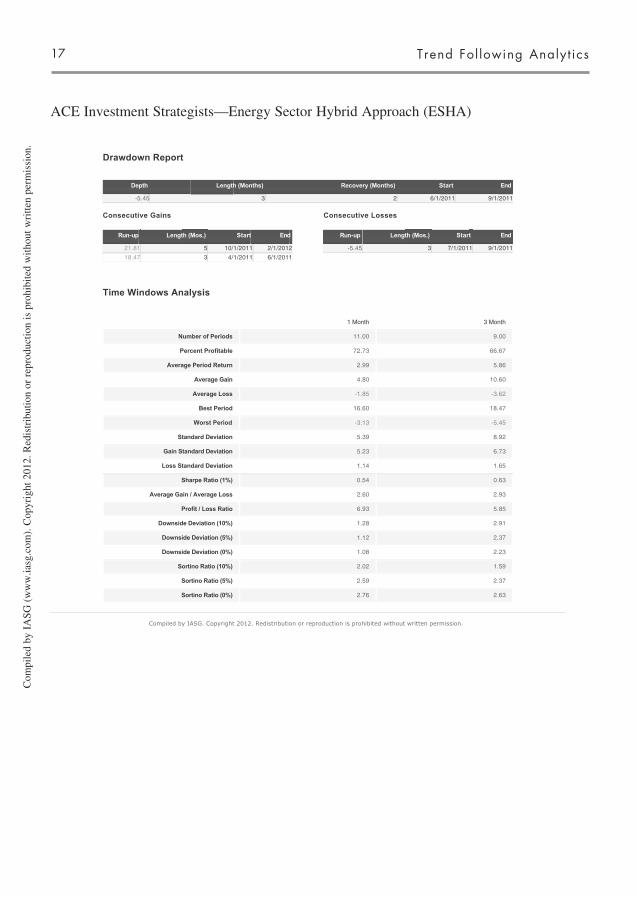
ACE Investment Strategists—Energy Sector Hybrid Approach (ESHA)
Cumulative Returns
Performance
PAST PERFORMANCE IS NOT NECESSARILY INDICATIVE OF FUTURE RESULTS. THE RISK OF LOSS IN TRADING COMMODITY FUTURES, OPTIONS, AND FOREIGN EXCHANGE ("FOREX") IS SUBSTANTIAL.
Strategy Description
ACE Investment Strategists : Energy Sector Hybrid Approach (ESHA)
YEAR-TO-DATE
9.43%3.71%
Minimum Investment $ 20k
Mgmt Fee 2.00%
Perf Fee 25.00%
Inception Apr 2011
Sharpe (RFR=1%) 1.87
CAROR -
Assets $ 6.6M
Worst DD -5.45
S&P Correlation 0.32
PAST PERFORMANCE IS NOT NECESSARILY INDICATIVE OF FUTURE RESULTS. THE RISK OF LOSS IN TRADING COMMODITY FUTURES, OPTIONS, AND FOREIGN EXCHANGE ("FOREX") IS SUBSTANTIAL.
Year Jan Feb Mar Apr May Jun Jul Aug Sep Oct Nov Dec YTD DD
2012 5.52 3.71 9.43 N/A
2011 16.60 1.45 0.15 -0.93 -1.48 -3.13 1.47 6.56 2.94 24.67 -5.45
Account & Fees
Type Managed Account
Minimum Account $ 20k
Trading Level Incremental Increase $ 0k
Management Fee 2.00%
Performance Fee 25.00%
Average Commission $0
Available to US Investors Yes
CTA Max Funding Factor
Subscriptions
Highwater Mark Yes
Subscription Frequency 1-7 Days
Redemption Frequency 1-7 Days
Investor Requirements Any Investor
Lock-up Period 0
Trading
Trading Frequency 6000
Avg. Margin-to-Equity 55.00%
Targeted WDD N/A
Worst Peak-to-Trough
Sector Focus: Energy Traders
Holding Periods
Over 12 Months 0%
4-12 Months 0%
1-3 Months 25.00%
1-30 Days 75.00%
Intraday 0%
Decision-Making
Discretionary 50.00%
Systematic 50.00%

ACE Investment Strategists—Energy Sector Hybrid Approach (ESHA)
Part I : Professional Trend Fol lowing Performance Track Records 16
Investment Strategy
"The objective of the ACE's Hybrid Approach Strategies is to enhance the consistency of overall returns by taking advantage of various market conditions with a vast array of investment vehicles and techniques. It is central to this trading strategy that ACE makes use of flexibility to match the optimum trading style to the specific market situation. It's an ""all market weather"" strategy approach in the sense that is tries trade the three stages of the market for optimum results. ""It's a simple formula: match the optimum trading approach to the current market environment and adjust as that changes. Of course, it's be bit more complex than that. It takes stern dedication to be that flexible and convicted to your trading program, disregarding all distractions. It takes experienced and seasoned trading."" The Energy Sector Hybrid Approach (ESHA) ACE shybrid strategy approach and applies it to the energy sector. The program focuses on the crude oil market. However, the program also has the versatility to trade heating oil, unleaded gasoline, natural gas, and energy spreads. ACE looks to take advantage of the long-term trends in the energy markets by utilizing outright futures contracts, inter and intra commodity spreads and/or options, depending on the strength and type of the ACE s signal and indicators. Volatility exploitation, swing trading, and trend following may also be incorporated in the ESHA trading. The appropriate investor for the ESHA will be someone who has had experience trading commodities, who is comfortable with frequent trading and exposure to higher than average risk in order to achieve potentially higher than average returns. It is suggested that at least 18 months should be allowed to evaluate performance of the ESHA strategy. Trading futures and options involves substantial risk
Statistics & Ratios
PAST PERFORMANCE IS NOT NECESSARILY INDICATIVE OF FUTURE RESULTS. THE RISK OF LOSS IN TRADING COMMODITY FUTURES, OPTIONS, AND FOREIGN EXCHANGE ("FOREX") IS SUBSTANTIAL.
Note: Figures shown in the Monthly column are the greatest figures (or worst for losses/drawdowns) for any particular month. The Annual figures are the greatest for any calendar year.
Reward Monthly Annual
Compound RoR: - -
Average RoR: - -
Max Gain: 16.60% 24.67%
Gain Frequency: 72.73% 100.00%
Average Gain: - -
Gain Deviation: 5.23% 18.12%
Risk
Standard Deviation: 5.39% 18.67%
Worst Loss: -3.13% N/A
Loss Frequency: 27.27% 0.00%
Average Loss: -1.85% N/A
Loss Deviation: 1.14% N/A
Reward/Risk
Sharpe Ratio: (RF=1%) 0.54 1.87
Correlation
S&P 500 Index 0.32
Composition
Energy 100.00%
Strategy
Counter-trend 20.00%Momentum 20.00%Option-writing 20.00%Technical 20.00%Trend-following 20.00%
Trend Fol lowing Analyt ics17
ACE Investment Strategists—Energy Sector Hybrid Approach (ESHA)
Drawdown Report
Time Windows Analysis
Depth Length (Months) Recovery (Months) Start End
-5.45 3 2 6/1/2011 9/1/2011
Consecutive Gains
Run-up Length (Mos.) Start End
21.81 5 10/1/2011 2/1/2012
18.47 3 4/1/2011 6/1/2011
Consecutive Losses
Run-up Length (Mos.) Start End
-5.45 3 7/1/2011 9/1/2011
1 Month 3 Month
Number of Periods 11.00 9.00
Percent Profitable 72.73 66.67
Average Period Return 2.99 5.86
Average Gain 4.80 10.60
Average Loss -1.85 -3.62
Best Period 16.60 18.47
Worst Period -3.13 -5.45
Standard Deviation 5.39 8.92
Gain Standard Deviation 5.23 6.73
Loss Standard Deviation 1.14 1.65
Sharpe Ratio (1%) 0.54 0.63
Average Gain / Average Loss 2.60 2.93
Profit / Loss Ratio 6.93 5.85
Downside Deviation (10%) 1.28 2.91
Downside Deviation (5%) 1.12 2.37
Downside Deviation (0%) 1.08 2.23
Sortino Ratio (10%) 2.02 1.59
Sortino Ratio (5%) 2.59 2.37
Sortino Ratio (0%) 2.76 2.63
Compiled by IASG. Copyright 2012. Redistribution or reproduction is prohibited without written permission.
Com
pile
d by
IA
SG (
ww
w.ia
sg.c
om).
Cop
yrig
ht 2
012.
Red
istr
ibut
ion
or r
epro
duct
ion
is p
rohi
bite
d w
ithou
t wri
tten
perm
issi
on.
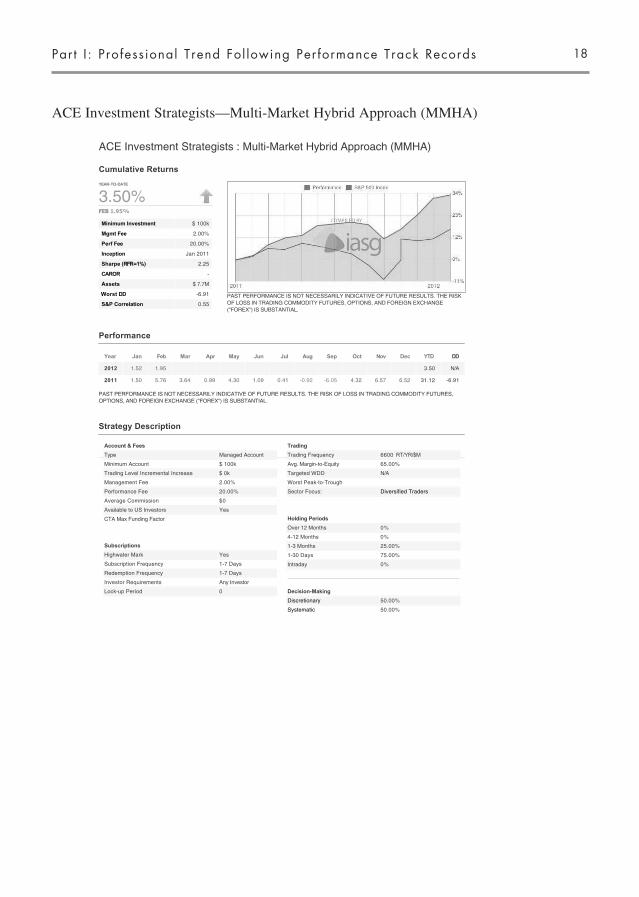
ACE Investment Strategists—Multi-Market Hybrid Approach (MMHA)
Part I : Professional Trend Fol lowing Performance Track Records 18
Cumulative Returns
Performance
PAST PERFORMANCE IS NOT NECESSARILY INDICATIVE OF FUTURE RESULTS. THE RISK OF LOSS IN TRADING COMMODITY FUTURES, OPTIONS, AND FOREIGN EXCHANGE ("FOREX") IS SUBSTANTIAL.
Strategy Description
ACE Investment Strategists : Multi-Market Hybrid Approach (MMHA)
YEAR-TO-DATE
3.50%1.95%
Minimum Investment $ 100k
Mgmt Fee 2.00%
Perf Fee 20.00%
Inception Jan 2011
Sharpe (RFR=1%) 2.25
CAROR -
Assets $ 7.7M
Worst DD -6.91
S&P Correlation 0.55
PAST PERFORMANCE IS NOT NECESSARILY INDICATIVE OF FUTURE RESULTS. THE RISK OF LOSS IN TRADING COMMODITY FUTURES, OPTIONS, AND FOREIGN EXCHANGE ("FOREX") IS SUBSTANTIAL.
Year Jan Feb Mar Apr May Jun Jul Aug Sep Oct Nov Dec YTD DD
2012 1.52 1.95 3.50 N/A
2011 1.50 5.76 3.64 0.99 4.30 1.09 0.41 -0.92 -6.05 4.32 6.57 6.52 31.12 -6.91
Account & Fees
Type Managed Account
Minimum Account $ 100k
Trading Level Incremental Increase $ 0k
Management Fee 2.00%
Performance Fee 20.00%
Average Commission $0
Available to US Investors Yes
CTA Max Funding Factor
Subscriptions
Highwater Mark Yes
Subscription Frequency 1-7 Days
Redemption Frequency 1-7 Days
Investor Requirements Any Investor
Lock-up Period 0
Trading
Trading Frequency 6600
Avg. Margin-to-Equity 65.00%
Targeted WDD N/A
Worst Peak-to-Trough
Sector Focus: Diversified Traders
Holding Periods
Over 12 Months 0%
4-12 Months 0%
1-3 Months 25.00%
1-30 Days 75.00%
Intraday 0%
Decision-Making
Discretionary 50.00%
Systematic 50.00%

Trend Fol lowing Analyt ics19
ACE Investment Strategists—Multi-Market Hybrid Approach (MMHA)
Summary
"The objective of the ACE's Hybrid Approach Strategies is to enhance the consistency of overall returns by taking advantage of various market conditions with a vast array of investment vehicles and techniques. It is central to this trading strategy that ACE makes use of flexibility to match the optimum trading style to the specific market situation. It's an ""all market weather"" strategy approach in the sense that is tries trade the three stages of the market for optimum results. ""It's a simple formula: match the optimum trading approach to the current market environment and adjust as that changes. Of course, it's be bit more complex than that. It takes stern dedication to be that flexible and convicted to your trading program, disregarding all distractions. It takes experienced and seasoned trading."" The Multi-Market Hybrid Approach (MMHA) strategy combines the use of Stock Indices used in the SIHA strategy and selected commodity futures and options to offer the potential of greater returns than the stock index strategy alone due to the low correlation of performance between and among stocks and many commodity markets. ACE may choose to use spreads, be long or short the future or the option, or swing-trade the future, or apply dollar-cost-averaging approaches, or other trading styles, very much directed by, and in sync with, the market situation at the time. ACE selects commodities opportunistically and consistent with their liquidity and timeliness. Examples of commodity categories likely to be included are foreign currencies, the credit markets, precious metals, energy products, grains, softs and the meat complex, among others. Each commodity market has unique characteristics and therefore is subject to unique trading parameters and style. ACE determines position-size accordingly. Strict risk management techniques are an integral part of the strategy using predetermined stop loss points which are designed to limit losses and protect gains. The use of stop loss or contingent orders may not protect profits or limit losses to the amounts intended. Certain market conditions make it difficult or impossible to execute such orders. The appropriate investor for the MMHA will be someone who has had experience trading commodities, who is comfortable with frequent trading and exposure to higher than average risk in order to achieve potentially higher than average returns. It is suggested that at least 20 months should be allowed to evaluate performance of the MMHA strategy. Trading futures and options involves substantial risk of loss and is not suitable for all investors. The risk of loss in options writing programs is unlimited. Past performance is not necessarily indicative of future results."
Statistics & Ratios
PAST PERFORMANCE IS NOT NECESSARILY INDICATIVE OF FUTURE RESULTS. THE RISK OF LOSS IN TRADING COMMODITY FUTURES, OPTIONS, AND FOREIGN EXCHANGE ("FOREX") IS SUBSTANTIAL.
Note: Figures shown in the Monthly column are the greatest figures (or worst for losses/drawdowns) for any particular month. The Annual figures are the greatest for any calendar year.
Reward Monthly Annual
Compound RoR: - -
Average RoR: - -
Max Gain: 6.57% 31.12%
Gain Frequency: 85.71% 100.00%
Average Gain: - -
Gain Deviation: 2.26% 7.81%
Risk
Standard Deviation: 3.35% 11.61%
Worst Loss: -6.05% N/A
Loss Frequency: 14.29% 0.00%
Average Loss: -3.49% N/A
Loss Deviation: 3.63% N/A
Reward/Risk
Sharpe Ratio: (RF=1%) 0.65 2.25
Correlation
S&P 500 Index 0.55
Composition
Currency Futures 10.00%Currency FX 10.00%Industrial Metals 10.00%Precious Metals 10.00%Energy 10.00%Grains 10.00%Interest Rates 10.00%Livestock 10.00%Softs 10.00%Stock Indices 10.00%
Strategy
Counter-trend 25.00%Option-writing 25.00%Technical 25.00%Trend-following 25.00%

ACE Investment Strategists—Multi-Market Hybrid Approach (MMHA)
Part I : Professional Trend Fol lowing Performance Track Records 20
Drawdown Report
Time Windows Analysis
Depth Length (Months) Recovery (Months) Start End
-6.91 2 2 7/1/2011 9/1/2011
Consecutive Gains
Run-up Length (Mos.) Start End
22.57 5 10/1/2011 2/1/2012
18.95 7 1/1/2011 7/1/2011
Consecutive Losses
Run-up Length (Mos.) Start End
-6.91 2 8/1/2011 9/1/2011
1 Month 3 Month 6 Month
Number of Periods 14.00 12.00 9.00
Percent Profitable 85.71 83.33 88.89
Average Period Return 2.26 6.91 10.06
Average Gain 3.21 9.24 11.38
Average Loss -3.49 -4.71 -0.48
Best Period 6.57 18.42 18.46
Worst Period -6.05 -6.53 -0.48
Standard Deviation 3.35 7.23 6.52
Gain Standard Deviation 2.26 5.21 5.54
Loss Standard Deviation 3.63 2.57
Sharpe Ratio (1%) 0.65 0.92 1.47
Average Gain / Average Loss 0.92 1.96 23.94
Profit / Loss Ratio 5.53 9.80 191.54
Downside Deviation (10%) 1.76 2.54 0.98
Downside Deviation (5%) 1.66 2.16 0.32
Downside Deviation (0%) 1.64 2.06 0.16
Sortino Ratio (10%) 1.05 2.24 7.74
Sortino Ratio (5%) 1.31 3.09 29.46
Sortino Ratio (0%) 1.38 3.35 63.51
Compiled by IASG. Copyright 2012. Redistribution or reproduction is prohibited without written permission.
Com
piled by IASG
(ww
w.iasg.com
). Copyright 2012. R
edistribution or reproduction is prohibited without w
ritten permission.

Trend Fol lowing Analyt ics21
Adalpha Asset Management, LLC—Adalpha Diversified Short-Term Program
Cumulative Returns
Performance
PAST PERFORMANCE IS NOT NECESSARILY INDICATIVE OF FUTURE RESULTS. THE RISK OF LOSS IN TRADING COMMODITY FUTURES, OPTIONS, AND FOREIGN EXCHANGE ("FOREX") IS SUBSTANTIAL.
Strategy Description
Adalpha Asset Management, LLC : Adalpha Diversified Short-TermProgram
YEAR-TO-DATE
4.10%-2.23%
Minimum Investment $ 1,000k
Mgmt Fee 0%
Perf Fee 20.00%
Inception Apr 2003
Sharpe (RFR=1%) 0.82
CAROR 12.47%
Assets $ 2.0M
Worst DD -13.75
S&P Correlation -0.16
PAST PERFORMANCE IS NOT NECESSARILY INDICATIVE OF FUTURE RESULTS. THE RISK OF LOSS IN TRADING COMMODITY FUTURES, OPTIONS, AND FOREIGN EXCHANGE ("FOREX") IS SUBSTANTIAL.
Year Jan Feb Mar Apr May Jun Jul Aug Sep Oct Nov Dec YTD DD
2012 -1.91 -2.23 -4.10 -4.10
2011 -0.41 1.35 -4.67 2.32 0.75 -1.34 1.86 4.62 3.21 -2.28 -1.67 1.69 5.17 -4.67
2010 0.08 -3.42 -0.49 -1.07 7.66 -0.31 0.47 0.73 1.82 -0.44 -2.23 -1.76 0.63 -4.92
2009 -1.54 1.11 1.19 0.70 6.33 -4.13 -2.59 0.95 -0.94 0.64 4.61 -2.39 3.52 -6.61
2008 -0.58 6.76 0.75 -1.70 0.69 0.29 -1.52 3.95 -2.73 22.41 1.02 0.17 30.93 -2.73
2007 3.29 -5.64 -3.56 3.88 2.46 3.20 -0.20 -8.61 2.41 7.45 2.55 -0.30 5.94 -9.00
2006 3.73 -0.27 7.40 2.85 -3.05 2.16 0.75 1.47 -0.66 1.57 -0.58 1.21 17.47 -3.05
2005 -3.31 -5.71 0.95 -3.42 5.65 7.12 3.98 -2.47 2.87 -3.58 5.88 3.17 10.53 -11.11
2004 7.05 4.78 2.10 1.64 5.83 -1.74 0.95 -5.13 5.61 -3.21 6.91 -2.97 22.92 -5.90
2003 -0.85 1.80 -7.96 -1.38 5.53 4.73 9.56 2.02 8.34 22.62 -9.23
Account & Fees
Type Managed Account
Minimum Account $ 1,000k
Trading Level Incremental Increase $ 0k
Management Fee 0%
Performance Fee 20.00%
Average Commission $0
Available to US Investors Yes
CTA Max Funding Factor
Subscriptions
Highwater Mark Yes
Subscription Frequency Daily
Redemption Frequency Daily
Investor Requirements Qualified Eligible Persons (QEP)
Lock-up Period 0
Trading
Trading Frequency 2500
Avg. Margin-to-Equity 3.00%
Targeted WDD N/A
Worst Peak-to-Trough 0%
Sector Focus: Diversified Traders
Holding Periods
Over 12 Months 0%
4-12 Months 0%
1-3 Months 0%
1-30 Days 65.00%
Intraday 35.00%
Decision-Making
Discretionary 0%
Systematic 100.00%

Adalpha Asset Management, LLC—Adalpha Diversified Short-Term Program
Part I : Professional Trend Fol lowing Performance Track Records 22
Summary
Adalpha Asset Management, LLC is an alternative investment management company that employs an institutional quality managedfutures program designed to consistently produce high absolute returns adjusted for risk. The program is diversified, short-term and 100% systematic. It utilizes multiple momentum-based systems which incorporate price, time, volatility and pattern recognition into its dynamic models. These elements are combined to generate high probability directional trading signals, which attempt to capitalize on the many short-term trends that are present in most types of market environments.Qualified investors have the potential to achieve superior capital appreciation with sound risk management and low correlation to traditional investments, regardless of the overall direction of individual markets or asset classes.If you would like more information about Adalpha Asset Management, LLC or how its managed futures program can be of benefit to your portfolio please contact us. Returns are based on proforma adjustments to a proprietary account to reflect fees. Client accounts will be traded in like fashion.
Statistics & Ratios
PAST PERFORMANCE IS NOT NECESSARILY INDICATIVE OF FUTURE RESULTS. THE RISK OF LOSS IN TRADING COMMODITY FUTURES, OPTIONS, AND FOREIGN EXCHANGE ("FOREX") IS SUBSTANTIAL.
Note: Figures shown in the Monthly column are the greatest figures (or worst for losses/drawdowns) for any particular month. The Annual figures are the greatest for any calendar year.
Reward Monthly Annual
Compound RoR: 0.98% 12.47%
Average RoR: 1.07% 12.97%
Max Gain: 22.41% 30.93%
Gain Frequency: 58.88% 98.13%
Average Gain: 3.51% 13.69%
Gain Deviation: 3.43% 11.89%
Risk
Standard Deviation: 4.13% 14.31%
Worst Loss: -8.61% -4.10%
Loss Frequency: 41.12% 1.87%
Average Loss: -2.43% -24.58%
Loss Deviation: 1.96% 6.79%
Reward/Risk
Sharpe Ratio: (RF=1%) 0.24 0.82
Correlation
S&P 500 Index -0.16
Composition
Currency Futures 22.00%Industrial Metals 3.00%Precious Metals 9.00%Energy 14.00%Grains 14.00%Interest Rates 14.00%Livestock 3.00%Softs 7.00%Stock Indices 14.00%
Strategy
Counter-trend 50.00%Trend-following 50.00%

Trend Fol lowing Analyt ics23
Adalpha Asset Management, LLC—Adalpha Diversified Short-Term Program
Drawdown Report
Time Windows Analysis
Depth Length (Months) Recovery (Months) Start End
-13.75 5 3 11/1/2004 4/1/2005
-9.23 2 2 5/1/2003 7/1/2003-9.00 2 7 1/1/2007 3/1/2007
-8.68 11 5 5/1/2009 4/1/2010-7.99 6 6 9/1/2010 3/1/2011
Consecutive Gains
Run-up Length (Mos.) Start End
64.87 10 8/1/2003 5/1/2004
23.87 3 10/1/2008 12/1/200817.68 3 5/1/2005 7/1/2005
13.31 3 11/1/2005 1/1/200612.85 3 9/1/2007 11/1/2007
Consecutive Losses
Run-up Length (Mos.) Start End
-11.54 3 12/1/2004 2/1/2005
-9.23 2 6/1/2003 7/1/2003-9.00 2 2/1/2007 3/1/2007
-8.79 2 7/1/2007 8/1/2007-6.61 2 6/1/2009 7/1/2009
1 Month 3 Month 6 Month 12 Month 18 Month 2 Year 3 Year 4 Year 5 Year
Number of Periods
107.00 105.00 102.00 96.00 90.00 84.00 72.00 60.00 48.00
PercentProfitable
58.88 63.81 73.53 84.38 93.33 96.43 100.00 100.00 100.00
AveragePeriodReturn
1.07 3.36 7.26 14.10 20.31 27.58 46.75 65.02 87.17
AverageGain
3.51 7.28 10.89 17.13 21.87 28.68 46.75 65.02 87.17
AverageLoss
-2.43 -3.55 -2.82 -2.29 -1.40 -2.04
BestPeriod
22.41 23.87 43.27 63.54 62.25 72.08 107.36 120.11 141.83
WorstPeriod
-8.61 -11.54 -8.88 -6.29 -2.57 -4.20 5.54 29.61 44.32
StandardDeviation
4.13 7.45 10.74 15.56 15.53 15.77 21.65 21.90 28.15
GainStandardDeviation
3.43 6.33 10.23 15.07 14.91 14.96 21.65 21.90 28.15
LossStandardDeviation
1.96 2.83 2.59 2.04 0.85 1.93
SharpeRatio (1%)
0.24 0.42 0.63 0.84 1.21 1.62 2.02 2.78 2.92
AverageGain /
AverageLoss
1.44 2.05 3.86 7.48 15.64 14.06
Profit / Loss Ratio
2.07 3.62 10.73 40.38 218.93 379.52
DownsideDeviation
(10%)2.20 3.33 3.05 3.29 2.99 3.23 1.94
DownsideDeviation
(5%)2.04 2.83 2.15 1.52 0.79 0.83
DownsideDeviation
(0%)1.99 2.71 1.95 1.20 0.41 0.49
SortinoRatio (10%)
0.30 0.64 1.57 2.76 4.26 5.37 15.94
SortinoRatio (5%)
0.48 1.10 3.15 8.60 23.73 30.86
SortinoRatio (0%)
0.53 1.24 3.72 11.79 49.24 56.62
Compiled by IASG. Copyright 2012. Redistribution or reproduction is prohibited without written permission.
Com
pile
d by
IA
SG (
ww
w.ia
sg.c
om).
Cop
yrig
ht 2
012.
Red
istr
ibut
ion
or r
epro
duct
ion
is p
rohi
bite
d w
ithou
t wri
tten
perm
issi
on.

Adamah Capital, LLC—Diversified Program
Part I : Professional Trend Fol lowing Performance Track Records 24
Cumulative Returns
Performance
PAST PERFORMANCE IS NOT NECESSARILY INDICATIVE OF FUTURE RESULTS. THE RISK OF LOSS IN TRADING COMMODITY FUTURES, OPTIONS, AND FOREIGN EXCHANGE ("FOREX") IS SUBSTANTIAL.
Strategy Description
Adamah Capital LLC : Diversified Program
YEAR-TO-DATE
1.80%-1.50%
Minimum Investment $ 250k
Mgmt Fee 2.00%
Perf Fee 20.00%
Inception Mar 2011
Sharpe (RFR=1%) -0.97
CAROR -
Assets $ 250k
Worst DD -12.86
S&P Correlation -0.02
PAST PERFORMANCE IS NOT NECESSARILY INDICATIVE OF FUTURE RESULTS. THE RISK OF LOSS IN TRADING COMMODITY FUTURES, OPTIONS, AND FOREIGN EXCHANGE ("FOREX") IS SUBSTANTIAL.
Year Jan Feb Mar Apr May Jun Jul Aug Sep Oct Nov Dec YTD DD
2012 -0.30 -1.50 -1.80 -1.80
2011 2.20 3.20 -3.60 -6.80 0.30 1.00 -1.60 -1.90 1.00 0.00 -6.41 -12.14
Account & Fees
Type Managed Account
Minimum Account $ 250k
Trading Level Incremental Increase $ 250k
Management Fee 2.00%
Performance Fee 20.00%
Average Commission $15.00
Available to US Investors Yes
CTA Max Funding Factor 2.50
Subscriptions
Highwater Mark Yes
Subscription Frequency Daily
Redemption Frequency Daily
Investor Requirements Qualified Eligible Persons (QEP)
Lock-up Period 0
Trading
Trading Frequency 1600
Avg. Margin-to-Equity 10.00%
Targeted WDD -29.00%
Worst Peak-to-Trough 5.00%
Sector Focus: Diversified Traders
Holding Periods
Over 12 Months 2.00%
4-12 Months 10.00%
1-3 Months 40.00%
1-30 Days 46.00%
Intraday 2.00%
Decision-Making
Discretionary 0%
Systematic 100.00%

Trend Fol lowing Analyt ics25
Adamah Capital, LLC—Diversified Program
Summary
Adamah s Diversified program combines concepts of post-ModernPortfolio Theory, rigorous risk management, and robust quantitative trading systems. The program applies machine-learning techniques and achieves diversification from both timeframe and market sectors.
Investment Strategy
The Diversified program focuses on intermediate and long-term trends, with short-term approaches to improve diversification and minimize drawdown volatility. The program trades the major liquid futures markets including currencies, bonds, metals, energy, agriculture, softs & meats.
Risk Management
Adamah believes that risk management is at least as important as trade signal generation. Risk is controlled on a variety of levels, including the trade/market, sector, and portfolio level. Several proprietary measures of risk are used to monitor volatility and range. Risk per trade is computed dynamically, but is typically less than the 1%-1.5% range.
Statistics & Ratios
PAST PERFORMANCE IS NOT NECESSARILY INDICATIVE OF FUTURE RESULTS. THE RISK OF LOSS IN TRADING COMMODITY FUTURES, OPTIONS, AND FOREIGN EXCHANGE ("FOREX") IS SUBSTANTIAL.
Note: Figures shown in the Monthly column are the greatest figures (or worst for losses/drawdowns) for any particular month. The Annual figures are the greatest for any calendar year.
Reward Monthly Annual
Compound RoR: - -
Average RoR: - -
Max Gain: 3.20% -1.80%
Gain Frequency: 41.67% 0.00%
Average Gain: - -
Gain Deviation: 1.15% 0.00%
Risk
Standard Deviation: 2.69% 9.32%
Worst Loss: -6.80% -6.41%
Loss Frequency: 58.33% 100.00%
Average Loss: -2.62% -8.21%
Loss Deviation: 2.31% 7.99%
Reward/Risk
Sharpe Ratio: (RF=1%) -0.28 -0.97
Correlation
S&P 500 Index -0.02
Composition
Currency Futures 20.00%Industrial Metals 10.00%Precious Metals 10.00%Energy 15.00%Grains 10.00%Interest Rates 15.00%Livestock 10.00%Softs 10.00%
Strategy
Counter-trend 10.00%Momentum 20.00%Pattern Recognition 20.00%Technical 20.00%Trend-following 20.00%Other 10.00%

Adamah Capital, LLC—Diversified Program
Part I : Professional Trend Fol lowing Performance Track Records 26
Drawdown Report
Time Windows Analysis
Depth Length (Months) Recovery (Months) Start End
-12.86 10 - 4/1/2011 2/1/2012
Consecutive Gains
Run-up Length (Mos.) Start End
5.47 2 3/1/2011 4/1/2011
1.30 2 7/1/2011 8/1/20111.00 1 11/1/2011 11/1/2011
Consecutive Losses
Run-up Length (Mos.) Start End
-10.16 2 5/1/2011 6/1/2011
-3.47 2 9/1/2011 10/1/2011-1.80 3 12/1/2011 2/1/2012
1 Month 3 Month 6 Month
Number of Periods 12.00 10.00 7.00
Percent Profitable 41.67 20.00 0.00
Average Period Return -0.67 -2.84 -5.57
Average Gain 1.54 1.19
Average Loss -2.62 -3.85 -5.57
Best Period 3.20 1.67 -1.23
Worst Period -6.80 -9.89 -12.14
Standard Deviation 2.69 3.67 3.87
Gain Standard Deviation 1.15 0.69
Loss Standard Deviation 2.31 3.38 3.87
Sharpe Ratio (1%) -0.28 -0.84 -1.57
Average Gain / Average Loss 0.59 0.31
Profit / Loss Ratio 0.49 0.08
Downside Deviation (10%) 2.61 5.35 8.80
Downside Deviation (5%) 2.42 4.63 7.05
Downside Deviation (0%) 2.38 4.46 6.62
Sortino Ratio (10%) -0.41 -0.76 -0.91
Sortino Ratio (5%) -0.31 -0.67 -0.86
Sortino Ratio (0%) -0.28 -0.64 -0.84
Compiled by IASG. Copyright 2012. Redistribution or reproduction is prohibited without written permission.
Com
piled by IASG
(ww
w.iasg.com
). Copyright 2012. R
edistribution or reproduction is prohibited without w
ritten permission.

Trend Fol lowing Analyt ics27
Adamah Capital, LLC—Global Macro Program
Cumulative Returns
Performance
PAST PERFORMANCE IS NOT NECESSARILY INDICATIVE OF FUTURE RESULTS. THE RISK OF LOSS IN TRADING COMMODITY FUTURES, OPTIONS, AND FOREIGN EXCHANGE ("FOREX") IS SUBSTANTIAL.
Strategy Description
Adamah Capital LLC : Global Macro Program
YEAR-TO-DATE
1.20%-1.00%
Minimum Investment $ 450k
Mgmt Fee 2.00%
Perf Fee 20.00%
Inception Mar 2011
Sharpe (RFR=1%) -1.48
CAROR -
Assets $ 450k
Worst DD -12.85
S&P Correlation 0.45
PAST PERFORMANCE IS NOT NECESSARILY INDICATIVE OF FUTURE RESULTS. THE RISK OF LOSS IN TRADING COMMODITY FUTURES, OPTIONS, AND FOREIGN EXCHANGE ("FOREX") IS SUBSTANTIAL.
Year Jan Feb Mar Apr May Jun Jul Aug Sep Oct Nov Dec YTD DD
2012 -0.20 -1.00 -1.20 -1.20
2011 1.60 2.10 -3.00 -5.10 -0.30 -3.20 -1.70 0.10 0.90 0.00 -8.50 -12.67
Account & Fees
Type Managed Account
Minimum Account $ 450k
Trading Level Incremental Increase $ 450k
Management Fee 2.00%
Performance Fee 20.00%
Average Commission $14.00
Available to US Investors Yes
CTA Max Funding Factor 2.50
Subscriptions
Highwater Mark Yes
Subscription Frequency Daily
Redemption Frequency Daily
Investor Requirements Qualified Eligible Persons (QEP)
Lock-up Period 0
Trading
Trading Frequency 1600
Avg. Margin-to-Equity 11.00%
Targeted WDD -29.00%
Worst Peak-to-Trough 5.00%
Sector Focus: Diversified Traders
Holding Periods
Over 12 Months 2.00%
4-12 Months 10.00%
1-3 Months 33.00%
1-30 Days 50.00%
Intraday 5.00%
Decision-Making
Discretionary 0%
Systematic 100.00%

Adamah Capital, LLC—Global Macro Program
Part I : Professional Trend Fol lowing Performance Track Records 28
Summary
Adamah s Global Macro program combines concepts of post-ModernPortfolio Theory, rigorous risk management, and robust quantitative trading systems. The program applies machine-learning techniques and achieves diversification from both timeframe and market sectors.
Investment Strategy
Adamah s Global Macro program combines the firm s quantitative trading programs (Diversified, Short-Term & Asset Allocator) into a well-diversified global macro strategy. The Global Macro program offers broad diversification across trading strategies, time-frames, and major market sectors. The program trades the major liquid futures markets including stock indices, currencies, bonds, metals, energy, agriculture, softs & meats.
Risk Management
Adamah believes that risk management is at least as important as trade signal generation. Risk is controlled on a variety of levels, including the trade/market, sector, and portfolio level. Several proprietary measures of risk are used to monitor volatility and range. Risk per trade is computed dynamically, but is typically less than the 1%-1.5% range.
Statistics & Ratios
PAST PERFORMANCE IS NOT NECESSARILY INDICATIVE OF FUTURE RESULTS. THE RISK OF LOSS IN TRADING COMMODITY FUTURES, OPTIONS, AND FOREIGN EXCHANGE ("FOREX") IS SUBSTANTIAL.
Note: Figures shown in the Monthly column are the greatest figures (or worst for losses/drawdowns) for any particular month. The Annual figures are the greatest for any calendar year.
Reward Monthly Annual
Compound RoR: - -
Average RoR: - -
Max Gain: 2.10% -1.20%
Gain Frequency: 33.33% 0.00%
Average Gain: - -
Gain Deviation: 0.87% 0.00%
Risk
Standard Deviation: 2.11% 7.32%
Worst Loss: -5.10% -8.50%
Loss Frequency: 66.67% 100.00%
Average Loss: -2.07% -9.70%
Loss Deviation: 1.79% 6.20%
Reward/Risk
Sharpe Ratio: (RF=1%) -0.43 -1.48
Correlation
S&P 500 Index 0.45
Composition
Currency Futures 15.00%Industrial Metals 8.00%Precious Metals 10.00%Energy 10.00%Grains 8.00%Interest Rates 17.00%Livestock 5.00%Softs 5.00%Stock Indices 17.00%VIX 5.00%
Strategy
Counter-trend 10.00%Momentum 20.00%Pattern Recognition 20.00%Technical 20.00%Trend-following 20.00%Other 10.00%

Trend Fol lowing Analyt ics29
Adamah Capital, LLC—Global Macro Program
Drawdown Report
Time Windows Analysis
Depth Length (Months) Recovery (Months) Start End
-12.85 10 - 4/1/2011 2/1/2012
Consecutive Gains
Run-up Length (Mos.) Start End
3.73 2 3/1/2011 4/1/2011
1.00 2 10/1/2011 11/1/2011
Consecutive Losses
Run-up Length (Mos.) Start End
-12.67 5 5/1/2011 9/1/2011
-1.20 3 12/1/2011 2/1/2012
1 Month 3 Month 6 Month
Number of Periods 12.00 10.00 7.00
Percent Profitable 33.33 30.00 0.00
Average Period Return -0.82 -3.21 -7.21
Average Gain 1.18 0.77
Average Loss -2.07 -4.92 -7.21
Best Period 2.10 1.00 -1.91
Worst Period -5.10 -8.41 -12.58
Standard Deviation 2.11 3.71 3.94
Gain Standard Deviation 0.87 0.20
Loss Standard Deviation 1.79 3.05 3.94
Sharpe Ratio (1%) -0.43 -0.93 -1.96
Average Gain / Average Loss 0.57 0.16
Profit / Loss Ratio 0.32 0.07
Downside Deviation (10%) 2.28 5.67 10.35
Downside Deviation (5%) 2.08 4.93 8.53
Downside Deviation (0%) 2.03 4.75 8.08
Sortino Ratio (10%) -0.54 -0.78 -0.94
Sortino Ratio (5%) -0.43 -0.70 -0.90
Sortino Ratio (0%) -0.40 -0.68 -0.89
Compiled by IASG. Copyright 2012. Redistribution or reproduction is prohibited without written permission.
Com
pile
d by
IA
SG (
ww
w.ia
sg.c
om).
Cop
yrig
ht 2
012.
Red
istr
ibut
ion
or r
epro
duct
ion
is p
rohi
bite
d w
ithou
t wri
tten
perm
issi
on.

Adamah Capital, LLC—Short-Term Program
Part I : Professional Trend Fol lowing Performance Track Records 30
Cumulative Returns
Performance
PAST PERFORMANCE IS NOT NECESSARILY INDICATIVE OF FUTURE RESULTS. THE RISK OF LOSS IN TRADING COMMODITY FUTURES, OPTIONS, AND FOREIGN EXCHANGE ("FOREX") IS SUBSTANTIAL.
Strategy Description
Adamah Capital LLC : Short-Term Program
YEAR-TO-DATE
0.20%-0.20%
Minimum Investment $ 50k
Mgmt Fee 2.00%
Perf Fee 20.00%
Inception Dec 2010
Sharpe (RFR=1%) -0.32
CAROR -
Assets $ 100k
Worst DD -16.67
S&P Correlation 0.31
PAST PERFORMANCE IS NOT NECESSARILY INDICATIVE OF FUTURE RESULTS. THE RISK OF LOSS IN TRADING COMMODITY FUTURES, OPTIONS, AND FOREIGN EXCHANGE ("FOREX") IS SUBSTANTIAL.
Year Jan Feb Mar Apr May Jun Jul Aug Sep Oct Nov Dec YTD DD
2012 0.00 -0.20 -0.20 -0.20
2011 1.40 4.80 1.90 2.10 -4.20 -3.50 -4.00 -5.90 1.50 -1.50 0.00 0.00 -7.69 -16.51
2010 4.50 4.50 N/A
Account & Fees
Type Managed Account
Minimum Account $ 50k
Trading Level Incremental Increase $ 50k
Management Fee 2.00%
Performance Fee 20.00%
Average Commission $12.00
Available to US Investors Yes
CTA Max Funding Factor 2.00
Subscriptions
Highwater Mark Yes
Subscription Frequency Daily
Redemption Frequency Daily
Investor Requirements Qualified Eligible Persons (QEP)
Lock-up Period 0
Trading
Trading Frequency 2000
Avg. Margin-to-Equity 7.00%
Targeted WDD -29.00%
Worst Peak-to-Trough 5.00%
Sector Focus: Stock Index Traders
Holding Periods
Over 12 Months 0%
4-12 Months 0%
1-3 Months 2.00%
1-30 Days 65.00%
Intraday 33.00%
Decision-Making
Discretionary 0%
Systematic 100.00%
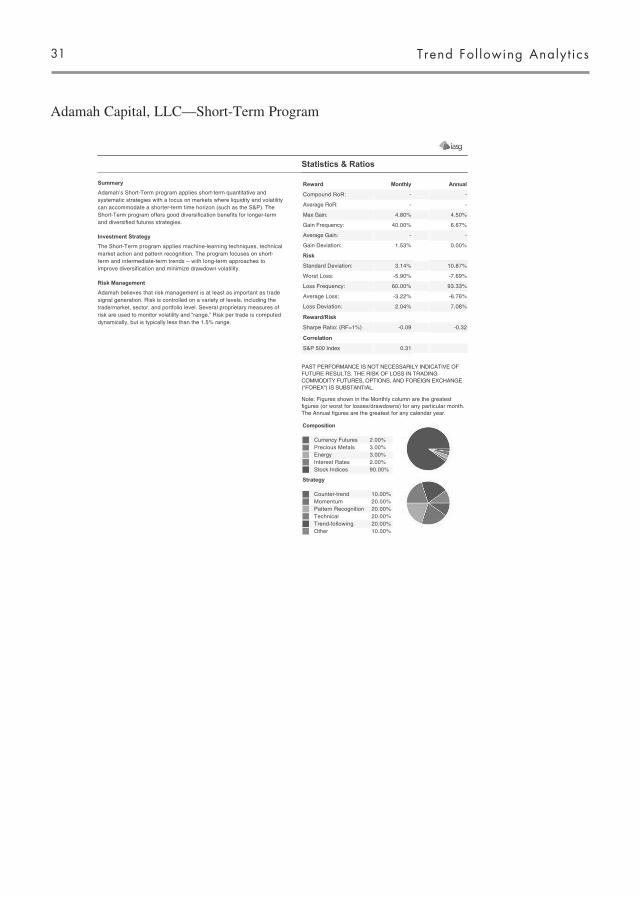
Trend Fol lowing Analyt ics31
Adamah Capital, LLC—Short-Term Program
Summary
Adamah s Short-Term program applies short-term quantitative and systematic strategies with a focus on markets where liquidity and volatility can accommodate a shorter-term time horizon (such as the S&P). The Short-Term program offers good diversification benefits for longer-termand diversified futures strategies.
Investment Strategy
The Short-Term program applies machine-learning techniques, technical market action and pattern recognition. The program focuses on short-term and intermediate-term trends -- with long-term approaches to improve diversification and minimize drawdown volatility.
Risk Management
Adamah believes that risk management is at least as important as trade signal generation. Risk is controlled on a variety of levels, including the trade/market, sector, and portfolio level. Several proprietary measures of risk are used to monitor volatility and range. Risk per trade is computed dynamically, but is typically less than the 1.5% range.
Statistics & Ratios
PAST PERFORMANCE IS NOT NECESSARILY INDICATIVE OF FUTURE RESULTS. THE RISK OF LOSS IN TRADING COMMODITY FUTURES, OPTIONS, AND FOREIGN EXCHANGE ("FOREX") IS SUBSTANTIAL.
Note: Figures shown in the Monthly column are the greatest figures (or worst for losses/drawdowns) for any particular month. The Annual figures are the greatest for any calendar year.
Reward Monthly Annual
Compound RoR: - -
Average RoR: - -
Max Gain: 4.80% 4.50%
Gain Frequency: 40.00% 6.67%
Average Gain: - -
Gain Deviation: 1.53% 0.00%
Risk
Standard Deviation: 3.14% 10.87%
Worst Loss: -5.90% -7.69%
Loss Frequency: 60.00% 93.33%
Average Loss: -3.22% -6.76%
Loss Deviation: 2.04% 7.08%
Reward/Risk
Sharpe Ratio: (RF=1%) -0.09 -0.32
Correlation
S&P 500 Index 0.31
Composition
Currency Futures 2.00%Precious Metals 3.00%Energy 3.00%Interest Rates 2.00%Stock Indices 90.00%
Strategy
Counter-trend 10.00%Momentum 20.00%Pattern Recognition 20.00%Technical 20.00%Trend-following 20.00%Other 10.00%

Adamah Capital, LLC—Short-Term Program
Part I : Professional Trend Fol lowing Performance Track Records 32
Drawdown Report
Time Windows Analysis
Depth Length (Months) Recovery (Months) Start End
-16.67 10 - 4/1/2011 2/1/2012
Consecutive Gains
Run-up Length (Mos.) Start End
15.54 5 12/1/2010 4/1/2011
1.50 1 9/1/2011 9/1/2011
Consecutive Losses
Run-up Length (Mos.) Start End
-16.49 4 5/1/2011 8/1/2011
-1.70 5 10/1/2011 2/1/2012
1 Month 3 Month 6 Month
Number of Periods 15.00 13.00 10.00
Percent Profitable 40.00 23.08 20.00
Average Period Return -0.21 -1.35 -6.21
Average Gain 2.70 9.46 6.45
Average Loss -3.22 -5.11 -9.37
Best Period 4.80 11.05 10.68
Worst Period -5.90 -12.83 -16.51
Standard Deviation 3.14 7.51 8.58
Gain Standard Deviation 1.53 1.43 5.99
Loss Standard Deviation 2.04 4.93 5.69
Sharpe Ratio (1%) -0.09 -0.21 -0.78
Average Gain / Average Loss 0.84 1.85 0.69
Profit / Loss Ratio 0.84 0.62 0.17
Downside Deviation (10%) 2.58 6.55 11.61
Downside Deviation (5%) 2.40 5.90 10.03
Downside Deviation (0%) 2.35 5.75 9.64
Sortino Ratio (10%) -0.24 -0.39 -0.75
Sortino Ratio (5%) -0.12 -0.27 -0.67
Sortino Ratio (0%) -0.09 -0.24 -0.64
Compiled by IASG. Copyright 2012. Redistribution or reproduction is prohibited without written permission.
Com
piled by IASG
(ww
w.iasg.com
). Copyright 2012. R
edistribution or reproduction is prohibited without w
ritten permission.
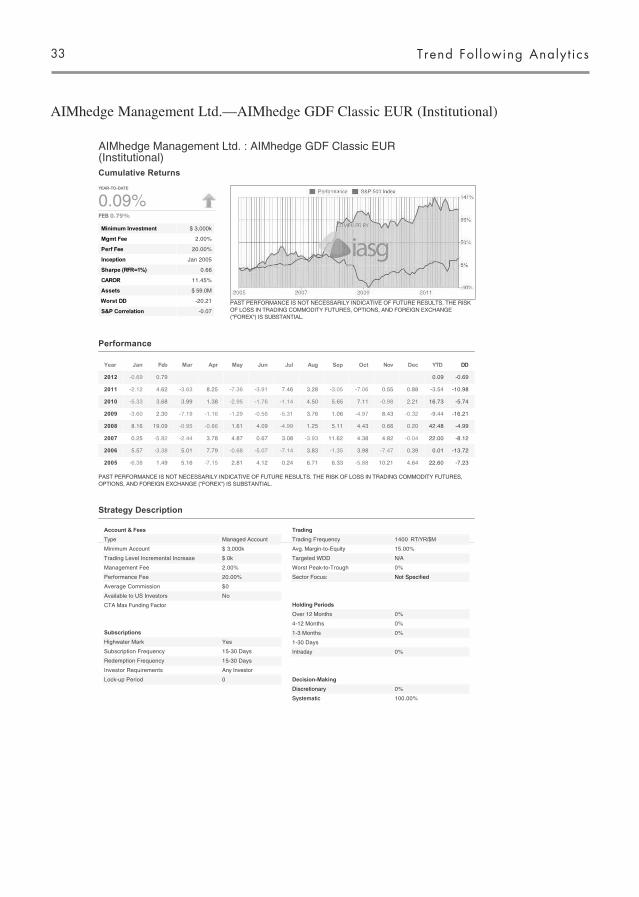
Trend Fol lowing Analyt ics33
AIMhedge Management Ltd.—AIMhedge GDF Classic EUR (Institutional)
Cumulative Returns
Performance
PAST PERFORMANCE IS NOT NECESSARILY INDICATIVE OF FUTURE RESULTS. THE RISK OF LOSS IN TRADING COMMODITY FUTURES, OPTIONS, AND FOREIGN EXCHANGE ("FOREX") IS SUBSTANTIAL.
Strategy Description
AIMhedge Management Ltd. : AIMhedge GDF Classic EUR (Institutional)
YEAR-TO-DATE
0.09%0.79%
Minimum Investment $ 3,000k
Mgmt Fee 2.00%
Perf Fee 20.00%
Inception Jan 2005
Sharpe (RFR=1%) 0.66
CAROR 11.45%
Assets $ 59.0M
Worst DD -20.21
S&P Correlation -0.07
PAST PERFORMANCE IS NOT NECESSARILY INDICATIVE OF FUTURE RESULTS. THE RISK OF LOSS IN TRADING COMMODITY FUTURES, OPTIONS, AND FOREIGN EXCHANGE ("FOREX") IS SUBSTANTIAL.
Year Jan Feb Mar Apr May Jun Jul Aug Sep Oct Nov Dec YTD DD
2012 -0.69 0.79 0.09 -0.69
2011 -2.12 4.62 -3.63 8.25 -7.36 -3.91 7.46 3.28 -3.05 -7.06 0.55 0.88 -3.54 -10.98
2010 -5.33 3.68 3.99 1.38 -2.95 -1.76 -1.14 4.50 5.65 7.11 -0.98 2.21 16.73 -5.74
2009 -3.60 2.30 -7.19 -1.16 -1.29 -0.56 -5.31 3.76 1.06 -4.97 8.43 -0.32 -9.44 -16.21
2008 8.16 19.09 -0.95 -0.86 1.61 4.09 -4.99 1.25 5.11 4.43 0.66 0.20 42.48 -4.99
2007 0.25 -5.82 -2.44 3.78 4.87 0.67 3.08 -3.93 11.62 4.38 4.82 -0.04 22.00 -8.12
2006 5.57 -3.38 5.01 7.79 -0.68 -5.07 -7.14 3.83 -1.35 3.98 -7.47 0.39 0.01 -13.72
2005 -6.38 1.49 5.16 -7.15 2.81 4.12 0.24 6.71 6.33 -5.88 10.21 4.64 22.60 -7.23
Account & Fees
Type Managed Account
Minimum Account $ 3,000k
Trading Level Incremental Increase $ 0k
Management Fee 2.00%
Performance Fee 20.00%
Average Commission $0
Available to US Investors No
CTA Max Funding Factor
Subscriptions
Highwater Mark Yes
Subscription Frequency 15-30 Days
Redemption Frequency 15-30 Days
Investor Requirements Any Investor
Lock-up Period 0
Trading
Trading Frequency 1400
Avg. Margin-to-Equity 15.00%
Targeted WDD N/A
Worst Peak-to-Trough 0%
Sector Focus: Not Specified
Holding Periods
Over 12 Months 0%
4-12 Months 0%
1-3 Months 0%
1-30 Days
Intraday 0%
Decision-Making
Discretionary 0%
Systematic 100.00%

AIMhedge Management Ltd.—AIMhedge GDF Classic EUR (Institutional)
Part I : Professional Trend Fol lowing Performance Track Records 34
Summary
This product aims to achieve absolute medium-term capital growth through systematic trend following across global markets including (futures and forward contracts of) stock indices, interest instruments, currencies, cross rates and tangible commodities, commonly known as Managed Futures. The product seeks to capitalise primarily on upward and downward price trends and offers the potential for returns independent of traditional forms of stock and bond investments.
Statistics & Ratios
PAST PERFORMANCE IS NOT NECESSARILY INDICATIVE OF FUTURE RESULTS. THE RISK OF LOSS IN TRADING COMMODITY FUTURES, OPTIONS, AND FOREIGN EXCHANGE ("FOREX") IS SUBSTANTIAL.
Note: Figures shown in the Monthly column are the greatest figures (or worst for losses/drawdowns) for any particular month. The Annual figures are the greatest for any calendar year.
Reward Monthly Annual
Compound RoR: 0.91% 11.45%
Average RoR: 1.03% 12.69%
Max Gain: 19.09% 42.48%
Gain Frequency: 58.14% 72.09%
Average Gain: 4.33% 20.11%
Gain Deviation: 3.47% 12.01%
Risk
Standard Deviation: 4.97% 17.21%
Worst Loss: -7.47% -9.44%
Loss Frequency: 41.86% 27.91%
Average Loss: -3.55% -6.49%
Loss Deviation: 2.45% 8.49%
Reward/Risk
Sharpe Ratio: (RF=1%) 0.19 0.66
Correlation
S&P 500 Index -0.07
Strategy
Trend-following 100.00%
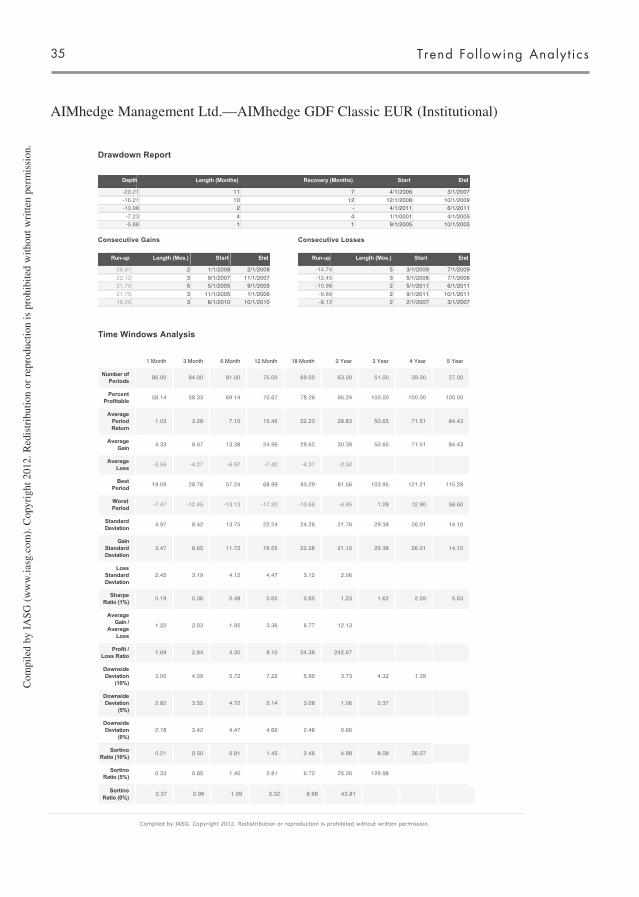
Trend Fol lowing Analyt ics35
AIMhedge Management Ltd.—AIMhedge GDF Classic EUR (Institutional)
Drawdown Report
Time Windows Analysis
Depth Length (Months) Recovery (Months) Start End
-20.21 11 7 4/1/2006 3/1/2007
-16.21 10 12 12/1/2008 10/1/2009-10.98 2 - 4/1/2011 6/1/2011
-7.23 4 4 1/1/0001 4/1/2005-5.88 1 1 9/1/2005 10/1/2005
Consecutive Gains
Run-up Length (Mos.) Start End
28.81 2 1/1/2008 2/1/2008
22.12 3 9/1/2007 11/1/200721.75 5 5/1/2005 9/1/2005
21.75 3 11/1/2005 1/1/200618.25 3 8/1/2010 10/1/2010
Consecutive Losses
Run-up Length (Mos.) Start End
-14.74 5 3/1/2009 7/1/2009
-12.45 3 5/1/2006 7/1/2006-10.98 2 5/1/2011 6/1/2011
-9.89 2 9/1/2011 10/1/2011-8.12 2 2/1/2007 3/1/2007
1 Month 3 Month 6 Month 12 Month 18 Month 2 Year 3 Year 4 Year 5 Year
Number of Periods
86.00 84.00 81.00 75.00 69.00 63.00 51.00 39.00 27.00
PercentProfitable
58.14 58.33 69.14 70.67 78.26 95.24 100.00 100.00 100.00
AveragePeriodReturn
1.03 3.28 7.10 15.46 22.23 28.83 50.65 71.51 84.43
AverageGain
4.33 8.67 13.38 24.96 29.62 30.39 50.65 71.51 84.43
AverageLoss
-3.55 -4.27 -6.97 -7.42 -4.37 -2.50
BestPeriod
19.09 28.76 57.24 68.99 80.29 81.56 103.95 121.21 115.28
WorstPeriod
-7.47 -12.45 -13.13 -17.20 -10.66 -4.85 1.28 12.90 58.60
StandardDeviation
4.97 8.42 13.75 22.24 24.26 21.76 29.38 26.01 14.10
GainStandardDeviation
3.47 6.65 11.72 19.55 22.28 21.10 29.38 26.01 14.10
LossStandardDeviation
2.45 3.19 4.12 4.47 3.12 2.06
SharpeRatio (1%)
0.19 0.36 0.48 0.65 0.85 1.23 1.62 2.59 5.63
AverageGain /
AverageLoss
1.22 2.03 1.92 3.36 6.77 12.13
Profit / Loss Ratio
1.69 2.84 4.30 8.10 24.38 242.67
DownsideDeviation
(10%)3.00 4.09 5.72 7.22 5.95 3.73 4.32 1.39
DownsideDeviation
(5%)2.82 3.55 4.72 5.14 3.08 1.06 0.37
DownsideDeviation
(0%)2.78 3.42 4.47 4.66 2.48 0.66
SortinoRatio (10%)
0.21 0.50 0.81 1.45 2.46 4.98 8.08 36.07
SortinoRatio (5%)
0.33 0.85 1.40 2.81 6.72 25.26 129.98
SortinoRatio (0%)
0.37 0.96 1.59 3.32 8.98 43.81
Compiled by IASG. Copyright 2012. Redistribution or reproduction is prohibited without written permission.
Com
pile
d by
IA
SG (
ww
w.ia
sg.c
om).
Cop
yrig
ht 2
012.
Red
istr
ibut
ion
or r
epro
duct
ion
is p
rohi
bite
d w
ithou
t wri
tten
perm
issi
on.
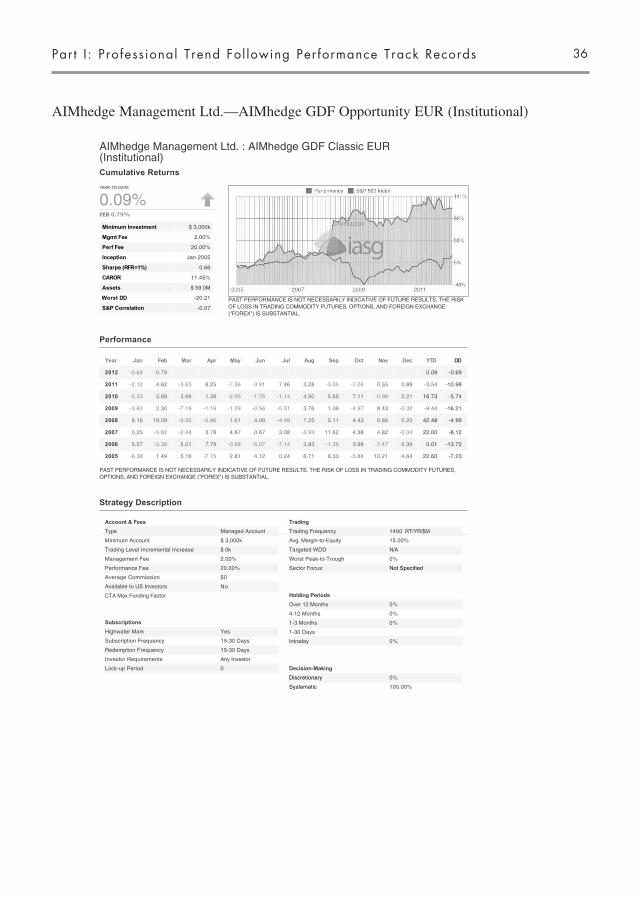
AIMhedge Management Ltd.—AIMhedge GDF Opportunity EUR (Institutional)
Part I : Professional Trend Fol lowing Performance Track Records 36
Cumulative Returns
Performance
PAST PERFORMANCE IS NOT NECESSARILY INDICATIVE OF FUTURE RESULTS. THE RISK OF LOSS IN TRADING COMMODITY FUTURES, OPTIONS, AND FOREIGN EXCHANGE ("FOREX") IS SUBSTANTIAL.
Strategy Description
AIMhedge Management Ltd. : AIMhedge GDF Classic EUR (Institutional)
YEAR-TO-DATE
0.09%0.79%
Minimum Investment $ 3,000k
Mgmt Fee 2.00%
Perf Fee 20.00%
Inception Jan 2005
Sharpe (RFR=1%) 0.66
CAROR 11.45%
Assets $ 59.0M
Worst DD -20.21
S&P Correlation -0.07
PAST PERFORMANCE IS NOT NECESSARILY INDICATIVE OF FUTURE RESULTS. THE RISK OF LOSS IN TRADING COMMODITY FUTURES, OPTIONS, AND FOREIGN EXCHANGE ("FOREX") IS SUBSTANTIAL.
Year Jan Feb Mar Apr May Jun Jul Aug Sep Oct Nov Dec YTD DD
2012 -0.69 0.79 0.09 -0.69
2011 -2.12 4.62 -3.63 8.25 -7.36 -3.91 7.46 3.28 -3.05 -7.06 0.55 0.88 -3.54 -10.98
2010 -5.33 3.68 3.99 1.38 -2.95 -1.76 -1.14 4.50 5.65 7.11 -0.98 2.21 16.73 -5.74
2009 -3.60 2.30 -7.19 -1.16 -1.29 -0.56 -5.31 3.76 1.06 -4.97 8.43 -0.32 -9.44 -16.21
2008 8.16 19.09 -0.95 -0.86 1.61 4.09 -4.99 1.25 5.11 4.43 0.66 0.20 42.48 -4.99
2007 0.25 -5.82 -2.44 3.78 4.87 0.67 3.08 -3.93 11.62 4.38 4.82 -0.04 22.00 -8.12
2006 5.57 -3.38 5.01 7.79 -0.68 -5.07 -7.14 3.83 -1.35 3.98 -7.47 0.39 0.01 -13.72
2005 -6.38 1.49 5.16 -7.15 2.81 4.12 0.24 6.71 6.33 -5.88 10.21 4.64 22.60 -7.23
Account & Fees
Type Managed Account
Minimum Account $ 3,000k
Trading Level Incremental Increase $ 0k
Management Fee 2.00%
Performance Fee 20.00%
Average Commission $0
Available to US Investors No
CTA Max Funding Factor
Subscriptions
Highwater Mark Yes
Subscription Frequency 15-30 Days
Redemption Frequency 15-30 Days
Investor Requirements Any Investor
Lock-up Period 0
Trading
Trading Frequency 1400
Avg. Margin-to-Equity 15.00%
Targeted WDD N/A
Worst Peak-to-Trough 0%
Sector Focus: Not Specified
Holding Periods
Over 12 Months 0%
4-12 Months 0%
1-3 Months 0%
1-30 Days
Intraday 0%
Decision-Making
Discretionary 0%
Systematic 100.00%
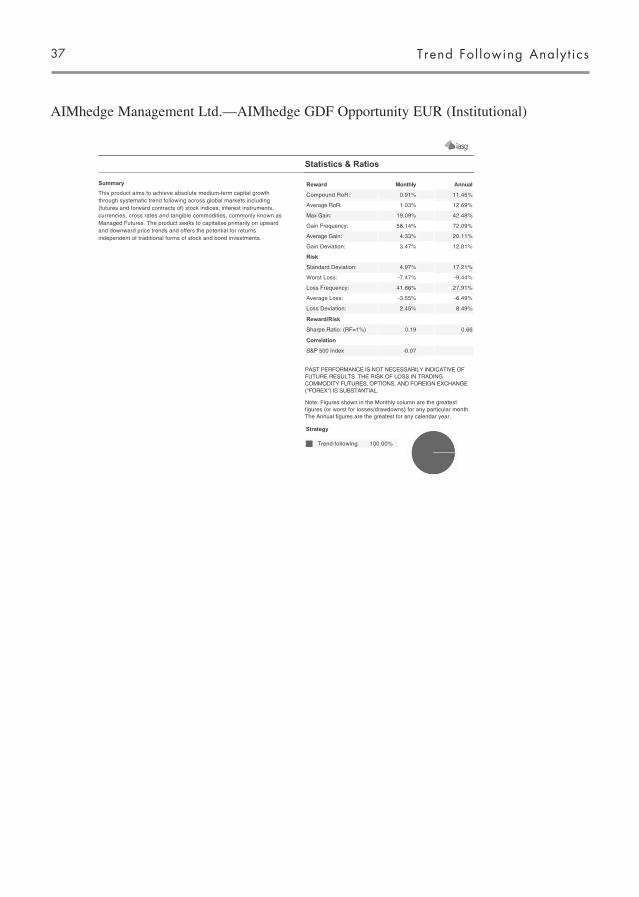
Trend Fol lowing Analyt ics37
AIMhedge Management Ltd.—AIMhedge GDF Opportunity EUR (Institutional)
Summary
This product aims to achieve absolute medium-term capital growth through systematic trend following across global markets including (futures and forward contracts of) stock indices, interest instruments, currencies, cross rates and tangible commodities, commonly known as Managed Futures. The product seeks to capitalise primarily on upward and downward price trends and offers the potential for returns independent of traditional forms of stock and bond investments.
Statistics & Ratios
PAST PERFORMANCE IS NOT NECESSARILY INDICATIVE OF FUTURE RESULTS. THE RISK OF LOSS IN TRADING COMMODITY FUTURES, OPTIONS, AND FOREIGN EXCHANGE ("FOREX") IS SUBSTANTIAL.
Note: Figures shown in the Monthly column are the greatest figures (or worst for losses/drawdowns) for any particular month. The Annual figures are the greatest for any calendar year.
Reward Monthly Annual
Compound RoR: 0.91% 11.45%
Average RoR: 1.03% 12.69%
Max Gain: 19.09% 42.48%
Gain Frequency: 58.14% 72.09%
Average Gain: 4.33% 20.11%
Gain Deviation: 3.47% 12.01%
Risk
Standard Deviation: 4.97% 17.21%
Worst Loss: -7.47% -9.44%
Loss Frequency: 41.86% 27.91%
Average Loss: -3.55% -6.49%
Loss Deviation: 2.45% 8.49%
Reward/Risk
Sharpe Ratio: (RF=1%) 0.19 0.66
Correlation
S&P 500 Index -0.07
Strategy
Trend-following 100.00%
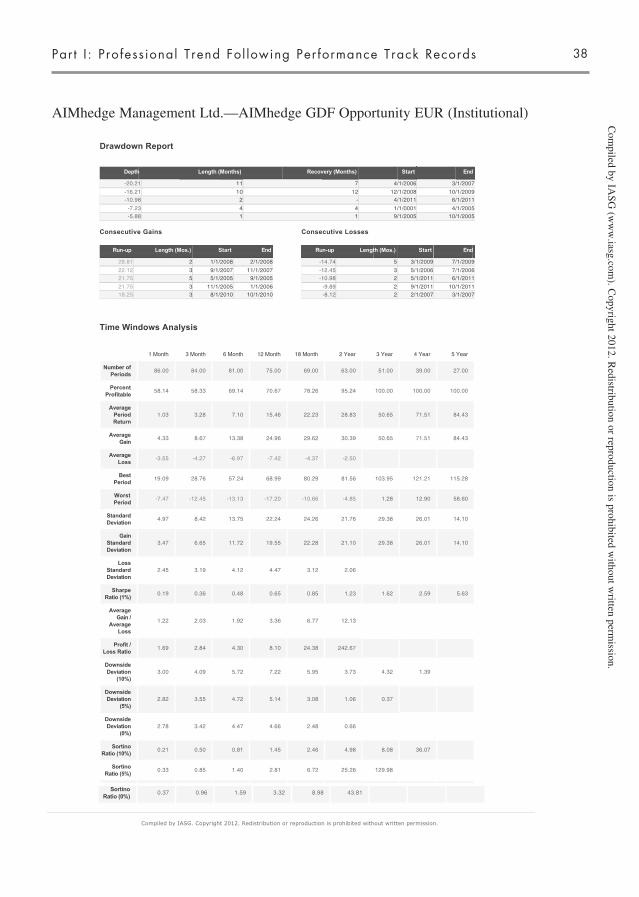
AIMhedge Management Ltd.—AIMhedge GDF Opportunity EUR (Institutional)
Part I : Professional Trend Fol lowing Performance Track Records 38
Drawdown Report
Time Windows Analysis
Depth Length (Months) Recovery (Months) Start End
-20.21 11 7 4/1/2006 3/1/2007
-16.21 10 12 12/1/2008 10/1/2009-10.98 2 - 4/1/2011 6/1/2011
-7.23 4 4 1/1/0001 4/1/2005-5.88 1 1 9/1/2005 10/1/2005
Consecutive Gains
Run-up Length (Mos.) Start End
28.81 2 1/1/2008 2/1/2008
22.12 3 9/1/2007 11/1/200721.75 5 5/1/2005 9/1/2005
21.75 3 11/1/2005 1/1/200618.25 3 8/1/2010 10/1/2010
Consecutive Losses
Run-up Length (Mos.) Start End
-14.74 5 3/1/2009 7/1/2009
-12.45 3 5/1/2006 7/1/2006-10.98 2 5/1/2011 6/1/2011
-9.89 2 9/1/2011 10/1/2011-8.12 2 2/1/2007 3/1/2007
1 Month 3 Month 6 Month 12 Month 18 Month 2 Year 3 Year 4 Year 5 Year
Number of Periods
86.00 84.00 81.00 75.00 69.00 63.00 51.00 39.00 27.00
PercentProfitable
58.14 58.33 69.14 70.67 78.26 95.24 100.00 100.00 100.00
AveragePeriodReturn
1.03 3.28 7.10 15.46 22.23 28.83 50.65 71.51 84.43
AverageGain
4.33 8.67 13.38 24.96 29.62 30.39 50.65 71.51 84.43
AverageLoss
-3.55 -4.27 -6.97 -7.42 -4.37 -2.50
BestPeriod
19.09 28.76 57.24 68.99 80.29 81.56 103.95 121.21 115.28
WorstPeriod
-7.47 -12.45 -13.13 -17.20 -10.66 -4.85 1.28 12.90 58.60
StandardDeviation
4.97 8.42 13.75 22.24 24.26 21.76 29.38 26.01 14.10
GainStandardDeviation
3.47 6.65 11.72 19.55 22.28 21.10 29.38 26.01 14.10
LossStandardDeviation
2.45 3.19 4.12 4.47 3.12 2.06
SharpeRatio (1%)
0.19 0.36 0.48 0.65 0.85 1.23 1.62 2.59 5.63
AverageGain /
AverageLoss
1.22 2.03 1.92 3.36 6.77 12.13
Profit / Loss Ratio
1.69 2.84 4.30 8.10 24.38 242.67
DownsideDeviation
(10%)3.00 4.09 5.72 7.22 5.95 3.73 4.32 1.39
DownsideDeviation
(5%)2.82 3.55 4.72 5.14 3.08 1.06 0.37
DownsideDeviation
(0%)2.78 3.42 4.47 4.66 2.48 0.66
SortinoRatio (10%)
0.21 0.50 0.81 1.45 2.46 4.98 8.08 36.07
SortinoRatio (5%)
0.33 0.85 1.40 2.81 6.72 25.26 129.98
SortinoRatio (0%)
0.37 0.96 1.59 3.32 8.98 43.81
Compiled by IASG. Copyright 2012. Redistribution or reproduction is prohibited without written permission.
Com
piled by IASG
(ww
w.iasg.com
). Copyright 2012. R
edistribution or reproduction is prohibited without w
ritten permission.

Trend Fol lowing Analyt ics39
AIS Capital and AIS Futures MGT—MAAP (2x–4x) Composite
Cumulative Returns
Performance
PAST PERFORMANCE IS NOT NECESSARILY INDICATIVE OF FUTURE RESULTS. THE RISK OF LOSS IN TRADING COMMODITY FUTURES, OPTIONS, AND FOREIGN EXCHANGE ("FOREX") IS SUBSTANTIAL.
Strategy Description
AIS Capital and AIS Futures MGT : MAAP (2x-4x) Composite
YEAR-TO-DATE
13.06%6.36%
Minimum Investment $ 5,000k
Mgmt Fee 2.70%
Perf Fee 20.00%
Inception Oct 1992
Sharpe (RFR=1%) 0.50
CAROR 11.95%
Assets $ 154.7M
Worst DD -74.76
S&P Correlation 0.29
PAST PERFORMANCE IS NOT NECESSARILY INDICATIVE OF FUTURE RESULTS. THE RISK OF LOSS IN TRADING COMMODITY FUTURES, OPTIONS, AND FOREIGN EXCHANGE ("FOREX") IS SUBSTANTIAL.
Year Jan Feb Mar Apr May Jun Jul Aug Sep Oct Nov Dec YTD DD
2012 6.30 6.36 13.06 N/A
2011 -2.04 6.28 8.17 9.99 -9.19 -7.61 9.93 7.89 -30.21 12.13 -3.02 -2.58 -8.87 -30.55
2010 -18.82 5.47 4.44 3.03 -10.15 -0.92 9.50 -7.10 23.00 11.94 2.90 19.06 40.74 -18.82
2009 -7.43 -8.63 11.68 4.03 39.31 -8.60 5.06 -4.06 7.70 7.90 14.61 -2.03 64.56 -15.42
2008 9.71 19.50 -7.06 2.81 8.17 17.74 -14.32 -15.94 -12.81 -33.82 -22.28 -7.62 -52.39 -70.16
2007 0.62 7.55 -1.08 -1.73 0.58 1.34 3.42 -2.27 18.47 9.07 -0.93 10.87 53.81 -2.79
2006 6.24 -9.28 9.33 15.05 -2.57 -6.49 3.37 -9.51 -12.14 9.24 12.65 -9.35 1.26 -25.12
2005 0.32 16.29 4.64 -5.91 0.80 3.06 5.87 4.62 2.15 -11.57 -3.59 11.64 28.50 -14.74
2004 4.14 10.82 11.61 -7.93 -2.31 -2.18 3.75 3.68 3.04 7.77 2.22 -10.45 23.91 -12.02
2003 6.58 10.57 -14.42 -6.65 6.16 -2.06 5.23 6.40 4.58 5.33 2.08 9.34 34.75 -20.11
2002 -2.96 -1.69 3.81 0.26 -5.86 3.30 5.22 5.19 3.93 -12.92 -4.92 4.58 -3.83 -17.20
2001 -0.91 2.89 10.33 -4.23 -6.10 -0.15 -2.15 0.29 2.36 3.62 -2.49 0.69 3.22 -12.14
2000 0.07 4.90 -3.25 -8.82 4.38 10.00 -9.01 11.73 -4.14 6.45 -1.46 -1.38 7.19 -11.78
1999 -3.83 4.33 4.91 6.01 -6.90 13.93 1.11 2.24 -6.52 -1.73 8.70 7.61 31.47 -8.14
1998 -3.31 -3.83 -10.72 -5.91 -0.74 -7.80 10.67 -7.26 -12.96 -0.36 12.34 9.21 -21.93 -36.37
1997 1.70 0.32 -2.39 -4.58 -5.69 0.92 -0.69 -8.66 1.33 -5.08 3.61 6.72 -12.75 -22.66
1996 5.88 -10.64 13.39 5.82 -1.04 8.31 -7.92 9.14 5.82 3.22 0.75 7.20 44.26 -10.64
1995 4.00 3.85 6.57 4.11 1.36 0.52 0.51 5.97 4.38 -1.92 0.12 -9.17 21.07 -10.81
1994 -5.06 -8.48 8.07 8.38 4.96 0.43 8.07 -9.62 -1.24 1.52 -3.29 -0.23 1.37 -13.11
1993 1.67 1.46 -2.30 -0.97 7.72 6.77 2.02 7.43 2.58 1.29 3.26 3.68 39.95 -3.25
1992 -3.22 0.97 2.13 -0.20 -3.22
Account & Fees
Type Managed Account
Minimum Account $ 5,000k
Trading Level Incremental Increase $ 0k
Management Fee 2.70%
Performance Fee 20.00%
Average Commission $6.00
Trading
Trading Frequency 250
Avg. Margin-to-Equity 20.00%
Targeted WDD N/A
Worst Peak-to-Trough 0%
Sector Focus: Diversified Traders

AIS Capital and AIS Futures MGT—MAAP (2x–4x) Composite
Part I : Professional Trend Fol lowing Performance Track Records 40
Available to US Investors Yes
CTA Max Funding Factor
Subscriptions
Highwater Mark Yes
Subscription Frequency Daily
Redemption Frequency Daily
Investor Requirements Accredited Investors
Lock-up Period 0
Holding Periods
Over 12 Months 50.00%
4-12 Months 40.00%
1-3 Months 10.00%
1-30 Days 0%
Intraday 0%
Decision-Making
Discretionary 100.00%
Systematic 0%
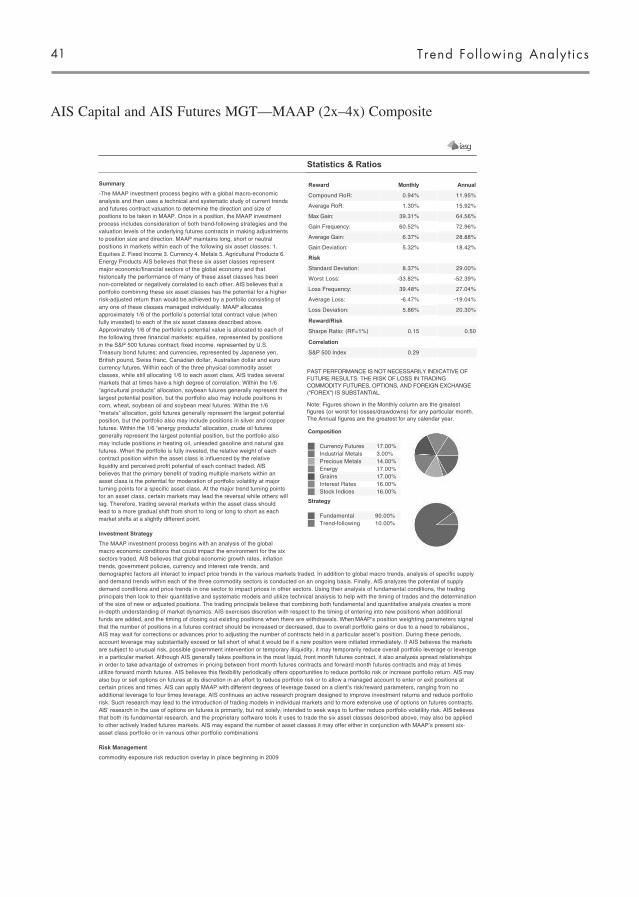
Trend Fol lowing Analyt ics41
AIS Capital and AIS Futures MGT—MAAP (2x–4x) Composite
Summary
-The MAAP investment process begins with a global macro-economicanalysis and then uses a technical and systematic study of current trends and futures contract valuation to determine the direction and size of positions to be taken in MAAP. Once in a position, the MAAP investment process includes consideration of both trend-following strategies and the valuation levels of the underlying futures contracts in making adjustments to position size and direction. MAAP maintains long, short or neutral positions in markets within each of the following six asset classes: 1.Equities 2. Fixed Income 3. Currency 4. Metals 5. Agricultural Products 6.Energy Products AIS believes that these six asset classes represent major economic/financial sectors of the global economy and that historically the performance of many of these asset classes has been non-correlated or negatively correlated to each other. AIS believes that a portfolio combining these six asset classes has the potential for a higher risk-adjusted return than would be achieved by a portfolio consisting of any one of these classes managed individually. MAAP allocates approximately 1/6 of the portfolio s potential total contract value (when fully invested) to each of the six asset classes described above.Approximately 1/6 of the portfolio s potential value is allocated to each of the following three financial markets: equities, represented by positions in the S&P 500 futures contract; fixed income, represented by U.S. Treasury bond futures; and currencies, represented by Japanese yen, British pound, Swiss franc, Canadian dollar, Australian dollar and euro currency futures. Within each of the three physical commodity asset classes, while still allocating 1/6 to each asset class, AIS trades several markets that at times have a high degree of correlation. Within the 1/6 agricultural products allocation, soybean futures generally represent the
largest potential position, but the portfolio also may include positions in corn, wheat, soybean oil and soybean meal futures. Within the 1/6 metals allocation, gold futures generally represent the largest potential
position, but the portfolio also may include positions in silver and copper futures. Within the 1/6 energy products allocation, crude oil futures generally represent the largest potential position, but the portfolio also may include positions in heating oil, unleaded gasoline and natural gas futures. When the portfolio is fully invested, the relative weight of each contract position within the asset class is influenced by the relative liquidity and perceived profit potential of each contract traded. AIS believes that the primary benefit of trading multiple markets within an asset class is the potential for moderation of portfolio volatility at major turning points for a specific asset class. At the major trend turning points for an asset class, certain markets may lead the reversal while others will lag. Therefore, trading several markets within the asset class should lead to a more gradual shift from short to long or long to short as each market shifts at a slightly different point.
Investment Strategy
The MAAP investment process begins with an analysis of the global macro economic conditions that could impact the environment for the six sectors traded. AIS believes that global economic growth rates, inflation trends, government policies, currency and interest rate trends, and demographic factors all interact to impact price trends in the various markets traded. In addition to global macro trends, analysis of specific supply and demand trends within each of the three commodity sectors is conducted on an ongoing basis. Finally, AIS analyzes the potential of supply demand conditions and price trends in one sector to impact prices in other sectors. Using their analysis of fundamental conditions, the trading principals then look to their quantitative and systematic models and utilize technical analysis to help with the timing of trades and the determinationof the size of new or adjusted positions. The trading principals believe that combining both fundamental and quantitative analysis creates a more in-depth understanding of market dynamics. AIS exercises discretion with respect to the timing of entering into new positions when additional funds are added, and the timing of closing out existing positions when there are withdrawals. When MAAP s position weighting parameters signal that the number of positions in a futures contract should be increased or decreased, due to overall portfolio gains or due to a need to rebalance,, AIS may wait for corrections or advances prior to adjusting the number of contracts held in a particular asset s position. During these periods, account leverage may substantially exceed or fall short of what it would be if a new position were initiated immediately. If AIS believes the markets are subject to unusual risk, possible government intervention or temporary illiquidity, it may temporarily reduce overall portfolio leverage or leveragein a particular market. Although AIS generally takes positions in the most liquid, front month futures contract, it also analyzes spread relationships in order to take advantage of extremes in pricing between front month futures contracts and forward month futures contracts and may at times utilize forward month futures. AIS believes this flexibility periodically offers opportunities to reduce portfolio risk or increase portfolio return. AIS may also buy or sell options on futures at its discretion in an effort to reduce portfolio risk or to allow a managed account to enter or exit positions at certain prices and times. AIS can apply MAAP with different degrees of leverage based on a client s risk/reward parameters, ranging from no additional leverage to four times leverage. AIS continues an active research program designed to improve investment returns and reduce portfolio risk. Such research may lead to the introduction of trading models in individual markets and to more extensive use of options on futures contracts.AIS research in the use of options on futures is primarily, but not solely, intended to seek ways to further reduce portfolio volatility risk. AIS believes that both its fundamental research, and the proprietary software tools it uses to trade the six asset classes described above, may also be applied to other actively traded futures markets. AIS may expand the number of asset classes it may offer either in conjunction with MAAP s present six-asset class portfolio or in various other portfolio combinations
Risk Management
commodity exposure risk reduction overlay in place beginning in 2009
Statistics & Ratios
PAST PERFORMANCE IS NOT NECESSARILY INDICATIVE OF FUTURE RESULTS. THE RISK OF LOSS IN TRADING COMMODITY FUTURES, OPTIONS, AND FOREIGN EXCHANGE ("FOREX") IS SUBSTANTIAL.
Note: Figures shown in the Monthly column are the greatest figures (or worst for losses/drawdowns) for any particular month. The Annual figures are the greatest for any calendar year.
Reward Monthly Annual
Compound RoR: 0.94% 11.95%
Average RoR: 1.30% 15.92%
Max Gain: 39.31% 64.56%
Gain Frequency: 60.52% 72.96%
Average Gain: 6.37% 28.88%
Gain Deviation: 5.32% 18.42%
Risk
Standard Deviation: 8.37% 29.00%
Worst Loss: -33.82% -52.39%
Loss Frequency: 39.48% 27.04%
Average Loss: -6.47% -19.04%
Loss Deviation: 5.86% 20.30%
Reward/Risk
Sharpe Ratio: (RF=1%) 0.15 0.50
Correlation
S&P 500 Index 0.29
Composition
Currency Futures 17.00%Industrial Metals 3.00%Precious Metals 14.00%Energy 17.00%Grains 17.00%Interest Rates 16.00%Stock Indices 16.00%
Strategy
Fundamental 90.00%Trend-following 10.00%

AIS Capital and AIS Futures MGT—MAAP (2x–4x) Composite
Part I : Professional Trend Fol lowing Performance Track Records 42
Drawdown Report
Time Windows Analysis
Depth Length (Months) Recovery (Months) Start End
-74.76 8 - 6/1/2008 2/1/2009
-45.58 20 29 2/1/1997 10/1/1998-25.12 5 12 4/1/2006 9/1/2006
-20.11 2 6 2/1/2003 4/1/2003-17.20 2 3 9/1/2002 11/1/2002
Consecutive Gains
Run-up Length (Mos.) Start End
77.31 9 7/1/2003 3/1/2004
68.68 4 9/1/2010 12/1/201061.85 3 3/1/2009 5/1/2009
45.35 3 12/1/2007 2/1/200840.22 8 5/1/1993 12/1/1993
Consecutive Losses
Run-up Length (Mos.) Start End
-74.76 8 7/1/2008 2/1/2009
-30.21 1 9/1/2011 9/1/2011-28.51 6 1/1/1998 6/1/1998
-20.50 2 8/1/2006 9/1/2006-20.47 2 12/1/2009 1/1/2010
1 Month 3 Month 6 Month 12 Month 18 Month 2 Year 3 Year 4 Year 5 Year
Number of Periods
233.00 231.00 228.00 222.00 216.00 210.00 198.00 186.00 174.00
PercentProfitable
60.52 61.90 68.42 74.32 77.78 76.67 74.75 87.63 95.40
AveragePeriodReturn
1.30 4.01 8.37 17.20 24.18 30.96 41.39 57.19 75.05
AverageGain
6.37 12.56 18.73 30.02 38.05 47.61 59.25 66.48 78.94
AverageLoss
-6.47 -9.88 -14.08 -19.90 -24.37 -23.75 -11.48 -8.67 -5.66
BestPeriod
39.31 61.85 86.07 128.87 145.40 191.94 182.12 249.13 444.66
WorstPeriod
-33.82 -55.15 -70.16 -69.29 -54.21 -59.73 -39.90 -30.93 -13.48
StandardDeviation
8.37 14.94 22.25 31.84 36.09 43.91 46.64 55.10 73.19
GainStandardDeviation
5.32 9.85 16.22 24.23 26.78 35.38 40.11 52.50 72.70
LossStandardDeviation
5.86 10.77 16.20 19.91 17.72 15.45 10.16 7.76 5.32
SharpeRatio (1%)
0.15 0.25 0.35 0.51 0.63 0.66 0.82 0.96 0.96
AverageGain /
AverageLoss
0.98 1.27 1.33 1.51 1.56 2.00 5.16 7.67 13.95
Profit / Loss Ratio
1.51 2.07 2.88 4.37 5.47 6.59 15.28 54.34 289.44
DownsideDeviation
(10%)5.66 9.53 12.98 16.11 17.22 18.09 14.89 12.57 9.78
DownsideDeviation
(5%)5.51 9.10 12.20 14.56 14.73 14.47 8.87 5.24 2.55
DownsideDeviation
(0%)5.47 8.99 12.01 14.20 14.15 13.64 7.67 4.05 1.62
SortinoRatio (10%)
0.16 0.29 0.45 0.76 0.96 1.14 1.72 2.84 4.85
SortinoRatio (5%)
0.22 0.41 0.65 1.11 1.54 2.00 4.32 10.15 27.45
SortinoRatio (0%)
0.24 0.45 0.70 1.21 1.71 2.27 5.40 14.11 46.45
Compiled by IASG. Copyright 2012. Redistribution or reproduction is prohibited without written permission.
Com
piled by IASG
(ww
w.iasg.com
). Copyright 2012. R
edistribution or reproduction is prohibited without w
ritten permission.
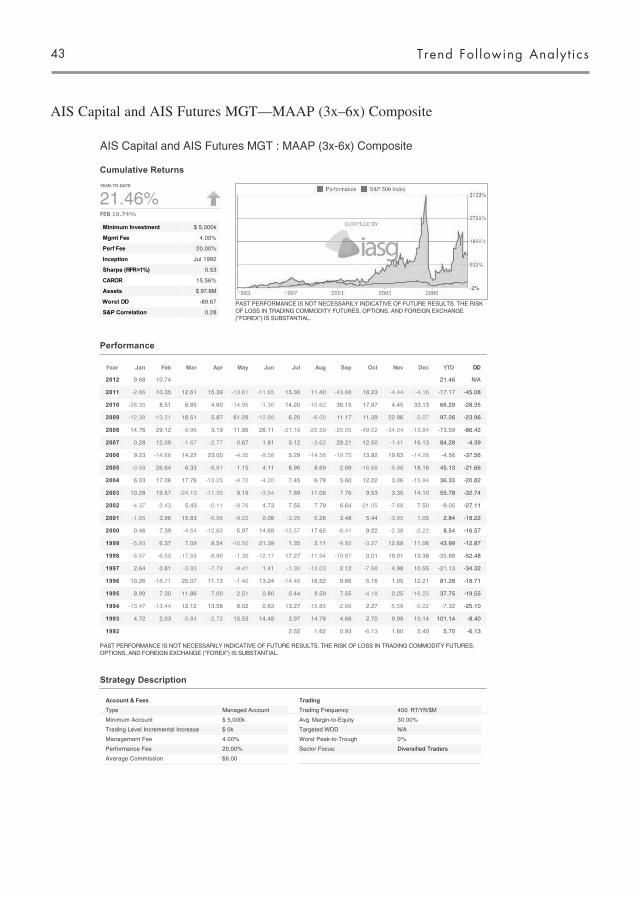
Trend Fol lowing Analyt ics43
AIS Capital and AIS Futures MGT—MAAP (3x–6x) Composite
Cumulative Returns
Performance
PAST PERFORMANCE IS NOT NECESSARILY INDICATIVE OF FUTURE RESULTS. THE RISK OF LOSS IN TRADING COMMODITY FUTURES, OPTIONS, AND FOREIGN EXCHANGE ("FOREX") IS SUBSTANTIAL.
Strategy Description
AIS Capital and AIS Futures MGT : MAAP (3x-6x) Composite
YEAR-TO-DATE
21.46%10.74%
Minimum Investment $ 5,000k
Mgmt Fee 4.00%
Perf Fee 20.00%
Inception Jul 1992
Sharpe (RFR=1%) 0.53
CAROR 15.56%
Assets $ 97.8M
Worst DD -89.67
S&P Correlation 0.28
PAST PERFORMANCE IS NOT NECESSARILY INDICATIVE OF FUTURE RESULTS. THE RISK OF LOSS IN TRADING COMMODITY FUTURES, OPTIONS, AND FOREIGN EXCHANGE ("FOREX") IS SUBSTANTIAL.
Year Jan Feb Mar Apr May Jun Jul Aug Sep Oct Nov Dec YTD DD
2012 9.68 10.74 21.46 N/A
2011 -2.86 10.35 12.61 15.39 -13.61 -11.65 15.30 11.40 -43.98 18.23 -4.44 -4.16 -17.17 -45.08
2010 -28.35 8.51 6.85 4.60 -14.95 -1.30 14.20 -10.62 36.15 17.97 4.45 33.13 66.29 -28.35
2009 -12.39 -13.21 18.51 5.87 61.29 -12.99 6.20 -6.00 11.17 11.39 22.96 -3.07 97.26 -23.96
2008 14.76 29.12 -9.96 3.19 11.96 26.11 -21.19 -25.59 -20.05 -49.02 -34.04 -13.84 -73.59 -86.42
2007 0.28 12.09 -1.67 -2.77 0.67 1.81 5.12 -3.62 28.21 12.50 -1.41 16.13 84.28 -4.39
2006 9.23 -14.66 14.22 23.00 -4.35 -9.58 5.29 -14.56 -19.75 13.82 19.63 -14.28 -4.56 -37.56
2005 -0.59 26.64 6.33 -8.81 1.15 4.11 8.96 8.69 2.99 -16.68 -5.98 18.16 45.13 -21.66
2004 6.03 17.06 17.76 -13.25 -4.72 -4.20 7.45 6.78 5.60 12.22 3.06 -15.94 36.33 -20.82
2003 10.28 19.57 -24.13 -11.35 9.19 -3.54 7.89 11.06 7.76 9.53 3.35 14.10 55.78 -32.74
2002 -4.37 -2.43 5.43 -0.11 -8.76 4.73 7.55 7.79 6.64 -21.05 -7.68 7.50 -9.05 -27.11
2001 -1.65 3.96 15.83 -6.96 -9.22 0.08 -3.25 0.26 3.48 5.44 -3.95 1.05 2.84 -18.22
2000 0.46 7.39 -4.54 -12.60 5.97 14.69 -13.57 17.65 -6.41 9.22 -2.38 -2.22 8.54 -16.57
1999 -5.93 6.37 7.09 8.54 -10.50 21.39 1.35 3.11 -9.92 -3.27 12.68 11.06 43.99 -12.87
1998 -5.57 -6.55 -17.59 -8.86 -1.36 -12.17 17.27 -11.94 -19.87 0.01 19.01 13.38 -35.88 -52.48
1997 2.64 0.81 -3.93 -7.74 -9.41 1.41 -1.30 -13.03 2.12 -7.98 4.98 10.55 -21.13 -34.32
1996 10.26 -18.71 25.07 11.13 -1.40 13.24 -14.46 16.52 9.66 5.16 1.05 12.21 81.28 -18.71
1995 8.99 7.30 11.86 7.00 2.51 0.80 0.44 9.59 7.55 -4.18 0.25 -16.25 37.75 -19.55
1994 -13.47 -13.44 12.12 13.58 8.02 0.63 13.27 -15.85 -2.66 2.27 -5.59 -0.22 -7.32 -25.10
1993 4.72 2.03 -5.84 -2.72 15.53 14.48 3.97 14.78 4.66 2.70 9.99 10.14 101.14 -8.40
1992 2.52 1.62 0.93 -6.13 1.60 5.40 5.70 -6.13
Account & Fees
Type Managed Account
Minimum Account $ 5,000k
Trading Level Incremental Increase $ 0k
Management Fee 4.00%
Performance Fee 20.00%
Average Commission $6.00
Trading
Trading Frequency 400
Avg. Margin-to-Equity 30.00%
Targeted WDD N/A
Worst Peak-to-Trough 0%
Sector Focus: Diversified Traders

AIS Capital and AIS Futures MGT—MAAP (3x–6x) Composite
Part I : Professional Trend Fol lowing Performance Track Records 44
Available to US Investors Yes
CTA Max Funding Factor
Subscriptions
Highwater Mark Yes
Subscription Frequency Daily
Redemption Frequency Daily
Investor Requirements Accredited Investors
Lock-up Period 0
Holding Periods
Over 12 Months 50.00%
4-12 Months 40.00%
1-3 Months 10.00%
1-30 Days 0%
Intraday 0%
Decision-Making
Discretionary 100.00%
Systematic 0%

Trend Fol lowing Analyt ics45
AIS Capital and AIS Futures MGT—MAAP (3x–6x) Composite
Summary
-The MAAP investment process begins with a global macro-economicanalysis and then uses a technical and systematic study of current trends and futures contract valuation to determine the direction and size of positions to be taken in MAAP. Once in a position, the MAAP investment process includes consideration of both trend-following strategies and the valuation levels of the underlying futures contracts in making adjustments to position size and direction. MAAP maintains long, short or neutral positions in markets within each of the following six asset classes: 1. Equities 2. Fixed Income 3. Currency 4. Metals 5. Agricultural Products 6. Energy Products AIS believes that these six asset classes represent major economic/financial sectors of the global economy and that historically the performance of many of these asset classes has been non-correlated or negatively correlated to each other. AIS believes that a portfolio combining these six asset classes has the potential for a higher risk-adjusted return than would be achieved by a portfolio consisting of any one of these classes managed individually. MAAP allocates approximately 1/6 of the portfolio s potential total contract value (when fully invested) to each of the six asset classes described above. Approximately 1/6 of the portfolio s potential value is allocated to each of the following three financial markets: equities, represented by positions in the S&P 500 futures contract; fixed income, represented by U.S. Treasury bond futures; and currencies, represented by Japanese yen, British pound, Swiss franc, Canadian dollar, Australian dollar and euro currency futures. Within each of the three physical commodity asset classes, while still allocating 1/6 to each asset class, AIS trades several markets that at times have a high degree of correlation. Within the 1/6 agricultural products allocation, soybean futures generally represent the
largest potential position, but the portfolio also may include positions in corn, wheat, soybean oil and soybean meal futures. Within the 1/6 metals allocation, gold futures generally represent the largest potential
position, but the portfolio also may include positions in silver and copper futures. Within the 1/6 energy products allocation, crude oil futures generally represent the largest potential position, but the portfolio also may include positions in heating oil, unleaded gasoline and natural gas futures. When the portfolio is fully invested, the relative weight of each contract position within the asset class is influenced by the relative liquidity and perceived profit potential of each contract traded. AIS believes that the primary benefit of trading multiple markets within an asset class is the potential for moderation of portfolio volatility at major turning points for a specific asset class. At the major trend turning points for an asset class, certain markets may lead the reversal while others will lag. Therefore, trading several markets within the asset class should lead to a more gradual shift from short to long or long to short as each market shifts at a slightly different point.
Investment Strategy
The MAAP investment process begins with an analysis of the global macro economic conditions that could impact the environment for the six sectors traded. AIS believes that global economic growth rates, inflation trends, government policies, currency and interest rate trends, and demographic factors all interact to impact price trends in the various markets traded. In addition to global macro trends, analysis of specific supply and demand trends within each of the three commodity sectors is conducted on an ongoing basis. Finally, AIS analyzes the potential of supply demand conditions and price trends in one sector to impact prices in other sectors. Using their analysis of fundamental conditions, the trading principals then look to their quantitative and systematic models and utilize technical analysis to help with the timing of trades and the determinationof the size of new or adjusted positions. The trading principals believe that combining both fundamental and quantitative analysis creates a more in-depth understanding of market dynamics. AIS exercises discretion with respect to the timing of entering into new positions when additional funds are added, and the timing of closing out existing positions when there are withdrawals. When MAAP s position weighting parameters signal that the number of positions in a futures contract should be increased or decreased, due to overall portfolio gains or due to a need to rebalance,, AIS may wait for corrections or advances prior to adjusting the number of contracts held in a particular asset s position. During these periods, account leverage may substantially exceed or fall short of what it would be if a new position were initiated immediately. If AIS believes the markets are subject to unusual risk, possible government intervention or temporary illiquidity, it may temporarily reduce overall portfolio leverage or leveragein a particular market. Although AIS generally takes positions in the most liquid, front month futures contract, it also analyzes spread relationships in order to take advantage of extremes in pricing between front month futures contracts and forward month futures contracts and may at times utilize forward month futures. AIS believes this flexibility periodically offers opportunities to reduce portfolio risk or increase portfolio return. AIS may also buy or sell options on futures at its discretion in an effort to reduce portfolio risk or to allow a managed account to enter or exit positions at certain prices and times. AIS can apply MAAP with different degrees of leverage based on a client s risk/reward parameters, ranging from no additional leverage to four times leverage. AIS continues an active research program designed to improve investment returns and reduce portfolio risk. Such research may lead to the introduction of trading models in individual markets and to more extensive use of options on futures contracts. AIS research in the use of options on futures is primarily, but not solely, intended to seek ways to further reduce portfolio volatility risk. AIS believes that both its fundamental research, and the proprietary software tools it uses to trade the six asset classes described above, may also be applied to other actively traded futures markets. AIS may expand the number of asset classes it may offer either in conjunction with MAAP s present six-asset class portfolio or in various other portfolio combinations
Risk Management
When AIS believes the markets are subject to unusual risk, possible government intervention or temporary illiquidity, it may temporarily reduce overall portfolio leverage or leverage in a particular market. Although AIS generally takes positions in the most liquid, front month futures contract, it also analyzes spread relationships in order to take advantage of extremes in pricing between front month futures contracts and forward month futures contracts and may at times utilize forward month futures. AIS believes this flexibility periodically offers opportunities to reduce portfolio risk or increase portfolio return. AIS may also buy or sell options on futures at its discretion in an effort to reduce portfolio risk or to allow a managed account to enter or exit positions at certain prices and times. AIS can apply MAAP with different degrees of leverage based on a client s risk/reward
Statistics & Ratios
PAST PERFORMANCE IS NOT NECESSARILY INDICATIVE OF FUTURE RESULTS. THE RISK OF LOSS IN TRADING COMMODITY FUTURES, OPTIONS, AND FOREIGN EXCHANGE ("FOREX") IS SUBSTANTIAL.
Note: Figures shown in the Monthly column are the greatest figures (or worst for losses/drawdowns) for any particular month. The Annual figures are the greatest for any calendar year.
Reward Monthly Annual
Compound RoR: 1.21% 15.56%
Average RoR: 2.09% 26.39%
Max Gain: 61.29% 101.14%
Gain Frequency: 61.02% 64.41%
Average Gain: 9.96% 54.30%
Gain Deviation: 8.36% 28.96%
Risk
Standard Deviation: 13.03% 45.14%
Worst Loss: -49.02% -73.59%
Loss Frequency: 38.98% 35.59%
Average Loss: -10.24% -24.10%
Loss Deviation: 8.77% 30.37%
Reward/Risk
Sharpe Ratio: (RF=1%) 0.15 0.53
Correlation
S&P 500 Index 0.28
Composition
Currency Futures 17.00%Industrial Metals 3.00%Precious Metals 14.00%Energy 17.00%Grains 17.00%Interest Rates 16.00%Stock Indices 16.00%
Strategy
Fundamental 90.00%Trend-following 10.00%
parameters, ranging from no additional leverage to four times leverage. AIS continues an active research program designed to improve investment returns and reduce portfolio risk. Such research may lead to the introduction of trading models in individual markets and to more extensive use of options on futures contracts. AIS research in the use of options on futures is primarily, but not solely, intended to seek ways to further reduce portfolio volatility risk. AIS believes that both its fundamental research, and the proprietary software tools it uses to trade the six asset classes described above, may also be applied to other actively traded futures markets. AIS may expand the number of asset classes it may offer either in conjunction with MAAP s present six-asset class portfolio or in various other portfolio combinationsRisk Management commodity exposure risk reduction overlay in place beginning in 2009
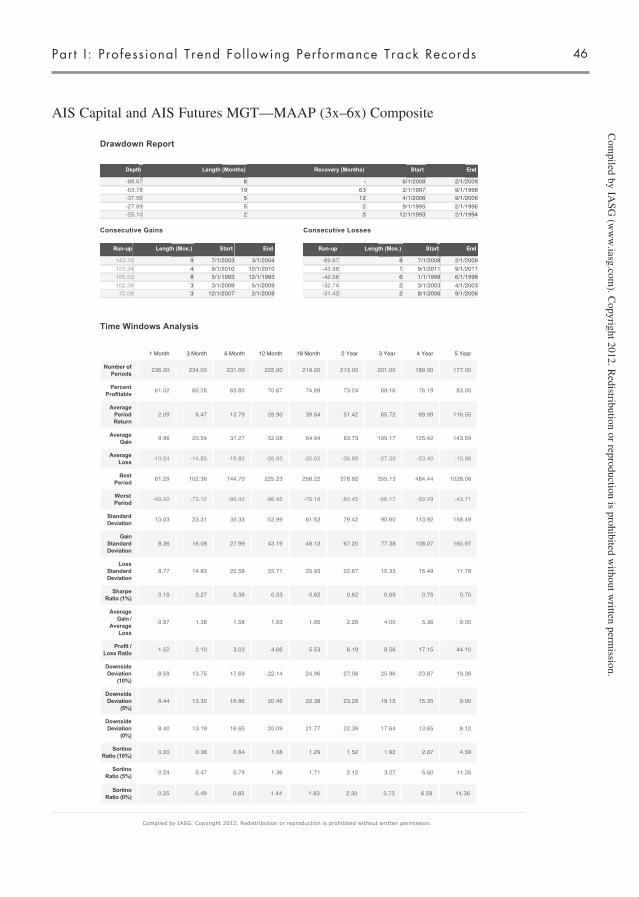
AIS Capital and AIS Futures MGT—MAAP (3x–6x) Composite
Part I : Professional Trend Fol lowing Performance Track Records 46
Drawdown Report
Time Windows Analysis
Depth Length (Months) Recovery (Months) Start End
-89.67 8 - 6/1/2008 2/1/2009
-63.78 19 63 2/1/1997 9/1/1998-37.56 5 12 4/1/2006 9/1/2006
-27.89 5 2 9/1/1995 2/1/1996-25.10 2 3 12/1/1993 2/1/1994
Consecutive Gains
Run-up Length (Mos.) Start End
143.76 9 7/1/2003 3/1/2004
123.34 4 9/1/2010 12/1/2010105.52 8 5/1/1993 12/1/1993
102.36 3 3/1/2009 5/1/200972.08 3 12/1/2007 2/1/2008
Consecutive Losses
Run-up Length (Mos.) Start End
-89.67 8 7/1/2008 2/1/2009
-43.98 1 9/1/2011 9/1/2011-42.58 6 1/1/1998 6/1/1998
-32.74 2 3/1/2003 4/1/2003-31.43 2 8/1/2006 9/1/2006
1 Month 3 Month 6 Month 12 Month 18 Month 2 Year 3 Year 4 Year 5 Year
Number of Periods
236.00 234.00 231.00 225.00 219.00 213.00 201.00 189.00 177.00
PercentProfitable
61.02 60.26 65.80 70.67 74.89 73.24 68.16 76.19 83.05
AveragePeriodReturn
2.09 6.47 13.79 28.90 39.84 51.42 65.72 89.99 116.55
AverageGain
9.96 20.54 31.27 52.08 64.94 83.73 109.17 125.42 143.59
AverageLoss
-10.24 -14.85 -19.82 -26.93 -35.02 -36.99 -27.30 -23.40 -15.96
BestPeriod
61.29 102.36 144.70 225.23 258.22 378.92 355.13 484.44 1028.08
WorstPeriod
-49.02 -73.12 -86.42 -86.45 -76.18 -80.45 -66.17 -59.29 -43.71
StandardDeviation
13.03 23.31 35.33 52.99 61.53 79.42 90.60 113.92 158.49
GainStandardDeviation
8.36 16.08 27.99 43.19 48.13 67.20 77.38 108.07 160.97
LossStandardDeviation
8.77 14.83 20.58 25.71 25.93 22.67 15.33 15.49 11.78
SharpeRatio (1%)
0.15 0.27 0.38 0.53 0.62 0.62 0.69 0.75 0.70
AverageGain /
AverageLoss
0.97 1.38 1.58 1.93 1.85 2.26 4.00 5.36 9.00
Profit / Loss Ratio
1.52 2.10 3.03 4.66 5.53 6.19 8.56 17.15 44.10
DownsideDeviation
(10%)8.59 13.75 17.69 22.14 24.96 27.08 25.96 23.87 19.39
DownsideDeviation
(5%)8.44 13.30 16.86 20.49 22.38 23.28 19.15 15.35 9.90
DownsideDeviation
(0%)8.40 13.19 16.65 20.09 21.77 22.39 17.64 13.65 8.12
SortinoRatio (10%)
0.20 0.38 0.64 1.08 1.29 1.52 1.92 2.87 4.59
SortinoRatio (5%)
0.24 0.47 0.79 1.36 1.71 2.12 3.27 5.60 11.26
SortinoRatio (0%)
0.25 0.49 0.83 1.44 1.83 2.30 3.73 6.59 14.36
Compiled by IASG. Copyright 2012. Redistribution or reproduction is prohibited without written permission.
Com
piled by IASG
(ww
w.iasg.com
). Copyright 2012. R
edistribution or reproduction is prohibited without w
ritten permission.
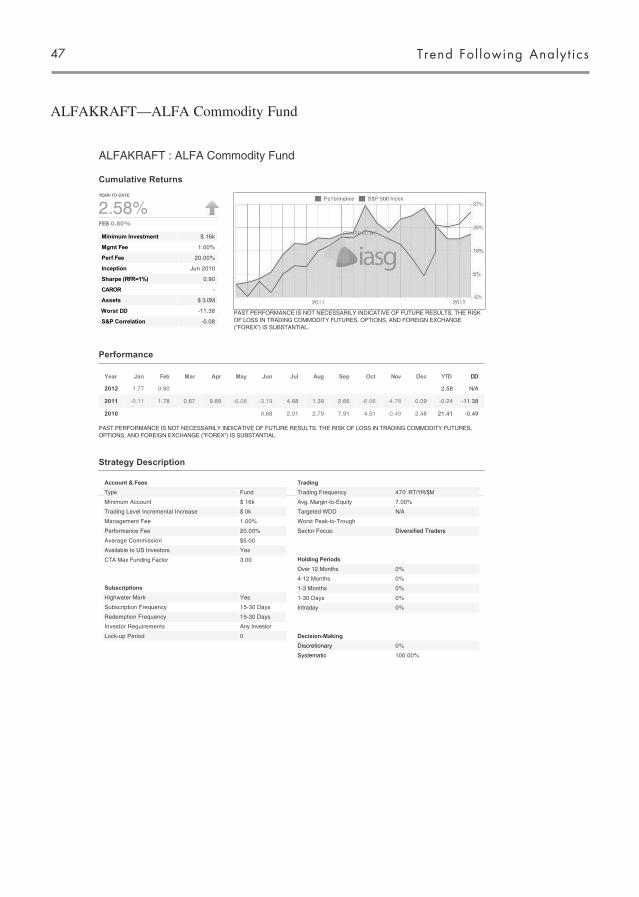
Trend Fol lowing Analyt ics47
ALFAKRAFT—ALFA Commodity Fund
Cumulative Returns
Performance
PAST PERFORMANCE IS NOT NECESSARILY INDICATIVE OF FUTURE RESULTS. THE RISK OF LOSS IN TRADING COMMODITY FUTURES, OPTIONS, AND FOREIGN EXCHANGE ("FOREX") IS SUBSTANTIAL.
Strategy Description
ALFAKRAFT : ALFA Commodity Fund
YEAR-TO-DATE
2.58%0.80%
Minimum Investment $ 16k
Mgmt Fee 1.00%
Perf Fee 20.00%
Inception Jun 2010
Sharpe (RFR=1%) 0.90
CAROR -
Assets $ 3.0M
Worst DD -11.38
S&P Correlation -0.08
PAST PERFORMANCE IS NOT NECESSARILY INDICATIVE OF FUTURE RESULTS. THE RISK OF LOSS IN TRADING COMMODITY FUTURES, OPTIONS, AND FOREIGN EXCHANGE ("FOREX") IS SUBSTANTIAL.
Year Jan Feb Mar Apr May Jun Jul Aug Sep Oct Nov Dec YTD DD
2012 1.77 0.80 2.58 N/A
2011 -0.11 1.78 0.67 9.89 -6.08 -3.19 4.68 1.39 2.66 -6.06 -4.78 0.09 -0.24 -11.38
2010 0.68 2.01 2.79 7.91 4.51 -0.49 2.48 21.41 -0.49
Account & Fees
Type Fund
Minimum Account $ 16k
Trading Level Incremental Increase $ 0k
Management Fee 1.00%
Performance Fee 20.00%
Average Commission $5.00
Available to US Investors Yes
CTA Max Funding Factor 3.00
Subscriptions
Highwater Mark Yes
Subscription Frequency 15-30 Days
Redemption Frequency 15-30 Days
Investor Requirements Any Investor
Lock-up Period 0
Trading
Trading Frequency 470
Avg. Margin-to-Equity 7.00%
Targeted WDD N/A
Worst Peak-to-Trough
Sector Focus: Diversified Traders
Holding Periods
Over 12 Months 0%
4-12 Months 0%
1-3 Months 0%
1-30 Days 0%
Intraday 0%
Decision-Making
Discretionary 0%
Systematic 100.00%

ALFAKRAFT—ALFA Commodity Fund
Part I : Professional Trend Fol lowing Performance Track Records 48
Summary
Responsible Fund Manager: Mr. Thomas Stridsman. Investment alternatives: Swedish based hedge fund, SEK denominated, (ALFA Commodity Fund) ISIN Code for the Fund: SE0003616036. Taxnumber for the Fund: 515602-4357. Also open to investors through Managed Account, both Swedish based Managed Account and USA based Managed Account, CTA structured. ALFAKRAFT is managing Quantitative Hedge Funds and Managed Accounts in Energy and Commodities, and has successfully managed investors money in the Energy- andCommodity sector for a long period of time. The average annual return between the years 1998 2008 have been in excess of 30% with $150 million in AUM. ALFAKRAFT has been under supervision from the Swedish Financial Supervisory Authority (Finansinspektionen) since 1999. ALFAKRAFT has the authorization to: receive and transmit buy and sell orders, execute orders on behalf of clients, discretionary manage client investment portfolios, share investment advice with clients, hold financial instruments and receive funds with accountability, manage publicly available funds in accordance with Swedish law for investment funds and also offer other investment services. In the US, ALFAKRAFT (Fund Manager Mr. Thomas Stridsman) is also registered as a CTA (Commodity Trading Advisor), in accordance with rules and regulations set forth by CFTC (Commodity Futures Trading Commission) and as administrated by NFA (National Futures Association).
Investment Strategy
Systematic, model-based trading on the global commodity derivatives markets, based on a purpose-driven approach, utilizing multiple short-term trades to balance risk-reward in long-term positions. Program type:Diversified, Systematic, Standard Leverage Program Market sectors:Energies, Metals, Grains, Softs/Misc, Currencies, Interest rates, Indexes.Return goals: Absolute return, High risk-adjusted return. Expected annual return: Standard leverage: 15-20%. Potential downside: < 15%. Risk
Correlation: Low correlation relative the Rec. investment period: Min.
2-3 years is recommended
Risk Management
The Managers have established a framework for the account smanagement and limitations for the risks, which every decision model are programmed to remain within. Complementing research and performance analysis, using several models for simulating the risks and other limitations, is continuously conducted by the Managers. Risk per trade and position: All risk control starts with a decision regarding the maximum amount to risk in any individual trade. To keep any losseswithin tolerated levels, it is important that each trading decision is assessed considering the total risk for the position. To avoid high risks, the decision models work to limit the position size in accordance with market volatility and momentum as well as macro-economic trends. The amount risked for any of the decision models in The ALFA Program, can be as little as 1/10th of 1% of account equity at the time for the entry. The models will take positions with the direction of the identified trend, and incrementally adjust each position using many small trades, with the signals to trade originating from several different systems. This also ensures that the exits take place in an orderly fashion. The Managers have compared many different CTA strategies and has concluded that this strategy is the most effective in terms of consistent strong returns and low drawdowns, as well as in minimizing costs such as slippage and commission.
Statistics & Ratios
PAST PERFORMANCE IS NOT NECESSARILY INDICATIVE OF FUTURE RESULTS. THE RISK OF LOSS IN TRADING COMMODITY FUTURES, OPTIONS, AND FOREIGN EXCHANGE ("FOREX") IS SUBSTANTIAL.
Note: Figures shown in the Monthly column are the greatest figures (or worst for losses/drawdowns) for any particular month. The Annual figures are the greatest for any calendar year.
Reward Monthly Annual
Compound RoR: - -
Average RoR: - -
Max Gain: 9.89% 21.41%
Gain Frequency: 71.43% 42.86%
Average Gain: - -
Gain Deviation: 2.77% 9.61%
Risk
Standard Deviation: 3.99% 13.82%
Worst Loss: -6.08% -0.24%
Loss Frequency: 28.57% 57.14%
Average Loss: -3.45% -0.24%
Loss Deviation: 2.66% 9.23%
Reward/Risk
Sharpe Ratio: (RF=1%) 0.26 0.90
Correlation
S&P 500 Index -0.08
Composition
Currency Futures 15.00%Industrial Metals 5.00%Precious Metals 10.00%Energy 15.00%Grains 15.00%Interest Rates 15.00%Livestock 5.00%Softs 5.00%Stock Indices 10.00%Other 5.00%
Strategy
Trend-following 100.00%
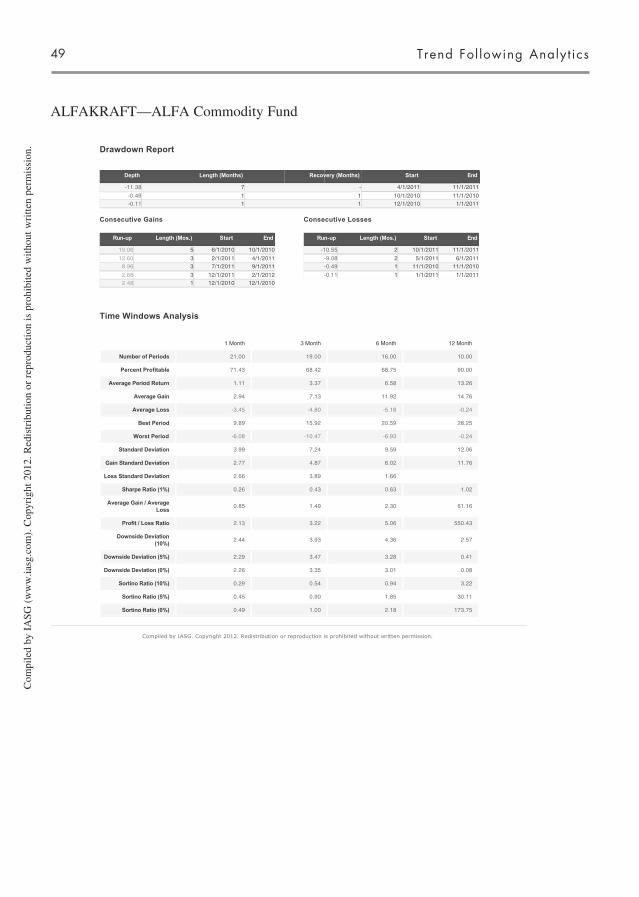
Trend Fol lowing Analyt ics49
ALFAKRAFT—ALFA Commodity Fund
Drawdown Report
Time Windows Analysis
Depth Length (Months) Recovery (Months) Start End
-11.38 7 - 4/1/2011 11/1/2011
-0.49 1 1 10/1/2010 11/1/2010-0.11 1 1 12/1/2010 1/1/2011
Consecutive Gains
Run-up Length (Mos.) Start End
19.06 5 6/1/2010 10/1/2010
12.60 3 2/1/2011 4/1/20118.96 3 7/1/2011 9/1/2011
2.68 3 12/1/2011 2/1/20122.48 1 12/1/2010 12/1/2010
Consecutive Losses
Run-up Length (Mos.) Start End
-10.55 2 10/1/2011 11/1/2011
-9.08 2 5/1/2011 6/1/2011-0.49 1 11/1/2010 11/1/2010
-0.11 1 1/1/2011 1/1/2011
1 Month 3 Month 6 Month 12 Month
Number of Periods 21.00 19.00 16.00 10.00
Percent Profitable 71.43 68.42 68.75 90.00
Average Period Return 1.11 3.37 6.58 13.26
Average Gain 2.94 7.13 11.92 14.76
Average Loss -3.45 -4.80 -5.18 -0.24
Best Period 9.89 15.92 20.59 28.25
Worst Period -6.08 -10.47 -6.93 -0.24
Standard Deviation 3.99 7.24 9.59 12.06
Gain Standard Deviation 2.77 4.87 6.02 11.76
Loss Standard Deviation 2.66 3.89 1.66
Sharpe Ratio (1%) 0.26 0.43 0.63 1.02
Average Gain / Average Loss
0.85 1.49 2.30 61.16
Profit / Loss Ratio 2.13 3.22 5.06 550.43
Downside Deviation (10%)
2.44 3.93 4.36 2.57
Downside Deviation (5%) 2.29 3.47 3.28 0.41
Downside Deviation (0%) 2.26 3.35 3.01 0.08
Sortino Ratio (10%) 0.29 0.54 0.94 3.22
Sortino Ratio (5%) 0.45 0.90 1.85 30.11
Sortino Ratio (0%) 0.49 1.00 2.18 173.75
Compiled by IASG. Copyright 2012. Redistribution or reproduction is prohibited without written permission.
Com
pile
d by
IA
SG (
ww
w.ia
sg.c
om).
Cop
yrig
ht 2
012.
Red
istr
ibut
ion
or r
epro
duct
ion
is p
rohi
bite
d w
ithou
t wri
tten
perm
issi
on.

ALFAKRAFT—ALFA Energy Fund
Part I : Professional Trend Fol lowing Performance Track Records 50
Cumulative Returns
Performance
PAST PERFORMANCE IS NOT NECESSARILY INDICATIVE OF FUTURE RESULTS. THE RISK OF LOSS IN TRADING COMMODITY FUTURES, OPTIONS, AND FOREIGN EXCHANGE ("FOREX") IS SUBSTANTIAL.
Strategy Description
ALFAKRAFT : ALFA Energy Fund
YEAR-TO-DATE
7.08%4.08%
Minimum Investment $ 8k
Mgmt Fee 2.00%
Perf Fee 20.00%
Inception Sep 2010
Sharpe (RFR=1%) -0.27
CAROR -
Assets $ 1.0M
Worst DD -16.36
S&P Correlation 0.53
PAST PERFORMANCE IS NOT NECESSARILY INDICATIVE OF FUTURE RESULTS. THE RISK OF LOSS IN TRADING COMMODITY FUTURES, OPTIONS, AND FOREIGN EXCHANGE ("FOREX") IS SUBSTANTIAL.
Year Jan Feb Mar Apr May Jun Jul Aug Sep Oct Nov Dec YTD DD
2012 2.88 4.08 7.08 N/A
2011 -0.86 7.15 1.11 2.00 -1.70 -4.45 -3.52 2.96 -6.31 2.85 -3.26 -3.84 -8.37 -16.36
2010 0.50 -1.02 -1.86 -0.05 -2.42 -2.91
Account & Fees
Type Fund
Minimum Account $ 8k
Trading Level Incremental Increase $ 0k
Management Fee 2.00%
Performance Fee 20.00%
Average Commission $5.00
Available to US Investors Yes
CTA Max Funding Factor 3.00
Subscriptions
Highwater Mark Yes
Subscription Frequency 15-30 Days
Redemption Frequency 15-30 Days
Investor Requirements Any Investor
Lock-up Period 0
Trading
Trading Frequency 560
Avg. Margin-to-Equity 4.00%
Targeted WDD N/A
Worst Peak-to-Trough
Sector Focus: Energy Traders
Holding Periods
Over 12 Months 0%
4-12 Months 0%
1-3 Months 0%
1-30 Days 0%
Intraday 0%
Decision-Making
Discretionary 0%
Systematic 100.00%

Trend Fol lowing Analyt ics51
ALFAKRAFT—ALFA Energy Fund
Summary
Responsible Fund Managers: Mr. Bengt Lindblad and Mr. Thomas Stridsman. We are also open to investors that want to invest through Managed Accounts. ISIN Code: SE0001991183. Taxnumber: 515602-1759. ALFAKRAFT is managing Quantitative Hedge Funds and Managed Accounts in Energy and Commodities. ALFAKRAFT has successfully managed investors money in the Energy- and Commodity sector for a long period of time. The average annual return between the years 1998 2008 have been in excess of 30% with $150 million in AUM. ALFAKRAFT has been under supervision from the Swedish Financial Supervisory Authority (Finansinspektionen) since 1999. ALFAKRAFT has the authorization to: receive and transmit buy and sell orders, execute orders on behalf of clients, discretionary manage client investment portfolios, share investment advice with clients, hold financial instruments and receive funds with accountability, manage publicly available funds in accordance with Swedish law for investment funds and also offer other investment services. In the US, ALFAKRAFT (Fund Manager Mr. Thomas Stridsman) is also registered as a CTA (Commodity Trading Advisor), in accordance with rules and regulations set forth by CFTC (Commodity Futures Trading Commission) and as administrated by NFA (National Futures Association).
Investment Strategy
Energy Futures, diversified strategies
Statistics & Ratios
PAST PERFORMANCE IS NOT NECESSARILY INDICATIVE OF FUTURE RESULTS. THE RISK OF LOSS IN TRADING COMMODITY FUTURES, OPTIONS, AND FOREIGN EXCHANGE ("FOREX") IS SUBSTANTIAL.
Note: Figures shown in the Monthly column are the greatest figures (or worst for losses/drawdowns) for any particular month. The Annual figures are the greatest for any calendar year.
Reward Monthly Annual
Compound RoR: - -
Average RoR: - -
Max Gain: 7.15% 7.08%
Gain Frequency: 44.44% 11.11%
Average Gain: - -
Gain Deviation: 2.04% 7.08%
Risk
Standard Deviation: 3.46% 11.98%
Worst Loss: -6.31% -8.37%
Loss Frequency: 55.56% 88.89%
Average Loss: -2.69% -8.10%
Loss Deviation: 1.92% 6.66%
Reward/Risk
Sharpe Ratio: (RF=1%) -0.08 -0.27
Correlation
S&P 500 Index 0.53
Composition
Energy 100.00%
Strategy
Trend-following 50.00%Other 50.00%

ALFAKRAFT—ALFA Energy Fund
Part I : Professional Trend Fol lowing Performance Track Records 52
Drawdown Report
Time Windows Analysis
Depth Length (Months) Recovery (Months) Start End
-16.36 8 - 4/1/2011 12/1/2011
-3.74 4 1 9/1/2010 1/1/2011
Consecutive Gains
Run-up Length (Mos.) Start End
10.51 3 2/1/2011 4/1/2011
7.08 2 1/1/2012 2/1/20122.96 1 8/1/2011 8/1/2011
2.85 1 10/1/2011 10/1/20110.50 1 9/1/2010 9/1/2010
Consecutive Losses
Run-up Length (Mos.) Start End
-9.38 3 5/1/2011 7/1/2011
-6.97 2 11/1/2011 12/1/2011-6.31 1 9/1/2011 9/1/2011
-3.74 4 10/1/2010 1/1/2011
1 Month 3 Month 6 Month 12 Month
Number of Periods 18.00 16.00 13.00 7.00
Percent Profitable 44.44 31.25 46.15 0.00
Average Period Return -0.19 -1.34 -2.32 -5.19
Average Gain 2.94 5.69 4.35
Average Loss -2.69 -4.53 -8.04 -5.19
Best Period 7.15 10.51 7.64 -0.26
Worst Period -6.31 -9.38 -11.52 -8.37
Standard Deviation 3.46 5.60 7.14 2.81
Gain Standard Deviation 2.04 3.62 2.86
Loss Standard Deviation 1.92 2.44 3.56 2.81
Sharpe Ratio (1%) -0.08 -0.28 -0.39 -2.21
Average Gain / Average Loss
1.09 1.26 0.54
Profit / Loss Ratio 0.88 0.57 0.46
Downside Deviation (10%)
2.68 5.15 8.10 10.52
Downside Deviation (5%) 2.47 4.40 6.71 6.72
Downside Deviation (0%) 2.42 4.22 6.37 5.81
Sortino Ratio (10%) -0.22 -0.50 -0.59 -0.97
Sortino Ratio (5%) -0.11 -0.36 -0.42 -0.92
Sortino Ratio (0%) -0.08 -0.32 -0.36 -0.89
Compiled by IASG. Copyright 2012. Redistribution or reproduction is prohibited without written permission.
Com
piled by IASG
(ww
w.iasg.com
). Copyright 2012. R
edistribution or reproduction is prohibited without w
ritten permission.