trees project tumbes-ecuador/peru -...
TRANSCRIPT
Centro Internacional de Agricultura Tropical lnternational Center for Tropical Agriculture
TREES PROJECT
Tumbes- Ecuador/Peru
(Path 011, Row 062, Quarter 2)
loint Research Centre (JRC)
and
CIAT
Technical Report
Javier Puiq. Grégoire Leclerc,
carlos Nagles, Alexander Cuero, Rafael D. Hoyos
December 1999
TABLE OF CO NT E NTS
INTRODUCTION
D EFORESTATION P ATTERNS IN SOtiTH AMERlCA
STUDY AREA
L OCATION
CLIMA TE ANO VEGET ATION
COAST AL FOREST
M OUNT AIN FOREST
METHODOWGY
MATERIALS
Ü EOCODING
LAND-USE ANO LAND-CoVER DIGmsiNG
B UILDING P OLYGONS
lNTERPRETATION OF CHANGES
CONCLUSIONS
ANNEX 1
G EOREFERENCE MAPS
G EOCODED IMAGE INFORMATION
G EOCODED IMAOE INFORMATION
ANNEX2
FIGURE 1 F ALSE COLOUR COMPOSITE
FIGURE 2 F ALSE COLOUR COMPOSITE
ANNEXJ
L ANO USE/ LAND COVER PRESENT IN 199 1 IMAGE
LAND USE/ LANDCOVERPRESENTIN 1997 IMAGE
STATISTICS FOR 1991 IMAGE
STATISTICS FOR 1997 IMAGE LANO USE CHANGE AREA FOR 1991 ANO 1997 IMAGES
LANO USE CHANGE MATRIX
ANNEX4
L AND USE INTERPRETATION KEY T ABLE 1: SPANISH VERSION OF TREES CLASSIFICATION KEY USED BY CIA T
ANNEX5
fOREST COVER CHANGE IN SoUTH AMERlCA
REFERENCES
1
l
3
3 3 4 4
5
5 5 5 6 6
7
8
9 10 11
12
13 14
15
16 17
18 19 20 21
22
22 24
25
25
27
INTRODUCTION
Phase 2 of the TREES project is developing a prototype for an operational system for monitoring forests in the tropical belt (TFIS). The capacity to detect deforestation hot spots is being improved by analysing a sample of high-resolution imagery over known hot-spot areas QRC, 1997). This work is being done partly by local organisations, in order to build partnerships for TFIS. Many locations scattered over virtually all of South America show evidence of accelerated deforestation, but principally so in the Colombian, Ecuadorian and Peruvian Andes and the westem part of the Amazon region QRC, 1997).
The objective of this component of TFIS development is to identify and quantify recent deforestation in the period between 1989-1991 and 1996-1998 for the selected samples. The changes of forest area between both dates were measured using high-resolution reme te sensing data and techniques.
The Intemational Centre for Tropical Agriculture (CIAT, its Spanish acronym) was responsible for studying 13 sample areas located in Colombia, Ecuador and Peru, covering sorne of the principal South American hot spots.
The methodology of this study involved the use of georeferenced satellite images, such as Landsat TM SPOT, and on-screen digitising of land-use and land-cover units, which are greater than SO hectares for recognition purposes. Digitising was on a 1: 100 000 scale. The recognition and assignment of land-use codes to the image interpretation was supported by the use of historical data, such as land-use and fo rest maps, to evaluate past and present changes.
This report involves the study of an area located on the south-west coast of Ecuador and the north-west coast of Peru.
DEFORESTATION PATTERNS IN SOUTH AMERICA
According to WRI-UNEP-UN DP-World Bank (1998), an average of O.S% annual deforestation occurred in South America during the 1990-199S period. However, it is highly variable between countries, from 0% (Guyana and Uruguay) to 2.6% (Paraguay) . Annex S gives statistics for South America's forests in the period 1990-1995.
The clearing of tropical forest shows different kinds of spatial pattem s, which are influenced by the size of the remaining forest area and the customs of the inhabitants. One spatial pattem is of a small remnant of forest like an island within the cleared area. In this way, deforestation is increasingly advancing along the borders (Rudel, 1993).
In the case of a wide area of forest, such as the Amazon basin, the deforestation pattem has another shape; along the forest margins, in similar circumstances to the forest-island, fringes are opening into the border of the forest. This situation can be seen where the
1

Amazon basin borders the Andes region. "The population overflowing from the Andes clown to the Amazon plains do not settle there. They advance like a slow burning fire, concentrating along a narrow margin between the land they are destroying and are about to leave behind, and the forests lying ahead of them" (Myers, 1984). The land is used until yields begin to decline, then it is ceded or sold to cattle ranchers and the settlers move farther into the forest to restart the cycle of forest clearing and abandonment (Stearman, 1985). In sorne cases, the deforested area is abandoned for 5 to 1 O years befo re secondary forest growth is established (Navas, 1982).
Deforestation may also occur along defined corridors, such as roads and rivers. One of the first situations revealing this pattem is in the upper reaches of the Amazon basin; the first spots of cleared land emerge in a linear pattem along mule trails from the Andes to the Amazon. Farther east, navigable rivers provide access to markets, so the first clearings occur in corridors of land along rivers (Rudel, 1993).
The govemments sponsor colonisation zones into the forest, often resulting in grids with cleared Jand along the roads and islands of forest in the centre of the squares created by the roads. Both sides of the roads have a uniform width of farm clearings. These clearings form an additional corridor of cleared land that parallels the roadside corridor several kilometres into the forest (Hiroaka and Yamamoto, 1980). Other road-building agents are the "highly capitalised organisations like timber companies that begin the deforestation process by building a penetration road, and colonists quickly clear a corridor of land along the road. The subsequent construction of feeder roads induces further deforestation and swaths of cleared land appear in the zone, reducing the forests to island rernnants away from the roads" (Rudel, 1993).
The building of a new road into the forest sometimes does not generate a corridor of cleared land. In Colombia, the penetration road into the state of Caqueta generated considerable land clearing, while the construction of a similar road into the state of Guaviare did not (Ortiz, 1984). Areas such as Guaviare and Amazonas in Colombia, even after roads had been completed, remained far from major markets and have had little economic or population growth.
In Frohn's (1998) study of the causes of landscape change in Rondonia, Brazil, he observed that the amount of deforested area is negatively correlated with the distance to the inhabited centres. The farmers closer to urban centres have difficult access to the forest because of lack of transport and services.
Many factors may have helped produce deforestation hot spots: political decisions, migration, marketplaces, fuelwood gathering, livestock farming, increase of population, climatic and compounded-impact, infrastructure, fires, illegal plantation, logging, appropriateness of land uses, dams, mining (Utting, 1993; Adger and Brown, 1994). But the causes of deforestation can be abridged into three principal ones, (1) land use conversion, (2) overexploítation of forest and (3) natural and environmental changes (Adger and Brown, 1994).
2
Deforestation has global consequences with respect to the carbon cycle. It has local impacts of increased rates of soil erosion, capacity of soils to retain water, other pollutants emitted from biomass burning, loss of biological diversity, loss of cultural diversity (when the indigenous people are displaced) and loss of indigenous knowledge (Adger and Brown, 1994).
STUDY AR E A
LOCATION
The study site is located across the intemational border between Ecuador and Peru, near to the Pacific Coast. This study area includes the southem Pacific mangrove forest in Latín America and the northem Peruvian montane forest on the westem slopes of the Andes. The principal boundaries are, in the west the Pacific O cean, in the north the city of Machala and the Guayaquil Gulf, in the east the intemational border and the agriculturalland of Ecuador and to the south the Tumbes National Reserve and the Peruvian coastal desert. The total area covered is 1 076 930 hectares, with ocean comprising 52.2% of the total area.
CLIMATE AND VEGETATION
The Peruvian coastal region is one of the driest places on the planet. This is because the Andes forros a barrier to the movement of humid masses of air coming from the Amazon region in the east. Also the cold Humboldt Current in the Pacific Ocean constantly cools the air masses forming banks of fog, which reach the coast especially between June and September. It only rains along the coast when the temperature of the sea exceeds that of the masses of air over the land. This situation occurs when "El Niño" manifests with abundant precipitation in the zone (Begler, 1980).
Rainfall is frequent between December and March, although sorne years can have total drought. Another form of precipitation is the drizzle that often covers the coast (Feininger, 1975). The drought conditions lessen moving north to Ecuador (Brawer, 1991).
Feininger (1975), in his study carried out in El Oro State in southem Ecuador bordering with Peru, describes the climatic conditions and vegetation in most of the area as semi-arid, even sub-humid. In the driest zones toward the north-west, the rains permit the growth of sporadic vegetation such as cactus and small shrub. Toward the south-east, the weather becomes more and more humid reaching a maximum on the north flank of Tahuin Hill (1295 m) in the Tahuin mountain range, where there are patches of humid tropical forest. Then the weather conditions change and become dry again.
3

COAST AL FOREST
The mangrove forest is an important tropical ecosystem dominated by mangrove, varied numbers of vegetable species and animals that interact in a delicate device for their survival. The mangrove forest has highly important functions in the coastal ecosystem, such as:
• Repressing the effects of the cicles and waves along the coast, • Facilitacing sedimentation, • Diminishing wind speed, • Impeding sea air loaded with salt from lapping the coastal fields and • Facilitacing the development of numerous species (PMRC, 1992; Las so, 1992; Diaz, 1998).
In South America, between 1 O and 15 mangrove species ex:ist. Although these forests are distributed along lacitude 30° North, in the southern hemisphere they are found only along lacitude 3° South on the Pacific Coast, up to about the mouth of the River Tumbes in the north ofPeru (PMRC, 1992).
In the Jambelli Archipelago in the south of Ecuador and the north of Peru, mangroves are located in the mouths of many rivers coming from the Andean mountain range, such as the Rivers Pagua and Arenillas in El Oro State, Ecuador. But, in El Oro State the mangroves have been destroyed in 90 % of their potencial area (PMRC, 1992). The indiscriminate logging is to clear surfaces to construct pools for shrimp breeding in captivity, which is the principal cause of damage to this kind of forest (PMRC, 1992; Las so, 1992).
The cutting of mangrove facilitates erosion along the coast and increases the desertification process in the interior of the continent, as well as salinizacion and water contaminacion on the coast (PMRC, 1992; Lasso, 1992).
MOUNTAIN FOREST
On the northern limit of Tumbes State, beside the internacional boundary with Ecuador, the Tumbes Nacional Reserve is located. This has an area of 72 102 ha and a variety in forest type and fauna (http://www3.rcp.net.pe/peru/tumbes/reservas naturales. htmD. Outside this forest, more than half of the original forest zone has become grassland and is unused.
4

METHODOLOGY
MATERIALS
For this work we used the second quarter of two Landsat TM images (path 011 row 062: 011062910819geo.lan, 011062971006.lan). The radiometric quality of data of both images was good, showing sorne cloud coverage in the upper right comers. We didn't dispose of a land use or forest map as reference, the interpretation of land use and land cover was done on the basis of the literature.
The interpretation key that we used for this project is given in annex 4.
GEOCODING
Both images were georeferenced to Universal Transversal of Mercator (UTi'ví), zone 17 WGS84, using the Georeferencing module of the PCI software. Geographic reference information was extracted from topographical maps and associated to the image of the first date as ground control points. In the case of the second image, the georeferencing process used as a reference the product obtained from georeferencing the first image (first date). The topographical maps ata scale of 1:100 000 that were used for georeferencing were produced by the Instituto Geográfico Militar (IGM) of &uador. Annex 1 gives a list of maps used for georeferencing, root mean square (RMS) error for both processes as well as pararneters and other georeferencing information.
Figures 1 and 2, in Annex 2, give an overview of the study area in both images after the georeferencing process.
LAND-USE AND LAND-COVER DIGITISING
Land uses and land cover were digitised on screen over the TM 4-5-3 colour composite. This process was completed using the Imageworks module of PCI software with the minimum mapping unit as described in TREES technical annex (50 ha; 300 m width for linear features). The images were displayed at a scale of 1:100 000 and all distinguishing characteristics were digitised and associated to a specific class code established by TREES (see Annex 3).
Digitised vectors on the first image were overlaid on the second and then the changes in land use and cover greater than 25 hectares were digitised. The resuJt of this process forms the digitised product of land use and cover for the second image.
5
BUILDING POLYGONS
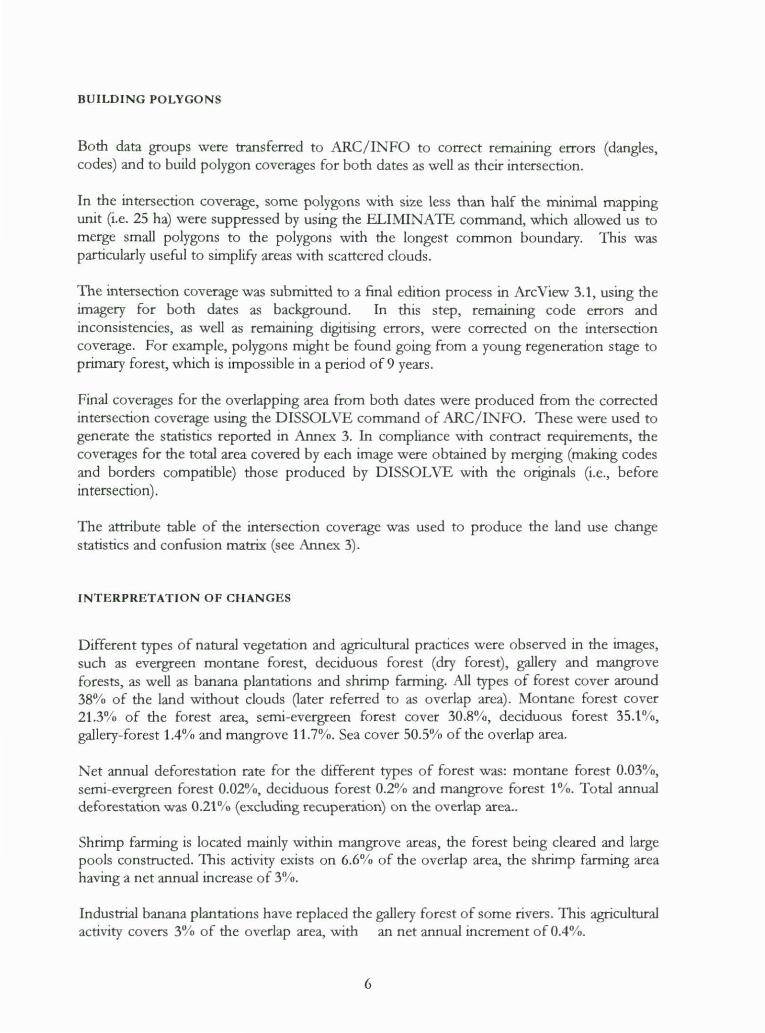
Both data groups were transferred to ARC/INFO to correct remammg errors (dangles, codes) and to build polygon coverages for both dates as well as their intersection.
In the intersection coverage, sorne polygons with size less than half the minimal mapping unit (i.e. 25 ha) were suppressed by using the ELIMINA 1E command, which allowed us to merge small polygons to the polygons with the longest common boundary. This was particularly useful to simplify areas with scattered clouds.
The intersection coverage was submitted toa final edition process in ArcView 3.1, using the imagery for both dates as background. In this step, remaining code errors and inconsistencies, as well as remaining digitising errors, were corrected on the intersection coverage. For example, polygons might be found going from a young regeneration stage to primary forest, which is impossible in a period of 9 years.
Final coverages for the overlapping area from both dates were produced from the corrected intersection coverage using the DISSOLVE command of ARC/INFO. These were used to generate the statistics reported in Annex 3. In compliance with contract requirements, the coverages for the total area covered by each image were obtained by merging (making codes and borders compatible) those produced by DISSOL VE with the originals (i.e., before intersection).
The attribute table of the intersection coverage was used to produce the land use change statistics and confusion matrix (see Annex 3).
INTERPRETATION OF CHANGES
Different types of natural vegetation and agricultura! practices were observed in the images, such as evergreen montane forest, deciduous forest (dry forest), gallery and mangrove forests, as well as banana plantations and shrimp farming. All types of forest cover around 38% of the land without clouds Oater referred to as overlap area). Montane forest cover 21.3% of the forest area, semi-evergreen forest cover 30.8%, deciduous forest 35.1 %, gallery-forest 1.4% and mangrove 11.7%. Sea cover 50.5% of the overlap area.
Net annual deforestation rate for the different types of forest was: montane forest 0.03%, semi-evergreen forest 0.02%, deciduous forest 0.2% and mangrove forest 1%. Total annual deforestation was 0.21% (excluding recuperation) on the overlap area..
Shrimp farming is located mainly within mangrove areas, the forest being cleared and large pools constructed. This activity exists on 6.6% of the overlap area, the shrimp farming area having a net annual increase of 3%.
Industrial banana plantations have replaced the gallery forest of sorne rivers. This agricultura! activity covers 3% of the overlap area, with an net annual increment of 0.4%.
6
Montane and deciduous forests are mainly located in the Piura Nature Reserve in Peru over the Amctape hills. Deciduous forest is found along the Pacific coastal plain or on small hills. Gallery forest occurs along sorne rivers that descend from the Piura Nature Reserve and the mangrove forest exists along the coast and the islands of the Jambelli Archipelago.
CONCLUSIONS
The study site is a deforestation hot spot of special importance because it presents a combination of different types of forest in a marginal area. Although sorne are protected by a nature reserve, this does not mean that they are safe. It was possible to observe deforestation, (especially along the lower parts of the Amctape hills) and the pressure on the reserve by Ecuadorians near the intemational border with Peru.
The mangrove forest was the most affected, its net annual deforestation rate (1 %) is close to national average of 1.6% (WRI-UNEP-UNDP-World Bank, 1998). The principal agents responsible of mangrove deforestation are the shrimp farmers who use the forest, wood and shrubland area to build new pools. Also they are beginning to expand their activity to other coastallands.
7
Annex 1
Geocoded image information
Tumbes (Path 011, Row 062, Quarter 2)
8

Maps Used for Georeferencing
IGN. 1982. Zorritos, Hoja 8-b, Tumbes-Perú, Topograhic map, Scale 1: 100 000, Instituto Geográfico Nacional, Serie ]632, Edition 2. Lima, Peru.
IGM. 1988. Alamar, CT-MVll-B2, 3581-I, Provincia de Laja-Ecuador, Topograhic map, Scale 1: 50 000, Instituto Geográfico Militar, Serie ]721-Edition 3, Quito-Ecuador
IGM. 1989. Puyango, CT-MVI-F4, 3582-II, Puyango-Ecuador, Topograhic map, Scale 1: 50 000, Instituto Geográfico Militar, Serie }721, Edition 2. Quito-Ecuador
IGN. 1995. Zarumilla, Hoja 7-c, Tumbes-Perú, Topograhic map, Scale 1: 100 000, Instituto Geográfico Nacional, Serie ]632, Edition 2. Lima, Peru.
IGM. 1984. Jambelí, CT-MVI-B4, 3584-II, Provincia de El Oro-Ecuador, Topograhic map, Scale 1: 50 000, Instituto Geográfico Militar, Serie ]721-Edition 1, Quito-Ecuador
IGN. 1985. Tumbes, Hoja 8-c, Tumbes-Perú, Topograhic map, Scale 1: 100 000, Instituto Geográfico Nacional, Serie ]632, Edition 2. Lima, Peru.
IGM. 1988. Santa Rosa de El Oro, CT-NV1-C1, 3683-IV, Provincia de El Oro-Ecuador, Topograhic map, Scale 1: 50 000, Instituto Geográfico Militar, Serie ]721, Edition 2. QuitoEcuador
IGM. 1990. Machala, CT-NV1-A3, 3684-III, Provincia de El Oro-Ecuador, Topograhic map, Scale 1: 50 000, Instituto Geográfico Militar, Serie ]721, Edition 2. Quito-Ecuador
IGM. 1990. Huaquillas,CT-MVI-D2, 3583-I, Provincia de El Oro-Ecuador, Topograhic map, Scale 1: 50 000, Instituto Geográfico Militar, Serie ]721, Edition 2. Quito-Ecuador
9
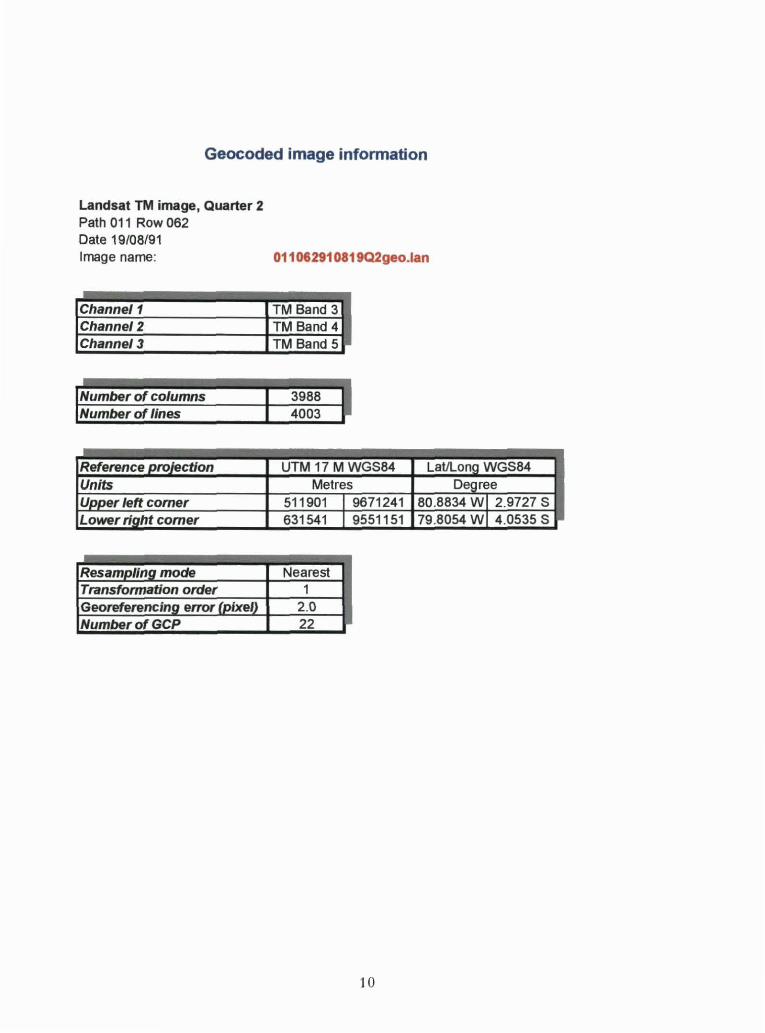
Geocoded image information
Landsat TM image, Quarter 2 Path 011 Row 062 Date 19/08/91 lrnage name:
Channe/1 Channe/2 Channe/3
INumber of co/umns INumber of lines
Reference projection Units Upper left comer Lower riqht comer
Resampllng mode Transformation order Georeterencing error [pixel) Number of GCP
011062910819Q2geo.lan
TM Band 3 TM Band 4 TM Band 5
3988 1 4003 1
UTM 17 M WGS84 Lat/Long WGS84 Me tres Degree
511901 1 9671241 80.8834 Wl 2.9727 S 631541 1 9551151 79.8054 Wl 4.0535 S
Nearest 1
2.0 22
10
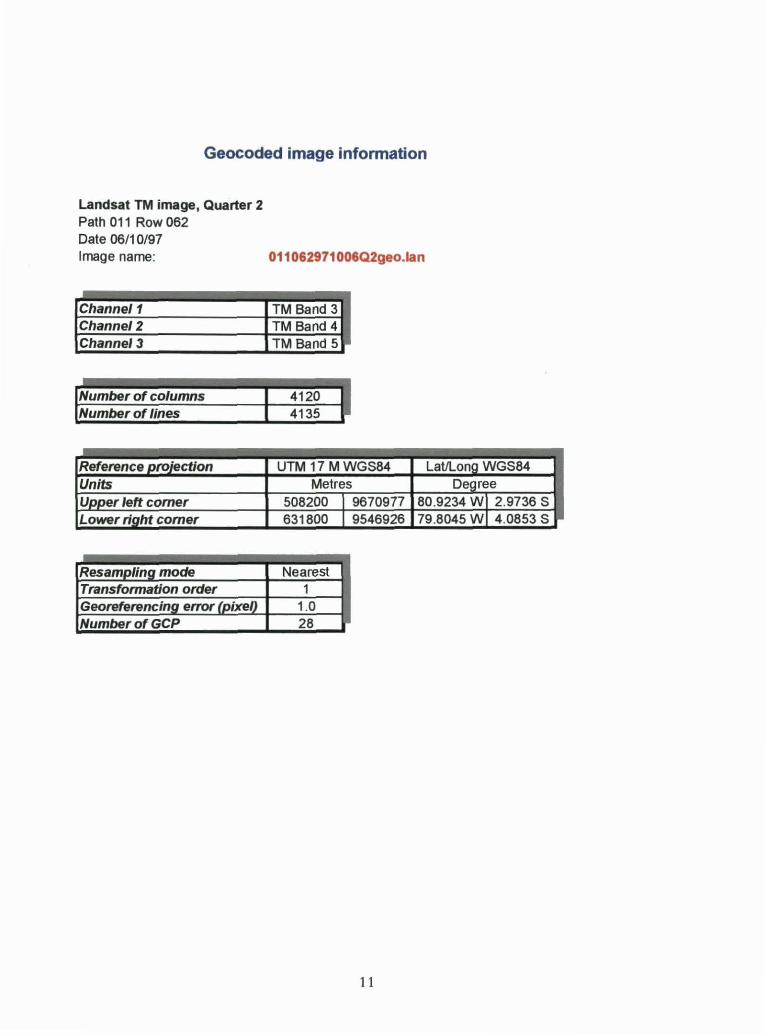
Geocoded image information
Landsat TM image, Quarter 2 Path 011 Row 062 Date 0611 0/97 lmage name:
Channe/1 Channe/2 Channel3
INumber of columns INumber ot lines
Reterence projecüon Units Upper left comer Lower right comer
Resampllng mode Transtonnation order Georeferencing error (pixel) Number of GCP
011062971 006Q2geo.lan
TM Band 3 TM Band 4 TM Band 5
4120 1 4135 ~
UTM 17 MWGS84 Lat/Long WGS84 Me tres Degree
508200 1 9670977 80.9234 WJ 2.9736 S 631800 1 9546926 79.8045 wl 4.0853 s
Nearest 1
1.0 28
11
Annex2
False colour composites
Tumbes (Path 011, Row 062, Quarter 2)
12
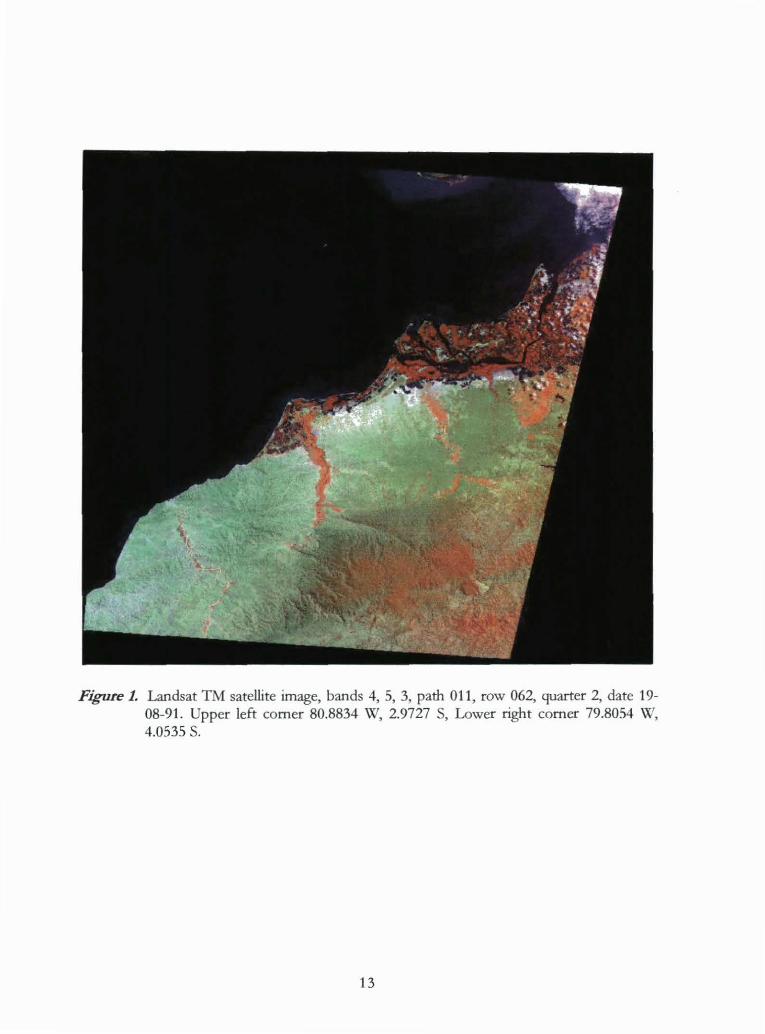
Figure 1. Landsat TM satellite image, bands 4, 5, 3, path 011, row 062, quarter 2, date 19-08-91. Upper left comer 80.8834 W, 2.9727 S, Lower right comer 79.8054 W, 4.0535 S.
13
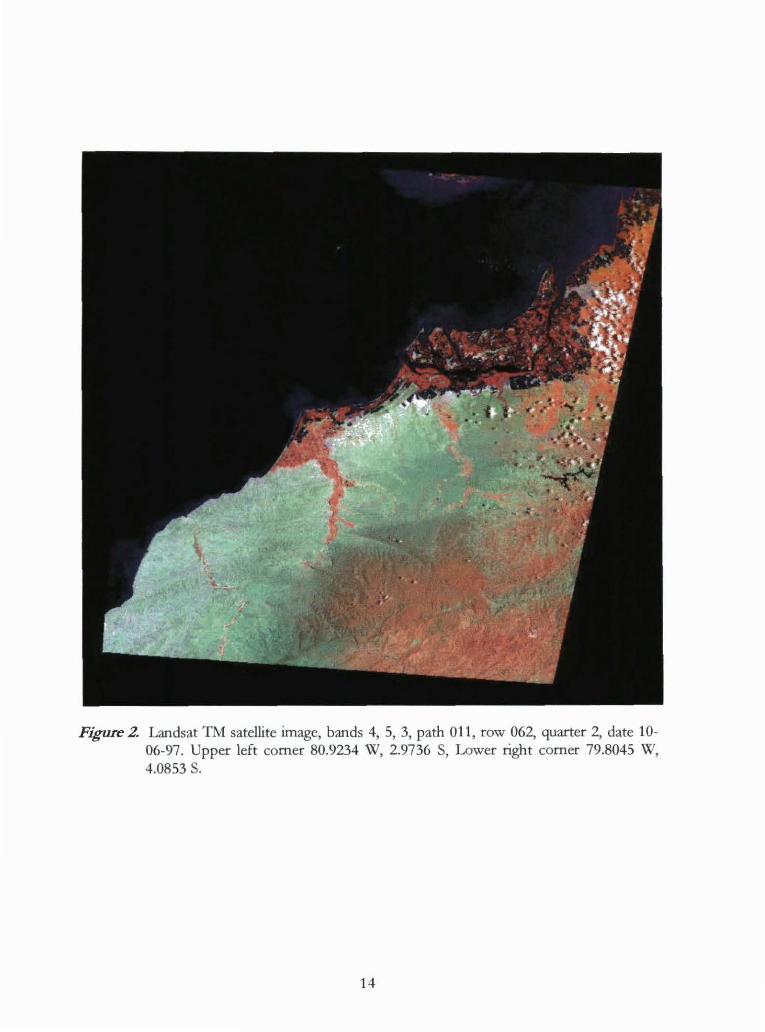
Figure 2. Landsat TM satellite image, bands 4, 5, 3, path 011, row 062, quarter 2, date 10-06-97. Upper left comer 80.9234 W, 2.9736 S, Lower right comer 79.8045 W, 4.0853 S.
14
Annex3
Land use / Land cover change (Overlap area)
Latacunga (Path 011, Row 062, Quarter 4)
15
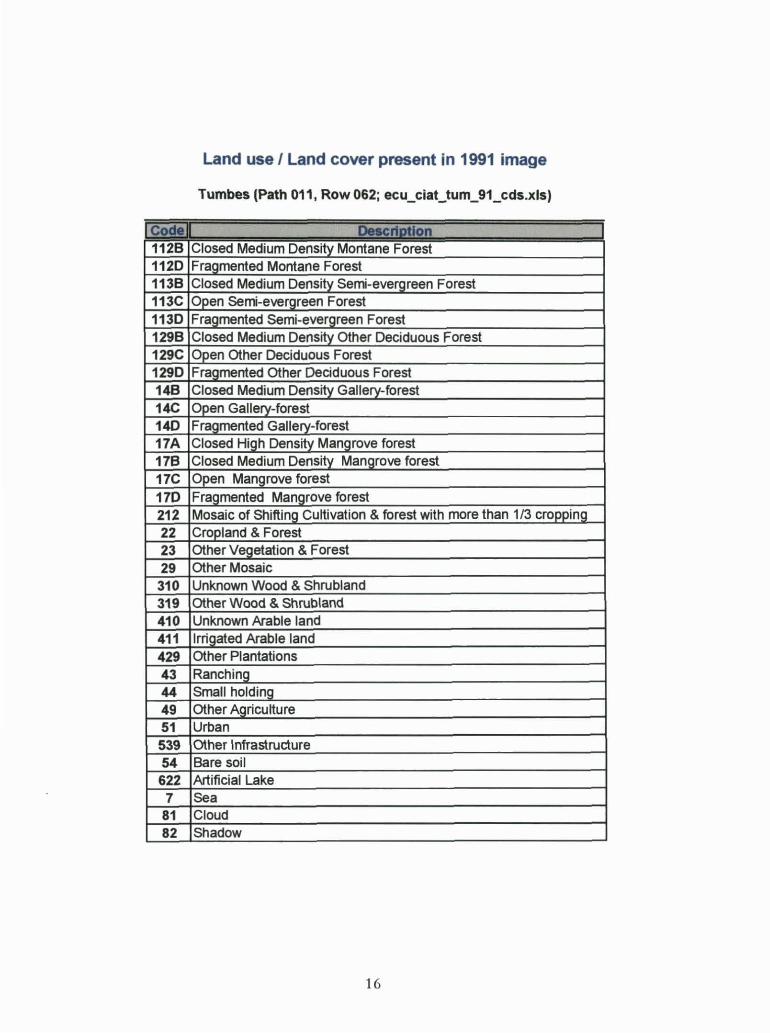
Land use 1 Land cover present in 1991 image
Tumbes (Path 011, Row062; ecu_ciat_tum_91_cds.xls)
Coctel DelcrtDtJon 1128 Closed Medium Density Montane Forest 1120 Fragmentad Montane Forest 1138 Closed Medium Density Semi-evergreen Forest 113C Open Serni-evergreen Forest 1130 Fragmentad Semi-evergreen Forest 1298 Closed Medium Density Other Deciduous Forest 129C Open Other Deciduous Forest 1290 Fragmentad Other Deciduous Forest 148 Closed Medium Density Gallery-forest 14C Open Gallery-forest 140 Fragmentad Gallery-forest 17A Closed High Densit)'_ Mangrove forest 178 Closed Medium Density Mangrove forest 17C OE>_en Mangrove forest
170 Fragmentad Mangrove forest 212 Mosaic of Shifting Cultivation & forest with more than 1/3 cropping 22 Cropland & Forest 23 OtherVegetation & Forest 29 Other Mosaic 310 Unknown Wood & Shrubland 319 Other Wood & Shrubland 410 Unknown Arable land 411 lrrigated Arable land 429 Other Plantations 43 Ranching 44 Small holding 49 Other Agricultura 51 Urban 539 Other lnfrastructure 54 Bare soil 622 Artificial Lake 7 Sea
81 Cloud 82 Shadow
16
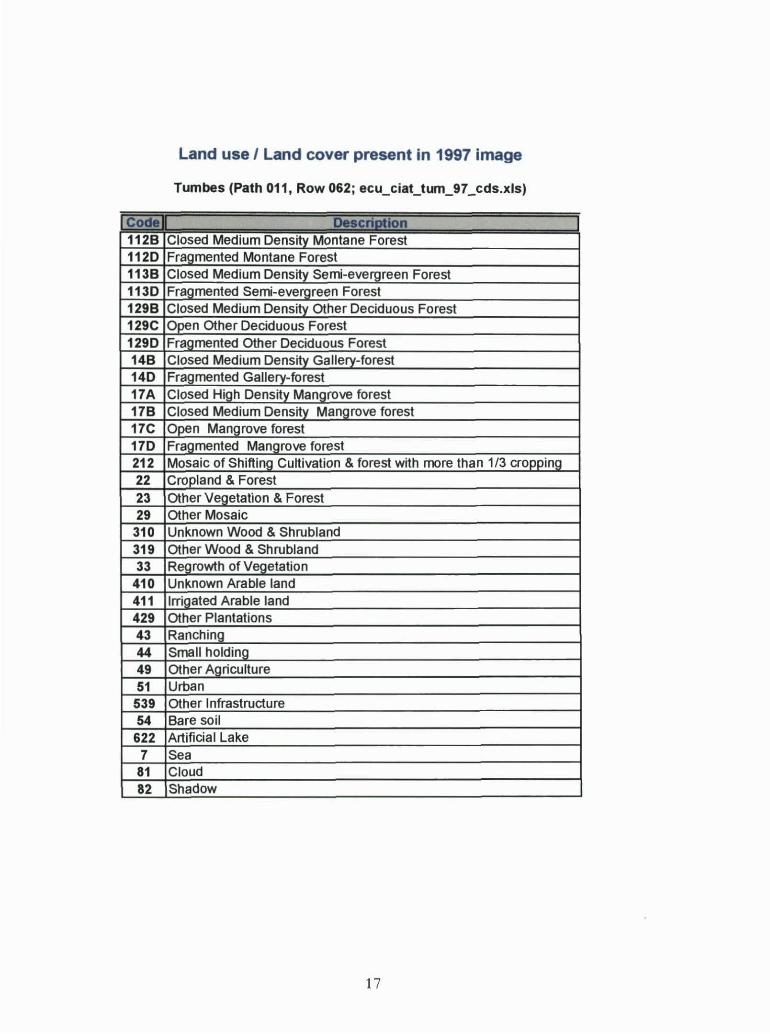
Land use 1 Land cover present in 1997 image
Tumbes (Path 011, Row 062; ecu_ciat_tum_97 _cds.xls)
Code Descriotlon 1128 Closed Medium Density Montane Forest 1120 Fr~gmented Montane Forest 1138 Closed Medium Density Semi-evergreen Forest 1130 Fra_g_mented Semi-evergreen Forest 1298 Closed Medium Density Other Deciduous Forest 129C Open Other Deciduous Forest 1290 Fragmented Other Deciduous Forest 148 Closed Medium Density Gallery-forest 140 Fragmented Gallery-forest 17A Closed High Density Mangrove forest 178 Closed Medium Density Mangrove forest 17C Open Mangrove forest 170 Fragmented Mangrove forest 212 Mosaic of Shifting Cultivation & forest with more than 1/3 cropping 22 Cropland & Forest 23 Other Vegetation & Forest 29 Other Mosaic 310 Unknown Wood & Shrubland 319 Other Wood & Shrubland 33 Regrowth of Vegetation
410 Unknown Arable land 411 lrrigated Arable land 429 Other Plantations 43 Ranching 44 Small holding 49 Other Agriculture 51 Urban
539 Other lnfrastructure 54 Bare soil 622 Artificial Lake 7 Sea
81 Cloud 82 Shadow
17
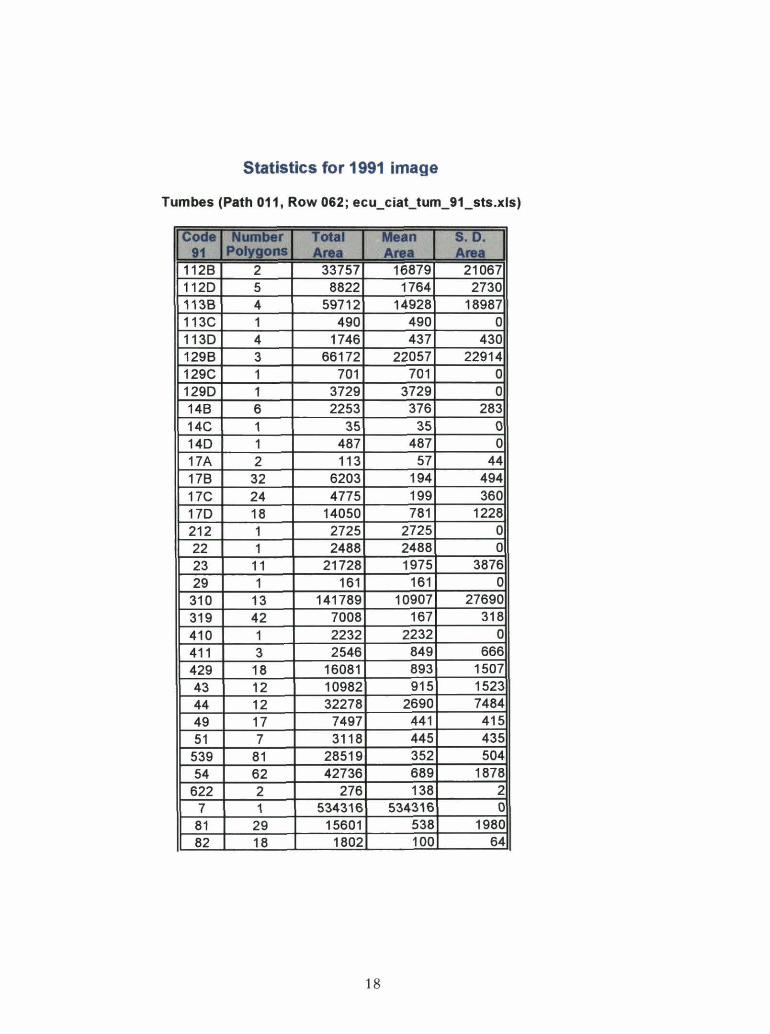
Statistics for 1991 image
Tumbes (Path 011, Row 062; ecu_ciat_tum_91_sts.xls)
ICode Number Total Mean S. D. 91 Polygona Area Area Area
1128 2 33757 16879 21067 1120 5 8822 1764 2730 1138 4 59712 14928 18987 113C 1 490 490 o 1130 4 1746 437 430 1298 3 66172 22057 22914 129C 1 701 701 o 1290 1 3729 3729 o 148 6 2253 376 283 14C 1 35 35 o 140 1 487 487 o 17A 2 113 57 44 178 32 6203 194 494 17C 24 4775 199 360 170 18 14050 781 1228 212 1 2725 2725 o 22 1 2488 2488 o 23 11 21728 1975 3876 29 1 161 161 o 310 13 141789 10907 27690 319 42 7008 167 318 410 1 2232 2232 o 411 3 2546 849 666 429 18 16081 893 1507 43 12 10982 915 1523 44 12 32278 2690 7484 49 17 7497 441 415 51 7 3118 445 435
539 81 28519 352 504 54 62 42736 689 1878 622 2 276 138 2
7 1 534316 534316 o 81 29 15601 538 1980 82 18 1802 100 64
18
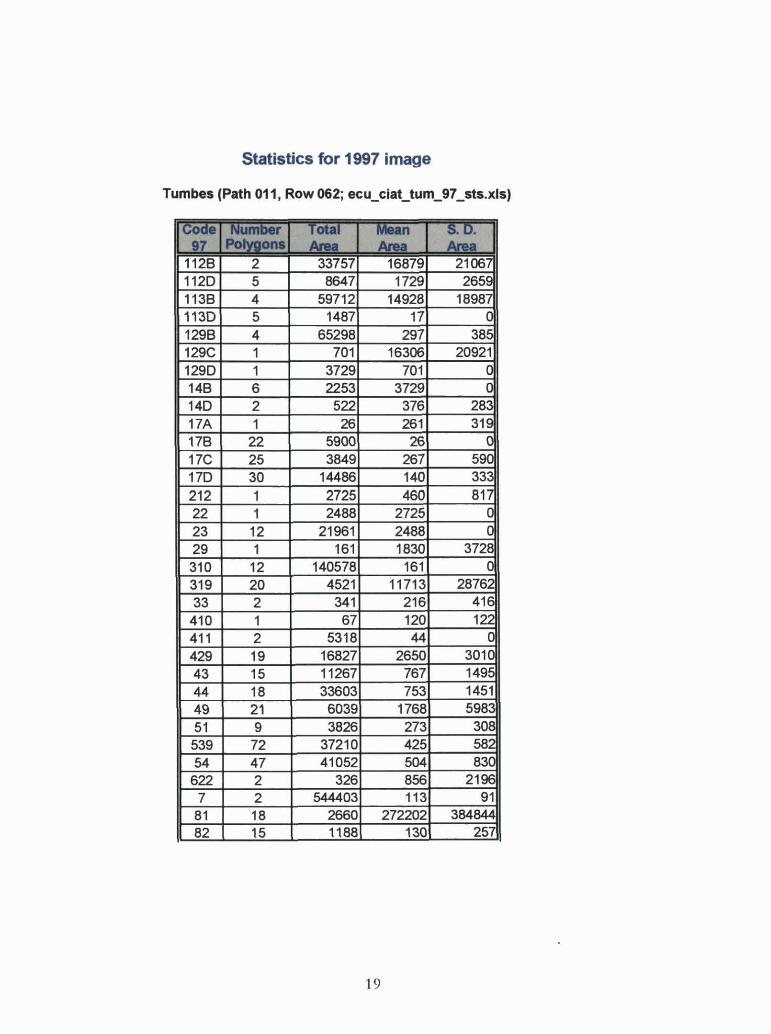
Statistics for 1997 image
Tumbes (Path 011, Row 062; ecu_ciat_tum_97_sts.xls)
ICode NumDer Total Mean S. D. 97 [Polygons Area Araa Anta
1128 2 33757 16879 21067 1120 5 8647 1729 2659 1138 4 59712 14928 18987 1130 5 1487 17 o 1298 4 65298 297 385 129C 1 701 16306 20921 1290 1 3729 701 o 148 6 2253 3729 iJ 140 2 522 376 283 17A 1 26 261 319 178 22 5900 26 e 17C 25 3849 267 590 170 30 14486 140 333 212 1 2725 460 817 22 1 2488 2725 o 23 12 21961 2488 -6 29 1 161 1830 3728 310 12 140578 161 o 319 20 4521 11713 28762 33 2 341 216 416 410 1 67 120 122 411 2 5318 44 a 429 19 16827 2650 301C 43 15 11267 767 149~
44 18 33603 753 1451 49 21 6039 1768 598~ 51 9 3826 273 30S 539 72 37210 425 582 54 47 41052 504 83C 622 2 326 856 2196 7 2 544403 113 91
81 18 2660 272202 384844 82 15 1188 130 257
19
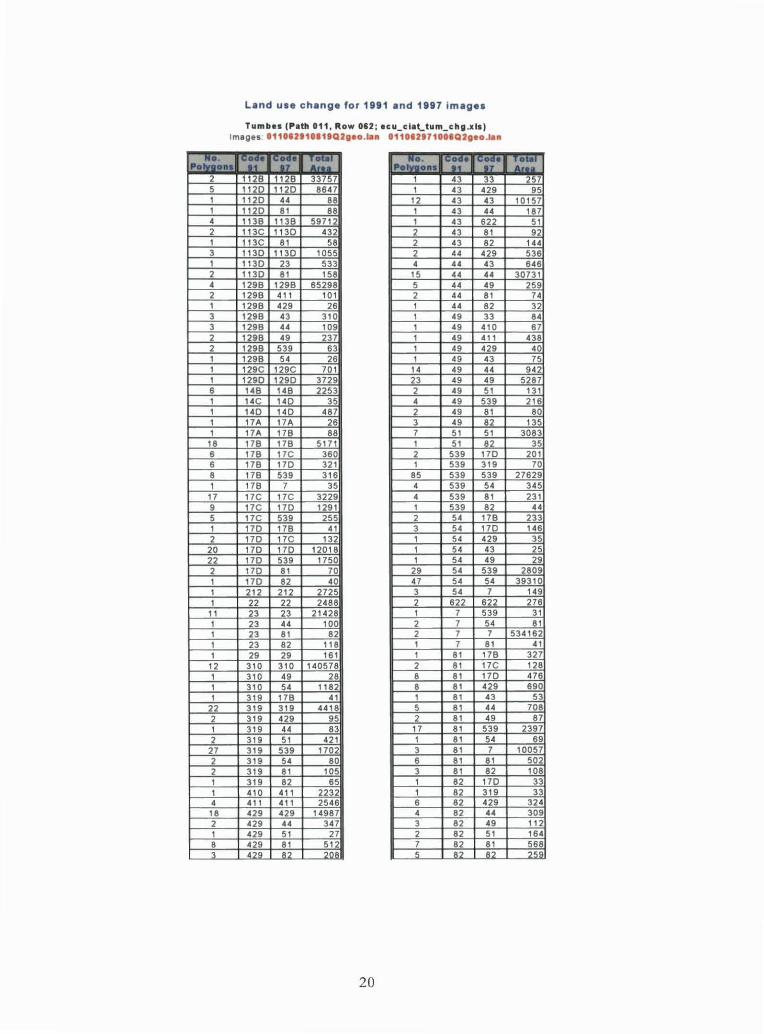
Land u ae chan go for 11191 and 111117 im agea
Tumbes IPath 011 , Row 012 ; ecu_clat_tum_chg.x ls) lmages. 1110UI11111Q2geo. t.n 111012171001Q2geo.lan
... .:: •.. llli::-1 llli:;· =: ... :: .... , .. ::. , .. ::. 2 126 112B 33757 1 43 33 5 1120 1120 8647 1 43 429 1 1120 44 88 12 43 43 1 1120 81 88 1 43 44 4 1138 11 38 59712 1 43 622 2 113C 11 30 432 2 43 81 1 113C 81 58 2 43 82 3 1130 11 30 1055 2 44 429 1 1130 23 533 4 44 43 2 1130 81 158 15 44 44 4 1298 1298 65298 5 44 49 2 1298 411 101 2 44 81 1 1298 429 26 1 44 82 3 1298 43 310 1 49 33 3 1298 44 109 1 49 410 2 1298 49 237 1 49 411 2 1298 539 63 1 49 429 1 1298 54 26 1 49 43 1 129C 129C 701 14 49 44 1 1290 1290 3729 23 49 49 6 148 148 2253 2 49 51 1 14C 140 35 4 49 539 1 140 140 487 2 49 81 1 17A 17A 26 3 49 82 1 17A 178 88 7 51 5 1 18 178 178 5171 1 51 82 6 178 17C 360 2 539 170 6 178 170 321 1 539 319 8 178 539 3 16 85 539 539 1 178 7 35 4 539 54 17 17C 17C 3229 4 539 81 9 17C 170 1291 1 539 82 5 17C 539 255 2 54 178 1 170 178 41 3 54 170 2 170 17C 13 1 54 429
20 170 170 12018 1 54 43 22 170 539 1750 1 54 49 2 170 81 70 29 54 539 1 170 82 40 47 54 54 1 212 212 2725 3 54 7 1 22 22 2488 2 622 622
11 23 23 2 1428 1 7 539 1 23 44 100 2 7 54 1 23 81 82 2 7 7 1 23 82 118 1 7 81 1 29 29 161 1 81 178 12 310 3 10 140578 2 81 17C 1 310 49 28 8 81 170 1 310 54 1182 8 81 429 1 319 178 41 1 81 43
22 319 319 4418 5 81 44 2 319 429 95 2 81 49 1 319 44 83 17 81 539 2 319 51 42 1 1 81 54
27 319 539 1702 3 81 7 2 319 54 80 6 81 81 2 319 81 105 3 81 82 1 319 82 65 1 82 170 1 410 411 2232 1 82 319 4 411 41 1 2546 6 82 429 18 429 429 14987 4 82 44 2 429 44 347 3 82 49 1 429 51 27 2 82 51 8 429 81 512 7 82 81 3 429 82 208 5 82 82
20
~= 257
95 10157
187 51 92
144 536 646
30731 259
74 32 84 67
438 40 75
942 5287
131 216
80 135
3083 35
201 70
27629 345 231
44 233 146 35 25 29
2809 39310
149 276
31 81
534162 41
327 128 476 690
53 708
87 2397
69 10057
502 108 33 33
324 309 112 164 568 259
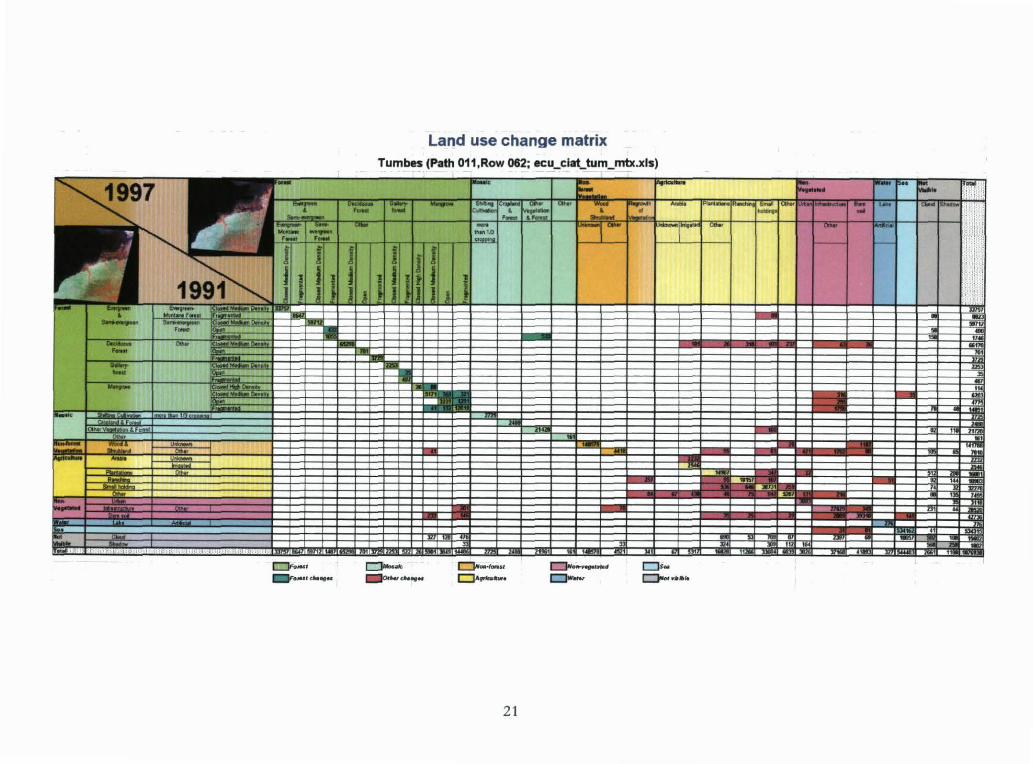
Land use change matrix Tumbes (Path 011,Row 062; ecu_ctat_tum_mtx.xls)
1997 r-., ~ . .. ' =-- ::" ;r - ¡;:;_ ,.._. . . . 1,... lo= ":'"'¡.,;;, - .,. ¡::::;;;; ,... ... --- ·-- .. .-:-- ·--- ~- _, - ... - - .. -,.::: .... 1+ -ii
.. • 1 ••• --,- - ~ -- "
1
! l 1 J ,_ L..l - - ~ ,... - .: .
1 _ ~91 1~1~ r 1 1 1 1 r 1 1 1 ." ~~~ •. .• : ~ ~ r:·¡:
= - ~ . ~ +"'~- . ;r ~ ~- • P..
- . - -- -á =- ~ ~ -- ~ ~ -""'"" 1- • ~ -¡;-;
;-~ ~ ---= , ~ ~· =· - ~ .. · Jiil
. "" .... ".". ~~~- ~ti . ~ ~ - 1 c::JFo-· ..,. ....... _ e:;..-..,..., ....... ClN--~-·
~--
21
t::lN·c:Jw--CJs-CJotoo ·••to
Annex4
Land use interpretation key
22

The TREES project classification key was obtained from the ftrSt TREES II project proposal, modified during the TREES project workshop in Caracas, Venezuela (FebruaryMarch 99), and finalised according to the recommendations ofTREES advisor, Orto Huber.
During the Caracas workshop, the suitability of a TREES table codes proposal for describing real land use/land cover in the different Latin American countries (LAC) was discussed. The participants decided to add four classes in the 4th forest classification level (A, B, C, D), to add a "small holding" code (44) as well as "bare soil and rocks" code (54).
In July-August 99 Mr. Otto Huber visited the different institutions collaborating with the TREES project in South America to discuss and agree on the codes to be assigned to the different land-use and land-cover classes. Sorne important land uses/land cover appearing on the images that CIAT is processing did not have a specific code (even after the Caracas meeting). Following discussion we agreed to select existing codes to describe these ambiguous land uses/land covers instead of adding new ones. The "paramo" vegetation was assigned to code 39, the "jalea" and "puno" vegetation to 329, "shrimp farming" to 59, "deciduous forest" (129A, 129B, 129C, 129D) and snow cover to 59. The codes for "arable land for agriculture" (411 or 412) were used to describe industrial and technical high-input agriculture, such as sugar cane, cotton, pine, et cetera. Low-input, small area agriculture was assigned "small holding" code (44).
The "ranching" code (43) was used for large areas of cattle activities. This was a simple task for cases where the limits of the area were geometrical ( e.g., a single large farm in the middle of the jungle). In other cases, the large area did not have geometrical boundaries, so it was impossible to tell if it corresponded to a single large farm or many small ones. We assumed that code 43 applied in these cases.
The regeneration areas ("vegetation re-growth" and "forest re-growth'') are not easy to distinguish, especially because the period when the land was abandoned is unknown. In addition, the spectral response of healthy vegetation re-growth with forest re-growth is similar in sorne cases. We should reconsider the period of time that defmes what is "vegetation re-growth "and "forest re-growth". In the tropical forest, re-growth can last 100 years until the forest structure corresponds to that of the primary forest. In theory, the succession process in the secondary forest starts at the moment the land is abandoned and ends when the tree species are totally replaced by primary forest.
The deciduous forest class should have a Level 3 code for the dry forests in the American Tropics (we used codes 129A-D, "other deciduous forests").
The classification key was translated to Spanish to ensure it could be clearly understood by our interpreters. Each translated code was checked and interpreted by Mr. O tto Huber to avoid interpretation mistakes.
23
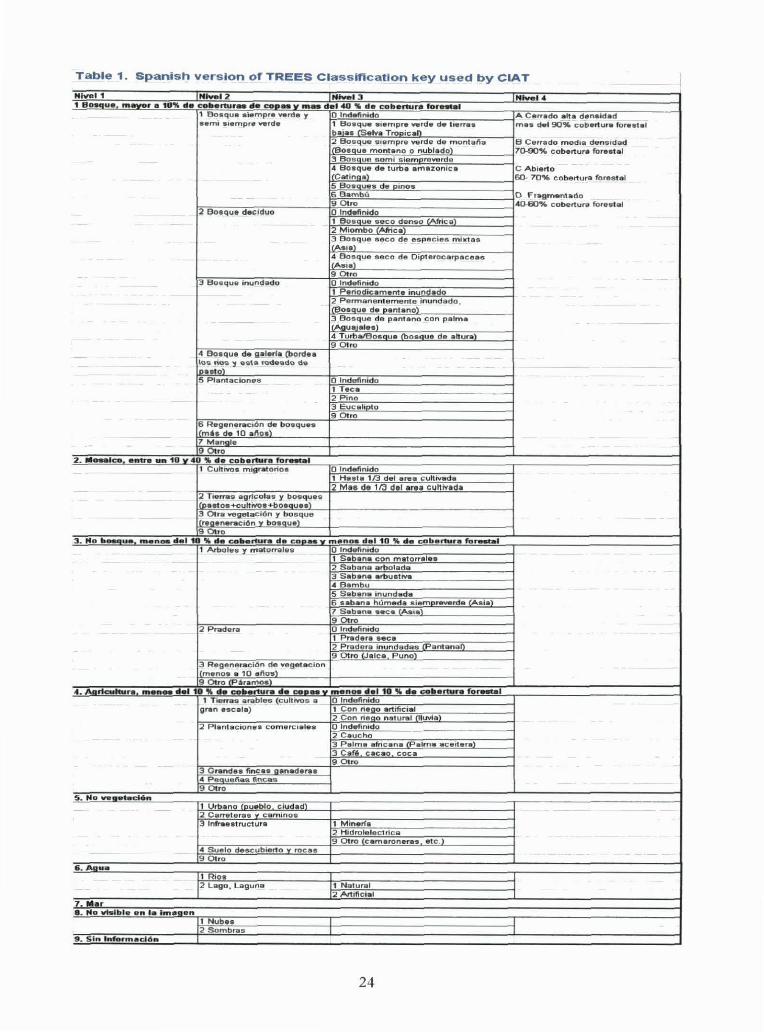
Table 1 . Spanlsh verslon of TREES Classlftcatlon key used by CIAT
Nlval1 Nlve12 Nlve13 Nlvel4 1 Bosque ,.,_.., e 10'11. de coltenurae •• co• .. v ., .. del 40 'lo de coberture for-el
1 Boaque siempre wrde y o lnct.llnldo A Cerrado atta denaidad aemt • •empre verde 1 Boa que ••empre verde de lterrea
be ·a a rSelva Tronican mea d.l90% c oberture foreatel
2 Boaquv u •vmpra verde de montana B Cerra do med1a dvmu dgd IIBoaoua montano o nublado) 70.90% cob artu .. foreatal 3 Boaa u e semi sie m oreverde 4 Bosque de turba a rne%onica e Abierto Calina al 60- 70'% c obertura fores tal
5 Boaa~H~w de oonow 6Bambú O Fragm•n1ado 9 Otro 40-SJ% cvbartuna fores t al
2 Boaque deciduo O Indefinido 1 BoaQue ae c:o denso CAtric e 12 M iombo Mica 3 Bos que s eco d e e spacies mhctaa A eoa)
4 Bos que seco d e O ipterocarpac eea Aaoal
9 Otro 3 Boa que inundado O lndefinodo
1 Periodicamente inundado ~~ermanontemente inundado ,
oeaue de o antanol 3 Bos que de pa ntano c on pelma fA&Iua elaal 4 TurbaiEiosa ua tboaaua de altura 9 Otro
4 Boaque da ¡¡alarle (bordea 'os rio-. :y e ata rodeado de loaetol 5 Pla ntac iones O Indefinido
1 Teca 2 Pino 3 Euc ahoto 9 Otro
6 Regena.-.ct6n de bowquaa lfmb da 10 ello!l 7 Man~ale 19 Otro
2.·-·- enuw ua 10 y 40 '!lo de cobertura fo.--1 1 C ultivoa m i gratorio • O Indefinido
1 Haete 113 del are• cultMide 2 M .. de 113 d el are a cuhived•
2 Ttern~a a_grfc.ol a• y bosques lroeetoe+cuhivoa+bo•quae) 3 Otra ve¡¡etaci6n y bos que lcreaanareci6n_y_boe~qua) 90tro
3. Mo 11-u• mene. del 10 '4 tle callertura d• cop- m•n- del 10 'llo ... caber1u ... fa-• 1 Art>oles y mato,...lee O Indefinido
1 Sabana con metorralaa 2 Saba na arbolada 3 Sabana erbuetMI 4 B ambu 5 Sabaneinundad• 6 aabane húmed• siemo,....rde (As ia 7 Sabane ••e • lAsta 9 Otro
2 Pradara O lndufinodo 1 Pradera eeca 2 Pradera inundadas (Panta no 9 Otro Jal ea Puno
3 R e g e neraci ón d e ve getecion 1 (mano• • 1 O allosl 9 Otro (P6ramoe
4 . Aartcuhure me- del 10 'llo de co ... rture de COII- menoe del 10 'llo •• colterture for-1 1 Teerras arab les (c ultivos a O Indefinido g,.n .. cele) 1 Con neao ertificilll
2 Con rieao natural Oluvla 2 Plantaciona• come rc1ala• O lndelinodo
2 Cauc ho 3 Palma africana lPatma a c ertara 3 Cef6 cacao coca 90tro
G rande a fine•• aanada ... 4 P e Que t\aa f\nc.aa 9 Otro
5.No.,.e-d6n 1 Urbano coueblo clud,!!ll 2 C arret era• y_ c;amin oa 3 lnl'raeatruct>Jre 1 Minarla
2 Hidro .. ls ctrlca 9 Otro eamaron.,.s etc.
4 Suelo descubierto y rocas 9 Otro
&. Aau• 1 Rioa 2 Lago, Laguna 1 N'a·rura l
2 Artillc:lel 7 • ••• 8 . No vt.lbla a n 1• lm•a•n
1 Nube• 2 S ombras
9 . Sin lnform•d6a
24
Annex 5
Forest cover change in South America
25
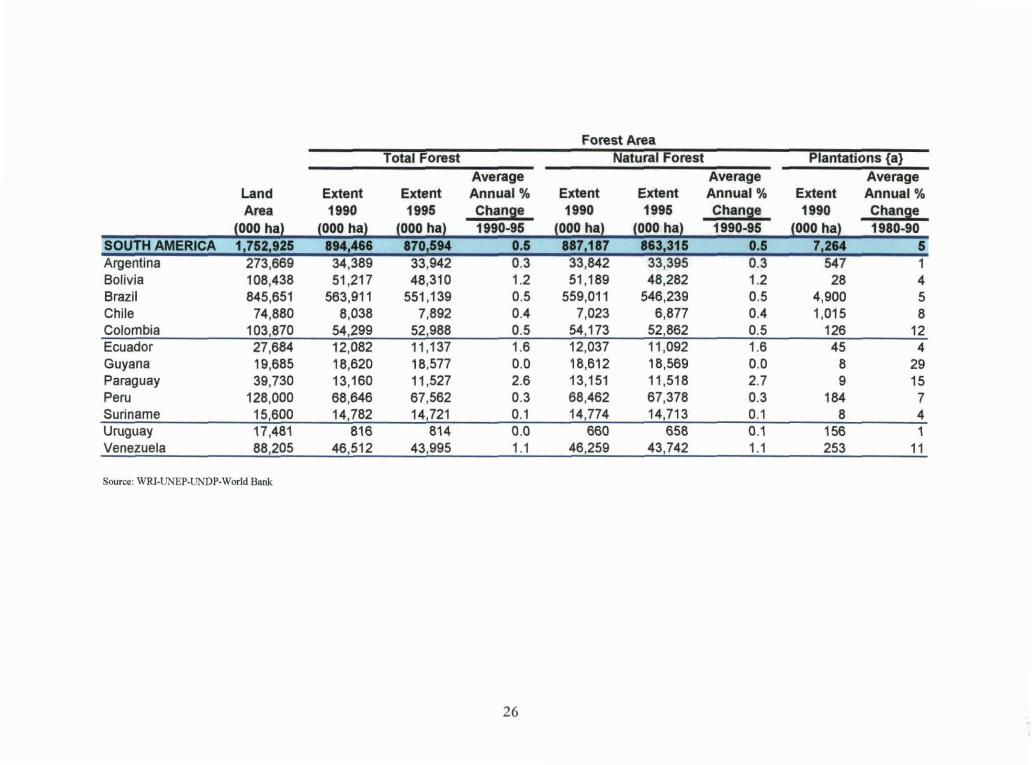
Forest Area Total Forest Natural Forest Plantations {a}
SOUTH AMERICA Argentina Bolivia Brazil Chile Colombia Ecuador Guyana Paraguay Peru Suriname Uruguay Venezuela
Average Average Land Extent Extent Annual % Extent Extent Annual % Extent Area 1990 1995 Change 1990 1995 Change 1990
(000 ha) (000 ha) (000 ha) 1990-95 (000 ha) (000 ha) 1990-95 (000 ha) 1,752,925 894,466 870,594 0.5 887,187 863,315 0.5 7,264
273,669 34,389 33,942 0.3 33,842 33,395 0.3 547 108,438 51 ,217 48,310 1.2 51 ,189 48,282 1.2 28 845,651 563,911 551 ,139 0.5 559,011 546,239 0.5 4,900
74,880 8,038 7,892 0.4 7,023 6,877 0.4 1,015 103,870 54,299 52,988 0.5 54,173 52,862 0.5 126 27,684 12,082 11 ,137 1.6 12,037 11 ,092 1.6 45 19,685 18,620 18,577 0.0 18,612 18,569 0.0 8 39,730 13,160 11 ,527 2.6 13,151 11 ,518 2.7 9
128,000 68,646 67,562 0.3 68,462 67,378 0.3 184 15,600 14,782 14,721 0.1 14,774 14,713 0.1 8 17,481 816 814 0.0 660 658 0.1 156 88,205 46,512 43,995 1.1 46,259 43,742 1.1 253
Source: WRI-UNEP-UNOP-World Bank
26
Average Annual% Change 1980-90
5 1 4 5 8
12 4
29 15 7 4 1
11
REFERENCES
Adger, W.N. and Brown K. 1994. Land use and the causes of global warming. John Wiley, UK. 271 p.
Begler, E.B. 1980. Modernizat:ion of agricultural product:ion and the problem of rural unemployment the search for work among the rural proletariat of the Peruvian North Coast. University Microfilms Internacional, Michigan, USA. 258 p.
Brawer, M. 1991 . Atlas of South America. Simon and Schuster, NY. p.52-56.
Diaz-P., S. 1998. El medio ambiente Colombiano y los cultivos ilícitos . Rev. Acad. Colombiana de Ciencias Exactas Física y Naturales, Bogotá, Colombia. 22:173-186.
Feininger, T. 1975. Geología de la zona Arenillas - Puyango, Provincia de El Oro. Programa Regional para Desarrollo del Sur del Ecuador (PREDESUR). Publicació no. 37. 143 p.
Frohn, R.C. 1998. Remote sensing for landscape ecology. New metric indicators for monitoring. Modeling and assessment of Ecosystems. CRC Press, Boca Raton, FL. 99 p.
Hiroaka, M. and Y amamoto S. 1980. Agricultural development in the Upper Amazon of Ecuador. Geog. Rev. p. 431.
JRC. 1997. Ident:ificat:ion of deforestat:ion hot spot areas in the humid tropics. TREES (Tropical Ecosystem Environment Observat:ions by Satellites), J oint Research Centre, European Commission. Synthesis of expert consultat:ion meeting, Ispra, Italy, 24-25 November 1997. TREES Publicat:ions Series B. Research Report no 4. 99 p.
Las so, G. 1992. Deterioro de los bosques en Ecuador. Bosques y Desarrollo, Cali, Colombia. Año 3 (5-mayo):29-32/58.
Myers, N. 1984. The primary source: tropical forests and our future. Norton, NY. 150 p.
Navas A.J. 1982. Considerat:ions on the Colombian Amazon region. In: Amazonia, agriculture and land use research. Centro Internacional de Agricultura Tropical (CIA1), Cali, Colombia. p. 41 -59.
Ortiz, S. 1984. Colonization in the Colombian Amazon. In: Schmink M. and Wood C. (eds.) Front:ier expansion in Amazonia. University Presses of Florida, FL. 206 p.
27
PMRC. 1992. El manglar un ecosistema fundamental. Ecuador visison global para el desarrollo de la costa. PMRC, Bosques y Desarrollo, Cali, Colombia. Año3(6-octubre) :46-48.
Rudel, T.K. 1993. Tropical deforestation. Small fanners and land clearing in the Ecuadorian Amazon. Columbia University Press, NY.
Steannan, A.M. 1985. Camba and kolla: migration and development in Santa Cruz, Bolivia. University of Central Florida Press, Orlando, FL. 158 p.
Utting, P. 1993. Trees, people and power. Social dimensions of deforestation and forest protection in Central America. Earthscan Pub!, UK. 14 p.
WRI-UNEP-UNDP-World Bank (World Resources Institute- United Nations Environment Programme-United Nations Development Programme-World Bank). 1998. World Resources, 1998-99. WRI-UNEP-UNDP-World Bank, NY. p. 291-302.
28