treatment of pcb contaminated paints at badger munitions depot
TRANSCRIPT
1
Final Report
TREATMENT OF PCB CONTAMINATED PAINTS AT BADGER MUNITIONS DEPOT
Part of the ESTCP project titled, “APPLICATON
OF A BIMETALLIC TREATMENT SYSTEM (BTS) FOR PCB REMOVAL FROM
OLDER STRUCTURES ON DOD FACILITIES.”
Cherie L. Geiger, Ph.D. and Christian A. Clausen, Ph.D. Chemistry Department
University of Central Florida

2
TABLE OF CONTENTS Section Title Page Background 3 Building 6810-11 3 Building 6810-36 23 Building 6657-02 36 Staging Area 49 Appendix A: Workplan 60

3
Badger Field Test Results
Background: In November of 2006, NASA and the UCF team members traveled to
Badger to collect samples from previously identified locations of PCB contamination.
The purpose of the visit was to take samples of material that could be tested in the
laboratory with the BTS treatment system to establish the optimum formulation and
conditions for PCB degradation. As described in the workplan, which is included in
Appendix A, the sampling procedure was much more complicated than simply taking
paint samples. It was necessary to obtain a sample of the structural material with the paint
still adhered to it. Thus, it was necessary to cut pieces of concrete from the press bunkers,
along with collecting various wood and metal parts from the various contaminated sites.
During the November 2006 visit to Badger, samples were collected from six
major PCB contaminated sites. These sites consisted of two press house buildings, 6810-
11 and 6810-36; a wooden rest house, building 6815-08; a nitrating house building, 6657-
02; a roll house building, 687-20 and various parts collected from presses located in the
staging area.
Based upon analysis and treatment of the collected samples as described in the
workplan, it was decided that field testing of the BTS technology would be focused on
only four locations, press houses 6810-11 and 6810-36, the nitrating tanks in 6657-02,
and the press staging area. The results of the field test are reported in the following
discussion. What will be presented is the specific location of each test site along with
PCB concentrations prior to treatment, after one week, two weeks and three weeks of
treatment with the BTS technology. In addition, results will be reported on the PCB
degradation that occurred in the paste after the samples were returned to the UCF
laboratory.
Treatment of Press House 6810-11
Figure 1 shows the location within the bunker 6810-11 where the BTS treatment
was applied. The treatment consisted of applying the BTS paste to two one-square foot
sections, where one of the sections would be sampled after one week of treatment and the
second section would be sampled after two weeks. A third section consisted of a three-

4
square foot section that would be sampled after three weeks. There were three of these
treatment areas set-up in 6810-11. One section was treated with BTS paste that contained
no active Mg/Pd metal. This section was sealed with a vinyl polymer coating. A second
section was set-up with BTS paste that contained active Mg/Pd particles and was sealed
with vinyl polymer. A third section was treated with BTS paste that contained active
Mg/Pd particles and the paste was sealed with a silicon polymer. The location of the test
treatment area is shown in Figure 1.

5

6
Prior to treatment, samples of paint were collected from each section. Four
square-inch samples of paint were collected from each of the one-square foot sections
and four sets of samples, each four square-inches in area, were collection from the three-
square foot treatment area. The samples from the three-square foot treatment area were
labeled as A, B, C, D with A being the top most sample.
Figure 2 shows where the pre-treatment samples were taken for the section that
was to be treated with the BTS containing active Mg/Pd particles and sealed with a vinyl
polymer. These samples have the prefix identification of 6810-11 MgPd-VP. What can
also be seen in this figure in the lower right corner is where sections of concrete were cut
out from the wall for preliminary treatment tests back in November of 2006. The other
two treatment sections in 6810-11 were sampled in a similar manner. Samples of concrete
to a depth of 3/8 inch were also taken from each treatment location before and after BTS
treatment.
Figure 2. Location of pre-treatment samples in 6810-11.
After all of the pretreatment samples were taken, the next step involved applying
the BTS paste to the wall. The original plan was to spray the BTS onto the test section
using a cartridge type sprayer gun as shown in Figure 3. However, the temperature
dropped so low as evidenced by the snow falling outside the bunker as shown in Figure 4,
that the paste became too viscous to spray. Therefore, it became necessary to apply the
paste to the test section by troweling it on. This technique was used to apply the BTS

7
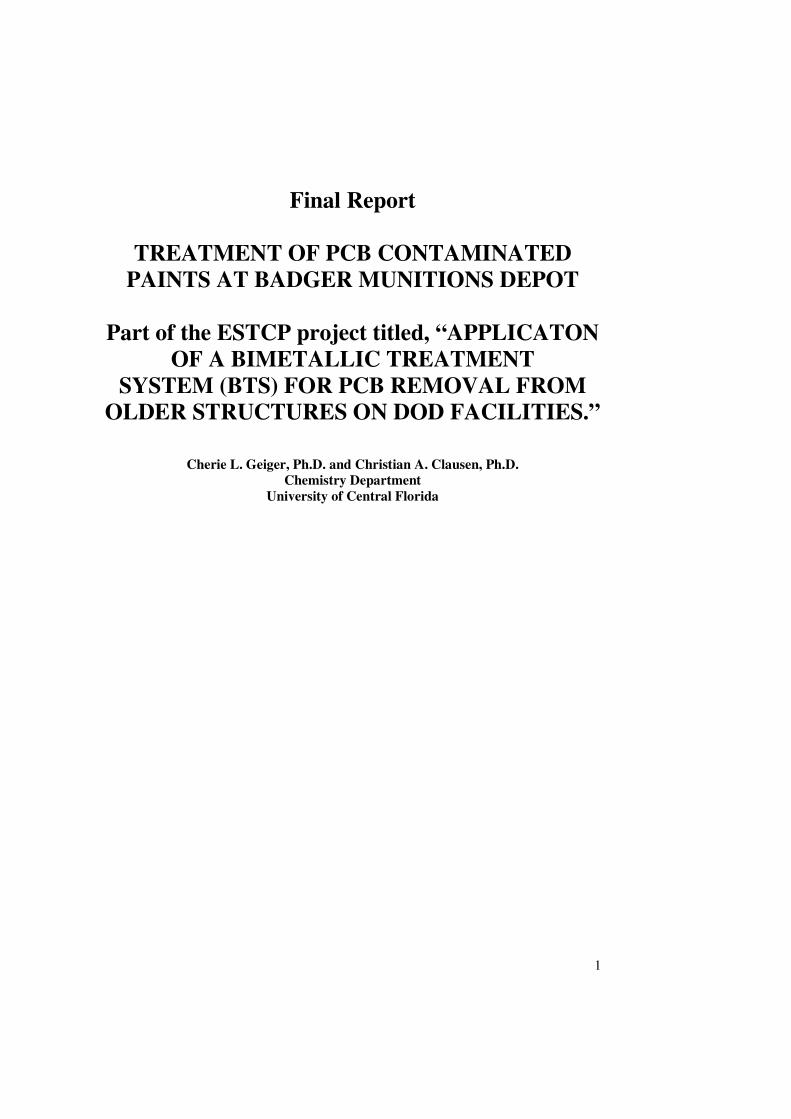
paste to all other test locations. After the BTS paste was applied to the test section, the
sealant was then sprayed onto the paste to cover it. The vinyl polymer sealant was
sprayed on by using a cartridge spray gun as can be seen in Figure 5. The silicon sealant
was applied by using a typical commercial spray gun as shown in Figure 6.
Figure 3. Spraying BTS with cartridge-type spray gun.
Figure 4. Snow fall outside building 6810-11 during BTS application.
8
Figure 5. Vinyl polymer sealant application using spray gun.
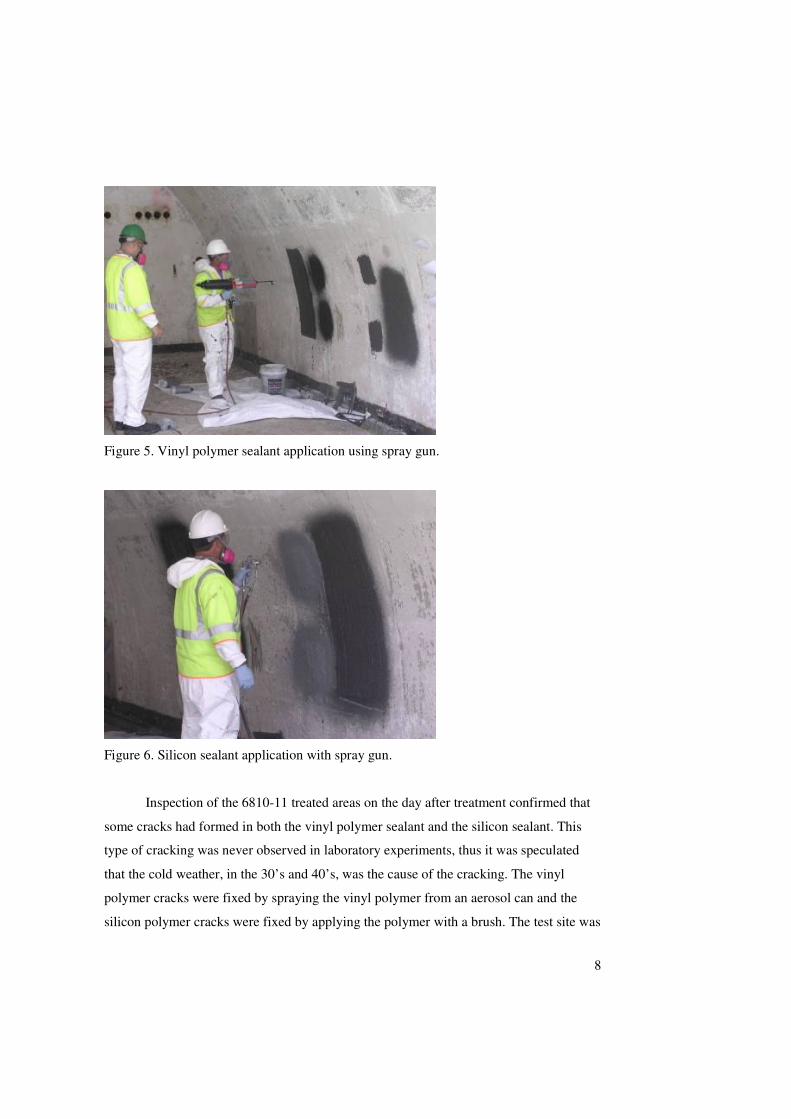
Figure 6. Silicon sealant application with spray gun.
Inspection of the 6810-11 treated areas on the day after treatment confirmed that
some cracks had formed in both the vinyl polymer sealant and the silicon sealant. This
type of cracking was never observed in laboratory experiments, thus it was speculated
that the cold weather, in the 30’s and 40’s, was the cause of the cracking. The vinyl
polymer cracks were fixed by spraying the vinyl polymer from an aerosol can and the
silicon polymer cracks were fixed by applying the polymer with a brush. The test site was

9
checked each day for a week until week one samples were taken. Any new cracks in the
sealant that formed during the week were repaired as described.
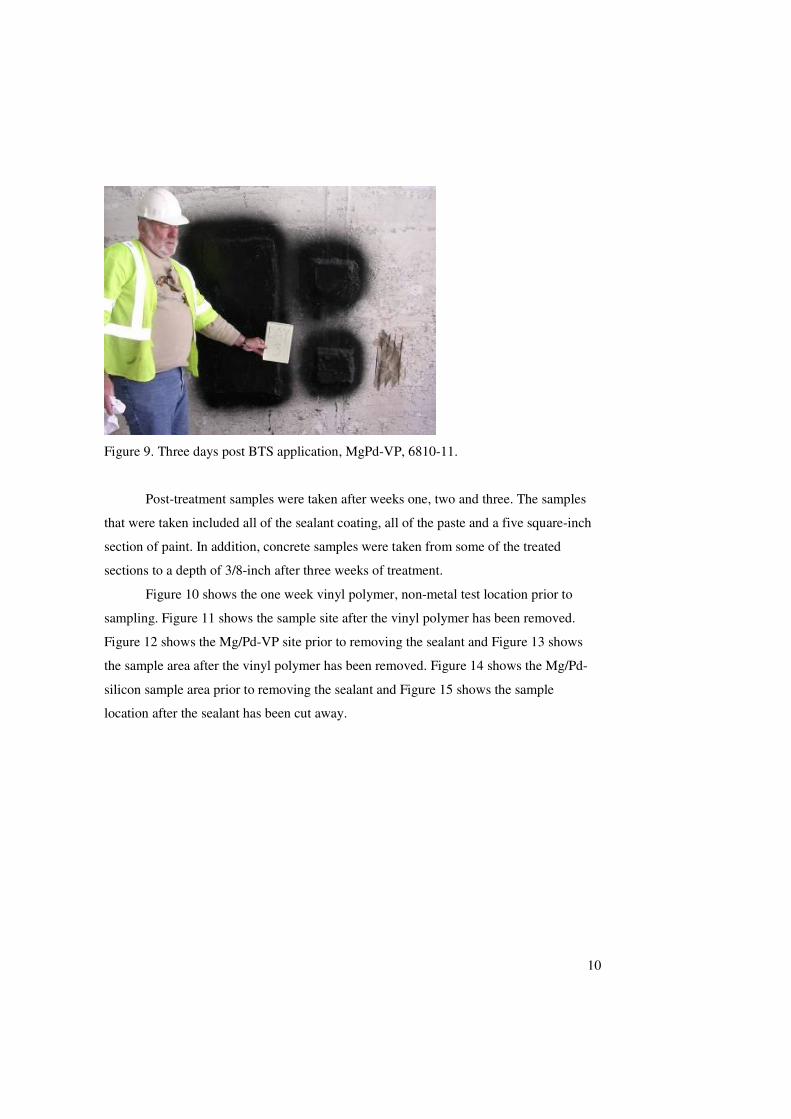
The status of the treated sections at the 6810-11 test site can be assessed from the
following three figures which show them three days after treatment. Figure 7 shows the
NM-VP site, Figure 8 shows the Mg/Pd-silicon site and Figure 9 shows the Mg/Pd-VP
site. As the figures show, all of the sealants are intact with no cracks.
Figure 7. Three days post BTS application, NM-VP in 6810-11.
Figure 8. Three days post BTS application, MgPd-silicon in 6810-11.
10
Figure 9. Three days post BTS application, MgPd-VP, 6810-11.
Post-treatment samples were taken after weeks one, two and three. The samples
that were taken included all of the sealant coating, all of the paste and a five square-inch
section of paint. In addition, concrete samples were taken from some of the treated
sections to a depth of 3/8-inch after three weeks of treatment.
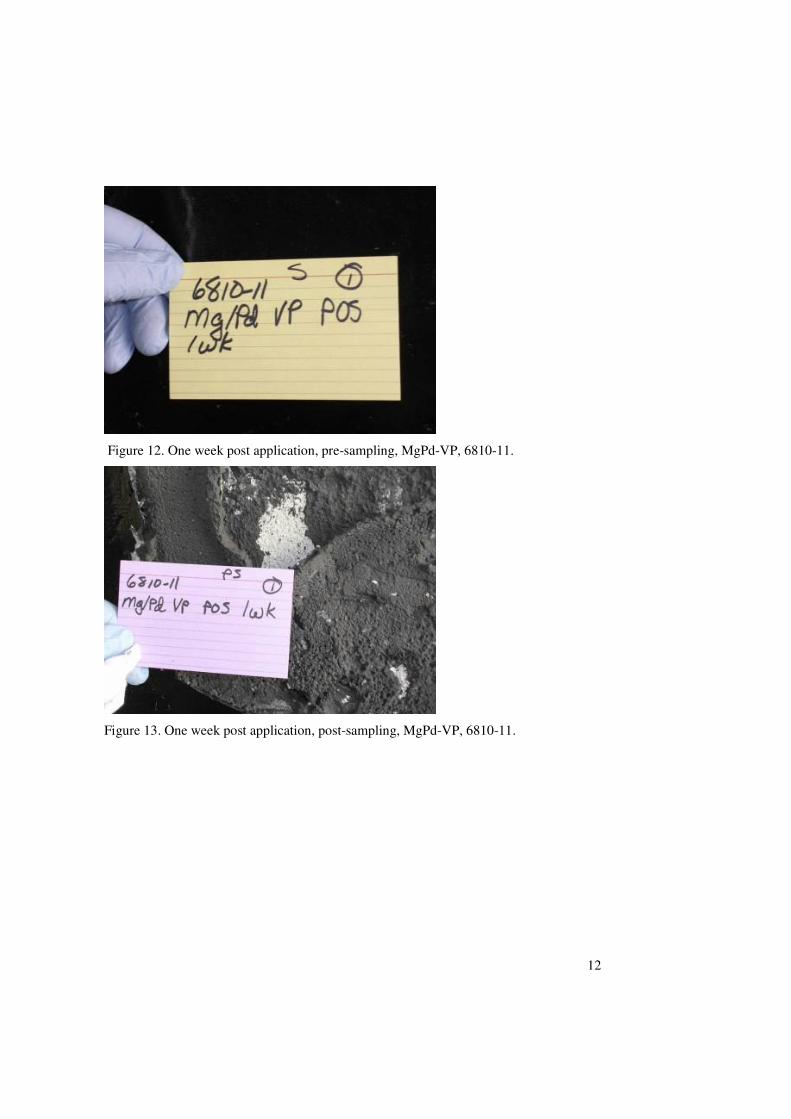
Figure 10 shows the one week vinyl polymer, non-metal test location prior to
sampling. Figure 11 shows the sample site after the vinyl polymer has been removed.
Figure 12 shows the Mg/Pd-VP site prior to removing the sealant and Figure 13 shows
the sample area after the vinyl polymer has been removed. Figure 14 shows the Mg/Pd-
silicon sample area prior to removing the sealant and Figure 15 shows the sample
location after the sealant has been cut away.

11
Figure 10. One week, post application, before samples were taken, NM-VP 6810-11.
Figure 11. One week, post application, after samples were taken, NM-VP 6810-11.
12
Figure 12. One week post application, pre-sampling, MgPd-VP, 6810-11.
Figure 13. One week post application, post-sampling, MgPd-VP, 6810-11.

13
Figure 14. One week post application, pre-sampling, MgPd-silicon, 6810-11.
Figure 15. One week post application, post-sampling, MgPd-silicon, 6810-11.
Figure 16 shows the 6810-11 MgPd-VP treatment two weeks after treatment. It
can be seen that part of the vinyl polymer sealant had failed. Thus it was decided to take
the two week sample from the three-square foot section and the three-week sample from
a one-square foot section (originally identified for sampling at two weeks).

14
Figure 16. MgPd-VP, two weeks after application, 6810-11.
Figure 17 shows the MgPd silicon site prior to taking week two samples. It can be
seen that the sealant has not failed. Figure 18 shows the MgPd-silicon site after the two
week sample was taken.
Figure 17. MgPd-silicon prior to two week sampling event, 6810-11.

15
Figure 18. MgPd-silicon after two week sampling event, 6810-11.
Figure 19 shows the status of the 6810-11 Mg/Pd-VP treatment site prior to
sampling after three weeks of treatment. It can be seen that the condition of the sealant
did not change very much between weeks two and three. The three week sample for this
treatment location was taken from the one-square foot area that was still intact. Figure 20
shows the NM-VP treatment location, prior to taking the three week sample. It can be
seen that a portion of the vinyl polymer broke loose between week two and week three
sampling. Figure 21 shows the Mg/Pd-silicon treatment area. It can be seen that the three-
square foot section is still intact. Figure 22 shows the Mg/Pd-silicon site after sampling.
Figure 23 shows a sample of concrete being taken from the Mg/Pd-silicon site after three
weeks of treatment. Table 1 gives the PCB concentrations in the paint located at the
different treatment sites in the 6810-11 building at times of pre-treatment, and after one,
two and three weeks of treatment. The foot-note at the bottom of the table explains the
legends that are used in the table.

16
Figure 19. MgPd-VP prior to three week sampling event, 6810-11.
Figure 20. NM-VP prior to three week sampling at 6819-11.

17
Figure 21. MgPd-silicon prior to three week sampling at 6810-11.
Figure 22. MgPd-silicon after three week sampling event, 6810-11.

18
Figure 23. Sampling concrete at 6810-11 at NM-VP location.

19
Table 1. Concentration of PCBs in paints sampled at locations in building 6810-11.
6810-11 Paint
Sample ID Location
Treatment Time
(weeks)
PRE-TR Conc.
(mg/kg) PRE-TR AVG
STD DEVPost-Conc.
(mg/kg)POST-TR AVG
STD DEV
NM VP 1 ft 1 1824 1888 99 96NM VP 1 ft 1 1951 92
NM VP 1 ft 2 3884 3262 352 167 80NM VP 1 ft 2 2639 298
NM VP 3 ft. A 3 2224 2138 201NM VP 3 ft. A 3 2411NM VP 3 ft. B 3 1782 270 169 56NM VP 3 ft. B 3 223NM VP 3 ft. B 3 208NM VP 3 ft. C 3 2053 127NM VP 3 ft. C 3 2110 110NM VP 3 ft. C 3 125NM VP 3 ft. C 3 92NM VP 3 ft. D 3 2291 186NM VP 3 ft. D 3 2093 175NM VP 3 ft. D 3 174
MgPd sil 1 ft 1 2153 2111 93 99 6 MgPd sil 1 ft 1 2069 104
101 MgPd sil 1ft 2 1498 1420 95 220 75 MgPd sil 1ft 2 1343 99
MgPd sil 3 ft. A 3 1830 2074 329 286 238 86MgPd sil 3 ft. A 3 2774 274MgPd sil 3 ft. A 3 270MgPd sil 3 ft. B 3 2178 223MgPd sil 3 ft. B 3 2221 204MgPd sil 3 ft. B 3 222MgPd sil 3 ft. C 3 1799 137MgPd sil 3 ft. C 3 2086 152MgPd sil 3 ft. C 3 137MgPd sil 3 ft. C 3 122MgPd sil 3 ft. D 3 1820 366MgPd sil 3 ft. D 3 1887 361MgPd sil 3 ft. D 3 340
MgPd VP 1ft 1 3049 2793 175 185 13 MgPd VP 1ft 1 2536 194
MgPd VP 3 ft. A 2 2545 229 198 218 58MgPd VP 3 ft. A 2 188MgPd VP 3 ft. A 2 197MgPd VP 3 ft. B 2 2481MgPd VP 3 ft. B 2 2620MgPd VP 3 ft. C 2 2652 285MgPd VP 3 ft. C 2 2903 322MgPd VP 3 ft. C 2 267MgPd VP 3 ft. D 2 2302 152MgPd VP 3 ft. D 2 2314 176MgPd VP 3 ft. D 2 177
MgPd VP 1 ft 3 2165 2862 258 251 9 MgPd VP 1ft 3 3559 241 MgPd VP 1ft 3 253

20
Explanation of columns in table: time, sample ID (see key below), and concentration are self-expanatory; AVG.:two to five samples were taken from the same sample container, extracted separately and analyzed, these numbers are averaged; STD DEV: standard deviation of data set.
Sample Identification Key: NM= no metal paste; Mg/Pd= paste with magnesium/palladium bimetal; VP=vinyl polymer sealant; SIL= silcone sealant; upper case letter (A, B, C, D) indicates that multiple areas (collected into separate containers) were sampled within the sample treatment area.
The PCB concentrations in the paint for each of the test locations as a function of
time is shown in Figure 24. As can be seen from the data, the major drop in PCB
concentration is after one week. After one week, the concentration does not change
significantly. The paint on the wall at each sample site was so heterogeneous that small
differences in PCB concentrations at each test site between weeks 1, 2, and 3 samples are
not statistically meaningful.
6810-11 wks 0-3Paint
0500
10001500200025003000
0 1 2 3 4Weeks Exposure
PC
B
Con
cent
ratio
n (m
g/kg
)
NM-VP 6810-11MgPd-sil 6810-11MgPd-VP 6810-11
Figure 24. Concentrations of PCBs in paint at 6810-11 during treatment times of 0-3
weeks.
Samples of BTS paste were collected from each test location at the same time
after treatment that paint samples were collected. These samples were analyzed for PCB
concentrations by the procedure that is described in the workplan. The data from these
analyses is given in Table 2. The data is plotted in Figure 25.

21
Table 2. Concentration of PCBs in paste from various locations and treatment periods in
6810-11.
6810-11 Paste
Sample IDTreatmen
t Time (weeks)
Post-Conc.
(mg/kg)POST-TR AVG
STD DEV
NM VP 1 32 32 1NM VP 1 33NM VP 1 32
NM VP 2 42 56 13NM VP 2 66NM VP 2 60
NM VP 3 187 162 60NM VP 3 205NM VP 3 93
MgPd Sil 1 18 13 7
MgPd Sil 1 5
MgPd Sil 1 17
MgPd Sil 2 23 23 2MgPd Sil 2 25MgPd Sil 2 21
MgPd Sil 3 66 61 7MgPd Sil 3 64MgPd Sil 3 54
MgPd VP 1 25 23 2MgPd VP 1 21MgPd VP 1 22
MgPd VP 2 19 36 11MgPd VP 2 41MgPd VP 2 35MgPd VP 2 34MgPd VP 2 37MgPd VP 2 51
MgPd VP 3 62 63 19 MgPd VP 3 82 MgPd VP 3 45

22
6810-11 Paste Concentration (mg/kg)
0
50
100
150
200
0 1 2 3 4
Weeks Exposure
PC
B C
once
ntra
tion
NM VP MgPd-silMgPd-VP
Figure 25. PCB concentration in paste from building 6810-11 for weeks one through
three.
As can be seen from the data, the PCB concentration in the BTS that contained
active Mg/Pd was much lower than the paste that contained no metal. This is as expected
because the active Mg/Pd particles are continuously degrading the PCBs as they enter the
paste. The concentrations of the PCBs in the paste are those that were present in the paste
soon after the samples were collected and returned to UCF for analysis. A later section in
this report will address the issue of how PCB degradation continued with time in the BTS
paste containing Mg/Pd and how the PCBs were degraded in the non-metal BTS after
Mg/Pd was added to the paste in the laboratory.
One of the many questions that needed to be addressed in this field study was
whether the BTS paste would transport any PCBs into the concrete. To answer this
question, samples of concrete were taken prior to treatment and after three weeks of
treatment. The samples were taken to a depth of 3/8 inches into the concrete at several
locations in the 6810-11 test area. Table 3 gives the data for the PCB levels in the
concrete prior to treatment and then after three weeks of exposure to BTS paste. As can
be seen from the data, BTS paste does not transport PCBs from the paint into the concrete
but rather transports PCBs from the concrete. This property of BTS paste has also been
observed and confirmed in laboratory studies.
All of the sealant, both the vinyl polymer and the silicon polymer from the 6810-
11 test site was removed and returned to UCF for analysis. Analysis of the sealant
samples confirmed that there were no PCBs found at detectable levels.

23
Table 3. Concentration of PCBs in concrete in building 6810-11 after BTS treatment.
6810-11 Paste
Sample IDTreatment
Time (weeks)
PRE-TR Conc.
(mg/kg) PRE-TR AVG
STD DEVPost-Conc.
(mg/kg)POST-TR AVG
STD DEV
NM VP 3ft concrete A 3 43 48 6 40 42 2NM VP 3ft concrete A 3 55 41NM VP 3ft concrete A 3 45 44NM VP 3ft concrete D 3 38 35 4 22 24 3NM VP 3ft concrete D 3 36 28NM VP 3ft concrete D 3 30 25NM VP 3ft concrete D 3 22
MgPd sil 3ft concrete 3 28 30 6 13 13 1MgPd sil 3ft concrete 3 36 13MgPd sil 3ft concrete 3 25 14
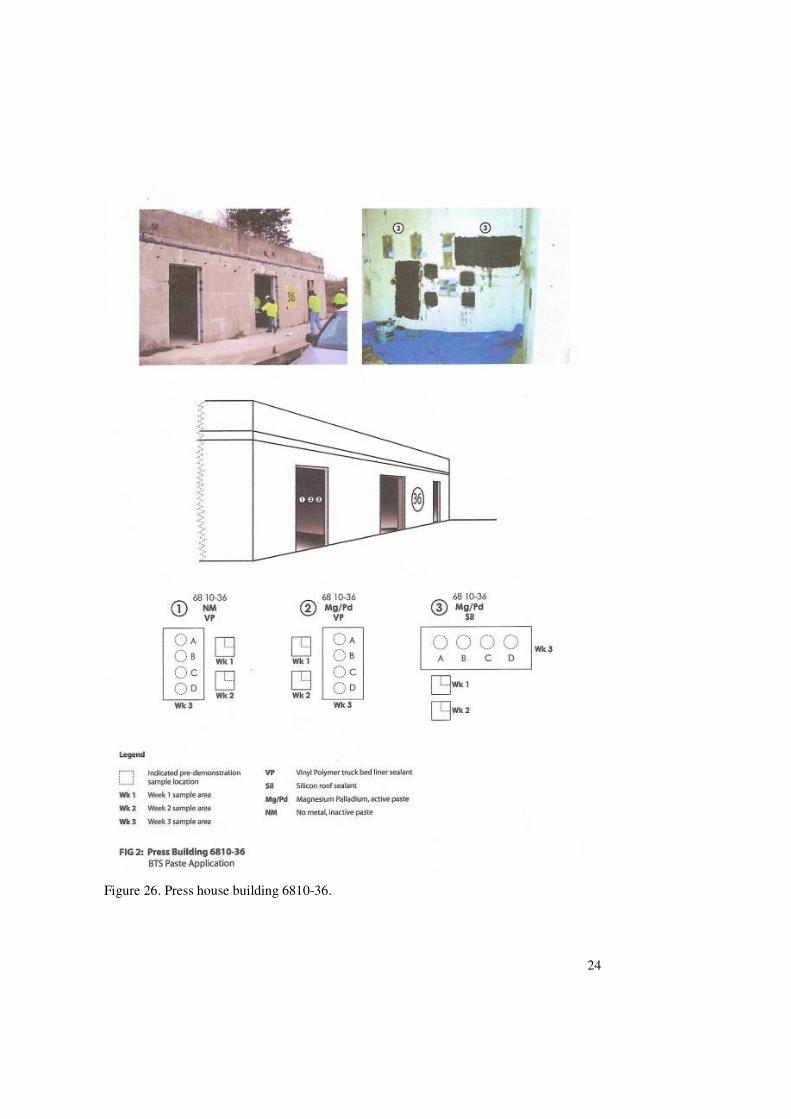
Treatment of the Press House 6810-36
As discussed in the application of BTS paste to the test sections in press house
6810-11, the same procedure was followed in press house 6810-36. However, there was
one major difference in the integrity of the paint on the surface of the concrete walls in
6810-36 as compared to 6810-11. The paint in 6810-36 was much more powdery and
flaky than the paint in 6810-11. This presented problems in getting the BTS paste and
sealant to adhere to the wall. This problem will be addressed in the following discussion
of the treatment tests that were conducted in 6810-36.
A set of treatment sections similar to what was done in 6810-11 was repeated in
6810-36 and this is shown in Figure 26.
24
Figure 26. Press house building 6810-36.
25
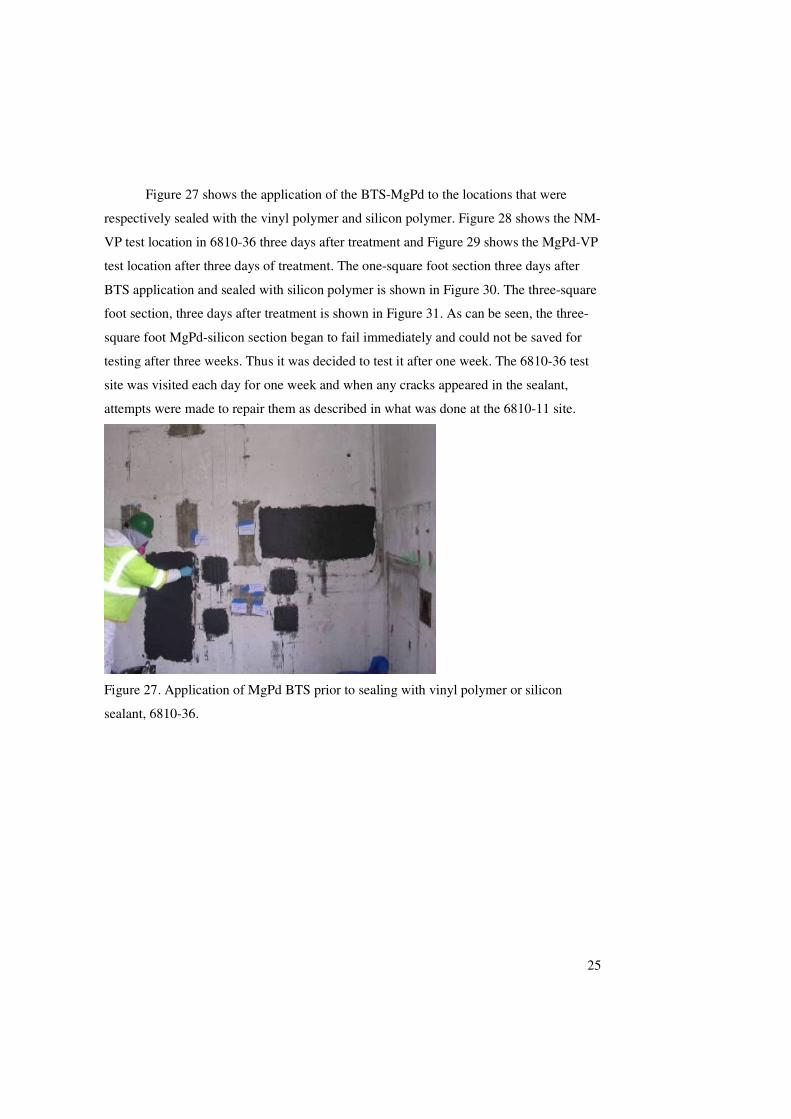
Figure 27 shows the application of the BTS-MgPd to the locations that were
respectively sealed with the vinyl polymer and silicon polymer. Figure 28 shows the NM-
VP test location in 6810-36 three days after treatment and Figure 29 shows the MgPd-VP
test location after three days of treatment. The one-square foot section three days after
BTS application and sealed with silicon polymer is shown in Figure 30. The three-square
foot section, three days after treatment is shown in Figure 31. As can be seen, the three-
square foot MgPd-silicon section began to fail immediately and could not be saved for
testing after three weeks. Thus it was decided to test it after one week. The 6810-36 test
site was visited each day for one week and when any cracks appeared in the sealant,
attempts were made to repair them as described in what was done at the 6810-11 site.
Figure 27. Application of MgPd BTS prior to sealing with vinyl polymer or silicon
sealant, 6810-36.

26
Figure 28. NM-VP test location after three days of treatment, 6810-36.
Figure 29. MgPd-VP test location after three days of treatment, 6810-36.
27
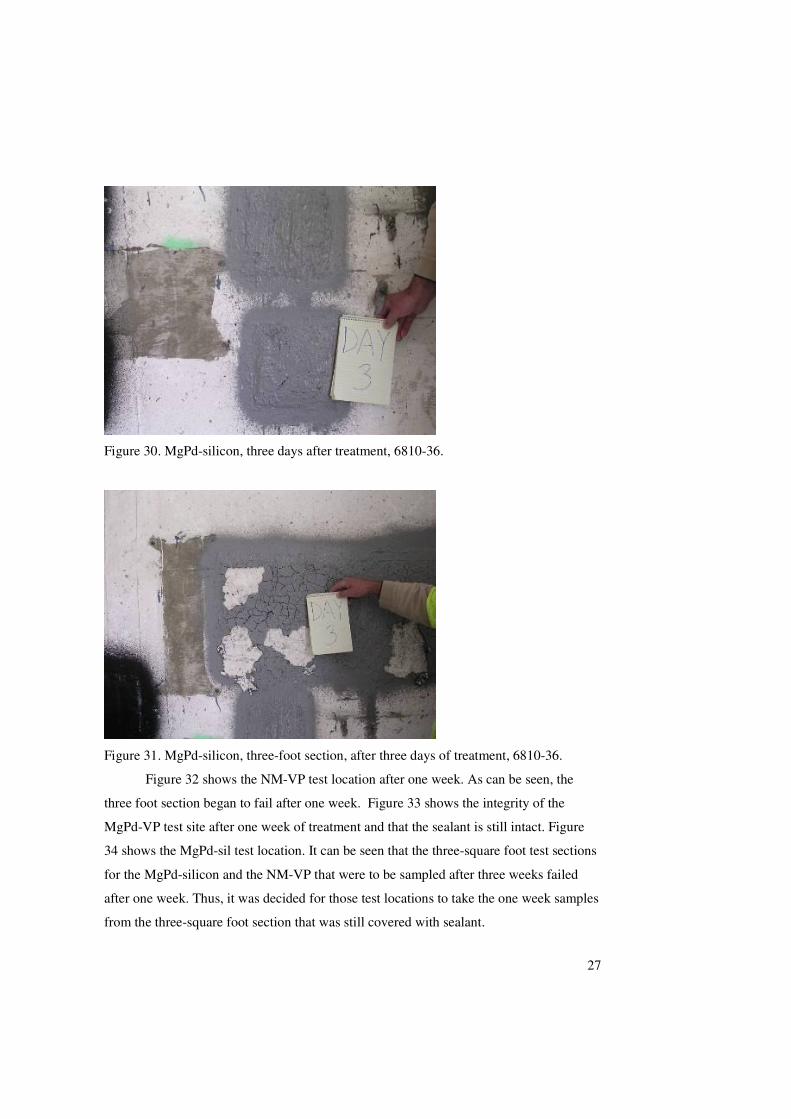
Figure 30. MgPd-silicon, three days after treatment, 6810-36.
Figure 31. MgPd-silicon, three-foot section, after three days of treatment, 6810-36.
Figure 32 shows the NM-VP test location after one week. As can be seen, the
three foot section began to fail after one week. Figure 33 shows the integrity of the
MgPd-VP test site after one week of treatment and that the sealant is still intact. Figure
34 shows the MgPd-sil test location. It can be seen that the three-square foot test sections
for the MgPd-silicon and the NM-VP that were to be sampled after three weeks failed
after one week. Thus, it was decided for those test locations to take the one week samples
from the three-square foot section that was still covered with sealant.

28
Figure 32. NM-VP after one week of treatment, 6810-36.
Figure 33. MgPd-VP after one week of treatment, 6810-36.

29
Figure 34. MgPd-silicon after one week of treatment, 6810-36.
The following Figures show the status of the treatment sites in building 6810-36
after the two week samples were taken. Figure 35 is for the MgPd-silicon, Figure 36 is
for the MgPd-VP and Figure 37 is for the NM-VP sites.
Figure 35. MgPd-silicon after two weeks sampling event at 6810-36.

30
Figure 36. MgPd-VP after two week sampling event at 6810-36.
Figure 37. NM-VP after two week sampling event at 6810-36.
Figure 38 shows the one-square foot test section with MgPd-sil in building 6810-
36 that was sampled after three weeks. Figure 39 shows the MgPd-VP section that was
sampled after three weeks and Figure 40 shows the NM-VP section prior to taking the
three week sample.

31
Figure 38. MgPd-silicon after three weeks, 6810-36.
Figure 39. MgPd-VP after three weeks, 6810-36.

32
Figure 40. NM-VP after three weeks, 6810-36.
The data for all of the paint samples for the 6810-36 site are given in Table 4.
Paste sample data is shown in Table 5 and concrete sample data is shown in Table 6. The
data for paint samples are plotted in Figures 41 and the data for paste samples are plotted
in Figure 42. The data for the 6810-36 test site show significant reduction in the PCB
levels from the paint as was also observed for the 6810-11 site. In addition, the concrete
samples document that the BTS paste does not transport PCBs into the concrete but rather
actually transports PCBs out of the concrete. As with the sealant from the 6810-11 site,
sealant samples from the 6810-36 site had PCB levels that were below detection limits.
����������� �Maybe we should say PCB levels were undetectable?

33
Table 4. PCB concentrations in paint from building 6810-36.
PAINT Sample IDTreatment
Time (weeks)
PRE-TR Conc.
(mg/kg)
PRE-TR AVG
STD DEV
Post-Conc.
(mg/kg)
POST-TR AVG
STD DEV
NM VP 3 ft A 1 391 566 190NM VP 3 ft A 1 414NM VP 3 ft D 1 745 94 98 4NM VP 3 ft D 1 714 102NM VP 3 ft D 1 98NM VP 1 ft 2 900 911 15 43 45 3NM VP 1 ft 2 921 47NM VP 1 ft 2 46NM VP 1 ft 3 780 815 49 115 110 7NM VP 1 ft 3 850 105
MgPd sil 3 ft A 1 855 789 108MgPd sil 3 ft A 1 854 82 82 21MgPd sil 3 ft B 1 908 112MgPd sil 3 ft B 1 817MgPd sil 3 ft C 1 590 66MgPd sil 3 ft C 1 684 69MgPd sil 3 ft D 1 741MgPd sil 3 ft D 1 861MgPd sil 1 ft 2 810 812 38 75 83 8MgPd sil 1 ft 2 850 86MgPd sil 1 ft 2 775 89MgPd sil 1 ft 3 840 815 35 132 141MgPd sil 1 ft 3 790 149
MgPd VP 1 ft 1 620 595 35 40 40 0MgPd VP 1 ft 1 570 40MgPd VP 1 ft 2 580 547 35 32 37 5MgPd VP 1 ft 2 510 39MgPd VP 1 ft 2 550 41
MgPd VP 3 ft A 3 542 525 24 56 55 1MgPd VP 3 ft A 3 508 55MgPd VP 3 ft A 3 55MgPd VP 3 ft B 3 26 27 2MgPd VP 3 ft B 3 29MgPd VP 3 ft B 3 26MgPd VP 3 ft C 3 402 394 11 50 48 5MgPd VP 3 ft C 3 387 52MgPd VP 3 ft C 3 43MgPd VP 3 ft D 3 724 706 25 25 26 3MgPd VP 3 ft D 3 689 28

34
6810-36 Weeks 0-3 Paint
0100200300400500600700800900
1000
0 0.5 1 1.5 2 2.5 3 3.5
Weeks Exposure
PC
B C
once
ntra
tion
(mg/
kg)
MgPd-VP 6810-36
MgPd-sil 6810-36
NM-VP 6810-36
Figure 41. PCB concentrations in paint samples from 6810-36.
Table 5. Concentrations of PCB in paste samples from building 6810-36.
PASTESample ID
Tretment Time
(weeks)
Post-Conc.
(mg/kg)POST-TR AVG
STD DEV
NM VP 3 ft 1 59 56 4NM VP 3 ft 1 53NM VP 1ft 2 114 95 18NM VP 1ft 2 78NM VP 1ft 2 92NM VP 1 ft 3 147 152 8NM VP 1 ft 3 158
MgPd Sil 3ft 1 44 43 13MgPd Sil 3ft 1 56MgPd Sil 3ft 1 29MgPd Sil 1ft 2 28 25 12MgPd Sil 1ft 2 36MgPd Sil 1ft 2 12MgPd sil 1ft 3 57 50 11MgPd sil 1ft 3 37MgPd sil 1ft 3 56
MgPd VP 1ft 1 39 40 6MgPd VP 1ft 1 35MgPd VP 1ft 1 47MgPd VP 1ft 2 20 39 17MgPd VP 1ft 2 46MgPd VP 1ft 2 52MgPd VP 3ft 3 52 34 17MgPd VP 3ft 3 18MgPd VP 3ft 3 33
35
6810-36 Paste PCB Concentrations
0
20
40
60
80
100
120
140
160
0 0.5 1 1.5 2 2.5 3 3.5
Weeks Exposure
PC
B C
on
cen
trat
ion
(mg
/kg
)
NM-VP
MgPd-sil
MgPd-VP
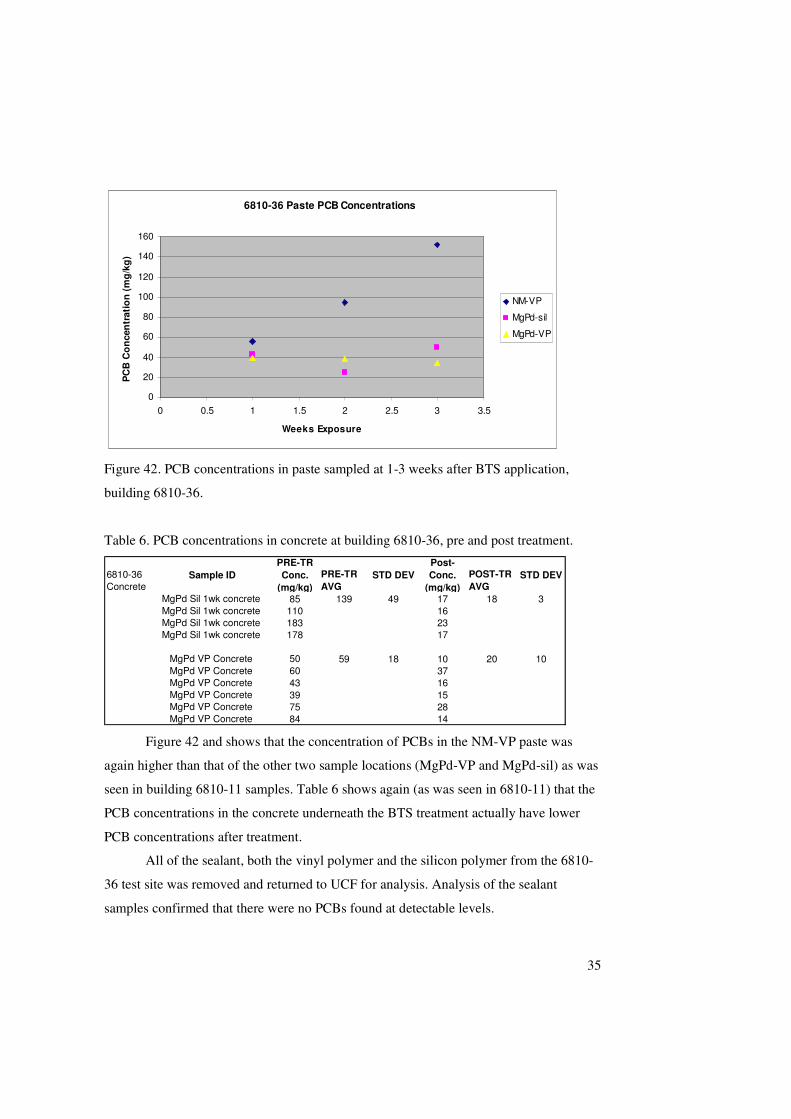
Figure 42. PCB concentrations in paste sampled at 1-3 weeks after BTS application,
building 6810-36.
Table 6. PCB concentrations in concrete at building 6810-36, pre and post treatment.
6810-36 Concrete
Sample IDPRE-TR Conc.
(mg/kg) PRE-TR AVG
STD DEVPost-Conc.
(mg/kg)POST-TR AVG
STD DEV
MgPd Sil 1wk concrete 85 139 49 17 18 3MgPd Sil 1wk concrete 110 16MgPd Sil 1wk concrete 183 23MgPd Sil 1wk concrete 178 17
MgPd VP Concrete 50 59 18 10 20 10MgPd VP Concrete 60 37MgPd VP Concrete 43 16MgPd VP Concrete 39 15MgPd VP Concrete 75 28MgPd VP Concrete 84 14
Figure 42 and shows that the concentration of PCBs in the NM-VP paste was
again higher than that of the other two sample locations (MgPd-VP and MgPd-sil) as was
seen in building 6810-11 samples. Table 6 shows again (as was seen in 6810-11) that the
PCB concentrations in the concrete underneath the BTS treatment actually have lower
PCB concentrations after treatment.
All of the sealant, both the vinyl polymer and the silicon polymer from the 6810-
36 test site was removed and returned to UCF for analysis. Analysis of the sealant
samples confirmed that there were no PCBs found at detectable levels.

36
Building 6657-02: Nitrating House
After treating the concrete press houses, the nitrating house, 6657-02 was treated.
Figure 43 shows the location of the treatment zones. There were two nitrating tanks
located in this building, one large tank and one smaller tank. The large tank was treated
with MgPd and the nonmetal pastes, both of these test sections were coated with vinyl
polymer sealant. The small tank was treated with MgPd paste and then sealed with the
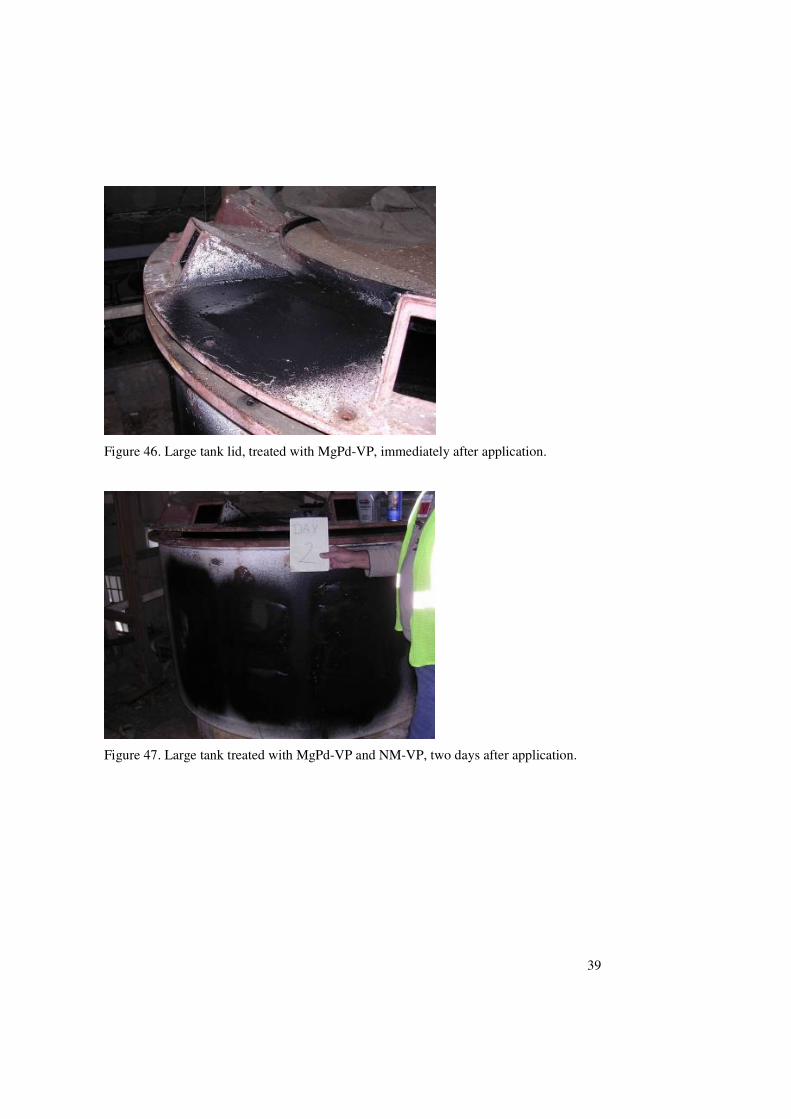
silicon polymer. Figures 44, 45, and 46 show the large tank after it was treated and sealed
with the silicon polymer. Figures 47 and 48 show the large tank two days after treatment.
As can be seen from the figures, the sealant and BTS is still intact and has not failed.

37
Figure 43. Nitrating House 6657-02.

38
Figure 44. Large tank treated with MgPd-VP and NM-VP immediately after application.
Figure 45. Large tank treated with MgPd-VP and NM-VP immediately after application.
39
Figure 46. Large tank lid, treated with MgPd-VP, immediately after application.
Figure 47. Large tank treated with MgPd-VP and NM-VP, two days after application.

40
Figure 48. Large tank lid treated with MgPd-VP, two days after application.
Figure 49 shows the large tank after one week. As can be seen, the treated
sections are still intact. Figure 50 shows the one week NM-VP sample being taken and
Figure 51 shows the one week MgPd-VP sample being taken. Figure 52 shows that the
three-square foot section on the small tank that was treated with the silicon polymer
failed after one week. This section was to be sampled after three weeks of treatment,
however, it was decided to take the one week sample from it and then take the two and
three week samples from the one-square foot sections that were still intact.
Figure 49. Large tank treated with MgPd-VP and NM-VP one week after application.

41
Figure 50. Sample being taken from large tank treated with NM-VP one week after
application.
Figure 51. Sample being taken from large tank treated with MgPd-VP one week after
application.

42
Figure 52. Small tank, three-square foot section treated with MgPd-silicon
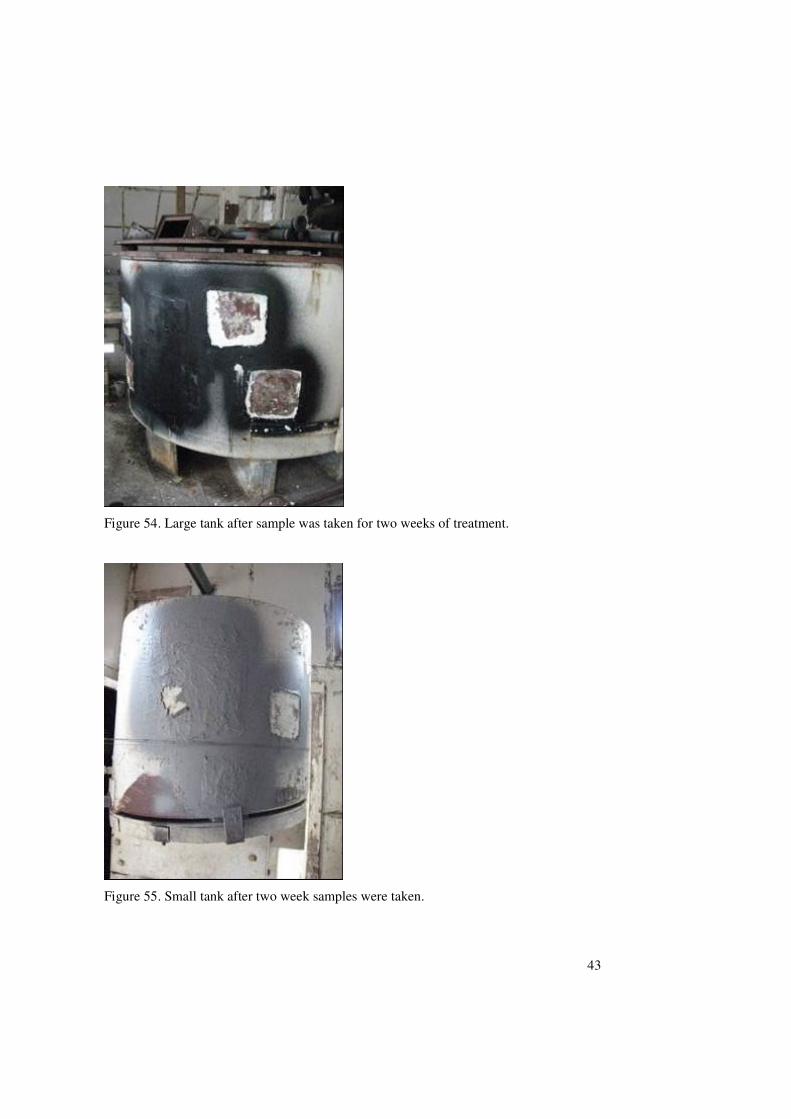
Figure 53 shows the status of the large tank after two weeks. Figure 54 shows the
status of the large tank after week two samples were taken. Figure 55 shows the status of
the small tank after week two samples were taken.
Figure 53. Large tank after two weeks of BTS treatment.
43
Figure 54. Large tank after sample was taken for two weeks of treatment.
Figure 55. Small tank after two week samples were taken.

44
Figure 56 shows that the 6657-02-NM-VP treated section is still intact after three
weeks. Figure 57 shows the three week sample being taken. Figure 58 shows that the
MgPd-VP three week treatment section was also intact.
Figure 56. Large tank, NM-VP, still intact three weeks after application.
Figure 57. Sampling of large tank NM-VP, three weeks after application.

45
Figure 58. MgPd-VP, large tank, three weeks after application.
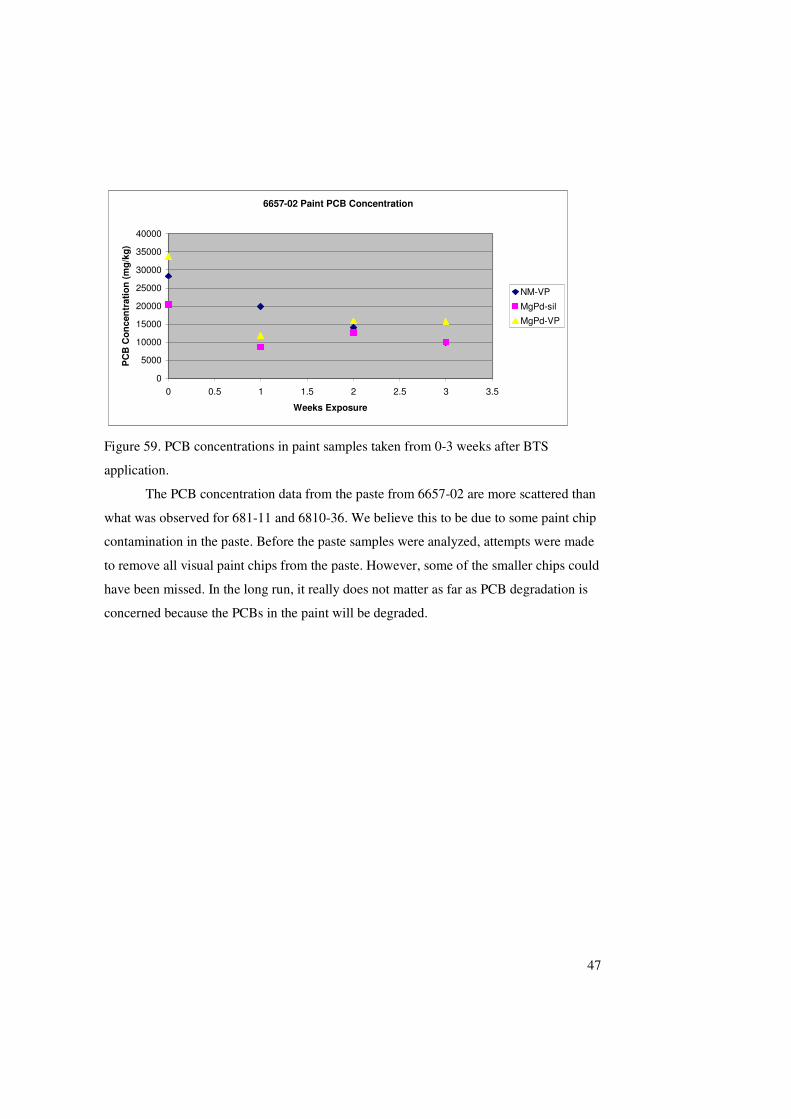
Table 7 gives the PCB concentration prior to treatment and after weeks one, two
and three of treatment. The data are also plotted in Figure 59. As can be seen from the
data, the PCB concentrations in the paint are higher than at any other location. In fact,
these are the highest PCB concentrations that we have every tested the BTS treatment on.
These high levels are probably due to the fact that the tanks were coated with several
layers of paint. Even though the BTS treatment was able to remove more than 50% of the
PCBs, high concentration were still left in the paint. Laboratory studies have shown that
where PCBs are located in multiple layers of paint, the transport of the PCBs into the
paste is much slower. Such coatings require multiple applications of BTS in order to
reach levels lower than 50 mg/kg. Paste sample data from 6657-02 is shown in Table 8
with a graphical representation shown in Figure 60.

46
Table 7. PCB concentrations in paint sampled from building 6657-02.
Paint 6657-02
Sample IDTreatment Time
PRE-TR Conc.
(mg/kg)
PRE-TR AVG
STD DEV
Post-Conc.
(mg/kg)
POST-TR AVG
STD DEV
NM VP 1ft 1 45739 42660 2690 20676 19824 1205NM VP 1ft 1 41480 18972NM VP 1ft 1 40762
NM VP 1ft 2 34607 33263 1901 14238 14016 415NM VP 1ft 2 31918 13538NM VP 1ft 2 14273
NM VP A 3ft 3 34127 33879 1951 8326 6576 1698NM VP A 3ft 3 35695 5827NM VP A 3ft 3 31816 7284NM VP A 3ft 3 7447NM VP A 3ft 3 3998NM VP B 3ft 3 36523 28051 11981 10632 11503 1232NM VP B 3ft 3 19579 12375NM VP C 3ft 3 40980 36055 4471 16522 16907 545NM VP C 3ft 3 32251 17293NM VP C 3ft 3 34934
MgPd VP 1ft 1 33863 36173 2080 15118 11788 4709MgPd VP 1ft 1 37898 8458MgPd VP 1ft 1 36759
MgPd VP 1ft 2 27671 40306 13497 13066 15825 2875MgPd VP 1ft 2 52941 15605MgPd VP 1ft 2 48526 18804
MgPd VP A 3ft 3 33234 35303 2926 22705 21536 2121MgPd VP A 3ft 3 37372 19088MgPd VP A 3ft 3 22814MgPd VP B 3ft 3 33107 35532 3430 14433 14847 919MgPd VP B 3ft 3 37957 15900MgPd VP B 3ft 3MgPd VP C 3ft 3 24989 27548 3619 14209MgPd VP C 3ft 3 30107
MgPd LID VP 3 24111 27154 4304 8522 10605 2947MgPd LID VP 3 30197 12689
SMALL TANKMgPd sil A 3ft 1 21130 20403 1028 8666 8687 434MgPd sil A 3ft 1 19676MgPd sil B 3ft 1 20097 19893 288 9131MgPd sil B 3ft 1 19689MgPd sil C 3ft 1 21242 8263MgPd sil C 3ft 1 18698 19970 1798
MgPd sil 1ft 2 24602 28970 6176 11288 12585 1835MgPd sil 1ft 2 33337 13882MgPd sil 1ft 3 15728 15319 1201 9441 10053 4422MgPd sil 1ft 3 13967 5970MgPd sil 1ft 3 16263 14749
47
6657-02 Paint PCB Concentration
0
5000
10000
15000
20000
25000
30000
35000
40000
0 0.5 1 1.5 2 2.5 3 3.5
Weeks Exposure
PC
B C
once
ntra
tion
(mg/
kg)
NM-VP
MgPd-sil
MgPd-VP
Figure 59. PCB concentrations in paint samples taken from 0-3 weeks after BTS
application.
The PCB concentration data from the paste from 6657-02 are more scattered than
what was observed for 681-11 and 6810-36. We believe this to be due to some paint chip
contamination in the paste. Before the paste samples were analyzed, attempts were made
to remove all visual paint chips from the paste. However, some of the smaller chips could
have been missed. In the long run, it really does not matter as far as PCB degradation is
concerned because the PCBs in the paint will be degraded.

48
Table 8. PCB concentrations in paste collected from building 6657-02.
6657-02Sample ID
Treatment Time
(weeks)
Post-Conc.
(mg/kg)POST-TR AVG
STD DEV
PASTE
NM VP large tank 1ft 1 284 298 61NM VP large tank 1ft 1 245NM VP large tank 1ft 1 364
NM VP large tank 1ft 2 1622 1554 206NM VP large tank 1ft 2 1303NM VP large tank 1ft 2 1793NM VP large tank 1ft 2 1499NM VP large tank 3ft 3 2054 1781 386NM VP large tank 3ft 3 1508
MgPd VP large tank 1ft 1 526MgPd VP large tank 1ft 1 853 688 164MgPd VP large tank 1ft 1 684MgPd VP large tank 1ft 2 4587MgPd VP large tank 1ft 2 4213 4490 243MgPd VP large tank 1ft 2 4669MgPd VP large tank 3 ft 3 642 716 104MgPd VP large tank 3 ft 3 789
MgPd VP top-large tank 1ft 3 111MgPd VP top-large tank 1ft 3 178 141 34MgPd VP top-large tank 1ft 3 134
MgPd Sil small tank 3ft 1 218MgPd Sil small tank 3ft 1 84 179 83MgPd Sil small tank 3ft 1 235MgPd Sil small tank 1ft 2 390MgPd Sil small tank 1ft 2 475 464 69MgPd Sil small tank 1ft 2 526MgPd Sil small tank 1ft 3MgPd Sil small tank 1ft 3MgPd Sil small tank 1ft 3

49
6657-02 Paste PCB Concentration
0
500
1000
1500
2000
2500
0 0.5 1 1.5 2 2.5 3 3.5
Weeks Exposure
PC
B C
once
ntra
tion
(mg/
kg)
NM-VP
MgPd-silMgPd-VP
Figure 60. PCB concentration in pastes from building 6657-02 for weeks 1-3.
All of the sealant, both the vinyl polymer and the silicon polymer from the
building 6657-02 test site was removed and returned to UCF for analysis. Analysis of the
sealant samples confirmed that there were no PCBs found at detectable levels.
Staging Area
The last test location that was treated was the staging area where five presses were
treated. All of the presses were treated with the MgPd paste and sealed with the vinyl
polymer. Only two treatment zones were done for the presses, one to be sampled after
one week and the other to be sampled after three weeks. Figure 61 shows BTS paste
being applied to press 14 and Figure 62 shows the vinyl polymer sealant being applied to
press 14. Figure 63 shows the two treated areas on press 4. Figure 64 shows the two
treated areas on press 15. Figure 65 shows the treatment locations on press 36. All of the
treated areas were in good shape two days after treatment as can be seen from Figure 66,
showing the treatment zones on press 4, two days after treatment.

50
Samples of paint, paste and sealant were taken from the presses one week after
treatment. All of the treatment locations were in good shape with no cracking of sealant
or loss of BTS paste from the treatment areas. Figure 67 shows the treatment location on
press 4 after one week of treatment. Figure 68 shows the treatment area after the vinyl
polymer sealant had been removed. Figure 69 shows the treatment area on press 15 after
one week of treatment. Figure 70 shows the treatment area on press 15 three weeks after
treatment.
Figure 61. BTS paste being applied to press 14.

51
Figure 62. Vinyl polymer sealant being applied to press 15.
Figure 63. Two treated areas on press 4.
Figure 64. Two treated areas on press 15.

52
Figure 65. Treated areas on press 36.
Figure 66. Treatment areas on press 4 two days after BTS application.

53
Figure 67. Treatment areas on press 4 one week after BTS application, prior to sampling.
Figure 68. Press 4, one week after BTS application, vinyl polymer removed for sampling.

54
Figure 69. Press 15, one week after BTS application, prior to sampling.
Figure 70. Press 15, three weeks after BTS application, prior to sampling.
The PCB concentrations in the paint samples collected from the presses in the
staging area are given in Table 9. The data for these samples is plotted in Figures 71. As

55
can be seen from the data, the PCB concentrations in the paint are much lower than those
that were observed at other test locations. At all of the sample sites that were treated, the
PCB levels were reduced to very low levels. Table 10 lists the concentrations of PCB
found in the paste samples taken from all five presses treated in the staging area. That
data is plotted in Figure 72.

56
Table 9. PCB concentrations in paint taken from equipment in the staging area.
Staging Area Paint
Sample ID
Treatment
Time (weeks
)
PRE-TR Conc.
(mg/kg) PRE-TR AVG
STD DEV
Post-Conc.
(mg/kg) POST-TR AVG
STD DEV
MgPd VP press #4 85 93.0 10.8MgPd VP press #4 101MgPd VP press #4 1 17 13 3MgPd VP press #4 1 13MgPd VP press #4 1 10MgPd VP press #4 3 6 7 0.5MgPd VP press #4 3 7
MgPd VP press #12 156 160.3 5.9MgPd VP press #12 164MgPd VP press #12 1 3 3 0MgPd VP press #12 1 3MgPd VP press #12 1 3MgPd VP press #12 3 4 4 0.1MgPd VP press #12 3 3
MgPd VP press #14 8 8.7 0.9MgPd VP press #14 9MgPd VP press #14 1 3 2 1MgPd VP press #14 1 2MgPd VP press #14 1 2MgPd VP press #14 3 12 13 0.7MgPd VP press #14 3 13
MgPd VP press #15 8 5.9 3.7MgPd VP press #15 3MgPd VP press #15 1 1MgPd VP press #15 1 bdlMgPd VP press #15 3 bdlMgPd VP press #15 3 bdl
MgPd VP press #36 bdlMgPd VP press #36 bdl
MgPd VP press #36 1 bdlMgPd VP press #36 1 bdlMgPd VP press #36 3 bdlMgPd VP press #36 3 bdl

57
PCB Concentration Paint Staging Area Presses
0
20
40
60
80
100
120
140
160
180
0 0.5 1 1.5 2 2.5 3 3.5
Weeks Exposure
PC
B C
on
cent
rati
on
(mg
/kg
)
MgPd-VP #4
MgPd-VP #12
MgPd-VP #14
MgPd-VP #15
MgPd-VP #36
Figure 71. PCB concentrations in paint samples from various staging area equipment at 0,
1, and three weeks after BTS exposure.

58
Table 10. Concentrations of PCBs in paste samples taken from five presses at the staging
area.
Staging Area Paste
Sample IDTreatment
Time (weeks)
Post-Conc.
(mg/kg)POST-TR AVG
STD DEV
MgPd VP press #4 1 2.9 2.2 0.7MgPd VP press #4 1 2.3MgPd VP press #4 1 1.5MgPd VP press #4 3 1.6 1.1 0.1MgPd VP press #4 3 1.4
MgPd VP press #12 1 0.3 0.3 0.0MgPd VP press #12 1 0.3MgPd VP press #12 3 0.4 0.4 0.0MgPd VP press #12 3 0.4MgPd VP press #14 1 0.4 0.5 0.1MgPd VP press #14 1 0.6MgPd VP press #14 1 0.5MgPd VP press #14 3 0.3 0.2 0.0MgPd VP press #14 3 0.2MgPd VP press #15 1 0.2 0.2 0.0MgPd VP press #15 1 0.2MgPd VP press #15 3 0.1 0.1 0.0MgPd VP press #15 3 0.1MgPd VP press #15 3 0.1MgPd VP press #36 1 0.1 0.1 0.0MgPd VP press #36 1 0.1MgPd VP press #36 3 0.1 0.1 0.0MgPd VP press #36 3 0.1
PCB Concentration Paste Staging Area Presses
0
0.5
1
1.5
2
2.5
0.0 0.5 1.0 1.5 2.0 2.5 3.0 3.5
Weeks Exposure
PC
B C
once
ntra
tion
(mg/
kg)
MgPd-VP #4
MgPd-VP #12
MgPd-VP #14
MgPd-VP #15
MgPd-VP #36
Figure 72. PCB concentration in paste from staging area (all presses) for weeks 1 and 3.

59
All of the sealant, both the vinyl polymer and the silicon polymer from the staging
area test site was removed and returned to UCF for analysis. Analysis of the sealant
samples confirmed that there were no PCBs found at detectable levels.
60
Appendix A
WORKPLAN INCLUDING PROJECT AT BADGER MUNITIONS DEPOT
61
��������������������������������
APPLICATON OF A BIMETALLIC TREATMENT SYSTEM (BTS) FOR PCB REMOVAL FROM OLDER STRUCTURES ON DOD FACILITIES
A Proposal to GeoSyntec Consultants 6770 S. Washington Avenue, Suite 1
Titusville, Florida 32780
From Drs. Cherie L. Geiger and Christian A. Clausen, III
University of Central Florida Department of Chemistry
4000 Central Florida Blvd. Orlando Florida 32816-2366
April 20, 2006
62
TABLE OF CONTENTS Section Number Section Title Page 1.0 INTRODUCTION 3 1.1 Statement of Objectives 3 1.2 Study Approach and Statement of Work 4 1.2.1 Task 1: Site Visit and Collection of Samples 4 1.2.2 Task 2: Treatability Testing 4 1.2.3 Task 3: Manufacturing Catalyst System and BTS 5 1.2.4 Task 4: Application of BTS to DoD Test
Structures/Materials 5
1.2.5 Task 5 Laboratory Testing of Materials Both Pre- and Post-BTS Deployment
6

63
1.0 INTRODUCTION Many DoD facilities and equipment built prior to the mid-1970’s have metal surfaces upon which paints containing polychlorinated biphenyls (PCBs) were applied. These painted surfaces pose potential health hazards to worker and ecological risks. The materials are considered TSCA-level (Toxic Substance Control Act) waste as a result of the PCBs in the paint covering the surfaces. Some of the facilities and equipment could be refurbished and used for new programs, but because of the PCBs in the paint, the DoD may be unable to reuse or even discard these facilities and equipment without significant cost to mitigate potential worker or ecological exposure. Other PCB containing materials found on DoD facilities include caulking, insulation, and Galbestos, an asbestos material used in roofing and siding. On Navy ships for instance, PCBs have been found in high concentrations in ventilation gaskets, sound damping materials, insulation in electrical cables, bulkhead and piping, transformers and capacitors, hydraulic oils, rubber products, adhesives, aluminized paint, and fluorescent light ballast. A number of alternatives exist for reuse or disposal of PCB-containing facilities, materials or equipment but none destroy the PCBs in a manner that does not also destroy the facility or equipment. Current practice does not provide a viable option for removing and degrading PCBs while allowing for beneficial re-use of the facilities or equipment. The BTS technology uses a bimetallic catalyst incorporated into an environmentally friendly solvent that is capable of extracting PCBs from multiple, thick layers of weathered paint in a short (hours to days) time period, and providing a hydrogen source for the reductive dechlorination of the PCBs. The cleanup levels achieved are typically low enough to allow for re-use or disposal of facilities or equipment without further consideration of the PCB content in the material. BTS does not remove or destroy the painted structure upon which it is applied. New paint may be applied following treatment, or the existing paint may be left in place as no visual difference is normally observed. Once the BTS reagent has been allowed to react until complete PCB degradation has occurred, the reagent or solvent may be disposed of as a non-RCRA regulated waste. The use of the BTS technology can provide: 1) order-of-magnitude reductions in demolition and disposal cost for PCB impacted structures; 2) PCB degradation rather than transfer to another media; 3) removal of long-term environmental liability for PCB disposal; and 4) an option of reusing rather then destroying structures and equipment. 1.1. Statement of Objectives The overall objective of this project is to refine and deploy a safe, cost-effective, in situ treatment method for the removal and destruction of PCBs found on DoD structures. This overall project objective will be addressed by four specific objectives: 1) Determine the protocol for formulating BTS for site-specific conditions to enhance applicability to various PCB-containing materials found across numerous DoD facilities while maximizing safety and efficacy with the ultimate goal of reducing PCB concentrations to less than 50 mg/kg. 2) Demonstrate the effectiveness of BTS on a wide range of actual contaminated structures at three DoD facilities. Facilities that have committed to participate in this project include Cape Canaveral Air Force Station and Badger Army Ammunitions Plant, as well as the Navy’s Inactive Ships Program (specific Navy ship still to be determined). The relationships between dose applied, repeated applications and reaction kinetics will

64
be evaluated with the intention of specifically identifying the factors influencing treatment and limiting reaction rates for a specific media (e.g. caulking verses paint). Environmental condition effects (temperature and humidity; weathering) and impact of BTS on material appearance and adhesion will also be evaluated. 3) Review BTS application and handling process and develop appropriate on-site safety protocols for institutions to implement during its application, including the handling of any site-specific waste products generated by BTS. The BTS process itself produces non-toxic waste. 4) Develop full-scale cost and performance reports for DoD facility end-users to utilize when addressing PCBs found on existing structures. 1.2. Study Approach and Statement of Work The study approach will consist of laboratory treatability tests followed by field trials to demonstrate that BTS can remove and degrade PCBs from materials on older DoD structures. PCB-containing materials will be collected from various DoD structures at three DoD facilities and laboratory treatability evaluations of the PCB removal efficiency by BTS will be conducted for each location and material. This will include determining the number of BTS applications required to reach pre-determined cleanup goals stipulated by the various installations. The work will then proceed into the field where the BTS will be applied to PCB-containing structures found on specified active DoD installations (USAF and Army) and BRAC (Base Realignment and Closure) sites (former Navy and Army installations). The overall removal and degradation efficiency at three DoD sites will be statistically validated. A brief overview of each task that the UCF team will be responsible for, including deliverables associated with a task, is presented in the following sections. 1.2.1. Task 1: Site Visit and Collection of Samples of PCB-Containing Materials. GeoSyntec, NASA, and/or UCF personnel in conjunction with GeoSyntec and NASA personnel, will visit each of three military installations at the beginning of the project. Samples from prospective buildings/structures will be collected and returned for PCB testing. These samples will be used to determine the range of PCB concentrations, the optimal specific BTS formulation, and the residual PCB concentration after BTS is applied. Appropriate site-specific Health and Safety Plans will be developed (HASP) prior to each site visit. Depending on the permitting, access agreements and site coordination for each of the sites, the site visits and corresponding sample collection may not occur at one time. Therefore this Task is broken down into three sub tasks: a) Site visit and sample collection at Cape Canaveral Air Force Station; b) Site visit and sample collection at Badger Army Ammunitions Plant; and c) Site visit and sample collection from one of the Navy’s inactive ships. These subtasks may not be completed in the order listed. 1.2.2. Task 2: Treatability Testing UCF and NASA personnel will conduct laboratory treatability studies on the samples collected in Task 2 to determine which BTS formulation is optimal for each specific installation. This task has been broken down into four subtasks in order to address the potential scheduling differences in site visits. A key subtask during this phase will be the

65
preparation and submission for review by the ESTCP program manager a detailed laboratory work plan that outlines the details of project organization and roles, laboratory experimental analytical protocols, health and safety issues, and reporting deliverables. This Treatability Study Laboratory Work Plan, completed as Task 2a, will serve as the basis for the laboratory work to be completed for each of the treatability testing subtasks. Task 2b will be the laboratory treatability testing for the samples from Cape Canaveral Air Force Station; Task 2c will be the laboratory treatability testing for the samples from Badger Army Ammunitions Plant; and Task 4d will be the laboratory treatability testing for the samples from one of the Navy’s inactive ships. These subtasks may not be completed in the order listed. Each treatability subtask will involve the testing of different BTS formulations to optimize the removal and treatment of PCBs for the specific material being tested at that site. Formulation development will include methods to: minimize evaporation of the solvent component of BTS; optimize application rates; and thicken the BTS reagent to reduce gravitational influences (i.e., for application to vertical walls or around pipes). Additionally, because all paints and caulking do not have the same amount of PCBs in them and multiple paint layers are common, an evaluation of dose required and reapplications necessary to reach cleanup goals will be performed. Once a formulation has been finalized for each location, split samples will be sent to KSC and GeoSyntec to independently evaluate the efficacy of the BTS application. 1.2.3. Task 3: Manufacturing of the Catalyst System and BTS for Field Testing In preparation for field-scale deployment, the catalyst will be manufactured at UCF in preparation for inclusion in BTS. The Mg/Pd catalyst is manufactured using mechanical alloying techniques. There is no commercial vendor currently identified to produce the catalyst that has been developed; however, there are a number of potential milling vendors that have this capability for future large-scale production. Once the catalyst has been manufactured, BTS reagent may be made at KSC, GeoSyntec’s laboratory and/or UCF and shipped to the field sites for application and evaluation by the research team or it may be made on location. 1.2.4. Task 4: Application of BTS to DoD Test Structures/Materials BTS reagent will be applied to PCB-containing structures at three DoD facilities. Based on the laboratory treatability testing, multiple applications of BTS may be required. Prior to application of BTS to the materials to be treated, pre-deployment samples will be collected to determine starting PCB concentrations. It is anticipated that the field deployment at each facility will last no more than one week including predeployment sampling, BTS reagent application, post-deployment sampling, and site cleanup. Approximately twenty gallons of BTS reagent will be available for application at each installation. If only one application of BTS reagent is required for a structure (e.g. reduction goals are achieved in a single treatment), the installation may choose to enlarge the proposed treatment area. Twenty gallons of BTS reagent applied at a thickness of 0.08 inches (an extremely thick layer) will treat approximately 20 square feet. A variety of structures and/or surface features (vertical walls, piping) will be treated. After the BTS reagent has been applied to a structure, it will be physically removed using a vacuum and stored in a 55 gallon drum for analysis. Reagent that is not removed by the vacuum

66
extraction technique will be scrapped from the structure and stored in the same 55-gallon metal drum. This material will be analyzed over time for PCB destruction. Laboratory data suggests that PCB levels will decline to less than 50 ppm within one week. This Task has been broken down into subtasks. For each of the facilities, the UCF team will help to prepare a Field Demonstration Plan including a Quality Assurance Project Plan (QAPP), Sampling and Analysis Plan (SAP), and site-specific Health and Safety Plan (HASP) will be prepared for review and approval by the ESTCP project manager. Task 4a will involve the preparation of the Draft Field Demonstration Plan for Cape Canaveral Air Force Station. Task 4b will involve the preparation of the Draft Field Demonstration Plan for Badger Army Ammunition Depot. Task 4c will involve the preparation of the Draft Field Demonstration Plan for the Navy Inactive ship. Application of BTS in the field will not occur until these Demonstration Plans have been finalized and approved by ESTCP. Task 4d will involve the pre-deployment sample collection, BTS application, post-deployment sampling, and site cleanup at Cape Canaveral Air Force Station. Task 4e will involve the pre-deployment sample collection, BTS application, post-deployment sampling, and site cleanup at Badger Army Ammunition Depot. Task 4f will involve the pre-deployment sample collection, BTS application, post-deployment sampling, and site cleanup at the Navy Inactive ship. 1.2.5. Task 5: Laboratory Testing of Materials Both Pre- and Post-BTS Deployment A statistically significant data set, a minimum of ten pre- and post-BTS deployment samples, will be evaluated in the laboratory based on the size of the deployment area and initial PCB concentrations. GeoSyntec will send representative samples from both the treated and untreated paint as well as the BTS residue to an independent National Environmental Accreditation Program (NELAP)-certified laboratory for secondary confirmation analyses of PCBs. In addition, UCF will test a sub set of the samples. Samples tested at UCF will be run on one of two Perkin Elmer AutoSystem XL GC/FID/ECDs both of which are equipped with an auto-sampler. Post application, the BTS will be sampled for analysis and any remainder containerized and monitored for PCB destruction over time. Samples of spent BTS reagent will be shipped to KSC, UCF and GeoSyntec for evaluation. Parameters to be evaluated include PCB loss over the full length of emulsion application, continued PCB loss with repeated applications of emulsion, PCB degradation in spent BTS reagent and the qualitative effect on paint texture or binder (softening of painted surfaces has been noted in previous testing). The adhesion, or pull-off strength, of the structure coatings will be evaluated under American Society for Testing and Materials (ASTM) procedure D4541-95e1 before and after BTS application. The proposed project schedule is given in Figure 1.

67
ID Task Name 2006 2007 2008
Quarters Quarters Quarters 2nd 3rd 4th 1st 2nd 3rd 4th 1st 2nd 3rd 4th
1 Task 1-Sampling at Field Sites
X X
2 Task 2-Laboratory-BTS Treatability Test
X X X X X
3 Task 3-Manufacturing of the Catalyst System and BTS
X X X X
4 Task 4-Application of BTS to Test Structures
X X X X
5 Task 5- Laboratory Testing of Pre- and Post BTS Deployment Materials
X X X X X
6 All Reporting and Meetings
X X X X X X X X X X X
Figure 1. Project Schedule