treatment of microconstituents for water reuse and ... · treatment of microconstituents for water...
TRANSCRIPT

Treatment of Microconstituents for Water Reuse and Drinking Water gApplications
Pacific Northwest Section AWWAPacific Northwest Section AWWAMay 6, 2009
Larry Schimmoller, P.E.
CH2M HILL’s Global Technology Leader for Water Reuse

Agendag• Definition of water reuse
• Treatment Technologies for microconstituents
• Case Studies:– Typical urban surface water supply– Planned Indirect Potable Reuse
• Sustainability
2

Water Reuse is the Recycling of Treated y gWastewater for Beneficial Use
Non-Potable ReuseMicroAgricultural Irrigation
Landscape Irrigation
Industrial Uses
Micro-constituents typically not a concern
Water
Recreational & Environmental Enhancement
Drinking water
Indirect Potable ReuseMore focusWater
Reclamation Plant
Drinking water source (reservoir, aquifer, etc..)
More focus on Micro-constituents
Wastewater Treatment Plant
Treatment Plant Effluent
3

Impact of Wastewater Discharges to Water Supplies
Under low flow conditions, water in Colorado and Sacramento Rivers may be 9%-17%9%-17% wastewater (Coss, 2007)
4

Advanced treatment options for Emerging C t i tContaminants
• Soil Aquifer Treatment (SAT)q ( )• Nanofiltration / Reverse osmosis• Granular activated carbon• UV - Advanced oxidation (UV-AOP)• Ozone and Ozone-UV

Soil Aquifer Treatment by Ri b k Filt tiRiverbank Filtration
Jörg Drewes (Colorado School of Mines)
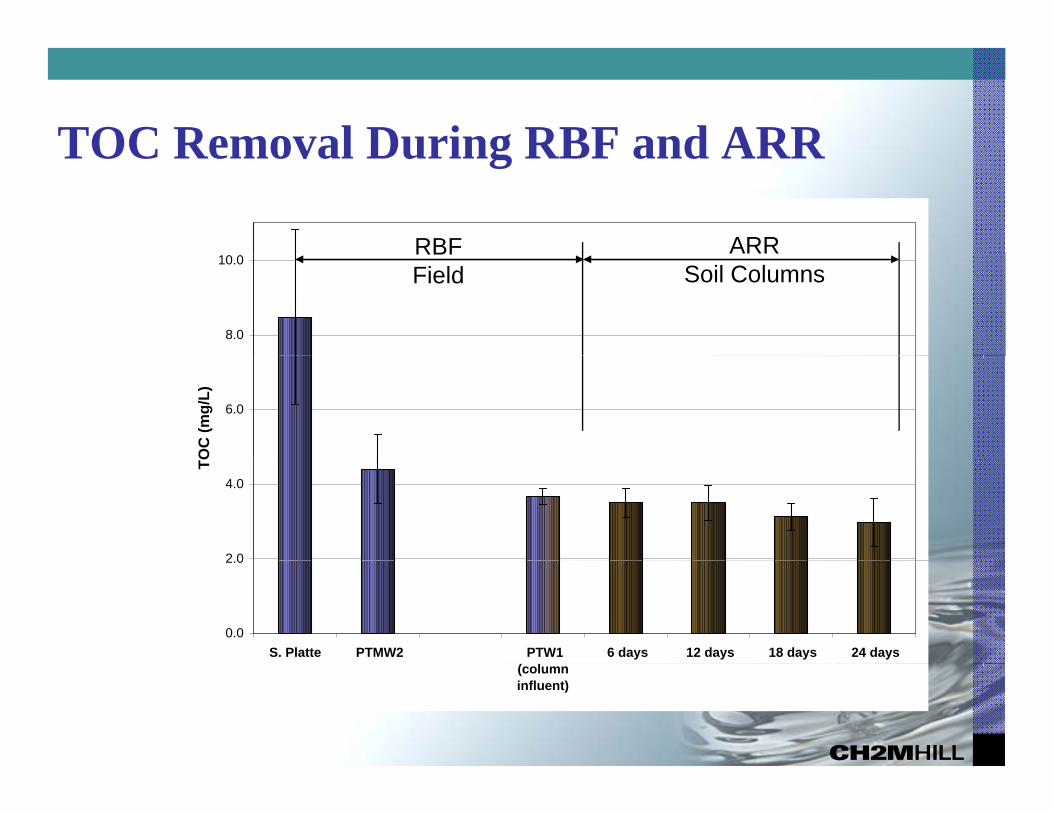
TOC Removal During RBF and ARRTOC Removal During RBF and ARR
RBF ARR
8.0
10.0RBF Field
ARR Soil Columns
6.0
OC
(mg/
L)
2 0
4.0
TO
0.0
2.0
S. Platte PTMW2 PTW1 6 days 12 days 18 days 24 days(columninfluent)

RBF Field MonitoringPharmaceutical Compounds RemovalPharmaceutical Compounds Removal
1200S.PlatteRBF water PTW1
1000
g/L)
RBF water PTW1
600
800
entra
tion
(ng
400Con
ce
n.d. - 55 n.d. - 45
n.d. - <250
200
0Gemfibrozil Naproxen Ibuprofen

RBF - Field MonitoringPharmaceutical Compounds RemovalPharmaceutical Compounds Removal
450S.Platte
350
400
g/L)
RBF water PTW1
250
300
entra
tion
(ng
150
200
Con
ce
50
100
0Carbamazepine Primidone

Reverse Osmosis MembranesMembranes

Rejection of Microconstituents by RO is E ll tExcellent
• Generally greater than 99% for mostGenerally greater than 99% for most compounds
• Some compounds not well removed (e.g., NDMA)

What is UV Advanced Oxidation? Hydrogen peroxideOxidation?
• Definition: water treatment with the use of UV light (photolysis) in combination with hydroxyl radical (advanced
)
Hydrogen peroxide
Hydroxyl radical
oxidation)• UV light destroys photo-sensitive
compounds • Hydrogen peroxide fed upstreamHydrogen peroxide fed upstream• UV light converts H2O2 to OH. radical:
– hydroxyl radical = very powerful oxidant– effective at oxidizing emerging
Courtesy of Trojang g g
contaminants, like ozone, but no bromate is formed Oxidant Half-Cell Potential, Eo
redChlorine Dioxide 0.95VHypochlorite 1.64VP t 1 68VPermanganate 1.68VHydrogen Peroxide 1.78VOzone 2.08VHydroxyl Radical 2.85V
12
Source: Water Quality and Treatment , 5th Ed. p.12.3

How is UV-AOP Different from UV Disinfection?Disinfection?
• UV-AOP typically uses a dose in excess of 500 J/ 2 t d t i t i t (mJ/cm2 to destroy emerging contaminants (more
than 10 times greater than typical UV disinfection dose)dose)
• Consequently UV AOP requires more energy than• Consequently, UV-AOP requires more energy than UV disinfection and good water quality (low TSS and organics) is very important.and organics) is very important.
13
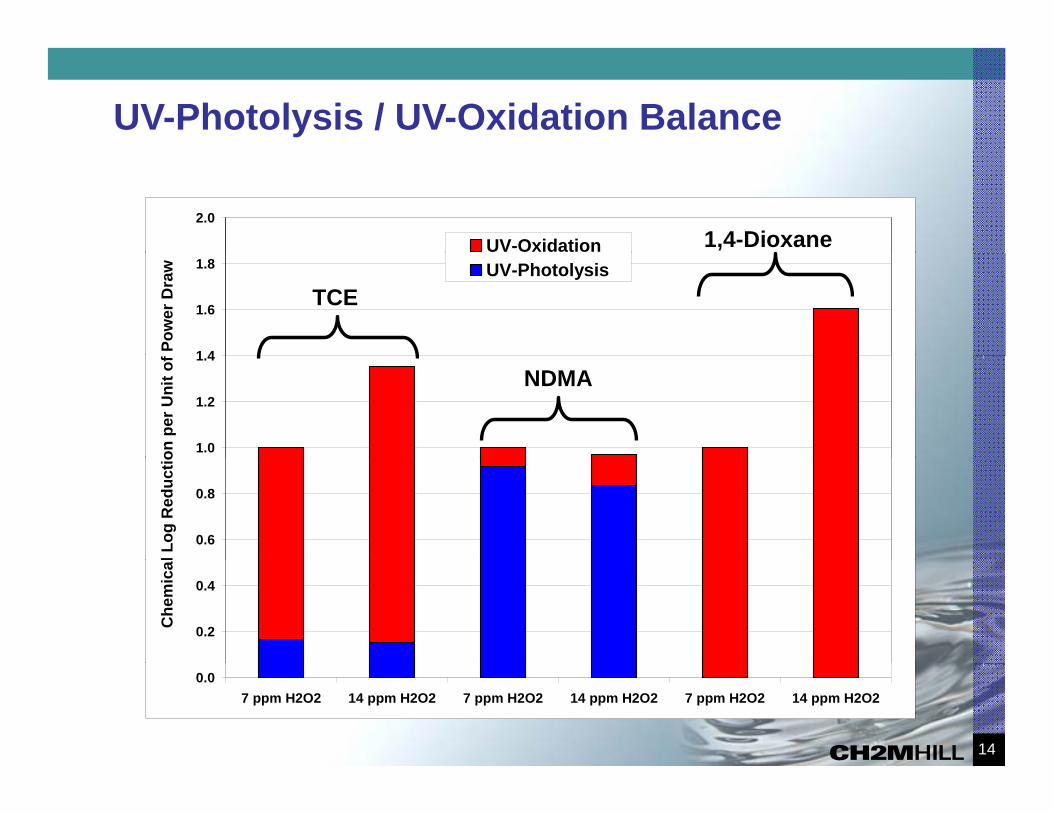
UV-Photolysis / UV-Oxidation Balance
2.0
UV-Oxidation 1,4-Dioxane
1 4
1.6
1.8
Pow
er D
raw UV-Photolysis
TCE
1.0
1.2
1.4
on p
er U
nit o
f
NDMA
0.6
0.8
l Log
Red
uctio
0.2
0.4
Che
mic
a
14
0.07 ppm H2O2 14 ppm H2O2 7 ppm H2O2 14 ppm H2O2 7 ppm H2O2 14 ppm H2O2

Removal of Emerging Contaminants by UV-AOP (Snyder et. al 2007)UV D 671 J/ 2 H2O2 D 5 /LUV Dose: 671 mJ/cm2 H2O2 Dose: 5 mg/L
90%
100%
70%
80%
oval
40%
50%
60%
erce
nt R
emo
10%
20%
30%Pe
0%
cetam
inoph
en
droste
nedio
neAtra
zine
Caffein
e
arbam
azep
ineDEET
Diazep
amDicl
ofena
cDila
ntin
Erthrom
ycin
Estriol
Estron
eFluo
xetin
eGem
fibroz
il
Hydroc
odon
eIbu
profen
Ioprom
ide
Meprob
amate
Naprox
enOxy
benz
one
Pentox
ifyllin
eProg
eteron
e
fameth
oxaz
oleTCEP
Testos
teron
eTric
losan
Trimeth
oprim
AceAnd
r
Car H M O P
Sulfam T T

Destruction of Nine Nitrosamines b UV AOPby UV AOP
4.5
5.0
5.0 mg/L of Hydrogen Peroxide Added to All Samples99.997%
99.999%
3.5
4.0
s)
NDMA NMEA NDEA
NDPA NPYR NMOP
NPIP NDBA NDPhA
NPIP
NMOP
NDPA
99.97%
99 99 %
99.99%
2.5
3.0
ruct
ion
(Log
s
NDPhA
NDEA
NPYR
NDBA
99.7%
99.9%Spiked RiverbankFiltration Water
1.5
2.0
Log
Des
tr
NDMA
NMEA
96.8%
99.0%
0.5
1.0
68.4%
90.0%
0.00 100 200 300 400 500 600 700 800 900 1000 1100 1200
Collimated Beam UV Dose (mJ/cm2)

Case StudiesCase Studies
• Prairie Waters Project (Aurora Colorado)Prairie Waters Project (Aurora, Colorado)– Drinking water project treating a typical urban
surface watersurface water
• Western Corridor Recycled Water Project (Southeast Queensland, Australia)– Planned Indirect Potable Reuse Project
17

Prairie Waters ProjectPrairie Waters Project
• Add sustainable water yield to Aurora’s water ysystem – “Drought Harden” Aurora’s existing system– Develop new supplies for new development
U i ti il bl t i ht t d li• Use existing available water rights to deliver no less than 10,000 af/yr of additional supply by 20102010

COLORADOAurora’s Water Supply System
VAIL
RIVER BASIN DENVER
AURORAAuroraReservoirQuincy
Griswold WTP
Wemlinger WTP
SOUTH PLATTERIVER BASIN
FAIRPLAYLEADVILLE
ReservoiryReservoir
RampartReservoir
Strontia SpringsReservoir
Homestake Reservoir
Turquoise
Jefferson Lake
FAIRPLAYLEADVILLE
COLORADO
Spinney Mountain ReservoirTwin Lakes
Turquoise Lake Cheeseman
Reservoir
ARKANSASRIVER BASIN
BUENA VISTA
COLORADO SPRINGS
PUEBLO
Pueblo
ROCKY FORD
Lake Meredith
Reservoir

Prairie Waters Project• 34 miles of 60-inch pipeline• 3 pumping stations
N th C• North Campus – Bank filtration– Aquifer Recharge and Recoveryq g y
• ARWPF– 50 mgd water purification facility
Public Health Protection•Nitrates•Nitrates•Pathogens•Organics•Micro-pollutants

Combining the Best of Natural and Engineered Purification StepsEngineered Purification Steps
Natural Treatment Softening UV-AOP Filters GAC Blending
Taste and Odor
Color
g g
TDS
Nitrate
PathogensPathogens
Organics
Micro-Pollutants

Results Demonstrate Effectiveness of Multiple Barrier ApproachMultiple Barrier Approach
200Raw South Platte RiverFollowing Riverbank FiltrationSoftened/Clarified Water
490 ng/L774 ng/L
150
on (n
g/L)
Softened/Clarified WaterUV-AOP EffluentGAC Effluent
100
Con
cent
ratio
0
50C
Detection Limit
0
Mecloc
yclin
eDem
ocloc
yclin
e
Monen
sinSali
nomyc
esTetr
acyc
line
Chlorte
tracy
cline
Oxytet
racyc
line
Sulfam
ethox
azole
Sulfath
iazole
Sulfad
imeth
oxan
eSulf
amera
zine
Erythro
mycin

Results Demonstrate Effectiveness of Multiple Barrier Approachp pp
1000
Average Concentration in South Platte RiverAverage Concentration following Riverbank FiltrationSoftened/Clarified WaterUV-AOPGAC Effluent
800
900
500
600
700
atio
n (n
g/L)
300
400
Con
cent
ra
0
100
200
Detection Limit
0
Bisphe
nol A
Caffein
eCarb
amaz
epine
Clofibr
ic Acid
Dichlor
prop
Diclofe
nac
Fenofi
brate
Gemfib
rozil
Ibupro
fenKeto
profen
Mecop
ropNap
roxen
Phena
cetin
ePrim
idone
Salicy
lic Acid
TCEP
TCIPP
TDCPP

Western Corridor Recycled Water ProjectRecycled Water Project - Background• Southeast Queensland hasSoutheast Queensland has
had the worst drought on record from 2001 – 2008
24

•Three new AWTPs•Nine storage tanks•12 pump stations
Tarong12 pump stations
•200 km of pipe•232 MLD (61 mgd) of purified recycled water supplies:
t l t
Aug 2007Jun 2008
Luggage PointWivenhoe Release
–two power plants–Wivenhoe Dam (if required)
Luggage Point
Gibson Island
Oct 2008
O l
Wacol
Bundamba
Oxley
GoodnaSwanbank

Key Design Criteria of Full-S l Pl tScale Plant
• Production capacity of 70 ML/d (18.5Production capacity of 70 ML/d (18.5 mgd)
• Provide multi-barrier treatment process
• Meet all water quality requirements– Meet all Australian drinking water guidelines – Total Nitrogen < 1.2 mg/L as N – Total Phosphorus < 0.13 mg/L– NDMA < 10 ng/L
26
NDMA 10 ng/L

Major Treatment Processes
FLOCCULATION/CLARIFICATION
SOLIDSPHOSPHORUS
ORGANICS
MICROFILTRATION SOLIDS
PATHOGENS
UV / ADVANCED OXIDATION
NDMAPATHOGENS
MICROCONSTITUENTS
REVERSE OSMOSISNUTRIENTS – N&P
ORGANICSTDS
PATHOGENSMICROCONSTITUENTS
SECONDARY TREATED
WASTEWATERFINISHED WATER
MICROCONSTITUENTS
27

Example Constituent Removal (based on pilot lt )results)
• Total nitrogen Ammonia Nitrogen
TKN Nitrate Nitrogen
Nitrite Nitrogen
Total organic
Total Nitrogen
– Influent average 10 mg/L– Permeate average 1.2 mg/L– 88% removal
Nitrogen Nitrogen Nitrogen organic nitrogen
Nitrogen
83% 88% 87% 94% 92% 88%
• Total phosphorus removal– Influent average 7.5 mg/L– Permeate average <0.01 mg/L– 99.9% removal
• NDMA Removal– Below detection limit
28

Luggage Point AWTP Sitegg gMembrane &
UV BuildingChemical
Building UV BuildingBuilding
Raw Water Storage
Flocculation / Clarification
C t if
29
ThickenerCentrifuge
Building

Luggage Point AWTPFlocculation / Clarification Reverse Osmosis
Microfiltration UV / Advanced Oxidation
30

E t FIndirect Potable Reuse:BALANCING COSTS AND
Excerpts From:
BALANCING COSTS ANDBENEFITSIWA World Water CongressIWA World Water CongressSeptember 2008Vienna
Larry Schimmoller – CH2M HILL Bill Bellamy – CH2M HILL Jason Curl – CH2M HILL

BackgroundBackground• Greater focus on sustainability throughout
societyy
• Intent of this paper is to compare two indirect potable reuse (IPR) treatmentindirect potable reuse (IPR) treatment trains with respect to cost, health, and environmental impact
32

Treatment Trains Evaluated
Treatment Train #1
Treatment Train #2
• Multiple barriers provided by each treatment train for removal of bulk organic matter, trace organics, and pathogens
33
• Disposal of RO concentrate required for Train #2

Triple Bottom Line AnalysisTriple Bottom Line Analysis
• Social– Health impacts: evaluated effectiveness of each treatment train
for removal of emerging contaminants, bulk organic matter, and pathogenspathogens
• Financial– Evaluated the capital cost, annual operating cost, and net
t l f h t t t t ipresent value of each treatment train
• Environmental– Evaluated greenhouse gas emissions produced by each plantEvaluated greenhouse gas emissions produced by each plant
34

Pharmaceutical and EDC Removal6
4
5
mov
al
2
3
Log
Rem
0
1
35
Train #1 - Coag/O3-BAC/GAC/UVTrain #2 - MF/RO/UV-AOP

NetPresent Worth (US Dollars)
$500
$600 O&M BldgConc HandlingSolids HandlingChemicals
$300
$400
ons
ChemicalsUVROGACMF
$200
$300
Mill
io MFO3/BACClarification
$0
$100
$0Train 1A -1/yr GAC Regen.
Train 1B -2/yr GAC Regen.
Train 1C -4/yr GAC Regen.
Train #2B -MF/RO/UV-
AOP
Train #2A -MF/RO/UV-AOP w/ZLD
36

CO2 EmissionsCO2 Emissions80,000
90,000
CO2 from GAC Regeneration
60,000
70,000
ric
tons
/yr)
CO2 from GAC Regeneration
CO2 from Electricity
40,000
50,000
issi
on (m
etr
20,000
30,000
CO
2 E
mi
0
10,000
Train 1A - Train 1B - Train 1C - Train #2B - Train #2A -
37
Train 1A 1/yr GACRegen.
Train 1B 2/yr GACRegen.
Train 1C 4/yr GACRegen.
Train #2B MF/RO/UV-
AOP
Train #2A MF/RO/UV-AOP w/ZLD

Major ConclusionsMajor Conclusions• Alternative treatment trains
should be considered for IPR applications (especially for
Social Equity
applications (especially for inland locations)– cost can be significantly
less
SustainableSolutions
less– environmental impact can
be substantially lesst t d t i f i il
EnvironmentEconomy
– treated water is of similar quality
• Alternative selected for
y
implementation should support the most sustainable approach
38
• Where TDS removal is required, RO treatment is necessary
