travel time safety energy and air quality impacts of
TRANSCRIPT

CEFACenter forCenter forEconomic ForecastingEconomic Forecastingand Analysisand Analysis
TRAVEL TIME, SAFETY, ENERGY, AND AIR QUALITY IMPACTS
OF FLORIDA HIGH SPEED RAIL
June 1997
Prepared for the
Florida Department of Transportation
and
FLORIDA OVERLAND EXPRESS
Prepared by
Thomas A. Lynch, Ph.D.Neil Sipe, Ph.D.
Institute of Science & Public AffairsFlorida State University
2035 E. Paul Dirac DriveRm. 130 Morgan Bldg.
Innovation ParkTallahassee, FL 32310
Steven E. Polzin, Ph.D.Xuehao Chu, Ph.D.
Center for Urban Transportation ResearchUniversity of South Florida
4202 E. Fowler Avenue, CUT 100Tampa, FL 33620-5375


TRAVEL TIME, SAFETY, ENERGY, AND AIR QUALITY IMPACTS
OF FLORIDA HIGH SPEED RAIL
Page - iii
TABLE OF CONTENTS
Section Page
Table of Contents . . . . . . . . . . . . . . . . . . . . . . . . . . . . . . . . . . . . . . . . . . . . . . . . . . . . . . . . iiiList of Tables . . . . . . . . . . . . . . . . . . . . . . . . . . . . . . . . . . . . . . . . . . . . . . . . . . . . . . . . . . . ivList of Figures . . . . . . . . . . . . . . . . . . . . . . . . . . . . . . . . . . . . . . . . . . . . . . . . . . . . . . . . . . . vIntroduction . . . . . . . . . . . . . . . . . . . . . . . . . . . . . . . . . . . . . . . . . . . . . . . . . . . . . . . . . . . . . 1Background . . . . . . . . . . . . . . . . . . . . . . . . . . . . . . . . . . . . . . . . . . . . . . . . . . . . . . . . . . . . 3
The High Speed Rail Alternative . . . . . . . . . . . . . . . . . . . . . . . . . . . . . . . . . . . . . . 5The Florida High Speed Rail Project . . . . . . . . . . . . . . . . . . . . . . . . . . . . . . . . . . . 5Impacts of Florida High Speed Rail . . . . . . . . . . . . . . . . . . . . . . . . . . . . . . . . . . . 12HSR Travel and Traveler Benefits . . . . . . . . . . . . . . . . . . . . . . . . . . . . . . . . . . . . 12
Methodologies . . . . . . . . . . . . . . . . . . . . . . . . . . . . . . . . . . . . . . . . . . . . . . . . . . . . . . . . . 15Ridership Forecasts . . . . . . . . . . . . . . . . . . . . . . . . . . . . . . . . . . . . . . . . . . . . . . . 15Technology Assumptions . . . . . . . . . . . . . . . . . . . . . . . . . . . . . . . . . . . . . . . . . . . 16Modal Performance Assumptions . . . . . . . . . . . . . . . . . . . . . . . . . . . . . . . . . . . . . 17
Travel Time Impacts . . . . . . . . . . . . . . . . . . . . . . . . . . . . . . . . . . . . . . . . . . . . . . . . . . . . . 19Safety Impacts . . . . . . . . . . . . . . . . . . . . . . . . . . . . . . . . . . . . . . . . . . . . . . . . . . . . . . . . . 23Reduction in Aircraft Flights and Automobile Trips . . . . . . . . . . . . . . . . . . . . . . . . . . . . . 27Energy Impacts . . . . . . . . . . . . . . . . . . . . . . . . . . . . . . . . . . . . . . . . . . . . . . . . . . . . . . . . 31Air Quality Impacts . . . . . . . . . . . . . . . . . . . . . . . . . . . . . . . . . . . . . . . . . . . . . . . . . . . . . . 33References . . . . . . . . . . . . . . . . . . . . . . . . . . . . . . . . . . . . . . . . . . . . . . . . . . . . . . . . . . . 41
Appendix A Florida Power Plant Emissions, 1995 . . . . . . . . . . . . . . . . . . . . . . . . . . . . . A-1Appendix B Flight Schedules, Orlando International Airport, 1997 . . . . . . . . . . . . . . . . . B-1

TRAVEL TIME, SAFETY, ENERGY, AND AIR QUALITY IMPACTS
OF FLORIDA HIGH SPEED RAIL
Page - iv
LIST OF TABLESPAGE
Table 1. FOX Schedule Speeds and Distances . . . . . . . . . . . . . . . . . . . . . . . . . . . . . . . . . . . . . . . 8Table 2. FLORIDA OVERLAND EXPRESS Project Summary . . . . . . . . . . . . . . . . . . . . . . . . . . . . . . . 11Table 3. FOX Station Pair Distances . . . . . . . . . . . . . . . . . . . . . . . . . . . . . . . . . . . . . . . . . . . . . . . 20Table 4. Line-Haul Travel Times . . . . . . . . . . . . . . . . . . . . . . . . . . . . . . . . . . . . . . . . . . . . . . . . . . 21Table 5. Travel Time Savings . . . . . . . . . . . . . . . . . . . . . . . . . . . . . . . . . . . . . . . . . . . . . . . . . . . . . 22Table 6. Fatality, Injury, and Accident Rates for Auto, Air, and HSR . . . . . . . . . . . . . . . . . . . . . . . 23Table 7. Fatalities, Serious Injuries, and Accidents for U.S. Scheduled Air Services . . . . . . . . . . . 24Table 8. Passenger Miles for U.S. Scheduled Services . . . . . . . . . . . . . . . . . . . . . . . . . . . . . . . . . 25Table 9. Estimated Safety Benefits . . . . . . . . . . . . . . . . . . . . . . . . . . . . . . . . . . . . . . . . . . . . . . . . 25Table 10. Reductions in Aircraft Flights and Automobile Trips . . . . . . . . . . . . . . . . . . . . . . . . . . . . 27Table 11. Transportation Mode Energy Efficiencies . . . . . . . . . . . . . . . . . . . . . . . . . . . . . . . . . . . . 31Table 12. Energy Savings from Diverting Auto and Air Passengers to Fox-HSR . . . . . . . . . . . . . . 32Table 13. Net Reduction in Air Quality Pollutants (tons) . . . . . . . . . . . . . . . . . . . . . . . . . . . . . . . . . 33Table 14. Power Plant Emission Factors . . . . . . . . . . . . . . . . . . . . . . . . . . . . . . . . . . . . . . . . . . . . 35Table 15. Automobile Emission Factors . . . . . . . . . . . . . . . . . . . . . . . . . . . . . . . . . . . . . . . . . . . . . 35Table 16. Sample Aircraft Profile . . . . . . . . . . . . . . . . . . . . . . . . . . . . . . . . . . . . . . . . . . . . . . . . . . 37Table 17. Aircraft Fuel Rate and Emission Factors . . . . . . . . . . . . . . . . . . . . . . . . . . . . . . . . . . . . 39Table 18. Emissions Savings Summary . . . . . . . . . . . . . . . . . . . . . . . . . . . . . . . . . . . . . . . . . . . . . 39
Table A-1. Carbon Monoxide (CO) . . . . . . . . . . . . . . . . . . . . . . . . . . . . . . . . . . . . . . . . . . . . . . A - 2Table A-2. Nitrogen Oxides (NOx) . . . . . . . . . . . . . . . . . . . . . . . . . . . . . . . . . . . . . . . . . . . . . . . A - 4Table A-3. Particular Matter (PM) . . . . . . . . . . . . . . . . . . . . . . . . . . . . . . . . . . . . . . . . . . . . . . . A - 6Table A-4. Particular Matter (PM10) . . . . . . . . . . . . . . . . . . . . . . . . . . . . . . . . . . . . . . . . . . . . . A - 9Table A-5. Sulfur Dioxide (SO2) . . . . . . . . . . . . . . . . . . . . . . . . . . . . . . . . . . . . . . . . . . . . . . . A - 11Table A-6. Volatile Organic Compounds (VOC) . . . . . . . . . . . . . . . . . . . . . . . . . . . . . . . . . . . . A - 13
Table B-1. Flight Schedules . . . . . . . . . . . . . . . . . . . . . . . . . . . . . . . . . . . . . . . . . . . . . . . . . . . . B - 1

TRAVEL TIME, SAFETY, ENERGY, AND AIR QUALITY IMPACTS
OF FLORIDA HIGH SPEED RAIL
Page - v
List of FiguresPage
Figure 1. Population and Tourism Growth, 1990 - 2010 . . . . . . . . . . . . . . . . . . . . . . . . . . . . . . . . . 4Figure 2. Travel Demand Growth, 1990 - 2010 . . . . . . . . . . . . . . . . . . . . . . . . . . . . . . . . . . . . . . . . 4Figure 3. FOX System and Project Description . . . . . . . . . . . . . . . . . . . . . . . . . . . . . . . . . . . . . . . 7Figure 4. FOX Stations and Facilities . . . . . . . . . . . . . . . . . . . . . . . . . . . . . . . . . . . . . . . . . . . . . . 8Figure 5. FOX Implementation Time Line . . . . . . . . . . . . . . . . . . . . . . . . . . . . . . . . . . . . . . . . . . . 10Figure 6. Florida High Speed Rail Ridership . . . . . . . . . . . . . . . . . . . . . . . . . . . . . . . . . . . . . . . . . 13Figure 7. Reduction in Aircraft Flights . . . . . . . . . . . . . . . . . . . . . . . . . . . . . . . . . . . . . . . . . . . . . . 28Figure 8. Reduction in Automobile Trips . . . . . . . . . . . . . . . . . . . . . . . . . . . . . . . . . . . . . . . . . . . . 28Figure 9. Cumulative Distribution of Aircraft by Number of Seats,
Orlando International Airport, 1997 . . . . . . . . . . . . . . . . . . . . . . . . . . . . . . . . . . . . . . . . . . 36

TRAVEL TIME, SAFETY, ENERGY, AND AIR QUALITY IMPACTS
OF FLORIDA HIGH SPEED RAIL
Page - 1
INTRODUCTION
This report, Travel Time, Safety, Energy, and Air Quality Impacts of Florida High Speed Rail,
is one of three documents produced reporting on the impacts of Florida high speed rail.
Two studies, with a shared executive summary, were carried out to analyze the impacts of
Florida high speed rail. This initiative was undertaken during the first half of 1997, by the
Center for Economic Forecasting and Analysis (CEFA) at Florida State University
(Tallahassee) and the Center for Urban Transportation Research (CUTR) at the University
of South Florida (Tampa). The three documents consist of two technical reports and an
executive summary. The two technical reports each share introductory materials and
background information then present findings in their respective areas. The technical study
and executive summary titles are:
An Analysis of the Economic Impacts of Florida High Speed Rail
Travel Time, Safety, Energy, and Air Quality Impacts of Florida High Speed Rail
Executive Summary: An Analysis of the Impacts of Florida High Speed Rail
This research effort is in response to a request from the Florida Department of
Transportation (FDOT) and the FLORIDA OVERLAND EXPRESS (FOX), the franchisee, to
construct and operate Florida high speed rail, to support continued project planning. Thus,
this effort produced an analysis that provides additional, specific technical information
regarding the impacts of the FOX project based on the high speed rail plan as outlined in
the FOX proposal and subsequent franchise agreement between FOX and Florida
Department of Transportation. This report addresses specific impacts of interest to
planners, the public and decision makers.
This report is organized to briefly describe the transportation market in Florida and the FOX
plan, followed by a more substantial discussion of the methodology and findings of the
analysis.


TRAVEL TIME, SAFETY, ENERGY, AND AIR QUALITY IMPACTS
OF FLORIDA HIGH SPEED RAIL
Page - 3
BACKGROUND
Florida has experienced population and tourism growth over the past few decades virtually
unrivaled elsewhere in the United States. Population has grown from 5.0 million in 1960 to
12.9 million in 1990 and is continuing to grow at a pace roughly twice as fast as the
population as the U.S. Considerable progress has been made in expanding Florida's
highways, ports, airports and public transportation systems. Flat topography, the absence
of freeze-thaw cycles and a relatively young existing infrastructure have helped; however,
growing demand has continued to outpace the supply of new transportation capacity. As
the inventory of facilities grows, the cost of maintenance requires an increasing share of
revenues. Urbanization has dramatically increased costs of right-of-way for facility
widening. Congestion has increased the costs of maintaining traffic flow while repairing or
widening facilities and utility relocation and environmental mitigation have dramatically
increased the cost for roadway expansion. The costs and consequences of unlimited
expansion of Florida's roadways are more than can be borne by our environment and by the
taxpayers. A number of Florida’s urbanized regions are nearing the physical and
environmental limits for expanding their highway and airport capacity.
Figure 1 shows the growth in total population and tourism in Florida since 1970 and
projected to 2010. Between 1990 and 2010 Florida population is expected to increase by
38 percent. Population growth is expected to continue to favor the coastal and central
Florida areas resulting in larger and more dense urbanized areas. Tourism is expected to
grow even more rapidly with an anticipated increase of 82 percent between 1990 and 2010.
The Associated Press reports that Florida had 7.2 million foreign tourists in 1995. The
renowned attractions of Florida, a combination of sunshine, beaches and a huge and
growing list of attractions and accommodations, will virtually assure continued attractiveness
as the baby boom ages and the international population expands in numbers and has
growing disposable income.
This increase in population and tourists will be facing an increasingly strained transportation
system. Not only has population grown but travel per capita has increased. And the
infrastructure investments have not kept pace. As shown in Figure 2, highway lane miles
(LM), is forecasted to only increase 19 percent between 1990 and 2010. In that same time
period vehicle miles of travel (VMT) and the number of vehicles are expected to grow
dramatically. Vehicle miles of travel per highway lane mile is expected to increase 52

0
10
20
30
40
Mill
ions
Y e a r1970 1980 1990 2000 2010
T o t a l T o u r i s t P o p u la t i o n
0 %
2 0 %
4 0 %
6 0 %
8 0 %
1 0 0 %
H i g h w a y L MF l o r i d a R e s i d e n t s
V e h i c l e s p e r L MV M T pe r LM
F l o r i d a T o u r i s t s
TRAVEL TIME, SAFETY, ENERGY, AND AIR QUALITY IMPACTS
OF FLORIDA HIGH SPEED RAIL
Page - 4
percent. Air travel expansion has also dramatically outpaced population growth and
continued pressure for intercity travel capacity is expected to remain strong in Florida.
Figure 1. Population and Tourism Growth, 1990 - 2010
Source: CEFA and CUTR.
Figure 2. Travel Demand Growth, 1990 - 2010
Source: CEFA and CUTR.

TRAVEL TIME, SAFETY, ENERGY, AND AIR QUALITY IMPACTS
OF FLORIDA HIGH SPEED RAIL
Page - 5
The High Speed Rail Alternative
The Florida Department of Transportation has aggressively sought alternatives to meet the
travel needs of Florida residents and tourists while still being responsible stewards of the
environment and public resources. In this search, the prospect of implementing a high
speed rail system for Florida originated in 1982 and is currently mandated by the 1992
Florida High Speed Rail Transportation Act. Florida is not alone in considering high speed
rail, a number of states and regions are exploring a variety of rail technologies and
corridors. A common goal is to identify markets where travel volumes and distances are
such that rail services can be competitive with highway and air travel options. This may
provide an opportunity to lessen the pressure on both roadway and air travel as these
facilities are heavily congested in several urban areas.
As time has passed, the prospect of a high speed rail system has grown more attractive.
Modern rail technology has proven itself in an increasing number of travel markets across
the globe. Florida's rapid population and tourism growth, flat topography, cluster of large
urbanized areas, and growing densities have created a travel market that, in part, may best
be served by a transportation system that includes high speed rail. Rapid development also
motivates moving ahead with a system at this time while the cost and availability of rights-of-
way are still reasonable. Other motivations for moving ahead include a desire to use the
investment to help shape future development near stations and to complement the growing
interest in public transit as an alternative to automobile travel. A traveler choosing to travel
by HSR instead of auto may be further reducing roadway travel and its negative impacts as
transit alternatives might be the logical choice for travel within the urban areas visited by
HSR travelers.
The proposed Florida high speed rail project is not envisioned as a single cure-all for the
pressing travel congestion problems facing the state. High speed rail is, however,
recognized as one of several pivotal transportation investments needed within the
integrated infrastructure of the state to resolve these growing concerns.
The Florida High Speed Rail Project
In 1996, the Florida Department of Transportation entered into a public-private partnership

TRAVEL TIME, SAFETY, ENERGY, AND AIR QUALITY IMPACTS
OF FLORIDA HIGH SPEED RAIL
Page - 6
with FLORIDA OVERLAND EXPRESS (FOX), a consortium of four of the world's largest and
most respected international engineering, construction and rail equipment companies, to
implement a high speed rail system linking Tampa-Orlando-Miami. The Florida Department
of Transportation and FOX are currently in the process of finalizing studies of ridership,
route alignment, construction costs and financing.
The Florida High Speed Rail System is designed to provide approximately 320 miles of
electrified track connecting Florida's largest urban areas. The system is intended to be an
integral part of the state's overall transportation infrastructure by linking air, auto, taxi,
shuttle vans, bus, and existing rail and transit systems in a way that will meet future resident
and tourist travel needs. The Florida high speed rail project will serve as an important link in
what may be the United States' first multi-modal transport system that includes high speed
rail.
The system proposes connections with five major airports, the highway system and growing
regional rail and bus transit systems across the state's largest metropolitan areas. The
counties directly served by this proposed high speed rail system are forecast to contain
more than 45% of the state's 15.5 million people by the year 2000 and over 58% of tourist
development tax revenues are predicted to be collected in counties with direct FOX service.
FOX will serve a very large share of the state's major tourism attractions including cruise
ships, beaches, urban centers and theme parks.
Figure 3 is a graphic provided by FOX that indicates the system characteristics and the
candidate alignments under study.
The proposed system is planned to utilize the newest generation of French TGV rail
equipment. The system will consist of ten car train sets, including two power cars, seven
passenger coaches and a lounge car with food service. The coach vehicles will be 61' - 4"
long and 9' - 6" wide. A train set would have seating capacity for 295 passengers. The
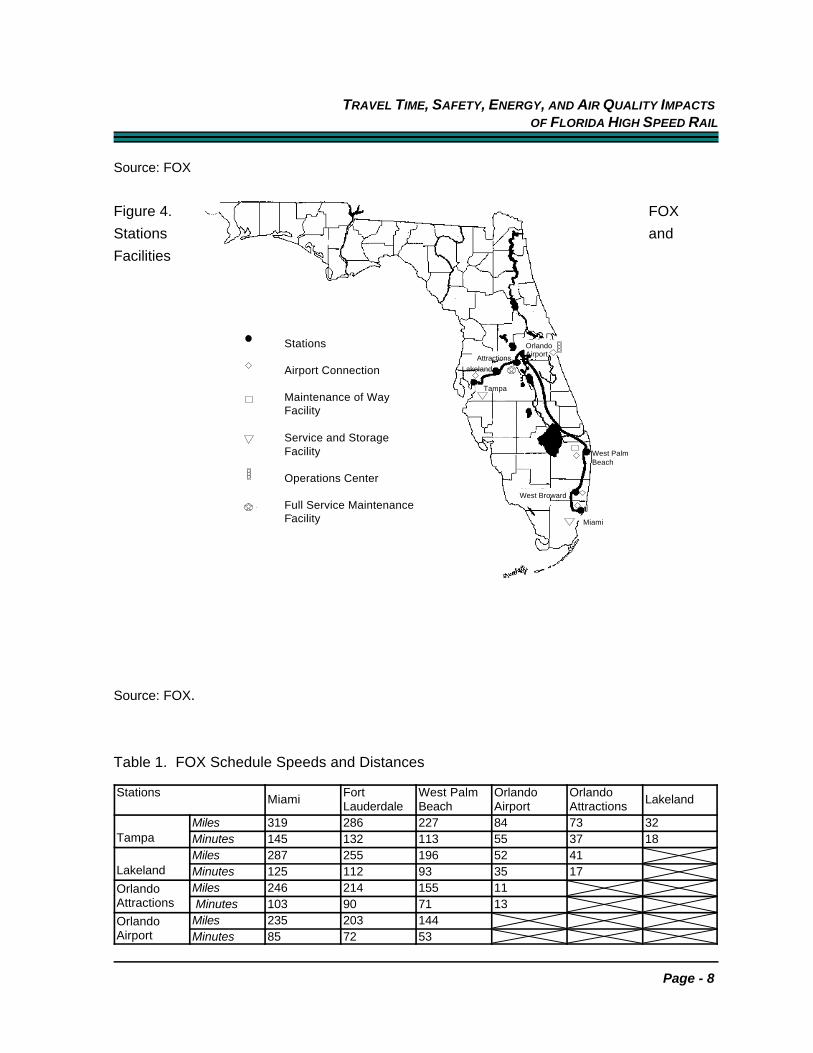
system will serve seven stations as shown in Figure 4. The peak operating speed for the
system is 200 miles per hour with an average scheduled travel speeds shown in Table 1 for
each station pair.

TRAVEL TIME, SAFETY, ENERGY, AND AIR QUALITY IMPACTS
OF FLORIDA HIGH SPEED RAIL
Page - 7
Figure 3. FOX System and Project Description
FOX’s High Speed Rail< 320 Dedicated Route Miles< 7 Stations including 2 Airport Intermodal Facilities< 21 Train Sets< 295 Passengers Per Train< Top Operating Speed 200 mph< Trains Can Operate Every 5 Minutes< Interconnects With Local Transit at All Stations< Commences Operation 2004< 5.3 Billion ($1995) Total Project Cost
Stations
Airport Connection
Maintenance of Way Facility
Service and StorageFacility
Operations Center
Full Service MaintenanceFacility
Attractions
West Broward
Miami
West PalmBeach
Lakeland
Tampa
Orlando Airport
TRAVEL TIME, SAFETY, ENERGY, AND AIR QUALITY IMPACTS
OF FLORIDA HIGH SPEED RAIL
Page - 8
Source: FOX
Figure 4. FOX
Stations and
Facilities
Source: FOX.
Table 1. FOX Schedule Speeds and Distances
Stations Fort West Palm Orlando Orlando Miami Lakeland
Lauderdale Beach Airport Attractions
TampaMiles 319 286 227 84 73 32Minutes 145 132 113 55 37 18
LakelandMiles 287 255 196 52 41Minutes 125 112 93 35 17
OrlandoAttractions
Miles 246 214 155 11 Minutes 103 90 71 13
OrlandoAirport
Miles 235 203 144Minutes 85 72 53

TRAVEL TIME, SAFETY, ENERGY, AND AIR QUALITY IMPACTS
OF FLORIDA HIGH SPEED RAIL
Page - 9
West PalmBeach
Miles 92 59Minutes 44 23
FortLauderdale
Miles 33Minutes 17
Source: FOX.
Schedules would provide service at least every hour, getting more frequent over time as
demand increased. Service would be provided 365 days per year at least 18 hours per day.
Fares are anticipated to be competitive with or lower than airline fares with pricing designed
similar to airlines with yield management targeted to several different travel markets.
Ticketing would be integrated with other ground travel and air providers.
The system would be completely grade separated with no at-grade crossings of roadways,
other rail lines or pedestrian or other access. Stations would offer a full service environment
with ticketing, access and egress mode services, amenities, and services designed to meet
many traveler needs. Smaller in scale than commercial airports, rail stations would enable
relatively quick arrival and departure times.
The schedule for the implementation of the FOX program is shown in Figure 5. The
proposed schedule for Florida's high speed rail project has environmental and engineering
studies on-going through 1999 and construction slated to begin in 2000. The first
passengers will be able to travel from Miami to Orlando beginning in 2004.
Service would start on the Orlando to Miami leg in 2004 and in 2006 the full phase one
alignment from Tampa to Miami would be in place. The prospect of future system
expansion to northeast or southwest Florida and perhaps other locations has been
considered; however, impacts from those facilities are not included in this analysis. Table 2
provides information developed by FOX summarizing the overall project.

TRAVEL TIME, SAFETY, ENERGY, AND AIR QUALITY IMPACTS
OF FLORIDA HIGH SPEED RAIL
Page - 10
Figure 5. FOX Implementation Time Line
Source: FOX.

TRAVEL TIME, SAFETY, ENERGY, AND AIR QUALITY IMPACTS
OF FLORIDA HIGH SPEED RAIL
Page - 11
Table 2. FLORIDA OVERLAND EXPRESS Project Summary

TRAVEL TIME, SAFETY, ENERGY, AND AIR QUALITY IMPACTS
OF FLORIDA HIGH SPEED RAIL
Page - 12
Source: FOX.
Impacts of Florida High Speed Rail
As a precursor to estimating the economic impacts, this study looked at the transportation
benefits expected from the project. These benefits are of interest both because they
subsequently contribute to economic impacts, and independently, as safety, air quality and
energy use are among the important considerations in making transportation investments.
Transportation benefits accrue to persons choosing to use HSR and for non-users of the
system that benefit from the presence of this transportation alternative. These benefits take
two forms. The first is benefits to the HSR traveler beyond the cost of the fare including
consumer surplus, safety, environmental and other savings. Second, there are economic
and other savings for non-high speed rail travelers using existing transportation modes in
the form of reductions in congestion and air pollution as a result of some air and auto
travelers switching to this new high speed rail mode.
HSR Travel and Traveler Benefits
Florida High Speed Rail is projected to carry approximately 6.13 million one-way trips in the
year 2010. This will result in approximately 16,780 daily trips, averaging 182 miles. Forty-
six percent of the ridership will be concentrated in the Orlando-Miami segment, with 36
percent and 18 percent in the Tampa-Orlando and Tampa-Miami segments, respectively.
Fifty-seven percent of these trips would be made for business purposes, the remainder
being tourism and personal travel. Of the total ridership, 31 percent are estimated to shift to
high speed rail from air travel, 45 percent would shift from auto, and 24 percent would be
new trips induced due to the cost and convenience of high speed rail. Of intercity travel
between the Florida cities served, approximately 5 percent of highway traffic will be served
by high speed rail, while approximately 80 percent of air traffic will be diverted to high speed
rail. HSR ridership represents about 11 percent of the total travel that starts and ends in the
cities served in the Tampa-Orlando-Miami corridor.
The average fare is projected to be approximately $64 per trip or $0.35 per passenger mile
in 1997 dollars. Figure 6 shows the trend of HSR ridership over the first few decades of

0
2 0 0 0
4 0 0 0
6 0 0 0
8 0 0 0
1 0 0 0 0
Y e a r
Rid
ersh
ip (
thou
sand
s)
2 004 2010 2016 2022 2028 2034 2040
TRAVEL TIME, SAFETY, ENERGY, AND AIR QUALITY IMPACTS
OF FLORIDA HIGH SPEED RAIL
Page - 13
operation. Several studies have developed ridership forecasts for high speed rail in Florida
over the past several years. The source of ridership estimates for this analysis is the
ridership forecast included in the FOX Pre-Certification Post Franchise Agreement and
supporting documents. This forecast utilized the extensive forecasting work that was
carried out by KPMG Peat Marwick in 1993 and further modeling work carried out by
SOFRERAIL, a French firm involved in high speed rail planning.
Based on that forecast, HSR will serve approximately 1.1 billion passenger miles of travel in
2010, helping meet needs in a state that currently has over 127 billion vehicle miles of travel
on roadways. As portrayed by these statistics, HSR would provide a large amount of
service and carry a large ridership, yet in the context of the total travel demand of the State,
its role, like that of any single project, is more modest.
Figure 6. Florida High Speed Rail Ridership
Source: FOX and FDOT Pre-Certification Post Franchise Agreement (PCPFA) and supporting
documents.


TRAVEL TIME, SAFETY, ENERGY, AND AIR QUALITY IMPACTS
OF FLORIDA HIGH SPEED RAIL
Page - 15
METHODOLOGIES
In evaluating the overall transportation impacts of the HSR project, the research team
started with data on the overall travel markets and the forecasts of travel changes as a
result of the implementation of HSR. This information was used along with other estimates
of mode specific performance to determine estimates of overall travel benefits of HSR
implementation. Accordingly, this analysis is dependent on two distinct set of data, first,
that on ridership and, second, that on the mode specific performance characteristics such
as accident rates.
The analysis was carried out at an aggregate level for the high speed rail system.
Depending on the specific type of impact, generally 2010 was used as a reference year.
However, in most cases, cumulative impacts over the time frame of the analysis were
calculated. Several factors introduce uncertainty into the estimates. These uncertainties
could result in the impacts being greater or less significant than forecasted. Several of
these considerations are briefly discussed below.
Ridership Forecasts
As indicated earlier, this analysis is dependent on ridership forecasts carried out
independently of this study. The impacts of HSR are dependent not only on the total
forecasted ridership but also on the assumed prior mode of travelers and on the forecasted
geographic travel pattern. In general, differences in impacts are calculated by comparing
the forecasted performance to the conditions that would be expected to exist for the
travelers in the absence of the new mode. Thus, for example, the energy savings will be
calculated to be the change in energy consumption between HSR and auto for that
segment of the market forecasted to switch from auto.
Ridership is forecasted as being from three sources: shifted from auto, shifted from air
travel and induced (new travelers deciding to travel due to the new alternative). The
benefits to travelers are calculated for shifted travelers. Net impacts may be different; as,
for example, the energy savings for a shift of travelers from air to HSR may be partially
offset by the energy consumption of the new induced travel. In general, the estimated 24%
induced travel share will offset some of the energy, travel time, safety and air quality
impacts of the shifted travelers. Thus, not only might changes in the total ridership change

TRAVEL TIME, SAFETY, ENERGY, AND AIR QUALITY IMPACTS
OF FLORIDA HIGH SPEED RAIL
Page - 16
the forecasts, but changes in the prior mode could change the estimation of impacts.
Similarly, shifts in the geographic market could result in changes in the. The same number
of travelers allocated differently between short and long trips would change the estimate of
benefits. For example, if total ridership were the same but fewer trips were on the Tampa-
Orlando segment and more on the Miami-Orlando segment, one would expect larger
traveler benefits.
Finally, even subtle assumptions can have an affect on impact estimation. Do the travelers
that choose high speed rail come from autos with an average occupancy of 2.2 in 1992, the
average today for intercity travel in Florida, or is it more likely that they come
disproportionately from single occupant vehicles? As auto operating costs are spread over
more travelers in multi-occupant vehicles, one might be more inclined to see a greater shift
from single occupant vehicles. This would create larger energy and environmental benefits.
Unless otherwise noted, this analysis uses average conditions. As in the above case, these
assumptions will impact benefits estimates.
Technology Assumptions
The energy and air quality analyses assume energy consumption and pollutant production
characteristics expected to be applicable for a 2010 analysis year. For a project with an
extremely long life such as the one being analyzed, one might expect significant technology
changes to impact the actual performance of various modes over time. For example,
looking back 25 years one would see significant differences in automobile energy efficiency,
travel safety, and air pollution characteristics. It is very difficult to predict how rapidly
technology changes can be expected in the future and how well they will be accepted by
the marketplace. We may have a significant share of the auto fleet being powered by
hybrid or electric vehicles within the time period of the franchise agreement. Yet, pure
electric vehicles may not be in significant use for intercity travel for some time if ever.
A more exhaustive analysis looking at scenarios of the vehicle fleet characteristics in the
areas of energy consumption, safety and air quality might be able to provide a richer
understanding of the traveler benefits, particularly for more distant time periods where there
remains a great deal of uncertainty regarding modal performance.
Technology changes in the aircraft industry will also impact the comparative performance of

TRAVEL TIME, SAFETY, ENERGY, AND AIR QUALITY IMPACTS
OF FLORIDA HIGH SPEED RAIL
Page - 17
air travel over the next several decades. Energy efficiency, safety, and pollutant production
have also been changing rapidly for the air travel industry.
Modal Performance Assumptions
This analysis assumes average modal performance characteristics for both high speed rail
and the alternatives over the time period of analysis. For high speed rail, international
experience with the technology provides a high degree of confidence that the assumed
performance characteristics will be attained. However, for the air and auto modes the
actual in-service operating performance is very much subject to market demand and
operating conditions. Specifically, while we know today’s technologies performance
capabilities, the actual in-service performance is very much affected by the levels of
congestion that exist. Dramatic increases in travel time, cost, safety, energy and air quality
impacts can be expected if the travel market continues to have strong growth and is not
supported by new capital investment in capacity.
The assumptions used in this analysis are generally based on near term forecasts of
operating conditions. However, both roadway and airport congestion can have dramatic
impacts as each vehicle not only directly suffers the consequences of congestion but may
be resulting in significant congestion being realized by other vehicles. For example, if high
levels of airport congestion are allowed to develop, travel time, energy consumption, and
pollutant production would dramatically increase. As airspace reaches saturation, each new
flight may be producing impacts on travel time, energy use and pollution for several aircraft
in queue waiting to use the airport. This rapid deterioration in performance as facility
capacities are reached is not fully accounted for in this analysis and may be resulting in an
underestimation of the benefits of implementing HSR. To fully evaluate this situation would
require a detailed, context specific analysis of overall travel demand and capacity. Perhaps
simulation modeling of airport congestion and performance of critical roadway links could
provide a richer understanding of the importance of this issue. The extent to which the
public and private sectors respond to growing travel demand will impact the extent to which
critical congestion levels develop.


TRAVEL TIME, SAFETY, ENERGY, AND AIR QUALITY IMPACTS
OF FLORIDA HIGH SPEED RAIL
Page - 19
TRAVEL TIME IMPACTS
Time savings were estimated for those HSR passengers who will be diverted from auto and
air. The estimation assumed that roadway access time was the same across all modes.
The estimation accounted for the following differences among the modes:
C the difference in the total amount of time for line-haul travel between HSR and the
original mode of travel; and
C the difference in the total amount of terminal time between air and HSR. It was
assumed that terminal time for HSR is 18 minutes shorter per passenger trip than
air. This assumption is similar to that used in earlier ridership forecasting work. It is
expected that the terminal time would be less on high speed rail due to a number of
factors. Airports, by virtue of the fact that they serve a multitude of destinations are
much larger physically and require greater walking distances. In addition, luggage
handling, security, and ticketing all would be expected to take less time in a high
speed rail facility. Actual vehicle boarding would also be expected to be faster as it
would not be constrained to a single entry point and narrow aisles as in aircraft
boarding. With single train departures every half hour to hour, the proposed station
facilities should be able to efficiently process demand. The 18 minute savings would
occur partially at each end of the trip, though the greatest HSR time advantage
would be expected at the boarding end of the trip.
The distances of line-haul travel for all three modes were assumed to be the same as those
for HSR. Table 3 shows the distances between each station pair, based on information
provided by FOX. As HSR stations are located in close proximity to or at airports, access
time to the station/airport for air and rail trips would be expected to be very similar. In some
cases auto access trips may be faster as they would be more direct, not necessarily having
to access a central station point to begin an intercity trip. This access circuitry for air or
HSR would be a relatively modest share of total travel time for longer intercity trips but could
be more important for shorter trips.
The line-haul travel times (excluding terminal times) used in the estimation are shown
separately in Table 4 for auto, air, and HSR. For auto, an average speed of 60 miles per
hour was assumed. Posted speeds in much of the corridor are 70 MPH and typically

TRAVEL TIME, SAFETY, ENERGY, AND AIR QUALITY IMPACTS
OF FLORIDA HIGH SPEED RAIL
Page - 20
average free-flow freeway speeds would be a few miles above the posted speed for auto
travel.
Table 3. FOX Station-Pair Distance (miles)
Stations Miami LakelandFor West Palm Orlando OrlandoLauderdale Beach Airport Attractions
Tampa 319 286 227 84 73 32
Lakeland 287 255 196 52 37
OrlandoAttractions 246 214 155 11
OrlandoAirport 235 203 144
West PalmBeach 92 59
FortLauderdale 33
Source: FOX.
Urban parts of the corridor would have lower posted speeds and most probably slower
travel in peak periods. Over the life of the franchise one might expect increasing congestion
on at least urban parts of the roadway system. Currently I-4 between Tampa and Orlando
experiences congestion and delays on a regular basis. Additional capacity for this corridor
is currently under construction. Over the life of the HSR project other sections of the
corridors are likely to get congested at times and operate at lower speeds. If roadway
demands continue to outpace capacity expansion, auto speeds may be lower in coming
decades.
For air, current schedules for flights between the cities in the HSR corridor were used.
Shifts to small jets as replacement for turboprop aircraft may sightly speed air travel in-flight
time, however, growing airport delays may offset that change. Airport congestion is
predicted to change significantly over the coming years and could result in slower overall air
travel times. Increased airport security measures could also impact air travel times by
increasing terminal times.
Line-haul travel times for high speed rail were from the FOX Proposal.

TRAVEL TIME, SAFETY, ENERGY, AND AIR QUALITY IMPACTS
OF FLORIDA HIGH SPEED RAIL
Page - 21
These travel time differences are then multiplied by the corridor specific travel forecasts.
The results of these calculations are shown in Table 5.
Table 4. Line-Haul Travel Times (minutes)
Stations Mode Mia
mi
For
tLa
uder
dale
Wes
t Pal
m
Bea
ch
Orla
ndo
Airp
ort
Orla
ndo
Attr
actio
ns
Lake
land
Tampa Air 80 70 60 40 - 30
Auto 319 286 227 84 73 32
FOX 145 132 113 55 37 18
Lakeland
Auto 287 255 196 52 37
Air 80 70 60 40 -
FOX 125 112 93 35 17
Orlando Air - - - -Attractions
Auto 246 214 155 11
FOX 103 90 71 13
Orlando Airport
Auto 235 203 144
Air 70 60 50
FOX 85 72 53
West Palm Beach
Auto 92 59
Air 20 10
FOX 44 23
Fort Lauderdale
Auto 33
Air 20
FOX 17
Source: FOX, CEFA, and CUTR.

TRAVEL TIME, SAFETY, ENERGY, AND AIR QUALITY IMPACTS
OF FLORIDA HIGH SPEED RAIL
Page - 22
Table 5. Travel Time Savings
Type of Impacts Annual Impacts Cumulative Impactsfor 2004-2043 for 2004-2043
Hours Saved for HSR Users from Air (millions) -0.5 -20.5
Hours Saved for HSR Users from Auto (millions) 4.3 173.8
Total Hours Saved for HSR Users (millions) 3.8 153.3
Source: CEFA and CUTR.

TRAVEL TIME, SAFETY, ENERGY, AND AIR QUALITY IMPACTS
OF FLORIDA HIGH SPEED RAIL
Page - 23
SAFETY IMPACTS
Reduction in the number of fatalities, injuries, and accidents was estimated for those HSR
passengers who would be diverted from auto and air. This analysis evaluated the safety
consequences of the HSR investment. It did not evaluate the relative merits of HSR in
improving safety compared to other transportation investments.
The estimation was based on information on fatality, injury, and accident rates per
passenger mile for each mode and the amount of passenger miles that are projected to be
diverted from auto and air. The fatality, injury, and accident rates used in this analysis are
shown in Table 6. HSR was assumed to be free of any fatalities, injuries, or accidents,
based on operating experiences in Japan and Europe in the last 15 years.
Table 6. Fatality, Injury, and Accident Rates for Auto, Air, and HSR
Auto Air HSR
Fatalities per Billion Passenger Miles 10 0.1958 0
Injuries per Billion Passenger Miles 1,766 0.0545 0
Accidents per Billion Passenger Miles 1,807 0.0783 0
Source: Tables 7 and 8; FOX, and Florida Department of Highway Safety and Motor Vehicles, 1995
Florida Traffic Crash Facts.
Information on fatality, injury, and accident rates for auto was from Florida Department of
Highway Safety and Motor Vehicles (FDHSMV)’s Florida Traffic Crash Facts, 1995. The
Department reported that there were 2,847 fatalities, 233,900 “non-fatal injuries,” and
228,589 crashes on Florida’s highways in 1995 and estimated a fatality rate of 2.2 per 100-
million vehicle miles of travel. This fatality rate and the total number of fatalities were used
in this analysis to estimate the total mount of vehicle travel, which in turn was used to
estimate injury and accident rates per vehicle mile for auto. These rates were then
converted into rates per passenger mile by using an occupancy rate of 2.2. persons per
vehicle for intercity travel. This auto occupancy rate was based on FDOT’s Florida High
Speed and Intercity Rail Market and Ridership Study.

TRAVEL TIME, SAFETY, ENERGY, AND AIR QUALITY IMPACTS
OF FLORIDA HIGH SPEED RAIL
Page - 24
Information on fatality, injury, and accident rates for air was derived from the Web site of the
National Transportation Safety Board (NTSB) and the 1996 U.S. Statistical Abstract. Since
the numbers of fatalities, injuries, or accidents vary significantly over time for air travel, this
analysis used average rates over the period 1990-1994. Also, only scheduled services
were considered in the rates because information on passenger miles is not readily
available for non-scheduled services.
Table 7 shows the number of passenger fatalities, serious injuries, and accidents by year
and type of services (U.S. Air Carriers versus Commuter Air Carriers). Table 8 shows the
amount of travel by year and type of services.
Table 7. Fatalities, Serious Injuries, and Accidents for U.S. Scheduled Air Services
Passenger Fatalities Serious Injuries Accidents
U.S. Carrier Commuter U.S. Carrier Commuter U.S. Carrier Commuter
1990 8 7 23 11 22 16
1991 40 99 19 30 25 22
1992 26 21 14 5 16 23
1993 0 24 7 2 22 16
1994 228 25 16 6 19 10
Total 302 176 79 54 104 87
Source NTSB NTSB NTSB US Abstract NTSB NTSBTable 3 Table 8 Table 3 No. 989 Table 6 Table 8
Source: National Transportation Safety Board, Aviation Accident Statistics and the 1996 U.S.
Statistical Abstract. Table numbers are shown at the bottom row of the table.
TRAVEL TIME, SAFETY, ENERGY, AND AIR QUALITY IMPACTS
OF FLORIDA HIGH SPEED RAIL
Page - 25
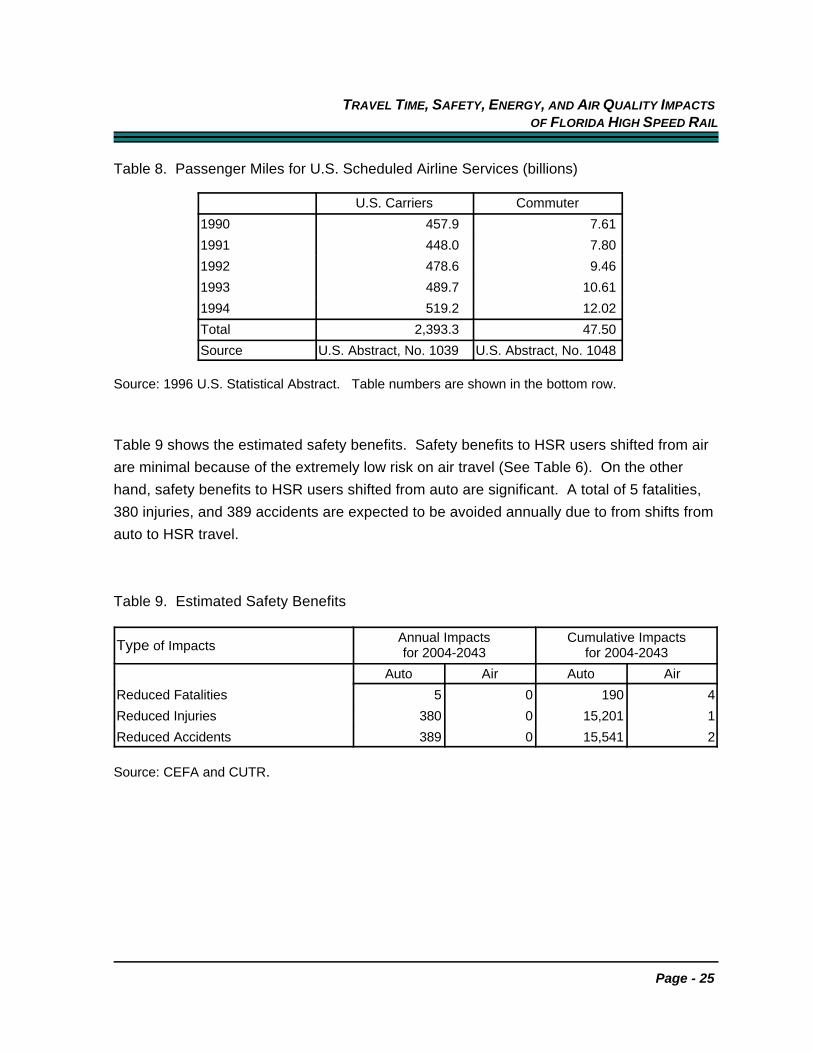
Table 8. Passenger Miles for U.S. Scheduled Airline Services (billions)
U.S. Carriers Commuter
1990 457.9 7.61
1991 448.0 7.80
1992 478.6 9.46
1993 489.7 10.61
1994 519.2 12.02
Total 2,393.3 47.50
Source U.S. Abstract, No. 1039 U.S. Abstract, No. 1048
Source: 1996 U.S. Statistical Abstract. Table numbers are shown in the bottom row.
Table 9 shows the estimated safety benefits. Safety benefits to HSR users shifted from air
are minimal because of the extremely low risk on air travel (See Table 6). On the other
hand, safety benefits to HSR users shifted from auto are significant. A total of 5 fatalities,
380 injuries, and 389 accidents are expected to be avoided annually due to from shifts from
auto to HSR travel.
Table 9. Estimated Safety Benefits
Type of ImpactsAnnual Impacts Cumulative Impactsfor 2004-2043 for 2004-2043
Auto Air Auto Air
Reduced Fatalities 5 0 190 4
Reduced Injuries 380 0 15,201 1
Reduced Accidents 389 0 15,541 2
Source: CEFA and CUTR.


AF 'Pair
Oair
TRAVEL TIME, SAFETY, ENERGY, AND AIR QUALITY IMPACTS
OF FLORIDA HIGH SPEED RAIL
Page - 27
(1)
REDUCTIONS IN AIRCRAFT FLIGHTS AND AUTOMOBILE TRIPS
The diversion of travelers from air and highway modes to the FHSR will reduce the number
of aircraft flights and automobile trips in the corridor. Table 10 shows the estimated
reductions in aircraft flights and automobile trips. Figures 7 and 8 show the reductions over
time for aircraft flights and automobile trips, respectively.
Table 10. Reductions in Aircraft Flights and Automobile Trips
Mode Annual for 2004-2043 Cumulative for 2004-2043
Aircrafts Flights (thousands) 61 2,433
Automobile Trips (thousands) 1,473 58,923
Source: CEFA and CUTR.
Annual reduction in aircraft flights because of diversion of passengers to the FHSR was
computed as follows:
where
AF = annual reduction in the number of aircraft flown
P = annual air passengers diverted to the FHSRair
O = average number of passengers per aircraftair
For example, the FHSR was projected to divert 1.5 million passengers from air in 2010.
This diversion translates to a reduction of about 30 aircrafts, assuming an occupancy level
of 32 passengers per aircraft. The level of aircraft occupancy of 32 passengers was based
on an average load factor of 63 percent and an average seating capacity of 50 for flights
between cities in the FHSR corridor.

0
20
40
60
80
Year
Airc
rafit
Flig
hts
(in th
ousa
nds)
2004 2010 2016 2022 2028 2034 2040
0
500
1000
1500
2000
Year
Aut
omob
ile T
rips
(in th
ousa
nds)
2004 2010 2016 2022 2028 2034 2040
TRAVEL TIME, SAFETY, ENERGY, AND AIR QUALITY IMPACTS
OF FLORIDA HIGH SPEED RAIL
Page - 28
Figure 7. Reduction in Aircraft Flights
Source: CEFA and CUTR.
Figure 8. Reduction in Automobile Trips.
Source: CEFA and CUTR.
AT 'VMTauto
Lauto
TRAVEL TIME, SAFETY, ENERGY, AND AIR QUALITY IMPACTS
OF FLORIDA HIGH SPEED RAIL
Page - 29
(2)
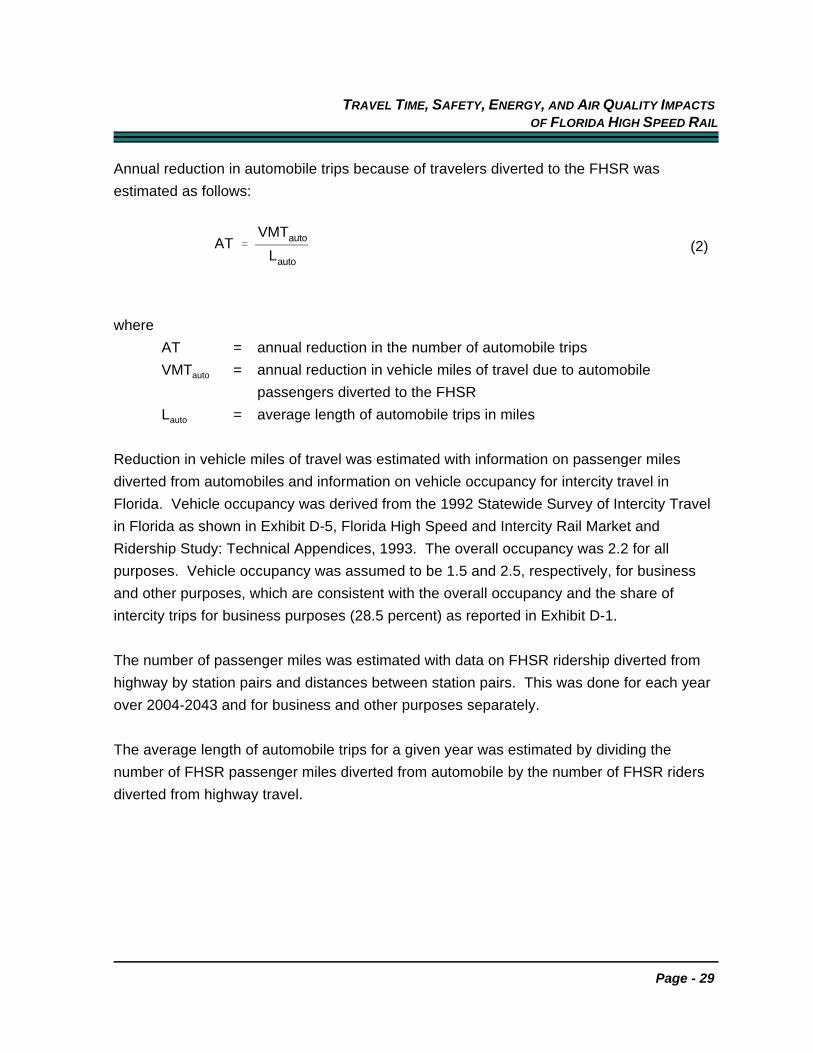
Annual reduction in automobile trips because of travelers diverted to the FHSR was
estimated as follows:
where
AT = annual reduction in the number of automobile trips
VMT = annual reduction in vehicle miles of travel due to automobileauto
passengers diverted to the FHSR
L = average length of automobile trips in milesauto
Reduction in vehicle miles of travel was estimated with information on passenger miles
diverted from automobiles and information on vehicle occupancy for intercity travel in
Florida. Vehicle occupancy was derived from the 1992 Statewide Survey of Intercity Travel
in Florida as shown in Exhibit D-5, Florida High Speed and Intercity Rail Market and
Ridership Study: Technical Appendices, 1993. The overall occupancy was 2.2 for all
purposes. Vehicle occupancy was assumed to be 1.5 and 2.5, respectively, for business
and other purposes, which are consistent with the overall occupancy and the share of
intercity trips for business purposes (28.5 percent) as reported in Exhibit D-1.
The number of passenger miles was estimated with data on FHSR ridership diverted from
highway by station pairs and distances between station pairs. This was done for each year
over 2004-2043 and for business and other purposes separately.
The average length of automobile trips for a given year was estimated by dividing the
number of FHSR passenger miles diverted from automobile by the number of FHSR riders
diverted from highway travel.


TRAVEL TIME, SAFETY, ENERGY, AND AIR QUALITY IMPACTS
OF FLORIDA HIGH SPEED RAIL
Page - 31
ENERGY IMPACTS
The energy efficiency of the automobile fleet is generally expected to continue to improve
as new more efficient vehicles replace existing stock across the U.S. This analysis
assumes a general 25% gain in the Florida general automobile fleet stock efficiency over
the 2010 to 2035 time period with the retirement and replacement of older models with the
new more efficient automobiles.
The FOX-TGV HSR energy consumption estimates were derived from the FOX Florida High
Speed Rail Application. The Florida airplane energy efficiency is derived from the Florida
Miami-Orlando-Tampa air carrier corridor specific information sources. These and other
pertinent transportation modeling information were derived from widely accepted industry
standards employing consistent and relatively conservative assumptions. The respective
average energy efficiencies for each mode are identified in Table 11.
Table 11. Transportation Mode Energy Efficiencies
Transportation Mode Year Energy Consumption Rate(Btus/Passenger-mile)
Auto2010 3,125
2035 2,344
Aircraft2010 5,446
2035 5,446
FOX-TGV HSR2010 1,813
2035 1,813
Source: CEFA and CUTR.
Table 12 provides a profile of the energy, gasoline, and total fossil fuel savings for
passengers diverted to HSR from the automobile and air transportation modes in Florida in
2010 and 2035. Over 1.67 trillion BTUs of energy will be saved across the corridor due to
these mode switches in 2010; and 2.11 trillion BTUs will be saved in 2035. On average this
is equivalent to 3.5 gallons of gasoline for each diverted passenger in 2010 and 3.0 gallons
in 2035. Since the diversion of travel is to electric energy presently generated by coal and

TRAVEL TIME, SAFETY, ENERGY, AND AIR QUALITY IMPACTS
OF FLORIDA HIGH SPEED RAIL
Page - 32
nuclear powered plants, even greater net savings of petroleum based fuel is realized from
these diversions since auto and air are exclusively fueled by petroleum based fuels. Over
386 thousand barrels of oil in 2010 and 506 thousand barrels in 2035 will be saved by
diverting these passengers from auto and air to HSR travel in Florida. Much of this oil is
imported. To the extent these fuels are imported, the U.S. balance of payments will be
reduced by these fuel substitution effects.
Table 12. Energy Savings from Diverting Auto and Air Passengers to the FOX-HSR
2010 2035
Total TotalAverage Per Average PerPassenger Passenger
Gross Transport BTUs Saved (mil.) 1,674,333 0.36 2,111,274 0.29
Gallons of Gasoline Saved 16,277,155 3.5 21,252,253 3.0
Barrels of Oil Saved 386,361 0.083 506,006 0.070
Source: CEFA and CUTR.

TRAVEL TIME, SAFETY, ENERGY, AND AIR QUALITY IMPACTS
OF FLORIDA HIGH SPEED RAIL
Page - 33
AIR QUALITY IMPACTS
The air quality impacts from the implementation of the FOX high speed rail are calculated in
a manner similar to the other benefits estimates. The relative energy efficiencies of the
modes are applied to the diverted traffic volumes to determine the savings associated with
the shifts in mode.
Table 13 summarizes emissions savings from introduction of the FOX-HSR for the years
2010 and 2035. The largest single category of emission reductions would be for carbon
dioxide, with over 134,918 and 218,410 tons saved in 2010 and 2035 from auto and air
passengers diverting to the HSR mode. The second largest reductions come from declines
in carbon monoxide, with 21,625 and 35,006 tons saved in 2010 and 2035, respectively.
The third largest savings comes from reductions in hydrocarbons, with 14,091 and 22,814
tons of annual emissions eliminated in 2010 and 2035 due to these modal shifts. Fourth,
nitrogen oxides reductions would equal 770 and 1,246 tons in 2010 and 2035. An
additional 101 and 164 tons of particulate matter and 38 and 62 tons of tire wear particles
would be removed in 2010 and 2035 through introducing the FOX-HSR system.
Table 13. Net Reductions in Air Quality Pollutants (tons)
Year Pollutant Auto Air Total FHSR Net
2010
Carbon Dioxide (CO2) 69,658 65,260 134,918 41,257 93,661
Carbon Monoxide (CO) 4,414 17,220 21,634 9 21,625
Hydrocarbons (HC) 595 13,499 14,094 1 14,093
Nitrogen Oxides (NOx) 307 654 961 191 770
Particulate Matter (PM) 37 97 134 33 101
Sulfur Dioxide (SO2) 25 145 170 287 (117)
Tire Wear Matter 38 38 38
Totals 75,074 96,875 171,949 41,778 130,171
2035
Carbon Dioxide (CO2) 112,765 105,645 218,410 66,789 151,621
Carbon Monoxide (CO) 7,145 27,876 35,021 15 35,006
Hydrocarbons (HC) 963 21,853 22,816 2 22,814
Nitrogen Oxides (NOx) 497 1,058 1,555 309 1,246
Particulate Matter (PM) 61 157 218 54 164
Sulfur Dioxide (SO2) 40 235 275 465 (190)
Tire Wear Matter 62 62 62
Totals 121,533 156,824 278,357 67,634 210,723
Source: CEFA and CUTR.

TRAVEL TIME, SAFETY, ENERGY, AND AIR QUALITY IMPACTS
OF FLORIDA HIGH SPEED RAIL
Page - 34
Finally, since power plant fuel sources typically employ higher sulfur content than auto and
aircraft fuels total sulfur emissions are increased by 123 tons per year while the sulfuric acid
component of sulfur emissions decline by 4 tons in 2010.
Electrical Power Generation for HSR
The potential environmental and energy benefits from introduction of the HSR mode owe
their existence to the use of relatively clean stationary sources of energy production.
Electric power plants use diverse fuel source mixes to produce efficient energy and can
employ and manage large and efficient emission control technologies. This results in
substantial improvements in air pollution emissions over conventional mobile transportation
technologies in all but one regulated pollutant. Across the central and south Florida
peninsula 15.4% of electrical generation is from nuclear sources (virtually no air pollution)
while 32% is from coal (all with regulated or controlled emissions). The remainder is from oil
and natural gas (relatively modest comparative emissions). All power plant emissions used
in this analysis are derived from a weighted average from the actual 1995 per megawatt
hour emissions levels. A unique MWH emission factor was calculated for the five principal
pollutants reported on in the Florida Department of Environmental Protection (FDEP) and
Environmental Protection Agency (EPA) air emission inventory. They are Volatile Organic
Compounds (VOC), Sulfur Dioxide (SO2), Nitrogen Oxides (NOx), Particulate Matter (PM),
and Carbon Monoxide (CO). Carbon Dioxide (CO2) was separately calculated from
separate research by the Oak Ridge National Laboratory.
Finally the average emissions per megawatt hour for each pollutant for all of the power
plants in operation in Central and South Florida were calculated for 1995 from the 1997 Air
Pollutant Information Systems Facility Emission Report, Florida Department of
Environmental Protection. A summary of those emission rates is provided in Table 14 with
the detailed emissions data available in Appendix A. The FOX-HSR energy demands
required to transport projected 2010 and 2035 ridership were then estimated. Comparisons
between emissions and energy consumption for each mode were completed for all travelers
diverted to the HSR mode from air and auto, and the net differences were calculated to
yield net emissions and energy consumption reductions for that year.

TRAVEL TIME, SAFETY, ENERGY, AND AIR QUALITY IMPACTS
OF FLORIDA HIGH SPEED RAIL
Page - 35
Table 14. Power Plant Emission Factors, 1995
Pollution HydrocarbonsCategory (HC)
Carbon Nitrogen Sulfur ParticulateMonoxide Oxides Dioxide Matters
(CO) (NO ) (SO2) (PM)x
Tons per MWH 0.01 0.29 1.89 2.84 0.33
Source: Calculated from data in FDEP’s 1997 Air Pollutant Information Systems Facility Emission
Report.
Auto Emissions
Table 15 provides USEPA emission factors used to generate automobile related emissions
from passengers diverted from automobile to the HSR system. The number of passengers
diverted from auto to HSR in 2010 assumes a weighted average occupancy of 2.2
passengers per vehicle. These occupancies were used along with average estimated
passenger trip length provided by system ridership models.
Table 15. Automobile Emission Factors
Pollution HydrocarbonsCategory (HC)
Carbon Nitrogen Sulfur Particulate CarbonMonoxide Oxides Dioxide Matters Dioxide
(CO) (NO ) (SO2) (PM) (CO )x 2
Grams pervehicle mile 3.1 23 1.6 0.13 0.195 363
Source: USEPA, 1995 Annual Emissions and Fuel Consumption for an “Average” Passenger Car.
Aircraft
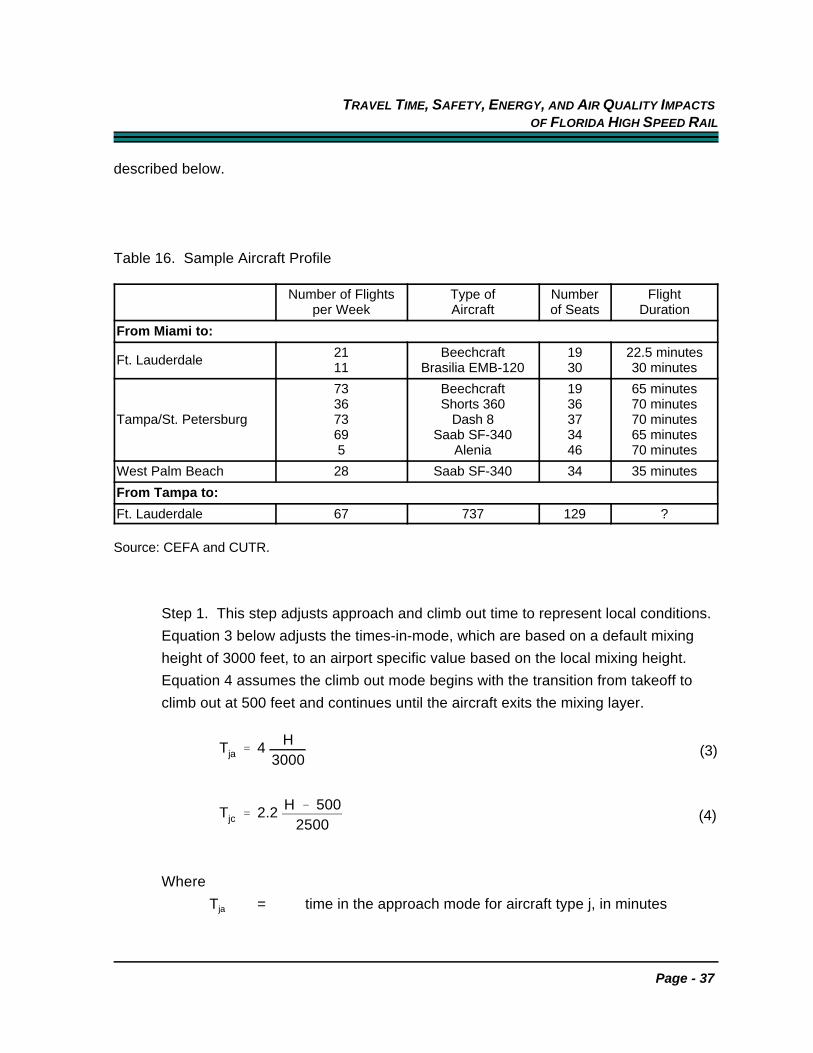
A comparable analysis was generated for the air travel mode. The current and likely future
fleet profile of aircraft transporting passengers between the Ft. Lauderdale, Miami, Orlando,
and Tampa airports was obtained from the Web site of the airports in the corridor. Figure 9
provides a profile of the size and cumulative percent of aircraft currently originating in

0 2 0 4 0 6 0 8 0 1 0 0 1 2 0 1 4 0 1 6 0 1 8 0 2 0 0 2 2 0 2 4 0 2 6 00 %
2 0 %
4 0 %
6 0 %
8 0 %
1 0 0 %
A i r c r a ft S e a t ing C a p a c i ty
TRAVEL TIME, SAFETY, ENERGY, AND AIR QUALITY IMPACTS
OF FLORIDA HIGH SPEED RAIL
Page - 36
Orlando flying to each of the other urban areas in the corridor. This profile includes both
direct and through aircraft flights. Over 80% of the existing aircraft operating in these
Figure 9. Cumulative Distribution of Aircraft by Number of Seats, Orlando InternationalAirport, 1997
Source: Appendix B.
corridors are under 50 seats. An even larger percentage of the direct flights falls in the
range of 19 to 30 seats. Aircraft are typically Beechcraft (19 seats), Brasilia EMB-120 (30
seats), Dash 8 (37 seats) and so forth. Table 16 contains a sample profile of the aircraft
operating in these corridors. Appendix B provides more detailed information on aircraft and
flight schedules for the Orlando International Airport.
The method used to estimate aircraft emissions was complicated by the different mixes of
commuter aircraft operating within the Miami, Orlando, Tampa corridor. The methodology
followed the recommendations in USEPA’s Procedures for Emission Inventory Preparation.
A standard 50 seat commuter aircraft was used with engines and related emission and fuel
consumption data derived from the USEPA procedures. The estimation involved three step
Tja ' 4 H3000
Tjc ' 2.2 H & 5002500
TRAVEL TIME, SAFETY, ENERGY, AND AIR QUALITY IMPACTS
OF FLORIDA HIGH SPEED RAIL
Page - 37
(3)
(4)
described below.
Table 16. Sample Aircraft Profile
Number of Flights Type of Number Flightper Week Aircraft of Seats Duration
From Miami to:
Ft. Lauderdale 21 Beechcraft 19 22.5 minutes11 Brasilia EMB-120 30 30 minutes
Tampa/St. Petersburg 73 Dash 8 37 70 minutes
73 Beechcraft 19 65 minutes36 Shorts 360 36 70 minutes
69 Saab SF-340 34 65 minutes5 Alenia 46 70 minutes
West Palm Beach 28 Saab SF-340 34 35 minutes
From Tampa to:
Ft. Lauderdale 67 737 129 ?
Source: CEFA and CUTR.
Step 1. This step adjusts approach and climb out time to represent local conditions.
Equation 3 below adjusts the times-in-mode, which are based on a default mixing
height of 3000 feet, to an airport specific value based on the local mixing height.
Equation 4 assumes the climb out mode begins with the transition from takeoff to
climb out at 500 feet and continues until the aircraft exits the mixing layer.
Where
T = time in the approach mode for aircraft type j, in minutesja

Eij ' jk
Tjk
FFjk
1000EIijk Nj
TEi ' jj
Eij LTOj
TRAVEL TIME, SAFETY, ENERGY, AND AIR QUALITY IMPACTS
OF FLORIDA HIGH SPEED RAIL
Page - 38
(5)
(6)
T = time in the climb out mode for commercial aircraft type j, injc
minutes
H = mixing height for time and region of interest
Step 2. This step calculates emissions for each aircraft type with equation (5) below.
where
j = mode (idle, take off, climb out, or approach)
E = emissions of pollutant i, in pounds, produced by aircraft type jij
for one LTO cycle
T = time in mode for mode k, in minutes, for aircraft type jjk
FF = fuel flow for mode k, in pounds per minute, for each enginejk
used on aircraft type j (See Table 17)
EI = emission index for pollutant i, in pounds of pollutant per oneijk
thousand pounds of fuel, in mode k for aircraft type j (See
Table 17)
N = number of engines used on aircraft type j
Step 3. This step calculates total emissions for all commercial aircraft as follows:
where
TE = total emissions of pollutant i, in pounds, produced by alli

TRAVEL TIME, SAFETY, ENERGY, AND AIR QUALITY IMPACTS
OF FLORIDA HIGH SPEED RAIL
Page - 39
commercial aircraft operating in the region of interest (where j
covers the range of commercial aircraft operating in the area)
LTO = total number of LTO cycles for aircraft type j, during thej
inventory period (annual data available from Airport Activity
Statistics of Certificated Route Air Carriers
The final step in this emissions and energy modal comparison was to calculate total
emissions for the “standard” commuter aircraft type and to sum them for total aircraft
emissions in the corridor using an industry wide 63% capacity factor.
Table 17. Aircraft Fuel Rate and Emission Factors
Idle Take Off Climb Out Approach
Fuel Rates
(LBS/hour Operation) 1.92 7.08 6.67 3.58
Emissions Rates (LBS Emissions/1000 LBS Fuel)
Carbon Monoxide (CO) 64.00 1.01 1.20 23.02
Nitrogen Oxide (NOx) 2.43 7.81 7.00 8.37
Total Hydrocarbon (HC) 50.17 0.50 0.50 2.19
Sulfur Oxides (SOx) 0.54 0.54 0.54 0.54
Particulate (PM) 0.36 3.70 2.60 1.50
Source: Table 5-4 Modal Emissions Rates - Civil Aircraft Engines - Typical Duration For Civil PT6A-
27 P&WC P.2-73 -2/80, Procedures for Emission Inventory Preparation, Vol. IV: Mobile Sources,
USEPA, 1996.
Table 18 provides a summary of all emission reductions and estimates of savings per
passenger for 2010 and 2035. These estimates indicate that the average passenger would
reduce their automobile and airplane pollution loadings into the Florida atmosphere by 56 to
58 pounds per trip between 2010 and 2035 if the FOX-HSR project were in operation.
Table 18. Emissions Savings Summary

Total EmissionDifferences
2010 2035
Total Per Passenger Total Per Passenger
Pounds 261,996,000 56 421,448,000 58
Tons 130,998 0.028 210,724 0.029
Source: CEFA and CUTR.

TRAVEL TIME, SAFETY, ENERGY, AND AIR QUALITY IMPACTS
OF FLORIDA HIGH SPEED RAIL
Page - 41
REFERENCES
Allport, Roger J. and Mark B. Brown. “The Economic Benefits of the European High Speed
Rail Network.” Preprint. Transportation Research Board. 72nd Annual Meeting. January
10-14, 1993. Washington, D.C.
American Association of State Highway and Transportation Officials (AASHTO). “A Manual
on User Benefit Analysis of Highway and Bus-Transit Improvements 1977.” Washington,
D.C.: AASHTO, 1978.
Ben-Akiva, Moshe, and Steven R. Lerman, “Discrete Choice Analysis: Theory and
Application to Travel Demand.” Boston: MIT Press, 1985.
Brand et al., “Estimating User Benefits for High Speed Ground Transportation Systems.”
Compendium of Technical Papers, 64th ITE Annual Meeting, October, 1994.
Bureau of Transportation Statistics. “High-Speed Ground Transportation for America.” U.S.
Department of Transportation. [http://www.bts.gov]. August, 1996.
Bureau of Transportation Statistics. Procedures for Emission Inventory Preparation.
Volume IV: Mobile Sources. [http://www.bts.gov/NTL/DOCS]. 1996.
Center for Urban Transportation Research. “An Analysis of the Economic Impacts of Urban
Transit Systems on Florida’s Economy.” Report prepared for the Florida Department of
Transportation and the Florida Transit Association. 1997.
Center for Economic Forecasting and Analysis and Center for Urban Transportation
Research. “Potential Statewide Impacts of Florida’s Proposed High Speed Rail System.”
Working Report, Florida Department of Transportation. October, 1991.
Department of Environmental Protection. “Facility Emission Report.” Tallahassee: Public
Service Commission, 1996.
Economic Research Associates. “Economic Impact and Benefit/Cost of High Speed Rail for
California.” California Intercity High Speed Rail Commission. August, 1996.

TRAVEL TIME, SAFETY, ENERGY, AND AIR QUALITY IMPACTS
OF FLORIDA HIGH SPEED RAIL
Page - 42
ECONorthwest, “Benefit-Cost of RTA Plan.” Working Report. Washington Research
Council. 1996.
Florida Department of Environmental Protection, Division of Air Resources Management.
“Air Pollutant Information Systems Facility Emission Report.” 1997
Florida Department of Transportation. “The Florida Aviation System Plan Statewide
Summary 1992-2010.” Executive Summary.
Florida Department of Transportation and Florida Overland eXpress. Pre-Certification Post-
Franchise Agreement. November 12, 1996.
Florida Department of Transportation. “Florida High Speed and Intercity Rail Market and
Ridership Study.” Working Report. July, 1993.
Florida Overland eXpress (FOX). “Florida High Speed Transportation System.” Volume 1.
Working Report, Florida Department of Transportation, High Speed Transportation
Program. October, 1995.
Florida Overland EXpress (FOX). “Florida High Speed Transportation System.” Volume 2.
Working Report, Florida Department of Transportation, High Speed Transportation
Program. October, 1995.
Floyd, Susan S., 1996 Florida Statistical Abstract. 13th edition. Gainesville, FL: University
of Florida. 1996.
Greene, David L. Transportation and Energy. Lansdowne, VA: Eno Transportation
Foundation, Inc. 1996.
Greenwood, Michael J. et al., “Migration, Regional Equilibrium, and the Estimation of
Compensating Differentials.” American Economic Review. Volume 81, number 5.
December, 1991. p.1382-1390.
Levinson, David et al., “The Full Cost of Intercity Transportation - A Comparison of High
Speed Rail, Air and Highway Transportation in California.” Berkeley: Institute of

TRAVEL TIME, SAFETY, ENERGY, AND AIR QUALITY IMPACTS
OF FLORIDA HIGH SPEED RAIL
Page - 43
Transportation Studies, University of California at Berkeley. June, 1996.
Lieu, S. And George Treyz. “Estimating the Economic and Demographic Effects of an Air
Quality Management Plan: The Case of Southern California.” Environment and Planning.
Volume 24, number 12. December, 1992. p. 1799-1811.
Lynch, T.A. “Energy-Related, Environmental, and Economic Benefits of Florida’s High-
Speed Rail and Maglev Systems Proposals.” Transportation Research Record 1255,
Washington, D.C.: Transportation Research Board, National Research Council, 1990.
Lynch, T.A. “The Economics and Financing of High Speed Rail and Maglev Systems in
Europe: An Assessment of Financing Methods and Results with the Growing Importance of
Public and Private Partnerships and Implications for the U.S.” Center for Economic
Forecasting and Analysis, Tallahassee: Florida State University. March, 1995.
National Research Council. “Environmental Issues: Noise, Rail Noise, and High Speed
Rail.” Transportation Research Record 1143, Washington, D.C.: Transportation Research
Board. 1988.
“Policy Analysis Applications of REMI Economic Forecasting and Simulation Models.”
International Journal of Public Administration. 1993.
Regional Economic Models, Inc. Operator’s Manual for a Multi-Region EDFS-53 Forecasting
and Simulation Model. Volume 2. Amherst, MA: Regional Economic Models, Inc. July,
1996.
Rickman, Dan S., “Alternative Labor Market Closures in a Regional Forecasting and
Simulation Model.” Growth and Change. Volume 24, number 1. Winter, 1993. p. 32-50.
Rickman, Dan S., et al., “Multiregional Stock Adjustment Equations of Residential and
Nonresidential Investment.” Journal of Regional Science. Volume 33, number 2, May, 1993.
p. 207-219.
Shao, Gang, “Building U.S. National and Regional Forecasting and Simulation Models.”
Economics Systems Research. Volume 5, number 1. 1993. p. 63-77.
TRAVEL TIME, SAFETY, ENERGY, AND AIR QUALITY IMPACTS
OF FLORIDA HIGH SPEED RAIL
Page - 44
Small, Kenneth A., and Harvey S. Rosen, “Applied Welfare Economics with Discrete Choice
Models.” Econometrica, 49, 1981, pp. 105-130).
Thompson, Chris and Tim Bawden, “What Are the Potential Economic Development
Impacts of High Speed Rail?” Economic Development Quarterly. Volume 6, Number 3,
August 1992, p.297.
Treyz, George I. et al., “The Dynamics of U.S. Internal Migration.” The Review of Economic
and Statistics. Volume 75, number 2. May, 1993. p. 209-214.
Treyz, George. “The Employment Sector of a Regional Policy Simulation Model.” The
Review of Economics and Statistics. 1980.
Treyz, George. “Prediction the Economic Effects of State Policy Initiatives.” Growth and
Change. Volume 12, number 2. April, 1981. p. 2-9.
Treyz, George I., “Regional Economic Modeling: A Systematic Approach to Economic
Forecasting and Policy Analysis.” Norwell: Kluwer Academic Publisher, 1993. p.506.
Treyz, George. “The REMI Economic-Demographic Forecasting and Simulation Model.”
International Regional Science Review. Volume 14, number 3. 1992. p. 221-253.
U.S. Department of Energy. “Carbon Dioxide and Climate.” Working Glossary. Oak Ridge,
TN: Oak Ridge National Laboratory. 1987.
U.S. Environmental Protection Agency. Compilation of Air Pollution Emission Factors.
Volume II: Mobile Sources, AP-42, Ann Arbor, MI: September, 1985.
U.S. Environmental Protection Agency. Annual Emissions and Fuel Consumption for an
“Average” Passenger Car. Oak Ridge, TN: Oak Ridge National Laboratory. 1995.
Vickerman, Roger. “The Economic Impact of High Speed Rail.” Transit Economics.
September/October 1996. pp. 63-70.

TRAVEL TIME, SAFETY, ENERGY, AND AIR QUALITY IMPACTS
OF FLORIDA HIGH SPEED RAIL
Page - 45

TRAVEL TIME, SAFETY, ENERGY, AND AIR QUALITY IMPACTS
OF FLORIDA HIGH SPEED RAIL
A - 1
APPENDIX A
Florida Power Plant Emissions, 1995

TRAVEL TIME, SAFETY, ENERGY, AND AIR QUALITY IMPACTS
OF FLORIDA HIGH SPEED RAIL
A - 2
Table A-1. Carbon Monoxide (CO)
Facility ID Site Name Emissions Unit Description MW Ton/YearOwner/Company
Rating710002 TECO HOOKERS POINT STATION UNIT #1 B+W FRONT FIRING OIL-FIRED BOILER 33 7.30710002 TECO HOOKERS POINT STATION UNIT #2-B & W FRONT FIRING OIL FIRED BOILER 34 5.01710002 TECO HOOKERS POINT STATION UNIT #3-B & W FRONT FIRING OIL FIRED BOILER 34 4.55710002 TECO HOOKERS POINT STATION 47 MW #6 OIL FIRED STEAM GENERATOR #5 47 2.13710002 TECO HOOKERS POINT STATION UNIT #4- B & W FRONT-FIRED OIL FIRED BOILER 49 5.30570039 FLORIDA POWER & LIGHT COMPANY FT MYERS POWER PLANT COMBUSTION TURBINE #1 63 0.50570039 FLORIDA POWER & LIGHT COMPANY FT MYERS POWER PLANT COMBUSTION TURBINE #10. 63 MW. 63 0.50570039 FLORIDA POWER & LIGHT COMPANY FT MYERS POWER PLANT COMBUSTION TURBINE #11. 63 MW. 63 0.50570039 FLORIDA POWER & LIGHT COMPANY FT MYERS POWER PLANT COMBUSTION TURBINE #12. 63 MW. 63 0.50570039 FLORIDA POWER & LIGHT COMPANY FT MYERS POWER PLANT COMBUSTION TURBINE #2. 63 MW. 63 0.50570039 FLORIDA POWER & LIGHT COMPANY FT MYERS POWER PLANT COMBUSTION TURBINE #3. 63 MW. 63 0.50570039 FLORIDA POWER & LIGHT COMPANY FT MYERS POWER PLANT COMBUSTION TURBINE #4. 63 MW. 63 0.50 570039 FLORIDA POWER & LIGHT COMPANY FT MYERS POWER PLANT COMBUSTION TURBINE #5. 63 MW. 63 0.50570039 FLORIDA POWER & LIGHT COMPANY FT MYERS POWER PLANT COMBUSTION TURBINE #6. 63 MW. 63 0.50570039 FLORIDA POWER & LIGHT COMPANY FT MYERS POWER PLANT COMBUSTION TURBINE #7. 63 MW. 63 0.50570039 FLORIDA POWER & LIGHT COMPANY FT MYERS POWER PLANT COMBUSTION TURBINE #8. 63 MW. 63 0.50570039 FLORIDA POWER & LIGHT COMPANY FT MYERS POWER PLANT COMBUSTION TURBINE #9. 63 MW. 63 0.50710002 TECO HOOKERS POINT STATION UNIT #6 - B & W TANGENTIAL FIRING OIL FIRED BOILER 82 6.00710002 TECO GANNON STATION 125MW BABCOCK&WILCOX CORP WET BOTTOM CYCLONIC FIRING TYPE BL 125 56.86710002 TECO GANNON STATION UNIT #1 STEAM GENERATOR 125 56.81570039 FLORIDA POWER & LIGHT COMPANY FT MYERS POWER PLANT UNIT #1 165 MW OIL-FIRED STEAM TURBINE ELECTRIC GENERATOR 156 55.70570038 FLORIDA POWER & LIGHT CO SANFORD POWER PLANT FFSG POWER PLANT - UNIT #3 -FUEL OIL,NATURAL GAS,PROPAN 160 57.00710002 TECO GANNON STATION UNIT #3 - B&W WET BOTTOM COAL FIRED BOILER 180 83.43710002 TECO GANNON STATION UNIT#4- B&W WET BOT CYCLONIC FIR`G COAL FIR BOLR, EAST STACK 187 140.1490006 FLORIDA POWER & LIGHT PORT EVERGLADES 232 MW FFSG #1 W/LOW EXCESS AIR BURNERS&MULTI CYCLONES W/REI 225 119.7690006 FLORIDA POWER & LIGHT PORT EVERGLADES 232 MW FFSG #2 W/LOW EXCESS AIR BURNERS&MULTI-CYCLONES W/REI 225 125.11710002 TECO GANNON STATION UNIT #5 COAL FIRED BOILER 239 156.76570039 FLORIDA POWER & LIGHT COMPANY PUTNAM POWER PLANT #1 A & B ELECT GEN PLANT COMB CYCLE (2 CT + 2 HRB) 290 685.10570039 FLORIDA POWER & LIGHT COMPANY PUTNAM POWER PLANT #2 A & B ELECT GEN PLANT COMB CYCLE (2 CT + 2 HRB) 290 631.5190006 FLORIDA POWER & LIGHT RIVIERA STEAM GENERATOR#4, LOW EXCESS AIR BURNERS&CYCLONES W/ REINJE 310 737.8590006 FLORIDA POWER & LIGHT RIVIERA UNIT # 3 BOILER STACK 310 236.8490006 FLORIDA POWER & LIGHT PORT EVERGLADES 401 MW FFSG#3 W/LOW EXCESS AIR BURNERS & MULTI-CYCLONES W/RE 402 302.0690006 FLORIDA POWER & LIGHT PORT EVERGLADES 401 MW FFSG#4 W/LOW EXCESS AIR BURNERS&MULTI-CYCLONES W/REIN 402 287.2690006 FLORIDA POWER & LIGHT TURKEY POINT 400 MW CLASS (440MW GROSS CAP.) STEAM GEN. UNIT 402 297.8190006 FLORIDA POWER & LIGHT TURKEY POINT 404 MEGAWATT UNIT#1-W/LOW EXCESS AIR BURNERS&TRANSMISSOMETER 402 265.28570039 FLORIDA POWER & LIGHT COMPANY FT MYERS POWER PLANT UNIT #2 408 MW OIL-FIRED STEAM TURBINE ELECTRIC GENERATOR 402 223.41570040 FLORIDA POWER & LIGHT/CP. CAN. CAPE CANAVERAL POWER PLANT FOSSIL FUEL STEAM GENERATOR, UNIT #2 402 323.60570040 FLORIDA POWER & LIGHT/CP. CAN. CAPE CANAVERAL POWER PLANT FOSSIL FUEL STEAM GENERATOR,UNIT #1 402 314.2590006 FLORIDA POWER & LIGHT PORT EVERGLADES GAS TURBINES ELECTRIC GENERATING UNIT #1-12 411 58.2890006 FLORIDA POWER & LIGHT LAUDERDALE 522 MMBTU/HR, UNIT #1 GAS TURBINE ELECTRIC GENERATION 411 36.9590006 FLORIDA POWER & LIGHT LAUDERDALE 522 MMBTU/HR, UNIT #13 GAS TURBINE ELECTRIC GENERATION 411 54.21710002 TECO GANNON STATION UNIT #6 - COAL FIRED BOILER WITH ESP 414 270.07570038 FLORIDA POWER & LIGHT CO SANFORD POWER PLANT FOSSIL FUEL STEAM GENERATOR, UNIT #4, OPERATING ON #6 FO P 436 160.00570038 FLORIDA POWER & LIGHT CO SANFORD POWER PLANT FOSSIL FUEL STEAM GENERATOR, UNIT #5, OPERATING ON #6 FO 436 215.50710002 TECO BIG BEND STATION UNIT #1 COAL FIRED BOILER W/RESEARCH-COTRELL ESP 445 371.39Table A-1. Carbon Monoxide (CO) (continued)
710002 TECO BIG BEND STATION UNIT #2 RILEY-STOKER COAL FIRED BOILER W/ ESP 445 366.19

TRAVEL TIME, SAFETY, ENERGY, AND AIR QUALITY IMPACTS
OF FLORIDA HIGH SPEED RAIL
A - 3
710002 TECO BIG BEND STATION UNIT #3 RILEY-STOKER COAL-FIRED BOILER W/ ESP 445 332.19710002 TECO BIG BEND STATION UNIT #4 COAL-FIRED BOILER W/ BELCO ESP PSD-FL-040 486 401.2790006 FLORIDA POWER & LIGHT MANATEE PLANT 877 MW STEAM GENERATOR UNIT NO. 1 863 5,174.5890008 FLORIDA POWER & LIGHT MANATEE PLANT 877 MW STEAM GENERATOR UNIT NO. 2 863 6,661.1390008 FLORIDA POWER & LIGHT FPL / MARTIN CO UNIT #1 STEAM GENERATOR-FRONT-FIRED - 863 MW MAX. CAPACITY 863 2,991.4390008 FLORIDA POWER & LIGHT FPL / MARTIN CO UNIT #2 STEAM GENERATOR-FRONT-FIRED- 863 MW CAPACITY 863 3,043.0090008 FLORIDA POWER & LIGHT LAUDERDALE CT 4A N / A 59.5890008 FLORIDA POWER & LIGHT LAUDERDALE CT 4B N / A 61.2790008 FLORIDA POWER & LIGHT LAUDERDALE CT 5A N / A 62.3590008 FLORIDA POWER & LIGHT LAUDERDALE CT 5B N / A 61.7890008 FLORIDA POWER & LIGHT LAUDERDALE DIESEL FUEL STORAGE TANK(UNDERGROUND) N / A 0.0090008 FLORIDA POWER & LIGHT LAUDERDALE GASOLINE STORAGE TANK (UNDERGROUND) N / A 0.0090008 FLORIDA POWER & LIGHT LAUDERDALE STORAGE TANK NO. 2 HANDLING NO. 2 FUEL OIL N / A 0.0090008 FLORIDA POWER & LIGHT LAUDERDALE STORAGE TANK NO. 3 HANDLING LIGHT DISTILLATE FUEL OIL N / A 0.0090008 FLORIDA POWER & LIGHT LAUDERDALE STORAGE TANK NO. 5 HANDLING NO. 2 FUEL OIL N / A 0.0090008 FLORIDA POWER & LIGHT LAUDERDALE TWO GAS TURBINE DUMP TANKS N / A 0.0090008 FLORIDA POWER & LIGHT CUTLER RIDGE 161.5 MW TANGENTIALLY FIRED STEAM GENERATOR #6 N / A 58.5190008 FLORIDA POWER & LIGHT CUTLER RIDGE 75 MW,TANGENTIALLY FIRED,STEAM GENERATOR N / A 17.4890008 FLORIDA POWER & LIGHT FPL / MARTIN CO COMBINED CYCLE UNIT 3A,1 CT WITH 1 HT RCVY STEAM GENERATOR N / A 54.0890008 FLORIDA POWER & LIGHT FPL / MARTIN CO COMBINED CYCLE UNIT 3B, 1 CT & 1 HRSG N / A 52.8390008 FLORIDA POWER & LIGHT FPL / MARTIN CO COMBINED CYCLE UNIT 4A-1CT WITH 1 HT RCVY STEAM GENERATOR N / A 39.4190008 FLORIDA POWER & LIGHT FPL / MARTIN CO COMBINED CYCLE UNIT 4B-1 CT WITH 1 HT RCVY STEAM GENERATOR N / A 52.8190008 FLORIDA POWER & LIGHT FPL - OSF/PDC 12.5 mmBTU/hr boiler #1 (Unit A) burning No.6 fuel oil N / A 0.1590008 FLORIDA POWER & LIGHT FPL - OSF/PDC 12.5 mmBTU/hr boiler #2 (Unit B) burning No.6 fuel oil N / A 0.0090008 FLORIDA POWER & LIGHT FPL - OSF/PDC Miscellaneous support equipment N / A 2.1990008 FLORIDA POWER & LIGHT FPL - OSF/PDC Wire reclamation incinerator w/afterburner N / A 0.36570040 ORLANDO UTILITIES COMMISSION STANTON ENERGY CENTER FOSSIL FUEL STEAM GENERATION UNIT #1 N / A 303.15570040 ORLANDO UTILITY COMMISSION INDIAN RIVER PLANT 129MW TURBINE GENERATOR (CT-C) N / A 10.08570040 ORLANDO UTILITY COMMISSION INDIAN RIVER PLANT 129MW TURBINE GENERATOR (CT-D) N / A 74.45570040 ORLANDO UTILITY COMMISSION INDIAN RIVER PLANT 35 MW TURBINE GENERATOR #CT-A N / A 11.36570040 ORLANDO UTILITY COMMISSION INDIAN RIVER PLANT 35 MW TURBINE GENERATOR #CT-B N / A 70.97570040 ORLANDO UTILITY COMMISSION INDIAN RIVER PLANT FOSSIL FUEL STEAM GENERATOR UNIT #2 N / A 47.98570040 ORLANDO UTILITY COMMISSION INDIAN RIVER PLANT FOSSIL FUEL STEAM GENERATOR UNIT #3 N / A 213.35570040 ORLANDO UTILITY COMMISSION INDIAN RIVER PLANT FOSSIL FUEL STEAM GENERATOR, UNIT #1 N / A 48.93570040 ORLANDO UTILITY COMMISSION CAPE CANAVERAL PLANT STEAM BOILER , LOCATED IN BELCHER OIL FAC. N / A 0.10710002 TECO BIG BEND STATION BIG BEND STATION COMBUST. TURBINE #2 - FIRED BY NO. 2 FUEL O N / A 1.93710002 TECO BIG BEND STATION GAS TURBINE #1 FIRED BY #2 FUEL OIL N / A 0.21710002 TECO BIG BEND STATION GAS TURBINE #3 - WESTINGHOUSE TURBINE FIRED BY NO. 2 FUEL OI N / A 3.26710002 TECO GANNON STATION 14 MW GAS FIRED TURBINE N / A 0.16

TRAVEL TIME, SAFETY, ENERGY, AND AIR QUALITY IMPACTS
OF FLORIDA HIGH SPEED RAIL
A - 4
Table A-2. Nitrogen Oxides (NOx)
Facility ID Owner/Company Site Name Emissions Unit Description Ton/YearMW
Rating90008 FLORIDA POWER & LIGHT ST. LUCIE NUCLEAR PLANT 4 MAIN PLANT EMERGENCY DIESEL GENERATORS 3 8.43710002 TECO HOOKERS POINT STATION UNIT #1 B+W FRONT FIRING OIL-FIRED BOILER 33 97.57710002 TECO HOOKERS POINT STATION UNIT #2-B & W FRONT FIRING OIL FIRED BOILER 34 67.13710002 TECO HOOKERS POINT STATION UNIT #3-B & W FRONT FIRING OIL FIRED BOILER 34 60.90710002 TECO HOOKERS POINT STATION 47 MW #6 OIL FIRED STEAM GENERATOR #5 47 28.29710002 TECO HOOKERS POINT STATION UNIT #4- B & W FRONT-FIRED OIL FIRED BOILER 49 70.77570039 FLORIDA POWER & LIGHT COMPANY FT MYERS POWER PLANT COMBUSTION TURBINE #1 63 7.30570039 FLORIDA POWER & LIGHT COMPANY FT MYERS POWER PLANT COMBUSTION TURBINE #10. 63 MW. 63 7.30570039 FLORIDA POWER & LIGHT COMPANY FT MYERS POWER PLANT COMBUSTION TURBINE #11. 63 MW. 63 7.30570039 FLORIDA POWER & LIGHT COMPANY FT MYERS POWER PLANT COMBUSTION TURBINE #12. 63 MW. 63 7.30570039 FLORIDA POWER & LIGHT COMPANY FT MYERS POWER PLANT COMBUSTION TURBINE #2. 63 MW. 63 7.30570039 FLORIDA POWER & LIGHT COMPANY FT MYERS POWER PLANT COMBUSTION TURBINE #3. 63 MW. 63 7.30570039 FLORIDA POWER & LIGHT COMPANY FT MYERS POWER PLANT COMBUSTION TURBINE #4. 63 MW. 63 7.30570039 FLORIDA POWER & LIGHT COMPANY FT MYERS POWER PLANT COMBUSTION TURBINE #5. 63 MW. 63 7.30570039 FLORIDA POWER & LIGHT COMPANY FT MYERS POWER PLANT COMBUSTION TURBINE #6. 63 MW. 63 7.30570039 FLORIDA POWER & LIGHT COMPANY FT MYERS POWER PLANT COMBUSTION TURBINE #7. 63 MW. 63 7.30570039 FLORIDA POWER & LIGHT COMPANY FT MYERS POWER PLANT COMBUSTION TURBINE #8. 63 MW. 63 7.30570039 FLORIDA POWER & LIGHT COMPANY FT MYERS POWER PLANT COMBUSTION TURBINE #9. 63 MW. 63 7.30710002 TECO HOOKERS POINT STATION UNIT #6 - B & W TANGENTIAL FIRING OIL FIRED BOILER 82 80.45710002 TECO GANNON STATION 125MW BABCOCK&WILCOX CORP WET BOTTOM CYCLONIC FIRING TYPE BL 125 3,452.55710013 TECO GANNON STATION UNIT #1 STEAM GENERATOR 125 3,449.55570039 FLORIDA POWER & LIGHT COMPANY FT MYERS POWER PLANT UNIT #1 165 MW OIL-FIRED STEAM TURBINE ELECTRIC GENERATOR 156 746.41570038 FLORIDA POWER & LIGHT CO SANFORD POWER PLANT FFSG POWER PLANT - UNIT #3 -FUEL OIL,NATURAL GAS,PROPAN 160 770.00710013 TECO GANNON STATION UNIT #3 - B&W WET BOTTOM COAL FIRED BOILER 180 5,090.55810010 TECO GANNON STATION UNIT#4- B&W WET BOT CYCLONIC FIR`G COAL FIR BOLR, EAST STACK 187 8,587.5590008 FLORIDA POWER & LIGHT PORT EVERGLADES 232 MW FFSG #1 W/LOW EXCESS AIR BURNERS&MULTI CYCLONES W/REI 225 1,631.0090008 FLORIDA POWER & LIGHT PORT EVERGLADES 232 MW FFSG #2 W/LOW EXCESS AIR BURNERS&MULTI-CYCLONES W/REI 225 1,703.71810010 TECO GANNON STATION UNIT #5 COAL FIRED BOILER 239 8,839.99570039 FLORIDA POWER & LIGHT COMPANY PUTNAM POWER PLANT #1 A & B ELECT GEN PLANT COMB CYCLE (2 CT + 2 HRB) 290 1,245.22570039 FLORIDA POWER & LIGHT COMPANY PUTNAM POWER PLANT #2 A & B ELECT GEN PLANT COMB CYCLE (2 CT + 2 HRB) 290 1,148.2090008 FLORIDA POWER & LIGHT RIVIERA STEAM GENERATOR#4, LOW EXCESS AIR BURNERS&CYCLONES W/ REINJE 310 3,016.2590008 FLORIDA POWER & LIGHT RIVIERA UNIT # 3 BOILER STACK 310 3,186.0890008 FLORIDA POWER & LIGHT PORT EVERGLADES 401 MW FFSG#3 W/LOW EXCESS AIR BURNERS & MULTI-CYCLONES W/RE 402 4,109.0090008 FLORIDA POWER & LIGHT PORT EVERGLADES 401 MW FFSG#4 W/LOW EXCESS AIR BURNERS&MULTI-CYCLONES W/REIN 402 3,914.7290008 FLORIDA POWER & LIGHT TURKEY POINT 400 MW CLASS (440MW GROSS CAP.) STEAM GEN. UNIT 402 4,051.0490008 FLORIDA POWER & LIGHT TURKEY POINT 404 MEGAWATT UNIT#1-W/LOW EXCESS AIR BURNERS&TRANSMISSOMETER 402 2,884.41570039 FLORIDA POWER & LIGHT COMPANY FT MYERS POWER PLANT UNIT #2 408 MW OIL-FIRED STEAM TURBINE ELECTRIC GENERATOR 402 2,993.65570040 FLORIDA POWER & LIGHT/CP. CAN. CAPE CANAVERAL POWER PLANT FOSSIL FUEL STEAM GENERATOR, UNIT #2 402 4,407.40570040 FLORIDA POWER & LIGHT/CP. CAN. CAPE CANAVERAL POWER PLANT FOSSIL FUEL STEAM GENERATOR,UNIT #1 402 4,286.0090008 FLORIDA POWER & LIGHT PORT EVERGLADES GAS TURBINES ELECTRIC GENERATING UNIT #1-12 411 233.1090008 FLORIDA POWER & LIGHT LAUDERDALE 522 MMBTU/HR, UNIT #1 GAS TURBINE ELECTRIC GENERATION 411 153.2890008 FLORIDA POWER & LIGHT LAUDERDALE 522 MMBTU/HR, UNIT #13 GAS TURBINE ELECTRIC GENERATION 411 225.04810010 TECO GANNON STATION UNIT #6 - COAL FIRED BOILER WITH ESP 414 15,254.55570038 FLORIDA POWER & LIGHT CO SANFORD POWER PLANT FOSSIL FUEL STEAM GENERATOR, UNIT #4, OPERATING ON #6 FO P 436 2,167.00

TRAVEL TIME, SAFETY, ENERGY, AND AIR QUALITY IMPACTS
OF FLORIDA HIGH SPEED RAIL
A - 5
Table A-2. Nitrogen Oxides (NOx) (continued)
570038 FLORIDA POWER & LIGHT CO SANFORD POWER PLANT FOSSIL FUEL STEAM GENERATOR, UNIT #5, OPERATING ON #6 FO 436 2,916.00810010 TECO BIG BEND STATION UNIT #1 COAL FIRED BOILER W/RESEARCH-COTRELL ESP 445 20,992.74810010 TECO BIG BEND STATION UNIT #2 RILEY-STOKER COAL FIRED BOILER W/ ESP 445 20,696.74810010 TECO BIG BEND STATION UNIT #3 RILEY-STOKER COAL-FIRED BOILER W/ ESP 445 8,149.74810010 TECO BIG BEND STATION UNIT #4 COAL-FIRED BOILER W/ BELCO ESP PSD-FL-040 486 7,236.6290008 FLORIDA POWER & LIGHT MANATEE PLANT 877 MW STEAM GENERATOR UNIT NO. 1 863 2,448.3290008 FLORIDA POWER & LIGHT MANATEE PLANT 877 MW STEAM GENERATOR UNIT NO. 2 863 3,151.7690008 FLORIDA POWER & LIGHT FPL / MARTIN CO UNIT #1 STEAM GENERATOR-FRONT-FIRED - 863 MW MAX. CAPACITY 863 2,011.2990008 FLORIDA POWER & LIGHT FPL / MARTIN CO UNIT #2 STEAM GENERATOR-FRONT-FIRED- 863 MW CAPACITY 863 2,435.3890008 FLORIDA POWER & LIGHT LAUDERDALE CT 4A 804.22 N / A90008 FLORIDA POWER & LIGHT LAUDERDALE CT 4B 827.06 N / A90008 FLORIDA POWER & LIGHT LAUDERDALE CT 5A 841.67 N / A90008 FLORIDA POWER & LIGHT LAUDERDALE CT 5B 833.94 N / A90008 FLORIDA POWER & LIGHT LAUDERDALE DIESEL FUEL STORAGE TANK(UNDERGROUND) 0.00 N / A90008 FLORIDA POWER & LIGHT LAUDERDALE GASOLINE STORAGE TANK (UNDERGROUND) 0.00 N / A90008 FLORIDA POWER & LIGHT LAUDERDALE STORAGE TANK NO. 2 HANDLING NO. 2 FUEL OIL 0.00 N / A90012 FLORIDA POWER & LIGHT LAUDERDALE STORAGE TANK NO. 3 HANDLING LIGHT DISTILLATE FUEL OIL 0.00 N / A90012 FLORIDA POWER & LIGHT LAUDERDALE STORAGE TANK NO. 5 HANDLING NO. 2 FUEL OIL 0.00 N / A90012 FLORIDA POWER & LIGHT LAUDERDALE TWO GAS TURBINE DUMP TANKS 0.00 N / A90012 FLORIDA POWER & LIGHT CUTLER RIDGE 161.5 MW TANGENTIALLY FIRED STEAM GENERATOR #6 804.62 N / A90012 FLORIDA POWER & LIGHT CUTLER RIDGE 75 MW,TANGENTIALLY FIRED,STEAM GENERATOR 240.29 N / A90012 FLORIDA POWER & LIGHT FPL / MARTIN CO 10,000 LB/HR AUXILIARY BOILER FOR UNITS 3(A,B) AND 4(A,B) 0.03 N / A90012 FLORIDA POWER & LIGHT FPL / MARTIN CO 500 KW EMERGENCY DIESEL GENERATOR 0.00 N / A90113 FLORIDA POWER & LIGHT FPL / MARTIN CO COMBINED CYCLE UNIT 3A,1 CT WITH 1 HT RCVY STEAM GENERATOR 537.98 N / A90113 FLORIDA POWER & LIGHT FPL / MARTIN CO COMBINED CYCLE UNIT 3B, 1 CT & 1 HRSG 525.61 N / A110036 FLORIDA POWER & LIGHT FPL / MARTIN CO COMBINED CYCLE UNIT 4A-1CT WITH 1 HT RCVY STEAM GENERATOR 392.03 N / A110036 FLORIDA POWER & LIGHT FPL / MARTIN CO COMBINED CYCLE UNIT 4B-1 CT WITH 1 HT RCVY STEAM GENERATOR 525.33 N / A110036 FLORIDA POWER & LIGHT FPL - OSF/PDC 12.5 mmBTU/hr boiler #1 (Unit A) burning No.6 fuel oil 0.89 N / A110036 FLORIDA POWER & LIGHT FPL - OSF/PDC 12.5 mmBTU/hr boiler #2 (Unit B) burning No.6 fuel oil 1.89 N / A110036 FLORIDA POWER & LIGHT FPL - OSF/PDC Miscellaneous support equipment 10.14 N / A110036 FLORIDA POWER & LIGHT FPL - OSF/PDC Wire reclamation incinerator w/afterburner 2.69 N / A110036 FLORIDA POWER & LIGHT ST. LUCIE NUCLEAR PLANT MISCELLANEOUS DIESEL DRIVEN EQUIPMENT 17.28 N / A570039 FLORIDA POWER & LIGHT COMPANY FLORIDA POWER & LIGHT PACKAGE BOILER,350 HP, CLEAVER-BROOKS 0.00 N / A570040 ORLANDO UTILITIES COMMISSION STANTON ENERGY CENTER FOSSIL FUEL STEAM GENERATION UNIT #1 6,190.80 N / A570040 ORLANDO UTILITY COMMISSION INDIAN RIVER PLANT 129MW TURBINE GENERATOR (CT-C) AircraftMarket570040 ORLANDO UTILITY COMMISSION INDIAN RIVER PLANT 129MW TURBINE GENERATOR (CT-D) Gulfstream Miami, FL570040 ORLANDO UTILITY COMMISSION INDIAN RIVER PLANT 35 MW TURBINE GENERATOR #CT-A Gulfstream Miami, FL570040 ORLANDO UTILITY COMMISSION INDIAN RIVER PLANT 35 MW TURBINE GENERATOR #CT-B Gulfstream Tampa,570040 ORLANDO UTILITY COMMISSION INDIAN RIVER PLANT FOSSIL FUEL STEAM GENERATOR UNIT #2 Gulfstream Miami, FL570040 ORLANDO UTILITY COMMISSION INDIAN RIVER PLANT FOSSIL FUEL STEAM GENERATOR UNIT #3 Gulfstream Miami, FL570040 ORLANDO UTILITY COMMISSION INDIAN RIVER PLANT FOSSIL FUEL STEAM GENERATOR, UNIT #1 Gulfstream Miami, FL570040 ORLANDO UTILITY COMMISSION CAPE CANAVERAL PLANT STEAM BOILER , LOCATED IN BELCHER OIL FAC. Gulfstream Miami, FL810010 TECO BIG BEND STATION BIG BEND STATION COMBUST. TURBINE #2 - FIRED BY NO. 2 FUEL O Gulfstream Miami, FL810010 TECO BIG BEND STATION GAS TURBINE #1 FIRED BY #2 FUEL OIL Gulfstream Miami, FL810010 TECO BIG BEND STATION GAS TURBINE #3 - WESTINGHOUSE TURBINE FIRED BY NO. 2 FUEL OI Gulfstream Ft.810010 TECO GANNON STATION 14 MW GAS FIRED TURBINE Gulfstream Miami, FL

TRAVEL TIME, SAFETY, ENERGY, AND AIR QUALITY IMPACTS
OF FLORIDA HIGH SPEED RAIL
A - 6
Table A-3. Particulate Matter (PM)
Facility ID Owner/Company Site Name Emissions Unit Description Ton/YearMW
Rating0850001 TECO HOOKERS POINT STATION UNIT #1 B+W FRONT FIRING OIL-FIRED BOILER 33 22.020850001 TECO HOOKERS POINT STATION UNIT #2-B & W FRONT FIRING OIL FIRED BOILER 34 15.170850001 TECO HOOKERS POINT STATION UNIT #3-B & W FRONT FIRING OIL FIRED BOILER 34 13.760850001 TECO HOOKERS POINT STATION 47 MW #6 OIL FIRED STEAM GENERATOR #5 47 5.730850001 TECO HOOKERS POINT STATION UNIT #4- B & W FRONT-FIRED OIL FIRED BOILER 49 15.970570039 FLORIDA POWER & LIGHT COMPANY FT MYERS POWER PLANT COMBUSTION TURBINE #10. 63 MW. 63 0.000570039 FLORIDA POWER & LIGHT COMPANY FT MYERS POWER PLANT COMBUSTION TURBINE #11. 63 MW. 63 0.000570039 FLORIDA POWER & LIGHT COMPANY FT MYERS POWER PLANT COMBUSTION TURBINE #12. 63 MW. 63 0.000570039 FLORIDA POWER & LIGHT COMPANY FT MYERS POWER PLANT COMBUSTION TURBINE #2. 63 MW. 63 0.000570039 FLORIDA POWER & LIGHT COMPANY FT MYERS POWER PLANT COMBUSTION TURBINE #3. 63 MW. 63 0.000570039 FLORIDA POWER & LIGHT COMPANY FT MYERS POWER PLANT COMBUSTION TURBINE #4. 63 MW. 63 0.000570039 FLORIDA POWER & LIGHT COMPANY FT MYERS POWER PLANT COMBUSTION TURBINE #5. 63 MW. 63 0.000570039 FLORIDA POWER & LIGHT COMPANY FT MYERS POWER PLANT COMBUSTION TURBINE #6. 63 MW. 63 0.000570039 FLORIDA POWER & LIGHT COMPANY FT MYERS POWER PLANT COMBUSTION TURBINE #7. 63 MW. 63 0.000570039 FLORIDA POWER & LIGHT COMPANY FT MYERS POWER PLANT COMBUSTION TURBINE #8. 63 MW. 63 0.000570039 FLORIDA POWER & LIGHT COMPANY FT MYERS POWER PLANT COMBUSTION TURBINE #9. 63 MW. 63 0.000850001 TECO HOOKERS POINT STATION UNIT #6 - B & W TANGENTIAL FIRING OIL FIRED BOILER 82 18.170850001 TECO GANNON STATION 125MW BABCOCK&WILCOX CORP WET BOTTOM CYCLONIC FIRING TYPE BL 125 92.100850001 TECO GANNON STATION UNIT #1 STEAM GENERATOR 125 46.280570039 FLORIDA POWER & LIGHT COMPANY FT MYERS POWER PLANT UNIT #1 165 MW OIL-FIRED STEAM TURBINE ELECTRIC GENERATOR 156 212.230570038 FLORIDA POWER & LIGHT CO SANFORD POWER PLANT FFSG POWER PLANT - UNIT #3 -FUEL OIL,NATURAL GAS,PROPAN 160 152.800850001 TECO GANNON STATION UNIT #3 - B&W WET BOTTOM COAL FIRED BOILER 180 101.950850001 TECO GANNON STATION UNIT#4- B&W WET BOT CYCLONIC FIR`G COAL FIR BOLR, EAST STACK 187 271.070110036 FLORIDA POWER & LIGHT PORT EVERGLADES 232 MW FFSG #1 W/LOW EXCESS AIR BURNERS&MULTI CYCLONES W/REI 225 180.130110036 FLORIDA POWER & LIGHT PORT EVERGLADES 232 MW FFSG #2 W/LOW EXCESS AIR BURNERS&MULTI-CYCLONES W/REI 225 189.250850001 TECO GANNON STATION UNIT #5 COAL FIRED BOILER 239 193.360570039 FLORIDA POWER & LIGHT COMPANY PUTNAM POWER PLANT #1 A & B ELECT GEN PLANT COMB CYCLE (2 CT + 2 HRB) 290 120.160570039 FLORIDA POWER & LIGHT COMPANY PUTNAM POWER PLANT #2 A & B ELECT GEN PLANT COMB CYCLE (2 CT + 2 HRB) 290 110.800110036 FLORIDA POWER & LIGHT RIVIERA STEAM GENERATOR#4, LOW EXCESS AIR BURNERS&CYCLONES W/ REINJE 310 697.320110036 FLORIDA POWER & LIGHT RIVIERA UNIT # 3 BOILER STACK 310 766.850110036 FLORIDA POWER & LIGHT PORT EVERGLADES 401 MW FFSG#3 W/LOW EXCESS AIR BURNERS & MULTI-CYCLONES W/RE 402 503.860110036 FLORIDA POWER & LIGHT PORT EVERGLADES 401 MW FFSG#4 W/LOW EXCESS AIR BURNERS&MULTI-CYCLONES W/REIN 402 398.470110036 FLORIDA POWER & LIGHT TURKEY POINT 400 MW CLASS (440MW GROSS CAP.) STEAM GEN. UNIT 402 499.400110036 FLORIDA POWER & LIGHT TURKEY POINT 404 MEGAWATT UNIT#1-W/LOW EXCESS AIR BURNERS&TRANSMISSOMETER 402 452.960570039 FLORIDA POWER & LIGHT COMPANY FT MYERS POWER PLANT UNIT #2 408 MW OIL-FIRED STEAM TURBINE ELECTRIC GENERATOR 402 851.180570040 FLORIDA POWER & LIGHT/CP. CAN. CAPE CANAVERAL POWER PLANT FOSSIL FUEL STEAM GENERATOR, UNIT #2 402 481.420570040 FLORIDA POWER & LIGHT/CP. CAN. CAPE CANAVERAL POWER PLANT FOSSIL FUEL STEAM GENERATOR,UNIT #1 402 392.500110036 FLORIDA POWER & LIGHT PORT EVERGLADES GAS TURBINES ELECTRIC GENERATING UNIT #1-12 411 10.200110036 FLORIDA POWER & LIGHT LAUDERDALE 522 MMBTU/HR, UNIT #1 GAS TURBINE ELECTRIC GENERATION 411 6.480110036 FLORIDA POWER & LIGHT LAUDERDALE 522 MMBTU/HR, UNIT #13 GAS TURBINE ELECTRIC GENERATION 411 9.510850001 TECO GANNON STATION UNIT #6 - COAL FIRED BOILER WITH ESP 414 1,116.350570038 FLORIDA POWER & LIGHT CO SANFORD POWER PLANT FOSSIL FUEL STEAM GENERATOR, UNIT #4, OPERATING ON #6 FO P 436 374.000570038 FLORIDA POWER & LIGHT CO SANFORD POWER PLANT FOSSIL FUEL STEAM GENERATOR, UNIT #5, OPERATING ON #6 FO 436 456.300850001 TECO BIG BEND STATION UNIT #1 COAL FIRED BOILER W/RESEARCH-COTRELL ESP 445 1,179.40
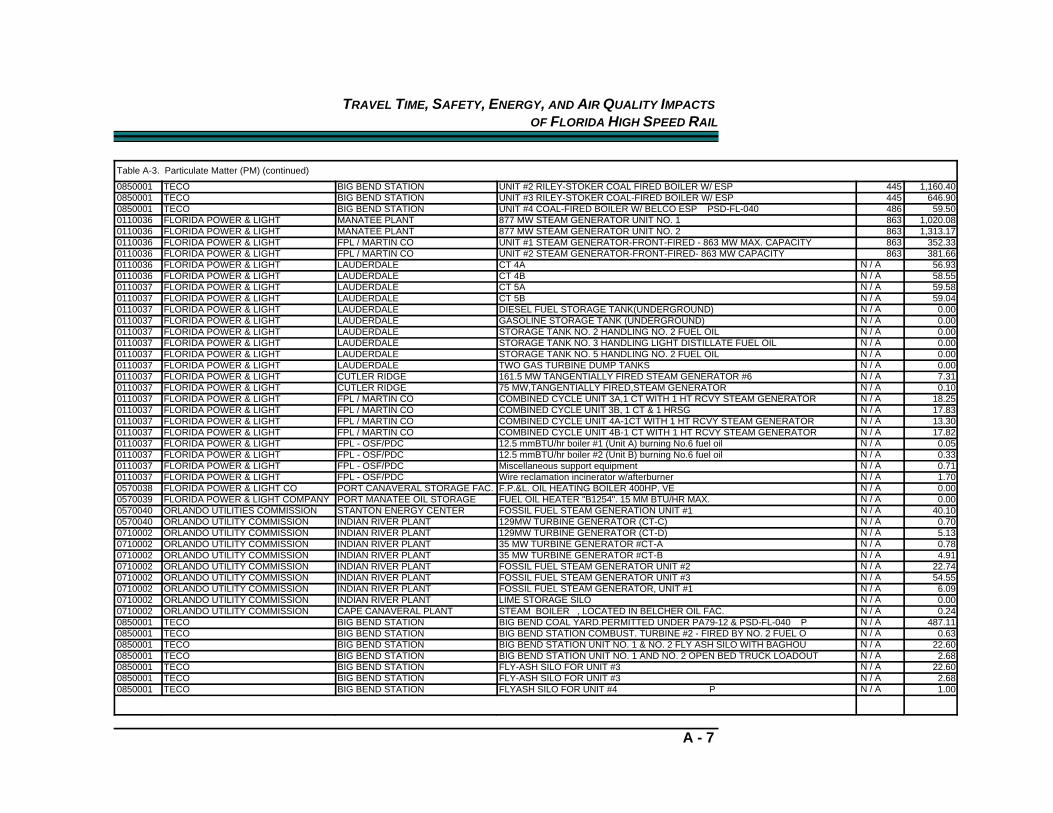
TRAVEL TIME, SAFETY, ENERGY, AND AIR QUALITY IMPACTS
OF FLORIDA HIGH SPEED RAIL
A - 7
Table A-3. Particulate Matter (PM) (continued)
0850001 TECO BIG BEND STATION UNIT #2 RILEY-STOKER COAL FIRED BOILER W/ ESP 445 1,160.400850001 TECO BIG BEND STATION UNIT #3 RILEY-STOKER COAL-FIRED BOILER W/ ESP 445 646.900850001 TECO BIG BEND STATION UNIT #4 COAL-FIRED BOILER W/ BELCO ESP PSD-FL-040 486 59.500110036 FLORIDA POWER & LIGHT MANATEE PLANT 877 MW STEAM GENERATOR UNIT NO. 1 863 1,020.080110036 FLORIDA POWER & LIGHT MANATEE PLANT 877 MW STEAM GENERATOR UNIT NO. 2 863 1,313.170110036 FLORIDA POWER & LIGHT FPL / MARTIN CO UNIT #1 STEAM GENERATOR-FRONT-FIRED - 863 MW MAX. CAPACITY 863 352.330110036 FLORIDA POWER & LIGHT FPL / MARTIN CO UNIT #2 STEAM GENERATOR-FRONT-FIRED- 863 MW CAPACITY 863 381.660110036 FLORIDA POWER & LIGHT LAUDERDALE CT 4A 56.93 N / A0110036 FLORIDA POWER & LIGHT LAUDERDALE CT 4B 58.55 N / A0110037 FLORIDA POWER & LIGHT LAUDERDALE CT 5A 59.58 N / A0110037 FLORIDA POWER & LIGHT LAUDERDALE CT 5B 59.04 N / A0110037 FLORIDA POWER & LIGHT LAUDERDALE DIESEL FUEL STORAGE TANK(UNDERGROUND) 0.00 N / A0110037 FLORIDA POWER & LIGHT LAUDERDALE GASOLINE STORAGE TANK (UNDERGROUND) 0.00 N / A0110037 FLORIDA POWER & LIGHT LAUDERDALE STORAGE TANK NO. 2 HANDLING NO. 2 FUEL OIL 0.00 N / A0110037 FLORIDA POWER & LIGHT LAUDERDALE STORAGE TANK NO. 3 HANDLING LIGHT DISTILLATE FUEL OIL 0.00 N / A0110037 FLORIDA POWER & LIGHT LAUDERDALE STORAGE TANK NO. 5 HANDLING NO. 2 FUEL OIL 0.00 N / A0110037 FLORIDA POWER & LIGHT LAUDERDALE TWO GAS TURBINE DUMP TANKS 0.00 N / A0110037 FLORIDA POWER & LIGHT CUTLER RIDGE 161.5 MW TANGENTIALLY FIRED STEAM GENERATOR #6 7.31 N / A0110037 FLORIDA POWER & LIGHT CUTLER RIDGE 75 MW,TANGENTIALLY FIRED,STEAM GENERATOR 0.10 N / A0110037 FLORIDA POWER & LIGHT FPL / MARTIN CO COMBINED CYCLE UNIT 3A,1 CT WITH 1 HT RCVY STEAM GENERATOR 18.25 N / A0110037 FLORIDA POWER & LIGHT FPL / MARTIN CO COMBINED CYCLE UNIT 3B, 1 CT & 1 HRSG 17.83 N / A0110037 FLORIDA POWER & LIGHT FPL / MARTIN CO COMBINED CYCLE UNIT 4A-1CT WITH 1 HT RCVY STEAM GENERATOR 13.30 N / A0110037 FLORIDA POWER & LIGHT FPL / MARTIN CO COMBINED CYCLE UNIT 4B-1 CT WITH 1 HT RCVY STEAM GENERATOR 17.82 N / A0110037 FLORIDA POWER & LIGHT FPL - OSF/PDC 12.5 mmBTU/hr boiler #1 (Unit A) burning No.6 fuel oil 0.05 N / A0110037 FLORIDA POWER & LIGHT FPL - OSF/PDC 12.5 mmBTU/hr boiler #2 (Unit B) burning No.6 fuel oil 0.33 N / A0110037 FLORIDA POWER & LIGHT FPL - OSF/PDC Miscellaneous support equipment 0.71 N / A0110037 FLORIDA POWER & LIGHT FPL - OSF/PDC Wire reclamation incinerator w/afterburner 1.70 N / A0570038 FLORIDA POWER & LIGHT CO PORT CANAVERAL STORAGE FAC. F.P.&L. OIL HEATING BOILER 400HP, VE 0.00 N / A0570039 FLORIDA POWER & LIGHT COMPANY PORT MANATEE OIL STORAGE FUEL OIL HEATER "B1254". 15 MM BTU/HR MAX. 0.00 N / A0570040 ORLANDO UTILITIES COMMISSION STANTON ENERGY CENTER FOSSIL FUEL STEAM GENERATION UNIT #1 40.10 N / A0570040 ORLANDO UTILITY COMMISSION INDIAN RIVER PLANT 129MW TURBINE GENERATOR (CT-C) 0.70 N / A0710002 ORLANDO UTILITY COMMISSION INDIAN RIVER PLANT 129MW TURBINE GENERATOR (CT-D) 5.13 N / A0710002 ORLANDO UTILITY COMMISSION INDIAN RIVER PLANT 35 MW TURBINE GENERATOR #CT-A 0.78 N / A0710002 ORLANDO UTILITY COMMISSION INDIAN RIVER PLANT 35 MW TURBINE GENERATOR #CT-B 4.91 N / A0710002 ORLANDO UTILITY COMMISSION INDIAN RIVER PLANT FOSSIL FUEL STEAM GENERATOR UNIT #2 22.74 N / A0710002 ORLANDO UTILITY COMMISSION INDIAN RIVER PLANT FOSSIL FUEL STEAM GENERATOR UNIT #3 54.55 N / A0710002 ORLANDO UTILITY COMMISSION INDIAN RIVER PLANT FOSSIL FUEL STEAM GENERATOR, UNIT #1 6.09 N / A0710002 ORLANDO UTILITY COMMISSION INDIAN RIVER PLANT LIME STORAGE SILO 0.00 N / A0710002 ORLANDO UTILITY COMMISSION CAPE CANAVERAL PLANT STEAM BOILER , LOCATED IN BELCHER OIL FAC. 0.24 N / A0850001 TECO BIG BEND STATION BIG BEND COAL YARD.PERMITTED UNDER PA79-12 & PSD-FL-040 P 487.11 N / A0850001 TECO BIG BEND STATION BIG BEND STATION COMBUST. TURBINE #2 - FIRED BY NO. 2 FUEL O 0.63 N / A0850001 TECO BIG BEND STATION BIG BEND STATION UNIT NO. 1 & NO. 2 FLY ASH SILO WITH BAGHOU 22.60 N / A0850001 TECO BIG BEND STATION BIG BEND STATION UNIT NO. 1 AND NO. 2 OPEN BED TRUCK LOADOUT 2.68 N / A0850001 TECO BIG BEND STATION FLY-ASH SILO FOR UNIT #3 22.60 N / A0850001 TECO BIG BEND STATION FLY-ASH SILO FOR UNIT #3 2.68 N / A0850001 TECO BIG BEND STATION FLYASH SILO FOR UNIT #4 P 1.00 N / A

TRAVEL TIME, SAFETY, ENERGY, AND AIR QUALITY IMPACTS
OF FLORIDA HIGH SPEED RAIL
A - 8
Table A-3. Particulate Matter (PM) (continued)
850001 TECO BIG BEND STATION GAS TURBINE #1 FIRED BY #2 FUEL OIL 0.07 N / A850001 TECO BIG BEND STATION GAS TURBINE #3 - WESTINGHOUSE TURBINE FIRED BY NO. 2 FUEL OI 1.06 N / A0950137 TECO BIG BEND STATION LIMESTONE SILO A W/ 2 BAGHOUSES. 1 IS 100% BACK-UP P 0.10 N / A0950137 TECO BIG BEND STATION LIMESTONE SILO B W/ 2 BAGHOUSES. 1 IS 100% BACK-UP P 0.10 N / A0950137 TECO BIG BEND STATION TRUCK UNLOADING OF LIMESTONE 0.10 N / A0950137 TECO BIG BEND STATION UNIT 1 COAL BUNKER W/ROTO-CLONE 0.07 N / A0950137 TECO BIG BEND STATION UNIT 2 COAL BUNKER W/ROTO-CLONE 0.07 N / A0950137 TECO BIG BEND STATION UNIT 3 COAL BUNKER W/ROTO-CLONE 0.07 N / A0950137 TECO GANNON STATION 14 MW GAS FIRED TURBINE 0.05 N / A0990042 TECO GANNON STATION COAL YARD SERVING UNITS 1-6/BARGE RRCAR UNLDG-TRNFR-STORAGE 160.52 N / A0990042 TECO GANNON STATION FLY ASH SILO NO. 2 UNITS 1-4 5.26 N / A0990042 TECO GANNON STATION FLYASH SILO NO. 1 FOR UNITS 5 & 6 12.70 N / A0990042 TECO GANNON STATION GANNON UNITS 5 & 6, PUG MILL AND TRUCK LOADING 2.64 N / A0990042 TECO GANNON STATION UNIT 1 COAL BUNKER W/ROTO-CLONE 0.01 N / A0990042 TECO GANNON STATION UNIT 2 COAL BUNKER W/ROTO-CLONE 0.01 N / A0990042 TECO GANNON STATION UNIT 3 COAL BUNKER W/ROTO-CLONE 0.02 N / A0990042 TECO GANNON STATION UNIT 4 COAL BUNKER W/ROTO-CLONE 0.03 N / A0990042 TECO GANNON STATION UNIT 5 COAL BUNKER W/ROTO-CLONE 0.03 N / A0990042 TECO GANNON STATION UNIT 6 COAL BUNKER W/ROTO-CLONE 0.05 N / A

TRAVEL TIME, SAFETY, ENERGY, AND AIR QUALITY IMPACTS
OF FLORIDA HIGH SPEED RAIL
A - 9
Table A-4. Particulate Matter (PM10)
Facility ID Owner/Company Site Name Emissions Unit Description MW Ton / Year
Rating0990042 TECO HOOKERS POINT STATION UNIT #1 B+W FRONT FIRING OIL-FIRED BOILER 33 22.020990042 TECO HOOKERS POINT STATION UNIT #2-B & W FRONT FIRING OIL FIRED BOILER 34 15.170990042 TECO HOOKERS POINT STATION UNIT #3-B & W FRONT FIRING OIL FIRED BOILER 34 13.760990042 TECO HOOKERS POINT STATION 47 MW #6 OIL FIRED STEAM GENERATOR #5 47 5.730990123 TECO HOOKERS POINT STATION UNIT #4- B & W FRONT-FIRED OIL FIRED BOILER 49 15.970990123 TECO HOOKERS POINT STATION UNIT #6 - B & W TANGENTIAL FIRING OIL FIRED BOILER 82 18.170990123 TECO GANNON STATION 125MW BABCOCK&WILCOX CORP WET BOTTOM CYCLONIC FIRING TYPE BL 125 92.100990123 TECO GANNON STATION UNIT #1 STEAM GENERATOR 125 46.280570039 FLORIDA POWER & LIGHT COMPANY FT MYERS POWER PLANT UNIT #1 165 MW OIL-FIRED STEAM TURBINE ELECTRIC GENERATOR 156 212.230570038 FLORIDA POWER & LIGHT CO SANFORD POWER PLANT FFSG POWER PLANT - UNIT #3 -FUEL OIL,NATURAL GAS,PROPAN 160 152.000990123 TECO GANNON STATION UNIT #3 - B&W WET BOTTOM COAL FIRED BOILER 180 101.950990123 TECO GANNON STATION UNIT#4- B&W WET BOT CYCLONIC FIR`G COAL FIR BOLR, EAST STACK 187 271.070110037 FLORIDA POWER & LIGHT PORT EVERGLADES 232 MW FFSG #1 W/LOW EXCESS AIR BURNERS&MULTI CYCLONES W/REI 225 180.130110037 FLORIDA POWER & LIGHT PORT EVERGLADES 232 MW FFSG #2 W/LOW EXCESS AIR BURNERS&MULTI-CYCLONES W/REI 225 189.250990123 TECO GANNON STATION UNIT #5 COAL FIRED BOILER 239 193.360570039 FLORIDA POWER & LIGHT COMPANY PUTNAM POWER PLANT #1 A & B ELECT GEN PLANT COMB CYCLE (2 CT + 2 HRB) 290 120.160570039 FLORIDA POWER & LIGHT COMPANY PUTNAM POWER PLANT #2 A & B ELECT GEN PLANT COMB CYCLE (2 CT + 2 HRB) 290 110.800110037 FLORIDA POWER & LIGHT RIVIERA STEAM GENERATOR#4, LOW EXCESS AIR BURNERS&CYCLONES W/ REINJE 310 697.320110037 FLORIDA POWER & LIGHT RIVIERA UNIT # 3 BOILER STACK 310 766.850110037 FLORIDA POWER & LIGHT PORT EVERGLADES 401 MW FFSG#3 W/LOW EXCESS AIR BURNERS & MULTI-CYCLONES W/RE 402 503.860110037 FLORIDA POWER & LIGHT PORT EVERGLADES 401 MW FFSG#4 W/LOW EXCESS AIR BURNERS&MULTI-CYCLONES W/REIN 402 398.470110037 FLORIDA POWER & LIGHT TURKEY POINT 400 MW CLASS (440MW GROSS CAP.) STEAM GEN. UNIT 402 499.400110037 FLORIDA POWER & LIGHT TURKEY POINT 404 MEGAWATT UNIT#1-W/LOW EXCESS AIR BURNERS&TRANSMISSOMETER 402 452.960570039 FLORIDA POWER & LIGHT COMPANY FT MYERS POWER PLANT UNIT #2 408 MW OIL-FIRED STEAM TURBINE ELECTRIC GENERATOR 402 851.180570040 FLORIDA POWER & LIGHT/CP. CAN. CAPE CANAVERAL POWER PLANT FOSSIL FUEL STEAM GENERATOR, UNIT #2 402 456.000570040 FLORIDA POWER & LIGHT/CP. CAN. CAPE CANAVERAL POWER PLANT FOSSIL FUEL STEAM GENERATOR,UNIT #1 402 392.500110037 FLORIDA POWER & LIGHT PORT EVERGLADES GAS TURBINES ELECTRIC GENERATING UNIT #1-12 411 10.200110037 FLORIDA POWER & LIGHT LAUDERDALE 522 MMBTU/HR, UNIT #1 GAS TURBINE ELECTRIC GENERATION 411 6.480110037 FLORIDA POWER & LIGHT LAUDERDALE 522 MMBTU/HR, UNIT #13 GAS TURBINE ELECTRIC GENERATION 411 9.510990123 TECO GANNON STATION UNIT #6 - COAL FIRED BOILER WITH ESP 414 1,116.350990123 TECO BIG BEND STATION UNIT #1 COAL FIRED BOILER W/RESEARCH-COTRELL ESP 445 1,179.400990123 TECO BIG BEND STATION UNIT #2 RILEY-STOKER COAL FIRED BOILER W/ ESP 445 1,160.400990123 TECO BIG BEND STATION UNIT #3 RILEY-STOKER COAL-FIRED BOILER W/ ESP 445 646.900990123 TECO BIG BEND STATION UNIT #4 COAL-FIRED BOILER W/ BELCO ESP PSD-FL-040 486 59.500110037 FLORIDA POWER & LIGHT MANATEE PLANT 877 MW STEAM GENERATOR UNIT NO. 1 863 1,020.000110037 FLORIDA POWER & LIGHT MANATEE PLANT 877 MW STEAM GENERATOR UNIT NO. 2 863 1,313.060110037 FLORIDA POWER & LIGHT FPL / MARTIN CO UNIT #1 STEAM GENERATOR-FRONT-FIRED - 863 MW MAX. CAPACITY 863 352.330110037 FLORIDA POWER & LIGHT FPL / MARTIN CO UNIT #2 STEAM GENERATOR-FRONT-FIRED- 863 MW CAPACITY 863 381.660110037 FLORIDA POWER & LIGHT LAUDERDALE CT 4A 56.93 N / A0110037 FLORIDA POWER & LIGHT LAUDERDALE CT 4B 58.55 N / A0110037 FLORIDA POWER & LIGHT LAUDERDALE CT 5A 59.58 N / A0110037 FLORIDA POWER & LIGHT LAUDERDALE CT 5B 59.04 N / A0110037 FLORIDA POWER & LIGHT LAUDERDALE DIESEL FUEL STORAGE TANK(UNDERGROUND) 0.00 N / A

TRAVEL TIME, SAFETY, ENERGY, AND AIR QUALITY IMPACTS
OF FLORIDA HIGH SPEED RAIL
A - 10
Table A-4. Particulate Matter (PM10) (continued)
110037 FLORIDA POWER & LIGHT LAUDERDALE GASOLINE STORAGE TANK (UNDERGROUND) 0.00 N / A110037 FLORIDA POWER & LIGHT LAUDERDALE STORAGE TANK NO. 2 HANDLING NO. 2 FUEL OIL 0.00 N / A0110037 FLORIDA POWER & LIGHT LAUDERDALE STORAGE TANK NO. 3 HANDLING LIGHT DISTILLATE FUEL OIL 0.00 N / A0110037 FLORIDA POWER & LIGHT LAUDERDALE STORAGE TANK NO. 5 HANDLING NO. 2 FUEL OIL 0.00 N / A0110037 FLORIDA POWER & LIGHT LAUDERDALE TWO GAS TURBINE DUMP TANKS 0.00 N / A0110037 FLORIDA POWER & LIGHT CUTLER RIDGE 161.5 MW TANGENTIALLY FIRED STEAM GENERATOR #6 7.31 N / A0110037 FLORIDA POWER & LIGHT FPL / MARTIN CO COMBINED CYCLE UNIT 3A,1 CT WITH 1 HT RCVY STEAM GENERATOR 18.25 N / A0110037 FLORIDA POWER & LIGHT FPL / MARTIN CO COMBINED CYCLE UNIT 3B, 1 CT & 1 HRSG 17.83 N / A0110037 FLORIDA POWER & LIGHT FPL / MARTIN CO COMBINED CYCLE UNIT 4A-1CT WITH 1 HT RCVY STEAM GENERATOR 13.30 N / A0110037 FLORIDA POWER & LIGHT FPL / MARTIN CO COMBINED CYCLE UNIT 4B-1 CT WITH 1 HT RCVY STEAM GENERATOR 17.82 N / A0110037 FLORIDA POWER & LIGHT FPL - OSF/PDC 12.5 mmBTU/hr boiler #1 (Unit A) burning No.6 fuel oil 0.03 N / A0110037 FLORIDA POWER & LIGHT FPL - OSF/PDC 12.5 mmBTU/hr boiler #2 (Unit B) burning No.6 fuel oil 0.17 N / A0110037 FLORIDA POWER & LIGHT FPL - OSF/PDC Miscellaneous support equipment 0.71 N / A0110037 FLORIDA POWER & LIGHT FPL - OSF/PDC Wire reclamation incinerator w/afterburner 0.68 N / A0570040 ORLANDO UTILITIES COMMISSION STANTON ENERGY CENTER FOSSIL FUEL STEAM GENERATION UNIT #1 39.74 N / A0710002 ORLANDO UTILITY COMMISSION INDIAN RIVER PLANT 129MW TURBINE GENERATOR (CT-C) 0.28 N / A0710002 ORLANDO UTILITY COMMISSION INDIAN RIVER PLANT 129MW TURBINE GENERATOR (CT-D) 2.05 N / A0710002 ORLANDO UTILITY COMMISSION INDIAN RIVER PLANT 35 MW TURBINE GENERATOR #CT-A 0.31 N / A0710002 ORLANDO UTILITY COMMISSION INDIAN RIVER PLANT 35 MW TURBINE GENERATOR #CT-B 1.94 N / A0710002 ORLANDO UTILITY COMMISSION INDIAN RIVER PLANT FOSSIL FUEL STEAM GENERATOR UNIT #2 16.12 N / A0710002 ORLANDO UTILITY COMMISSION INDIAN RIVER PLANT FOSSIL FUEL STEAM GENERATOR UNIT #3 38.70 N / A0710002 ORLANDO UTILITY COMMISSION INDIAN RIVER PLANT FOSSIL FUEL STEAM GENERATOR, UNIT #1 4.32 N / A0710002 ORLANDO UTILITY COMMISSION CAPE CANAVERAL PLANT STEAM BOILER , LOCATED IN BELCHER OIL FAC. 0.17 N / A0990123 TECO BIG BEND STATION BIG BEND STATION COMBUST. TURBINE #2 - FIRED BY NO. 2 FUEL O 0.63 N / A0990123 TECO BIG BEND STATION GAS TURBINE #1 FIRED BY #2 FUEL OIL 0.07 N / A0990123 TECO BIG BEND STATION GAS TURBINE #3 - WESTINGHOUSE TURBINE FIRED BY NO. 2 FUEL OI 1.06 N / A0990123 TECO GANNON STATION 14 MW GAS FIRED TURBINE 0.05 N / A

TRAVEL TIME, SAFETY, ENERGY, AND AIR QUALITY IMPACTS
OF FLORIDA HIGH SPEED RAIL
A - 11
Table A-5. Sulfur Dioxide (SO2)
Facility ID Owner/Company Site Name Emissions Unit Description MW Ton/Year
Rating0990123 TECO HOOKERS POINT STATION UNIT #1 B+W FRONT FIRING OIL-FIRED BOILER 33 211.300990123 TECO HOOKERS POINT STATION UNIT #2-B & W FRONT FIRING OIL FIRED BOILER 34 145.610990123 TECO HOOKERS POINT STATION UNIT #3-B & W FRONT FIRING OIL FIRED BOILER 34 132.100990123 TECO HOOKERS POINT STATION 47 MW #6 OIL FIRED STEAM GENERATOR #5 47 61.020990123 TECO HOOKERS POINT STATION UNIT #4- B & W FRONT-FIRED OIL FIRED BOILER 49 153.170570039 FLORIDA POWER & LIGHT COMPANY FT MYERS POWER PLANT COMBUSTION TURBINE #1 63 3.610570039 FLORIDA POWER & LIGHT COMPANY FT MYERS POWER PLANT COMBUSTION TURBINE #10. 63 MW. 63 3.610570040 FLORIDA POWER & LIGHT COMPANY FT MYERS POWER PLANT COMBUSTION TURBINE #11. 63 MW. 63 3.610570040 FLORIDA POWER & LIGHT COMPANY FT MYERS POWER PLANT COMBUSTION TURBINE #12. 63 MW. 63 3.610570040 FLORIDA POWER & LIGHT COMPANY FT MYERS POWER PLANT COMBUSTION TURBINE #2. 63 MW. 63 3.610570040 FLORIDA POWER & LIGHT COMPANY FT MYERS POWER PLANT COMBUSTION TURBINE #3. 63 MW. 63 3.610570040 FLORIDA POWER & LIGHT COMPANY FT MYERS POWER PLANT COMBUSTION TURBINE #4. 63 MW. 63 3.610570040 FLORIDA POWER & LIGHT COMPANY FT MYERS POWER PLANT COMBUSTION TURBINE #5. 63 MW. 63 3.610570040 FLORIDA POWER & LIGHT COMPANY FT MYERS POWER PLANT COMBUSTION TURBINE #6. 63 MW. 63 3.610570040 FLORIDA POWER & LIGHT COMPANY FT MYERS POWER PLANT COMBUSTION TURBINE #7. 63 MW. 63 3.610570040 FLORIDA POWER & LIGHT COMPANY FT MYERS POWER PLANT COMBUSTION TURBINE #8. 63 MW. 63 3.610570040 FLORIDA POWER & LIGHT COMPANY FT MYERS POWER PLANT COMBUSTION TURBINE #9. 63 MW. 63 3.610990123 TECO HOOKERS POINT STATION UNIT #6 - B & W TANGENTIAL FIRING OIL FIRED BOILER 82 174.590990123 TECO GANNON STATION 125MW BABCOCK&WILCOX CORP WET BOTTOM CYCLONIC FIRING TYPE BL 125 3,925.300990123 TECO GANNON STATION UNIT #1 STEAM GENERATOR 125 4,043.300570040 FLORIDA POWER & LIGHT COMPANY FT MYERS POWER PLANT UNIT #1 165 MW OIL-FIRED STEAM TURBINE ELECTRIC GENERATOR 156 3,247.990570039 FLORIDA POWER & LIGHT CO SANFORD POWER PLANT FFSG POWER PLANT - UNIT #3 -FUEL OIL,NATURAL GAS,PROPAN 160 2,437.500990123 TECO GANNON STATION UNIT #3 - B&W WET BOTTOM COAL FIRED BOILER 180 5,929.300990123 TECO GANNON STATION UNIT#4- B&W WET BOT CYCLONIC FIR`G COAL FIR BOLR, EAST STACK 187 9,963.300110037 FLORIDA POWER & LIGHT PORT EVERGLADES 232 MW FFSG #1 W/LOW EXCESS AIR BURNERS&MULTI CYCLONES W/REI 225 1,342.040110037 FLORIDA POWER & LIGHT PORT EVERGLADES 232 MW FFSG #2 W/LOW EXCESS AIR BURNERS&MULTI-CYCLONES W/REI 225 1,413.680990123 TECO GANNON STATION UNIT #5 COAL FIRED BOILER 239 10,362.780570040 FLORIDA POWER & LIGHT COMPANY PUTNAM POWER PLANT #1 A & B ELECT GEN PLANT COMB CYCLE (2 CT + 2 HRB) 290 9.360570040 FLORIDA POWER & LIGHT COMPANY PUTNAM POWER PLANT #2 A & B ELECT GEN PLANT COMB CYCLE (2 CT + 2 HRB) 290 8.630110037 FLORIDA POWER & LIGHT RIVIERA STEAM GENERATOR#4, LOW EXCESS AIR BURNERS&CYCLONES W/ REINJE 310 12,762.500110037 FLORIDA POWER & LIGHT RIVIERA UNIT # 3 BOILER STACK 310 14,003.280110037 FLORIDA POWER & LIGHT PORT EVERGLADES 401 MW FFSG#3 W/LOW EXCESS AIR BURNERS & MULTI-CYCLONES W/RE 402 3,819.190110037 FLORIDA POWER & LIGHT PORT EVERGLADES 401 MW FFSG#4 W/LOW EXCESS AIR BURNERS&MULTI-CYCLONES W/REIN 402 2,977.100110037 FLORIDA POWER & LIGHT TURKEY POINT 400 MW CLASS (440MW GROSS CAP.) STEAM GEN. UNIT 402 3,890.920110037 FLORIDA POWER & LIGHT TURKEY POINT 404 MEGAWATT UNIT#1-W/LOW EXCESS AIR BURNERS&TRANSMISSOMETER 402 3,554.600570040 FLORIDA POWER & LIGHT COMPANY FT MYERS POWER PLANT UNIT #2 408 MW OIL-FIRED STEAM TURBINE ELECTRIC GENERATOR 402 13,125.160570040 FLORIDA POWER & LIGHT/CP. CAN. CAPE CANAVERAL POWER PLANT FOSSIL FUEL STEAM GENERATOR, UNIT #2 402 6,071.000570040 FLORIDA POWER & LIGHT/CP. CAN. CAPE CANAVERAL POWER PLANT FOSSIL FUEL STEAM GENERATOR,UNIT #1 402 4,749.300110037 FLORIDA POWER & LIGHT PORT EVERGLADES GAS TURBINES ELECTRIC GENERATING UNIT #1-12 411 0.000110037 FLORIDA POWER & LIGHT LAUDERDALE 522 MMBTU/HR, UNIT #1 GAS TURBINE ELECTRIC GENERATION 411 0.000110037 FLORIDA POWER & LIGHT LAUDERDALE 522 MMBTU/HR, UNIT #13 GAS TURBINE ELECTRIC GENERATION 411 0.001070014 TECO GANNON STATION UNIT #6 - COAL FIRED BOILER WITH ESP 414 18,752.300570039 FLORIDA POWER & LIGHT CO SANFORD POWER PLANT FOSSIL FUEL STEAM GENERATOR, UNIT #4, OPERATING ON #6 FO P 436 5,885.00

TRAVEL TIME, SAFETY, ENERGY, AND AIR QUALITY IMPACTS
OF FLORIDA HIGH SPEED RAIL
A - 12
Table A-5. Sulfur Dioxide (SO2) (continued)
570039 FLORIDA POWER & LIGHT CO SANFORD POWER PLANT FOSSIL FUEL STEAM GENERATOR, UNIT #5, OPERATING ON #6 FO 436 7,168.001070014 TECO BIG BEND STATION UNIT #1 COAL FIRED BOILER W/RESEARCH-COTRELL ESP 445 33,311.041070014 TECO BIG BEND STATION UNIT #2 RILEY-STOKER COAL FIRED BOILER W/ ESP 445 34,223.041070014 TECO BIG BEND STATION UNIT #3 RILEY-STOKER COAL-FIRED BOILER W/ ESP 445 17,132.041070014 TECO BIG BEND STATION UNIT #4 COAL-FIRED BOILER W/ BELCO ESP PSD-FL-040 486 2,656.240110037 FLORIDA POWER & LIGHT MANATEE PLANT 877 MW STEAM GENERATOR UNIT NO. 1 863 8,190.860110037 FLORIDA POWER & LIGHT MANATEE PLANT 877 MW STEAM GENERATOR UNIT NO. 2 863 10,533.300110037 FLORIDA POWER & LIGHT FPL / MARTIN CO UNIT #1 STEAM GENERATOR-FRONT-FIRED - 863 MW MAX. CAPACITY 863 4,111.710110037 FLORIDA POWER & LIGHT FPL / MARTIN CO UNIT #2 STEAM GENERATOR-FRONT-FIRED- 863 MW CAPACITY 863 4,360.150110037 FLORIDA POWER & LIGHT LAUDERDALE CT 4A N / A 18.260110037 FLORIDA POWER & LIGHT LAUDERDALE CT 4B N / A 18.780110037 FLORIDA POWER & LIGHT LAUDERDALE CT 5A N / A 19.110110037 FLORIDA POWER & LIGHT LAUDERDALE CT 5B N / A 18.940110037 FLORIDA POWER & LIGHT LAUDERDALE DIESEL FUEL STORAGE TANK(UNDERGROUND) N / A 0.000250001 FLORIDA POWER & LIGHT LAUDERDALE GASOLINE STORAGE TANK (UNDERGROUND) N / A 0.000250001 FLORIDA POWER & LIGHT LAUDERDALE STORAGE TANK NO. 2 HANDLING NO. 2 FUEL OIL N / A 0.000250001 FLORIDA POWER & LIGHT LAUDERDALE STORAGE TANK NO. 3 HANDLING LIGHT DISTILLATE FUEL OIL N / A 0.000250001 FLORIDA POWER & LIGHT LAUDERDALE STORAGE TANK NO. 5 HANDLING NO. 2 FUEL OIL N / A 0.000250001 FLORIDA POWER & LIGHT LAUDERDALE TWO GAS TURBINE DUMP TANKS N / A 0.000250001 FLORIDA POWER & LIGHT CUTLER RIDGE 161.5 MW TANGENTIALLY FIRED STEAM GENERATOR #6 N / A 0.530250001 FLORIDA POWER & LIGHT CUTLER RIDGE 75 MW,TANGENTIALLY FIRED,STEAM GENERATOR N / A 0.230250001 FLORIDA POWER & LIGHT FPL / MARTIN CO 10,000 LB/HR AUXILIARY BOILER FOR UNITS 3(A,B) AND 4(A,B) N / A 0.060250001 FLORIDA POWER & LIGHT FPL / MARTIN CO 500 KW EMERGENCY DIESEL GENERATOR N / A 0.000250003 FLORIDA POWER & LIGHT FPL / MARTIN CO COMBINED CYCLE UNIT 3A,1 CT WITH 1 HT RCVY STEAM GENERATOR N / A 19.600250003 FLORIDA POWER & LIGHT FPL / MARTIN CO COMBINED CYCLE UNIT 3B, 1 CT & 1 HRSG N / A 19.150250003 FLORIDA POWER & LIGHT FPL / MARTIN CO COMBINED CYCLE UNIT 4A-1CT WITH 1 HT RCVY STEAM GENERATOR N / A 14.290250003 FLORIDA POWER & LIGHT FPL / MARTIN CO COMBINED CYCLE UNIT 4B-1 CT WITH 1 HT RCVY STEAM GENERATOR N / A 19.140250003 FLORIDA POWER & LIGHT FPL - OSF/PDC 12.5 mmBTU/hr boiler #1 (Unit A) burning No.6 fuel oil N / A 0.610250003 FLORIDA POWER & LIGHT FPL - OSF/PDC 12.5 mmBTU/hr boiler #2 (Unit B) burning No.6 fuel oil N / A 1.150250003 FLORIDA POWER & LIGHT FPL - OSF/PDC Miscellaneous support equipment N / A 1.150250003 FLORIDA POWER & LIGHT FPL - OSF/PDC Wire reclamation incinerator w/afterburner N / A 0.020570039 FLORIDA POWER & LIGHT CO PORT CANAVERAL STORAGE FAC. F.P.&L. OIL HEATING BOILER 400HP, VE N / A 0.000570040 FLORIDA POWER & LIGHT COMPANY FLORIDA POWER & LIGHT PACKAGE BOILER,350 HP, CLEAVER-BROOKS N / A 6.930570040 ORLANDO UTILITIES COMMISSION STANTON ENERGY CENTER FOSSIL FUEL STEAM GENERATION UNIT #1 N / A 3,415.900710002 ORLANDO UTILITY COMMISSION INDIAN RIVER PLANT 129MW TURBINE GENERATOR (CT-C) N / A 0.020710002 ORLANDO UTILITY COMMISSION INDIAN RIVER PLANT 129MW TURBINE GENERATOR (CT-D) N / A 0.160710002 ORLANDO UTILITY COMMISSION INDIAN RIVER PLANT 35 MW TURBINE GENERATOR #CT-A N / A 0.020710002 ORLANDO UTILITY COMMISSION INDIAN RIVER PLANT 35 MW TURBINE GENERATOR #CT-B N / A 0.170710002 ORLANDO UTILITY COMMISSION INDIAN RIVER PLANT FOSSIL FUEL STEAM GENERATOR UNIT #2 N / A 529.300710002 ORLANDO UTILITY COMMISSION INDIAN RIVER PLANT FOSSIL FUEL STEAM GENERATOR UNIT #3 N / A 885.960710002 ORLANDO UTILITY COMMISSION INDIAN RIVER PLANT FOSSIL FUEL STEAM GENERATOR, UNIT #1 N / A 62.350710002 ORLANDO UTILITY COMMISSION CAPE CANAVERAL PLANT STEAM BOILER , LOCATED IN BELCHER OIL FAC. N / A 2.961070014 TECO BIG BEND STATION BIG BEND STATION COMBUST. TURBINE #2 - FIRED BY NO. 2 FUEL O N / A 17.561070014 TECO BIG BEND STATION GAS TURBINE #1 FIRED BY #2 FUEL OIL N / A 1.921070014 TECO BIG BEND STATION GAS TURBINE #3 - WESTINGHOUSE TURBINE FIRED BY NO. 2 FUEL OI N / A 29.671070014 TECO GANNON STATION 14 MW GAS FIRED TURBINE N / A 1.47

TRAVEL TIME, SAFETY, ENERGY, AND AIR QUALITY IMPACTS
OF FLORIDA HIGH SPEED RAIL
A - 13
Table A-6. Volatile Organic Compounds (VOC)
Facility ID Owner/Company Site Name Emissions Unit Description MW Ton/Year
Rating1070014 TECO HOOKERS POINT STATION UNIT #1 B+W FRONT FIRING OIL-FIRED BOILER 33 1.111070014 TECO HOOKERS POINT STATION UNIT #2-B & W FRONT FIRING OIL FIRED BOILER 34 0.761070014 TECO HOOKERS POINT STATION UNIT #3-B & W FRONT FIRING OIL FIRED BOILER 34 0.691110071 TECO HOOKERS POINT STATION 47 MW #6 OIL FIRED STEAM GENERATOR #5 47 0.321110071 TECO HOOKERS POINT STATION UNIT #4- B & W FRONT-FIRED OIL FIRED BOILER 49 0.801270009 TECO HOOKERS POINT STATION UNIT #6 - B & W TANGENTIAL FIRING OIL FIRED BOILER 82 0.911270009 TECO GANNON STATION 125MW BABCOCK&WILCOX CORP WET BOTTOM CYCLONIC FIRING TYPE BL 125 6.561270009 TECO GANNON STATION UNIT #1 STEAM GENERATOR 125 6.560570040 FLORIDA POWER & LIGHT COMPANY FT MYERS POWER PLANT UNIT #1 165 MW OIL-FIRED STEAM TURBINE ELECTRIC GENERATOR 156 8.470570039 FLORIDA POWER & LIGHT CO SANFORD POWER PLANT FFSG POWER PLANT - UNIT #3 -FUEL OIL,NATURAL GAS,PROPAN 160 6.001270009 TECO GANNON STATION UNIT #3 - B&W WET BOTTOM COAL FIRED BOILER 180 9.661270009 TECO GANNON STATION UNIT#4- B&W WET BOT CYCLONIC FIR`G COAL FIR BOLR, EAST STACK 187 16.280250003 FLORIDA POWER & LIGHT PORT EVERGLADES 232 MW FFSG #1 W/LOW EXCESS AIR BURNERS&MULTI CYCLONES W/REI 225 6.830250003 FLORIDA POWER & LIGHT PORT EVERGLADES 232 MW FFSG #2 W/LOW EXCESS AIR BURNERS&MULTI-CYCLONES W/REI 225 7.181270009 TECO GANNON STATION UNIT #5 COAL FIRED BOILER 239 18.220570040 FLORIDA POWER & LIGHT COMPANY PUTNAM POWER PLANT #1 A & B ELECT GEN PLANT COMB CYCLE (2 CT + 2 HRB) 290 21.170570040 FLORIDA POWER & LIGHT COMPANY PUTNAM POWER PLANT #2 A & B ELECT GEN PLANT COMB CYCLE (2 CT + 2 HRB) 290 19.520250003 FLORIDA POWER & LIGHT RIVIERA STEAM GENERATOR#4, LOW EXCESS AIR BURNERS&CYCLONES W/ REINJE 310 183.510250003 FLORIDA POWER & LIGHT RIVIERA UNIT # 3 BOILER STACK 310 31.800570038 FLORIDA POWER & LIGHT PORT EVERGLADES 401 MW FFSG#3 W/LOW EXCESS AIR BURNERS & MULTI-CYCLONES W/RE 402 25.460570038 FLORIDA POWER & LIGHT PORT EVERGLADES 401 MW FFSG#4 W/LOW EXCESS AIR BURNERS&MULTI-CYCLONES W/REIN 402 21.650570038 FLORIDA POWER & LIGHT TURKEY POINT 400 MW CLASS (440MW GROSS CAP.) STEAM GEN. UNIT 402 25.140570038 FLORIDA POWER & LIGHT TURKEY POINT 404 MEGAWATT UNIT#1-W/LOW EXCESS AIR BURNERS&TRANSMISSOMETER 402 22.690570040 FLORIDA POWER & LIGHT COMPANY FT MYERS POWER PLANT UNIT #2 408 MW OIL-FIRED STEAM TURBINE ELECTRIC GENERATOR 402 33.960570040 FLORIDA POWER & LIGHT/CP. CAN. CAPE CANAVERAL POWER PLANT FOSSIL FUEL STEAM GENERATOR, UNIT #2 402 18.280570040 FLORIDA POWER & LIGHT/CP. CAN. CAPE CANAVERAL POWER PLANT FOSSIL FUEL STEAM GENERATOR,UNIT #1 402 22.270570038 FLORIDA POWER & LIGHT PORT EVERGLADES GAS TURBINES ELECTRIC GENERATING UNIT #1-12 411 0.000570038 FLORIDA POWER & LIGHT LAUDERDALE 522 MMBTU/HR, UNIT #1 GAS TURBINE ELECTRIC GENERATION 411 0.000570038 FLORIDA POWER & LIGHT LAUDERDALE 522 MMBTU/HR, UNIT #13 GAS TURBINE ELECTRIC GENERATION 411 0.001270009 TECO GANNON STATION UNIT #6 - COAL FIRED BOILER WITH ESP 414 31.440570039 FLORIDA POWER & LIGHT CO SANFORD POWER PLANT FOSSIL FUEL STEAM GENERATOR, UNIT #5, OPERATING ON #6 FO 436 17.801270009 TECO BIG BEND STATION UNIT #1 COAL FIRED BOILER W/RESEARCH-COTRELL ESP 445 43.251270009 TECO BIG BEND STATION UNIT #2 RILEY-STOKER COAL FIRED BOILER W/ ESP 445 42.641270009 TECO BIG BEND STATION UNIT #3 RILEY-STOKER COAL-FIRED BOILER W/ ESP 445 38.641270009 TECO BIG BEND STATION UNIT #4 COAL-FIRED BOILER W/ BELCO ESP PSD-FL-040 486 46.800570038 FLORIDA POWER & LIGHT MANATEE PLANT 877 MW STEAM GENERATOR UNIT NO. 1 863 40.690570038 FLORIDA POWER & LIGHT MANATEE PLANT 877 MW STEAM GENERATOR UNIT NO. 2 863 52.380570038 FLORIDA POWER & LIGHT FPL / MARTIN CO UNIT #1 STEAM GENERATOR-FRONT-FIRED - 863 MW MAX. CAPACITY 863 22.490570038 FLORIDA POWER & LIGHT FPL / MARTIN CO UNIT #2 STEAM GENERATOR-FRONT-FIRED- 863 MW CAPACITY 863 30.960570038 FLORIDA POWER & LIGHT LAUDERDALE CT 4A N / A 0.000570038 FLORIDA POWER & LIGHT LAUDERDALE CT 4B N / A 0.000570038 FLORIDA POWER & LIGHT LAUDERDALE CT 5A N / A 0.000570038 FLORIDA POWER & LIGHT LAUDERDALE CT 5B N / A 0.00

TRAVEL TIME, SAFETY, ENERGY, AND AIR QUALITY IMPACTS
OF FLORIDA HIGH SPEED RAIL
A - 14
Table A-6. Volatile Organic Compounds (VOC) (continued)
570038 FLORIDA POWER & LIGHT LAUDERDALE DIESEL FUEL STORAGE TANK(UNDERGROUND) N / A 0.01570038 FLORIDA POWER & LIGHT LAUDERDALE GASOLINE STORAGE TANK (UNDERGROUND) N / A 0.040570038 FLORIDA POWER & LIGHT LAUDERDALE STORAGE TANK NO. 2 HANDLING NO. 2 FUEL OIL N / A 0.890570038 FLORIDA POWER & LIGHT LAUDERDALE STORAGE TANK NO. 3 HANDLING LIGHT DISTILLATE FUEL OIL N / A 0.000570038 FLORIDA POWER & LIGHT LAUDERDALE STORAGE TANK NO. 5 HANDLING NO. 2 FUEL OIL N / A 0.850570038 FLORIDA POWER & LIGHT LAUDERDALE TWO GAS TURBINE DUMP TANKS N / A 0.000570038 FLORIDA POWER & LIGHT FPL / MARTIN CO COMBINED CYCLE UNIT 3A,1 CT WITH 1 HT RCVY STEAM GENERATOR N / A 5.000570038 FLORIDA POWER & LIGHT FPL / MARTIN CO COMBINED CYCLE UNIT 3B, 1 CT & 1 HRSG N / A 4.900570038 FLORIDA POWER & LIGHT FPL / MARTIN CO COMBINED CYCLE UNIT 4A-1CT WITH 1 HT RCVY STEAM GENERATOR N / A 3.580570038 FLORIDA POWER & LIGHT FPL / MARTIN CO COMBINED CYCLE UNIT 4B-1 CT WITH 1 HT RCVY STEAM GENERATOR N / A 4.990570038 FLORIDA POWER & LIGHT FPL - OSF/PDC 12.5 mmBTU/hr boiler #1 (Unit A) burning No.6 fuel oil N / A 0.030570038 FLORIDA POWER & LIGHT FPL - OSF/PDC 12.5 mmBTU/hr boiler #2 (Unit B) burning No.6 fuel oil N / A 0.050570038 FLORIDA POWER & LIGHT FPL - OSF/PDC Boiler fuel storage N / A 2.900570038 FLORIDA POWER & LIGHT FPL - OSF/PDC Miscellaneous support equipment N / A 8.750570038 FLORIDA POWER & LIGHT FPL - OSF/PDC Wire reclamation incinerator w/afterburner N / A 0.100570040 ORLANDO UTILITIES COMMISSION STANTON ENERGY CENTER FOSSIL FUEL STEAM GENERATION UNIT #1 N / A 36.440710002 ORLANDO UTILITY COMMISSION INDIAN RIVER PLANT 129MW TURBINE GENERATOR (CT-C) N / A 0.870710002 ORLANDO UTILITY COMMISSION INDIAN RIVER PLANT 129MW TURBINE GENERATOR (CT-D) N / A 6.380710002 ORLANDO UTILITY COMMISSION INDIAN RIVER PLANT 35 MW TURBINE GENERATOR #CT-A N / A 0.970710002 ORLANDO UTILITY COMMISSION INDIAN RIVER PLANT 35 MW TURBINE GENERATOR #CT-B N / A 6.040710002 ORLANDO UTILITY COMMISSION INDIAN RIVER PLANT FOSSIL FUEL STEAM GENERATOR UNIT #2 N / A 4.850710002 ORLANDO UTILITY COMMISSION INDIAN RIVER PLANT FOSSIL FUEL STEAM GENERATOR UNIT #3 N / A 12.600710002 ORLANDO UTILITY COMMISSION INDIAN RIVER PLANT FOSSIL FUEL STEAM GENERATOR, UNIT #1 N / A 2.050710002 ORLANDO UTILITY COMMISSION CAPE CANAVERAL PLANT STEAM BOILER , LOCATED IN BELCHER OIL FAC. N / A 0.021270009 TECO BIG BEND STATION BIG BEND STATION COMBUST. TURBINE #2 - FIRED BY NO. 2 FUEL O N / A 0.601270009 TECO BIG BEND STATION GAS TURBINE #1 FIRED BY #2 FUEL OIL N / A 0.071270009 TECO BIG BEND STATION GAS TURBINE #3 - WESTINGHOUSE TURBINE FIRED BY NO. 2 FUEL OI N / A 1.011270009 TECO GANNON STATION 14 MW GAS FIRED TURBINE N / A 0.05

TRAVEL TIME, SAFETY, ENERGY, AND AIR QUALITY IMPACTS
OF FLORIDA HIGH SPEED RAIL
B - 1
APPENDIX BFlight Schedules, Orlando International Airport, 1997
Table B-1. Flight Schedules
Market Airline Aircraft Flight Depart Arrive Itinerary Days Seats
Number Miami Gulfstream BE1 395 1640 1755 MIA-MCO 6 19 Miami Gulfstream BE1 416 1845 1955 FPO-MIA-MCO 6 19 Tampa Gulfstream BE1 185 1215 1250 MCO-TPA-JAX 6 19 Miami Gulfstream BE1 174 1010 1120 MCO-MIA 7 19 Miami Gulfstream BE1 386 930 1035 MCO-MIA 7 19 Miami Gulfstream BE1 407 1915 2025 MIA-MCO 7 19 Miami Gulfstream BE1 489 1520 1630 MIA-MCO 67 19 Miami Gulfstream BE1 490 1715 1820 MCO-MIA 67 19 Miami Gulfstream BE1 436 1115 1220 TLH-MCO-MIA-EYW 12345 19 Ft. Lauderdale Gulfstream BE1 188 1935 2040 MCO-FLL 1234567 19 Miami Gulfstream BE1 409 700 805 MCO-MIA-FPO 1234567 19 Tampa USAir Express BE1 5408 910 945 TPA-MCO 1234567 19 Tampa USAir Express BE1 5427 1400 1435 MCO-TPA 1234567 19 Tampa USAir Express BE1 5430 1200 1235 MCO-TPA 1234567 19 Tampa USAir Express BE1 5434 1630 1705 TPA-MCO 1234567 19 West Palm Beach USAir Express BE1 5304 1725 1815 MCO-PBI-MCO 1234567 19 West Palm Beach USAir Express BE1 5330 820 910 JAX-PBI-MCO 1234567 19 West Palm Beach USAir Express BE1 5359 1035 1125 MCO-PBI-MCO 1234567 19 West Palm Beach USAir Express BE1 5359 930 1020 MCO-PBI-MCO 1234567 19 West Palm Beach USAir Express BE1 5360 1335 1425 PBI-MCO-PBI 1234567 19 West Palm Beach USAir Express BE1 5360 1440 1530 PBI-MCO-PBI 1234567 19 Miami Gulfstream BE1 417 1950 2100 EYW-MIA-MCO 12345 7 19 Miami Gulfstream BE1 487 1835 1945 EYW-MIA-MCO-TLH 12345 7 19 West Palm Beach USAir Express BE1 5304 1830 1920 MCO-PBI-MCO 12345 7 19 West Palm Beach USAir Express BE1 5363 1950 2040 PBI-MCO-PBI 12345 7 19 West Palm Beach USAir Express BE1 5363 2100 2150 PBI-MCO-PBI 12345 7 19 Ft. Lauderdale Comair EM2 3320 2115 2220 MCO-FLL 7 30 Ft. Lauderdale Comair EM2 3410 915 1025 MCO-FLL 7 30 Ft. Lauderdale Comair EM2 3314 1930 2035 MCO-FLL 12345 30 Ft. Lauderdale Comair EM2 3316 800 905 FLL-MCO 123456 30 Ft. Lauderdale Comair EM2 3450 630 730 MCO-FLL 123456 30 Ft. Lauderdale Comair EM2 3434 920 1030 FLL-MCO 1234567 30 Ft. Lauderdale Comair EM2 3435 1110 1220 MCO-FLL 1234567 30 Ft. Lauderdale Comair EM2 3462 1245 1355 FLL-MCO 1234567 30 Miami Comair EM2 3420 1411 1515 PNS-MCO-MIA 1234567 30 Miami Comair EM2 3422 1535 1640 MIA-MCO 1234567 30 Miami Comair EM2 3429 1810 1915 PNS-MCO-MIA 1234567 30 Miami Comair EM2 3430 1935 2045 MIA-MCO 1234567 30 West Palm Beach Comair EM2 3389 1640 1740 MCO-PBI 1234567 30 West Palm Beach Comair EM2 3398 755 855 MCO-PBI 1234567 30 West Palm Beach Comair EM2 3399 920 1020 PBI-MCO-TLH 1234567 30West Palm Beach Comair EM2 3396 1800 1900 PBI-MCO 1234567 30 Ft. Lauderdale Comair EM2 3433 750 900 MCO-FLL 12345 7 30 Ft. Lauderdale Comair EM2 3453 2000 2100 FLL-MCO 12345 7 30 Miami American Eagle SF3 5800 1340 1450 MCO-MIA 67 34 Miami American Eagle SF3 5805 1200 1315 MIA-MCO 67 34 Miami American Eagle SF3 5645 1815 1925 MIA-MCO 1234567 34 Miami American Eagle SF3 5674 650 800 MCO-MIA 1234567 34 Miami Gulfstream SH6 383 730 845 MIA-MCO 6 36 Miami Gulfstream SH6 386 930 1040 MCO-MIA 6 36 Miami Gulfstream SH6 417 1950 2105 EYW-MIA-MCO 6 36 Miami Gulfstream SH6 474 1330 1440 MCO-MIA 6 36 Miami Gulfstream SH6 495 1140 1250 MIA-MCO 6 36 Miami Gulfstream SH6 403 1020 1135 EYW-MIA-MCO 7 36 Miami Gulfstream SH6 484 1255 1410 MCO-MIA 7 36 Miami Gulfstream SH6 486 2030 2140 MCO-MIA 7 36 Miami Gulfstream SH6 436 1115 1220 MCO-MIA 67 36 Miami Gulfstream SH6 493 925 1040 MIA-MCO 67 36

TRAVEL TIME, SAFETY, ENERGY, AND AIR QUALITY IMPACTS
OF FLORIDA HIGH SPEED RAIL
B - 2
Table B-1. Flight Schedules (continued)
Market Airline Aircraft Flight Depart Arrive Itinerary Days Seats
Number Miami Gulfstream SH6 174 1010 1120 MCO-MIA 12345 36 Miami Gulfstream SH6 389 830 940 MIA-MCO 12345 36 Miami Gulfstream SH6 396 1830 1945 TLH-MCO-MIA 12345 36 Miami Gulfstream SH6 483 640 750 MIA-MCO-TLH 123456 36 Miami Gulfstream SH6 427 1300 1415 EYW-MIA-MCO 1234567 36 Miami Gulfstream SH6 428 825 935 MCO-MIA-EYW 1234567 36 Miami Gulfstream SH6 475 1400 1515 NAS-MIA-MCO 1234567 36 Miami Gulfstream SH6 476 1545 1700 MCO-MIA 1234567 36 Miami Gulfstream SH6 395 1640 1755 MIA-MCO 12345 7 36 Miami USAir Express DH8 3287 800 910 TLH-MCO-MIA 6 37 Miami USAir Express DH8 3400 1155 1305 MIA-MCO 6 37 Miami USAir Express DH8 3056 700 815 EYW-MIA-MCO 12345 37 Miami USAir Express DH8 3460 655 805 JAX-MCO-MIA 12345 37 Miami USAir Express DH8 3033 1141 1251 MCO-MIA 1234567 37 Miami USAir Express DH8 3140 1810 1920 MIA-MCO 1234567 37 Miami USAir Express DH8 3271 1030 1140 MIA-MCO 1234567 37 Miami USAir Express DH8 3457 830 940 MCO-MIA 1234567 37 Miami USAir Express DH8 3458 1630 1740 MIA-MCO 1234567 37 Miami USAir Express DH8 3459 1800 1915 MCO-MIA 1234567 37 Miami USAir Express DH8 3461 850 1000 MIA-MCO 1234567 37 Miami USAir Express DH8 3464 1320 1435 MCO-MIA 1234567 37 Miami USAir Express DH8 3468 2041 2154 MCO-MIA 1234567 37 Miami USAir Express DH8 3469 2015 2125 MIA-MCO-JAX 1234567 37 Miami USAir Express DH8 3481 1405 1515 EYW-MIA-MCO 1234567 37 Miami USAir Express DH8 3215 1950 2059 MCO-MIA 12345 7 37 Miami USAir Express DH8 3257 2120 2230 MIA-MCO 12345 7 37 Miami USAir Express DH8 3481 1405 1515 EYW-MIA-MCO 12345 7 37 Miami USAir Express DH8 3482 1610 1725 MCO-MIA-EYW 12345 7 37 Miami American Eagle ATR 5752 555 700 MCO-MIA 12345 46 Miami American Eagle ATR 5800 1340 1450 MCO-MIA 12345 46 Miami American Eagle ATR 5805 1200 1315 MIA-MCO 12345 46 Miami American Eagle ATR 5646 750 900 MCO-MIA 1234567 46 Miami American Eagle ATR 5700 1130 1245 MCO-MIA 1234567 46 Miami American Eagle ATR 5701 2245 2355 MIA-MCO 1234567 46 Miami American Eagle ATR 5718 1115 1225 NAS-MIA-MCO 1234567 46 Miami American Eagle ATR 5746 1915 2030 MCO-MIA 1234567 46 Miami American Eagle ATR 5788 1015 1125 MCO-MIA 1234567 46 Miami American Eagle ATR 5789 835 945 MIA-MCO 1234567 46 Miami American Eagle ATR 5804 1250 1405 MCO-MIA 1234567 46 Miami American Eagle ATR 5828 1810 1925 MCO-MIA 1234567 46 Miami American Eagle ATR 5829 1630 1740 MIA-MCO 1234567 46 Miami American Eagle ATR 5837 1730 1845 MIA-MCO 1234567 46Miami American Eagle ATR 5830 950 1100 MIA-MCO 1234567 46 Miami American Eagle ATR 5675 2050 2155 MIA-MCO 1234 7 46 Miami Comair CRJ 3873 620 715 MIA-MCO 123456 50 Miami Comair CRJ 3702 755 850 MCO-MIA 1234567 50 Miami Comair CRJ 3711 910 1005 MIA-MCO 1234567 50 Miami Comair CRJ 3728 1120 1215 MCO-MIA 1234567 50 Miami Comair CRJ 3780 1235 1330 MIA-MCO 1234567 50 Miami Comair CRJ 3803 1805 1900 MIA-MCO 1234567 50 Miami Comair CRJ 3804 1650 1745 MCO-MIA 1234567 50 Miami Comair CRJ 3802 1950 2050 MCO-MIA 12345 7 50 Ft. Lauderdale Delta Express 73S 2404 2150 2240 IND-MCO-FLL 1234567 107 Ft. Lauderdale Delta Express 73S 2484 700 750 FLL-MCO 1234567 107 Ft. Lauderdale Delta Express 73S 2542 1625 1715 MCO-FLL 1234567 107 Tampa Delta Express 73S 2401 1020 1100 TPA-MCO-SDF 1234567 107 Tampa Delta Express 73S 2406 1050 1130 IND-MCO-TPA 1234567 107 Tampa Delta Express 73S 2408 1840 1920 IND-MCO-TPA 1234567 107 Tampa Delta Express 73S 2420 1200 1240 TPA-MCO-PVD 1234567 107 Tampa Delta Express 73S 2539 1435 1515 TPA-MCO 1234567 107 Tampa Delta Express 73S 2547 1325 1405 MCO-TPA 1234567 107 West Palm Beach Delta Express 73S 2407 1150 1240 PBI-MCO-IND 1234567 107 West Palm Beach Delta Express 73S 2410 2040 2130 SDF-MCO-PBI 1234567 107 West Palm Beach Delta Express 73S 2417 1030 1120 PVD-MCO-PBI 1234567 107 West Palm Beach Delta Express 73S 2525 1605 1655 PBI-MCO 1234567 107

TRAVEL TIME, SAFETY, ENERGY, AND AIR QUALITY IMPACTS
OF FLORIDA HIGH SPEED RAIL
B - 3
Table B-1. Flight Schedules (continued)
Market Airline Aircraft Flight Depart Arrive Itinerary Days Seats
Number West Palm Beach Delta Express 73S 2536 800 850 PBI-MCO 1234567 107 West Palm Beach Delta Express 73S 2537 1445 1535 CMH-MCO-PBI 1234567 107 Tampa Vanguard Airlines 73S 502 1700 1732 DEN-MCI-TPA-MCO 134567 110 Miami Vanguard Airlines 733 202 1400 1455 MIA-MCO-MCI-DSM 1234567 131 Miami Vanguard Airlines 733 281 1240 1331 MCI-MCO-MIA 1234567 131 Miami American 72S 1485 1658 1801 MCO-MIA 1234567 150 Miami United 757 414 630 724 CNF-GRU-MIA-MCO 1234567 188 Miami United 757 415 2100 2155 MCO-MIA-GRU-CNF 1234567 188 Miami American 757 1811 2110 2207 MCO-MIA 1234567 188 Tampa America West 757 2564 2026 2103 PHX-MCO-TPA-LAS-PHX 1234567 190Tampa America West 757 2561 655 734 LAS-TPA-MCO-PHX-LAS 1234567 190 Miami American D10 1483 914 1013 MCO-MIA 1234567 237 Miami American AB3 903 1431 1535 MCO-MIA-CCS 1234567 267
Market Aircraft Flight Flight Depart Arrive Itinerary Days Seats
Number