travel model comparison - caltrans - california …€¦ · · 2012-02-01travel model comparison:...
TRANSCRIPT

Travel Model Comparison: Trip-Based vs. Tour/Activity-Based
& Integrated Land Use/Economic Modeling
Gordon Garry, Sacramento Area Council of Governments (SACOG)
For Caltrans Planning Horizons January 24, 2008

SACOG’s 4Ds Applications (Cont. from Jerry Walters’ presentation)
• 4Ds Post-processor to trip based travel model• Also in I-PLACE3S land use planning model• Both were significant to bringing better
information to the Sacramento regional Blueprint effort
• (However, post-processing the 4Ds limits the full examination of land use effects:
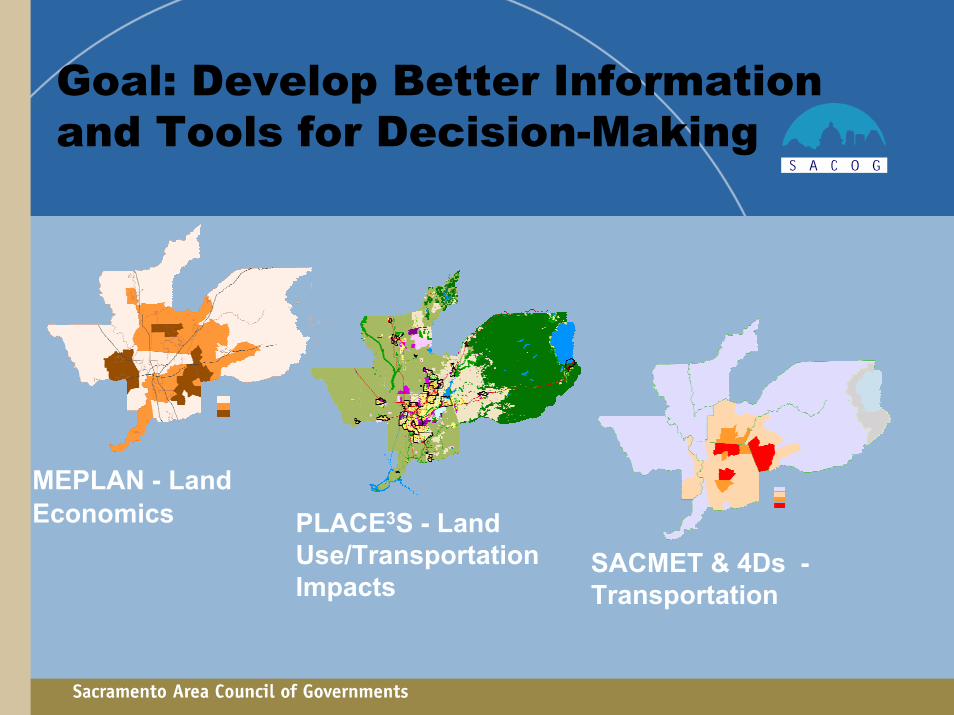
Goal: Develop Better Information and Tools for Decision-Making
MEPLAN - LandEconomics
SACMET & 4Ds -Transportation
PLACE3S - Land Use/Transportation Impacts
SACOG’s Model Development History
• Household Travel Survey (1991)• SACMET travel demand model (1994-2005)• MEPLAN land use model (1995-2001)
– Bob Johnston, Caroline Rodier, John Abraham, Doug Hunt
• Household Travel/Activity Survey (2000)• Integrated Land Use/Travel Model Design
(2001)– PECAS economic land use model– Activity/tour-based travel demand model
SACOG Model Development History (continued)
• Blueprint plan (2002-2004)– SACMET Travel Model with 4Ds
• 4Ds adds land use sensitivities– MEPLAN upgrades (2002) for Base Case scenario– MEPLAN (2003-04) - 6 county
• Improved land use and price data/estimates• Tour-based travel model (2005-07)
– Met. Trans. Plan (2008) and air quality plan (2008)• PECAS integrated land use/economic/transp. model
development (2002-2003, 2008-2009)

Trip-Based vs. Tour/Activity-Based Travel Models
• Trip-based (traditional) travel models based on Aggregate travel (zone-to-zone) – vs. –
• Tour/Activity-based micro-simulation models of the need to travel (re: households)– Provide improved representation of demographic,
spatial, and time variations in the population– Get rid of “Non-Home Based Trips”– Much improved accountability of causes and
impacts of travel and transportation investments

Tours vs. Activities
• “Tour-based” assumes list of activities leads to travel
• “Activity-based” assumes list of activities mostly leads to travel– More person’s time & activity is simulated– Telecommuting and internet shopping
applications– Requires more data on intra-household
interactions, time schedules

Travel Patterns for “Sample” Family…
Sam ple hom e
C entra l C ity
Shopping C enter
OfficeTrip 7
Trip 1
Trip 2
Trip 5
Trip 6School
T rip 8
Trip 9
Soccer fie ld Trip 10
Trip 11
O ffice
Trip 3
Trip 4

Trip Shortening…
Sam ple hom e
O ld Job Location
Shopping C enter
O ld Job Location
Trip 7
Trip 1
Trip 2Trip 5
Trip 6School
Trip 8
Trip 9
Soccer fie ld Trip 10
Trip 11
O ld Appt.location
Trip 3Trip 4
N ew Job
New JobN ew A ppt.Location

Mode Shift…
Sam ple hom e
C entra l C ity
Shopping C enter
OfficeTrip 7
T rip 5
Trip 1
Trip 4
T rip 6School
Trip 8
Soccer fie ld Trip 9
Trip 10
O ffice
Trip 2
Trip 3
New R
ail Li
ne
Trip 11Trip 12
Model Development Agencies: Tour/Activity-Based Travel Models
• In use:– County of San Francisco; New York; Columbus,
Ohio; SACOG, Ohio Dept. of Transportation (DOT), Oregon DOT
• In development:– Portland, Atlanta, Denver, Seattle, Metropolitan
Transportation Commission (SF Bay Area)• Starting development:
– SCAG, Phoenix

Data Requirements(beyond trip-based models)
• Household travel AND activity data– Caltrans and MPOs working on joint survey
effort to improve consistency and reduce cost of collecting data.
• Spatial data– Land use– Population and household demographics– Employment
Integrated Economic,Land Use & Travel Modeling
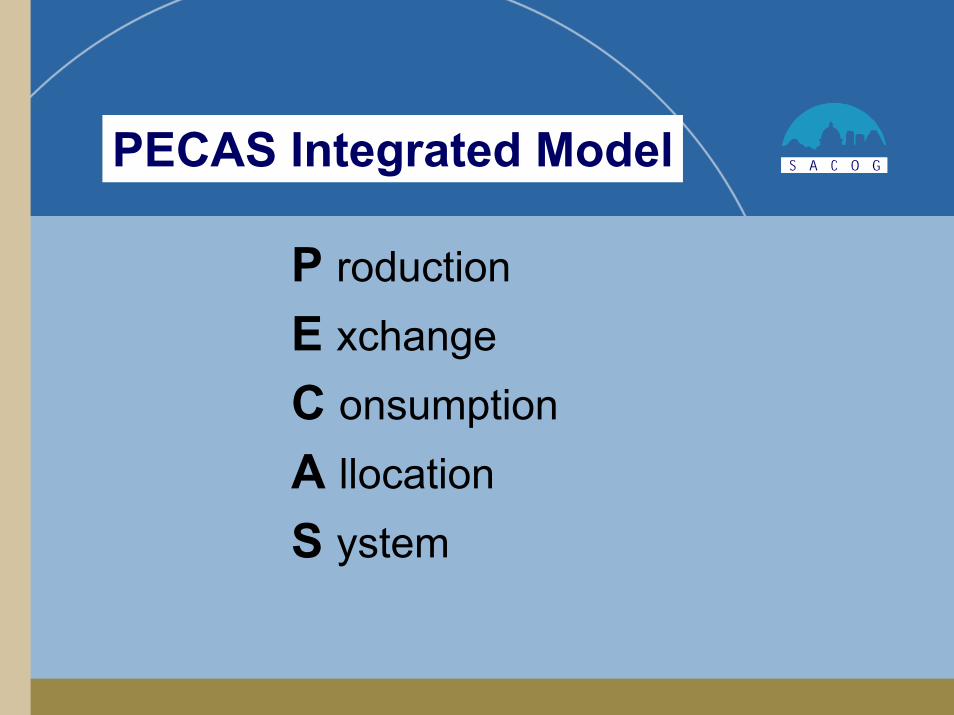
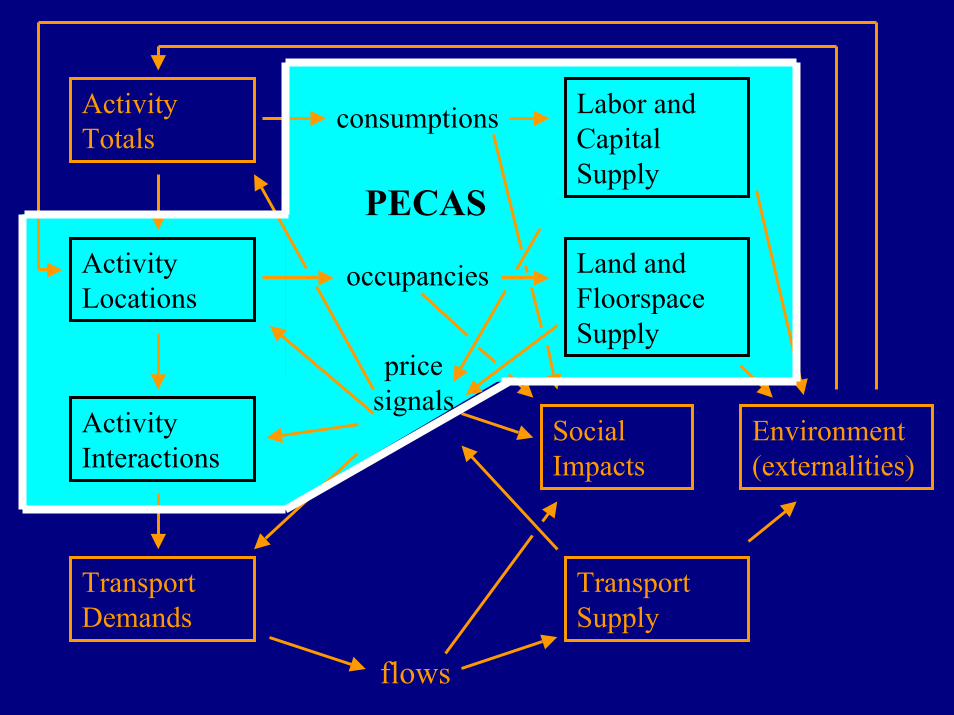
PECAS Integrated Model
P roductionE xchangeC onsumptionA llocationS ystem
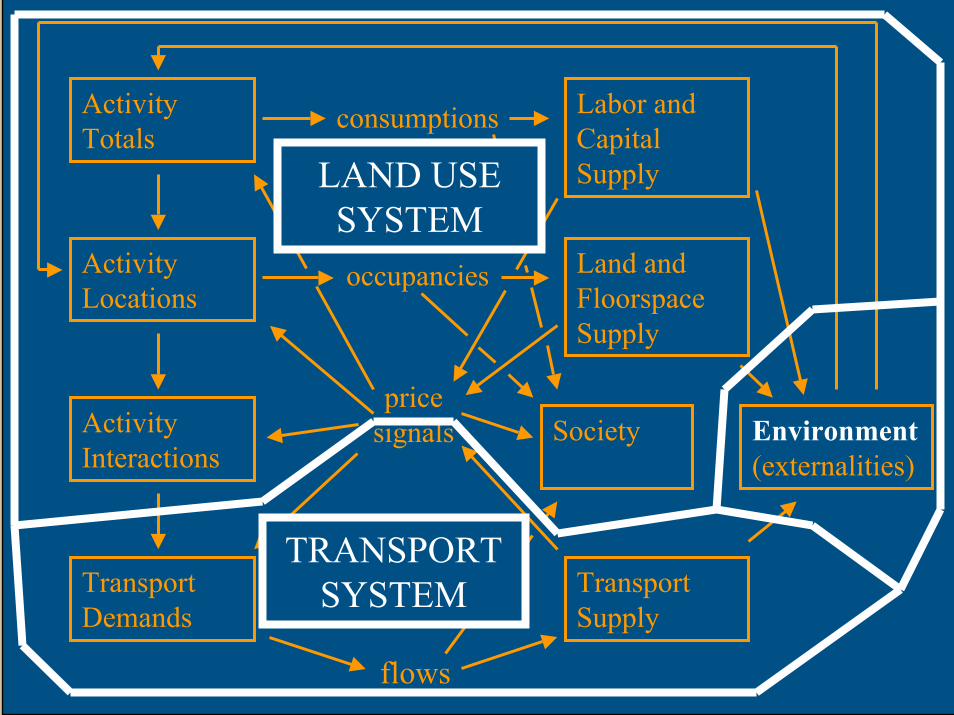
ActivityTotals
ActivityLocations
ActivityInteractions
TransportDemands
TransportSupply
flows
pricesignals
Land andFloorspaceSupply
Labor andCapital Supply
occupancies
consumptions
Society
TRANSPORT SYSTEM
LAND USE SYSTEM
Environment(externalities)
ActivityTotals
ActivityLocations
ActivityInteractions
TransportDemands
TransportSupply
flows
pricesignals
Land andFloorspaceSupply
Labor andCapital Supply
Environment(externalities)
occupancies
consumptions
Social Impacts
PECAS
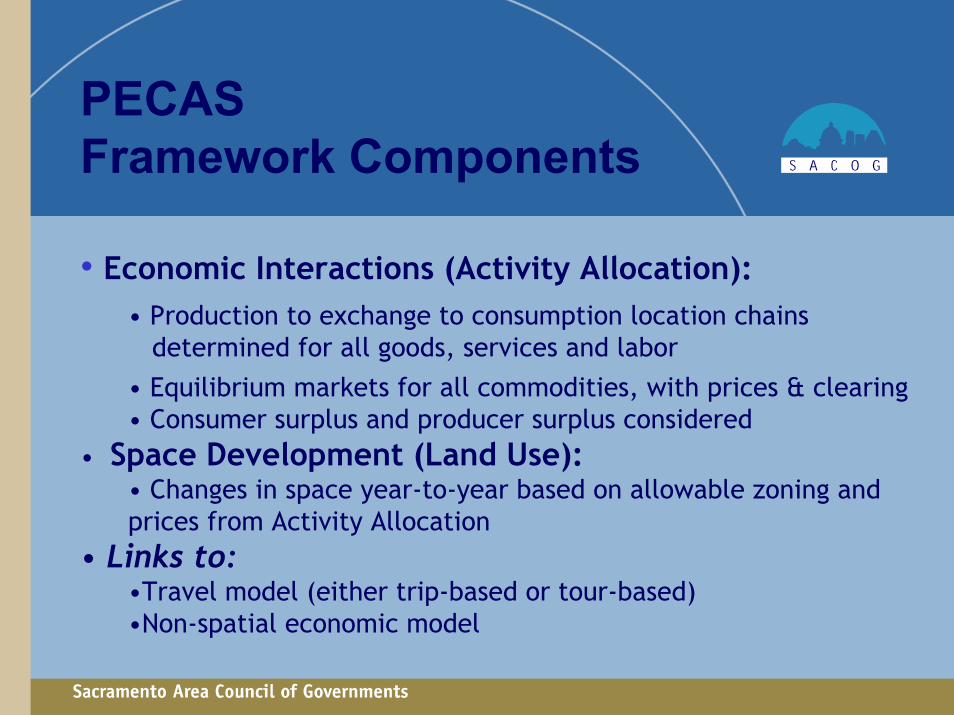
PECAS Framework Components
• Economic Interactions (Activity Allocation):• Production to exchange to consumption location chains
determined for all goods, services and labor• Equilibrium markets for all commodities, with prices & clearing• Consumer surplus and producer surplus considered
• Space Development (Land Use):• Changes in space year-to-year based on allowable zoning and prices from Activity Allocation
• Links to:•Travel model (either trip-based or tour-based)•Non-spatial economic model
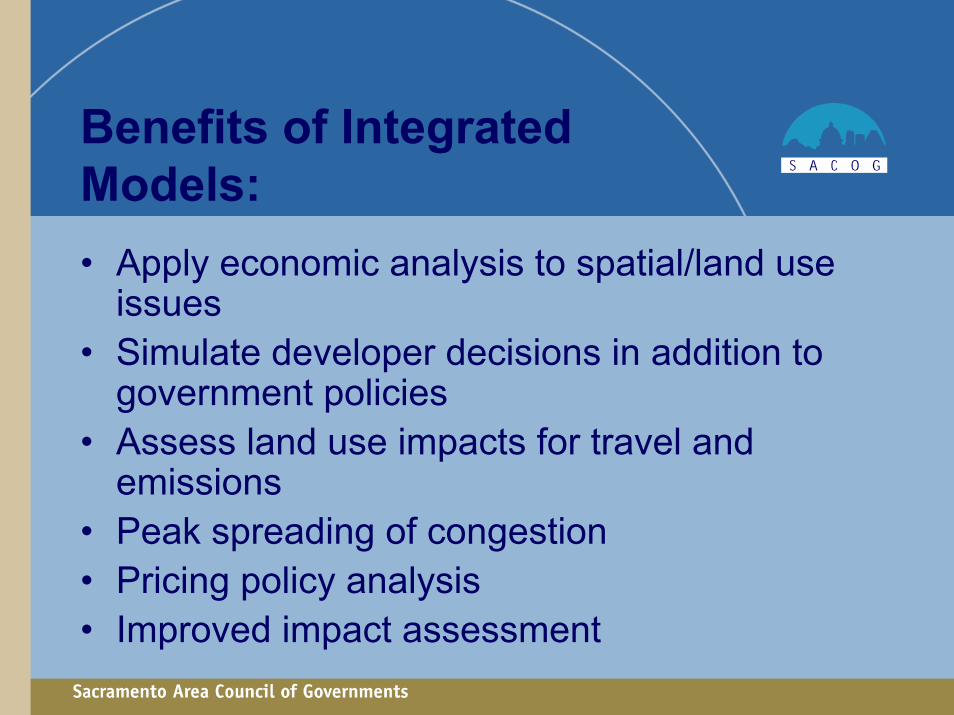
Benefits of Integrated Models:• Apply economic analysis to spatial/land use
issues• Simulate developer decisions in addition to
government policies• Assess land use impacts for travel and
emissions• Peak spreading of congestion• Pricing policy analysis• Improved impact assessment