transportation reliability and trip satisfaction
TRANSCRIPT

Transportation Reliability and Trip Satisfaction
Prepared for:Michigan Department of Transportation
Research Administration OfficeLansing, MI 48909
Prepared by:Timothy J. Gates, Ph.D., P.E., P.T.O.E.
Peter T. Savolainen, Ph.D., P.E.Tapan K. Datta, Ph.D., P.E.
And Ryan G. Todd
Wayne State UniversityTransportation Research Group
5050 Anthony Wayne DriveDetroit, MI 48202
October 31, 2012
FINAL REPORT
ORBP Reference Number: OR10-028
TRANSPORTATION RELIABILITY AND TRIP SATISFACTION
MDOT ORBP Project Number: OR10-028
FINAL REPORT
By Timothy J. Gates, Ph.D., P.E., Peter T. Savolainen, Ph.D., P.E., Tapan K. Datta, Ph.D., P.E., and Ryan G. Todd
Wayne State University - Transportation Research Group October 31, 2012

1. Report No. RC-1584
2. Government Accession No. N/A
3. MDOT Project Manager Jason Firman
4. Title and Subtitle TRANSPORTATION RELIABILITY AND TRIP SATISFACTION
5. Report Date October 31, 2012 6. Performing Organization Code N/A
7. Author(s) Timothy J. Gates, Peter T. Savolainen, Tapan K. Datta, and Ryan G. Todd
8. Performing Org. Report No. N/A
9. Performing Organization Name and Address Wayne State University Transportation Research Group 5050 Anthony Wayne Drive Detroit, MI 48202
10. Work Unit No. (TRAIS) N/A 11. Contract No. 2010-0298 11(a). Authorization No. Z4
12. Sponsoring Agency Name and Address Michigan Department of Transportation Research Administration 8885 Ricks Rd. P.O. Box 30049 Lansing MI 48909
13. Type of Report & Period Covered Final Report 10/1/2011 – 10/31/2012 14. Sponsoring Agency Code N/A
15. Supplementary Notes 16. Abstract
Travel delays and associated costs have become a major problem in Michigan over the past several decades as congestion has continued to increase, creating significant negative impacts on travel reliability on many roadways throughout the State. The Michigan Department of Transportation (MDOT) possesses the capability to distribute real-time travel time, speed, and reliability related information to the public through a variety of communication channels. If properly conveyed, such information would help facilitate necessary trip planning decisions both before and during a trip. Research was performed to develop appropriate communication techniques for distribution of travel reliability and related information to travelers through the MDOT MiDrive website based on the needs of users of the transportation network in Michigan. A number of tasks were performed to achieve this objective, including surveys of travelers, commuters, and the freight industry, in addition to the state-of-the-art and state-of-the-practice reviews. Synthesis of the information obtained from these tasks allowed for conclusions and recommendations to be drawn, including recommended techniques for reliability measurement – specifically buffer time and planning time – in addition to strategies for communication of this information through the MiDrive website. 17. Key Words Reliability, variability, travel times, travel mobility, traffic map, MiDrive
18. Distribution Statement No restrictions. This document is available to the public through the Michigan Department of Transportation.
19. Security Classification - report Unclassified
20. Security Classification - page Unclassified
21. No. of Pages 110
22. Price N/A

i
TABLE OF CONTENTS TABLE OF CONTENTS……………………………………....................................................... i LIST OF FIGURES……………………………………............................................................... iii LIST OF TABLES…………………………………….................................................................. v EXECUTIVE SUMMARY……………………………………................................................... vii CHAPTER 1: INTRODUCTION AND BACKGROUND……………………………………... 1
Statement of Problem…………………………………………………………………….. 2 Objectives and Tasks…………………………………………………………………….. 3
CHAPTER 2: REVIEW OF RELIABILITY MEASUREMENT STRATEGIES………………. 4 Statistical Range Measures………………………………………………………………. 5 Buffer Time Measures…………………………………………………………………… 6 Tardy Trip Indicators…………………………………………………………………….. 9 Current Practice for Online Communication of Traffic Condition Information….......... 11
Summary of Findings…………………………………………………………………… 14 CHAPTER 3: SURVEY OF EN ROUTE TRAVELERS……………………………………… 16 Survey Methods………………………………………………………………………… 17 Results………………………………………………………………………………….. 22 Demographic Characteristics…………………………………………………… 22 Trip Characteristics…….……………………………………………………….. 23 MiDrive Familiarity and Use…………………………………………………… 24 Sources of Traffic Information and MiDrive Use……………………………… 27 Desired Online Traffic Information……………………………………………. 30 Satisfaction with Michigan Travel……………………………………………… 31 Route Satisfaction….…………………………………………………………… 34 Definition of Late Arrival………………………………………………………. 37 Additional Time Budgeted……………………………………………………… 39 Factors Influencing Trip Satisfaction…………………………………………… 40 CHAPTER 4: SURVEY OF MICHIGAN COMMUTERS…………………………………….. 42 Basic Respondent Demographics………………………………………………………. 42 Commute Mode and mode Choice Factors……………………………………………. 44 Commute Duration……………………………………………………………………… 45 Definition of Late Arrival to Work……………………………………………………... 46 Additional Time Budgeted to Ensure On-Time Arrival to Work………………………. 47 Route Preference………………………………………………………………………... 48 Commute Satisfaction………………………………………………………………….. 49 Sources of Traffic Information and MiDrive Use……………………………….……… 54 Desired Online Traffic Information……………………………………………….……. 55 Use of Traffic Information to Modify Travel Plans…………………………………….. 56

ii
CHAPTER 5: FREIGHT INDUSTRY SURVEY……………………………………….…….. 58 Managing Unreliable Routes…………………………………………………………… 59 Managing Late Arrivals………………………………………………………………… 59 Routing and Scheduling Resources…………………………………………………….. 60 CHAPTER 6: CONCLUSIONS……………………………………………………………….. 62 Causes of Unreliable Travel………………………………………………………..…… 62 Impacts of Variability on Traveler Uncertainty………………………………………… 63 Information Needs of Travelers………………………………………………………… 64 En Route………………………………………………………………………… 64 Preparing for Near-Term Departure……………………...…………………….. 65 Planning for Future Departure………………………………………….……….. 65 Utilization of Online Traffic Information and MiDrive………………………………… 66 Satisfaction with Travel in Michigan…………………………………………………… 67 Reliability Measurement………………………………………………………………... 68 CHAPTER 7: RECOMMENDATIONS……………………………………………………….. 70 Strategies for Quantifying Travel Reliability Information……………………………. 70 Buffer Time and Index…………………………………………………………. 70 Planning Time and Index……………………………………………………….. 71 Communication of Reliability Information Using MiDrive………………………...….. 72 Communication of Current Traffic Conditions………………………………………..... 76 Changeable Message Signs………………..……………………………………. 76 MiDrive…………………………………………………………………………. 77 MiDrive User Interface and Alert Notifications………………………………………… 80 CHAPTER 8: IMPLEMENTATION STRATEGY……………………………………………. 85 REFERENCES………………………………………………………………………………….. 88 APPENDIX A: ONLINE TRAFFIC INFORMATION RESOURCES BY STATE…………… 90 APPENDIX B: EN ROUTE TRAVELER SURVEY QUESTIONNAIRE.…….……………… 95 APPENDIX C: MICHIGAN COMMUTER TRAVELER SURVEY QUESTIONNAIRE…..... 96 APPENDIX D: FREIGHT INDUSTRY SURVEY ……………..……………………………..100

iii
LIST OF FIGURES
Figure 1. Relationship between Buffer Time, Planning Time, and Average Travel Time…....... 9
Figure 2. Online Traffic Condition Map and Associated Information, by State……………….. 12
Figure 3. Arizona DOT Online Traffic Condition Map with Phoenix-Area Travel Times……. 13
Figure 4. Washington DOT Online Travel Time Information for Seattle-Area……………….. 14
Figure 5. Michigan Rest Area Site Locations for Traveler Survey ……………………………. 18
Figure 6. Examples of On-Site Rest Area User Survey Administration……………………….. 20
Figure 7. Overall Response for MiDrive Familiarity and Use…………………………………. 25
Figure 8. Traveler Familiarity with MiDrive Based on Demographic and Trip Characteristics.. 26 a. by Trip Purpose, Age Group, and Employment Status b. by Home Region and Home State
Figure 9. Percent of Travelers Using MiDrive at Least Monthly……………………………… 29 a. by Trip Purpose, Age Group, and Employment Status b. by Home Region and Home State
Figure 10. Relative Importance of Online Traffic Information, by Trip Purpose…………........ 31
Figure 11. Satisfaction with Michigan Travel………………………………………................. 33 a. by Trip Purpose and Age Group b. by Home Region and Home State
Figure 12. Satisfaction with Michigan Travel, by Home Region ……………………………... 34
Figure 13. Mean Satisfaction Score by Route and Region – All Travelers……………………. 36
Figure 14. Mean Satisfaction Score by Route and Region – Truck Drivers………………….... 37
Figure 15. Distribution of Unacceptably Late Arrival Times, by Trip Purpose……………...... 38
Figure 16. Extra Time Budgeted – Truck Drivers vs. Other Travelers………………………… 40
Figure 17. Relative Importance of Factors that Influence Trip Satisfaction, by Trip Purpose…………………………………………………………………………….... 41
Figure 18. Importance of Various Mode Choice Factors………………………………………. 45
Figure 19. Percent of Commutes Above and Below 30 minutes, by Work Region………........ 46
Figure 20. Additional Time to Ensure On-Time Arrival ………………………………............ 48
Figure 21. Commuter Preference for Reliability versus Minimum Travel Time………………. 49
Figure 22. Satisfaction with Commute, by Commute Time……………………………………. 51
Figure 23. Satisfaction with Commute, by Work Region……………………………………… 51
Figure 24. Commute Satisfaction within Southeast Michigan, by Subregion…………………. 52
Figure 25. Commute Satisfaction within Southeast Michigan, by Route……………………… 53
Figure 26. Utilization Frequency of Various Traffic Information Sources……………………. 54

iv
Figure 27. Use of Smartphone to Obtain Traffic Information (Smartphone Users Only)……... 55
Figure 28. Traffic Website Information Most Valued by Commuters…………………………. 56
Figure 29. Frequency of Travel Plan Modification based on Traffic Information Received……………………………………………………………………………. 57
Figure 30. Usefulness of Website Information for Route Planning or Scheduling Purposes….. 61
Figure 31. Online Display of Travel Time and Reliability Information from travelmidweststats.com……………………………………………………………... 74
Figure 32. Custom Display Interface and Output from travelmidweststats.com………………. 75
Figure 33. Typical Changeable Message Sign Displays……………………………………….. 77
Figure 34. Sample of Washington DOT Online Travel Time Information for Seattle-Area…... 78
Figure 35. Arizona DOT Online Traffic Condition Map with Phoenix-Area Travel Times…... 78
Figure 36. MiDrive vs. Traffic.com Traffic Map Speed Scales………………………………... 79 a. MiDrive website
b. Google maps and Bing maps c. Traffic.com website
d. Washington DOT website
Figure 37. Current Default View for MiDrive Traditional Website…………………………… 80
Figure 38. Current Default Views for MiDrive Mobile Website………………………………. 81 a. Opening Screen
b. Initial Map View c. Map Layer Selection
d. Current Speeds (Southeast Michigan)
Figure 39. Example MiDrive Mobile Website Icon with Mock Push Alert…………………… 83
Figure 40. Example Traffic Alert Messages…………………………………………………… 84 a. Incident Information (Actual) b. Trip Planning Information (Mock)

v
LIST OF TABLES
Table 1. Types of Travel Planning/Traffic Related Info Available on State Traffic Websites… 12
Table 2. Common Measures of Travel Reliability or Variability Reported in the Literature…. 15
Table 3. Target and Actual Survey Sample Size by Region…………………………………… 17
Table 4. Survey Sample Size by Roadway…………………………………………………….. 18
Table 5. En Route Traveler Survey Locations, Dates, and Number of Responses Obtained….. 21
Table 6. En Route Traveler Survey Participant Demographics………………………………... 22
Table 7. En Route Traveler Survey Trip Characteristics………………………………………. 23
Table 8. MiDrive Familiarity and Use Based on Demographic and Trip Characteristics……... 24
Table 9. Utilization Frequency of Various Traffic Information Sources………………………. 27
Table 10. Frequency of MiDrive Use Based on Demographic and Trip Characteristics………. 28
Table 11. Traffic Website Information Most Valued by Survey Respondents………………… 30
Table 12. Satisfaction with Michigan Travel by Demographic and Trip Characteristics……… 32
Table 13. Route Satisfaction – All Travelers vs. Truck Drivers……………………………….. 35
Table 14. Unacceptably Late Arrival Time, by Trip Purpose………………………………….. 38
Table 15. Additional Time Budgeted to Account for Delay, by Trip Purpose………………… 39
Table 16. List of Employers Submitting Two or More Survey Responses……………………. 43
Table 17. Work Region and Employment Status of Respondents…………………………….. 44
Table 18. Commute Mode Frequency…………………………………………………………. 44
Table 19. Distribution of Commute Times by Work Region…………………………………... 46
Table 20. Unacceptably Late Arrival to Work…………………………………………………. 47
Table 21. Additional Time Budgeted if On-Time Arrival to Work is Necessary……………… 47
Table 22. Satisfaction with Commute by Commute Duration and Work Region…...…………. 50
Table 23. Utilization Frequency of Various Traffic Information Sources……………………... 54
Table 24. Frequency of Travel Plan Modification based on Traffic Information Received…… 57
Table 25. Maximum Amount of Time a Shipment May Arrive Late Without Penalty……….. 59
Table 26. Additional Buffer Time Added as Percent of Total Trip Time……………………… 60
Table A1. Primary Traffic Information Website, by State …………………………………... 90
Table A2. Sample of Traffic Information Websites for Major U.S. Cities…………………….. 92
Table A3. Characteristics and Availability of Online Traffic Information, by State…………... 93
Table D1. Freight Industry Survey Participants……………………………………………….. 100

vii
EXECUTIVE SUMMARY
Travel delays and associated costs have become a major problem in Michigan over the
past several decades as congestion has continued to increase, creating significant negative
impacts on travel reliability on many roadways throughout the State. As it is not possible to
provide a perfectly reliable transportation system due to incidents, roadwork, etc., travelers and
other users of the transportation network are aided by transportation reliability information
disseminated through a broad variety of communication channels. The Michigan Department of
Transportation (MDOT) possesses the capability to distribute real-time travel time, speed, and
reliability related information to the public through a variety of communication channels. If
properly conveyed, such information would help facilitate necessary trip planning decisions both
before and during a trip. Although communication of transportation reliability information has
become more common throughout the United States over the past decade, questions pertaining to
communication of network reliability in Michigan still remain.
The primary objective of this research was to develop appropriate communication
techniques for distribution of travel reliability and traffic related information to the traveling
public and freight industry personnel. Of particular emphasis was determination of appropriate
methods for displaying route reliability information through the MDOT MiDrive website. A
number of tasks were performed to achieve this objective, including surveys of travelers,
commuters, and freight industry logistics professionals, in addition to the state-of-the-art and
state-of-the-practice reviews. Synthesis of the information obtained from these tasks allowed for
conclusions and recommendations to be drawn, which are summarized as follows.
Information Needs of Travelers
The information needs of travelers and freight industry personnel are largely dependent
on when such information is sought with respect to the trip departure. In general, travel
information may be sought at three different points occurring either before or during the trip:
En Route: Travelers that are already en route have the least amount of trip flexibility
and changes are typically limited to selection of an alternate route, assuming a
reasonable alternative exists. The information needs of travelers en route are best

viii
satisfied by the display of current travel time, incident location, road work, or other
congestion information on changeable message signs.
Preparing for Near-Term Departure: Travelers preparing for a near-term departure,
such as regular commuters, have some flexibility with respect to departure time, route
choice, and mode choice. Advance awareness of unfavorable travel conditions allow
these travelers to adjust departure time, select an alternative route, and/or select an
alternative mode. The information needs of travelers preparing for a near-term
departure are best satisfied by the display of current travel speed, travel time, incident
location and status, road work, or transit departure times on a travel information
website, such as MiDrive or television broadcast.
Planning for Future Departure: Trip planning well in advance of departure affords the
greatest level of flexibility with respect to departure time, route choice, and mode
choice. Route reliability information is of particular value to travelers in this category
as it allows for informed decisions to be made pertaining to route choice, departure
time, and/or mode choice. The information needs of travelers planning for future
departure, including freight industry personnel, are best satisfied by the display of
travel time reliability or variability information on a travel information website, in
addition to information pertaining to current and future road work.
State-of-the-Practice for Communicating Online Travel Reliability Information
A review of current nationwide practice found that all states have some level of traffic
related information available online to assist travelers with determining suitable routes and/or
departure times. At the basic level, nearly all states provide information related to construction,
incidents, weather, and/or general roadway condition information, typically on some sort of
interactive state or regional map. Several states, including Michigan, provide a color-coded map
displaying either current travel speeds or traffic flow conditions. In most cases, the information
is hosted on an official state website, although some states provide a link to related information
provided by a third-party. Many states also provide a mobile version of the travel website.
However, and perhaps most relevant to this particular study, it was determined that relatively few
states provide online information related to travel reliability. Furthermore, the states that provide

ix
reliability-related information typically give only basic information, such as a side-by-side
comparison of current versus average segment travel times.
The lack of available online reliability information is perhaps due in part to an overall
lack of consensus within the literature on the quantitative measures that best reflect travel time
reliability. However, it was evident that traffic information should be quantified in a manner that
provides the greatest level of flexibility in order to meet the needs of a broad range of network
users. Furthermore, the data should be communicated to users in a variety of formats, including
both tabular and graphical displays, using a variety of communication channels.
Recommended Methods for Quantifying Travel Reliability Data
Although many options are available for quantifying travel reliability, the measures that
are most effectively utilized by the general public are those that utilize common terminology to
describe quality of service of the particular facility. In a general sense, the most broadly
applicable reliability measures are those that, for a specific period, compare days with high delay
to days with average delay. Consequently, the recommended practices for quantifying travel
reliability information for dissemination to the public through the MiDrive website include:
Buffer Time/Index and Planning Time/Index. These measures were selected due to the inherent
understandability by a broad range of transportation system users as they account for unexpected
delays beyond that which are typical for a specific time of day.
Buffer time refers to the amount of extra time needed beyond the average (or median)
travel time to ensure an on-time arrival for most travelers with a high level of confidence,
typically 95 percent. Travelers concerned with an on-time arrival may use this data to advance
their departure time by the amount of buffer time recommended for the segment. The buffer
time index is simply the buffer time expressed as a percentage of the average travel time, thereby
broadening the applicability by providing a time and distance neutral version of the buffer time.
Planning time relates to the total travel time that should be budgeted to ensure an on-time
arrival for most travelers with a high level of confidence. The planning time is typically
computed as the 95th percentile travel time for the particular segment during the particular time
of day, while the index simply divides this value by the travel time observed during free-flow
conditions. Planning time is very user-friendly as it provides an indication of the amount of time
to be scheduled for the particular segment to be confident in an on-time arrival.

x
Recommended Methods for Communicating Travel Reliability Information via MiDrive
A common theme found throughout the review of the state-of-the-art and practice was
that traffic information should be provided to road users in a variety of formats, including both
tabular and graphical displays, thereby providing adequate flexibility to satisfy a broad range of
users. Thus, it is recommended that MiDrive be modified to include segment travel time and
reliability-related data for each roadway segment for which speed and travel time information are
available. Such information should be displayed in both tabular and graphical formats, thereby
providing information in a manner that is useful to a broad audience. The following data should
be provided within MiDrive for each applicable roadway segment:
Current travel time;
Average travel time for current time-of-day and day-of-week;
95th percentile travel time for current time-of-day and day-of-week (Planning Time);
Difference between current travel time and average travel time, and
Difference between 95th percentile travel time and average travel time (Buffer Time).
Displaying travel time and reliability information in this manner provides information
relevant for nearly all stages of travel planning. For example, travelers preparing for a near-term
departure can utilize the current travel time information to determine the departure time. If on-
time arrival is critical, then the user may consider basing departure on the 95th percentile of travel
times to determine the additional buffer time necessary to account for unexpected delays. For
those concerned with route reliability, comparison can be made between the relative magnitudes
of the typical travel time ranges between reasonable routes to determine the route with the least
variability in travel times for the time period of interest.
These segment reliability data should be provided to users directly from the main
MiDrive traffic condition map by simply clicking on the desired road segment. It may also be
helpful to provide the basic segment reliability statistics, such as current travel time, average
travel time, buffer time, and/or planning time either as a map layer and/or as a table in a small
pop-up window that is displayed upon hovering the cursor above the particular segment.
Modification to the color coded speed scale shown on the MiDrive traffic condition map from a
quantitative (e.g., speed ranges) to a qualitative (e.g., “fast”, “moderate”, “slow”) scale is also
recommended. Additionally, other modifications of MiDrive, including allowing users to
customize the interface, create an account, and register for traffic alerts.

1
CHAPTER 1:
INTRODUCTION AND BACKGROUND
Travel delays and associated costs have become a major problem in Michigan. The
annual urban mobility study performed by the Texas Transportation Institute estimated that the
cost of traffic congestion for commuters in metro-Detroit rose nearly 425 percent between 1982
and 2009 (1). Average annual commuter delays from 1982 to 2009 increased from 14 hours to
33 hours per commuter (136 percent increase) in metro-Detroit and from 4 hours to 18 hours per
commuter (350 percent increase) in Grand Rapids (1). Such congestion increases have
undoubtedly contributed to diminished reliability of the transportation network in Michigan.
Prior research has shown that travelers are not only interested in minimizing the travel
time of a trip, but also in minimizing the uncertainty of travel times (2). Routes with highly
variable travel times are undesirable to travelers, as the ability to accurately estimate the
destination arrival time is diminished. However, the degree to which the uncertainty of travel
times impacts travelers’ route choice and departure time decisions depends largely on the
consequences associated with late arrivals (3).
For business travelers and freight haulers, the consequences of late arrivals may result in
financial loss. These travelers address travel time uncertainty by either departing earlier or using
an alternative route, assuming that a reasonable alternative is available. On the other hand,
leisure travelers typically do not face such financial consequences for arriving late and may
either avoid travel periods that produce unreliable travel times or simply absorb any unexpected
travel delays without making travel adjustments.
In the absence of up-to-date traffic information, travelers are tend to rely on past
experience for route planning and scheduling decisions, which often proves unreliable. As the
value of time has continued to increase along with the demand for on-time deliveries, increasing
pressure has been placed on roadway agencies to convey effective real-time travel mobility
information through a variety of communication channels to assist with travel planning both
before and during a trip. Travelers often utilize this information to assist with route choice,
departure time, or other trip planning decisions.
Transportation agencies commonly communicate real-time travel mobility information to
motorists on changeable message signs and/or an online map. However, such information only

2
describes current roadway conditions and does not relate to the day-to-day variability of
conditions along the roadway, which is critical for trip planning purposes. As a result, roadway
agencies have also begun to measure and communicate information related to the reliability of
the transportation network, which relates to the consistency or dependability in travel times for a
particular route (4).
STATEMENT OF PROBLEM
As it is not possible to provide a perfectly reliable transportation system due to incidents,
roadwork, etc., travelers and other users of the transportation network are aided by transportation
reliability information disseminated through a broad variety of communication channels.
Although transportation reliability research has become more common over the past decade,
questions pertaining to travel time reliability in Michigan still remain. Some of the questions
that are relevant to transportation agencies in Michigan include:
What is the current level of trip satisfaction on the Michigan transportation system?
How does trip satisfaction vary by mode, trip purpose, trip length, and other factors?
How does trip satisfaction relate to reliability?
Which roadways are considered most unreliable in Michigan and why?
How do users of the Michigan transportation network value travel time and its reliability?
How much does travel time reliability contribute to route choice in Michigan?
How do travel time and reliability related values and decisions vary by mode, trip
purpose, trip length, etc. in Michigan?
How should reliability be quantified in Michigan?
How can accurate reliability-related data be measured?
How do users of the transportation network value potential tradeoffs between reliability
and travel time (i.e., longer route with more reliable travel time versus shorter route with
less reliable travel time)?
How can reliability effectively be communicated to users of the transportation network
by MDOT?

3
OBJECTIVES AND TASKS
The primary goal of the research was to develop a better understanding of the needs of
users of the transportation network in Michigan in order to develop appropriate communication
techniques for distribution of travel reliability information. In order to satisfy this goal and
answer the aforementioned questions related to reliability and trip satisfaction, the following
research objectives were developed:
Identify problems travelers encounter on the state’s transportation system that could
adversely impact travel time reliability.
Provide insight and recommendations as to how best to minimize and/or eliminate the
problems.
Determine reliability measures most important to travelers and the freight industry.
Determine factors considered by motorists when choosing a particular mode of travel.
Determine the best practices to measure and subsequently communicate reliability.
The following tasks were performed to satisfy the research objectives:
Perform a comprehensive state-of-the-art and state-of-the-practice review.
Host a stakeholder focus group to discuss reliability issues in Michigan, including
representatives from MDOT, Michigan State Police, freight industry, transit agencies and
others.
Perform a survey of Michigan travelers, providing adequate representation across all
regions of the State and a variety of travel modes and purposes.
Perform a survey of freight industry personnel to investigate the needs and desires of
shippers, carriers, and logistics specialists with respect to travel time reliability.
Synthesize all information to determine the best practices for reliability measurement.
Recommend reliability measures that may be utilized by MDOT for posting to the
MiDrive website or other communication channels.
A full description of all data collected, analyses performed, and results obtained as a part of this
research is provided in the chapters that follow along with conclusions, and recommendations.

4
CHAPTER 2:
REVIEW OF RELIABILITY MEASUREMENT STRATEGIES
A review of the relevant literature and state practice was performed to determine the
current state-of-the-art and state-of-the-practice pertaining to travel reliability and related
subjects. Of particular interest during the review was the experience of other states with respect
to measuring and calculating travel time reliability and effectively communicating this
information to the travelers in a format that is easily understood by travelers across all modes.
Consequently, a nationwide review was conducted to investigate the current methods for
transmitting real-time traffic data, including travel speeds, travel times, road work, incidents, and
reliability information to the traveling public. In addition, a comprehensive literature review was
performed through queries of the Transportation Research Board’s Transportation Research
Information Database (TRID), which provides access to reports, journal articles, conference
proceedings and other publication types from various publication sources around the world.
For reliability data to be effective, it is necessary that the measure have both technical
merit for agency reporting and tracking purposes and also be easily understood by the general
public. It is important to note that no single mobility or reliability measure will satisfy the needs
of all users due to the complexity of trip planning (5). As the measurement and communication
of transportation reliability has continued to evolve over the past decade, several methods of
quantifying transportation reliability currently exist in the literature. However, broad nationwide
implementation of reliability measurement and communication does not yet exist, generally due
to the inability for agencies to effectively collect, store, and distribute data related to current
traffic conditions.
It is first important to note the difference between “reliability” and “variability”. In
practice, the two terms are often used interchangeably, as both describe the impact of non-
recurring congestion on the transportation system – specifically travel time or speed along a
particular route (6). Although they are similarly specified, reliability has been suggested as a
more appropriate definition for communicating to the traveling public as it relates more to the
quality of service provided by the facility (5). More specifically, it provides an indication of the
difference between the expected travel time, such as the average or median travel time, and the
actual travel time along a route (7). Variability measures relate more to statistical range

5
measurements, such as the mean travel time plus a multiple of the standard deviation, which may
be better suited for agency reporting purposes (5). Both types of measures can be defined based
on common mobility measures, such as segment travel times or speeds.
Lomax and Schrank provided a comprehensive taxonomy of existing travel reliability and
variability measures in reference 5. Three general categories for measuring travel time reliability
and variability were suggested, including (5):
Statistical Range Measures – These measures represent theorized or conceptualized
measures. They are typically computed utilizing measures of central tendency (mean
and variance) to estimate of the range of expected travel conditions. These measures
relate more to the variability of network performance rather than reliability.
Although they provide an indication of system performance and are useful for agency
reporting, they are not easily understood by the traveling public.
Buffer Time Measures – These measures indicate the amount of extra (“buffer”) time
that must be allowed for travelers to arrive on time at the destination with a high level
of confidence. The measures are generally presented as either a percentage of the
average trip time (i.e., “add x-percent additional time”) or a value in minutes per mile
or minutes of some typical or average trip. Such measures are a typical
representation of travel reliability and are easily understood by the traveling public.
Tardy Trip Indicators – These measures use a threshold to identify an acceptable late
arrival time in order to answer how often a traveler will be unacceptably late to
his/her destination. The threshold time can be based either on a percentage of the trip
time, an increased time in minutes above the average, or some absolute value in
minutes. These measures are also a typical representation of travel reliability and are
easily understood by the traveling public.
STATISTICAL RANGE MEASURES
This category includes measures of travel variability, computed on the basis of a range of
historical travel times experienced during daily trips along a route (8). One of the earliest and
most simplistic definitions suggested utilizing the inverse of the standard deviation of the travel
time distribution along the route (9). A dimensionless travel time range measure is the travel
time index, which is computed based on the ratio of the average travel time to the free-flow

6
travel time (10). Variability can also be described using a travel time window, which may be
computed using the mean travel time and some multiple of standard deviation (typically 1σ to
2σ) to describe the range of travel times that have been experienced by travelers (5).
Alternatively, the median travel time plus the difference between the upper percentile travel time
and the median travel time has also been proposed. Use of the median travel time is
recommended over the mean to better represent congested travel time conditions, which are
typically positively skewed and follow a log-normal distribution (4,11,12). Uncongested travel
times are typically normally distributed and using the mean value is appropriate (4).
The coefficient of variation is a dimensionless measure of travel time variability and
allows for comparison between trips of varying lengths (7,12,13). The coefficient of variation
(or percent variation), is computed using the ratio of the standard deviation to the average (or
median) travel time, expressed as a percentage, as follows (7):
%100Time Travel Average
DeviationStandard VariationPercent
The variability index is another variability measure, which is calculated as a ratio of the
difference in the upper and lower 95 percent confidence interval travel times between the peak
and off-peak periods (5). Because peak variability is typically greater than off-peak variability,
the variability index values are typically greater than 1.0. The variability index is computed as
follows:
Time Travel percentile 5thOffPeak - Time Travel percentile 95thOffPeak
Time Travel percentile 5th Peak - Time Travel percentile 95thPeak Index y Variabilit
BUFFER TIME MEASURES
Buffer time measures describe unreliable route conditions by quantifying the amount of
extra time that travelers must allow to reach their destination with a high likelihood of being on-
time. They are favorable because they relate to the way travelers make trip-related decisions,
including: “how much extra time do I need to allow?” and subsequently “when do I need to
leave?” In this case, the failure threshold is set at a very low level of tolerance for arriving late.
Consequently, the primary task is to determine the necessary buffer time to ensure a high rate of

7
on-time arrivals, considering all congestion factors including weather, incidents, work zones,
events, holidays, etc. Lomax and Schrank have suggested that the additional travel time
allowances be provided such that late work arrivals would only occur at a rate of once per month
(i.e., approximately 5% of the time) (5). Higher or lower threshold percentiles may be utilized
based on the need to ensure on-time arrivals. The extra time needed to ensure that the average
trip will arrive on time X-percent of the time is typically referred to as the buffer time, which can
be computed assuming 95 percent arrival confidence as follows:
Buffer Time (min) = 95th percentile Travel Time for a Typical Trip – Average Travel Time for a Typical Trip
The challenge lies in defining the typical trip that is to be used as the baseline. To circumvent
this issue, buffer time may be communicated to motorists as extra minutes for a nominal trip
length (i.e., allow 15 extra minutes per hour of travel) or as a value of extra minutes per mile
(i.e., allow 1 extra minute per mile) along a route.
The buffer time index is also a useful measurement of reliability for reporting to the
public (5,10,11,12,14) and provides the advantage of being dimensionless. This measure is
typically computed on the basis of the percent difference between the 95th percentile travel time
(or rate) and the average (or median) travel time (or rate) for the section of interest and converted
to a percent, as follows:
%100Time Travel Average
Time Travel Average - Time Travel percentile 95 Index TimeBuffer X
The index would be communicated to the traveler by suggesting an extra BTI percentage
of total trip time (i.e., “allow 25% extra travel time”) due to unexpected congestion to allow for
an on-time arrival 95 percent of the time. As previously stated, the use of the median travel
times or rates are recommended over the averages to better represent congested travel time
conditions (4,11,12).
It is also important to consider the source of the congestion, such roadwork, incidents or
heavy traffic and the impacts on the particular reliability measure. Research has shown that
roadwork more likely deteriorates buffer index than incidents, meaning disseminating accurate
roadwork information is more important than incident information in order to reduce the
8
additional travel time that is necessary for on-time arrival. (15). Further, Mehran developed a
methodology to estimate the buffer time index by modeling travel time variations as a function
of demand, capacity, weather conditions, and crashes, thereby eliminating the need for empirical
data (16).
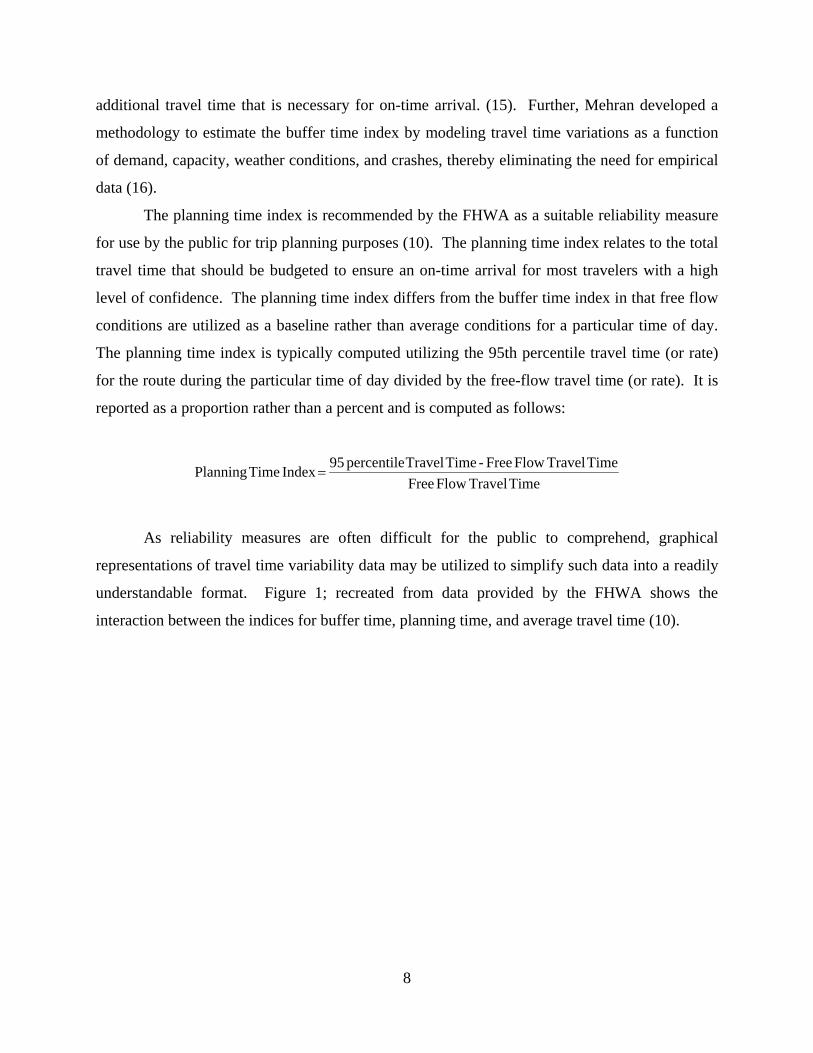
The planning time index is recommended by the FHWA as a suitable reliability measure
for use by the public for trip planning purposes (10). The planning time index relates to the total
travel time that should be budgeted to ensure an on-time arrival for most travelers with a high
level of confidence. The planning time index differs from the buffer time index in that free flow
conditions are utilized as a baseline rather than average conditions for a particular time of day.
The planning time index is typically computed utilizing the 95th percentile travel time (or rate)
for the route during the particular time of day divided by the free-flow travel time (or rate). It is
reported as a proportion rather than a percent and is computed as follows:
TimeTravelFlowFree
Time Travel Flow Free - Time Travel percentile 95 Index Time Planning
As reliability measures are often difficult for the public to comprehend, graphical
representations of travel time variability data may be utilized to simplify such data into a readily
understandable format. Figure 1; recreated from data provided by the FHWA shows the
interaction between the indices for buffer time, planning time, and average travel time (10).

9
Figure 1. Relationship between Buffer Time, Planning Time, and Average Travel Time (10)
This figure charts both the travel time index and planning time index across all times of
the day for a typical weekday. The lines depicting the travel time index and planning time index
track similar trends, but are based on the mean and 95th percentile travel times, respectively. The
difference between the planning time index and the travel time index represents the buffer time,
which can be converted to the buffer time index (percentage) by dividing this value by the
average travel time for the particular time of the day.
TARDY TRIP INDICATORS
Tardy trip indicators are reliability measures that describe how often a traveler will be
unacceptably late and are formulated on the basis of defining a threshold to identify an
acceptable late arrival time. These reliability measures are most commonly utilized in public
transportation, including the bus, rail, and airline industries (17). Whereas buffer time
measurements relate to the extra time needed for a traveler to arrive on-time with a high degree
of likelihood, tardy trip indicators relate to the likelihood of being unacceptably late, or
1.00
1.20
1.40
1.60
1.80
2.00
2.20
12 AM 2 AM 4 AM 7 AM 9 AM 12 PM 2 PM 4 PM 7 PM 9 PM 12 AM
Index Value
Time of Day (weekdays, non‐holidays only)
Travel Time Planning Time
"Buffer" betweenaverage and and 95th percentiletravel times
Travel time index(average)
Planning time index (95th percentile)

10
conversely, on-time. Thus, it is important to define the maximum level of tardiness that is
generally deemed acceptable.
One common tardy trip indicator is that utilized in the Florida Reliability Model (18).
This measure uses the median off-peak travel time plus an additional acceptable amount of travel
time to estimate the upper limit of reliable travel times as follows (19):
Acceptable Travel Time = Median Off-Peak Travel Time + Acceptable Additional Time
Acceptable additional travel time is defined on the basis of a certain threshold percentage
of the median travel time, typically between 5% and 20%. Travel times longer than the
Acceptable Travel Time are considered unreliable and the percent of unreliable trips can be
computed and communicated to motorists based on the percent of total corridor trips that exceed
the Acceptable Travel Time, such as “5% of trips downtown will exceed 1 hour”. The Florida
model may also be modified to utilize travel rate rather than travel time, which provides
reliability estimates that are independent of trip length. This information may be communicated
as, for example “5% of trips require 50% additional travel time”.
A similar alternative to the Florida Reliability Model is to express the information as the
percent of “on-time” arrivals, which is a common reliability measure used by the commercial
airline and transit industries. This reliability measurement is computed based on the percent of
trips that reach a destination over a designated facility within a given travel time (or equivalently,
at a given travel speed or higher) (8,19,20). The on-time arrival percentage is a universal
dimensionless measurement that is easily comprehended by many travelers, which provides
comparability between different periods, and across different facilities and different modes (8).
This concept uses an acceptable “lateness” threshold, which varies based on trip purpose and
cost to arriving late. For example, where leisurely trips may have a higher travel time threshold,
trips to work or freight hauling trips may have a lower threshold. Schrank and Lomax have
suggested a threshold as 10 percent, meaning that the percent of on time arrivals would be
defined as trips that do not exceed 110% of the average travel time for that period (5).
Misery indices are computed based on the average number of minutes that the “worst” x-
percent of trips exceed the average (5). This index is more useful for agency reporting purposes
rather than for communication to the public. For example, the misery index may be computed

11
based on the 20 percent of trips with the longest travel times compared to the average trip
duration, as follows:
(min/mile) Trips Allfor Rate Travel Avg
(min/mile) Trips of 20%Longest for Rate Travel Avg Index Misery
CURRENT PRACTICE FOR ONLINE COMMUNICATION OF TRAFFIC CONDITION
INFORMATION
To counter the increasing congestion levels, many transportation agencies across the
United States, including the Michigan Department of Transportation (MDOT), communicate
real-time segment travel times and other necessary roadway condition data, such as travel speed,
congestion, incident locations, alternative routes, reliability, work zone locations, and/or weather
to travelers. Such information is distributed to travelers through a broad array of communication
methods, most notably via changeable message signs, the internet, in-vehicle GPS, media traffic
reports, highway advisory radio, 511 services, and other sources. These communication methods
help travelers make informed decisions both pre-trip and en route pertaining to route choice,
mode choice, and departure time, and also help them form realistic travel expectations.
Although agencies often collect and communicate real-time roadway condition data using
modern vehicular detection systems, numerous private sector companies also collect and/or
communicate such data.
A nationwide state-of-the-practice review was conducted, specifically focusing on the
procedures utilized by State DOTs with respect to the types of information and methods for
providing travel planning and traffic related information in an online format. A particularly
useful resource was the FHWA’s National Traffic and Road Closure Information website:
http://www.fhwa.dot.gov/trafficinfo/. This website provides a comprehensive collection of
available traffic information websites nationwide, including both DOT websites and commercial
websites. Table 1 and Figure 2 summarize the information found during this review. The list of
available traffic information websites for each of the 50 states and select major cities is provided
in Appendix A. A detailed list of specific information provided within the traffic information
website for each state is also provided in Appendix A.

Table 1.
Type of I
Interactiv
Construct
Incidents
Road Con
Color Cod
Weather C
Travel Tim
Mobile V
Legend: N
T
T
Tre
Figure 2
Types of T
Information
ve Map
tion Info
nditions
ded Speed or F
Conditions
me/Reliability
Version Availab
No traffic con
Traffic condit
Traffic condit
Traffic conditeliability info
2. Online Tr
Travel Plann
Flow
ble
ndition map
tion map
tion map wit
tion map witformation
raffic Condi
ning/Traffic
or related tr
th current se
th current an
tion Map an
12
c Related In
Frequenc
47
48
42
43
35
41
9
30
avel plannin
egment speed
nd average s
nd Associat
nfo Availabl
cy
ng informatio
d or traffic f
egment trav
ted Informa
le on State T
P
on
flow indicati
el times and
ation, by Sta
Traffic Web
Percent
94
96
84
86
70
82
18
60
ons
d/or other
ate
bsites

13
The state-of-the-practice review found that all states have some level of traffic related
information available online to assist travelers with determining suitable routes and/or departure
times. At the basic level, 47 of the 50 states provide information related to construction,
incidents, weather, and/or general roadway condition information, typically on some sort of
interactive state or regional map. In most cases, the information is hosted on an official state
website, and many states also provided a mobile version of the website. In several cases, similar
traffic related information is also available either for the entire state or major metropolitan areas
through one or more third-party websites. Some states provide links to available third-party
website(s) in lieu of displaying the actual traffic information. Although several states provide a
color-coded map displaying either current travel speeds or traffic flow conditions, it was
determined that relatively few states provide information related to travel reliability.
Furthermore, those that do provide such information typically give only basic reliability
information, such as a side-by-side comparison of current vs. average segment travel times.
Arizona DOT provided the best example of a state-maintained website displaying a color
coded map that includes route reliability information, as shown in Figure 3. Washington DOT
also provided a good example for displaying current versus average travel times, although this
information was somewhat difficult to access and was not directly available from the traffic
condition map. Current travel times that exceeded the average were shown as red text, while
travel times that were below the average were shown as green text, as shown in Figure 4.
Figure 3. Arizona DOT Online Traffic Condition Map with Phoenix-Area Travel Times

14
Figure 4. Washington DOT Online Travel Time Information for Seattle-Area
SUMMARY OF FINDINGS
There remains an overall lack of consensus on the quantitative measures that best reflect
travel time reliability. Reliability measures that best serve as agency performance measures may
not be easily utilized by the traveling public. What is evident is that traffic information should
be quantified in a manner that provides the greatest level of flexibility in order to meet the needs
of a broad range of users. The data should be communicated to users in a variety of formats,
including both tabular and graphical displays, using a variety of communication channels.
Lomax and Schrank suggest that selection of mobility-related measures, such as those related to
travel times, speeds, or reliability should (5):
Relate to goals and objectives of the agency;
Clearly communicate results in an understandable and usable format;

15
Be consistent and accurate;
Illustrate effect of improvements over time;
Consider available travel modes in urban areas;
Apply to existing and future conditions;
Apply broadly across all regions, and
Use cost-effective methods to collect and/or estimate data.
The following table provides a summary of several available measures for travel time
reliability and variability along with citations from the research literature.
Table 2. Common Measures of Travel Reliability or Variability Reported in the Literature
Category Measure Prior Research
Statistical Range
Variability Index Lomax (5)
Coefficient of Variation Lomax (5), Pu (12), Rakha (4), Chien and Kolluri (21)
Travel Time Window Lomax (5)
Travel Time Index Lyman and Bertini (22), FHWA (10)
Buffer Time
Buffer Time Index Lomax (5), Pu (12), Chien and Kolluri (21) , Lyman and Bertini (22), Chu (14), Elefteriadou (20), Pu and Meese (15), FHWA (10)
Planning Time Index Lyman and Bertini (22), Chu (14), Pu and Meese (15), FHWA (10)
Tardy Trip
Misery Index Lomax (5)
Florida Reliability Model Florida DOT (18)
On-Time Arrival Rate Elefteriadou (20), Watkins and Rutherford (23)
16
CHAPTER 3:
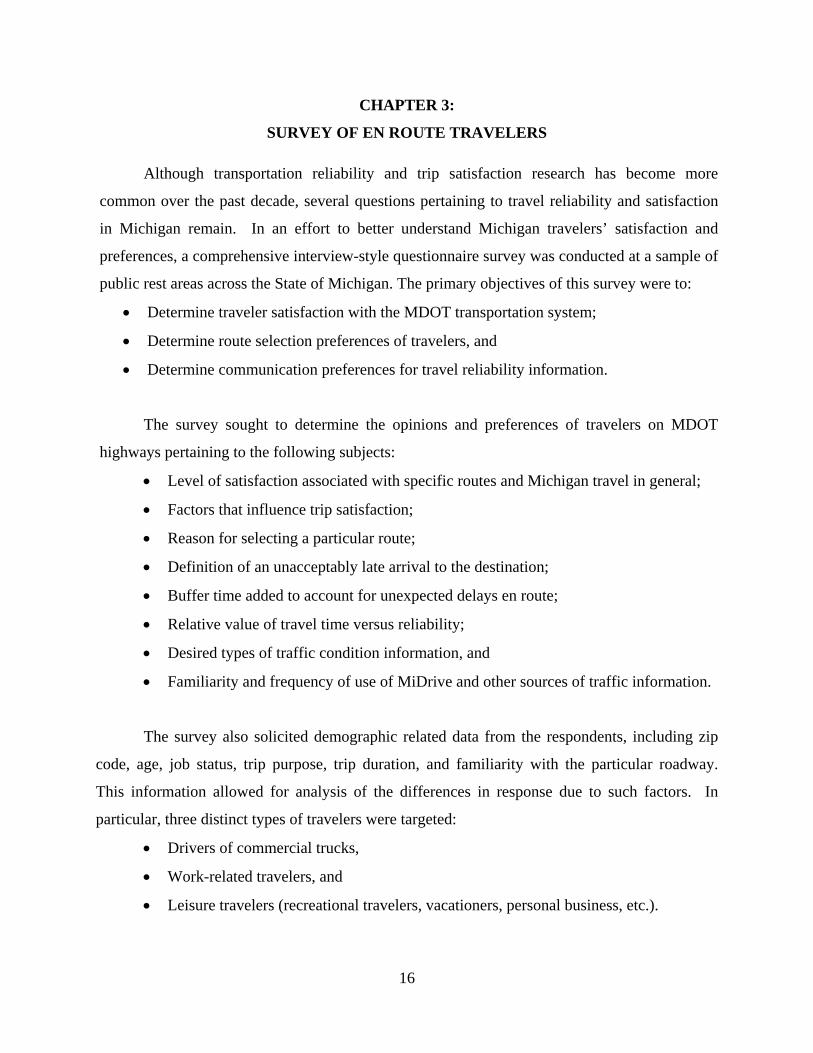
SURVEY OF EN ROUTE TRAVELERS
Although transportation reliability and trip satisfaction research has become more
common over the past decade, several questions pertaining to travel reliability and satisfaction
in Michigan remain. In an effort to better understand Michigan travelers’ satisfaction and
preferences, a comprehensive interview-style questionnaire survey was conducted at a sample of
public rest areas across the State of Michigan. The primary objectives of this survey were to:
Determine traveler satisfaction with the MDOT transportation system;
Determine route selection preferences of travelers, and
Determine communication preferences for travel reliability information.
The survey sought to determine the opinions and preferences of travelers on MDOT
highways pertaining to the following subjects:
Level of satisfaction associated with specific routes and Michigan travel in general;
Factors that influence trip satisfaction;
Reason for selecting a particular route;
Definition of an unacceptably late arrival to the destination;
Buffer time added to account for unexpected delays en route;
Relative value of travel time versus reliability;
Desired types of traffic condition information, and
Familiarity and frequency of use of MiDrive and other sources of traffic information.
The survey also solicited demographic related data from the respondents, including zip
code, age, job status, trip purpose, trip duration, and familiarity with the particular roadway.
This information allowed for analysis of the differences in response due to such factors. In
particular, three distinct types of travelers were targeted:
Drivers of commercial trucks,
Work-related travelers, and
Leisure travelers (recreational travelers, vacationers, personal business, etc.).

17
SURVEY METHODS
The survey locations were selected to include each MDOT region and each major
freeway in Michigan, with bi-directional representation along the primary interstate routes of I-
94, I-75, I-96, and I-69. Selecting sites in this manner ensured statewide representation and
allowed for comparison to be made between traveler responses between regions and routes. The
overall target number of survey responses was determined based on the following equation using
a 1.5 percent margin of error (∆) at a 95 percent level of confidence (Zα/2 = 1.96):
2
222/ 5.0
Z
n
The preceding equation yielded a minimum sample size of approximately 4,270 surveys.
The target number of surveys per region was based on the regional vehicle miles traveled (VMT)
as a proportion of the statewide total. The target number of surveys per region is shown in Table
3 along with the actual number of surveys obtained.
Table 3. Target and Actual Survey Sample Size by Region
Region VMT (2009) % of Total
VMT Target No. of
Surveys Actual No. of
Surveys % of Total
Surveys Bay 12,535,263 13.1 558 987 21.4
Grand 12,170,912 12.7 542 437 9.5
Detroit Metro 35,774,655 37.3 1592 1437 31.2
North 6,407,424 6.7 285 402 8.7
Southwest 10,293,556 10.7 458 537 11.7
Superior 3,196,858 3.3 142 208 4.5
University 15,562,057 16.2 693 599 13.0
TOTAL 95,910,725 100 4,270 4607 100
In order to collect an adequate representation of statewide travelers, the surveys were
administered at 30 MDOT public rest areas and welcome centers located throughout the State of
Michigan. The rest area locations were selected to include at least one rest area within each
MDOT region and along each limited access freeway. Multiple rest areas in each direction were
selected for each of the major truck-haul routes in Michigan, which included I-75, I-94, and I-69.
Table 4 displays the number of surveys obtained by roadway and the location of survey sites is
identified in Figure 5.

18
Table 4. Survey Sample Size by Roadway
Roadway Surveys Obtained
I-94 1293
I-96 789
I-69 160
I-75 1305
I-275 74
US-127 325
US-23 274
US-31 63
US-131 59
US-2 208
I-196 57
TOTAL 4607
Figure 5. Michigan Rest Area Site Locations for Traveler Survey

19
The surveys were conducted at the selected rest areas from May to July 2012. In most
cases, all surveys were obtained for an individual site within a single day, although surveys were
performed on multiple days at selected locations. The surveys were performed on weekdays and
weekends and were typically performed between the hours of 8:30 AM and 4:00 PM. The
surveys were not administered at night for safety reasons. Surveys were typically performed on
weekdays at rest areas located along primary trucking routes, including all freeways in southern
Michigan. Weekend surveys were typically reserved for locations along recreational routes,
particularly those located in northern Michigan and the Upper Peninsula.
The surveys were conducted by a team of two to three individuals. At least one surveyor
was stationed at each entry point to the building with a portable canopy, folding table, and sign,
as shown in Figure 6. Patrons approaching the facility were asked to participate in the survey
and were given the option to take the survey either before or after entering the building.
Whenever possible, the surveyors would also walk through the parking areas to interview
persons that did not enter the building. However, it was not possible to engage all persons that
did not approach the rest area building.
The survey instrument consisted of a one-page questionnaire targeted at drivers and
passengers of passenger vehicles, recreational vehicles, and commercial vehicles. The
questionnaire included a total of 19 questions and was designed to be as concise as possible to
encourage a high level of response. The survey questionnaire included the following topics (full
questionnaire form is provided in Appendix B):
Traveler information, including: zip code, age, and type of job held by respondent;
Trip information, including: trip purpose (truck haul, recreation, work, etc.), trip
duration, time sensitivity for late arrival, and extra buffer time added to account for
delays;
Factors causing highest travel dissatisfaction (arriving late, encountering unexpected
delay, stop-and-go traffic, and traveling below desired speed);
Level of satisfaction with travel on the specific roadway and Michigan travel in general;
Familiarity/frequency of use of MiDrive website for trip planning;
Preferred communication method for reliability information (online, television traffic
reports, radio traffic reports, and in-vehicle devices),

20
Importance of items presented on traffic information websites (travel speeds, travel times,
work zone, incidents, route reliability, etc.).
Figure 6. Examples of On-Site Rest Area User Survey Administration
Table 5 provides a summary of locations and corresponding dates that the surveys were
conducted along with the total number of surveys obtained per location. A total of 4,607 surveys
were obtained, representing an average of 153 surveys per each of the 30 locations. The survey
data were analyzed using ordinal regression techniques to determine the factors that affect the
preferences and behaviors of survey respondents. Given the inherent ordered structure and
multiple categories for each dependent variable, ordered logit models allow for the best analysis
of the data.

21
Table 5. En Route Traveler Survey Locations, Dates, and Number of Responses Obtained
Region* Facility Name Roadway and
Direction Dates Surveys
Conducted (2012) No. of Surveys Bay Clare US-127 NB/SB 6/21 325
Bay Clio I-75 SB 5/24 53
Bay Dodge Rd I-75 NB 5/24 299
Bay Fenton US-23 NB 5/22 58
Bay Linwood I-75 NB 5/25 194
Bay Swartz Creek I-69 EB 5/23 58
Grand Morley US-131 NB 6/14 27
Grand Portland I-96 WB 6/5 115
Grand Rockford US-131 SB 6/14 32
Grand Rothbury US-31 NB 6/15 63
Grand Saranac I-96 EB 6/7, 6/20 143
Grand Zeeland I-196 EB 6/13 57
Metro Detroit* Belleville I-94 WB 5/23, 6/6 211
Metro Detroit* Chelsea I-94 EB 5/17, 6/5 340
Metro Detroit* Clarkston I-75 SB 5/17, 6/6 106
Metro Detroit* Davisburg I-75 NB 5/18, 6/6 97
Metro Detroit* Howell I-96 EB 5/16, 6/1 275
Metro Detroit* Lake Chemung I-96 WB 5/18 180 Metro Detroit* Monroe I-75 NB 5/25 154 Metro Detroit* Westland I-275 NB 5/22 74
North Grayling I-75 NB 6/21 107
North Mackinac I-75 NB 7/6 84
North West Branch I-75 NB 6/21 211
Southwest Battle Creek I-94 EB 6/7 219
Southwest Galesburg I-94 WB 6/8 318
Superior Naubinway US-2 EB/WB 7/7 208
University Grass Lake I-94 WB 5/31 205
University Northfield Church US-23 SB 5/30 216
University Okemos I-96 EB 5/30 76
University Woodbury I-69 WB 5/31 102
TOTAL 4,607
*Metro Detroit included facilities within 25 miles of the MDOT Metro Region and along a primary Interstate freeway leading directly into the Metro Region.

22
RESULTS
Demographic Characteristics
A summary of the survey respondent demographics including home region, age, and job
status is provided in Table 6. Approximately 73 percent of all survey respondents resided in
Michigan, while 19 percent were from other portions of the United States, and 2.5 percent
resided in Canada. The most widely represented MDOT region of residence was the Metro
Region with approximately one third of all respondents, while all other regions of Michigan
combined were represented by a total of 40 percent of the total survey respondents. Nearly 24
percent of respondents were between the ages of 16 and 44, another 20.3 percent were ages 45 to
54, and just over half of the survey participants were 55 years or older. In terms of job status, 63
percent of travelers were employed, while 37 percent reported either being retired, not employed,
or a student.
Table 6. En Route Traveler Survey Participant Demographics Category Sub-Category Number of Respondents Percent of Respondents
Region of Residence (MDOT Region, where applicable)
Superior 40 0.9
North 258 5.6
Grand 405 8.8
Bay 443 9.6
Southwest 269 5.8
University 396 8.6
Metro 1559 33.8
Out of State 881 19.2
Canada 116 2.5
No Response 240 5.2
Age Group
16-29 351 7.6
30-44 737 16.0
45-54 934 20.3
55-64 1291 28.0
65+ 1058 23.0
No Response 236 5.1
Job Status
Full Time: Salary 1390 30.2
Part Time 304 6.6
Student 124 2.7
Full Time: Hourly 837 18.2
Not Employed 177 3.8
Retired 1386 30.1
Self Employed 341 7.4
No Response 48 1.0

23
Trip Characteristics
A summary of the trip characteristics of the survey respondents including trip purpose,
duration, and annual frequency on the particular route is provided in Table 7. The majority of
survey respondents (70 percent) were on leisure trips that were not related to work. This
included trips specified as recreation, vacation, or personal business. Approximately 10 percent
of travelers were commercial vehicle operators driving a truck haul route and the remaining
travelers were on a work trip (21 percent). Over half of travelers were on a trip with duration of
2 to 6 hours, while nearly a quarter of respondents indicated a trip of 8 or more hours. Truck
drivers tended to be on longer trips, as the median truck driver trip duration was approximately 8
hours. The vast majority (approximately 84 percent) of the survey respondents had previously
traveled along the particular section of roadway within the prior 12 months. Only 16 percent
were first-time travelers along the roadway. Truck drivers tended to travel more frequently on
the particular route as weekly travel was the approximate median route frequency for truck
drivers. It is also important to note that the home residence of the surveyed truck drivers was
split approximately evenly between Michigan and all other states. Further, approximately 20
percent of the truck drivers resided in the Metro Region.
Table 7. En Route Traveler Survey Trip Characteristics Category Sub-Category Number of Respondents Percent of Respondents
Trip Purpose
Truck Haul 475 10.3
Work Trip 957 20.8
Leisure Trip 3126 67.9
No Response 49 1.1
Trip Duration
Less than 1 hour 114 2.5
1 to 2 hours 446 9.7
2 to 4 hours 1204 26.1
4 to 6 hours 1056 22.9
6 to 8 hours 709 15.4
8 + hours 1048 22.7
No Response 30 0.7
Annual Frequency On Route
First time 762 16.5
2-5 times 1596 34.6
6-20 times 1109 24.1
20-50 times 540 11.7
51+ times 585 12.7
No Response 15 0.3

24
MiDrive Familiarity and Use
Overall, 22.5 percent of respondents reported that they were familiar with MDOT’s MiDrive
website. Approximately 27 percent of travelers had obtained traffic information prior to
departing on the particular trip, although only 1.9 percent indicated MiDrive as the source. The
responses were found to vary based on several demographic or trip related characteristics, as
reflected in Table 8. The overall results are also displayed in Figure 7.
Table 8. MiDrive Familiarity and Use Based on Demographic and Trip Characteristics
Percent of Respondents
Category Subcategory Sample Size Familiar with
MiDrive Obtained Traffic
Info Today Used MiDrive
Today
Trip Purpose Truck Haul 473 27.4 35.3 4.3 Work Trip 951 25.6 26.6 1.2 Leisure Trip 3096 21.0 25.1 1.8
Age Group
16-29 349 16.1 26.4 2.6 30-44 733 22.9 27.8 1.5 45-54 927 25.7 31.0 2.4 55-64 1283 25.4 25.9 2.1 65+ 1045 17.8 22.0 0.9
Employment Status
Employed 2979 23.7 27.4 2.3 Not Employed 1544 20.1 24.3 1.2
Home Region
Superior 39 17.9 15.4 0.0 North 258 20.6 20.5 1.2 Grand 403 22.9 24.8 1.0 Bay 441 25.6 24.7 1.9
Southwest 267 22.6 25.1 2.3
University 394 27.9 19.3 1.3 Metro 1541 27.4 28.2 2.7
Home State Michigan 3365 25.7 25.3 2.0
Border State 628 13.2 31.8 2.1
Other State 567 14.3 27.9 1.3
Trip Duration
< 2 hours 556 21.8 1.8 2 to 4 hrs 1196 24.1 1.4
4 to 6 hrs 1047 27.3 2.2
6 to 8 hrs 705 28.4 1.7
8 + hrs 1036 29.5 2.3
Number of Times on Roadway
First Time 752 33.5 0.7
2-5 Times 1582 26.8 2.5
6-20 Times 1102 24.0 2.1
21-50 Times 539 21.9 1.9
51+ Times 580 25.7 1.7 TOTAL 4560 22.5 26.5 1.9

25
Figure 7. Overall Response for MiDrive Familiarity and Use.
Truck drivers showed the highest level of familiarity with MiDrive across all traveler
groups at 27.4 percent. Truckers also most frequently obtained traffic information prior to
departure for the particular trip (35.3 percent) and most frequently utilized MiDrive for the
particular trip (4.3 percent). Higher levels of familiarity were observed for travelers between the
ages of 45 and 64, while lower familiarity was observed for the youngest (16 – 29) and oldest
(65+) age groups. The 65 and older age group was also far less likely to have utilized MiDrive
for the particular trip. Travelers that were employed were more likely to be familiar with
MiDrive than travelers that were not employed and were almost twice as likely to have utilized
MiDrive for the particular trip. Travelers residing within Michigan were nearly twice as likely to
be familiar with MiDrive as travelers from out-of-state. However, travelers from outside of
Michigan were more likely to seek traffic information prior to the particular trip. In terms of
MDOT Regions, travelers residing in the Metro and University Regions showed higher levels of
familiarity with MiDrive, while travelers residing in the North and Superior Regions showed
lower levels. Travelers on longer trips, and on the particular roadway for the first time, were
more likely to have sought traffic information prior to departure. The results related to MiDrive
familiarity with respect to traveler demographic and trip characteristics are reflected in Figures
8a and 8b.
0%
10%
20%
30%
40%
50%
60%
70%
80%
90%
100%
Yes No Yes No Yes No
Familiar with MiDrive Obtained Traffic Info Today Used MiDrive Today
Percent of Respondents

26
a. by Trip Purpose, Age Group, and Employment Status
b. by Home Region and Home State
Figure 8. Traveler Familiarity with MiDrive Based on Demographic and Trip Characteristics
0%
5%
10%
15%
20%
25%
30%
Truck Haul Work Trip LeisureTrip
16‐29 30‐44 45‐54 55‐64 65+ Employed NotEmployed
Trip Purpose Age Group Employment Status
Percent Familiar with M
iDrive
0%
5%
10%
15%
20%
25%
30%
Superior North Grand Bay Southwest University Metro Michigan BorderState
OtherState
Home Region Home State
Percent Familiar with M
iDrive
Overall Average
Overall Average

27
Sources of Traffic Information and MiDrive Use
Travelers were also asked about the utilization frequency of various traffic information
sources either before or during travel. The sources included MiDrive, other websites, television,
radio, and GPS. The results are reflected in Table 9.
Table 9. Utilization Frequency of Various Traffic Information Sources
Percent of Respondents
Information Source Never Yearly Monthly Weekly Daily
MiDrive 87.7 5.1 4.4 2.0 0.8
Other Website 68.6 7.9 12.2 8.1 3.2
Television 64.5 4.7 7.8 11.1 11.9
Radio 52.4 4.3 7.5 12.0 23.8
GPS 47.7 5.5 13.5 11.8 21.5
The most commonly utilized sources of traffic information were the radio and GPS
devices with 35 percent and 33 percent of travelers, respectively, using these sources to obtain
traffic information at least weekly. Only about 14 percent of travelers indicated using traffic
websites on a weekly or daily basis, and fewer than 3 percent utilize MiDrive at least weekly.
Approximately 7 percent of travelers utilize MiDrive at least monthly, while only 12.3 percent of
travelers had ever utilized MiDrive.
Additional analyses of the utilization of MiDrive on at least a monthly basis were also
performed across demographics and trip characteristics. These results are displayed in Table 10
and Figure 9. Ten percent of truckers utilized MiDrive at least monthly, which was
approximately 50 percent higher utilization rate than all other travelers. Persons over the age of
65 were approximately 50 percent less likely to utilize MiDrive at least monthly. Employed
persons were approximately 66 percent more likely to utilize MiDrive at least monthly than non-
employed persons. Persons residing in Metro Region showed more frequent utilization of
MiDrive, while persons residing in the Superior Region showed the least frequent utilization.
Michigan residents were more than twice as likely to utilize MiDrive at least monthly compared
to persons residing outside of Michigan.

28
Table 10. Frequency of MiDrive Use Based on Demographic and Trip Characteristics
Percent of Respondents
Category Subcategory Never Yearly Monthly Weekly Daily
Trip Purpose
Truck Haul 87.7 2.3 2.9 3.4 3.7
Work Trip 87.0 3.9 5.3 3.2 0.6
Leisure Trip 88.0 5.7 4.4 1.5 0.4
Age Group
16-29 88.5 4.1 3.4 3.0 1.0
30-44 87.2 5.1 4.5 2.1 1.1
45-54 85.4 5.4 5.6 2.5 1.1
55-64 86.5 6.3 4.5 2.2 0.6
65+ 91.4 3.3 3.9 1.0 0.4
Employment Status Employed 86.6 5.1 4.9 2.4 1.0
Not Employed 89.9 5.0 3.5 1.2 0.3
Home Region
Superior 89.2 8.1 2.7 0.0 0.0
North 90.5 2.9 4.8 1.4 0.5
Grand 85.4 7.3 4.9 1.7 0.7
Bay 88.3 3.8 5.0 2.0 0.9
Southwest 86.0 6.0 4.0 2.5 1.5
University 84.2 8.0 4.5 3.2 0.0
Metro 84.0 6.2 6.3 2.7 0.8
Home State
Michigan 85.6 5.9 5.4 2.4 0.7
Border State 93.2 2.1 2.1 1.5 1.1
Other State 94.0 3.5 1.4 0.5 0.7

29
a. by Trip Purpose, Age Group, and Employment Status
b. by Home Region and Home State
Figure 9. Percent of Travelers Using MiDrive at Least Monthly
0%
2%
4%
6%
8%
10%
12%
Truck HaulWork Trip LeisureTrip
16‐29 30‐44 45‐54 55‐64 65+ Employed NotEmployed
Trip Purpose Age Group Employment Status
Percent Using MiDrive at Least Monthly
0%
2%
4%
6%
8%
10%
12%
Superior North Grand Bay SouthwestUniversity Metro Michigan BorderState
OtherState
Home Region Home State
Percent Using MiDrive at Least Monthly
Overall Average
Overall Average

30
Desired Online Traffic Information
Respondents were also asked to assess the relative importance of various types of traffic
related information that are typically displayed on a traffic information website. The types of
information included travel speeds, travel times, reliability, accident locations, road work
information, wet/icy conditions, and freeway camera views. Table 11 reflects the overall results.
The most highly valued types of information for display on a traffic information website
included construction information, wet/icy road conditions, accidents, and route reliability
information. Travel times, speeds, and freeway camera views were considered less important.
Table 11. Traffic Website Information Most Valued by Survey Respondents
Percent of Respondents
Type of Information Not Important
Somewhat Important Important
Very Important Essential
Road Work 11.8 3.0 11.7 25.1 48.4
Wet/Icy Conditions 12.3 5.0 14.2 25.2 43.3
Accident Locations 12.4 4.5 14.9 25.6 42.5
Reliability Info 13.3 3.8 15.7 29.9 37.3
Travel Times 14.6 5.3 20.3 31.4 28.4
Travel Speeds 15.3 6.4 22.3 30.0 26.0
Freeway Cameras 32.1 16.1 25.0 13.3 13.5
Figure 10 displays the corresponding percentage of respondents who indicated “Very
Important” or “Essential” for a given item, separated by trip purpose. Truck drivers and business
travelers were more likely to desire nearly all types of information compared to leisure travelers.
Business travelers valued nearly all types of information slightly higher than truck drivers.
However, truck drivers were more likely to desire road weather information and freeway camera
views, which were often noted as being useful for verifying road weather conditions downstream
along a route.

31
Figure 10. Relative Importance of Online Traffic Information, by Trip Purpose
Satisfaction with Michigan Travel
Travelers were asked to rate the level of satisfaction associated with Michigan travel on a
1 (very dissatisfied) to 5 (very satisfied) scale. Considering all travelers surveyed, travel in
Michigan had a mean satisfaction score of 3.70, with 62.6 percent providing a rating of 4 or 5
(satisfied or very satisfied). Approximately 13 percent of travelers were dissatisfied or very
dissatisfied with Michigan travel. The level of satisfaction with Michigan travel was also
investigated across the demographic and trip related categories. These results are presented in
Table 12.
0%
10%
20%
30%
40%
50%
60%
70%
80%
90%
Road Work RoadWeather
Accidents Reliability Travel Times TravelSpeeds
FreewayCameras
Percent Responding "V
ery Im
portan
t" or "Essential"
Truck Haul
Work Trip
Leisure Trip

32
Table 12. Satisfaction with Michigan Travel by Demographic and Trip Characteristics
Percent of Respondents
Category Subcategory Dissatisfied or Very
Dissatisfied Neutral Satisfied or Very
Satisfied
Trip Purpose
Truck Haul 16.5 28.4 55.1
Work Trip 12.4 29.9 57.7
Leisure Trip 12.7 22.7 64.6
Age Group
16-29 13.8 27.5 58.7
30-44 11.7 27.3 61.0
45-54 13.4 24.4 62.2
55-64 13.3 25.3 61.4
65+ 13.5 21.0 65.6
Employment Status Employed 12.4 25.6 62.0
Not Employed 13.8 22.5 63.6
Home Region
Superior 5.7 20.0 74.3
North 10.3 28.5 61.2
Grand 9.6 30.1 60.3
Bay 15.2 24.1 60.7
Southwest 10.7 24.9 64.5
University 9.4 27.8 62.8
Metro 17.0 25.0 58.1
Home State
Michigan 13.7 25.9 60.4
Border State 10.3 18.9 70.8
Other State 11.4 22.3 66.3
OVERALL 13.0 24.5 62.6
With the exception of employment status, there were distinct differences with the traveler
satisfaction ratings across the various demographic and trip related categories. Truck drivers
and travelers from the Metro Region tended to be the least satisfied with Michigan travel
compared to all other travelers, as approximately 17 percent of travelers in these categories were
dissatisfied or very dissatisfied with Michigan travel. Travelers from the Superior Region,
travelers from outside of Michigan, leisure travelers and travelers over the age of 65 showed the
highest levels of satisfaction associated with travel in Michigan. Interestingly, travelers from
border states, including Wisconsin, Illinois, Indiana, Ohio, and Ontario were substantially more
satisfied with Michigan travel than travelers from Michigan. The results are displayed in Figure
11. Additionally, the Michigan travel satisfaction scores are displayed by region in Figure 12.

33
a. by Trip Purpose and Age Group
b. by Home Region and Home State
Figure 11. Satisfaction with Michigan Travel
0%
10%
20%
30%
40%
50%
60%
70%
Truck Haul Work Trip LeisureTrip
16‐29 30‐44 45‐54 55‐64 65+
Trip Purpose Age Group
Percent of Responses
Dissatisfied orVeryDissatisfied
Neutral
Satisfied orVery Satisfied
0%
10%
20%
30%
40%
50%
60%
70%
80%
Sup. North Gnd. Bay SW Univ. Metro MI Border Other
Home Region Home State
Percent of Responses Dissatisfied or
VeryDissatisfied
Neutral
Satisfied orVery Satisfied

34
Figure 12. Satisfaction with Michigan Travel, by Home Region
Route Satisfaction
Satisfaction with the particular route was also investigated as part of the survey, both
overall and for truck drivers. The routes with the highest satisfaction rating for all travelers were
I-69 , I-96, and I-94 in the University Region, I-75 in the Bay and North Regions, US-31, I-96,
and US-131 in the Grand Region and US-2 in the Superior Region. The lowest rated roadways
overall were I-75 between the Ohio border and Genesee County, I-94 in the Metro Region, US-
23 in the University Region, and I-196 in the Grand Region.
The routes with the highest satisfaction rating by truck drivers were I-69 and I-96 in the
University Region and I-75 in the Bay Region. The route rated lowest by truck drivers was I-75
ALL TRAVELERS Mean Satisfaction Score by Home Region
3.59
3.59-3.67
3.67-3.69
3.69-3.74
3.74-3.97
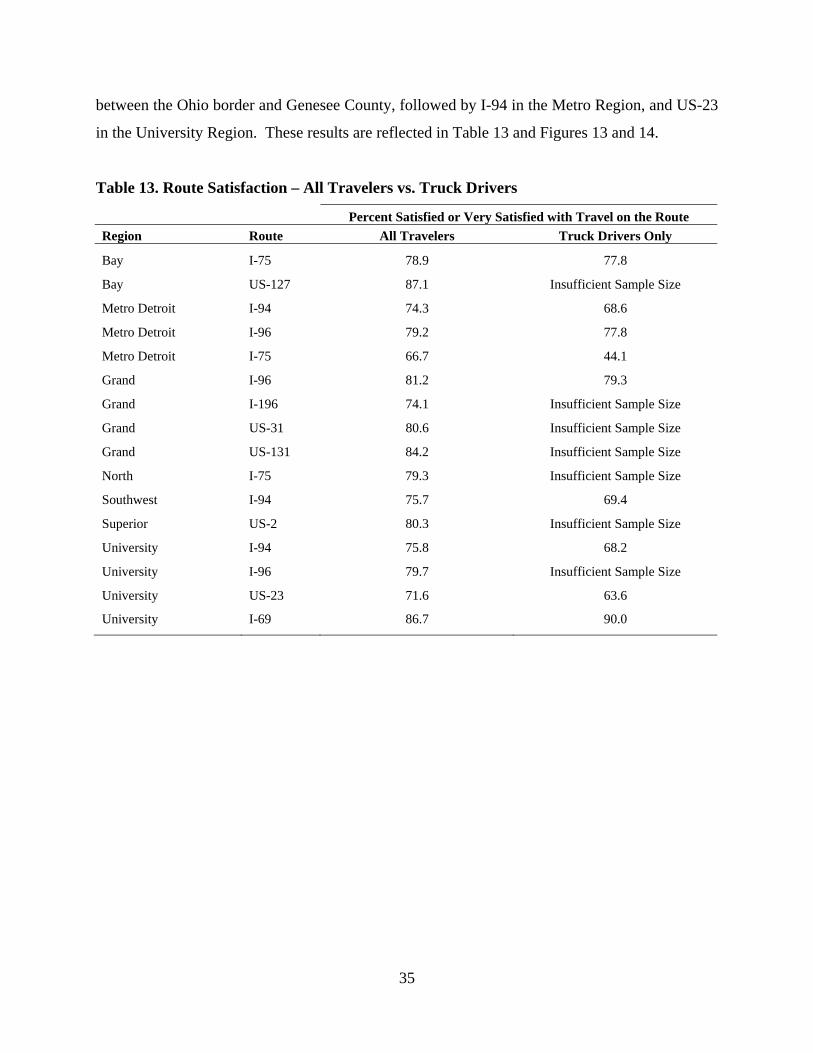
35
between the Ohio border and Genesee County, followed by I-94 in the Metro Region, and US-23
in the University Region. These results are reflected in Table 13 and Figures 13 and 14.
Table 13. Route Satisfaction – All Travelers vs. Truck Drivers
Percent Satisfied or Very Satisfied with Travel on the Route
Region Route All Travelers Truck Drivers Only
Bay I-75 78.9 77.8
Bay US-127 87.1 Insufficient Sample Size
Metro Detroit I-94 74.3 68.6
Metro Detroit I-96 79.2 77.8
Metro Detroit I-75 66.7 44.1
Grand I-96 81.2 79.3
Grand I-196 74.1 Insufficient Sample Size
Grand US-31 80.6 Insufficient Sample Size
Grand US-131 84.2 Insufficient Sample Size
North I-75 79.3 Insufficient Sample Size
Southwest I-94 75.7 69.4
Superior US-2 80.3 Insufficient Sample Size
University I-94 75.8 68.2
University I-96 79.7 Insufficient Sample Size
University US-23 71.6 63.6
University I-69 86.7 90.0

36
Figure 13. Mean Satisfaction Score by Route and Region – All Travelers.
ALL TRAVELERS Mean Satisfaction Score by Route
3.67
3.67-3.87
3.87-3.96
3.96-4.11
4.11-4.27

37
Figure 14. Mean Satisfaction Score by Route and Region – Truck Drivers.
Definition of Late Arrival
Survey respondents provided information on what they considered to be an unacceptable
late arrival to their destination for that particular trip. The results are displayed by trip purpose in
Table 14 and Figure 15.
TRUCK DRIVERS Mean Satisfaction Score by Route
3.42
3.42-3.65
3.65-3.93
3.93-4.17
4.17-4.30

38
Table 14. Unacceptably Late Arrival Time, by Trip Purpose Percent of Respondents Indicating Unacceptable Late Arrival to Destination
Trip Purpose 0-1 min 1-5 min 6-15 min 15-30 min 30+ min Not a concern
Truck Haul 10.4 9.7 16.1 20.1 19.9 23.9
Work Trip 8.9 13.2 26.2 17.3 12.9 21.4
Leisure Trip 3.1 4.7 10.0 14.6 19.1 48.4
Figure 15. Distribution of Unacceptably Late Arrival Times, by Trip Purpose
Travelers on a work trip or truck route were more likely to require an on-time arrival to
their destination compared to those travelers on a leisure trip. Approximately 10 percent of truck
drivers and 9 percent of work travelers required an on-time arrival. Approximately 56 percent of
truck drivers and 66 percent of work travelers required an arrival that was no more than 30
minutes late. The median “lateness threshold” for truck drivers was approximately 18 minutes
and for work travelers was approximately 11 minutes. Almost one-half of all leisure travelers
were not concerned with a late arrival. These results reinforce the expectation that those
traveling on business purposes have a larger requirement to meet a defined schedule in contrast
to those recreational travelers who do not necessarily need to arrive at a prescribed time.
0%
10%
20%
30%
40%
50%
60%
70%
80%
0 5 10 15 20 25 30 35
Percent of Responses
Lateness Threshold (min)
Truck Haul
Work Trip
Leisure Trip

39
Additional Time Budgeted
Travelers were also asked to provide the amount of additional time budgeted into their
trip to account for unexpected delays. The results are provided in Table 15, separated by trip
purpose. Over half of those on leisure trips indicated they did not budget any extra time on their
current trip. On the other hand, nearly one-half of all truck drivers and work travelers budgeted
at least 10 minutes extra into their trip to account for unexpected delays. Commercial truck
drivers were the most likely group to budget 30 or more minutes for their trip, likely due to the
typically greater trip distances compared to other travelers.
Table 15. Additional Time Budgeted to Account for Delay, by Trip Purpose
Percent of Respondents
Additional Time Budgeted (minutes)
Trip Purpose 0 1-10 11-20 21-30 31-60 61-120 121+
Truck Haul 42.9 5.8 13.6 16.0 16.8 3.1 1.8
Work Trip 35.8 12.3 21.8 20.0 8.0 1.2 0.5
Leisure Trip 53.1 4.7 8.5 17.0 13.2 2.5 1.1
As trip duration also influences the amount of buffer time added to a trip, the average
additional time budgeted was plotted as a function of trip duration for both truck drivers and
other travelers. These results are displayed in Figure 16. Not surprisingly, truck drivers
budgeted more time than other travelers across each trip duration category. Truck drivers on
shorter trips tended to report greater amounts of buffer time as a percent of the overall trip while
those on longer trips tended to report proportionally lower amounts of buffer time. Generally
speaking, the amount of time budgeted by truck drivers for trips greater than 2 hours ranged
between approximately 5 percent and 10 percent of the overall trip duration, or 3 minutes to 6
minutes per hour of travel.

40
Figure 16. Extra Time Budgeted – Truck Drivers vs. Other Travelers
Factors Influencing Trip Satisfaction
Respondents to the survey were asked to rate factors that influence trip satisfaction,
including arriving on time, encountering no delays, traveling at high speeds, and avoiding stop-
and-go traffic. Figure 17 displays the results across all trip categories. Commercial truck drivers
and work travelers were most concerned with arriving on time, encountering no delays, and
avoiding stop-and-go traffic. Each of these factors was rated as “very important” or “essential”
factor related to trip satisfaction by 70 to 80 percent of all truck drivers and work travelers.
Leisure travelers were most concerned with avoiding stop-and-go traffic. Traveling at high
speeds was of less importance across all traveler categories.
0
5
10
15
20
25
30
35
40
1 to 2 2 to 4 4 to 6 6 to 8 8+
Additional Buffer Time (min)
Current Trip Duration (hours)
Truck Drivers
Other Travelers

41
Figure 17. Relative Importance of Factors that Influence Trip Satisfaction, by Trip Purpose
0%
10%
20%
30%
40%
50%
60%
70%
80%
90%
Arriving on Time Encountering NoDelays
Traveling at HighSpeeds
Avoiding Stop‐and‐Go‐Traffic
Percent Responding "V
ery Im
portan
t" or "Essential"
Factor Related to Trip Satisfaction
Truck Haul
Work Trip
Leisure Trip

42
CHAPTER 4:
SURVEY OF MICHIGAN COMMUTERS
An online survey was distributed via email to various employers throughout Michigan
during June and July of 2012. The survey questions and format were similar to those utilized in
the en route traveler survey, although the overall theme of the survey was specifically directed
towards commuter travel. The survey questionnaire form is displayed in the Appendix C. The
questions targeted the following topics related to various aspects of the daily commute for
respondents along with other travel related questions, including:
Basic demographic information: home zip code, employer name, employer address,
full time or part time employment status;
Basic commute information: primary routes traveled (no more than 2), typical daily
commute time, frequency of various commute modes, mode and route choice factors;
Threshold for late arrival to work and typical buffer time added to commute to
account for unexpected delays;
Relative importance of route reliability versus overall travel time;
Trip satisfaction information: factors that influence trip satisfaction, satisfaction with
daily commute, regional and statewide travel satisfaction, and
Travel planning: use of travel information resources, MiDrive familiarity and use,
utilization of smartphone for traffic information, usefulness of various types of
information found on a traffic information website, frequency that travel plans are
modified based on traffic info received.
BASIC RESPONDENT DEMOGRAPHICS
A total of 744 responses were received and nearly 200 employers were represented.
Multiple responses were received from 48 employers, which accounted for greater than 75
percent of all survey responses. The top 48 employers are displayed in Table 16 along with the
total number of surveys received from each.

43
Table 16. List of Employers Submitting Two or More Survey Responses
Employer Freq. Pct. Cum. Pct. Employer Freq. Pct.
Cum. Pct.
University of Michigan 76 10.2 10.2 City of Wixom 4 0.5 69.0
Road Comm. for Oakland County 49 6.6 16.8 MDOT 4 0.5 69.5
Univ. of Michigan Health System 45 6.0 22.8 State of Michigan 4 0.5 70.0
Wayne State University 45 6.0 28.9 Eastern Michigan University 3 0.4 70.4
Wade Trim 44 5.9 34.8 Eaton Co. Road Commission 3 0.4 70.8
Ford Motor Company 42 5.6 40.5 Jefferson East Business Asso. 3 0.4 71.2
Blue Cross Blue Shield Michigan 34 4.6 45.0 Providence Park Hospital 3 0.4 71.6
Hubbell Roth & Clark 23 3.1 48.1 AARP Foundation 2 0.3 71.9
City of Ann Arbor 21 2.8 50.9 Ann Arbor Township 2 0.3 72.2
Genesee Co. Road Commission 20 2.7 53.6 Aquatest Laboratories Inc. 2 0.3 72.4
City of Detroit 16 2.2 55.8 Autodesk 2 0.3 72.7
Ann Arbor Transp. Authority 13 1.7 57.5 Carrier & Gable 2 0.3 73.0
Soil and Materials Engineers 12 1.6 59.1 Consumers Energy 2 0.3 73.3
CBRE 10 1.3 60.5 DTE Energy 2 0.3 73.5
City of Grand Rapids 7 0.9 61.4 Focus: HOPE 2 0.3 73.8
Self Employed 7 0.9 62.4 General Electric 2 0.3 74.1
University of Detroit Mercy 7 0.9 63.3 General Motors 2 0.3 74.3
Washtenaw County 7 0.9 64.2 KMG 2 0.3 74.6
Priority Health 6 0.8 65.1 Michigan Fitness Foundation 2 0.3 74.9
SE MI Council of Governments 6 0.8 65.9 Michigan Tech University 2 0.3 75.1
Henry Ford Health System 5 0.7 66.5 Parsons 2 0.3 75.4
Midtown Detroit Inc. 5 0.7 67.2 Transportation Riders United 2 0.3 75.7
Stryker 5 0.7 67.9 Vanguard CDC 2 0.3 75.9
City of Monroe 4 0.5 68.4 Washtenaw Area Transp. Study 2 0.3 76.2
The majority of survey participants worked within Southeast Michigan. In total, 591 of
the 744 responses (79.4 percent) were received from persons who worked with in Wayne,
Oakland, or Washtenaw Counties. Nearly 66 percent of all survey respondents indicated that
they were salaried employees, while 31 percent were hourly employees. Table 17 details the full
breakdown of the respondents by work region and job status.

44
Table 17. Work Region and Employment Status of Respondents
Category Subcategory Reponses Percent of Total
Work Region of Michigan
Metro Detroit/Southeast 625 84.0
- Wayne 263 35.3
- Oakland 121 16.3
- Washtenaw 207 27.8
- Other Southeast 34 4.6
West/Southwest 39 5.2
Lansing/Jackson 25 3.4
Bay 41 5.5
Other 14 1.9
Employment Status
Full Time - Salaried 488 65.6
Full Time - Hourly 177 23.8
Part Time 55 7.4
Other 24 3.2
TOTAL 744 100
COMMUTE MODE AND MODE CHOICE FACTORS
The survey respondents were asked to indicate the frequency of use of various commute
modes, in addition to providing an indication of the importance of various factors with respect to
selection of commute travel mode. As expected, the vast majority of survey respondents (80.8
percent) use their personal vehicle to travel to and from work on a daily basis. Of the remaining
commuters, approximately 6 percent use a bus at least weekly and approximately 16 percent
commute via bus at least once per year. Table 18 indicates the frequency of common commute
modes.
Table 18. Commute Mode Frequency
Percent of Respondents Commute Mode Never Yearly Monthly Weekly Daily
Personal Vehicle 3.5 3.0 4.0 8.7 80.8
Carpool/Rideshare 80.5 10.2 3.1 3.0 3.2
Bus 84.1 7.9 2.2 2.0 3.8
Bicycle 84.8 7.0 2.4 3.5 2.3
Walk 88.7 4.4 1.5 2.2 3.2
Telecommute 64.8 23.8 7.4 2.4 1.6
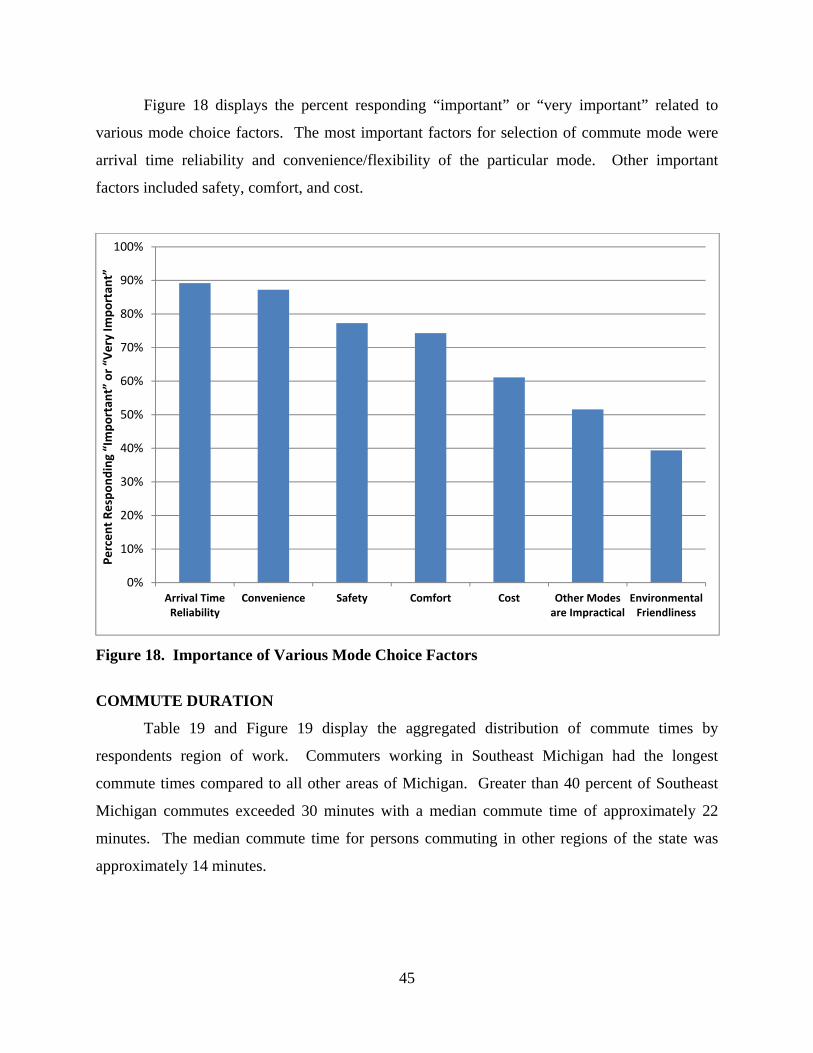
45
Figure 18 displays the percent responding “important” or “very important” related to
various mode choice factors. The most important factors for selection of commute mode were
arrival time reliability and convenience/flexibility of the particular mode. Other important
factors included safety, comfort, and cost.
Figure 18. Importance of Various Mode Choice Factors
COMMUTE DURATION
Table 19 and Figure 19 display the aggregated distribution of commute times by
respondents region of work. Commuters working in Southeast Michigan had the longest
commute times compared to all other areas of Michigan. Greater than 40 percent of Southeast
Michigan commutes exceeded 30 minutes with a median commute time of approximately 22
minutes. The median commute time for persons commuting in other regions of the state was
approximately 14 minutes.
0%
10%
20%
30%
40%
50%
60%
70%
80%
90%
100%
Arrival TimeReliability
Convenience Safety Comfort Cost Other Modesare Impractical
EnvironmentalFriendliness
Percent Responding “Importan
t” or “V
ery Im
portan
t”

46
Table 19. Distribution of Commute Times by Work Region
Percent of Respondents
Work Region 5 min or less 6-10 min 11-20 min 21-30 min 31-45 min 46-60 min More than
1 hour Southeast 1.9 9.7 21.1 25.9 22.5 14.9 4.0
West/Southwest 0.0 12.8 33.3 20.5 12.8 10.3 10.3
Lansing/Jackson 12.0 8.0 44.0 8.0 12.0 16.0 0.0
Flint/Bay 12.2 9.8 34.1 19.5 19.5 4.9 0.0
Other 7.7 53.8 0.0 15.4 15.4 7.7 0.0
TOTAL 2.8 10.6 22.8 24.5 21.4 14.0 3.9
Figure 19. Percent of Commutes Above and Below 30 minutes, by Work Region
DEFINITION OF LATE ARRIVAL TO WORK
Commuters were also asked to indicate what was considered an unacceptable late arrival
to their destination, with the results shown in Table 20. On-time arrival was required by 15.6
percent of commuters and another 14.8 percent responded that arriving more than 5 minutes late
was unacceptable. Conversely, greater than 23 percent of commuters indicated that late arrivals
to work could either exceed 30 minutes or were not a concern. The median late arrival threshold
0%
10%
20%
30%
40%
50%
60%
70%
80%
90%
Southeast West/Southwest Lansing/Jackson Flint/Bay Other
Percent of Commuters
30 min orless
More than30 min

47
for all commuters was approximately 9 minutes, which was similar to the median threshold for
late arrival of 10 minutes reported by business travelers in the en route traveler survey.
Table 20. Unacceptably Late Arrival to Work
Maximum Late Arrival Percent of Respondents
0 min 15.6
1-5 min 14.8
6-15 min 25.3
16-30 min 21.1
More than 30 min 9.3
Not a concern 14.0
ADDITIONAL TIME BUDGETED TO ENSURE ON-TIME ARRIVAL TO WORK
In order to account for unexpected delays arising during their drives, commuters were
asked to indicate how much extra time they budget if an on-time arrival to work is necessary.
Greater than 45 percent would budget an additional 10 minutes or less into their commute.
Slightly less than 12 percent indicated buffering an additional 20 minutes or more. These results
are displayed in Table 21.
Table 21. Additional Time Budgeted if On-Time Arrival to Work is Necessary
Buffer Time Percent of Respondents
0 min 3.0
1-5 min 14.4
6-10 min 28.2
11-15 min 29.9
16-20 min 13.0
21-30 min 8.6
More than 30 min 3.1
The amount of additional buffer time is also sensitive to the overall commute duration.
The average additional time added to the commute is shown versus commute duration in Figure
20. For commutes greater than 20 minutes in duration, the average additional time added to the
commute to ensure an on-time arrival ranged from approximately 30 percent to 40 percent of the

48
overall commute time. In other words, a typical commuter would add between 9 and 12 minutes
of additional time to ensure on-time arrival for an average commute of 30 minutes. Commuters
with shorter duration commutes tend to add proportionally greater buffer time, typically adding
between 70 and 130 percent of the typical trip duration if an on-time arrival is necessary.
Figure 20. Additional Time to Ensure On-Time Arrival
ROUTE PREFERENCE
In order to determine the relative importance of minimizing travel time variability versus
overall travel times, commuters were asked to indicate whether they preferred either:
A slightly slower router with more reliable travel times, or
A slightly faster route with less reliable travel times.
This question was asked separately for commute trips versus vacation/recreation trips.
The results are shown in Figure 21. Commuters showed a strong preference towards route
reliability for their daily commute. Vacation travel was more evenly split between reliability and
minimizing travel time, although reliability was still preferred.
0
2
4
6
8
10
12
14
16
18
20
5 min or less 6‐10 min 11‐20 min 21‐30 min 31‐45 min 46‐60 min More than 1hour
Average
Additional Tim
e Added to Commute (min)
Average Commute Time

49
Figure 21. Commuter Preference for Reliability versus Minimum Travel Time
COMMUTE SATISFACTION
Commuters were asked to rate the level of satisfaction associated with their daily
commute on a 1 (very dissatisfied) to 5 (very satisfied) scale. Considering all commuters
surveyed, the average commute satisfaction score was 3.61, with 65.4 percent providing a
commute satisfaction rating of 4 or 5 (satisfied or very satisfied). Approximately 18 percent of
commuters were dissatisfied or very dissatisfied with their commute. The level of satisfaction
with Michigan travel was also investigated across the commute duration and work region
categories. These results are presented in Table 22.
0%
10%
20%
30%
40%
50%
60%
70%
80%
90%
Commute Route Preference Vacation Route Preference
Percent of Respondents
Slower/More Reliable
Faster/Less Reliable

50
Table 22. Satisfaction with Commute by Commute Duration and Work Region
Percent of Respondents
Category Subcategory Dissatisfied or Very
Dissatisfied Neutral Satisfied or Very
Satisfied
Commute Duration
20 min or less 6.7 10.7 82.6
21 min – 45 min 17.0 19.1 63.9
Greater than 45 min 42.9 22.6 34.6
Work Region
Southeast 19.7 17.4 62.9
West/Southwest 5.3 21.1 73.7
Lansing/Jackson 12.5 8.3 79.2
Flint/Bay 2.4 17.1 80.5
OVERALL 17.9 16.7 65.4
There is a very strong negative correlation between commute time and commute
satisfaction. As commute time increases, the commuter’s satisfaction with his/her daily
commute tends to decrease. Nearly 83 percent of survey respondents commuting 20 minutes or
less were either satisfied or very satisfied with their commutes. However, only 34.6 percent of
respondents with commute times greater than 45 minutes were satisfied or very satisfied, while
nearly 43 percent were dissatisfied or very dissatisfied with their commutes. Not surprisingly,
commuters in Southeast Michigan were the least satisfied with their commutes. These results
are also reflected in Figures 22 and 23.

51
Figure 22. Satisfaction with Commute, by Commute Time
Figure 23. Satisfaction with Commute, by Work Region
0%
10%
20%
30%
40%
50%
60%
70%
80%
90%
20 min or less 21 ‐ 45 min Greater than 45 min
Percent of Respondents Dissatisfied or Very
Dissatisfied
Neutral
Satisfied or VerySatisfied
0%
10%
20%
30%
40%
50%
60%
70%
80%
90%
Southeast West/Southwest Lansing/Jackson Flint/Bay
Percent of Respondents Dissatisfied or Very
Dissatisfied
Neutral
Satisfied or VerySatisfied

52
The relatively large sample of commuters in Southeast Michigan allowed for additional
analysis to be performed with respect to commute satisfaction by route and sub-area within the
region. In particular, the satisfaction of commuters working in downtown Detroit (zip code
48226) was compared to other areas of Detroit, and Southeast Michigan, and elsewhere in
Michigan. These results are displayed in Figure 24.
Figure 24. Commute Satisfaction within Southeast Michigan, by Sub-Region
Persons commuting to downtown Detroit were found to possess the lowest satisfaction
scores within Detroit, Southeast Michigan, and Michigan in general. Fewer than one-half of all
commuters working in downtown Detroit were satisfied or very satisfied with their commute.
Other work locations displaying relatively low commute satisfaction scores were in other areas
of Detroit and Washtenaw County. The highest levels of commute satisfaction statewide were
noted by workers located outside of Southeast Michigan. Within Southeast Michigan, the
highest commute satisfaction scores were associated with commuters working in portions of
Wayne County outside of Detroit followed closely by commuters working in Oakland County
0%
10%
20%
30%
40%
50%
60%
70%
80%
DowntownDetroit(48226)
Midtown andNew CenterDetroit
All OtherDetroit
All OtherWayneCounty
OaklandCounty
WashtenawCounty
All OtherLocationsStatewide
Percent of Respondents Dissatisfied or
Very Dissatisfied
Neutral
Satisfied or VerySatisfied

53
The commute satisfaction scores within Southeast Michigan were also investigated by
route, with the results displayed in Figure 25. Fewer than half of commuters that utilize I-696
and US-23 were either satisfied or very satisfied with their commutes and were the lowest-rated
commute routes statewide. Commutes that included I-75, I-275, and I-94, in Southeast Michigan
were rated only slightly more favorably. In general, commutes that primarily involved local
roadways were associated with the highest levels of satisfaction in Southeast Michigan. The
MDOT roadways possessing the highest commute satisfaction scores included M-39, M-10, and
non-freeways, including M-1, US-24, and M-59.
Figure 25. Commute Satisfaction within Southeast Michigan, by Route
0%
10%
20%
30%
40%
50%
60%
70%
80%
90%
I‐696 US‐23 I‐75 I‐275 I‐94 M‐14 I‐96 M‐10 MDOTNon
Freeway
M‐39 LocalRoads
Percent of Commuters
Dissatisfiedor VeryDissatisfied
Neutral
Satisfied orVerySatisfied

54
SOURCES OF TRAFFIC INFORMATION AND MIDRIVE USE
Commuters were also asked about the utilization frequency of various traffic information.
Same as the en route traveler survey, the sources included MiDrive, other websites, television,
radio, and GPS. The results are reflected in Table 23 and Figure 26.
Table 23. Utilization Frequency of Various Traffic Information Sources
Percent of Respondents
Source Never Yearly Monthly Weekly Daily
MiDrive 73.4 16.4 6.9 2.4 0.9
Other Website 52.8 24.5 13.3 6.9 2.6
GPS 48.0 18.7 18.0 9.8 5.5
Television 39.4 22.0 13.0 11.2 14.4
Radio 16.8 15.5 16.0 19.9 31.9
Figure 26. Utilization Frequency of Various Traffic Information Sources
The most utilized sources of traffic information was the radio with more than 50 percent
utilizing radio for traffic information weekly or daily. Only about 13 percent of commuters
indicated using traffic websites on a weekly or daily basis, which was consistent with the traveler
survey. MiDrive use was relatively low, as only approximately 10 percent utilize MiDrive on at
least a monthly basis, 3 percent on a weekly basis, and 1 percent on a daily basis. Greater than
0%
10%
20%
30%
40%
50%
60%
70%
80%
Never Yearly Monthly Weekly Daily
Percent of Responses
MiDrive
Other Website
GPS
Television
Radio

55
26 percent of commuters had utilized MiDrive at least once in the past, which was more than
double the MiDrive utilization found in the en route traveler survey.
Commuters were also asked to indicate the frequency of use of a web-enabled
smartphone to obtain traffic information. Slightly less than 70 percent of commuters own a
smartphone. However, smartphone owners were far more likely to obtain traffic information
from an online source, as indicated in Figure 27. Greater than 37 percent of smartphone owners
obtain traffic information via smartphone at least monthly, while greater than 18 percent and 6
percent obtain traffic information via smartphone at least weekly or daily, respectively.
Figure 27. Use of Smartphone to Obtain Traffic Information (Smartphone Users Only)
DESIRED ONLINE TRAFFIC INFORMATION
Commuters were also asked to assess the relative importance of various types of traffic
related information that are typically displayed on a traffic information website, including travel
speeds, travel times, reliability, accident locations, current and future road work information,
wet/icy conditions, freeway camera views, bus arrival information, and special event
information. Figure 28 displays the responses for “Important or Very Important.” The most
highly valued types of information for display on a traffic information website included current
36.5%
26.2%
18.8%
12.2%
6.2%
0%
5%
10%
15%
20%
25%
30%
35%
40%
Never Yearly Monthly Weekly Daily
Percent of Respondents

56
road work and accident locations. Travel times, weather, reliability, travel speeds, future road
work, and special event information were also commonly rated as important or very important.
Bus arrival times and freeway camera views were considered less important.
Figure 28. Traffic Website Information Most Valued by Commuters
USE OF TRAFFIC INFORMATION TO MODIFY TRAVEL PLANS
Additional analyses was performed to determine the way commuters utilize traffic
information to modify travel plans, with respect to route choice, departure time, or mode choice.
These results are displayed in Table 24 and Figure 29. Nearly 60 percent of commuters
indicated that the information was utilized to change the travel route at least one-half of the time.
Greater than 47 percent of commuters utilized the information to modify the departure time for
the trip at least one-half of the time. Commuters are far less likely to use the information for
mode choice modifications, as fewer than 18 percent utilized this information more than one-half
of the time to change the travel mode.
0%
10%
20%
30%
40%
50%
60%
70%
80%
90%
CurrentRoadWork
Accidents TravelTime
Weather Reliability TravelSpeeds
FutureRoadWork
SpecialEvents
BusTimes
FreewayCameras
Percent of Responses
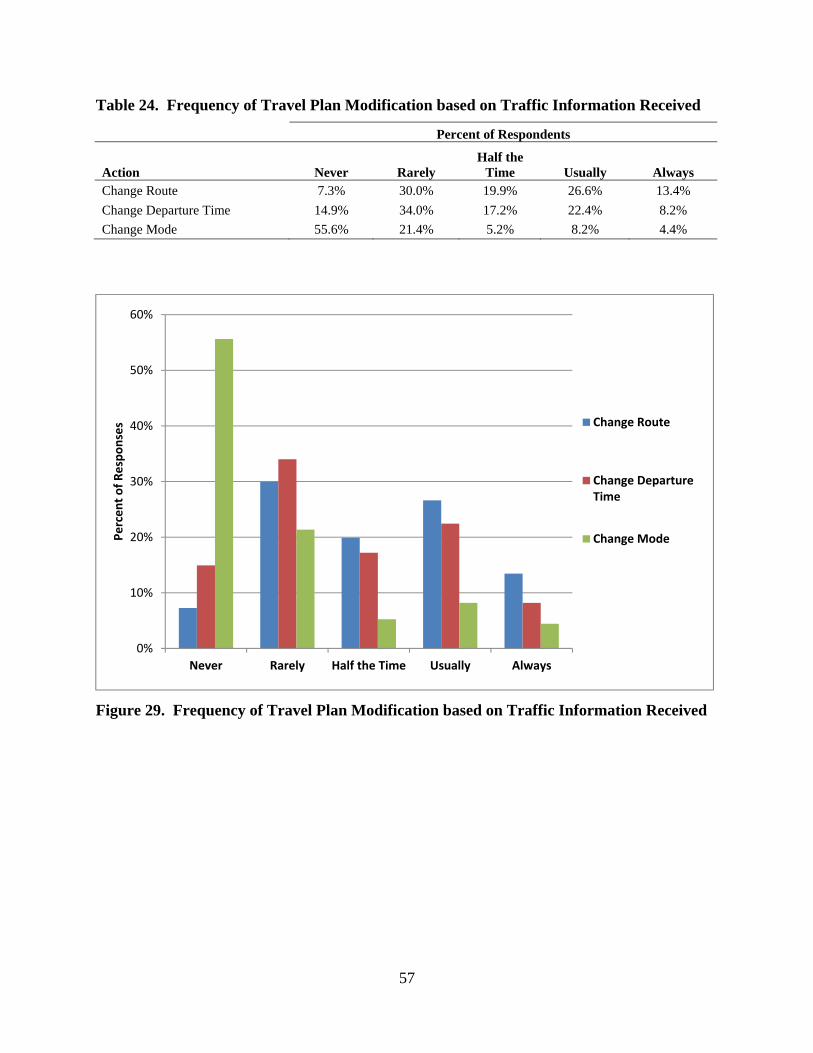
57
Table 24. Frequency of Travel Plan Modification based on Traffic Information Received
Percent of Respondents
Action Never Rarely Half the
Time Usually Always Change Route 7.3% 30.0% 19.9% 26.6% 13.4%
Change Departure Time 14.9% 34.0% 17.2% 22.4% 8.2%
Change Mode 55.6% 21.4% 5.2% 8.2% 4.4%
Figure 29. Frequency of Travel Plan Modification based on Traffic Information Received
0%
10%
20%
30%
40%
50%
60%
Never Rarely Half the Time Usually Always
Percent of Responses Change Route
Change DepartureTime
Change Mode

58
CHAPTER 5:
FREIGHT INDUSTRY SURVEY
A telephone questionnaire survey was administered to schedulers and logistics specialists
involved with freight industry operations in Michigan. The survey was primarily administered to
shippers, carriers, logistics companies, and private contractors throughout Michigan and the
Midwest in general. More than 100 companies were contacted from a list generated based on
information obtained from various sources, including various traveler surveys, online resources,
and recommendations from participants in the initial focus group meeting. The only major
criterion for a trucking company to be included in the survey was that the company operates one
or more haul routes on Michigan freeways. Three transit agencies that operate routes on
Michigan freeways were also contacted and responses were included in the results, where
applicable. The questionnaire was brief and a total of 10 targeted questions were included and
covered the following topics:
Most frequently utilized Michigan roadways;
Most unreliable Michigan roadways in terms of arriving on-time;
Ways of dealing with unreliable travel and unexpected delays;
Maximum late arrival time to destination without penalty;
Frequency at which late arrivals may occur;
Typical buffer time added to schedule to account for unexpected delays;
Relative importance of route reliability versus overall travel time;
Route planning and scheduling resources utilized;
Use of MiDrive for route planning or scheduling;
Usefulness of various types of information found on a traffic information website for
route planning/scheduling.
A total of 32 responses were received. The complete list of respondents is provided in
Appendix D, along with the primary freeways utilized. The telephone questionnaire survey form
is also provided in Appendix D.

59
MANAGING UNRELIABLE ROUTES
The most common freeways used by the freight survey respondents included the four
primary interstates in Michigan: I-94, I-75, I-96, and I-69, each of which was utilized by 50 to
60 percent of those surveyed. The most commonly reported unreliable roadways were I-94 and
I-75 with 37 percent and 28 percent, respectively, of companies using these routes reporting
reliability issues. Nearly 50 percent of the survey respondents indicated that the drivers are
instructed to utilize an alternate route when encountering unexpected delays.
Similar to the commuter survey response, two-thirds of the freight industry respondents
preferred a more reliable route over a slightly faster route when planning haul routes. To help
reduce the uncertainty of travel times along the haul routes, more than one-third of respondents
scheduled hauls during off-peak hours to avoid unwanted and unpredictable delays.
MANAGING LATE ARRIVALS
Forty-three (43) percent of respondents reported adherence to a 100 percent on-time
arrival goal, while an additional 47 percent reported a 95 percent on-time arrival goal. Thus, 90
percent of the freight industry respondents reported adherence to a 95 percent or better on-time
arrival performance goal. Approximately 28 percent of respondents indicated that on-time
deliveries were necessary in order to avoid penalties from receivers. The median threshold for
late arrivals without penalty was approximately 15 minutes beyond the scheduled arrival time.
The maximum acceptable late arrival time reported by any respondent was 2 hours. The
distribution of maximum late arrival times is shown in Table 25.
Table. 25. Maximum Amount of Time a Shipment May Arrive Late Without Penalty
Time Frequency Percentage Cumulative Frequency
Cumulative Percentage
0 min (On-Time) 8 26.7 8 26.7
5 min 4 13.3 12 40.0
10 min 1 3.3 13 43.3
15 min 2 6.7 15 50.0
30 min 4 13.3 19 63.3
60 min 5 16.7 24 80.0
90 min 1 3.3 25 83.3
120 min 5 16.7 30 100.0
60
In an effort to compensate for unexpected delays along freight haul routes, greater than
38 percent of all respondents indicated scheduling up to an additional 5 percent of the total
expected trip duration as a buffer to account for unexpected delays while en route, while an
additional 29 percent buffer 5 to 10 percent additional time into a freight trip. The distribution
of buffer time responses is provided in Table 26.
Table 26. Additional Buffer Time Added as Percent of Total Trip Time
Additional Buffer Time Frequency Percentage Cumulative Frequency
Cumulative Percentage
0 to 5 percent 12 38.7 12 38.7
5 to 10 percent 9 29.0 21 67.7
11 to 15 percent 4 12.9 25 80.6
16+ percent 6 19.4 31 100.0
ROUTING AND SCHEDULING RESOURCES
Proprietary software was utilized by nearly 75 percent of the freight industry respondents
for routing and scheduling of haul routes. In particular, the software program “PC Miler” was
utilized by greater than 56 percent of all freight industry respondents, which was the most
commonly referenced software. Mapping websites were utilized by greater than 43 percent of
the respondents for freight routing purposes.
MiDrive had been utilized by only 15 percent of respondents for routing and scheduling
purposes. Although most respondents were completely unfamiliar with MiDrive, there was a
noted interest among the survey respondents for future utilization. Figure 30 displays the
responses pertaining to potential usefulness of travel planning information displayed on a
website such as MiDrive. The display of current roadwork information was most frequently
indicated as useful or very useful by respondents, followed by road weather condition, and
accident locations.

61
Figure 30. Usefulness of Website Information for Route Planning or Scheduling Purposes
0%
10%
20%
30%
40%
50%
60%
70%
80%
90%
CurrentRoadwork
RoadWeatherConditions
AccidentLocations
CurrentTravelTimes
FutureRoadwork
RouteReliability
Info
SpecialEvent
Information
CurrentTravelSpeeds
Percent Responding "Importan
t" or "V
ery
Importan
t"

62
CHAPTER 6:
CONCLUSIONS
Travel delays and associated costs have become a major problem in Michigan over the
past several decades as congestion continues to increase, thus, creating significant negative
impacts on travel reliability on many roadways throughout the State. MDOT is currently capable
of measuring and communicating real-time travel time, speed, and reliability related information
to the public through a variety of communication channels. If conveyed correctly, such
information would assist in the trip planning process both before and during a trip. However,
prior to this research effort, many questions remained pertaining to the measurement and
communication of real-time travel information to the public in Michigan.
The research described herein sought to develop appropriate communication techniques
for distribution of travel reliability and traffic related information to the public based on the
needs of users of the transportation network in Michigan. A number of tasks were performed to
achieve this goal, including surveys of travelers, commuters, and freight industry logistics
professionals, in addition to the state-of-the-art and state-of-the-practice reviews. Synthesis of
the information obtained from these tasks allowed for conclusions to be drawn, which are
described in detail in the following sections.
CAUSES OF UNRELIABLE TRAVEL
Roadway congestion may be classified into either of two categories based on the
regularity of occurrence: 1) recurring, which is generally consistent and predictable and 2) non-
recurring, which is generally variable and unpredictable. Typical contributors to roadway
congestion include the following (5):
Recurring
o Day-to-day fluctuations in demand,
o Traffic control devices (poorly timed signals, railroad crossings, etc.), and
o Inadequate roadway capacity.
Non-recurring
o Incidents
o Work zones (construction and maintenance)
o Weather

63
o Special events
Recurring congestion contributes relatively little to the day-to-day variability in travel
times and is most effectively treated by roadway or traffic signal capacity improvements. Non-
recurring congestion provides the greatest contribution to travel time variability and unreliability.
While weather, road work, and special events contribute to travel time variability, such sources
are also generally either scheduled or somewhat predictable. Congestion and travel variability
caused by road work and special events may be minimized by scheduling their occurrence during
nights or weekends. Furthermore, communicating planned road closure occurrences to travelers
in advance will also aid in the trip planning process. Weather-related impacts are best handled
by providing as much advance notice as possible through appropriate communication channels
so that travelers can make adjustments prior to departure. Incidents are the most problematic
contributors to day-to-day travel time variability and subsequent traveler uncertainty. This is due
to the difficulty in predicting when and where incidents will occur and the degree and duration of
subsequent traffic flow impacts. As it is not possible for agencies to provide advance travel
alerts, incidents are better managed by strategies such as Michigan’s Quick Clearance program.
IMPACTS OF VARIABILITY ON TRAVELER UNCERTAINTY
While travelers are generally able to account for recurring congestion, which typically
occurs during the peak daily commute periods, the unpredictability of non-recurring congestion
leads to traveler uncertainty in terms of selecting a route and subsequent departure time.
Although delays related to non-recurring congestion may occur at any time and any location, the
magnitude of such delays are largely dependent on existing levels of congestion. Consequently,
the occurrence of non-recurring congestion during peak periods generally has severe
consequences on travel times due to the congestion that is already present. As a result, peak-
period travelers are often forced to plan their departure times substantially earlier and/or choose
an alternate route if an on-time arrival is necessary. However, when non-recurring congestion
does not occur, the additional buffer time and/or travel distance is wasted, resulting in an
excessively early arrival or unnecessary vehicle operating costs. As off-peak period travelers or
travelers in rural areas are less likely to experience recurring congestion, they also tend to be less
inclined to budget substantial additional travel time due to the low frequency of non-recurring

64
congestion that occur in these areas. As a result, incidents, unexpected road work, major events
or holiday travel may cause unexpected delays for travelers during off-peak periods.
Travel time uncertainty has the greatest impact on the freight industry, due to the often
severe penalties associated with late arrivals. Ninety percent of respondents to the survey of
freight industry logistics professionals indicated adherence to 95 percent or better on-time arrival
performance. Additionally, more than 25 percent of the surveyed freight industry logistics
professionals indicated that on-time arrivals were critically necessary for deliveries in order to
avoid penalties. The median threshold for late arrivals without penalty was approximately 15 to
20 minutes beyond the scheduled arrival time, as reported by both freight logistics professionals
and truck drivers en route. Business travelers were even more time sensitive, reporting a median
threshold for late arrival to work of approximately 10 minutes. In an effort to compensate for
unexpected delays along freight haul routes, it is common practice for schedulers/drivers to
buffer between 5 and 10 percent extra time into the trip schedule. Commuters tended to add a
proportionally greater amount of time to ensure an on-time arrival, likely due to the uncertainty
associated with greater levels of congestion experienced during peak hour commute travel. For
commutes greater than 20 minutes in duration, the average additional time added to the commute
to ensure an on-time arrival ranged from approximately 30 percent to 40 percent of the overall
commute time.
INFORMATION NEEDS OF TRAVELERS
The information needs of travelers and freight industry personnel are largely dependent
on when such information is sought with respect to the trip departure. In general, travel
information may be sought at three different points either before or during the trip, which
include:
En route,
Preparing for near-term departure, or
Planning for future departure.
En Route
Travelers that are already en route have the least amount of trip flexibility – particularly for short
duration trips. Changes made en route are often limited to selection of an alternate route,
65
assuming a reasonable alternative exists, as the departure time and mode choice selections have
already occurred. As such, en route travelers desire only basic information pertaining to
downstream travel conditions that will assist with route choice decisions and/or allow for the
traveler to be notified of delays. The information needs of travelers en route are best satisfied by
the display of current travel time, incident location, road work, or other congestion information
on changeable message signs. Information should also continue to be distributed to motorists via
radio broadcasts (traditional, highway advisory, or subscription services) as radio still stands as
the most common media for travelers seeking traffic information. Travelers en route may also be
served by a traffic information website, such as MiDrive, that could be accessed via a
smartphone during a stop.
Preparing for Near-Term Departure
Travelers preparing for a near-term departure have some flexibility with respect to
departure time, route choice, and mode choice - particularly for short duration trips. Regular
commuters tend to fall in this category, as long-range travel planning is generally not performed
due to familiarity, but current travel information is often useful prior to departure. If travelers
preparing for departure are aware of unfavorable travel conditions, they have the option of
adjusting departure time, selecting an alternative route, and/or selecting an alternative mode.
The survey of Michigan commuters indicated that 60 percent of commuters will utilize traffic
information to modify their route at least half of the time, while nearly 50 percent will modify
their departure time. The information needs of travelers preparing for a near-term departure are
best satisfied by the display of current travel speed, travel time, incident location and status, road
work, or transit departure times on a travel information website or television broadcast.
Planning for Future Departure
Trip planning well in advance of departure affords the greatest level of flexibility with
respect to departure time, route choice, and mode choice. Long distance travelers – particularly
those traveling on unfamiliar routes and freight haulers – generally fall within this category due
to the level of complexity associated with scheduling, particularly if there are multiple route
options. As travel planning occurs well in advance of the trip, current travel conditions are
generally of little value. However, reliability information is of particular importance as it allows

66
for informed decisions to be made pertaining to route choice, departure time, and/or mode
choice. Additional information pertaining to the location of current and/or future road work is
also of value to travelers in this category. The information needs of travelers planning for future
departure, including freight industry personnel, are best satisfied by the display of travel time
reliability or variability information on a travel information website, in addition to information
pertaining to current and future road work. The freight industry did note substantial utilization of
specialized truck routing software, most notably PC Miler, although many noted a desire for a
comprehensive travel planning website to assist with scheduling or routing.
UTILIZATION OF ONLINE TRAFFIC INFORMATION AND MIDRIVE
The use of websites for traffic information by Michigan travelers remains relatively low,
as evidenced by the responses obtained during the surveys. Only about 14 percent of travelers
and commuters indicated using traffic websites on a weekly or daily basis, although smartphone
users were far more likely to seek online traffic information. MiDrive recognition is also
relatively low as only 22.5 percent of travelers were familiar with MiDrive. Furthermore, only
12.3 percent of travelers had ever utilized MiDrive, approximately 7 percent utilize MiDrive at
least monthly, while fewer than 3 percent utilize MiDrive at least weekly.
The relatively low utilization of MiDrive may be at least partially attributed to the
saturation of websites that display current traffic information for all or part of Michigan, which is
often redundant with the information found on MiDrive. Including MiDrive, at the time of this
report, no fewer than six different online sources provide a real-time traffic information map for
Michigan that include, as a minimum, a color-coded map depicting current travel speeds/flow
conditions, along with incident and road work locations. These include popular mapping and trip
routing websites, such as Google, Bing, and MapQuest, in addition to beathtetraffic.com,
traffic.com operated by Navteq, which currently serves as the traffic data provider for MDOT
and many other agencies nationwide. Numerous other online sources, particularly news media
websites, provide regional traffic information. Further, mobile versions and/or smartphone
applications are also provided for many of these websites and stand-alone traffic applications are
also available. In particular, Google and beatthetraffic.com each provide highly functional
mobile sites.

67
SATISFACTION WITH TRAVEL IN MICHIGAN
The results of the traveler, commuter, and freight industry surveys provided several
conclusions related to the satisfaction of travelers in Michigan. Overall, greater than 60 percent
of survey respondents indicated being satisfied or very satisfied with travel in Michigan.
Analysis of the results by home region found that travelers residing in the Metro Region had the
lowest levels of travel satisfaction. These results are not unexpected due to the elevated levels of
congestion found in Southeast Michigan compared to other areas of the state. Travelers residing
in the Superior Region had the highest percentage of satisfied travelers, which is also not
unexpected due to relatively low levels of congestion.
The survey of Michigan commuters also showed varied response based largely on region
and route. Respondents from the Southeast Michigan were the least satisfied with their daily
commute, whereas respondents commuting in the Grand and Southwest regions reported the
highest level of satisfaction. A more detailed analysis of commuters in Southeast Michigan
indicated that the highest levels of dissatisfaction were associated with commutes that included
one or more of the following commonly congestion roadways: I-696, US-23, or I-275. Southeast
Michigan commuters were most satisfied if their commute included M-39, M-10, an MDOT
non-freeway such as M-1, US-24, M-59, or local a roadway. Commuters who worked within the
City of Detroit were generally less satisfied with their commute compared to those who
commuted to other areas of Southeast Michigan. Further analysis revealed that commuters who
work in Downtown Detroit (zip code 48226) were the least satisfied of all commuters in
Michigan, likely due to elevated congestion levels experienced during peak-periods on freeways
approaching Downtown Detroit.
Commercial motor vehicle (CMV) operators tended to be less satisfied with travel on
Michigan highways compared to all other travelers. CMV operators were most commonly
dissatisfied with travel on freeways in Southeast Michigan, specifically on US-23, I-75, and I-94.
I-94 and I-75 were similarly noted by freight industry logistics professionals as the most
unreliable routes with respect to on time arrivals. Of the major trucking corridors in the state, I-
96 and I-69 tended to receive the highest satisfaction ratings by both CMV operators and freight
industry professionals.

68
RELIABILITY MEASUREMENT
Travel time reliability is defined as the consistency or dependability in travel times as
measured from day-to-day or across different times of a day. Reliability may be quantified based
on the impact of non-recurring congestion on the transportation system, particularly the impacts
on travel time or speed along a particular route. The goal for an effective reliability
measurement strategy is to provide information that is both easily understood by a broad range of
transportation users and useful as an agency performance measure.
There are numerous methods for estimating reliability to help travelers to plan their trip,
which are split into three general categories, which include: statistical range measures, buffer
time measures, and tardy trip measures. Although several reliability measures have been
suggested in the literature and, to a lesser extent, used in practice, it is clear that no such
universally effective measure of reliability currently exists. The most common methods for
determining travel time reliability are categorized as follows:
Statistical Range Measures
o Standard Deviation of Travel Time
o Coefficient of Variation - Computed as standard deviation of travel time divided
by mean travel time.
o Travel Time Window – Computed as the average or median travel time plus or
minus 1 or 2 standard deviations.
o Travel Time Index - Computed as the average or median travel time divided by
assumed free-flow travel time.
o Variability Index – Computed as the difference between the peak period 95th
percentile and 5th percentile travel times divided by the difference between the
off-peak 95th percentile and 5th percentile travel times.
Buffer Time Measures
o Buffer Time - Computed as difference between 95th percentile travel time and
average or median travel time.
o Buffer Time Index - Computed as difference between 95th percentile travel time
and average or median travel time, divided by average or median travel time.
o Planning Time – 95th percentile travel time.

69
o Planning Time Index - Computed as 95th percentile travel time divided by
assumed free-flow travel time.
Tardy Trip Indicators
o Florida Reliability Model – Computed as the percent of trips that exceed the
median off-peak travel time plus additional acceptable travel time (typically 5 to
20 percent of the median).
o On-time Arrival Rate – Computed as the percent of trips that reach a destination
within a given travel time.
o Misery Index - Computed as the average or median travel time for worst 20% of
trips divided by the average or median travel time for all trips.
A review of current state practice for communication of current travel condition
information found that nearly all states include some form of travel planning information online.
Furthermore, a majority of states provide current traffic speeds or flow conditions on a color-
coded online map. However, very few states include information related to route reliability.
Those that do display reliability-related information typically do so in a simple format, such as a
side-by-side comparison of current travel times versus average or ideal travel times.

70
CHAPTER 7:
RECOMMENDATIONS
The findings from the state-of-the-art and state-of-the-practice review were synthesized
along with the survey responses to generate several recommendations pertaining to the best
practices for quantification and communication of travel reliability information for use by the
public through MiDrive and other sources. The recommendations included:
Strategies for quantifying travel reliability information
Communication of reliability information through MiDrive
Communication of current traffic conditions
Modifications to the MiDrive user interface
Provision of alert notifications through MiDrive
STRATEGIES FOR QUANTIFYING TRAVEL RELIABILITY INFORMATION
Reliability measures that are most effectively utilized by the general public are those that
utilize common terminology to describe quality of service of the particular facility. For example,
the concepts of buffer time, planning time, and on-time arrival percentage are all inherently
simple descriptions that may be effectively utilized by the public. Statistical range
measurements, such as the standard deviation of travel time and coefficient of variation, are
typically suitable for use as agency performance measures, but are not readily understood by the
general public. In a general sense, the most broadly applicable reliability measures for both
public communication and agency purposes are those that, for a specific period, compare days
with high delay to days with average delay (10). The recommended practices for quantifying
travel reliability information for public use include the following performance measures:
Buffer Time and Index
Planning Time and Index
Buffer Time and Index
Buffer time and buffer time index represent the most widely recommended measures of
travel reliability found in the literature. These measures were selected due to the inherent
understandability by a broad range of transportation system users as they account for unexpected

71
delays beyond that which are typical for a specific time of day. Buffer time refers to the amount
of extra time needed beyond the average (or median) travel time to ensure an on-time arrival for
most travelers with a high level of confidence. The buffer time index is simply the buffer time
expressed as a percentage of the average travel time, thereby broadening the applicability by
providing a time and distance neutral version of the buffer time.
The amount of buffer time is typically determined based on the 95th percentile travel time
for the route during the particular time of day, which represents a lateness frequency of
approximately one weekday per month, which was found to be a generally acceptable threshold
both in the literature and in the survey of freight logistics personnel. However, other travel time
percentiles, such as the 90th or 99th percentile, could be used depending on the level of need for
an on-time arrival. For example, critical on-time deliveries may require higher level of
reliability, whereas leisure trips may warrant a lower level. As such, trip planners would likely
benefit from an online interface that included a user-selectable percentile for computing the
buffer time.
Buffer time is inherently a more user-friendly measure for travelers interested only in the
specific segment to which the buffer time applies. Travelers planning a trip along the segment
can simply add the displayed amount of buffer time to the expected trip travel time for that
particular time of day. Travelers concerned with an on-time arrival may simply advance their
departure time by the amount of buffer time recommended for the segment. The buffer time
index may be utilized in a similar fashion by multiplying the buffer index (percentage) by the
expected segment travel time and advancing the departure time by the calculated amount. For
example, a buffer index of 50 percent translates to adding an extra 15 minutes of travel time for a
30 minute average commute to be confident in an on-time arrival.
Planning Time and Index
The planning time and corresponding index are other popular measures of travel time
reliability. Planning time relates to the total travel time that should be budgeted to ensure an on-
time arrival for most travelers with a high level of confidence. The planning time is simply the
95th percentile travel time for the route during the particular time of day, while the index simply
divides this value by the free-flow travel time.

72
Planning time differs from the buffer time in that free flow conditions are utilized as a
baseline rather than average conditions for a particular time of day. Thus, whereas the buffer
time (and index) only accounts for delays beyond expected (i.e., average) for the particular
period, the planning time index includes any delays beyond free flow conditions. Similar to the
buffer time, a larger planning time value relates to lower reliability and other travel time
percentiles, such as the 90th or 99th percentile, could be used depending on the level of need for
an on-time arrival.
Planning time is very user-friendly as it provides an indication of the amount of time to
be scheduled for the particular segment to be confident in an on-time arrival. Similarly, the
planning time index may be multiplied by the travel time at the speed limit or under very light
traffic conditions to determine the overall amount of time to allow. Again, the departure time
may be adjusted accordingly to ensure an on-time arrival. For example, a planning time index of
2.0 means that 30 minutes should be provided for a trip that takes 15-minutes during free flow
conditions. The planning time index also serves as a useful normalized performance measure for
agencies, particularly when used in conjunction with the travel time index, which is computed in
the same manner but utilizing the average (or median) travel time rather than the 95th percentile
travel time.
COMMUNICATION OF RELIABILITY INFORMATION USING MIDRIVE
As MDOT continues to improve and modify MiDrive, consideration must be given
towards distinguishing MiDrive from the variety of other popular real-time traffic information
websites, such as traffic.com, Google, Bing, MapQuest. Because much of the information found
on other websites relates primarily to current traffic information, MDOT can satisfy a currently
unmet need by adding reliability-related information to MiDrive. Such information will assist
travelers and the freight industry in the planning process for both near-term and future
departures.
A common theme found throughout the review of the state-of-the-art and practice was
that traffic information should be provided to road users in a variety of formats, including both
tabular and graphical displays, to satisfy the needs of a broad range of users. Perhaps the best
example of this technique that should be considered for emulation by MDOT is provided by the
travelmidweststats.com website. This website provides freeway traffic conditions for the

73
southern Lake Michigan region, including the Milwaukee and Chicago Metropolitan areas along
with northwest Indiana and southwest Michigan and is maintained by RoadStats, LLC (24).
Figure 31 displays a screenshot of the travel information provided for a section of Chicago
freeway from travelmidweststats.com, which provides a broad range of reliability related
information that may be utilized for trip planning purposes, including:
Segment name, length, and current time-of-day
Travel time data for the current time-of-day
o Current segment travel time
o Average segment travel time and number of days in the sample (specific
day of week)
o Difference between current travel time and average travel time
Graphical representation of travel time data by time-of-day
o Current travel time (green line)
o Average travel time for the day of the week (red line)
o “Normal” range of travel times representing approximately 68 percent of
all travel times for the day of the week (yellow area)
Displaying travel time reliability in this manner provides information relevant for nearly
all stages of travel planning. For example, travelers preparing for a near-term departure can
utilize the current travel time information (green line) to determine the departure time. If on-
time arrival is critical, then the user may consider basing departure on the upper bound of the
normal range of travel times (yellow area) to determine additional buffer time necessary to
account for unexpected delays. For those concerned with route reliability, comparison can be
made between the relative magnitudes of the normal travel time ranges between various routes to
determine the route with the lowest travel time variability for the time period of interest.
Another useful feature of the travelmidweststats.com website is the ability to perform
custom queries. Upon clicking on the “custom query” hyperlink in the center of the page, the
user is directed to a subsequent page displaying additional criteria, including the ability to
display information for two segments, and selection of a customized range of dates (or simply
month and year) and specific day(s) of the week. However, as displayed in Figure 32, the
graphical output provided by the custom query simply displays separate average travel time lines
for the two road segments and the normal range is not provided.

74
Figure 31. Online Display of Travel Time and Reliability Information from travelmidweststats.com (24).
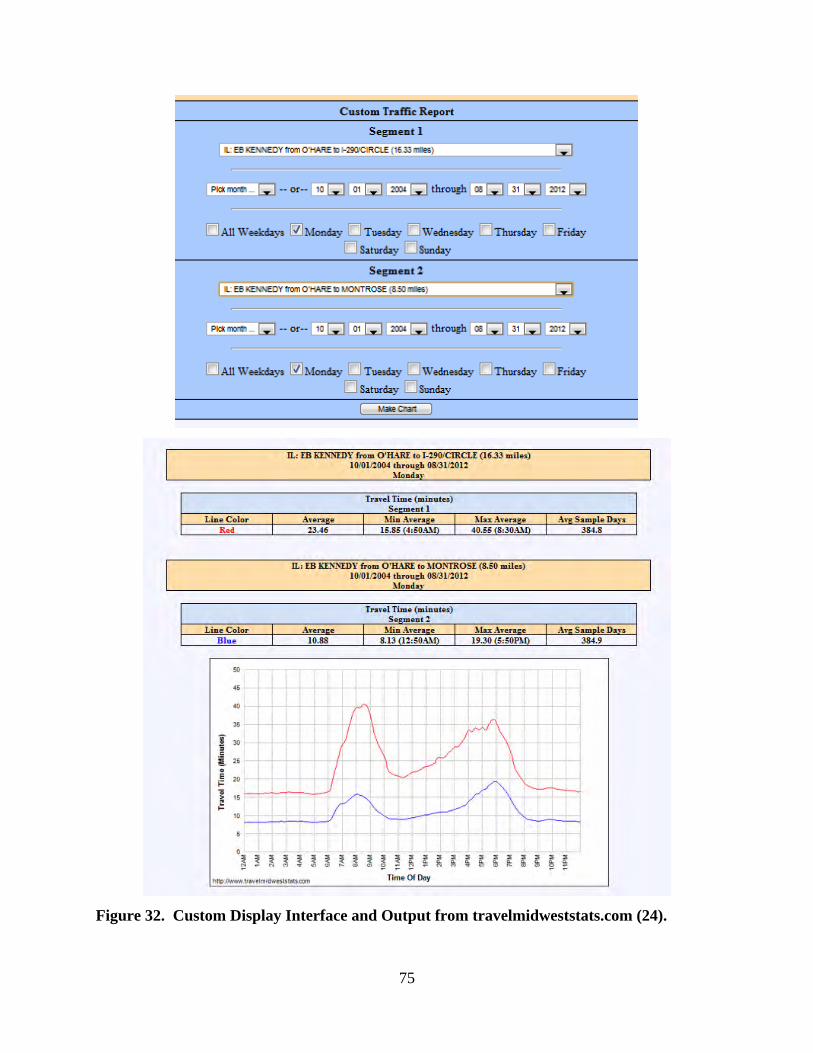
75
Figure 32. Custom Display Interface and Output from travelmidweststats.com (24).

76
Although the online data displays provided by travelmidweststats.com include a broad
range of valuable information to assist with travel planning, slight modifications are
recommended, as follows:
Increase the upper end of the normal range (yellow area in the graph). The current
range of 68 percent does not provide a high enough level of confidence for critical
on-time performance. A more appropriate upper threshold for the freight industry is
the 95th percentile travel time. The best strategy would be to allow the user to select
the percentile representing at least the upper limit of this range.
Provide additional segment reliability statistics in the table, including: buffer time and
index and planning time and index.
Report the current average or median travel speeds along the segment in the table.
Allow for the ability to either customize the segment start and end points (preferred)
or the combination of multiple predetermined segments into a single segment, as
opposed to the two discrete segments displayed in the custom query interface of
travelmidweststats.com.
Eliminate the horizontal speed threshold lines from the graph.
It is recommended that access to such an online travel time and reliability data resource
be provided to users directly from the main MiDrive traffic condition map by simply clicking on
the desired segment. It may also be of value to provide the basic segment reliability statistics,
such as current travel time, average travel time, buffer time, and/or planning time either as a map
layer and/or as a table in a small pop-up window that is displayed upon hovering the cursor
above the particular segment.
COMMUNICATION OF CURRENT TRAFFIC CONDITIONS
Changeable Message Signs
Changeable message signs are effective for communicating current mobility information
to travelers en route. As travelers that are already en route have limited trip flexibility, basic
information pertaining to downstream travel conditions is most helpful to assist with route choice
decisions (if multiple options exist) and/or communication of travel delays to the destination.

77
Changeable message signs should continue to be utilized by MDOT to provide segment travel
time information to help satisfy the information needs of travelers already en route.
Travel time information should be formatted in one of two ways, dependent on whether
one route or multiple reasonable routes are available to a destination. MDOT’s current practice
of displaying freeway distance and travel time information to an interchange or destination is in-
line with nationwide practice and is recommended. If only a single reasonable route is available,
then distances and travel times to one or more major interchanges along the route should be
displayed to motorists. If two routes are available, then distances and travel times via each route
to the same destination should be displayed. An example of each is provided below.
a. Single Route Option b. Multiple Route Options
Figure 33. Typical Changeable Message Sign Displays
Travelers en route also desire information pertaining to current incidents, road work, or other
congestion information. Incident or road work related messages should preempt travel time
information when such information will assist travelers in making route-related decisions.
MiDrive
MiDrive currently utilizes a statewide traffic map to display real-time mobility
information, including segment travel speeds, current and future road work locations and
information, freeway cameras, among other information. It is recommended that real-time
mobility information continue to be displayed on MiDrive in this manner. It is also
recommended that travel times for common travel routes be displayed alongside the map similar
to the displays utilized by the Washington DOT or Arizona DOT as shown in the following
figures. While the Washington DOTs simplistic color coded display of information is preferred,
the information should be displayed in conjunction with the traffic condition map in a manner
similar to the Arizona DOT.
TRAVEL TIME TO M-39 5 MI 4 MIN I-275/M-14 16 MI 15 MIN
TRAVEL TIME TO I-94 VIA I-96 12 MI 12 MIN VIA M-39 12 MI 13 MIN

78
Figure 34. Sample of Washington DOT Online Travel Time Information for Seattle-Area
Figure 35. Arizona DOT Online Traffic Condition Map with Phoenix-Area Travel Times

79
Modifications to the color coded speed scale shown on the MiDrive traffic condition map
are also recommended. MiDrive currently utilizes a quantitative speed scale that includes 10
mph speed increments, which is shown in Figure 36 compared to other common traffic websites
that are more qualitative in nature. While such an absolute numeric scale provides an accurate
measure of the current speed of the traffic stream, it is somewhat misleading when viewing urban
non-freeway routes on the color coded map as such routes will display as orange or yellow rather
than green during free flow conditions due to the lower speed limits. On the other hand,
qualitative scales, including those utilized by the Washington DOT, traffic.com, Google, and
Bing, use color coding to indicate traffic flow or speed relative to free flow conditions along the
route. For example, “free flowing” or “fast” traffic conditions along the segment are indicated as
green, while slower traffic flow is indicated as yellow, orange or red. It is recommended for the
MiDrive speed scale to be modified to a qualitative scale so that the non-freeway color coding
scheme provides an indication of relative traffic flow conditions along a segment rather than
absolute conditions. This will also make MiDrive consistent with other common online traffic
flow maps. A qualitative scale similar to that displayed on traffic.com is most preferable as it
provides more descriptive captions for the color coded classifications.
a. MiDrive website b. Google maps and Bing maps
c. Traffic.com website d. Washington DOT website
Figure 36. MiDrive vs. Traffic.com Traffic Map Speed Scales

80
MIDRIVE USER INTERFACE AND ALERT NOTIFICATIONS
Modification of MiDrive to include a customizable user interface would provide users
with greater flexibility by allowing for users to establish the default map view, including the
default region/route and map layers, along with incident and/or congestion notifications for
specific routes. These features would apply to both the traditional website and the smartphone
application. The current version of the traditional and particularly the mobile websites require
the user to maneuver through a series of menus in order to display traffic-related information as
shown in Figures 37 and 38, respectively.
Figure 37. Current Default View for MiDrive Traditional Website

81
a. Opening Screen b. Initial Map View
c. Map Layer Selection d. Current Speeds (Southeast Michigan) Figure 38. Current Default Views for MiDrive Mobile Website
82
As shown in Figure 38a, the current default opening screen for the MiDrive Mobile
website displays a menu of options, including current incidents, map, camera images,
construction, and others. Upon selection of “map”, the default view displays the state map, but
without any traffic related information, as shown in Figure 38b. To add traveler information to
the map, the user must select the “layer” icon, followed by selection of one or more layers to be
displayed, as shown in Figure 38c. Figure 38d displays an example of current travel speeds
along major routes in southeast Michigan. MiDrive users would benefit from the ability to create
and store a desired default viewing window that is displayed each time the website is accessed.
It is also recommended that MiDrive be modified to include customized traffic alerts that
are sent via email, text, or “push” notification to the MiDrive mobile (smartphone) website.
Such an alert system would greatly enhance the functional capability for users. “Push” alerts are
common features within many smartphone applications and work by automatically sending
notifications to the subscribed user’s phone. This notification is typically provided via a small
icon overlaid onto the website icon, which serves to alert the user while the application is closed.
An audible alert may also be included at the user’s discretion. An example of how the MiDrive
iPhone icon may appear with a push notification is shown in Figure 39.
The registration process for traffic alerts should be designed in a manner that is similar to
that used by the Illinois DOT’s “Traffic Alert Website” http://www.iltrafficalert.com/. After
establishing an online user account, the user may then register for free customized traffic alerts
sent via email or text message. Flexibility is provided to the user in terms of selection of
roadway segments, directions, times of day, days of week, and types of alerts (incidents,
construction, congestion and/or travel times). Additionally, the user is provided with the ability
to establish a minimum average speed threshold for the selected roadway, below which an alert
will be triggered. Navteq’s traffic.com website provides a similar traffic alert feature and also
allows for users to create a personal account for storage of all user information. Traffic.com also
provides users with suggested alternate routes based on current traffic conditions. A personal
MiDrive account would allow users to store all settings related to alerts, the default interface, and
other features.
In addition to the features found within both the Illinois DOT’s and Navteq’s traffic alert
systems it is also recommended that users be provided with the ability to control the severity of
the incident that would prompt an alert, for example major incidents only, major and moderate
83
incidents, or all incidents. Regular commuters may also benefit from regular alerts pertaining to
suggested buffer or planning times sent prior to a scheduled departure to assist with selection of
departure time and/or route.
After receiving an alert, the user may then enter the app to receive complete details.
Incident-related alerts may be formatted in the same manner as the incident information currently
found on the mobile website, as shown in Figure 40a. Incident alerts should include the
following information, as a minimum: roadway, direction, location (nearest crossroad), nature of
the incident, number of lanes/shoulder blocked, time the incident occurred, current time, and the
stage of the incident. An example of a mocked-up planning time-related alert for determining
commute departure time is provided in Figure 8b. Push notifications, particularly those related
to incidents may also be applied in a similar fashion to the standard MiDrive website and other
3rd party applications, such as in-vehicle GPS navigation systems.
Figure 39. Example MiDrive Mobile Website Icon with Mock Push Alert

84
a. Incident Information (Actual) b. Trip Planning Information (Mock)
Figure 40. Example Traffic Alert Messages
Alert for Tom’s Commute Sent 6/25/12 at 7:30 AM
Arrive at destination by 8:30 AM
Suggested Route: I-275/I-96 (map) Current Travel Time = 37 minutes Typical Travel Time = 35 minutes Suggested departure by 7:47 AM Alt Route: I-275/I-94 (map): Current Travel Time = 34 min Typical Travel Time = 25 minutes Suggested departure by 7:45 AM
Trip Planning

85
CHAPTER 8:
IMPLEMENTATION STRATEGY
An assessment of transportation system reliability and trip satisfaction has provided
insight for implementation of the research results in various aspects of planning and operation by
MDOT. Such implementation strategies can be grouped as follows:
1. Communicating real-time travel mobility and reliability data via MiDrive. Providing
realistic travel time and reliability information to the public often allows road users to
make informed choices pertaining to selection of route choice and/or departure time.
Such information should be quantified and presented using a variety of techniques to
service a broad range of travelers and trip planners, whose needs vary based on when
the information is sought along with the penalties associated with late arrival.
MDOT currently possesses the data necessary to quantify real-time travel time, speed,
and reliability information for major routes statewide. MDOT also maintains and
continues to develop communication methods to distribute such information to the
public, most notably through the MiDrive traffic information website and changeable
message signs. Although MiDrive currently provides suitable display of travel
mobility information, certain additional reliability-related data and modifications to
the online and mobile interfaces have been recommended, as described in Chapter 7.
Implementation of the recommended changes to MiDrive should be phased beginning
with a pilot project either within a particular region, such as the Metro Region, or
along a particular route, such as I-94. This pilot implementation project would
include the addition of travel reliability data to the MiDrive interactive map along
with the additional recommend modifications to the user interface, as described in
Chapter 7. As the necessary current and historical travel mobility data are available
to MDOT for roadways currently included in MiDrive, this pilot implementation
project may be performed as soon as possible. Further, these modifications may be
made at a relatively low cost as MiDrive is currently operated and maintained
internally. The pilot implementation will allow MDOT to test several display
strategies and make modifications prior to statewide implementation. It is
recommended that MDOT perform surveys or focus groups of travelers and freight
industry personnel to obtain feedback pertaining to the changes to MiDrive, including

86
the utility of the newly included travel reliability data and user-friendliness of the
modified web interface. Statewide implementation may occur thereafter for the
remaining roadways for which data are available and should not involve substantive
additional costs to operate or maintain. Other items, such as customizable user
accounts, may require an investigation of necessary data storage requirements and
privacy issues and may be implemented at a later date if feasible.
2. Marketing and promoting MiDrive. MiDrive continues to have a relatively low level
of familiarity and use among travelers. MDOT should continue to advertise MiDrive
both on official State of Michigan websites and also through other sources, such as
social media, Pure Michigan (michigan.org), changeable message signs, and other
communication channels. The popularity of MiDrive will likely improve if MDOT
continues to distinguish MiDrive from the variety of other available real-time traffic
information websites, such as traffic.com, Google, Bing, and Mapquest. As much of
the information found on other websites relates primarily to current traffic
information, MDOT can satisfy a currently unmet need by adding reliability-related
information to MiDrive. Such information will assist travelers and the freight
industry in the planning process for both near-term and future departures.
3. Planning and development of alternatives that alleviate travel reliability problems.
Travel reliability issues could be addressed in terms of medium and long-range
transportation improvement program. The survey data identified the most
problematic MDOT roadways with respect to travel time uncertainty and trip
dissatisfaction. Remediation strategies could be included in future project
development for these roadways, including those related to operational and/or
capacity improvements.
4. Monitoring trip satisfaction for project planning and development purposes. Periodic
surveying of the trip satisfaction across a broad range of travelers would help MDOT
track corridor performance – particularly as it relates to travel mobility. MDOT has
historically performed traveler surveys both internally and via contractors using a
variety of methods, including face-to-face, via telephone, and online. It is
recommended that future MDOT statewide traveler surveys, regardless of context,
include one or more standard questions related to travel reliability, trip satisfaction,

87
and MiDrive familiarity and utilization. Data collected and reported here from
traveler surveys performed at 30 rest areas statewide along with surveys of nearly 750
commuters statewide may serve as benchmarks.

88
REFERENCES
1. Schrank, D., T. Lomax, and S. Turner (2010). “Annual Urban Mobility Report.” Texas
Transportation Institute. http://mobility.tamu.edu/ums/.
2. Recker, W., Y. Chung, et al. (2005). Considering risk-taking behavior in travel time
reliability, Institute of Transportation Studies, University of California, Berkeley.
3. Chen, A., Z. Ji, et al. (2002). "Travel time reliability with risk-sensitive travelers."
Transportation Research Record (1783): 27-33.
4. Rakha, H., El-Shawarby, I., and Arafeh, M. (2010). "Trip Travel-Time Reliability: Issues and
Proposed Solutions." Journal of Intelligent Transportation Systems, 14(4), 232-250.
5. Lomax, T. and D. Schrank (2002). "Using Travel Time Measures to Estimate Mobility and
Reliability in Urban Areas.” Texas Transportation Institute, The Texas A&M University
System.
6. Lomax, T., S. Turner, et al. (1997). NCHRP Report 398: Quantifying Congestion, Final
Report. Transportation Research Board, National Research Council.
7. Booz-Allen & Hamilton, Inc. (1998) 1998 California Transportation Plan: Transportation
System Performance Measures: Final Report. California Department of Transportation,
Transportation System Information Program, Sacramento, California.
8. Kaparias, I., M. Bell, et al. (2008). Quantifying and Measuring Travel Time Reliability for
In-Vehicle Navigation Systems. Transportation Research Board 87th Annual Meeting
9. Polus, A. A Study of Travel Time and Reliability on Arterial Routes. Transportation, Vol. 8.
pp. 141-151. 1979.
10. Travel Time Reliability: Making It There On Time, All The Time, Federal Highway
Administration – Office of Operations, 2006,
http://ops.fhwa.dot.gov/publications/tt_reliability/TTR_Report.htm Bogers, E., H. Van Lint,
et al. (2008). "Reliability of Travel Time: Effective Measures from a Behavioral Point of
View." Transportation Research Record(2082): 27-34.
11. Arezoumandi, M., and Bham, G. (2011). "Travel Time Reliability Estimation: Use of Median
Travel Time as Measure of Central Tendency." Proceedings of the First Congress of
Transportation and Development Institute (TDI), American Society of Civil Engineers.

89
12. Pu, W. (2011). "Analytic Relationships Between Travel Time Reliability Measures."
Transportation Research Record: Journal of the Transportation Research Board, 2254, 122-
130.
13. Rakha, H., I. El-Shawarby, et al. (2007). Estimating Path Travel-Time Reliability.
Transportation Research Board 86th Annual Meeting.
14. Chu, H. C. (2010). "Estimating Travel Time Reliability on Freight Corridors." Proceedings
of the Transportation Research Board 89th Annual Meeting, Washington DC.
15. Pu, W. and A. J. Meese (2010). Exploring Travel Time Reliability Under Different
Circumstances: A Case Study. Transportation Research Board 89th Annual Meeting
16. Mehran, B. and H. Nakamura (2009). "Implementing Travel Time Reliability for Evaluation
of Congestion Relief Schemes on Expressways." Transportation Research Record (2124):
137-147.
17. Vincent M. and Hamilton B. A. (2008). “Measurement Valuation of Public Transport
Reliability.” Land Transport New Zealand Research Report 339.
18. Florida Department of Transportation, The Florida Reliability Method. In Florida's Mobility
Performance Measures Program. 2000.
19. Elefteriadou, L. and X. Cui (2007). A Framework for Defining and Estimating Travel Time
Reliability. Transportation Research Board 86th Annual Meeting.
20. Elefteriadou, L., Chrysikopoulos, G., and Lombard, M. (2010). "Travel Time Reliability
Model for Florida." Transportation Research Center, University of Florida.
21. Chien, S. I., and Kolluri, K. K. (2010). "Evaluation of Freeway Travel Time Variability and
Reliability under Adverse Weather with TRANSMIT Data." Proceedings of the
Transportation Research Board 89th Annual Meeting, Washington DC.
22. Lyman, K., and Bertini, R. L. (2008). "Using travel time reliability measures to improve
regional transportation planning and operations." Transportation Research Record: Journal of
the Transportation Research Board, 2046, 1-10.
23. Rutherford, G. S., and Watkins, K. E. (2011). "Measurement and Evaluation of Transit
Travel Time Reliability." Department of Civil and Environmental Engineering, University of
Washington.
24. www.travelmidweststats.com, RoadStats, LLC, based on Lake Michigan Interstate Gateway
Alliance data, accessed August, 2012.

90
APPENDIX A:
ONLINE TRAFFIC INFORMATION RESOURCES BY STATE
Table A1. Primary Traffic Information Website, by State
State Website
Alabama http://alitsweb.dot.state.al.us/its/
Alaska http://511.alaska.gov/alaska511/mappingcomponent
Arizona http://www.az511.com/adot/files/traffic/
Arkansas http://www.arkansashighways.com/
California http://quickmap.dot.ca.gov/
Colorado http://www.cotrip.org/home.htm
Connecticut http://www.dotdata.ct.gov/iti/master_iti.html
Delaware http://www.deldot.gov/information/travel_advisory/
Florida http://www.fl511.com/
Georgia http://www.georgianavigator.com/realtimetraffic.html
Hawaii http://hawaii.gov/dot/highways
Idaho http://hb.511.idaho.gov/main.jsf
Illinois http://www.gettingaroundillinois.com/
Indiana http://www.trafficwise.in.gov/
Iowa http://hb.511ia.org/main.jsf
Kansas http://www.ksdot.org/offTransInfo/511Info/511traffictravel.asp
Kentucky http://511.ky.gov/kyhb/main.jsf
Louisiana http://hb.511la.org/main.jsf
Maine http://www.511.maine.gov/main.jsf
Maryland http://www.chart.state.md.us/
Massachusetts http://mass511.com
Michigan http://mdotnetpublic.state.mi.us/drive/
Minnesota http://hb.511mn.org/main.jsf
Mississippi http://www.mdottraffic.com/
Missouri http://maps.modot.mo.gov/timi/
Montana http://roadreport.mdt.mt.gov/map/
Nebraska http://www.511.nebraska.gov/atis/html/index.html
Nevada http://www.safetravelusa.com/nv/
New Hampshire http://hb.511nh.com/main.jsf
New Jersey http://www.511nj.org/
New Mexico http://nmroads.com/
New York http://www.511ny.org/mapview.aspx?1344447242110
North Carolina http://tims.ncdot.gov/tims/default.aspx
North Dakota http://www.dot.nd.gov/travel-info-v2/
Ohio http://www.buckeyetraffic.org/
Oklahoma http://oktraffic.org/map.php?location=statewide

91
State Website
Oregon http://www.tripcheck.com
Pennsylvania http://www.511pa.com/TravelConditions.aspx
Rhode Island http://511.dot.ri.gov/hb/main.jsf
South Carolina http://www.511sc.org/sc511/login/auth
South Dakota http://www.safetravelusa.com/sd/
Tennessee http://ww2.tdot.state.tn.us/tsw/smartmap.htm
Texas http://www.drivetexas.org
Utah http://www.udottraffic.utah.gov/
Vermont http://511.vermont.gov/main.jsf
Virginia http://www.511virginia.org/home.aspx?r=1
Washington http://www.wsdot.com/traffic/
West Virginia http://www.transportation.wv.gov/highways/traffic/Pages/roadconditions.aspx#23
Wisconsin http://www.511wi.gov/Web/
Wyoming http://map.wyoroad.info/hi.html

92
Table A2. Sample of Traffic Information Websites for Major U.S. Cities City Website Atlanta http://www.traffic.com/Atlanta-Traffic/Atlanta-Traffic-Reports.html
Atlanta http://www.beatthetraffic.com/traffic/#!/Atlanta/report
Boston http://www.boston.com/news/traffic/
Boston http://www.traffic.com/Boston
Boston http://www.beatthetraffic.com/traffic/#!/Boston/report
Chicago http://webapps.cityofchicago.org/traffic/
Chicago http://travelmidwest.com/lmiga/home.jsp
Dallas http://www.traffic.com/Dallas-Traffic/Dallas-Traffic-Reports.html
Dallas http://www.beatthetraffic.com/traffic/#!/Dallas/report
Houston http://traffic.houstontranstar.org/layers/
Los Angeles http://www.go511.com/traffic/map.aspx
Los Angeles http://www.sigalert.com/map.asp?region=Los+Angeles#lat=33.98417&lon=-118.22335&z=2
Los Angeles http://trafficinfo.lacity.org/
Miami http://www.fl511.com/Map.aspx
Miami http://www.traffic.com/Miami
Minneapolis http://www.traffic.com/Minneapolis-Traffic/Minneapolis-Traffic-Reports.html
Minneapolis http://www.minneapolistrafficmap.com/
New York http://www.511ny.org/mapview.aspx?1345830380015
New York http://www.beatthetraffic.com/traffic/#!/New-York-City/report
Philadelphia http://www.traffic.com/Philadelphia-Traffic/Philadelphia-Traffic-Reports.html
Philadelphia http://www.beatthetraffic.com/traffic/#!/Philadelphia/report
Phoenix http://www.traffic.com/Phoenix-Traffic/Phoenix-Traffic-Reports.html
Phoenix http://www.beatthetraffic.com/traffic/#!/Phoenix/report
San Francisco http://traffic.511.org/traffic_map.asp
San Francisco http://www.traffic.com/San-Francisco-Traffic/San-Francisco-Traffic-Reports.html
San Francisco http://www.beatthetraffic.com/traffic/#!/Bay-Area/report
Seattle http://www.wsdot.com/traffic/trafficalerts/PugetSound.aspx
Seattle http://www.traffic.com/Seattle-Traffic/Seattle-Traffic-Reports.html
Seattle http://www.beatthetraffic.com/traffic/#!/Seattle/report
Washington DC http://www.traffic.com/Washington-DC-Traffic/Washington-DC-Traffic-Reports.html
Washington DC http://www.beatthetraffic.com/traffic/#!/Washington-DC/report
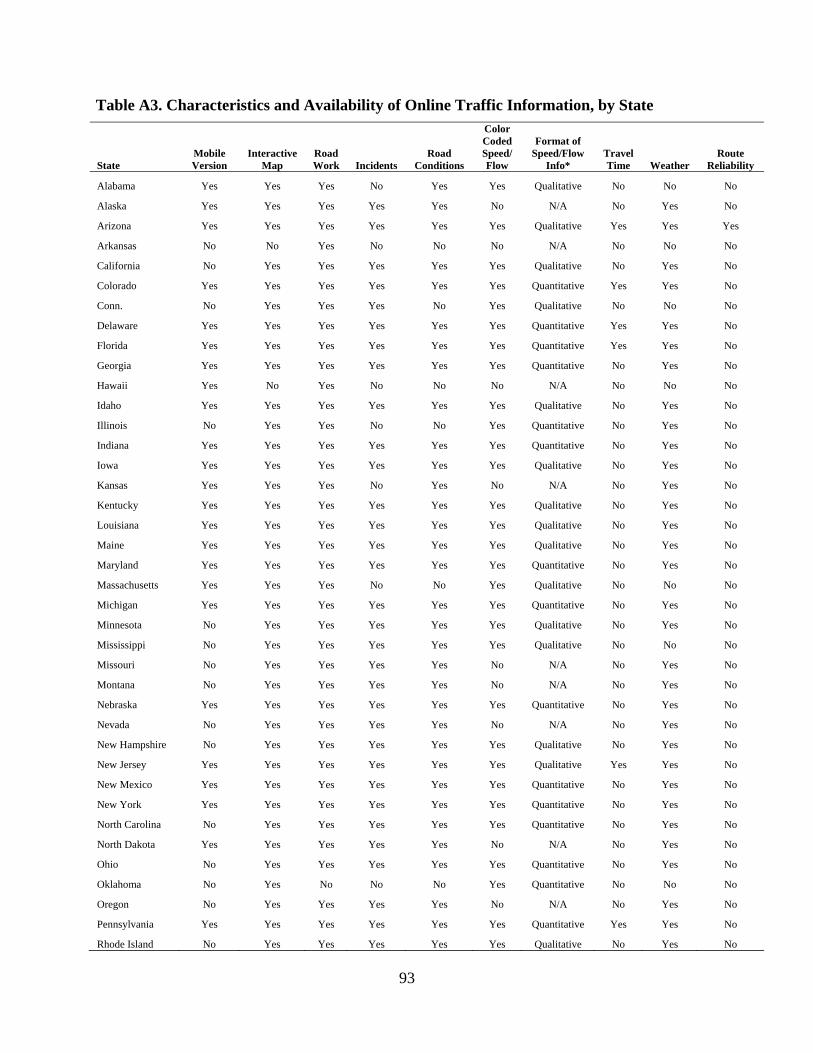
93
Table A3. Characteristics and Availability of Online Traffic Information, by State
State Mobile Version
Interactive Map
Road Work Incidents
Road Conditions
Color Coded Speed/ Flow
Format of Speed/Flow
Info* Travel Time Weather
Route Reliability
Alabama Yes Yes Yes No Yes Yes Qualitative No No No
Alaska Yes Yes Yes Yes Yes No N/A No Yes No
Arizona Yes Yes Yes Yes Yes Yes Qualitative Yes Yes Yes
Arkansas No No Yes No No No N/A No No No
California No Yes Yes Yes Yes Yes Qualitative No Yes No
Colorado Yes Yes Yes Yes Yes Yes Quantitative Yes Yes No
Conn. No Yes Yes Yes No Yes Qualitative No No No
Delaware Yes Yes Yes Yes Yes Yes Quantitative Yes Yes No
Florida Yes Yes Yes Yes Yes Yes Quantitative Yes Yes No
Georgia Yes Yes Yes Yes Yes Yes Quantitative No Yes No
Hawaii Yes No Yes No No No N/A No No No
Idaho Yes Yes Yes Yes Yes Yes Qualitative No Yes No
Illinois No Yes Yes No No Yes Quantitative No Yes No
Indiana Yes Yes Yes Yes Yes Yes Quantitative No Yes No
Iowa Yes Yes Yes Yes Yes Yes Qualitative No Yes No
Kansas Yes Yes Yes No Yes No N/A No Yes No
Kentucky Yes Yes Yes Yes Yes Yes Qualitative No Yes No
Louisiana Yes Yes Yes Yes Yes Yes Qualitative No Yes No
Maine Yes Yes Yes Yes Yes Yes Qualitative No Yes No
Maryland Yes Yes Yes Yes Yes Yes Quantitative No Yes No
Massachusetts Yes Yes Yes No No Yes Qualitative No No No
Michigan Yes Yes Yes Yes Yes Yes Quantitative No Yes No
Minnesota No Yes Yes Yes Yes Yes Qualitative No Yes No
Mississippi No Yes Yes Yes Yes Yes Qualitative No No No
Missouri No Yes Yes Yes Yes No N/A No Yes No
Montana No Yes Yes Yes Yes No N/A No Yes No
Nebraska Yes Yes Yes Yes Yes Yes Quantitative No Yes No
Nevada No Yes Yes Yes Yes No N/A No Yes No
New Hampshire No Yes Yes Yes Yes Yes Qualitative No Yes No
New Jersey Yes Yes Yes Yes Yes Yes Qualitative Yes Yes No
New Mexico Yes Yes Yes Yes Yes Yes Quantitative No Yes No
New York Yes Yes Yes Yes Yes Yes Quantitative No Yes No
North Carolina No Yes Yes Yes Yes Yes Quantitative No Yes No
North Dakota Yes Yes Yes Yes Yes No N/A No Yes No
Ohio No Yes Yes Yes Yes Yes Quantitative No Yes No
Oklahoma No Yes No No No Yes Quantitative No No No
Oregon No Yes Yes Yes Yes No N/A No Yes No
Pennsylvania Yes Yes Yes Yes Yes Yes Quantitative Yes Yes No
Rhode Island No Yes Yes Yes Yes Yes Qualitative No Yes No

94
State Mobile Version
Interactive Map
Road Work Incidents
Road Conditions
Color Coded Speed/ Flow
Format of Speed/Flow
Info*Travel Time Weather
Route Reliability
South Carolina Yes Yes No Yes No No N/A No No No
South Dakota No Yes Yes Yes Yes No N/A No Yes No
Tennessee Yes Yes Yes Yes Yes Yes Qualitative No Yes No
Texas Yes Yes Yes Yes Yes Yes Qualitative No Yes No
Utah Yes Yes Yes Yes Yes Yes Quantitative No Yes No
Vermont No Yes Yes Yes Yes No N/A No No No
Virginia Yes Yes Yes Yes Yes Yes Quantitative No Yes No
Washington Yes Yes Yes Yes Yes Yes Qualitative Yes Yes No
West Virginia No No Yes No Yes No N/A No Yes No
Wisconsin Yes Yes Yes Yes Yes No N/A No Yes No
Wyoming No Yes Yes Yes Yes No N/A No Yes No *Quantitative indicates that numeric ranges are utilized to describe current traffic speeds. Qualitative indicates that descriptive terms are utilized to describe current traffic speeds or flows (e.g., fast, moderate, slow, congested, free flowing, etc.).

ENN ROUTE T
APP
TRAVELE
95
PENDIX B:
R SURVEY
:
Y QUESTIOONNAIRE

96
APPENDIX C:
MICHIGAN COMMUTER TRAVELER SURVEY QUESTIONNAIRE
Note: Format differs from actual online survey
1. Within what region of Michigan do you work?
METRO DETROIT / SOUTHEAST (including Wayne, Oakland, Macomb, Washtenaw, Livingston, Monroe, St. Clair, and Lenawee Counties)
WEST / SOUTHWEST (including Kent, Ottawa, Kalamazoo, Calhoun, Muskegon, Allegan, Van Buren, Berrien, Cass, St. Joseph, Branch, Barry, Ionia, Montcalm, Mecosta, Oceana, and Newago Counties)
LANSING / JACKSON AREA (including Ingham, Eaton, Jackson, Clinton, Gratiot, and Hillsdale, Counties) FLINT / SAGINAW / BAY CITY / MIDLAND AREA (including Genesee, Saginaw, Bay, Midland, Lapeer, Shiawasee,
Isabella, and Tuscola Counties) ALL OTHER AREAS OF MICHIGAN
2. Please provide the following background information:
Home Zip Code Employer Work Street Address Work City Work Zip
3. What is your primary route or routes to/from work? (please list no more than 2)
Roadway #1
Roadway #2
4. Which of the following best describes your job status?
Full time - Salaried Full time - Hourly Part time Other, please specify
5. How often do you typically use each of the following modes for your commute to/from work?
Never
A few times a Year
A few times a Month
A few times a Week Daily
Personal Vehicle � � � � � Carpool/Vanpool/Rideshare � � � � � Bus/Public Transportation � � � � � Bicycle � � � � � Walk � � � � � Telecommute/Work from Home � � � � �

97
6. How long is your typical daily commute (one-way) using your most common travel mode?
5 minutes or less 6 to 10 minutes 11 to 20 minutes 21 to 30 minutes 31 to 45 minutes 46 to 60 minutes Greater than 1 hour
7. How important are each of the following factors when selecting the travel mode for your commute?
Not Important Of Little
Importance Moderately Important Important Very Important
Convenience/Flexibility � � � � � Cost � � � � � Travel Speed � � � � � Arrival Time Reliability � � � � � Safety � � � � � Comfort/Avoiding Stress � � � � � Environmental Friendliness � � � � � Other mode options are not practical � � � � �
8. What is considered an unacceptably late arrival to work?
0 to 1 minute late 1 to 5 minutes late 6 to 15 minutes late 16 to 30 minutes late More than 30 minutes late Not a concern
9. Assuming that an on-time arrival is necessary, how much additional time would you budget into your daily commute (one-way) to account for unexpected delays?
0 minutes 1 to 5 minutes 6 to 10 minutes 11 to 15 minutes 16 to 20 minutes 21 to 30 minutes More than 30 minutes
10. If both of the following route options were available for your daily commute, which option would you prefer?
A slightly slower route with more reliable travel times A slightly faster route with less reliable travel times

98
11. How important are each of the following factors as they relate to the level of satisfaction for your daily commute?
Not Important Of Little
Importance Moderately Important Important Very Important
Arriving on time (or before) � � � � � Encountering no unexpected delays � � � � � Traveling at your desired speed � � � � � Avoiding heavy traffic � � � � �
12. Within the past 12 months, approximately how many trips of greater than 2 hours have you taken via motor vehicle?
0 1-5 6-10 11-15 16-20 more than 20
13. If both of the following route options were available for a vacation/recreational trip, which option would you prefer?
A slightly slower route with more reliable travel times A slightly faster route with less reliable travel times
14. How important are each of the following factors as they relate to your level of satisfaction for vacation/recreational travel?
Not Important Of Little
Importance Moderately Important Important Very Important
Arriving on time (or before) � � � � � Encountering no unexpected delays � � � � � Traveling at your desired speed � � � � � Avoiding heavy traffic � � � � �
15. Please indicate your general level of satisfaction regarding:
Very Dissatisfied Dissatisfied Neutral Satisfied Very Satisfied
Your daily commute travel � � � � � Travel within your region of Michigan � � � � � Michigan travel in general � � � � �
16. Are you familiar with MDOT's "MiDrive" traffic information website (http://mdotnetpublic.state.mi.us/drive/)?
Yes No

99
17. Approximately how often do you use each of the following sources to obtain traffic information?
Never A few times a
Year A few times a
Month A few times a
Week Daily
"MiDrive" Website � � � � � Other Website � � � � � Television � � � � � Radio � � � � � GPS � � � � �
18. How often do you use the traffic information obtained from the source(s) indicated in the previous question to change your:
Never Rarely About Half the Time Usually Always N/A
Travel Route � � � � � � Departure Time � � � � � � Travel Mode � � � � � �
19. How frequently do you use a web-enabled smartphone to obtain traffic information? I do not own a
smartphone Never A few times a Year A few times a Month A few times a Week Daily
� � � � � �
20. Please indicate the importance of each of the following characteristics as they relate to a traffic information website (such as "MiDrive") that is used for travel planning purposes:
Not Important Of Little
Importance Moderately Important Important Very Important
Current Travel Speeds � � � � � Current Travel Times � � � � � Route Reliability (Day-to-day consistency of traffic conditions) � � � � � Accident Locations � � � � � Current Road Work � � � � � Future Road Work � � � � � Road Weather Conditions � � � � � Freeway Camera Views � � � � � Bus/Transit Arrival Times � � � � � Special Event Information � � � � �
21. Considering each of the following trip purposes, would you be more likely to travel using public transportation (e.g., bus or train) if real-time arrival information was available online?
No Possibly Yes
Daily commute � � � Short distance recreational travel � � � Long distance vacation/recreational travel � � �

100
APPENDIX D:
FREIGHT INDUSTRY SURVEY Table D1. Freight Industry Survey Participants
Company Phone City State Major Routes Traveled
AD Transport Express Inc (734) 397-7100 Canton MI I-75 I-94
Blainer Express LLC (517) 944-0383 Lansing MI I-96
Evans Distribution (313) 827-9161 Detroit MI I-94 I-75
Ever Fresh Farms Transportation (616) 530-0005 Grand Rapids MI I-94 I-96 I-196 US 131 I-94
Farmco Distributing Inc (517) 669-8391 Lansing MI I-96 I-94 I-69
InOnTime Inc (616) 748-7519 Zeeland MI I-96 US 131
I-196
Inter Commerce Express (616) 475-8413 Grand Rapids MI US 131
I-96 I-94 I-69
Johnston Trucking Inc (517) 882-5274 Lansing MI US 127
I-96 I-69
Kerry Transport Inc (989) 754-6871 Saginaw MI I-75 I-96 I-69 I-94 US 23
MAC Transport (810) 424-4001 Flint MI I-75 I-69 I-96
Magic Transportation (616) 532-1333 Grand Rapids MI US 131
I-96 I-196
Michigan Rail-Michigan Terminal (269) 838-6410 Grand Rapids MI US 131
I-96
Now Delivery LLC (616) 893-1148 Grand Rapids MI I-94 I-96 I-75
Rapid Supply & Sales Inc (616) 534-3900 Grand Rapids MI US 131
US 31 I-96
Reliable Delivery (734) 641-1600 Romulus MI I-75
Richfield Logistics Corp (810) 233-0440 Flint MI US 23
I-75 I-69
Roth Trucking Inc (616) 784-4404 Grand Rapids MI I-96 I-275 I-94 I-75 M-39
Steel Transportation Services (810) 736-1065 Flint MI I -69 I-75 I-96 US 23
AC Trucking (513) 771-3676 Cincinnati OH I-75 I-94
Eldomar Logistics (905) 795-9339 Mississauga ON I -69 I-94
Hewings Transport (519) 752-8478 Brantford ON I-75 I-94 I-69 I-96
Illini State Trucking (219) 554-6750 Hammond IN I-94 I-196 US 23 I-75
Interstate Auto Transport (219) 326-1000 Michigan City IN I-94 I-69 I-75
Luckhart Transportation Limited (519) 393-6128 Sebringville ON I-75 I-69
McKevitt Trucking LTD (807) 623-0054 Thunder Bay ON I-75 I-94 I-69
MGM Express (630) 227-3200 Bensenville IL I-94
Trans-Frt. McNamara (519) 740-6500 Ayr ON I-75 I-69 I-94
Vikta Inc (905) 232-0911 Mississauga ON I-75 I-69
Worldwide Carriers LTD (416) 213 1334 Brampton ON I-94 I-69 I-75
Greyhound Bus (313) 204-4145 Detroit MI I-94 I-96
SMART Bus (313) 223-2352 Southeast MI Var.
MTA Flint (810) 780-8813 Flint MI I-75

101
Freight Industry Survey Telephone Questionnaire Your Name:______________________________ Respondent’s Name:________________________________ Company: ________________________________ Direct Phone Number (Optional):_________________________________ Email (Optional):_________________________________
1. Which Michigan highways does your company use most frequently for truck hauling? 2. Which Michigan highways would you consider to be the most unreliable with respect to arriving
on-time? 3. How do you deal with unreliable highways during trip planning (Prompt with examples: travel
during off peak hours, travel at night, use alternate routes)? 4. In minutes, what is typically considered the maximum amount of time a shipment can arrive late
to a destination without penalty?
(If something other than 0 min) -> What percent of the time may late arrivals occur? 5. On average, approximately how much extra time (in percent of the total trip time) is typically
added to a haul route to account for unexpected travel delays? 6. What is the most important basis for determining a haul route?
□ Lowest cost/lowest fuel usage □ Fastest route □ Most predictable travel times □ Shortest Distance
7. If forced to select between these two options for routing, which do you prefer? 1) A generally slower route with predictable travel times or 2) A generally faster route with unpredictable travel times
8. What resources do you utilize when planning a haul? (Examples include: mapping websites, logistics software, GPS).
9. Have you ever utilized MDOT’s “MiDrive” traffic information website to assist with planning a haul?
10. On a scale of 1 to 5, where 1 is “not useful” and 5 is “very useful”, please indicate the value of each of the following pieces of information found on a traffic information website as they relate to planning a truck haul route:
Current Road Work
Future Road Work
Route Reliability Info
Accident Locations
Current Travel Speeds
Current Travel Times
Road Weather Conditions
Special Event Information