transportation planning and programming process overview · 2019-08-16 · transportation planning...
TRANSCRIPT

Transportation Planning and Programming Process Overview
Colleen Turner – Assistant Director, Office of Planning and Capital ProgrammingMaryland Department of TransportationAugust 13, 2019
MDOT at a Glance

Maryland Overview
Western Maryland
Washington Metro Region
Baltimore Metro Region
Southern Maryland
Eastern Shore

Maryland’s Transportation
System

Review performance consistentwith the goals and objectives in the MTP and Federal factors
Develop strategies to addressperformance deficiencies
Seek input on local priorities Develop projects based on
studies and system performance Prioritize capital investments
consistent with State goals Address Federal planning requirements and air quality Provide an opportunity for
public and stakeholder input
Set vision, goals, objectives Identify priorities that meet
the vision Work with stakeholders and
the public to seek input and direction
Establish policies and programs to address challenges and capitalize opportunities
Performance Based Planning and Programming
PLAN INVEST
EVALUATE Review performance trends and update performance
targets to reflect changing priorities and external factors

The State Report on Transportation The State Report on Transportation is submitted annually to the General Assembly.
The MTP establishes a 20-year vision for multi-modal transportation in Maryland that outlines the State’s transportation policies and priorities and helps guide Statewide investment decisions for all modes of transportation.
Invest
Plan
Evaluate
Updated every 5 years
Supported by the Bicycle and Pedestrian Plan, other TBU/Mode Specific Plans and MPO MTPs
MDOT’s fiscally constrained 6-year capital budget for all State transportation projects. MDOT works with residents, businesses, local jurisdictions, and local and state elected officials to include projects into the CTP.
Updated annually
Implemented by each project sponsor through project development, delivery and matching funds
Updated annually
Provides an overview of the transportation system, system investment, mobility and accessibility. MDOT assesses progress toward achieving its overarching strategic goals and objectives by aligning performance measures and data with each MTP goal area and objective.
Development is coordinated across the MDOT TBUs, covers 49 unique measures and targets across the 7 MTP goals

The MTP includes a set of strategies for implementing goals and objectives Strategy development was informed by
MDOT TBU strategic and business plans, as well as public input
Putting the strategies into action will help assure progress toward performance targets
Some implementation strategies are statewide, while most are tailored to address the needs of the State’s diverse regions
MTP Goals and Strategies

Consolidated Transportation ProgramFunding Sources and Investments
8
The source of a majority of “State” funding for transportation needs
is the Transportation Trust Fund (TTF)
$30.9 billion 2019-2024
$14.4 billion from the TTF goes to capital investments in the CTP, plus an additional $2 billion from “Other” sources to total a
$16.4 billion six-year capital program
Other Sources
WMATALocal contributions
Airport feesDiscretionary grants

Consolidated Transportation ProgramFunding Sources and Investments
$3.31billion
$644million
$8.68billion
$143million
$842million
$2.57billion
$244million
2019-2024 CTP $16.44 billion

Each fall, the Secretary of Transportation visits each of
the 23 counties and Baltimore City to present the draft CTP at the annual Tour meetings to local elected
officials & citizens
10
Consolidated Transportation ProgramHow The Program is Developed
Multiple criteria to identify cost-effective investments that align with transportation priorities: Meets all federal and other legal mandates Supports MDOT’s mission, priorities and MTP goals Meets all federal match requirements Chapter 30 project scoring (construction projects > $5m) Supports State plans and objectives Supports existing project commitments and upholds
intergovernmental agreements Is the single top priority within a local priority letter Is consistent with local plans Is included in the regional Metropolitan Planning Organization (MPO) long-range plan

MDOT estimates that 43 percent (approximately $6.4 billion) of the total $14.8 billion six-year CTP (FY 2018 – 2023)… is associated with investments that could reduce GHG emissions by 2020 and beyond
$6.40 , 43%$8.40 ,
57%
GHG BeneficialCapitalInvestments
Total funding for major capital programming is roughly $8.7 billion, and MDOT is investing nearly three quarters of that funding… in projects that are expected to result in GHG emissions reductions
$6.40 , 74%
$2.29 , 26%
GHG MajorCapitalInvestments
Consolidated Transportation ProgramGHG Mitigating Investments
The majority of non-GHG mitigating investments are within MDOT’s commitment to system preservation and maintenance programs
Non-GHG mitigating major capital projects include major bridge replacements, other asset and fleet replacements or rehabilitation

Annual Attainment ReportMeasuring Transportation System Performance
Annual Attainment Report (since 2000):
• Reports progress toward achieving the goals and objectives in the MTP and the CTP
• Establishes performance indicators that quantify achievement of these objectives
• Sets performance targets
Starting in 2017, through coordination with MPOs
and adjacent state DOTs, MDOT developed
baseline performance measures and targets to
address MAP-21/FAST Act federal
requirements
MDOT also generates quarterly reports through
the MDOT ExcelleratorPerformance
Management System which focuses on
agency performance against 10 tangible results
Electric Vehicle Charging Outlets (2015-2019)

Transportation Sector GGRA Plan
Colleen Turner – Assistant Director, Office of Planning and Capital ProgrammingMaryland Department of TransportationAugust 13, 2019

14
Presentation Outline
• MDOT’s GGRA StoryAccomplishments since 2008 and our Approach to Climate Change
• Trends – Opportunities and ChallengesHow transportation is changing and will change through 2030 and beyond
• The 2030 PictureWhat can the transportation sector achieve and how much will it cost
• Beyond 2030How will the emerging trends and disrupters impact the transportation sector
15
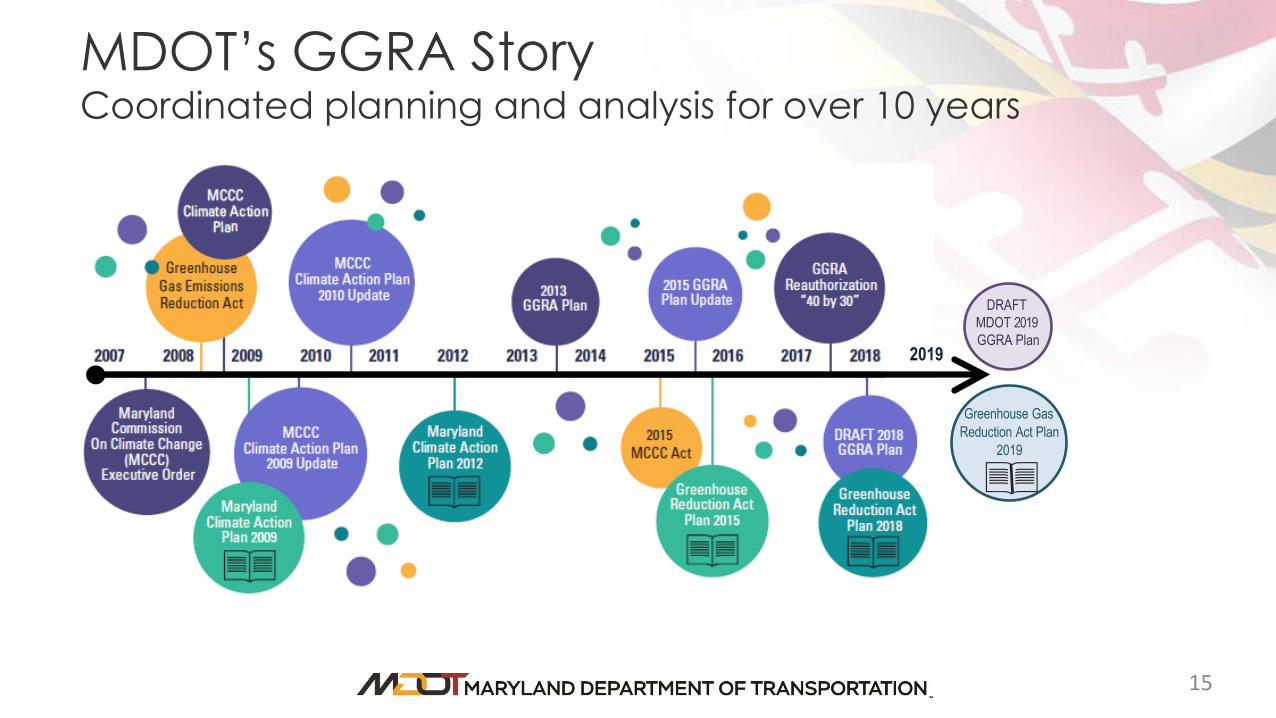
MDOT’s GGRA StoryCoordinated planning and analysis for over 10 years
Greenhouse Gas Reduction Act Plan
2019
2019
DRAFTMDOT 2019GGRA Plan

MDOT’s Approach to Climate Change
New vehicle technologies could reduce
GHG emissions by 34% through 2030
A car operating at 20 mph emits 25% more than a car operating at
50 mph
As the fleet becomes more efficient, VMT strategies and transit ridership
are less effective at reducing
GHGs
Solar systems on MDOT properties reduce energy
use

Trends – Opportunities and ChallengesEconomic, technology, development, and demographic trends create both challenges and opportunities for reducing GHG emissions from transportation

The Maryland ContextTravel demand follows economic trends
6.05 million people#19 in US by population #5 in density
2010 to 2017 Growth = 4.8%7.
5%
-0.5%3.
6%6.
9%
1.3%
81% of Maryland growth within Washington Metro plus Howard and Anne Arundel Counties.
3.23 million civilian jobs in 2018 5% growth since 2010Maryland’s Gross State Product increased from $242.3 billion in 2000 to $329.1 billion in 2015.Labor force participation rate has stayed between 65% and 70% since 2007. It currently stands at 68.4%, 5% above the national average.
Jobs per households<1 job per 10 hh1 – 2.5 jobs per 10 hh2.5 – 5 jobs per 10 hh5 – 10 jobs per 10 hh1 – 2 jobs per hh> 2 jobs per hh
Maryland Jobs and Households

Maryland Transportation
TrendsAddressing Challenges & Reducing GHG
Emissions
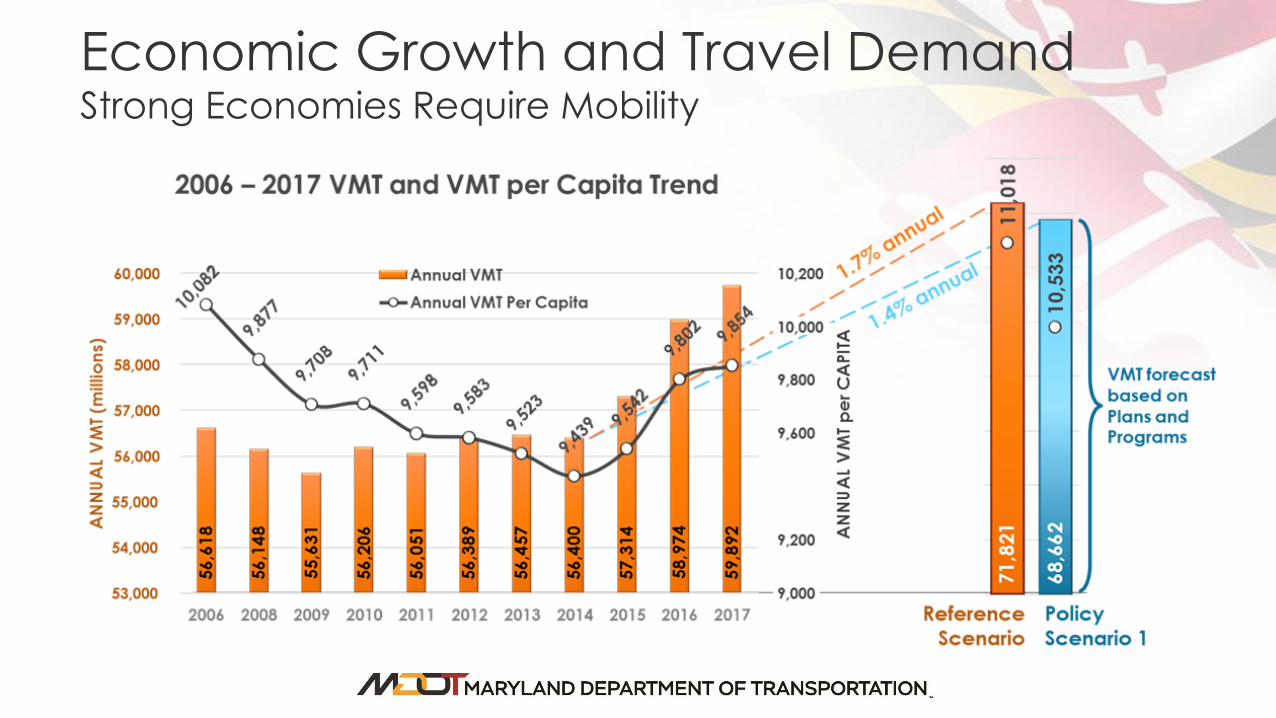
Economic Growth and Travel DemandStrong Economies Require Mobility

VMT in MarylandOur Economy and Location Bring Unique Challenges
Source – SHA Maryland Statewide Travel Model (2015)
33.7
33.3
32.1
30.8
29.8
29.8
29.1
28.8
28.6
27.9
0 5 10 15 20 25 30 35 40
NEW YORK
MARYLAND
NEW JERSEY
DISTRICT OF COLUMBIA
CALIFORNIA
MASSACHUSETTS
ILLINOIS
GEORGIA
VIRGINIA
WASHINGTON
States With Longest Commute Times (In Minutes) - 2017

The Role of Public TransportationRealities and Opportunities to Reducing GHG Emissions
Annual Ridership (1000s) • Average annual growth rate in MTA service revenue vehicle miles from 2006 to 2017 was 3.1%, while ridership declined over that same period
• MD is #5 in transit commute mode share (9%) behind only IL, MA, NJ, NY
• Over the last 10 years, the share of the capital budget committed to MTA and WMATA has steadily increased from 29.6% in 2006 to 33.1% in 2016
• The percent of transit customers within bike or walk distance of fixed route transit has increased from 49% in 2010 to over 53% in 2018
• Transit operating cost per revenue mile continues to increase, with a 25% increase in cost since 2013

Consumer PreferenceIncreasing share of SUVs, vans, and pickups all with lower average real
world MPG, represent over 60% of the MY 2018 market
While the share and diversity of new,
efficient technologies are increasing, some
benefits are being offset by the market shift away from cars
Source: US EPA Automotive Trends Report

Electric Vehicles
519 1,421 1,943 2,643 3,745
5,495
10,938
1,540 1,757
3,521 4,345
5,624
7,712
9,784
609 2,059
3,178
5,464 6,988
9,369
13,207
20,722
-
5,000
10,000
15,000
20,000
25,000
2012 2013 2014 2015 2016 2017 2018 2019
Num
ber o
f Veh
icle
s
Fiscal Year
Battery and Plug-In EV Registrations
BEV PHEV Total
21,359 EVs Registered612 Stations1,867 Charging Outlets

Highway CongestionInefficiencies in Transportation Increase GHG Emissions
• Over 86 million annual hours of delay on the MDOT highway network translating to over $4.1 billion in wasted time and fuel
• 19% of freeway VMT and 29% of arterial VMToperate in congested conditions during the PM peak hour
MDOT SHA’s CHART incident management program saved motorists $1.465 billion in user costs and helped reduce delays by 38.6 million vehicle hours in CY 2017.
MDTA’s electronic toll transactions increased from 79% of all transactions in 2015 to 83% in 2018.
MDOT SHA is developingTransportation Systems Management and Operations (TSMO) solutions that provide active traffic managementand integrated corridor management capabilities

Washington Area Traffic Relief Plan
• Top 5 highest volume highway sections in Maryland are within program area
• Today, on average, severe congestion lasts for 7 hours each day on I-270 and 10 hours each day on I-495
• Many sections experience speeds less than 15 mph under existing conditions and traffic is expected to deteriorate
The largest initiative in the Traffic Relief Plan will evaluate transformative solutions to address congestion on I-270 and I-495.
Source: MDOT Workshop Spring 2019 Presentation
Congestion Benefits• All alternatives are projected to reduce delay
by 20% or more compared to the No Build condition
• Equates to projected daily fuel savings of about 19,000 gallons (~7 million gallons / year)

The New Mobility FutureThe opportunities from CAVs, new modes, and drones
Connected and automatedvehicles (CAVs) are likely to
transform personal and freight travel
New fuels, vehicle ownershipmodels, and modes of transportationare emerging and reshaping choices
and preference, fueled by private sector innovation
Unmanned aerial vehicles are apromising tool for transportationsystem management, package
delivery, and even people movement
Image Source: Shared Mobility News https://www.sharedmobility.news/
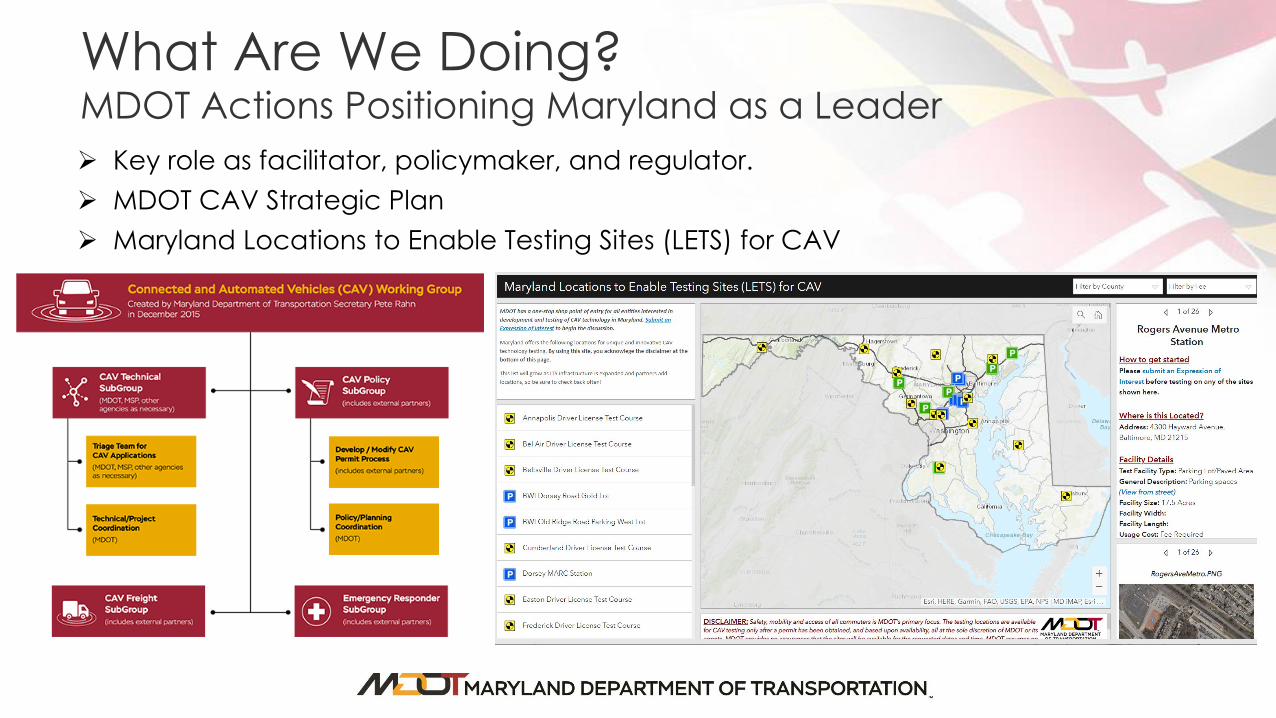
What Are We Doing?MDOT Actions Positioning Maryland as a Leader Key role as facilitator, policymaker, and regulator. MDOT CAV Strategic Plan Maryland Locations to Enable Testing Sites (LETS) for CAV

The 2030 PictureWhere will current trends takes us through 2030, and if the best-case outcomes
are achieved, how far could we reduce emissions from transportation

GHG Emissions Modeling
HPMS & MPO Travel
Models
Traffic Forecast
Estimates
VMT, Speeds
and Traffic Volumes
MOVES2014a
Local Planning Assumptions and Vehicle
Characteristics
Fuels and Environmental
Data
Sketch Planning
Techniques
GHG, VMT, and/or Fuel Impacts
Inventory Development
Strategy Analyses
E3Pathways
Model
MDOT and MDE’s different methodologies for GHG
calculations produce similar, but not exact results!
2030 GHGEmissions Estimates

Baseline and Reference Scenarios
• In 2014, a reduction of 1.96 billion VMT is required to reduce GHG emissions by 1 mmt CO2e
• In 2030, a reduction of 2.87 billion VMT is required to reduce GHG emissions by 1 mmt CO2e
• In other words, 2030 VMT would have to be reduced by 4 percent to achieve a1 mmt CO2e reduction in on-road emissions

The MDOT Scenario ProcessThe Careful and Evidence Driven Approach to 2030
32
Included in POLICY SCENARIO 4Tested only to gauge
revenue potential to help fund Policy Scenario 2
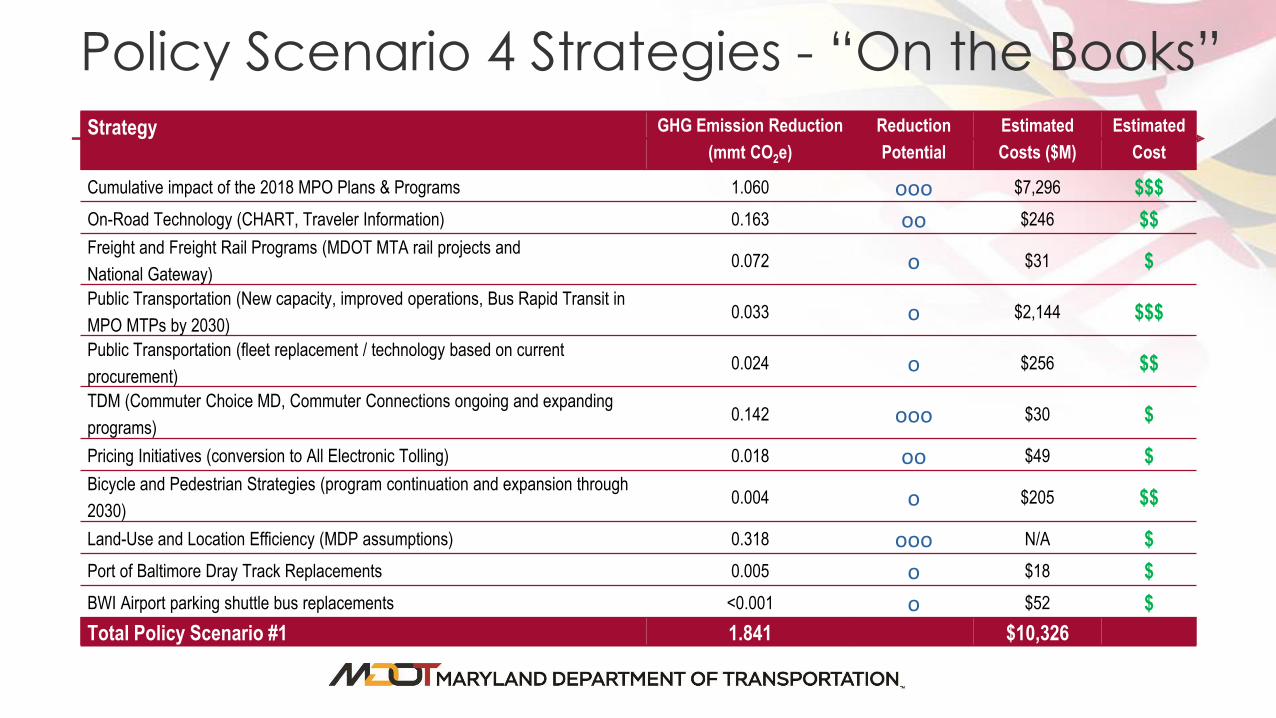
Policy Scenario 4 Strategies - “On the Books”Strategy GHG Emission Reduction
(mmt CO2e)Reduction Potential
Estimated Costs ($M)
Estimated Cost
Cumulative impact of the 2018 MPO Plans & Programs 1.060 ooo $7,296 $$$On-Road Technology (CHART, Traveler Information) 0.163 oo $246 $$Freight and Freight Rail Programs (MDOT MTA rail projects and National Gateway)
0.072 o $31 $Public Transportation (New capacity, improved operations, Bus Rapid Transit in MPO MTPs by 2030)
0.033 o $2,144 $$$Public Transportation (fleet replacement / technology based on current procurement)
0.024 o $256 $$TDM (Commuter Choice MD, Commuter Connections ongoing and expanding programs)
0.142 ooo $30 $
Pricing Initiatives (conversion to All Electronic Tolling) 0.018 oo $49 $Bicycle and Pedestrian Strategies (program continuation and expansion through 2030)
0.004 o $205 $$
Land-Use and Location Efficiency (MDP assumptions) 0.318 ooo N/A $Port of Baltimore Dray Track Replacements 0.005 o $18 $BWI Airport parking shuttle bus replacements <0.001 o $52 $Total Policy Scenario #1 1.841 $10,326

Policy Scenario 4 Emerging StrategiesStrategy GHG Emission Reduction
(mmt CO2e)Reduction Potential
Estimated Costs ($M)
Estimated Cost
Freeway Management/Integrated Corridor Management 0.052 oo $506 to $760 $$Arterial System Operations and Management 0.049 oo $453 to $680 $$Limited Access System Operations and Management 0.023 oo $108 to $152 $$Managed Lanes (I-270/I-495 Traffic Relief Plan Implementation) 0.051 oo $6,650 to $9,840 $$$Intermodal Freight Centers Access Improvement 0.017 oo $2,240 to $3,136 $$$Commercial Vehicle Idle Reduction, Low-Carbon Fleet 0.055 oo Nominal § $Eco-Driving (informal implementation underway) 0.042 oo $3 to $5 $Lead by example - Alternative Fuel Usage in State Fleet 0.004 o Nominal § $Truck Stop Electrification 0.007 o $9 to $38 $Transit capacity/service expansion (fiscally unconstrained) 0.069 oo $2,307 to $2,659 $$$Expanded TDM strategies (dynamic) 0.314 ooo $15 to $30 $Expanded bike/pedestrian system development 0.081 oo $103 $$Freight Rail Capacity Constraints/Access 0.072 oo $300 $$Regional Clean Fuel Standard 0.382 ooo $148 $$MARC Growth and Investment Plan / Cornerstone Plan 0.052 oo $1,078 $$$Additional 100K Ramp Up (total of 704,840 EVs) 0.322 ooo $54 $$$50% EV Transit Bus Fleet 0.036 oo $93 $Total Policy Scenario #2 “Emerging” 1.628 $14,068 - $19,077
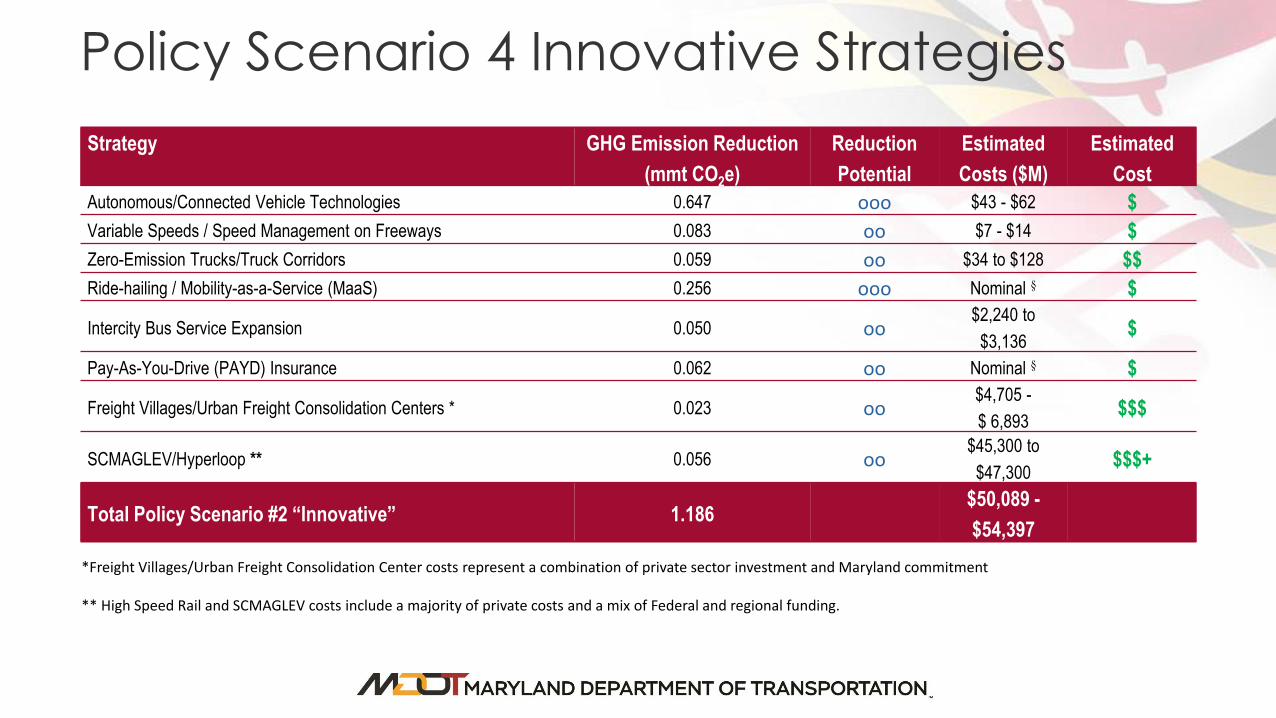
Policy Scenario 4 Innovative StrategiesStrategy GHG Emission Reduction
(mmt CO2e)Reduction Potential
Estimated Costs ($M)
Estimated Cost
Autonomous/Connected Vehicle Technologies 0.647 ooo $43 - $62 $Variable Speeds / Speed Management on Freeways 0.083 oo $7 - $14 $Zero-Emission Trucks/Truck Corridors 0.059 oo $34 to $128 $$Ride-hailing / Mobility-as-a-Service (MaaS) 0.256 ooo Nominal § $
Intercity Bus Service Expansion 0.050 oo$2,240 to
$3,136 $
Pay-As-You-Drive (PAYD) Insurance 0.062 oo Nominal § $
Freight Villages/Urban Freight Consolidation Centers * 0.023 oo$4,705 -$ 6,893 $$$
SCMAGLEV/Hyperloop ** 0.056 oo$45,300 to
$47,300 $$$+
Total Policy Scenario #2 “Innovative” 1.186$50,089 -$54,397
*Freight Villages/Urban Freight Consolidation Center costs represent a combination of private sector investment and Maryland commitment
** High Speed Rail and SCMAGLEV costs include a majority of private costs and a mix of Federal and regional funding.
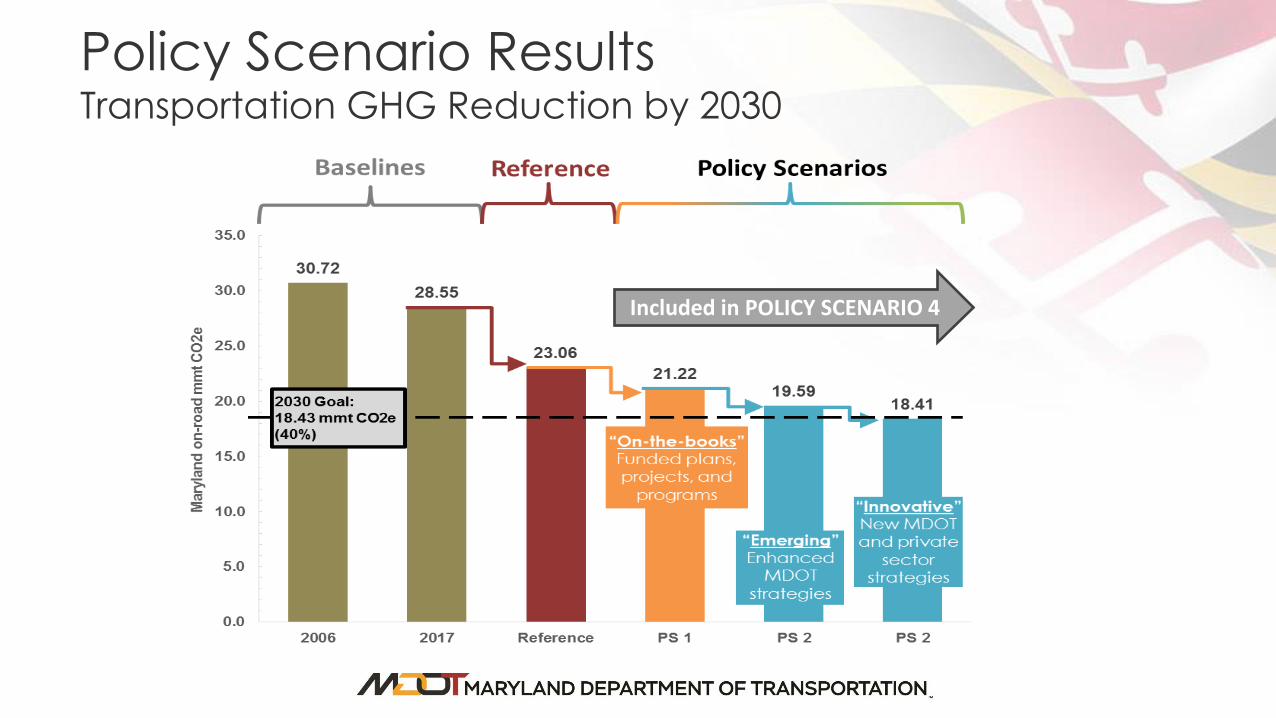
Policy Scenario ResultsTransportation GHG Reduction by 2030
Included in POLICY SCENARIO 4

Costs and Cost EffectivenessOur Funding Need and the GHG Return on Investment
Estimated $10.2 billion programmed or planned toward GHG supportive projects through 2030
Up to $18 billion more needed to implement suite of emerging and innovative strategies through 2030

Co-benefits and Economic ImpactsEnvironmental Co-
benefits
• Improved Air Quality providing significant reductions to ozone and fine particulates
• Reduced Impacts on infrastructure, water quality and sensitive ecosystems
Public Health
• Criteria pollutant emission reductions
• Reduced exposure and crash reduction
• Quality of life and public health improvement with alternative transportation options (non-motorized)
Equity
• Enhancing access to jobs and reducing transportation costs
• Matching opportunities to skills and providing access
Economic Vitality
• Consumer Cost Savings
• Business Cost Savings
• Changes in Government Expenditures
• Net Macroeconomic Benefits

Beyond 2030How will the emerging trends and disrupters impact the transportation sector?

Transportation for 2030 and Beyond
Influences and Trends Travel Activity “Sharing Economy” influence of the Transportation System

2050 Perspective on Opportunities, Challenges and Uncertainty

Success Stories MDOT SHA improved 93.9 directional miles for bicycle access in FY 2017 and 62.5 miles in FY 2018
MDOT MAA procured 20-60’ articulated Shuttle Buses powered by Clean Natural Gas (CNG) for transportation between the BWI Marshall Airport terminal and the Consolidated Rental Car Facility
MDOT MPA reduced emissions by 19% between 2012 and 2016 while at the same time increasing cargo throughput by 10%
MDOT MPA continues to replace more than 173 dray tucks through USEPA’s DERA grant and helped Canton Railroad install idle-reduction technology in six switcher locomotives
MDOT SHA’s CHART reached a milestone of one million responses (since 1995) – Saved motorists $1.465 billion in user costs and helped reduce delays by 38.6 million vehicle hours in CY 2017
FY 2018–FY 2023 CTP set aside $3.310 billion for transit projects that will increase transit reliability and contribute to emissions reductions
In FY 2018, approximately 29,000 jobs were supported in Maryland by MDOT, an increase of more than 3,400 jobs over FY 2017

2018 Mitigation Working Group Recommendations - Discussion on Progress & Next StepsColleen Turner – Assistant Director, OPCPMaryland Department of TransportationAugust 13, 2019

Recommendations and Progress Summary1. ZEEVIC incentives and policies
2. GHG emission reduction potential of vehicle and infrastructure technologies, and associated co-benefits including equity
3. Enhance travel demand management, land use/smart growth, active transportation, and inter-city travel strategies
4. Develop tracking of key indicators of GHGreduction strategies
5. Review state fleet procurement procedures and practices
6. Public transportation and school bus electrification
Implementation
Research Ongoing
Implementation
Research Ongoing
Research Ongoing
Research Ongoing

Recommendation # 1As part of the process to meet the State's current light-duty zero emissionvehicle (ZEV) goals and projections, the Maryland Electric Vehicle InfrastructureCouncil (EVIC) [Now ZEEVIC] should specifically assess:• Bolstering the State's consumer purchasing incentives for ZEVs, and
regulatory and financial incentives for high power/speed ZEV infrastructureinstallation, including particular attention to investments and incentives forchallenging areas;
• Policies that employ Maryland's public utilities to aid in efforts to rapidly andequitably expand EV infrastructure in Maryland, with specific targets in ruralareas; and
• Policies that make it easier to install EV charging infrastructure at multi-family housing locations with attention to high density, urban populations.
Implementation

Progress and Status of Efforts
• Highlight: Maryland ranked in the Top Tier of ZEV States on the Electrification Coalition ZEV State Policy Scorecard, second only to California• Maryland – Tier 1 (CA and CT are the other two)
“ Maryland places near the top due to generous financial incentives for purchasing ZEVs and for incentives offering up to $5,000 for the installation of workplace chargers.”
• Expansion Efforts: • Supplementing existing alternative fuel corridors with the following: US 1, I-795, I-97, MD 140, MD 100,
MD 32, MD 4, MD 5 / MD 235, US 113, US 13, and MD 528
• Equity: • Right to Charge• Morgan State Survey Report Update (2018) - “…. legislation to address the difficulty of charging in HOAs
or multifamily housing would allow for greater equity and EV market penetration”• Howard County Legislation

PC 44 / Order 88997
• PC 44: Transforming Maryland’s Electric Grid• EVIC provided letter of support for PC 44
• Order 88997 approves incentives for about 5,000 EV chargers across residential, MUD, and public charging portfolios.• Order intended to further EV goals, while balancing impact on ratepayers, and limited to PSC’s focus on
grid impacts of EVs• Authorizes a 5-year pilot program, with semi-annual reports
• Utilities directed to work with EVIC to develop programs aimed at advancing equitable access to transportation electrification

Zero Emission Electric Vehicle Infrastructure Council (ZEEVIC)

Next Steps
• Developing a better understanding of the environmental and economic opportunities that can be realized through the growth of BEV ownership and EVSE installation in Maryland
• Ensuring EV readiness by finding an appropriate balance between home/workplace/public charging infrastructure
• Developing a better understanding of the needs of underserved communities within the context of EV deployment
• Meetings every other month – Open to the public

Recommendation # 2
The Maryland Department of Transportation (MDOT) should continue to researchand evaluate the GHG emission reduction potential of vehicle and infrastructuretechnologies, including:• Connected and automated vehicles;• EVs and other ZEVs;• Transportation network companies/shared rides; and• System operations.The evaluation effort should include consideration of safety, congestion, andequity issues including public health, economic, and workforce impacts.
Research Ongoing

Connected and Automated Vehicles
• Established a Connected and Automated Vehicle (CAV) Working Group as the central coordination point
• The Aberdeen Test Center has been recognized as a federal testing location for AV and US 1 was selected to pilot an innovative technology corridor
• CAV strategic plans document opportunities, challenges, priorities, strategies, and recommendations to help guide the State in planning and implementing CAV technology

System Operations
• MDOT SHA is a recognized national leader in the testing and deployment of real time technologies to adjust signal operation
• The system uses real-time traffic conditions and artificial intelligence (AI) to adjust the timing of traffic signals
• Traffic Relief Planwill improve traffic operations for 700,000 drivers per day on 14 major corridors across the state ($50.3 million in the FY 2019-2024 CTP)

Recommendation # 3
MDOT should continue to enhance travel demandmanagement strategies, land use/smart growth, activetransportation, and inter-city travel strategies, incollaboration with the Maryland Department of Planning(MDP) and other State agencies and stakeholders.
Research Ongoing

Transportation Demand Management
Emission Reductions through Transportation Emission Reduction Measures (TERMs) (Source: 2019 AR)
Commuter Choice Maryland –TDM Program CommuterChoiceMaryland.com
MDOT SHA to construct 642 Park and Ride spaces and finalize design of 286 spaces in the coming year

TOD Initiatives In coordination with state, local, and
private sector partners
Maryland TOD by the numbers: 16 Designated TOD sites 129 rail transit stations 9981 acres of mixed-use zoning 20,067 Average weekday MARC riders
Planning tools for TOD – Coordination between MDOT and MDP
Other coordination areas CAV strategic Action Plan Transportation Alternatives Program MDOT SHA Project Life Cycle Transportation Projects

Other Efforts Coordination with MDP
Ongoing coordination regarding assumptions on land-use and transportation nexus
Forecasting and demographic growth assumptions
Scenario planning construct Checks for preventing overlaps on
emissions reduction estimates Discussion and sharing of methodological
approach to emission reduction estimation
Active Transportation 2019 Maryland Bicycle and Pedestrian
Master Plan Released January 2019 Model Complete Streets Policy for
Bike/Pedestrian Access to Transportation Facilities

Recommendation # 4
MDOT should develop tracking of key indicators of GHGreduction strategies to monitor progress of achieving goals.Examples include state facilities and fleet adoption ofrenewable/low-emissions energy sources, ZEV penetration,equity indicators to track participation, congestion levels,vehicle miles traveled (VMT) per capita, mobility access, andadoption of low-emissions vehicle technology for personaluse.
Implementation

MDOT Performance Management
Attainment Report (AR)Annual report presented to stakeholders, public, Governor, General Assembly
Managing for Results (MFR) Annual submission to the Maryland Department of Budget and Management
MDOT ExcelleratorQuarterly reporting on measures within ten tangible results
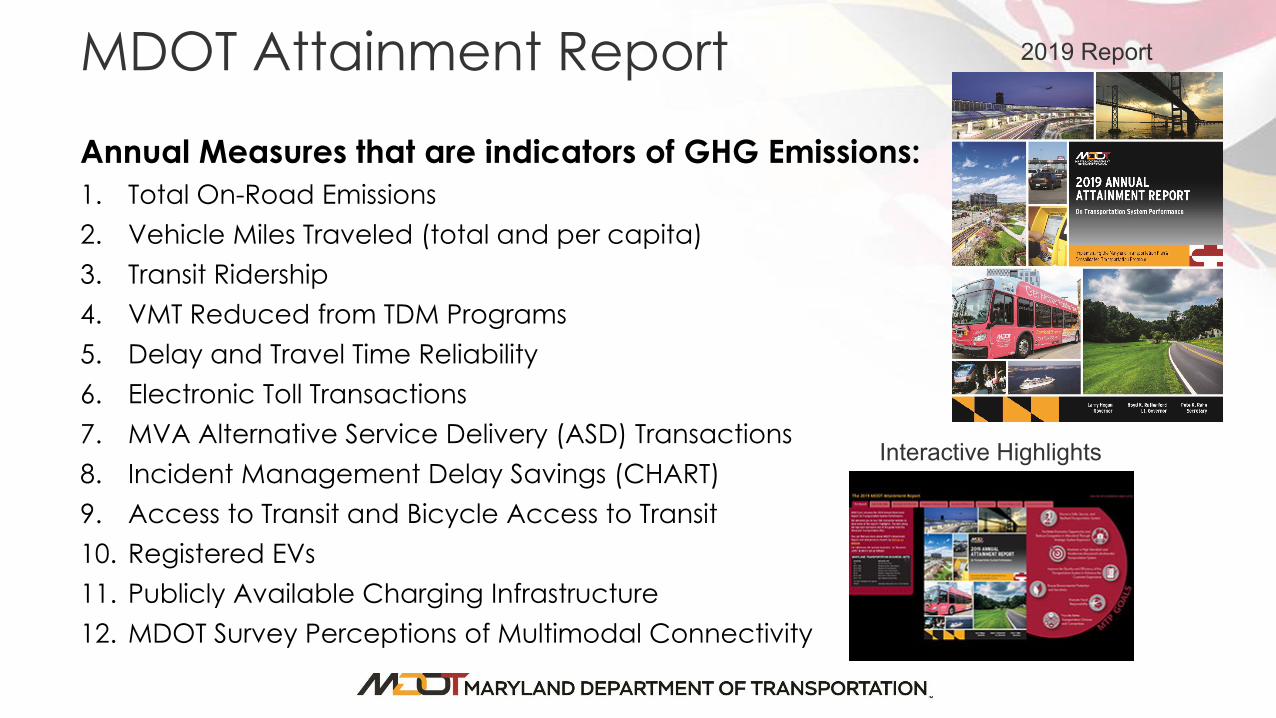
MDOT Attainment Report
Annual Measures that are indicators of GHG Emissions:1. Total On-Road Emissions2. Vehicle Miles Traveled (total and per capita)3. Transit Ridership 4. VMT Reduced from TDM Programs5. Delay and Travel Time Reliability6. Electronic Toll Transactions7. MVA Alternative Service Delivery (ASD) Transactions8. Incident Management Delay Savings (CHART)9. Access to Transit and Bicycle Access to Transit10. Registered EVs11. Publicly Available Charging Infrastructure12. MDOT Survey Perceptions of Multimodal Connectivity
2019 Report
Interactive Highlights

MDOT Excellerator Section 9 on Environmental
Stewardship
Fuel Efficiency of State Fleet Consumption patterns evaluated for improving fuel
efficiency and shifting towards use of renewable fuels.
Publicly Available Electric Vehicle Charging Infrastructure & Total Electric Vehicles Registered in Maryland
State of Maryland’s Air Quality Emissions (State fleet fuel use and utility energy use

Recommendation # 5
MDOT, MDE, Maryland Energy Administration (MEA),Department of Budget and Management (DBM) and theDepartment of General Services (DGS) should review statefleet procurement procedures and practices and providedirection on procurement of EVs and other ZEVs, andassociated charging/filling station installation guidance andtargets, by October 2019.
Research Ongoing

Progress and Status of Effort
• Less than 10 EVs in Maryland State Agency fleet
• Infrastructure needed before purchase• MDOT has installed new EV chargers at MDOT headquarters• Maryland Volkswagen Mitigation Plan provides funding for EVSE, which could include
installation at state offices
• MDOT, in collaboration with MDE, MEA, DBM, and DGS through the State Agency workgroup within EVIC, is in the process of reviewing procurement procedures and best practices

Recommendation # 6
MDOT should report on its analysis regarding electric trains/rail, and continue towork with other appropriate agencies and stakeholders to examine the costs andbenefits of supporting deployment opportunities of ZEV school and transitbuses in Maryland. The analysis should include:(a) Capital, maintenance and operating cost comparisons;(b) Research into the viability of ZEVs as well as hybrid and alternative fuel
technologies;(c) Emissions reduction benefit summaries; and(d) Potential goals to fully electrify bus transport in the State, including targets for
deployment and provisions for low-interest financing.
Research Ongoing

Progress and Status of Effort• Maryland Volkswagen Mitigation Plan provides funding for:
• 8 Electric Shuttle Busses at BWI Airport• Transit Bus Replacements• School Bus Replacements, including an Electric School Bus Pilot Program
• Howard County Electric Bus Project• Through a federal grant, Howard County, RTA, MDOT MTA, and the Center for Transportation and the
Environment (CTE) have partnered to replace three aging diesel buses with three state-of-the-art battery electric buses that utilize wireless opportunity charging at the Columbia Mall.
• Data collection and reporting over a two year period ending in August 2019

2019 Draft Recommendations - Inputs
• Draft Recommendations • Carryover Recommendations• New Recommendations
• Carryover Recommendations • Need for continued policy support/emphasis (EVIC, for example)• Ongoing progress in 2019 (strategies that need to be carried forward for complete implementation)• MDOT leadership position (Solar Program, EVIC, adaptation/resilience, for example)
• New Recommendations• Contemporary/emerging issues/landscape (technology, sharing economy, logistics patterns)• Congestion mitigation and travel reliability (comprehensive, multi-strategy statewide approach to
addressing recurring and non-recurring congestion challenge)• Active transportation and demand management strategies (bicycle, pedestrian, transit access,
micromobility, support for multimodalism)

Carryover RecommendationsRecommendation Supporting Rationale
# 1 ZEEVIC incentives and policies Next Steps regarding improved understanding of EV ownership, equity considerations, infrastructure needs. Also continuation and expansion of partnerships for ZEV planning across states.
# 2 GHG emission reduction potential of vehicle and infrastructure technologies, and associated co-benefits including equity
Emerging technology and policy landscape, continued need to study co-benefits, and also to assess longer-term effects of some of these strategies (2050?)
# 5 MDOT, MDE, Maryland Energy Administration(MEA), Department of Budget and Management (DBM)and the Department of General Services (DGS) shouldreview state fleet procurement procedures andpractices and provide direction on procurement of EVsand other ZEVs, and associated charging/filling stationinstallation guidance and targets, by October 2019.
Infrastructure funding through Volkswagen Mitigation Plan as a precursor to fleet purchase; ZEEVIC state agency group reviewing best practices in procurement.

New Draft RecommendationsRecommendation Supporting Rationale
MDOT will continue to provide support and coordinate with regional partnerships and initiatives like the I-95 Corridor Coalition, AASHTO, and TCI efforts to address transportation management, technology, and funding issues of common interest.
Consistent with MDOT’s goals and priorities, and affirms the value and synergies created through regional level implementation of transportation strategies to enhance mobility and reduce emissions.
MDOT will review shifts in mobility trends, technologies, and logistics that impact congestion and reliability, and assess the value and return on investment of past, ongoing, and planned investment into a more efficient and reliable system.
Increasing congestion and reliability challenges, in part also associated with other Maryland priorities like safety and security, and economic development.
MDOT will strengthen partnerships and initiatives to further “Active Transportation,” and evaluate new tools and data techniques to support route planning for shared mobility options.
MDOT Bicycle and Pedestrian Master Plan (BPMP) update conducted research and outreach related to trends, needs, and opportunities, which captured emerging trends, some of which were included as part of this recommendation.

QUESTIONS?
Colleen Turner, Assistant Director, OPCP Maryland Department of Transportation
68