transportation & logistics - harriswilliams.com concern about aaa’sdemands for customer...
TRANSCRIPT

www.harriswilliams.com
Investment banking services are provided by Harris Williams LLC, a registered broker-dealer and member of FINRA and SIPC, and Harris Williams & Co. Ltd, which is authorised andregulated by the Financial Conduct Authority. Harris Williams & Co. is a trade name under which Harris Williams LLC and Harris Williams & Co. Ltd conduct business.
TRANSPORTATION & LOGISTICS
AUTOMOTIVE AFTERMARKET SECTOR UPDATE │ APRIL 2016

PAGE |
www.harriswilliams.com
TRANSPORTATION & LOGISTICS
AUTOMOTIVE AFTERMARKET SECTOR UPDATE │ APRIL 2016
AMERICANS DROVE MORE THAN 3 TRILLION MILES LAST YEAR
Americans renewed their long-standing love affair with the automobile in 2015,challenging the notion that millennials and baby boomers alike are abandoningtheir cars for public transit, bikes and car-sharing. Last year, U.S. motorists drovemore miles — 3.148 trillion — than any other year in history, according to datareleased by the Federal Highway Administration. And about 17 million new carsand trucks were sold in 2015, an increase of nearly 6 percent and a level of carcommerce not seen since 2000.
The Detroit News
AFTERMARKET OVERVIEW
THE CHANGING FACE OF PARTS RETAILING
Well-known components like ignition keys and analogue gauges are going theway of cigarette lighters and hand-cranked windows. This fairly rapidtransformation has traditional auto parts makers scrambling to adapt as newplayers such as Google, Sony, and other tech companies attempt to redefine theautomobile. Increased transmission of data between aftermarket retailer andconsumer, as well as consumer and vehicle will emerge as the new standard forparts retailing. Expect to see new types of retail businesses emerge to provideservices to consumers using the data they are generating online.
Auto Service World
1
CONTENTS
M&A TRANSACTIONS
PUBLIC MARKETS OVERVIEW
STOCK PRICE PERFORMANCE
OUR GROUP
CONTACTS
UNITED STATES
Frank MountcastleManaging [email protected]+1 (804) 915-0124
Jason BassManaging [email protected]+1 (804) 915-0132
Joe ConnerManaging Director [email protected]+1 (804) 915-0151
Jershon JonesDirector [email protected]+1 (804) 932-1356
Jeff BurkettDirector [email protected] +1 (804) 932-1334
Jeff KiddVice President [email protected] +1 (804) 915-0178
James O’MalleyVice President [email protected]+1 (804) 915-0165
EUROPE
Jeffery PerkinsManaging Director [email protected]+49 (0) 69 3650638 00
Some members of AAA Inc.’s Certified Approved Auto Repair (AAR) program areexpressing concern about AAA’s demands for customer information sharing aspart of next year’s Approved Auto Repair Agreement. According to a letter sentto AAR member shops on Jan. 15, 2016, AAA-affiliated auto clubs across the U.S.“shall require all AAR facilities to implement an Internet-based repair portal and/orshop management system interface to send member vehicle service transactiondata to AAA by Dec. 15, 2016.”
Tire Business
AAA DATA CULLING CONCERNS REPAIR SHOP OWNERS
Due to falling gas prices, the annual cost to own and operate a vehicle in the U.S.has fallen to a six-year low of $8,558, according to AAA’s 2016 Your Driving Costsstudy. This year, a driver can expect to spend 57 cents for each mile driven,approximately $713 per month, to cover the fixed and variable costs associatedwith owning and operating a car. In addition to lower gas prices, vehicle redesignsand improved powertrain technologies increased the average fuel economy ofthe sedans used in the study to 26.7 mpg.
Body Shop Business
STUDY FINDS DRIVING COSTS HAVE HIT SIX-YEAR LOW
HARRIS WILLIAMS & CO. DEAL SPOTLIGHT
Harris Williams & Co. announces the merger of DYK Automotive,LLC, a nationwide distributor of automotive aftermarket productsand portfolio company of Dobbs Management Service, withAAHC, Inc., an operating company of Marubeni Corporation. Aspart of the merger, The Sterling Group will join DobbsManagement Service and management in the investment as thenew majority shareholder of the combined entity. Harris Williams& Co. acted as exclusive financial advisor to DYK Automotive.
DYK Automotive
WHAT WE’RE READING
has merged with
a division of
in a recapitalization by
and

PAGE |
M&A TRANSACTIONS
2
RECENT M&A TRANSACTIONS1,2
TRANSPORTATION & LOGISTICS
AUTOMOTIVE AFTERMARKET SECTOR UPDATE │ APRIL 2016
*Denotes pending transactions
Date Target Business Description Acquirer
4/11/2016* Kovatch Mobile Equipment
Corporation
Designs, manufactures, and distributes customized specialty trucks,
chassis, and vehicles.
REV Group, Inc.
4/1/2016 DYK Automotive, LLC & AAHC,
Inc.
Distributes products to the automotive aftermarket throughout the
United States.
The Sterling Group
3/30/2016 Take 5 Oil Change LLC Provides oil change serv ices for vehicles in the United States. Driven Brands, Inc.
3/24/2016* ASIMCO NVH Technologies Co.,
Ltd.
Manufactures automotive components such as bushings, body mounts,
and engine mounts.
Zhengzhou Coal Mining
Machinery Group Co., Ltd.
3/11/2016* Cruise Automation, Inc. Develops and manufactures autonomous vehicle technologies. General Motors Company
3/1/2016 Jiffy-tite Company Inc. Manufactures fluid hose couplers for the automotive industry. Oetiker Limited
2/29/2016* Pittsburgh Glass Works LLC Manufactures and distributes automotive glass in the United States and
internationally.
LKQ Corp.
2/17/2016 Texas Hydraulics, Inc. Operates as a custom manufacturer of fluid power components for
original equipment manufacturers.
Wynnchurch Capital, LLC
2/9/2016 Trans-Safety LOCKS GmbH Manufactures and markets anti-theft protection products for the
transport industry.
WABCO Holdings Inc.
2/3/2016* PurePOWER Technologies, LLC Offers research and development, engineering, and manufacturing of
engine control and emissions management solutions.
Smithfield Group LLP;
Kensington Capital Partners,
LLC
2/2/2016 UGN, Inc. Manufactures acoustic, interior trim, and thermal management
products for the automotive industry.
Angeles Equity Partners
2/2/2016* Key Safety Systems, Inc. Designs, develops, and manufactures automotive safety-critical
components and systems for automotive and non-automotive markets
worldwide.
Ningbo Joyson Electronic
Corp.
2/2/2016 MICO, Incorporated Manufactures and sells hydraulic components, controls, and brake
systems primarily for off-road vehicles worldwide.
WABCO Holdings Inc.
1/28/2016 Save-A-Load, Inc. Manufactures cargo load bars for tractor trailers, light duty/commercial
vehicles, sprinter vans, SUVs, and pick-up trucks.
Fleet Engineers, Inc.
1/12/2016 H&S Autoshot Manufacturing Co.,
Ltd.
Manufactures stud welders for the automotive industry. Nu-Tec Systems, LLC
1/11/2016 Drake Automotive Group, Inc. Manufactures and markets auto parts for new and v intage American
muscle cars and recreational off-road vehicles.
Huron Capital Partners, LLC
1/5/2016 TowerSec Inc. Operates as an automotive cyber security vendor which develops and
provides on-board cyber security software to OEMs, suppliers, and
aftermarket telematics manufacturers.
Harman International
Industries, Incorporated
12/21/2015 Big Tex Trailer Manufacturing, Inc. Manufactures professional grade open trailers in North America. Bain Capital Private Equity

PAGE |
PUBLIC MARKETS OVERVIEW
3
TRANSPORTATION & LOGISTICS
TEV / LTM EBITDA TEV / 2016P EBITDA
AVERAGE REVENUE GROWTH (2012 – 2015E) AVERAGE REVENUE GROWTH (2015E – 2017P)
AVERAGE EBITDA GROWTH (2012 – 2015E) AVERAGE EBITDA GROWTH (2015E – 2017P)
AUTOMOTIVE AFTERMARKET SECTOR UPDATE │ APRIL 2016
6.6x
8.6x
12.1x
12.1x
Suppliers
Vehicle Manufacturers
Dealerships and Services
Providers
Distributors and Retailers
6.0x
8.9x
11.3x
11.6x
Suppliers
Vehicle Manufacturers
Dealerships and Services
Providers
Distributors and Retailers
0.7%
4.4%
6.6%
15.0%
Suppliers
Vehicle Manufacturers
Distributors and Retailers
Dealerships and Services
Providers
2.3%
2.8%
4.4%
7.7%
Vehicle Manufacturers
Distributors and Retailers
Suppliers
Dealerships and Services
Providers
2.4%
7.8%
13.6%
16.8%
Suppliers
Distributors and Retailers
Vehicle Manufacturers
Dealerships and Services
Providers
2.6%
6.9%
7.8%
12.4%
Vehicle Manufacturers
Dealerships and Services
Providers
Distributors and Retailers
Suppliers

PAGE |
STOCK PRICE PERFORMANCE
4
TRANSPORTATION & LOGISTICS
(Indexed to April 13, 2015)
TRAILING TWELVE MONTHS
MEDIAN % CHANGE (1 MONTH) MEDIAN % CHANGE (12 MONTH)
AUTOMOTIVE AFTERMARKET SECTOR UPDATE │ APRIL 2016
(40%)
(30%)
(20%)
(10%)
0%
10%
20%
30%
40%
Apr-15 Jul-15 Oct-15 Jan-16 Apr-16
Suppliers Distributors and Retailers
Dealerships and Service Providers Vehicle Manufacturers
S&P 500 Index
(1.6%)
(1.0%)
1.2%
1.9%
3.0%
Vehicle
Manufacturers
Dealerships and
Service Providers
Distributors and
Retailers
Suppliers
S&P 500
(25.8%)
(25.6%)
(15.3%)
(0.6%)
22.8%
Vehicle
Manufacturers
Dealerships and
Service Providers
Suppliers
S&P 500
Distributors and
Retailers

PAGE |
OUR GROUP
Harris Williams & Co. is a leading advisor to the transportation and logistics M&A market. Our Transportation & LogisticsGroup serves companies in a broad range of attractive niches, including third-party logistics (3PL), truck, rail, marineand air transportation, transportation equipment, and the automotive and heavy duty vehicle market.
TRANSPORTATION & LOGISTICS
RECENTLY CLOSED T&L TRANSACTIONS
DEEP EXPERIENCE ACROSS T&L SECTORS
MARINE TRANSPORTATION
NICHE TRANSPORTATION
TRANSPORTATION EQUIPMENT
RAIL & RAIL SERVICES
AUTOMOTIVE & HEAVY DUTY
VEHICLE
THIRD-PARTY LOGISTICS
AIR TRANSPORTATION
5
AUTOMOTIVE AFTERMARKET SECTOR UPDATE │ APRIL 2016
has been acquired by
a portfolio company of
has been acquired by
a portfolio company of
and
in partnership with
and
RCL Services Group
has sold
tohas been acquired by
a portfolio company of
has been acquired by
a portfolio company of
has been acquired by
a portfolio company of
has been acquired by
a portfolio company of
a portfolio company of
has been acquired by
a portfolio company of
has acquired
a portfolio company of
has been acquired by
a portfolio company of
has been acquired by
has merged with
a division of
in a recapitalization by
and

Energy, Power& Infrastructure
IndustrialsHealthcare & Life Sciences
Transportation & Logistics
Aerospace, Defense & Government
Services
Business Services
Building Products & Materials
Technology, Media & Telecom
Specialty Distribution
Consumer
PAGE |
HARRIS WILLIAMS & CO. OFFICE LOCATIONS
UNITED STATES EUROPE
BostonTwo International Place24th FloorBoston, Massachusetts 02110Phone: +1 (617) 482-7501
Cleveland1900 East 9th Street20th FloorCleveland, Ohio 44114Phone: +1 (216) 689-2400
Minneapolis222 South 9th StreetSuite 3350Minneapolis, Minnesota 55402Phone: +1 (612) 359-2700
Richmond (Headquarters)1001 Haxall Point9th FloorRichmond, Virginia 23219Phone: +1 (804) 648-0072
San Francisco575 Market Street31st FloorSan Francisco, California 94105Phone: +1 (415) 288-4260
FrankfurtBockenheimer Landstrasse 33-3560325 FrankfurtGermanyPhone: +49 069 3650638 00
London63 Brook StreetLondon W1K 4HS, EnglandPhone: +44 (0) 20 7518 8900
NETWORK OFFICES
Beijing
Hong Kong
Mumbai
New Delhi
Shanghai
Transportation & Logistics
Harris Williams & Co. has a broad range of industry expertise, which creates powerful opportunities.Our clients benefit from our deep-sector experience, integrated industry intelligence andcollaboration across the firm, and our commitment to learning what makes them unique. For moreinformation, visit our website at www.harriswilliams.com/industries.
6
OUR FIRM
TRANSPORTATION & LOGISTICS
AUTOMOTIVE AFTERMARKET SECTOR UPDATE │ APRIL 2016
PAGE |
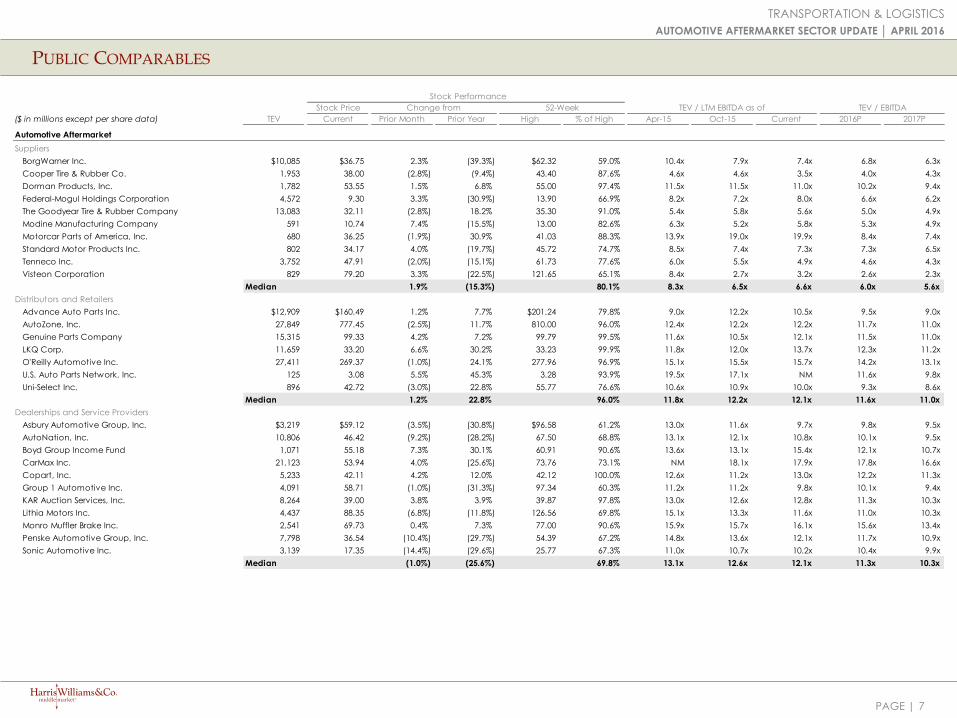
PUBLIC COMPARABLES
7
TRANSPORTATION & LOGISTICS
AUTOMOTIVE AFTERMARKET SECTOR UPDATE │ APRIL 2016
Stock Performance
Stock Price Change from 52-Week TEV / EBITDA EBITDA
($ in millions except per share data) TEV Current Prior Month Prior Year High % of High Apr-15 Oct-15 Current 2016P 2017P
Automotive Aftermarket
TEV / LTM EBITDA as of
Suppliers
BorgWarner Inc. $10,085 $36.75 2.3% (39.3%) $62.32 59.0% 10.4x 7.9x 7.4x 6.8x 6.3x
Cooper Tire & Rubber Co. 1,953 38.00 (2.8%) (9.4%) 43.40 87.6% 4.6x 4.6x 3.5x 4.0x 4.3x
Dorman Products, Inc. 1,782 53.55 1.5% 6.8% 55.00 97.4% 11.5x 11.5x 11.0x 10.2x 9.4x
Federal-Mogul Holdings Corporation 4,572 9.30 3.3% (30.9%) 13.90 66.9% 8.2x 7.2x 8.0x 6.6x 6.2x
The Goodyear Tire & Rubber Company 13,083 32.11 (2.8%) 18.2% 35.30 91.0% 5.4x 5.8x 5.6x 5.0x 4.9x
Modine Manufacturing Company 591 10.74 7.4% (15.5%) 13.00 82.6% 6.3x 5.2x 5.8x 5.3x 4.9x
Motorcar Parts of America, Inc. 680 36.25 (1.9%) 30.9% 41.03 88.3% 13.9x 19.0x 19.9x 8.4x 7.4x
Standard Motor Products Inc. 802 34.17 4.0% (19.7%) 45.72 74.7% 8.5x 7.4x 7.3x 7.3x 6.5x
Tenneco Inc. 3,752 47.91 (2.0%) (15.1%) 61.73 77.6% 6.0x 5.5x 4.9x 4.6x 4.3x
Visteon Corporation 829 79.20 3.3% (22.5%) 121.65 65.1% 8.4x 2.7x 3.2x 2.6x 2.3x
Median 1.9% (15.3%) 80.1% 8.3x 6.5x 6.6x 6.0x 5.6x
Distributors and Retailers
Advance Auto Parts Inc. $12,909 $160.49 1.2% 7.7% $201.24 79.8% 9.0x 12.2x 10.5x 9.5x 9.0x
AutoZone, Inc. 27,849 777.45 (2.5%) 11.7% 810.00 96.0% 12.4x 12.2x 12.2x 11.7x 11.0x
Genuine Parts Company 15,315 99.33 4.2% 7.2% 99.79 99.5% 11.6x 10.5x 12.1x 11.5x 11.0x
LKQ Corp. 11,659 33.20 6.6% 30.2% 33.23 99.9% 11.8x 12.0x 13.7x 12.3x 11.2x
O'Reilly Automotive Inc. 27,411 269.37 (1.0%) 24.1% 277.96 96.9% 15.1x 15.5x 15.7x 14.2x 13.1x
U.S. Auto Parts Network, Inc. 125 3.08 5.5% 45.3% 3.28 93.9% 19.5x 17.1x NM 11.6x 9.8x
Uni-Select Inc. 896 42.72 (3.0%) 22.8% 55.77 76.6% 10.6x 10.9x 10.0x 9.3x 8.6x
Median 1.2% 22.8% 96.0% 11.8x 12.2x 12.1x 11.6x 11.0x
Dealerships and Service Providers
Asbury Automotive Group, Inc. $3,219 $59.12 (3.5%) (30.8%) $96.58 61.2% 13.0x 11.6x 9.7x 9.8x 9.5x
AutoNation, Inc. 10,806 46.42 (9.2%) (28.2%) 67.50 68.8% 13.1x 12.1x 10.8x 10.1x 9.5x
Boyd Group Income Fund 1,071 55.18 7.3% 30.1% 60.91 90.6% 13.6x 13.1x 15.4x 12.1x 10.7x
CarMax Inc. 21,123 53.94 4.0% (25.6%) 73.76 73.1% NM 18.1x 17.9x 17.8x 16.6x
Copart, Inc. 5,233 42.11 4.2% 12.0% 42.12 100.0% 12.6x 11.2x 13.0x 12.2x 11.3x
Group 1 Automotive Inc. 4,091 58.71 (1.0%) (31.3%) 97.34 60.3% 11.2x 11.2x 9.8x 10.1x 9.4x
KAR Auction Services, Inc. 8,264 39.00 3.8% 3.9% 39.87 97.8% 13.0x 12.6x 12.8x 11.3x 10.3x
Lithia Motors Inc. 4,437 88.35 (6.8%) (11.8%) 126.56 69.8% 15.1x 13.3x 11.6x 11.0x 10.3x
Monro Muffler Brake Inc. 2,541 69.73 0.4% 7.3% 77.00 90.6% 15.9x 15.7x 16.1x 15.6x 13.4x
Penske Automotive Group, Inc. 7,798 36.54 (10.4%) (29.7%) 54.39 67.2% 14.8x 13.6x 12.1x 11.7x 10.9x
Sonic Automotive Inc. 3,139 17.35 (14.4%) (29.6%) 25.77 67.3% 11.0x 10.7x 10.2x 10.4x 9.9x
Median (1.0%) (25.6%) 69.8% 13.1x 12.6x 12.1x 11.3x 10.3x

PAGE |
PUBLIC COMPARABLES
8
TRANSPORTATION & LOGISTICS
AUTOMOTIVE AFTERMARKET SECTOR UPDATE │ APRIL 2016
Stock Performance
Stock Price Change from 52-Week TEV / EBITDA EBITDA
($ in millions except per share data) TEV Current Prior Month Prior Year High % of High Apr-15 Oct-15 Current 2016P 2017P
Automotive Aftermarket
TEV / LTM EBITDA as of
Vehicle Manufacturers
Bayerische Motoren Werke Aktiengesellschaft $142,579 $87.89 (1.0%) (32.2%) $131.38 66.9% 11.2x 10.4x 9.9x 8.6x 8.4x
Daimler AG 174,186 71.46 (2.4%) (27.0%) 104.33 68.5% 11.9x 10.0x 6.9x 8.1x 7.8x
Ford Motor Co. 161,402 13.06 (1.7%) (18.2%) 16.10 81.1% 14.1x 12.3x 10.1x 13.3x 12.9x
General Motors Company 90,909 30.78 (1.5%) (15.6%) 37.45 82.2% 8.0x 6.2x 6.6x 5.7x 5.6x
Harley-Davidson, Inc. 15,036 46.83 (4.3%) (24.7%) 62.26 75.2% 12.3x 12.2x 11.0x 11.0x 10.5x
Navistar International Corporation 5,533 13.46 17.8% (51.9%) 30.49 44.1% 18.8x 17.9x 14.8x 9.2x 8.2x
Oshkosh Corporation 3,950 41.00 10.5% (15.3%) 55.69 73.6% 7.9x 7.8x 8.2x 9.1x 8.0x
PACCAR Inc. 24,790 55.56 5.4% (12.2%) 68.44 81.2% 10.7x 8.6x 9.0x 11.4x 11.4x
Toyota Motor Corporation 295,712 51.46 (8.4%) (32.1%) 79.62 64.6% 10.0x 8.6x 7.4x 8.6x 8.7x
Volkswagen AG 160,409 125.82 (1.7%) (54.6%) 279.95 44.9% 9.1x 8.2x 8.2x 5.5x 5.0x
Median (1.6%) (25.8%) 71.1% 10.9x 9.3x 8.6x 8.9x 8.3x

PAGE |
PUBLIC COMPARABLES
9
TRANSPORTATION & LOGISTICS
AUTOMOTIVE AFTERMARKET SECTOR UPDATE │ APRIL 2016
Revenue Revenue Growth EBITDA EBITDA Growth
($ in millions) 2012 2013 2014 2015E 2016P 2017P '12-15E '15E-17P 2012 2013 2014 2015E 2016P 2017P '12-15E '15E-17P
Automotive Aftermarket
Suppliers
BorgWarner Inc. $7,183 $7,437 $8,305 $8,023 $9,088 $9,533 3.8% 9.0% $1,126 $1,224 $1,398 $1,362 $1,493 $1,582 6.6% 7.8%
Cooper Tire & Rubber Co. 4,201 3,439 3,425 2,973 3,017 3,073 (10.9%) 1.7% 629 483 516 555 492 458 (4.1%) (9.2%)
Dorman Products, Inc. 570 664 751 803 855 901 12.1% 5.9% 112 138 152 162 175 188 13.0% 7.7%
Federal-Mogul Holdings Corporation 6,444 6,786 7,317 7,419 7,600 7,870 4.8% 3.0% 439 555 578 575 687 737 9.4% 13.2%
The Goodyear Tire & Rubber Company 20,992 19,540 18,138 16,443 16,143 16,306 (7.8%) (0.4%) 1,819 2,132 2,251 2,336 2,652 2,703 8.7% 7.6%
Modine Manufacturing Company 1,577 1,376 1,478 1,496 1,354 1,337 (1.7%) (5.5%) 128 96 116 109 113 121 (5.3%) 5.5%
Motorcar Parts of America, Inc. 179 213 259 302 377 431 19.1% 19.6% 31 37 35 36 81 92 5.5% 59.8%
Standard Motor Products Inc. 949 984 980 972 1,006 1,048 0.8% 3.8% 102 120 126 110 109 123 2.4% 6.2%
Tenneco Inc. 7,363 7,964 8,420 8,209 8,491 8,937 3.7% 4.3% 638 695 736 772 831 880 6.6% 6.7%
Visteon Corporation 5,715 1,724 2,586 3,245 3,240 3,432 (17.2%) 2.8% 479 55 125 259 324 363 (18.5%) 18.4%
Total $55,173 $50,127 $51,659 $49,885 $51,171 $52,868 0.7% 4.4% $5,503 $5,535 $6,033 $6,276 $6,957 $7,247 2.4% 12.4%
Distributors and Retailers
Advance Auto Parts Inc. $6,205 $6,494 $9,844 $9,737 $9,760 $9,945 16.2% 1.1% $847 $969 $1,381 $1,233 $1,376 $1,456 13.4% 8.7%
AutoZone, Inc. 8,604 9,148 9,475 10,187 10,734 11,294 5.8% 5.3% 1,841 2,000 2,081 2,223 2,386 2,537 6.5% 6.8%
Genuine Parts Company 13,014 14,078 15,342 15,280 15,500 15,955 5.5% 2.2% 1,114 1,209 1,273 1,266 1,306 1,384 4.4% 4.6%
LKQ Corp. 4,123 5,063 6,740 7,193 7,739 8,302 20.4% 7.4% 493 627 790 852 938 1,030 20.0% 9.9%
O'Reilly Automotive Inc. 6,182 6,649 7,216 7,967 8,555 9,147 8.8% 7.2% 1,159 1,291 1,468 1,743 1,913 2,082 14.6% 9.3%
U.S. Auto Parts Network, Inc. 304 255 284 291 303 NA (1.4%) NA 8 5 5 6 11 NA (8.5%) NA
Uni-Select Inc. 1,798 1,788 1,784 1,355 1,139 1,182 (9.0%) (6.6%) 79 82 92 90 96 104 4.4% 7.5%
Total $40,229 $43,474 $50,685 $52,010 $53,730 $55,825 6.6% 2.8% $5,540 $6,182 $7,091 $7,414 $8,025 $8,593 7.8% 7.8%
Dealerships and Service Providers
Asbury Automotive Group, Inc. $4,475 $5,128 $5,639 $6,325 $6,841 $7,234 12.2% 6.9% $210 $259 $297 $332 $335 $339 16.5% 1.1%
AutoNation, Inc. 15,020 16,674 18,180 19,847 22,565 23,316 9.7% 8.4% 737 826 911 998 1,064 1,120 10.6% 5.9%
Boyd Group Income Fund 329 438 639 879 994 1,098 38.7% 11.8% 21 31 52 79 88 99 55.7% 12.1%
CarMax Inc. 10,004 10,963 12,574 14,269 15,142 16,404 12.6% 7.2% 783 828 932 1,091 1,186 1,275 11.7% 8.1%
Copart, Inc. 924 1,046 1,163 1,146 1,209 1,274 7.4% 5.4% 338 351 362 389 427 459 4.7% 8.6%
Group 1 Automotive Inc. 7,216 8,607 9,571 10,224 11,327 11,691 12.3% 6.9% 271 322 390 416 407 447 15.4% 3.7%
KAR Auction Services, Inc. 1,963 2,173 2,365 2,640 2,942 3,165 10.4% 9.5% 471 495 574 644 733 795 11.0% 11.1%
Lithia Motors Inc. 3,204 3,867 5,200 7,581 8,580 8,973 33.3% 8.8% 166 210 266 383 394 427 32.2% 5.7%
Monro Muffler Brake Inc. 687 732 831 894 952 1,050 9.2% 8.3% 115 101 127 147 163 190 8.4% 13.7%
Penske Automotive Group, Inc. 12,584 14,112 16,796 18,807 20,431 21,274 14.3% 6.4% 417 489 571 645 673 705 15.6% 4.6%
Sonic Automotive Inc. 8,115 8,571 8,897 9,298 9,936 10,232 4.6% 4.9% 288 300 304 309 301 321 2.3% 1.8%
Total $64,522 $72,312 $81,857 $91,908 $100,918 $105,711 15.0% 7.7% $3,818 $4,212 $4,785 $5,433 $5,772 $6,178 16.8% 6.9%

PAGE |
PUBLIC COMPARABLES
10
TRANSPORTATION & LOGISTICS
AUTOMOTIVE AFTERMARKET SECTOR UPDATE │ APRIL 2016
Vehicle Manufacturers
Bayerische Motoren Werke Aktiengesellschaft $57,296 $63,981 $62,738 $88,995 $102,394 $105,812 15.8% 9.0% $11,820 $11,724 $13,502 $14,407 $16,242 $16,982 6.8% 8.6%
Daimler AG 105,477 112,497 115,527 127,163 164,718 171,318 6.4% 16.1% 12,119 12,120 20,220 25,430 21,728 22,613 28.0% (5.7%)
Ford Motor Co. 128,168 126,567 139,369 135,782 138,865 145,090 1.9% 3.4% 11,464 19,724 8,132 16,017 12,266 12,175 11.8% (12.8%)
General Motors Company 148,866 150,295 152,092 151,092 145,110 147,032 0.5% (1.4%) 10,914 10,741 9,084 13,690 16,104 15,963 7.8% 8.0%
Harley-Davidson, Inc. 4,662 4,943 5,258 5,568 5,322 5,365 6.1% (1.8%) 1,198 1,321 1,460 1,362 1,351 1,423 4.4% 2.2%
Navistar International Corporation 13,441 12,527 10,617 10,653 10,213 8,919 (7.5%) (8.5%) (468) (423) 152 425 605 695 NM 27.8%
Oshkosh Corporation 7,539 8,141 7,665 6,808 6,076 5,822 (3.3%) (7.5%) 511 636 622 517 435 501 0.4% (1.6%)
PACCAR Inc. 15,326 15,952 15,949 17,793 18,068 16,361 5.1% (4.1%) 1,927 2,047 2,446 2,768 2,149 2,216 12.8% (10.5%)
Toyota Motor Corporation 156,712 153,998 183,917 213,803 237,858 250,313 10.9% 8.2% 12,518 22,125 31,157 38,069 33,463 33,777 44.9% (5.8%)
Volkswagen AG 158,665 192,979 195,414 198,245 238,107 237,461 7.7% 9.4% 21,676 21,328 22,897 25,171 29,883 33,500 5.1% 15.4%
Total $796,151 $841,879 $888,546 $955,902 $1,066,730 $1,093,493 4.4% 2.3% $83,677 $101,342 $109,672 $137,856 $134,228 $139,845 13.6% 2.6%
Revenue Revenue Growth EBITDA EBITDA Growth
($ in millions) 2012 2013 2014 2015E 2016P 2017P '12-15E '15E-17P 2012 2013 2014 2015E 2016P 2017P '12-15E '15E-17P
Automotive Aftermarket

PAGE |
TRANSPORTATION & LOGISTICS
SOURCES
TRANSPORTATION & LOGISTICS
1. Capital IQ.
2. MergerMarket.
Harris Williams & Co. (www.harriswilliams.com) is a preeminent middle market investment bank focused on the advisory needs of clients worldwide. The firm has deep industry knowledge, global transaction expertise, and an unwavering commitment to excellence. Harris Williams & Co. provides sell-side and acquisition advisory, restructuring advisory, board advisory, private placements, and capital markets advisory services.
Investment banking services are provided by Harris Williams LLC, a registered broker-dealer and member of FINRA and SIPC, and Harris Williams & Co. Ltd, which is authorised and regulated by the Financial Conduct Authority. Harris Williams & Co. is a trade name under which Harris Williams LLC and Harris Williams & Co. Ltd conduct business.
THIS REPORT MAY CONTAIN REFERENCES TO REGISTERED TRADEMARKS, SERVICE MARKS AND COPYRIGHTS OWNED BY THIRD-PARTY INFORMATION PROVIDERS. NONE OF THE THIRD-PARTY INFORMATION PROVIDERS IS ENDORSING THE OFFERING OF, AND SHALL NOT IN ANY WAY BE DEEMED AN ISSUER OR UNDERWRITER OF, THE SECURITIES, FINANCIAL INSTRUMENTS OR OTHER INVESTMENTS DISCUSSED IN THIS REPORT, AND SHALL NOT HAVE ANY LIABILITY OR RESPONSIBILITY FOR ANY STATEMENTS MADE IN THE REPORT OR FOR ANY FINANCIAL STATEMENTS, FINANCIAL PROJECTIONS OR OTHER FINANCIAL INFORMATION CONTAINED OR ATTACHED AS AN EXHIBIT TO THE REPORT. FOR MORE INFORMATION ABOUT THE MATERIALS PROVIDED BY SUCH THIRD PARTIES, PLEASE CONTACT US AT THE ABOVE ADDRESSES OR NUMBERS.
The information and views contained in this report were prepared by Harris Williams & Co. (“Harris Williams”). It is not a research report, as such term is defined by applicable law and regulations, and is provided for informational purposes only. It is not to be construed as an offer to buy or sell or a solicitation of an offer to buy or sell any financial instruments or to participate in any particular trading strategy. The information contained herein is believed by Harris Williams to be reliable, but Harris Williams makes no representation as to the accuracy or completeness of such information. Harris Williams and/or its affiliates may be market makers or specialists in, act as advisers or lenders to, have positions in and effect transactions in securities of companies mentioned herein and also may provide, may have provided, or may seek to provide investment banking services for those companies. In addition, Harris Williams and/or its affiliates or their respective officers, directors and employees may hold long or short positions in the securities, options thereon or other related financial products of companies discussed herein. Opinions, estimates and projections in this report constitute Harris Williams’ judgment and are subject to change without notice. The financial instruments discussed in this report may not be suitable for all investors, and investors must make their own investment decisions using their own independent advisors as they believe necessary and based upon their specific financial situations and investment objectives. Also, past performance is not necessarily indicative of future results. No part of this material may be copied or duplicated in any form or by any means, or redistributed, without Harris Williams’ prior written consent.
Copyright© 2016 Harris Williams & Co., all rights reserved.
DISCLOSURES
11
AUTOMOTIVE AFTERMARKET SECTOR UPDATE │ APRIL 2016