transport research laboratory - keeping london … · transport research laboratory ... proportion...
TRANSCRIPT

Transport Research Laboratory
Mobile Phone and Seat Belt Usage Rates
in London 2008
by J Knowles, LK Walter and G Buckle
PPR 364
PUBLISHED PROJECT REPORT


Transport Research Laboratory
PUBLISHED PROJECT REPORT PPR 364
Mobile Phone and Seat Belt Usage Rates in London 2008
by J Knowles, LK Walter and G Buckle (TRL)
Prepared for: Project Record: Mobile Phone and Seat Belt Usage Rates in
London
Client: Transport for London, London Road Safety Unit
(Adrian McMullan)
Copyright Transport Research Laboratory May 2008
This Published Report has been prepared for Transport for London. Published Project
Reports are written primarily for the Client rather than for a general audience and are
published with the Client‟s approval.
The views expressed are those of the author(s) and not necessarily those of Transport
for London.
Name Date
Approved
Project
Manager Paul Walton 26/06/2008
Technical
Referee Jeremy Broughton 24/06/2008

Published Project Report
TRL PPR 364
If this report has been received in hard copy from TRL, then in support of the company‟s
environmental goals, it will have been printed on recycled paper, comprising 100% post-
consumer waste, manufactured using a TCF (totally chlorine free) process.

Published Project Report
TRL v PPR 364
Contents
List of Tables vii
List of Figures vii
Executive summary 1
1 Introduction 3
2 Survey methods 3
2.1 Data collection 3
2.2 Changes from previous surveys 4
2.3 Data Analysis 5
3 Survey results 2008 5
3.1 Use of seat belts and other restraints 7
3.2 Use of mobile phones 16
4 Law Enforcement 21
5 Casualty saving 22
5.1 Casualty saving of increased seat belt use 22
5.2 Casualty saving of reduced mobile phone use 24
6 Summary 25
Acknowledgements 27
References 27
Appendix A: Hammersmith & Fulham and Hackney data 28
Appendix B: Borough results 31


Published Project Report
TRL vii PPR 364
List of Tables
Table 2.1: Variables and categories of data collected in survey ................................... 4 Table 3.1: Number of vehicles and occupants observed, London surveys ...................... 6 Table 3.2: Distribution of vehicles observed (2008) and annual traffic by road type in
London (2007) ................................................................................................ 6 Table 3.3: Distribution of car registrations in London year .......................................... 7 Table 3.4: Overall proportion of vehicle occupants using restraints .............................. 8 Table 3.5: Proportion of car occupants using restraints, by road type .......................... 9 Table 3.6: Proportion of car occupants using restraints, by time of week ...................... 9 Table 3.7: Proportion of male car occupants using restraints, by age and seating position
................................................................................................................... 10 Table 3.8: Proportion of female car occupants using restraints, by age and seating
position ........................................................................................................ 11 Table 3.9: Use of child restraints in cars................................................................. 13 Table 3.10: Car occupant wearing rates, weekdays, by area, 2008 ............................ 14 Table 3.11: Car occupant wearing rates, weekdays, by Police Garage, 2008 ............... 14 Table 3.12: Overall proportion of drivers using mobile phones in London.................... 17 Table 3.13: Proportion of car and taxi drivers using mobile phones, weekdays, by area,
2008 ............................................................................................................ 18 Table 3.14: Proportion of car and taxi drivers using mobile phones, weekdays, by Police
garage, 2008 ................................................................................................ 19 Table 3.15: Proportion of drivers using mobile phones, by restraint status ................. 20 Table 4.1: Number and rate of Fixed Penalty Notices in London, 2007 ....................... 21 Table 5.1: Estimated car occupant casualty saving in London per year if restraint use
increased to level found by DfT survey ............................................................. 23 Table 5.2: Estimated car occupant casualty saving in London per year if restraint use
increased to 100% ......................................................................................... 23 Table 5.3: Estimated casualty saving in London per year if mobile phone use decreased
to level found by DfT survey ........................................................................... 24 Table 5.4: Estimated casualty saving in London per year if mobile phone use eliminated
................................................................................................................... 24
List of Figures
Figure 3.1: Trends in wearing rate, DfT survey ........................................................ 7
Figure 3.2: Proportion of restrained car occupants, by age in years, sex and seating
position, 2008 .............................................................................................. 12
Figure 3.3: Proportion of car drivers using seat belts, weekdays, by area, 2008 ......... 15
Figure 3.4: Proportion of car drivers using seat belts, weekdays, by Police garage, 2008
................................................................................................................... 15
Figure 3.5: Trends in mobile phone use, DfT survey ............................................... 16
Figure 3.6: Hand-held mobile phone use by car and taxi drivers in London, by age and
sex ............................................................................................................. 17
Figure 3.7: Hands-free mobile phone use by car and taxi drivers in London, by age and
sex ............................................................................................................. 18
Figure 3.8: Proportion of car and taxi drivers using hand-held mobile phones, weekdays,
by area, 2008 .............................................................................................. 19
Figure 3.9: Proportion of car and taxi drivers using hand-held mobile phones, weekdays,
by Police garage, 2008 .................................................................................. 20


Published Project Report
TRL 1 PPR 364
Executive summary
The third London Seat Belt and Mobile Phone survey was carried out in March 2008 to
survey the use of restraints1 by car, taxi and van occupants, and the use of mobile
phones by drivers. The survey used the same method as the London survey in 2006 and
2007 and the long running Department for Transport (DfT) Seat Belt and Mobile Phone
survey. Observations were made on a weekday at 33 sites in London covering a range of
different road types – one site in each Borough and one in the City of London. Ten of the
sites were also surveyed at the weekend.
In total 30,850 cars and taxis and 5,314 vans were observed in 2008. Details of restraint
use, age group and gender were recorded for all drivers, 14,118 car and taxi passengers
and 1,394 van passengers as well as mobile phone use by the drivers. The report
compares results from the 2008 survey with results from the 2006 and 2007 London
surveys and the most recent DfT survey.
Overall, the survey found that a higher proportion of car drivers in London were wearing
seat belts in 2008, compared with the previous two years. In 2008, 89% of car drivers in
London were observed to be wearing seat belts. This wearing rate is an increase from
82% in 2006 and 87% in 2007. The survey found a less positive picture for passenger
seat belt compliance. In 2008, there was a further increase in seat belt wearing for front
seat passengers in cars (80% in 2006; 84% in 2007; 86% in 2008). However, the
wearing rate for rear seat passengers in cars decreased slightly in 2008 after a
substantial improvement in 2007 (49% in 2006; 65% in 2007; 63% in 2008).
The proportion of occupants observed wearing seat belts in London was lower than that
observed in the Built-Up sites of the DfT survey, although the difference between the
two surveys is smaller in 2008 than in 2006. For example, nationally the proportion of
car drivers wearing a seat belt has remained fairly stable at around 92% over the last
few years (DfT survey). However, in London compliance is slightly poorer, although it
has risen from 82% in 2006 to 89% in 2008.
Drivers of hackney carriages are not legally required to wear a seat belt whilst on duty
and private taxi drivers are not required to wear a seat belt when they are carrying a
fare paying passenger. As a consequence, the proportion of taxi drivers wearing seat
belts (14% in 2008) is substantially lower than the for car drivers (89% in 2008). The
proportion of taxi passengers wearing seat belts has increased gradually since 2006
(17% in 2006; 19% in 2007; 21% in 2008). However, this proportion is considerably
lower than the proportion of car passengers wearing seat belts. The proportion of van
drivers wearing seat belts increased from 56% in 2007 to 61% in 2008, whilst the
wearing rate for van passengers remains at just under 50% in 2008.
The 33 sites were grouped into five regions of London for analysis. This analysis showed
that the wearing rates were lowest in Central London and the highest in South East
London.
The survey records the type of child restraint used, so the effects of the new child
restraint regulations could be monitored. The 2007 survey saw a significant drop in the
proportion of unrestrained children (aged 0-4 and 5-9) from 2006. The 2008 survey
found that the effect of the new regulations was not sustained for children aged 0-4 yrs
returning to 2006 levels for those seated in the rear of the car (25% unrestrained in
2008 compared with 8% in 2007). However, the effect was sustained for children aged
5-9 and 10-13, with these age groups seeing slight drops in the proportion of
unrestrained children: in the front seat the proportion of 5-9 years olds observed not
wearing a restraint dropped from 21% in 2007 to 18% in 2008, and the proportion of
10-13 year olds dropped from 14% to 13% in the same period; and in the rear seat the
proportion of 5-9 years olds observed not wearing a restraint dropped slightly from 27%
1 Restraint includes seat belt and appropriate child restraint systems.
Published Project Report
TRL 2 PPR 364
in 2007 to 26% in 2008, and the proportion of 10-13 year olds dropped from 31% to
28% in the same period.
Overall mobile phone use has increased over the last three years for all car drivers
(3.8% in 2006; 3.7% in 2007; 5.0% in 2008), taxi drivers (1.9% in 2006; 3.8% in
2007; 8.1% in 2008) and van drivers (4.8% in 2006; 6.7% in 2007; 7.7% in 2008). In
2006 the majority of the mobile phones being used were hand-held, while in 2008 the
reverse is true with a greater proportion of drivers using hands-free phones while
driving. After the penalties for using a hand-held mobile phone while driving increased in
February 2007, the proportion of car drivers using hand-held phones fell from 2.6% in
2006 to 1.4% in 2007. However, this proportion increased in 2008 to 1.9%. Over the
same three year period the use of hands-free mobile phones has risen: for car drivers
from 1.2% in 2006 to 3.1% in 2008, for taxi drivers from 0.8% in 2006 to 7.5% in 2008
and for van drivers from 1% in 2006 to 4.9% in 2008. While more drivers are complying
with the law, its focus on hand-held mobiles may have led them to believe that hands-
free mobile phones are safer than hand-held to use while driving. There is research to
suggest that there may be no difference (e.g., Kircher et al., 20042).
Previous London surveys showed that drivers‟ use of hand-held and hands-free mobile
phones was correlated with their use of seat belts. As in previous years, belted drivers in
2008 were less likely than unbelted drivers to use hand-held mobile phones. 1.6% of car
and taxi drivers wearing a seat belt were using a hand-held mobile phone, compared
with 2.7% of those who did not wear a belt, and a similar disparity was found for van
drivers. This suggests that driving while using a hand-held mobile phone and whilst
unbelted are consequences of a driver‟s general willingness to disobey traffic laws.
The Police issue fixed penalty notices (FPNs) for restraint and mobile phone driving
offences. Rates of seat belt FPNs issued in 2007 varied from 0.28 per million vehicle km
in South East London to 0.78 per million vehicle km in Central London, with an average
in London of 0.43 per million vehicle km. More FPNs were issued for mobile phone
offences, although fewer drivers use hand-held mobile phones than fail to wear seat
belts. Overall 0.89 FPNs per million vehicle km were issued in 2007, rates ranged from
0.58 per million vehicle km in South East London to 1.92 per million vehicle km in
Central London.
In conclusion, the results of the latest survey show that overall seat belt wearing rates
are improving, but mobile phone use is worsening, albeit the trends are different for
hand-held and hands-free. With any increase in the level of restraint use in London and
reduction in the level of mobile phone use while driving, the number of casualties would
be expected to fall. Using 2007 casualty figures and the 2008 survey results, if the seat
belt wearing rate in London was 100%, the resulting casualty saving has been estimated
at around 160 KSI casualties and 590 total casualties per year. Similarly, if no drivers
used a mobile phone, it is estimated that there would be approximately 560 fewer KSI
casualties per year.
2 Kircher, A, Vogel, K, Tornos, J, Bolling, A, Nilsson, L, Patten, C, Malmstrom, T and Ceci, C (2004).
Mobile telephone simulator study. Swedish National Road and Transport Research Institute, Sweden.

Published Project Report
TRL 3 PPR 364
1 Introduction
The use of seat belts by drivers and front seat passengers was made compulsory in cars
and vans in January 1983, and for rear seat passengers in 1991 - where belts were
available. A national DfT-funded seat belt survey was implemented in 1982, and
superseded in 1988 by a more comprehensive TRL survey that was carried out twice a
year to record the use of restraints by car, van and taxi drivers and their passengers.
The survey was adapted in the year 2000 to record the use of hand-held and hands-free
phone use by drivers. This provided important evidence of drivers‟ response to the
legislation in December 2003 to prohibit the use of a hand-held mobile phone while
driving.
An equivalent study in London was carried out in 2006 and 2007 for Transport for
London (Broughton & Buckle, 2006 and Walter et al, 2007). The restraint and mobile
phone use was observed at one site in each of the 32 London Boroughs and another in
the City of London in March of each year. The survey was repeated in 2008 and the
results are presented in this report. These findings are compared with the 2006 and
2007 results for London and the latest results on Built-Up3 roads in the DfT survey
(October 2007).
Previous London surveys found that mobile phone use was higher than on Built-Up roads
in the DfT survey, and that restraint wearing was lower. If the levels in London had
matched those found in the DfT survey, it is estimated that fewer people in London
would have been killed and injured in road collisions.
2 Survey methods
2.1 Data collection
In March 2006, the first seat belt and mobile phone survey for London was completed
using methods that had been developed for the DfT survey. The basic method has been
applied since 1988, with adaptations to the data requirements and collection procedures,
and each year the results are published in a leaflet (e.g. TRL, 2008). Two extensive
areas are used for the DfT survey, centred on Crowthorne and Nottingham, and other
areas are surveyed each year to build up a national picture (Broughton, 2003). Restraint
usage is well represented by the two areas; mobile phone usage is more varied,
however, so these proportions are not as nationally representative.
For the London survey, detailed data were collected at 33 sites – one site per London
Borough and one in the City of London. In order to achieve a representative London
estimate, the 33 sites cover all types of road – 12 were situated on the Transport for
London road network (TLRN), 11 on the Borough Principal Road Network (BPRN) and the
remaining ten on Minor roads (Minor). The sites are not designed to be representative of
individual Boroughs, but to give a balanced view of seat belt and drivers‟ mobile phone
use in London. In the analysis, data are weighted to represent the distribution of traffic
on these three types of road in London. In order to make direct comparisons with the
2006 and 2007 surveys, the same sites were revisited in 2008.
The survey collected information on drivers, front and rear seat passengers and people
sitting on laps in cars, vans and taxis (hackney carriages and private hire vehicles). The
information comprised details of restraint use for all occupants (including the different
child restraint types) and mobile phone use for drivers. Age group and sex were also
collected along with car registration, as cars older than E registration are not required to
have rear seat belts. Age group and sex of the occupants was estimated by the survey
staff and where there was doubt the variable was recorded as unknown. The sex of
young children is particularly difficult to estimate and this is reflected in the numbers
3 Built-up roads have speed limits of less than 40mph.

Published Project Report
TRL 4 PPR 364
recorded as unknown: almost 100% of under 1s, 46% of 1-4 year olds, 53% of 5-9 year
olds and 41% of 10-13 year olds compared with under 1% unknown for the adult age
groups. Estimating a child‟s age is also difficult.
The data collection procedures were as consistent as possible across the years. Each set
of data was collected at a signal controlled junction in eight half hour sessions during
daylight hours on a weekday. Ten sites were also surveyed at the weekend to detect any
differences in restraint wearing and mobile phone use during the weekend. Two people
were posted at each site: one recorded the number and type of vehicles passing in the
observation session while the other recorded restraint and phone use for occupants of
vehicles that stopped at the traffic signal. The detailed data on occupants in each vehicle
were recorded via a digital voice recorder. The data recorded for each vehicle are
detailed in Table 2.1.
Table 2.1: Variables and categories of data collected in survey
Variable Categories
Seating position driver, front seat passenger, rear seat passenger (left, central, right);
people seated on passengers‟ laps
Sex male, female, unknown.
Age (estimated) 0, 1-4, 5-9, 10-13, 14-29, 30-59, 60+, unknown.
Restraint used seat belt, unrestrained, child seat, rear facing baby seat, booster seat with seat belt, booster cushion with seat belt, booster seat without seat belt, booster cushion without seat belt, cheated (restraint not used properly), unknown
Driver mobile phone use
Hand-held, hands-free, none
Vehicle type car, van, hackney carriage, private hire vehicle
Vehicle prefix L and later registrations, H-K, E-G, C-D, older, other
The survey was conducted during daylight hours, in order to observe vehicle occupants
accurately. Broughton and Walter (2007) present evidence to suggest that restraint
wearing rates are lower at night (defined as 8pm-7.59am) than during the day (8am-
7.59pm), so wearing rates for the full day are likely to be slightly lower than the rates
calculated from the survey data.
The survey collected information on the use of hand-held and hands-free mobile phones.
A hand-held device is something that “is or must be held at some point during the
course of making or receiving a call or performing any other interactive communication
function”. A hands-free device is one that can be operated without holding the mobile
phone. It is an offence to use a hand-held mobile phone when driving regardless of
whether the driving has been affected; this is not the case for hands-free phones.
Observations of drivers using hands-free phones are only recorded if the observer is sure
that a hands-free device is being used. Due to the difficulty in observing hands-free
phone usage, these results are likely to be underestimates.
2.2 Changes from previous surveys
No major road traffic regulation changes occurred between the 2007 and 2008 surveys.
However, two sets of changes occurred between the 2006 and 2007 surveys: the road
traffic regulations changed in two significant respects and some minor adjustments were
made to the survey sites and procedure (Walter, Broughton & Buckle, 2007). On 18
September 2006, a new regulation took effect that requires a driver to ensure that any

Published Project Report
TRL 5 PPR 364
child travelling in their vehicle uses an appropriate type of restraint (DfT, 2006). The
definition of „appropriate‟ depends upon the child‟s age, weight and height, but the
conventional belt designed for adults is not regarded as appropriate for children up to
135cm in height (or 12th birthday, whichever they reach first). The introduction of the
new regulation was accompanied by extensive national publicity and public discussion.
The use of a hand-held mobile phone while driving was prohibited in December 2003,
and new penalties were introduced on 27 February 2007. From that date, the fixed
penalty included three penalty points and the basic fine was doubled to £60. Thus, it
became possible for a driver to be disqualified from driving as a result of repeated
mobile phone offences. Again, the new regulation was introduced to the accompaniment
of extensive national publicity and public discussion.
During data quality checks for the 2008 survey, two sites were found to be missing
detailed data for vans, namely Hackney and Hammersmith & Fulham. This error was due
to a new member of the survey team failing to separately identify vans from cars at
these two sites. The main reason of concern is that van drivers are less likely to wear
their seat belts than car drivers (56% wearing rate compared to 87% wearing rate in
2007) and are more likely to use a mobile phone (6.7% compared to 3.7% in 2007).
However, a detailed look at the results from these two Boroughs confirms that this error
does not have a significant impact on the main results and does not affect the
conclusions. However, for the remainder of the report whenever cars are referred to in
the tables and figures, a small unknown number of vans will be included from these two
Boroughs. A more detailed analysis of Hackney and Hammersmith & Fulham are
presented in Appendix A.
2.3 Data Analysis
The 2008 data have been analysed identically to the 2007 and 2006 survey data, so the
three sets of results can be compared directly.
Restraint use and mobile phone use that are classified as unknown are excluded from
the analysis, and occupants classified as not using their restraint properly4 are included
as „unrestrained‟ passengers. Weights were applied to the data to give a more
representative estimate of rates across London. At the Borough level, these weights
were based on traffic counts in each session to ensure that the proportion of vehicles for
which detailed data is collected is the same across all sites and sessions. When the data
were combined to give an overall estimate for London, an additional weighting procedure
allowed for traffic flows on different types of road in London. The identical process was
used to analyse the data from the 2006 and 2007 London surveys and follows the
methods of the long running DfT survey.
The results from 2008 were compared with the London 2006 and 2007 results and the
October 2007 results from Built-Up roads in the DfT survey (using observations from
sites with a speed limit of at most 40mph) where appropriate. At the time that this
report was being prepared, the most recent DfT seat belt and mobile phone survey had
been conducted in October 2007. Note that results quoted from that survey (labelled DfT
2007) relate to sites with speed limits up to 40mph, in order to be comparable with the
sites of the London survey.
3 Survey results 2008
During March 2008, observations were made at 33 sites in London. Table 3.1 shows the
numbers of vehicles observed on 43 site visits (33 sites visited on a weekday and ten
sites revisited at the weekend). Detailed observations were made of the occupants of
4 This includes occupants wearing a seat belt that has not been fastened. Vehicle occupants who are classified as not using their restraint properly make up approximately 1.5% of all unrestrained occupants.

Published Project Report
TRL 6 PPR 364
30,850 cars and taxis and 5,314 vans; a decrease in the number of observations of 5%
and 12% respectively, compared with 2007. The average number of front and rear seat
passengers per vehicle has not changed over the last three years - an average of 0.3
front seat passengers per car and 0.16 rear seat passengers per car. Details were
recorded for 1,798 taxis, 70% of these were observed in Central London and 12% in
North East London (these areas are defined in Appendix B).
There were fewer observations of van and taxi occupants than car occupants, so larger
variation between results from the three surveys may arise by chance for van and taxi
occupants than car occupants. In some cases only car driver or car occupant results are
displayed as they provide the most robust results.
Once the data had been verified and validated, weights were applied to each data point
dependent on the volume of traffic per road type and weekend or weekday and the
proportion of vehicles that passed during the survey session for which detailed
observations were made. The weights ensure that results represent London averages as
well as possible. All proportions reported in this report have been weighted, and any
sample size is reported as an unweighted actual representation of the number of
observations.
Table 3.1: Number of vehicles and occupants observed, London surveys
Vehicles & Occupants 2006 2007 2008
Cars 27,638 30,126 29,052
Front seat passenger 8,534 8,893 8,839
Rear seat passenger 4,343 4,734 4,374
Taxis 1,497 2,027 1,798
Passenger 790 1,095 905
Vans 4,709 6,006 5,314
Passenger 1,252 1,550 1,394
The 33 sites are spread across the three types of road in London (TLRN, BPRN and
Minor). Table 3.2 shows the numbers of vehicles observed on each road type during the
study and the most recent estimated annual traffic flow in million vehicle kilometres
travelled on these roads in London (2007 data). These numbers form the basis of the
weighting system.
Table 3.2: Distribution of vehicles observed (2008) and annual traffic by road
type in London (2007)
Road type
Vehicles observed Traffic volume1
(million vkm)
Car or taxi Van Car or taxi Van
TLRN 12,789 2,438 7,618 1,257
BPRN 9,420 1,575 6,837 925
Minor 8,641 1,301 10,261 1,680
1Traffic data sources: Table 4.1.2, London Travel Report 2007 (TfL, 2008), RNPR Traffic Note 1 (RNPR, 2008)
Published Project Report
TRL 7 PPR 364
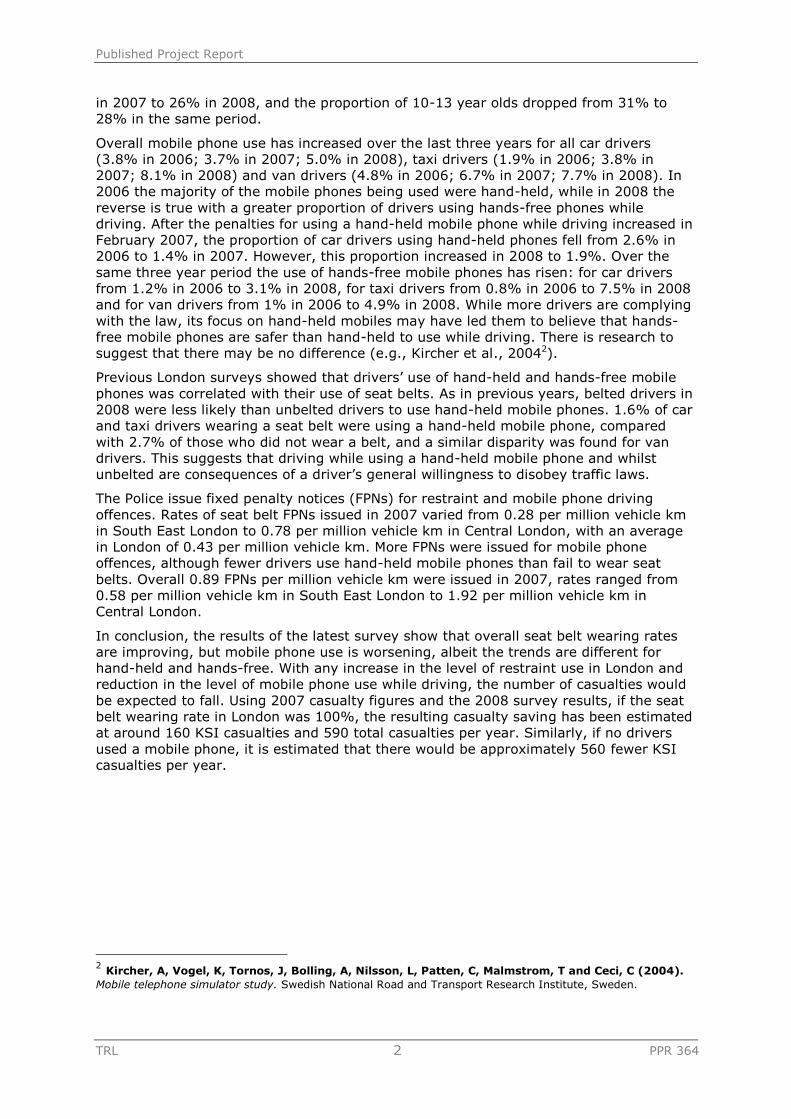
The vehicle registration was recorded to identify older cars which, if older than an E
registration (registered before August 1987), are not required by law to be fitted with
rear seat belts. However, as shown in Table 3.3, the vast majority (over 99% in 2007
and 2008) of cars observed were newer than this, so no adjustment for these older
vehicles was deemed necessary.
Table 3.3: Distribution of car registrations in London year
Survey L and later
H-K E-G C-D Older
2006 90.4% 5.8% 2.3% 0.5% 0.9%
2007 94.4% 3.7% 1.2% 0.4% 0.4%
2008 95.3% 3.0% 1.0% 0.4% 0.3%
Distribution excludes other registrations, e.g. military and diplomatic
3.1 Use of seat belts and other restraints
The DfT survey has been running for many years, so it is possible to follow the trend in
restraint wearing across time for different categories of occupants and vehicles.
Figure 3.1 shows this trend from 1995 for driver, front seat passenger and child and
adult rear seat passengers in cars. The driver and front seat wearing rates have been
around 92% over the last few years whilst rear restraint wearing rates for children5 and
adults have tended to increase. The adult rear seat belt wearing rate remains
considerably lower than the other rates. The results of the latest DfT survey for Built-Up
roads only (October 2007) are included in this report for comparison purposes and are
referred to as the national average.
40%
50%
60%
70%
80%
90%
100%
1995 1996 1997 1998 1999 2000 2001 2002 2003 2004 2005 2006 2007 2008
driver front seat passenger child rear seat passenger adult rear seat passenger
Figure 3.1: Trends in wearing rate, DfT survey
Table 3.4 shows the overall proportion of drivers and passengers (including children)
using restraints for the three London surveys together with the national average (DfT
2007). In London in 2008, 89% of car drivers were observed wearing a seat belt,
5 Seat belt wearing rate for children includes appropriate use of child seats, booster seats and cushions.

Published Project Report
TRL 8 PPR 364
compared with 87% in 2007. This increase brings the wearing rate in London closer to
the national average of 92%. The proportion of front seat car passengers who were
restrained also increased from 84% to 86% between 2007 and 2008 while the
proportion of restrained rear seat car passengers fell to 63% and remains lower than the
national average of 82%. The proportion of taxi drivers wearing seat belts has fluctuated
between 12% and 14% over the last three surveys and 21% of passengers in taxis were
observed wearing a seat belt in 2008. Drivers of hackney carriages are not legally
required to wear a seat belt whilst on duty and private taxi drivers do not have to wear a
seat belt when they are carrying a fare paying passenger, but taxi drivers face the same
risks as car drivers when involved in a collision. Seat belt wearing rates for van drivers
increased from 51% in the 2006 survey to 61% in 2008, whilst the wearing rate of
passengers in vans remains at just under 50%. The rates for van drivers and passengers
are still lower than the wearing rates for car occupants.
Table 3.4: Overall proportion of vehicle occupants using restraints
Survey
Drivers
Passengers
Number of
vehicles Front seat
Rear seat
All1
Cars
London, 2006 82% 80% 49% 27,638
London, 2007 87% 84% 65% 30,126
London, 2008 89% 86% 63% 29,052
DfT, Oct 2007 92% 92% 82% 15,644
Taxis
London, 2006 14% 17% 1,497
London, 2007 12% 19% 2,027
London, 2008 14% 21% 1,798
Vans
London, 2006 51% 40% 4,709
London, 2007 56% 49% 6,006
London, 2008 61% 48% 5,314
DfT, Oct 2007 69% 55% 2,419
1Very few rear seat passengers were observed in vans and front seat passengers in taxis, so they have been combined with front seat
passengers.
Overall seat belt wearing rates increased more markedly between 2006 and 2007 than
between 2007 and 2008. This may be due to publicity campaigns run both on national
TV and radio as well as by the Metropolitan Police in March 2007. The increased
penalties for mobile phone use and the new child seat belt regulation, along with
accompanying publicity and increased enforcement is also likely to have contributed to
the increase between 2006 and 2007. The higher wearing rates have been sustained and
slightly improved on for drivers of cars and vans in 2008 but have fallen slightly for rear
seat passengers.
Table 3.5 shows the wearing rates for car occupants on the three road types (TLRN,
BPRN and Minor roads). The wearing rate for front seat car occupants on TLRN roads
was highest while broadly similar rates were observed for BPRN and minor roads in
2008. Rear seat passenger wearing rates were highest on Minor roads at 66% and
lowest for BPRN roads at 60%.

Published Project Report
TRL 9 PPR 364
Table 3.5: Proportion of car occupants using restraints, by road type
Road type
Year
Proportion using
restraints
Sample size
Drivers
Passengers
Drivers
Passengers
Front seat
Rear seat
Front seat
Rear seat
TLRN
2006 82% 82% 50% 10,894 3,447 1,749
2007 90% 88% 65% 11,971 3,605 1,794
2008 90% 89% 64% 11,959 3,826 1,999
BPRN
2006 83% 77% 39% 7,726 2,264 1,111
2007 86% 81% 52% 9,181 2,561 1,399
2008 88% 85% 60% 9,082 2,665 1,249
Minor
2006 82% 79% 55% 9,018 2,823 1,483
2007 85% 83% 69% 8,974 2,727 1,541
2008 88% 82% 66% 8,011 2,348 1,126
At ten survey sites, observations were made at the weekend as well as on a weekday.
Table 3.6 compares the weekday and weekend wearing rates at the sites where
observations were made at the weekend. The results for 2008 showed a relatively
consistent picture between weekend and weekdays for drivers and front seat
passengers. Wearing rates for rear seat passengers were observed to be higher at the
weekend in 2008, while the opposite was found in 2006. These results may again be
affected by small numbers.
Table 3.6: Proportion of car occupants using restraints, by time of week
Weekday Weekend
2006 2007 2008 2006 2007 2008
Driver 85% 87% 89% 85% 87% 91%
Front seat passenger 82% 82% 84% 81% 84% 89%
Rear seat passenger 55% 60% 58% 49% 67% 67%
Number of cars 6,387 7,000 8,381 6,929 6,558 7,513
The variation of wearing rate by sex and age is shown in Table 3.7 and Table 3.8. The
age and sex of a baby and young child is particularly difficult to estimate and a
consequence of this difficulty is that the sample size for the younger age groups is
reduced and the results are subject to more variation. In the majority of cases wearing
rates for males were lower than for females in all surveys. For drivers and front seat
passengers there is a general increase in wearing rate as age increases and for rear
seated passengers children (under 14) have the highest wearing rates. The driver is
responsible for children wearing a restraint up to the age of 14 and this could explain the
lower restraint wearing rates of the other age groups.
In 2008, driver wearing rates increased for all ages and both sexes compared to 2007.
This increase was also true for adult rear seat passengers, particularly for male rear

Published Project Report
TRL 10 PPR 364
seated passengers (increasing from 25% to 40%). However, the seat belt wearing rate
for children sitting in the back of the car fell in 2008, in particular the rate for children
aged under five years old fell to the level seen in 2006 (these proportions are subject to
more variation as they are based on smaller numbers of observations). The use of
restraints by children in London increased between 2006 and 2007 possibly as a result of
the publicity surrounding the new regulation concerning the use of child car seats
introduced in September 2006. The effects however, were not sustained in 2008 for
young children in the age group 0-4 shown in detail in Table 3.9.
Table 3.7: Proportion of male car occupants using restraints, by age and seating
position
Age
Seat belt wearing rates Sample Size1
2006 2007 2008 DfT 2007
2006 2007 2008 DfT 2007
Dri
ver
17-29 80% 80% 86% 89% 2,991 2,520 3,440 1,686
30-59 78% 85% 86% 88% 13,097 14,218 13,573 5,470
60+ 83% 89% 89% 93% 2,365 2,576 1,627 1,851
All 79% 85% 87% 89% 18,470 19,368 18,736 9,007
Fro
nt
seat
passenger
0-13 72% 85% 81% 95% 448 417 99 254
14-29 68% 72% 80% 82% 1,047 994 1,123 432
30-59 74% 81% 80% 89% 1,705 1,982 1,790 565
60+ 84% 91% 89% 94% 299 328 317 251
All 73% 80% 81% 89% 3,497 3,732 3,473 1,502
Rear
seat
passenger
0-4 74% 91% 71% 98% 232 312 202 384
5-13 54% 71% 68% 92% 530 613 327 367
14-29 36% 37% 42% 58% 342 340 378 241
30-59 31% 25% 40% 49% 447 377 272 217
60+ 40% 51% 53% 67% 83 76 58 106
All 46% 60% 52% 82% 1,640 1,747 1,259 1,315
1Sample sizes for all age groups may not equal the sum of the age groups due to occupants with unknown age

Published Project Report
TRL 11 PPR 364
Table 3.8: Proportion of female car occupants using restraints, by age and
seating position
Age
Seat belt wearing rates Sample Size1
2006 2007 2008 DfT 2007
2006 2007 2008 DfT 2007
Dri
ver
17-29 87% 89% 92% 96% 2,265 2,210 2,885 1,994
30-59 88% 90% 93% 96% 6,210 7,530 6,848 3,821
60+ 91% 94% 95% 96% 664 958 530 821
All 88% 90% 93% 96% 9,158 10,725 10,296 6,636
Fro
nt
seat
passenger
0-13 75% 81% 88% 97% 370 304 181 214
14-29 79% 79% 86% 92% 1,353 1,236 1,488 713
30-59 87% 88% 90% 93% 2,549 2,575 2,515 1,065
60+ 93% 93% 94% 96% 675 871 687 729
All 86% 86% 89% 89% 4,947 5,005 4,898 2,721
Rear
seat
passenger
0-4 79% 92% 65% 97% 235 304 219 384
5-13 54% 75% 73% 90% 537 629 365 367
14-29 35% 47% 50% 64% 591 478 462 241
30-59 36% 43% 44% 59% 712 553 447 217
60+ 56% 55% 66% 69% 154 140 172 106
All 42% 63% 56% 81% 2,237 2,156 1,701 1,315
1Sample sizes for all age groups may not equal the sum of the age groups due to occupants with
unknown age
Figure 3.2 presents the proportion of restrained car occupants by age group for the
London 2008 survey. It is easier to see from these plots that females had higher wearing
rates across almost all sub-groups and that wearing rates for rear seat passengers were
particularly low for passengers aged 14 to 60 years. The biggest gap between male and
female rates occurred among rear seat passengers aged 60+.

Published Project Report
TRL 12 PPR 364
Drivers
0%
20%
40%
60%
80%
100%
17-29 30-59 60+ All
Front seat passengers
0%
20%
40%
60%
80%
100%
0-13 14-29 30-59 60+ All
Rear seat passengers
0%
20%
40%
60%
80%
100%
0-13 14-29 30-59 60+ All
Male Female
Figure 3.2: Proportion of restrained car occupants, by age in years, sex and
seating position, 2008
Table 3.9 examines the use of restraints by children in greater detail, with all of the
categories of restraint used in the survey. Children carried on the lap of another
passenger are at as much risk in a collision as an unrestrained child and so are
considered to be unrestrained.
In 2008, in the front seat, 21% of 0-4 year olds were unrestrained compared to 3% in
2007 and 5% nationally (Built-Up roads, DfT 2007). In contrast the other age groups 5-9
and 10-13 have seen improvement in the front seat wearing rate although this
proportion is still well below the national rates (Built-Up roads, DfT 2007). A similar
pattern is found for rear seat passengers, albeit with higher unrestrained rates.

Published Project Report
TRL 13 PPR 364
Table 3.9: Use of child restraints in cars
Age
2006 2007 2008 DfT 2007
0-4 5-9 0-4 5-9 10-13
0-4 5-9 10-13
0-4 5-9 10-13
Fro
nt
seat
passengers
Seat belt 17% 57% 1% 61% 85% 10% 61% 86% 8% 71% 95%
Booster
seat/cushion with seat belt
9% 8% 50% 16% 0% 22% 22% 1% 16% 26% 0%
Child seat 20% 8% 19% 4% 0% 35% 4% 1% 33% 0% 0%
Rear facing child seat
12% 0% 26% 0% 0% 11% 0% 0% 39% 0% 0%
No restraint 4% 26% 1% 17% 14% 3% 10% 12% 2% 3% 5%
Booster
seat/cushion without seat belt
32% 1% 0% 1% 0% 8% 3% 1% 0% 0% 0%
Carried on lap 6% 1% 2% 1% 0% 10% 0% 0% 3% 0% 0%
Number observed 168 490 142 371 323 115 314 362 92 205 172
Rear
seat
passengers
Seat belt 32% 34% 3% 43% 65% 5% 36% 62% 4% 60% 61%
Booster seat/cushion with seat belt
13% 12% 42% 23% 3% 10% 22% 2% 8% 24% 0%
Child seat 25% 7% 39% 6% 0% 51% 16% 8% 73% 8% 0%
Rear facing child seat
6% 1% 7% 0% 0% 9% 0% 0% 13% 0% 0%
No restraint 13% 42% 4% 24% 31% 5% 19% 27% 1% 7% 39%
Booster seat/cushion without seat belt
4% 0% 0% 2% 0% 16% 7% 1% 0% 0% 0%
Carried on lap 7% 2% 4% 1% 0% 4% 0% 0% 1% 1% 0%
Number observed 902 867 1,119 1,011 349 860 831 503 822 492 237
Although, in the front seat the majority of 0-4 year olds were restrained using a child
seat or booster seat/cushion (68%), a fairly high proportion were restrained
inappropriately using an adult seat belt (10%). This proportion of inappropriately
restrained 0-4 year olds is an increase from the 1% observed in 2007, although is a
similar proportion to that observed nationally (8% Built-Up roads, DfT 2007). The older
age group of 5-9 year olds were mainly restrained by adult seat belts in the front seat
(61%) with 26% using a child seat or booster seat/cushion. In contrast, in the rear seat
the proportion of 5-9 year olds wearing an adult seat belt is around half of the front seat
rate while the proportion using child seats or booster seat/cushions is doubled (36% and
38% respectively). A possible explanation may be that children travelling in the front
seat are skewed towards the older end of the age group while the ones in the rear seat
tend to be younger. This explanation may be a consequence of the advice that child car
seats should only be used in the front seat in a car fitted with an active airbag if there is
no other choice and that the seat is as far back from the dashboard as possible. Thus

Published Project Report
TRL 14 PPR 364
children who are smaller/younger that need to use a booster seat may be more likely to
sit in the rear of the car than the front.
With only one site per Borough, the rate at that site will not be representative of the
Borough as a whole. Therefore, the London Boroughs have been grouped into five
geographical areas and seven Police Garage areas and thus increasing the number of
observations in each group (with the exception of the City of London). This grouping
reduces the possible random variability in the wearing rates. The details of the Borough
groupings are presented in Appendix B and for completeness, the individual wearing
rates by Borough are also given.
Table 3.10 and Table 3.11 present the wearing rates for car occupants on weekdays for
2008, for the five geographical areas and seven Police Garage areas respectively. The
results are compared to the overall London results and statistically significant differences
are highlighted. It can be seen from Table 3.10 and Figure 3.3 that wearing rates were
lowest in Central London for drivers and front seat passengers, and highest in South East
London. The same pattern was observed in 2007. Table 3.11 and Figure 3.4 show that
wearing rates were lowest in Central garage for drivers, and highest in South East
garage.
Table 3.10: Car occupant wearing rates, weekdays, by area, 2008
Area Driver Front seat passenger
Rear seat passenger
South West 89%* 85% 49%*
South East 93%* 90%* 74%*
North West 88% 83% 60%
North East 88% 86% 61%
Central 78%* 71%* 54%*
London 88% 84% 61%
* Proportion significantly different from London result
Table 3.11: Car occupant wearing rates, weekdays, by Police Garage, 2008
Police Garage Driver Front seat
passenger
Rear seat
passenger
Central garage 80%* 79% 52%*
NE garage 85%* 79%* 60%
NW garage 90%* 88%* 63%
SW Hampton garage 85%* 76%* 54%*
SW Merton garage 90%* 85% 44%*
SE garage 92%* 90%* 78%*
City of London 85% .. ..
London 88% 84% 61%
* Proportion significantly different from London result .. Rate not reported as number of observations less than 15

Published Project Report
TRL 15 PPR 364
Figure 3.3: Proportion of car drivers using seat belts, weekdays, by area, 2008
Figure 3.4: Proportion of car drivers using seat belts, weekdays, by Police
garage, 2008

Published Project Report
TRL 16 PPR 364
3.2 Use of mobile phones
Regulations prohibiting the use of hand-held mobile phones by drivers took effect in
December 2003 and the penalties for using a hand-held mobile phone were increased in
February 2007. The effects of these changes were seen in the results of the DfT survey
and are shown in Figure 3.5. This figure shows the dip in use after the regulations took
effect in 2003 and the subsequent return almost to the pre-regulation level after 2003.
In the DfT survey, mobile phone use was shown to be higher in vans than in cars, and
hand-held phones were more commonly used than hands-free phones. Usage of mobile
phones varies more around the country than usage of restraints, so the DfT results may
not be nationally representative, but should still show the trend in use across years.
Cars Vans
0%
1%
2%
3%
4%
5%
2000 2001 2003 2005 2007
hand-held hands-free either
Vans
0%
1%
2%
3%
4%
5%
2000 2001 2003 2005 2007
Figure 3.5: Trends in mobile phone use, DfT survey
The penalties for using a hand-held mobile phone were increased in February 2007, so a
comparison of results from the 2006, 2007 and 2008 surveys may demonstrate the
effects in London. Table 3.12 shows the proportion of drivers observed using mobile
phones in the three London surveys. The proportion of car drivers using a hand-held
mobile phone dipped substantially in 2007 (1.4%) after the change in the penalties but
has risen in 2008 (1.9%) although not to the levels of 2006 (2.6%). Over the same
three year period the use of hands-free mobile phones in London has risen being three
times higher for car drivers in 2008 compared to 2006 (3.1% compared with 1.2%) and
five and nine times higher for van and taxi drivers respectively(van drivers 4.9%
compared with 1%; taxi drivers 7.5% compared with 0.8%).
The overall use of a mobile phone by drivers in London (shown in Table 3.12) increased
in 2008 for car, van and taxi drivers, in particular hands-free phones. The biggest
increase in mobile phone use was among taxi drivers, in particular hands-free mobiles;
overall use increased from 3.8% in 2007 to 8.1% in 2008. The London mobile phone
usage rate of car drivers was more than double the national rate in 2008, 5.0%
compared with 2.1% in the latest DfT survey. In line with DfT results, the use of hand-
held mobile phones was higher amongst van drivers than car drivers.

Published Project Report
TRL 17 PPR 364
Table 3.12: Overall proportion of drivers using mobile phones in London
Year
Vehicle
Mobile phones Number of
vehicles Hand-held
Hands-free
All
2006
Car 2.6% 1.2% 3.8% 27,640
Taxi 1.1% 0.8% 1.9% 1,497
Van 3.8% 1.0% 4.8% 4,709
2007
Car 1.4% 2.3% 3.7% 30,126
Taxi 0.7% 3.1% 3.8% 2,027
Van 1.8% 4.9% 6.7% 6,006
2008
Car 1.9%* 3.1%* 5.0%* 29,052
Taxi 0.6% 7.5%* 8.1%* 1,798
Van 2.7%* 4.9% 7.7%* 5,312
DfT
2007 Car 1.5% 0.6% 2.1% 13,362
Van 2.4% 0.5% 2.9% 2,299
* 2008 result differs significantly from 2007 result
Figure 3.6 compares the use of hand-held mobile phones by car and taxi drivers in the
three London surveys by age and sex. The results show a consistent pattern of phone
use being lower among females than males and falling with increasing age. Figure 3.7
makes the corresponding comparison for hands-free phone use. For all groups except
males aged 17-29, the use of hands-free mobile phones has tended to increase over the
three years.
0.0%
0.5%
1.0%
1.5%
2.0%
2.5%
3.0%
3.5%
4.0%
17-29 30-59 60+ 17-29 30-59 60+
male female
2006 2007 2008
Figure 3.6: Hand-held mobile phone use by car and taxi drivers in London, by
age and sex

Published Project Report
TRL 18 PPR 364
0.0%
0.5%
1.0%
1.5%
2.0%
2.5%
3.0%
3.5%
4.0%
4.5%
5.0%
17-29 30-59 60+ 17-29 30-59 60+
male female
2006 2007 2008
Figure 3.7: Hands-free mobile phone use by car and taxi drivers in London, by
age and sex
The level of mobile phone use across London is shown in Table 3.13, and the hand-held
results are shown in Figure 3.8. The proportion of car drivers using a hand-held mobile
phone was highest in the South and North West, and lowest in the North East. The
results are compared to the overall London results and areas in which the observed
phone use is significantly different from the overall results are highlighted. All results
(apart from three) were significantly higher or lower than the overall results which imply
that there is a large amount of variation in use of mobile phones across London. The
biggest differences between 2007 and 2008 were the hands-free usage in the North
West and Central London, which increased by 3.2% and 2.5% respectively. These
increases may reflect the rise in the hands-free mobile phone usage by taxi drivers; 70%
and 8% of all taxis observed were in Central London and the North East respectively.
Table 3.13: Proportion of car and taxi drivers using mobile phones, weekdays,
by area, 2008
Area
Mobile phone type
Hand-held
Hands-free
All
South West 2.5%* 2.9%* 5.4%
South East 1.7% 1.9%* 3.6%*
North West 2.4%* 6.5%* 8.9%*
North East 1.4%* 2.3%* 3.7%*
Central 1.9% 5.7%* 7.5%*
London 2.0% 4.0% 6.0%
* Significantly different from London average

Published Project Report
TRL 19 PPR 364
Figure 3.8: Proportion of car and taxi drivers using hand-held mobile phones,
weekdays, by area, 2008
Table 3.14: Proportion of car and taxi drivers using mobile phones, weekdays,
by Police garage, 2008
Police Garage
Mobile phone type
Hand-held
Hands-free
All
Central garage 1.6% 5.6%* 7.2%*
NE garage 1.6% 2.5%* 4.1%*
NW garage 2.5%* 5.7%* 8.2%*
SW Hampton garage 2.0% 7.2%* 9.2%*
SW Merton garage 2.7%* 2.5%* 5.2%*
SE garage 1.7% 2.1%* 3.7%*
City of London1 1.2% 20.2%* 21.3%*
London 2.0% 4.0% 6.0%
* Significantly different from London average 1The results for the City of London are based on small numbers and are
therefore subject to more variation than the other areas. The high use of hands-free mobile phones may be as a result of taxis accounting for 84% of the car and taxi group with a high proportion of taxi drivers using hands-free mobile phones.

Published Project Report
TRL 20 PPR 364
Figure 3.9: Proportion of car and taxi drivers using hand-held mobile phones,
weekdays, by Police garage, 2008
Previous London surveys showed that drivers‟ use of mobile phones was correlated with
their use of seat belts. Table 3.15 shows the proportion of drivers using mobile phones
by seat belt use. Results where the proportion of seat belt wearers using mobile phone
differs significantly from that of non-wearers are highlighted. Table 3.15 shows that, as
in previous years, belted drivers in 2008 were less likely than unbelted drivers to use
hand-held mobile phones. The difference continues to be more marked for car drivers
than van drivers.
Table 3.15: Proportion of drivers using mobile phones, by restraint status
Mobile phone type
Cars and taxis Vans
2006 2007 2008 2006 2007 2008
Drivers
wearing seat belts
Hand-held 2.2%* 1.1%* 1.6%* 2.3%* 1.4%* 2.1%*
Hands-free 1.1% 2.2%* 3.0%* 1.2%* 5.5%* 4.9%*
All 3.3%* 3.2%* 4.6%* 3.5%* 6.9%* 7.0%*
Drivers not wearing seat
belts
Hand-held 3.6% 2.8% 2.7% 5.3% 2.4% 3.6%
Hands-free 1.2% 3.3% 5.4% 0.9% 4.1% 5.1%
All 4.8% 6.1% 8.0% 6.2% 6.5% 8.7%
* Differs significantly from drivers not wearing seat belt

Published Project Report
TRL 21 PPR 364
4 Law Enforcement
The Police issue Fixed Penalty Notices (FPNs) for many seat belt and mobile phone
driving offences. The numbers of FPNs issued in each Borough and the City of London in
2007 were provided by the Metropolitan Police and the City of London Police and have
been used to compare the rates of FPNs distributed across London. Results for each
Borough (displayed in Appendix B) have been combined into the London areas, and rates
of FPNs per million vehicle kilometres are given in Table 4.1. Rates of seat belt FPNs
issued vary from 0.28 per million vehicle km in North West London to 0.78 per million
vehicle km in Central London, with an average in London of 0.43 per million vehicle km.
The police issued more mobile phone FPNs than seatbelt FPNs, even though fewer
drivers used hand-held mobile phones than failed to wear seat belts. Overall 0.89 FPNs
per million vehicle km were issued in 2007, rates ranged from 0.58 per million vehicle
km in South East London to 1.92 per million vehicle km in Central London. There is some
correlation between the FPN issued and the level of illegal activity observed in the
survey. Central and North East London had the lowest seatbelt wearing rates (Table
3.10) and the highest rate of FPNs while Central, South West and North West London
had the highest hand-held mobile phone usage rates (Table 3.13) and also the highest rates of FPNs issued.
Table 4.1: Number and rate of Fixed Penalty Notices in London, 2007
Area Seat belt Mobile Phone Traffic volume (million vkm)
Number Rate1 Number Rate1
South West 1,578 0.30 5,121 0.97 5,305
South East 2,069 0.31 3,850 0.58 6,604
North West 2,629 0.28 7,198 0.77 9,344
North East 4,687 0.64 5,264 0.72 7,359
Central 3,443 0.78 8,502 1.92 4,430
London 14,237 0.43 29,421 0.89 33,041
1Rate is calculated as number of FPN divided by traffic volume

Published Project Report
TRL 22 PPR 364
Newham
Redbridge
Richmond
upon
Thames
Southwark
Sutton
0.00 0.50 1.00 1.50 2.00 2.50
London
Central
South West
North West
North East
South East
Mobile Phone Seatbelt
Figure 4.1: Rate of Fixed Penalty Notices per million vehicle-km in London,
2007
5 Casualty saving
A considerable amount of published research confirms the safety benefit of seat belts
and correctly worn restraints, in particular the protection they provide to the occupants
of a vehicle involved in a collision. Although the overall wearing rate in London has
increased, it remains lower than the rate found by the DfT survey. Section 5.1 estimates
the number of casualties that could be saved by raising the London rates further.
The use of mobile phones whilst driving increases the risk of being involved in a collision,
and observations from the London 2008 survey show that mobile phone use is
considerably higher in London than found by the DfT survey. Section 5.2 estimates the
number of casualties that could be saved by reducing the number of drivers who use
mobile phones.
5.1 Casualty saving of increased seat belt use
The number of car occupant casualties in London in 2007 and factors for the
effectiveness of seat belts can be used to estimate the number of car occupant casualties
that could be saved if the seat belt wearing rate in London was increased to the level
found by the DfT survey. Estimates of the effectiveness of seat belts in fatal, serious and
slight collisions have been recently reported for injured car drivers (Broughton & Walter,
2007). These show, for example, that the risk of being killed should a collision occur is
reduced, on average, by 72% if a seat belt is worn.
The casualty saving estimates are subject to random variation and rely on two
underlying assumptions:
1. The underlying collision-involvement rates of belted and unbelted drivers do not
differ. It seems likely, in fact, that unbelted drivers tend to have a more risky
driving style, and Table 3.7 shows that wearing rates were lowest among young

Published Project Report
TRL 23 PPR 364
drivers who are more likely to be involved in collisions than older drivers.
Consequently, the estimated casualty reductions are conservative.
2. The effectiveness estimates prepared for car drivers also apply to car passengers.
Using the information provided above and applying the overall car occupant seat belt
wearing rates of 86% (TfL 2008) and 91% (DfT 2007), the conservative estimates of the
number of car occupant casualties that could be saved by increasing the London seat
belt wearing rate to DfT reported levels and eliminating non compliance (100% seat belt
wearing rate) are reported in Table 5.1 and Table 5.2.
Casualty savings are indicative and do not take into account the proportion of casualties
in 2007 who were wearing a seat belt (which is not known). The value of these savings
were estimated using official figures for the average value of preventing a casualty (DfT,
2007c).
Table 5.1: Estimated car occupant casualty saving in London per year if
restraint use increased to level found by DfT survey
Casualty Casualties in 2007
Casualty saving
Value*
Fatal 52 5 £7.5m
Serious 900 54 £8.6m
Slight 12,224 158 £2.0m
Total 13,176 217 £18.0m
*defined using average value of preventing a casualty at June 2005 prices (DfT, 2007c)
Table 5.1 shows that 217 casualties could have been saved in a year if the proportion of
car occupants wearing seat belts in London had matched the national rate. The value of
preventing these casualties is estimated to be £18m at June 2005 prices.
Table 5.2: Estimated car occupant casualty saving in London per year if
restraint use increased to 100%
Casualty Casualties in 2007
Casualty saving
Value*
Fatal 52 14 £20.2m
Serious 900 145 £23.3m
Slight 12,224 428 £5.3m
Total 13,176 587 £48.7m
*defined using average value of preventing a casualty at June 2005 prices (DfT, 2007c)
Table 5.2 shows that if all car occupants in London had worn seatbelts in 2007 then
there would have been 587 fewer casualties, and the estimated value of preventing
these casualties is £48.7m (June 2005 prices).
The 2010 London road safety target for KSI casualties is a reduction of 50% compared
to the 1994-1998 average (6,684). There were 3,783 KSI casualties in London in 2007.
If all car occupants had been wearing seat belts then the estimates in Table 5.2 suggest
that this total would have been 159 less, representing a 46% reduction in KSI casualties
in London from the baseline.

Published Project Report
TRL 24 PPR 364
5.2 Casualty saving of reduced mobile phone use
Using a hands-free or hand-held mobile phone whilst driving has been shown to be
detrimental to driving (RoSPA, 2002) and this increases the risk of a collision occurring.
Several estimates of the increase in risk have been proposed by researchers. Redelmeier
& Tibshirani (1997) report a four fold increase in risk of collision involvement if a driver
is using a mobile phone, and this value will be used in addition to the rates of drivers‟
mobile phone use shown in Table 3.12 to estimate the number of casualties that may
have been saved had those drivers not been using their mobile phone.
A similar approach to that used in Section 5.1 is applied here, with the following
assumptions:
The overall levels of mobile phone use reported in Section 3.2 for drivers in
London also apply to drivers of other types of vehicle (HGVs etc.), and that the
same is true of the results of the DfT survey;
The proportion of drivers who are involved in collisions is the same for drivers who
do and those who do not use their mobile phones whilst driving. It seems likely in
fact that the rate for phone users would tend to be higher than for non-users, for
the reasons discussed in the case of unbelted drivers, so the estimated casualty
reductions are conservative;
The increased risk of being involved in a collision is the same for all injury
severities;
Results for cars and vans can be combined using the national traffic proportions of
86:14 (DfT, 2007b).
Table 5.3: Estimated casualty saving in London per year if mobile phone use
decreased to level found by DfT survey
Casualty Casualties in 2007
Casualty saving
Value*
Fatal 222 20 £28.6m
Serious 3,561 322 £51.6m
Slight 24,577 2,220 £27.5m
Total 28,360 2,562 £107.7m
*defined using average value of preventing a casualty at June 2005 prices (DfT, 2007c)
It was estimated that reducing the proportion of mobile phone users from the London
level of 5.7% (combined result for car, taxi and van drivers) to the level reported in the
latest DfT survey of 2.2% (combined result) would produce the casualty reductions
detailed in Table 5.3.
Table 5.4: Estimated casualty saving in London per year if mobile phone use
eliminated
Casualty Casualties in 2007
Casualty saving
Value*
Fatal 222 33 £46.6m
Serious 3,561 523 £84.0m
Slight 24,577 3,610 £44.7m
Total 28,360 4,166 £175.2m
*defined using average value of preventing a casualty at June 2005 prices (DfT, 2007c)

Published Project Report
TRL 25 PPR 364
Table 5.4 estimates the reductions of reducing the level to 0%, so in essence estimates
the number of casualties that may be attributed to drivers‟ use of mobile phones.
Since 2005, the information collected about road collisions by the police as part of the
national STATS19 reporting system includes the contributory factors to the collision
(Department for Transport, 2006). These factors represent the factors which contributed
to the collision in the opinion of the police reporting officer, and one factor is „Driver
using Mobile Phone‟. 52 collisions were recorded with this contributory factor in London
in 2007, resulting in 6 seriously and 64 slightly injured casualties. Clearly these numbers
are considerably lower than the estimates in Table 5.4. It is proposed that this is due to
three issues:
Contributory Factors can be used in evidence if a driver is prosecuted. In this
case, the reporting officer may need to provide evidence that the driver was using
a mobile phone. As this is at best difficult to prove, this is likely to reduce
considerably the reporting of the contributory factor „Driver using Mobile Phone‟;
in addition,
By the time that a police officer arrives at the scene of a collision, any evidence
and indeed suggestion of the use of a mobile phone has usually been removed,
i.e. the driver has finished his conversation.
The assumptions stated above, although based on research, may not be directly
applicable to London in 2008.
There were 6,684 KSI casualties in London in 2007. If mobile phone use had been
eliminated then the estimates in Table 5.4 suggest that this total could have been
reduced by 556, representing a 52% reduction in KSI casualties in London from the
1994-98 baseline.
6 Summary
The London seat belt and mobile phone survey was carried out in March 2008 at 33 sites
in London, replicating the methods and analysis of the 2006 and 2007 survey. Results
from this survey have been compared with the previous two London surveys and results
on Built-Up roads from the DfT survey carried out in October 2007.
The 33 sites were chosen to cover all types of road with one site per London Borough
and one in the City of London. The sites are not designed to be representative of
individual Boroughs, but to give a balanced view of seatbelt wearing rates and drivers‟
mobile phone use in London as a whole. The survey was conducted during daylight hours
in order to observe vehicle occupants accurately. Research suggests that restraint
wearing rates are lower at night than during the day, so wearing rates for the full day
are likely to be slightly lower than the rates calculated from the survey data (Broughton
and Walter (2007)). As with all sample surveys there are limitations with the sample size
when drilling down into the detail of the main results. For example, the sample size per
group decreases substantially when examining seatbelt wearing rates by age group and
sex and as a result the estimates are subject to increased variation.
Overall, the 2008 survey found that the driver and front seat passenger wearing rates
have risen, albeit not by as much as in 2007 and that the rear seat passenger rates fell
slightly. In 2008, 89% of car drivers in London were wearing a seat belt, an increase
from 87% in 2007 which brought the wearing rate in London closer to the rate of 92%
found by the DfT survey on Built-Up roads. The proportion of front seat car passengers
who were restrained also increased from 84% to 86% between 2007 and 2008 while the
proportion of restrained rear seat car passengers fell slightly to 63% - less than the DfT
rate of 82%. As in previous years, the wearing rate for car drivers varied considerably
across London in 2008, from 78% in Central London to 93% in South East London.

Published Project Report
TRL 26 PPR 364
Increases in seat belt wearing since 2007 were also seen for van drivers whilst seat belt
wearing rates for van passengers and taxi occupants were largely unchanged. The rates
for van and taxi occupants are still considerably lower than the wearing rates for car
occupants.
The use of restraints by children in London increased between 2006 and 2007 possibly
as a result of the publicity surrounding the new regulation concerning the use of child car
seats introduced in September 2006. The effects however, were not sustained for young
children aged 0-4 (although still higher than in 2006) but were slightly improved upon
for 5-9 and 10-13 year olds in 2008.
The survey collected information on the use of hand-held and hands-free mobile phones.
Observations of drivers using hands-free phones are only recorded if the observer is sure
that a hands-free device is being used. Due to the difficulty in observing hands-free phone usage, these results are likely to be underestimates.
The proportion of car drivers using a hand-held mobile phone fell from 2.6% in 2006 to
1.4% in 2007 after the penalties were increased, but rose in 2008 to 1.9%. The overall
use of mobile phones increased in 2008 for car, van and taxi drivers, in particular use of
hands-free phones. Taxi drivers saw the biggest increase, from 3.8% overall in 2007 to
8.1% in 2008. The London mobile phone usage rates of car drivers were more than
double the national rates (5.0% compared with 2.1% in the DfT survey of October
2007). Hands-free mobile phones are now used more often than hand-held mobile
phones. This could be the result of the increased penalties for using hand-held mobile
phones, or drivers may have accepted the implied message that hands-free mobile
phones are safer to use while driving than hand-held, whereas recent evidence suggests
that there is little or no difference (Kircher et al, 2004).
As with the previous London surveys, the 2008 data show that males are less likely to
use restraints than females and that usage generally increases with increasing age. The
exception to this is rear seat passengers where children have the highest wearing rates,
closely followed by those passengers aged over 60. The results for hand-held phones
have maintained a pattern of being lower among women than men and falling with
increasing age. For all age groups, except men aged 17-29, the use of hands-free mobile
phones has increased over the last three years while the use of hand-held mobiles has
tended to decrease.
There is a correlation between drivers‟ use of hand-held mobile phones and non-use of
seat belts. As in previous years, belted drivers in 2008 were less likely than unbelted
drivers to use hand-held mobile phones. For example, 1.6% of car and taxi drivers
wearing a seat belt were using a hand-held mobile phone, compared with 2.7% of those
who did not wear a belt. The disparity was greater for van drivers, 2.1% and 3.6%
respectively.
Research has shown the safety benefit of seat belts and correctly worn restraints, and
also the increased risk of being involved in a collision whilst driving and using a mobile
phone (e.g. Broughton et al 2007, Kircher et al, 2004). It has been possible to estimate
the number of casualties that could be saved by improving the London levels to those
found in the most recent DfT survey, also to estimate the benefits of eliminating mobile
phone use by drivers and ensuring that all car occupants wear seat belts. The estimates
are approximate because certain simplifying assumptions are necessary, but help to
illustrate the human consequences of the relatively low level of restraint use and the
relatively high level of mobile phone use in London. It is estimated that if overall mobile
phone use fell to the level found by DfT survey then the KSI total would fall by 342, and
the casualty total would fall by 2,562. An increase in restraint wearing rates to the rates
found by the DfT survey is estimated to reduce the number of car occupants KSI by 59
and the car occupant casualty total by 217.

Published Project Report
TRL 27 PPR 364
Acknowledgements
The work described in this report was carried out in the Statistics and Engineering Group
of the Transport Research Laboratory. The authors are grateful to Jeremy Broughton
who carried out the technical review and auditing of this report, and to the Metropolitan
Police Service and the City of London Police who provided Fixed Penalty Notice statistics
for 2007.
References
Broughton, J (2003). Seat belt wearing rates in cars in England, 1998 – 2002. TRL
Report 580, Wokingham.
Broughton, J and Buckle, G (2006). Mobile phone and Seat Belt usage rates in
London, March 2006. TRL report PPR232, Wokingham.
Broughton, J and Walter, LK (2007). Trends in Fatal Car Accidents – Analysis of CCIS
data. TRL report PPR172, Wokingham.
Department for Transport (2006). Child Car Seat Law leaflet. Downloaded
20/06/2007. www.thinkroadsafety.gov.uk/campaigns/childcarseats/pdf/law-leaflet.pdf
Department for Transport (2006). Road Casualties Great Britain: 2005. Department
for Transport, London.
Department for Transport (2007a). Road Traffic Statistics for Local Authorities:
1995-2006. Department for Transport, London.
Department for Transport (2007b). Transport Statistics Great Britain: 2007 edition.
Department for Transport, London.
Department for Transport (2007c). Highways Economic Note 1 - 2005 Valuation of
the Benefits of Prevention of Road Accidents and Casualties. Department for Transport,
London
Redelmeier, DA and Tibshirani, RJ (1997). Association between cellular telephone
calls and motor vehicle collisions. New England Journal of Medicine, Vol. 336, No.7,
pp453-458.
Road Network Performance & Research Team (2008). RNPR Traffic Note 1 - Traffic
levels on major roads in greater London 1994 – 2006. Transport for London, London.
RoSPA (2002). The risk of using a mobile phone while driving. Royal Society for the
Prevention of Accidents. Downloaded 28/06/2007
http://www.rospa.com/roadsafety/info/mobile_phone_report.pdf
Transport for London (2008). London Travel Report 2007. Transport for London,
London.
Transport Research Laboratory (2008). Restraint use by car occupants 2006-2007.
TRL Leaflet LF2102 (revised), Wokingham.
Walter, L, Broughton, J and Buckle, G (2007). Mobile phone and Seat Belt usage
rates in London, March 2007. TRL report PPR245, Wokingham.

Published Project Report
TRL 28 PPR 364
Appendix A: Hammersmith & Fulham and Hackney data
Data quality and validation checks are carried out in the course of processing the data.
At this stage, it was noted that two sites, Hackney and Hammersmith & Fulham had no
detailed data for vans. This error was queried with the survey team who confirmed that
a new member of the team had failed to identify vans and cars separately at these two
sites. The main reason of concern is that van drivers behave differently from car drivers.
Van drivers are less likely to wear their seat belts than car drivers (56% wearing rate
compared to 87% wearing rate in 2007) and are more likely to use a mobile phone
(6.7% compared to 3.7% in 2007). However, a detailed look at the results from these
two Boroughs confirms that this error does not have a significant impact on the results.
Table A.1 presents the overall proportion of restraint use in 2008 for car drivers with and
without the two affected sites. The table shows that when the two sites are included the
results are slightly lower for drivers as well as front and rear passengers. This may be
due to the inclusion of a small number of vans in the results, although if this were the
case then only drivers and to a lesser extent front seat passengers would be affected but
the table shows that rear seat passengers are also affected. The more likely reason for
the slightly lower results when the two sites are included is that Hackney and
Hammersmith & Fulham have the sixth and fifth lowest seat belt wearing rate
respectively for car and van drivers combined (i.e. when comparing all Boroughs on the
same basis).
Table A.2 shows the overall proportion of car drivers using mobile phones with and
without the two affected sites. The table shows that the results are virtually unchanged
when the two sites are removed. From this, it may be concluded that the mobile phone
results for London are not affected by the inclusion of vans with cars for the two sites.
Table A.1: Overall proportion of car occupants using restraints with and without
the two affected sites, 2008
Occupants Includes the two
sites
Without the two
sites
Drivers 88.8% 89.6%
Front seat passengers 85.8% 87.2%
Rear seat passengers 63.1% 63.5%
Table A.2: Overall proportion of car drivers using mobile phones, with and
without the two affected sites, 2008
Mobile phone
type
Includes
the two sites
Without
the two sites
Hand-held 1.9% 1.9%
Hands-free 3.1% 2.8%
All 5.0% 4.6%
The two sites are on different road types and fall into different geographical areas with
the Hackney site being on a minor road in Central London and the Hammersmith &
Fulham site being on the Borough principal road network in NW London. In 2007,
approximately 5% of the vehicles observed were vans at the Hackney site and

Published Project Report
TRL 29 PPR 364
approximately 25% of the observed vehicles were vans at the Hammersmith & Fulham
site. This may suggest that areas including the Hammersmith & Fulham site may be
slightly more affected (i.e. the North West geographical area & SW Hampton police
garage). Table A.3 shows that the Central and NW area car occupant seat belt wearing
rates are slightly higher when the two sites are not included.
Table A.4 shows slightly more variation in the results by police garage. However the
differences can be explained by the relatively low overall seat belt wearing rate for these
two Boroughs rather than the fact that some vans are included in the results. Table A.5
shows the seat belt wearing rates for car and van drivers combined with and without the
Hammersmith and Fulham site for the North West and SW Hampton police garage. This
table is comparing like with like as vans are included in all Borough rates. Similar
differences in rates are observed with and without the Hammersmith & Fulham site as
observed in Table A.3. Thus it has been assumed in the report that the inclusion of vans
with cars for the two sites has not had an appreciable impact on the results. The same
comparisons were made for the Central and North East areas and the same conclusion
was reached.
Table A.3: Car occupant wearing rates, weekdays, by area, with and without the
two affected sites, 2008
Central North West
Includes
Hackney
Without
Hackney
Includes
Hammersmith & Fulham
Without
Hammersmith & Fulham
Drivers 78% 79% 88% 90%
Front seat passengers
71% 74% 83% 88%
Rear seat passengers
54% 54% 60% 61%
Table A.4: Car occupant wearing rates, weekdays, by police garage, with and
without the two affected sites, 2008
North East SW Hampton
Includes Hackney
Without Hackney
Includes Hammersmith
& Fulham
Without Hammersmith
& Fulham
Drivers 78% 86% 85% 93%
Front seat passengers
71% 82% 79% 90%
Rear seat
passengers
54% 61% 60% 53%

Published Project Report
TRL 30 PPR 364
Table A.5: Car and van occupant wearing rates, weekdays, with and without
Hammersmith & Fulham, 2008
North West SW Hampton
Includes Hammersmith
& Fulham
Includes Hammersmith
& Fulham
Includes Hammersmith
& Fulham
Without Hammersmith
& Fulham
Drivers 85% 87% 83% 88%
Front seat passengers
80% 83% 75% 85%
Rear seat passengers
60% 60% 54% 52%
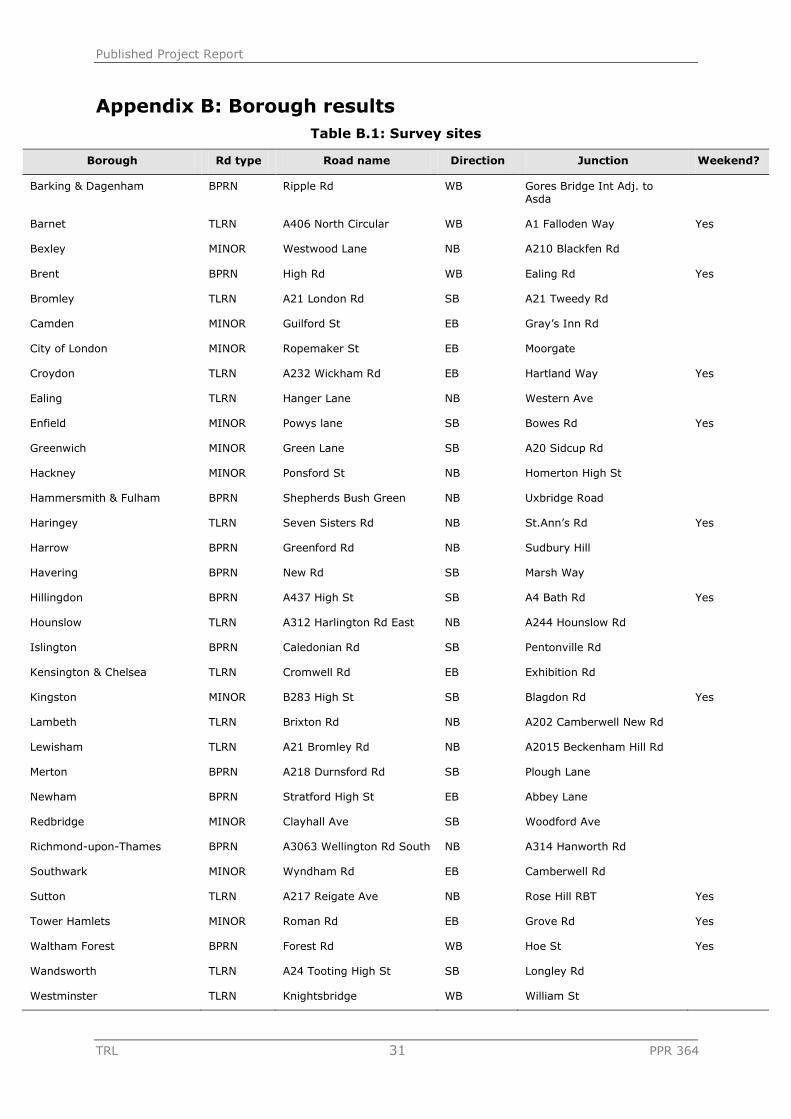
Published Project Report
TRL 31 PPR 364
Appendix B: Borough results
Table B.1: Survey sites
Borough Rd type Road name Direction Junction Weekend?
Barking & Dagenham BPRN Ripple Rd WB Gores Bridge Int Adj. to Asda
Barnet TLRN A406 North Circular WB A1 Falloden Way Yes
Bexley MINOR Westwood Lane NB A210 Blackfen Rd
Brent BPRN High Rd WB Ealing Rd Yes
Bromley TLRN A21 London Rd SB A21 Tweedy Rd
Camden MINOR Guilford St EB Gray‟s Inn Rd
City of London MINOR Ropemaker St EB Moorgate
Croydon TLRN A232 Wickham Rd EB Hartland Way Yes
Ealing TLRN Hanger Lane NB Western Ave
Enfield MINOR Powys lane SB Bowes Rd Yes
Greenwich MINOR Green Lane SB A20 Sidcup Rd
Hackney MINOR Ponsford St NB Homerton High St
Hammersmith & Fulham BPRN Shepherds Bush Green NB Uxbridge Road
Haringey TLRN Seven Sisters Rd NB St.Ann‟s Rd Yes
Harrow BPRN Greenford Rd NB Sudbury Hill
Havering BPRN New Rd SB Marsh Way
Hillingdon BPRN A437 High St SB A4 Bath Rd Yes
Hounslow TLRN A312 Harlington Rd East NB A244 Hounslow Rd
Islington BPRN Caledonian Rd SB Pentonville Rd
Kensington & Chelsea TLRN Cromwell Rd EB Exhibition Rd
Kingston MINOR B283 High St SB Blagdon Rd Yes
Lambeth TLRN Brixton Rd NB A202 Camberwell New Rd
Lewisham TLRN A21 Bromley Rd NB A2015 Beckenham Hill Rd
Merton BPRN A218 Durnsford Rd SB Plough Lane
Newham BPRN Stratford High St EB Abbey Lane
Redbridge MINOR Clayhall Ave SB Woodford Ave
Richmond-upon-Thames BPRN A3063 Wellington Rd South NB A314 Hanworth Rd
Southwark MINOR Wyndham Rd EB Camberwell Rd
Sutton TLRN A217 Reigate Ave NB Rose Hill RBT Yes
Tower Hamlets MINOR Roman Rd EB Grove Rd Yes
Waltham Forest BPRN Forest Rd WB Hoe St Yes
Wandsworth TLRN A24 Tooting High St SB Longley Rd
Westminster TLRN Knightsbridge WB William St
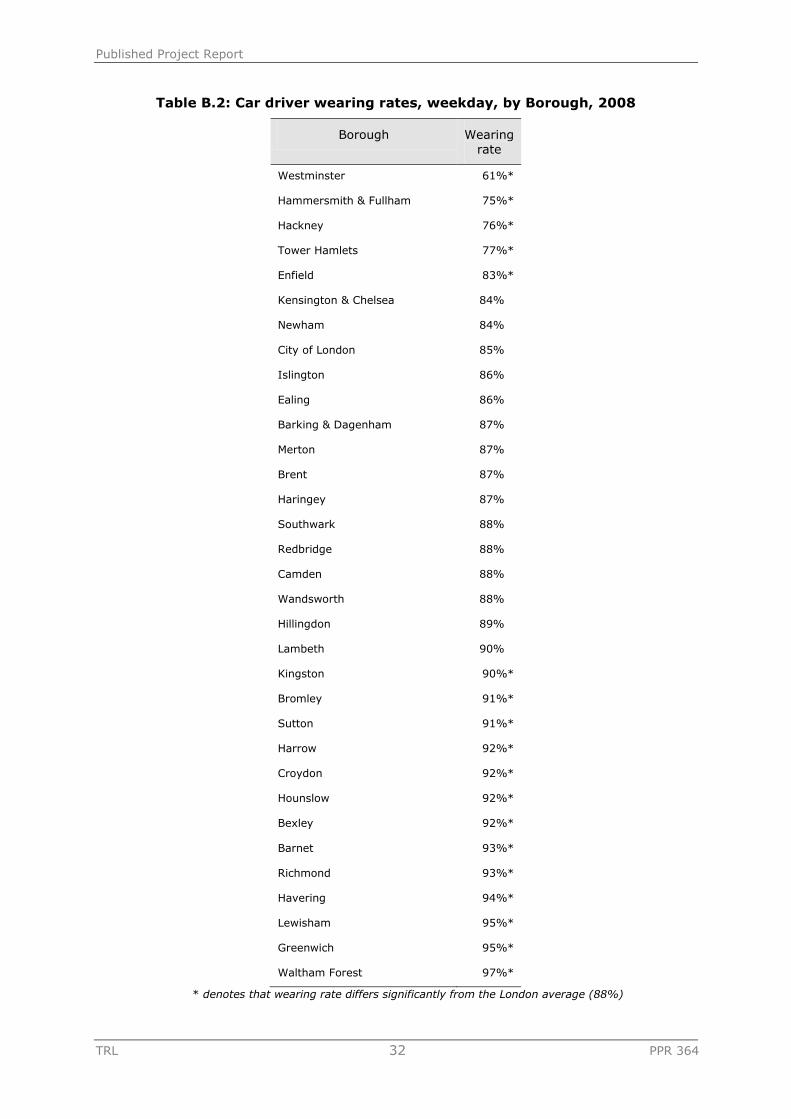
Published Project Report
TRL 32 PPR 364
Table B.2: Car driver wearing rates, weekday, by Borough, 2008
Borough Wearing
rate
Westminster 61%*
Hammersmith & Fullham 75%*
Hackney 76%*
Tower Hamlets 77%*
Enfield 83%*
Kensington & Chelsea 84%
Newham 84%
City of London 85%
Islington 86%
Ealing 86%
Barking & Dagenham 87%
Merton 87%
Brent 87%
Haringey 87%
Southwark 88%
Redbridge 88%
Camden 88%
Wandsworth 88%
Hillingdon 89%
Lambeth 90%
Kingston 90%*
Bromley 91%*
Sutton 91%*
Harrow 92%*
Croydon 92%*
Hounslow 92%*
Bexley 92%*
Barnet 93%*
Richmond 93%*
Havering 94%*
Lewisham 95%*
Greenwich 95%*
Waltham Forest 97%*
* denotes that wearing rate differs significantly from the London average (88%)

Published Project Report
TRL 33 PPR 364
Table B.3: London areas by Borough
Borough Area Police garage
Southwark South West SE
Lambeth South West SW Merton
Wandsworth South West SW Merton
Merton South West SW Merton
Kingston South West SW Merton
Richmond-upon-Thames South West SW Hampton
Sutton South East SW Merton
Greenwich South East SE
Lewisham South East SE
Bexley South East SE
Bromley South East SE
Croydon South East SE
Hammersmith & Fulham North West SW Hampton
Hounslow North West SW Hampton
Hillingdon North West NW
Brent North West NW
Ealing North West NW
Harrow North West NW
Barnet North West NW
Waltham Forest North East NE
Redbridge North East NE
Havering North East NE
Barking & Dagenham North East NE
Newham North East NE
Haringey North East NE
Enfield North East NE
Hackney Central NE
Tower Hamlets Central NE
City of London Central City
Westminster Central Central
Camden Central Central
Islington Central Central
Kensington & Chelsea Central Central

Published Project Report
TRL 34 PPR 364
Table B.4: Proportion of car and taxi drivers using mobile phones, weekdays, by
Borough, 2008
Borough Hand-held
All mobile phone use
Bromley 0.3%* 2.1%
Newham 0.4%* 3.9%
Lewisham 0.7%* 2.7%
Camden 0.7%* 5.6%
Waltham Forest 0.8%* 2.4%
Croydon 1.1%* 5.4%
Greenwich 1.2%* 2.1%
City of London 1.2% 21.3%
Kensington & Chelsea 1.2% 10.5%
Havering 1.2% 2.5%
Wandsworth 1.3% 9.9%
Redbridge 1.3% 2.3%
Harrow 1.3% 5.4%
Westminster 1.5% 5.8%
Hackney 1.6% 5.4%
Richmond 1.6% 4.6%
Haringey 1.7% 2.9%
Enfield 1.7% 5.0%
Barnet 1.8% 9.9%
Hillingdon 1.9% 8.4%
Hammersmith & Fulham 2.0% 14.5%
Southwark 2.1% 4.5%
Hounslow 2.3% 3.9%
Kingston 2.3% 3.4%
Sutton 2.3% 3.6%
Barking & Dagenham 3.2% 7.0%
Tower Hamlets 3.3% 5.5%
Merton 3.4%* 5.6%
Islington 3.5%* 5.1%
Brent 3.7%* 6.2%
Bexley 3.7%* 5.3%
Ealing 3.8%* 9.2%
Lambeth 4.2%* 6.1%
* denotes hand-held rate that differs significantly from the London average (hand-held 1.9%)

Published Project Report
TRL 35 PPR 364
Table B.4 has two Boroughs with mobile phone usage rates substantially higher than the
London average; namely City of London (21.3%) and Hammersmith & Fulham (14.5%).
The high City of London rate may be due to the high proportion of taxis observed in this
area (taxis accounted for 84% of the group cars + taxis) combined with a high
proportion of taxi drivers using hands-free mobile phones. Hammersmith & Fulham may
be higher due to the inclusion of some vans with the car group.

Published Project Report
TRL 36 PPR 364
Table B.5: Number and rate of fixed penalty notices in London, 2007
Seat belt Mobile Phone Traffic volume (million vkm) (DfT, 2007a) Number Rate Number Rate
Barking & Dagenham 322 0.50 677 1.05 647
Barnet 339 0.20 1,067 0.62 1,711
Bexley 261 0.26 475 0.47 1,019
Brent 616 0.61 1,376 1.36 1,015
Bromley 241 0.17 599 0.43 1,393
Camden 603 1.12 1,309 2.43 538
City of London 302 1.52 952 4.78 199
Croydon 304 0.22 619 0.45 1,363
Ealing 585 0.42 1,526 1.10 1,385
Enfield 566 0.35 726 0.45 1,621
Greenwich 522 0.44 794 0.67 1,189
Hackney 211 0.37 438 0.77 566
Hammersmith & Fulham 59 0.10 217 0.36 606
Haringey 321 0.50 366 0.57 641
Harrow 215 0.33 357 0.54 656
Havering 465 0.29 716 0.45 1,590
Hillingdon 278 0.12 798 0.35 2,276
Hounslow 537 0.32 1,857 1.10 1,695
Islington 387 0.82 708 1.49 474
Kensington & Chelsea 412 0.69 1,478 2.49 593
Kingston-upon-Thames 465 0.47 1,691 1.70 995
Lambeth 245 0.28 535 0.61 882
Lewisham 460 0.51 809 0.90 896
Merton 181 0.27 478 0.70 682
Newham 1,430 1.46 736 0.75 981
Redbridge 208 0.19 179 0.16 1,112
Richmond-upon-Thames 209 0.23 753 0.84 894
Southwark 208 0.24 597 0.68 872
Sutton 281 0.38 554 0.74 744
Tower Hamlets 427 0.42 693 0.69 1,010
Waltham Forest 1,375 1.79 1,864 2.43 767
Wandsworth 270 0.28 1,067 1.09 980
Westminster 1,101 1.05 2,924 2.78 1,050
London 14,237 0.43 29,421 0.89 33,041

Published Project Report
TRL 37 PPR 364
0.0 0.5 1.0 1.5 2.0 2.5 3.0 3.5 4.0 4.5 5.0
City
Westminster
Kensington & Chelsea
Camden
Waltham Forest
Kingston
Islington
Brent
Ealing
Hounslow
Wandsworth
Barking & Dagenham
Lewisham
Richmond
Hackney
Newham
Sutton
Merton
Tower Hamlets
Southwark
Greenwich
Barnet
Lambeth
Haringey
Harrow
Bexley
Croydon
Havering
Enfield
Bromley
Hammersmith & Fullham
Hillingdon
Redbridge
London
Mobile Phone Seatbelt
Figure B.1: Rate per million vehicle-km of fixed penalty notices in London, 2007