translation of the french financial documents fiscal year ... · translation of the french...
TRANSCRIPT

TRANSLATION OF THE FRENCHFINANCIAL DOCUMENTS
FISCAL YEAR ENDED DECEMBER 31, 2015
1_VA_V4 01/02/2016 10:33 PageI

BUSINESS REVIEW AND COMMENTS ON THE CONSOLIDATED FINANCIAL STATEMENTS OF LVMH GROUP 5
COMMENTS ON THE CONSOLIDATED INCOME STATEMENT 6WINES AND SPIRITS 10FASHION AND LEATHER GOODS 11PERFUMES AND COSMETICS 12WATCHES AND JEWELRY 13SELECTIVE RETAILING 15COMMENTS ON THE CONSOLIDATED BALANCE SHEET 16COMMENTS ON THE CONSOLIDATED CASH FLOW STATEMENT 18
CONDENSED CONSOLIDATED FINANCIAL STATEMENTS 19
CONSOLIDATED INCOME STATEMENT 20CONSOLIDATED STATEMENT OF COMPREHENSIVE GAINS AND LOSSES 21CONSOLIDATED BALANCE SHEET 22CONSOLIDATED STATEMENT OF CHANGES IN EQUITY 23CONSOLIDATED CASH FLOW STATEMENT 24SELECTED NOTES TO THE CONSOLIDATED FINANCIAL STATEMENTS 25
SIMPLIFIED ACCOUNTING INFORMATION OF LVMH MOËT HENNESSY-LOUIS VUITTON SE 63
INCOME STATEMENT 64CHANGE IN EQUITY 64
CONTENTS
EXECUTIVE AND SUPERVISORY BODIES; STATUTORY AUDITORS 1FINANCIAL HIGHLIGHTS 2HIGHLIGHTS AND OUTLOOK 4SHARE CAPITAL AND VOTING RIGHTS 4
This document is a free translation into English of the original French “Documents financiers - 31 décembre 2015”, hereafterreferred to as the “Financial Documents”. It is not a binding document. In the event of a conflict in interpretation, referenceshould be made to the French version, which is the authentic text.
1_VA_V4 01/02/2016 10:33 PageII

(a) Independent Director.
1Financial Documents - December 31, 2015
Board of Directors
Bernard ArnaultChairman and Chief Executive Officer
Pierre Godé Vice-Chairman
Antonio Belloni Group Managing Director
Antoine Arnault
Delphine Arnault
Nicolas Bazire
Bernadette Chirac (a)
Nicholas Clive Worms(a)
Charles de Croisset (a)
Diego Della Valle (a)
Albert Frère (a)
Marie-Josée Kravis (a)
Lord Powell of Bayswater
Marie-Laure Sauty de Chalon (a)
Yves-Thibault de Silguy (a)
Francesco Trapani
Hubert Védrine (a)
Advisory Board members
Paolo Bulgari
Patrick Houël
Felix G. Rohatyn
Executive Committee
Bernard ArnaultChairman and Chief Executive Officer
Antonio BelloniGroup Managing Director
Nicolas BazireDevelopment and acquisitions
Michael BurkeLouis Vuitton
Chantal GaemperleHuman Resources and Synergies
Jean-Jacques GuionyFinance
Christopher de LapuenteSephora and beauty
Christophe NavarreWines and Spirits
Daniel PietteInvestment funds
Pierre-Yves RousselFashion Group
Philippe SchausDFS
Jean-Baptiste VoisinStrategy
General Secretary
Marc-Antoine Jamet
Performance Audit Committee
Yves-Thibault de Silguy (a)
Chairman
Nicholas Clive Worms(a)
Charles de Croisset (a)
Nominations and Compensation Committee
Albert Frère (a)
Chairman
Charles de Croisset (a)
Yves-Thibault de Silguy (a)
Statutory Auditors
DELOITTE & ASSOCIÉSrepresented by Thierry Benoitand Guillaume Troussicot
ERNST & YOUNG et Autresrepresented by Jeanne Boillet and Gilles Cohen
EXECUTIVE AND SUPERVISORY BODIES; STATUTORY AUDITORS
1_VA_V4 01/02/2016 10:33 Page1

FINANCIAL HIGHLIGHTS
2 Financial Documents - December 31, 2015
Revenue(EUR millions)
Revenue by business group 2015 2014 2013(EUR millions)
Wines and Spirits 4,603 3,973 4,173Fashion and Leather Goods 12,369 10,828 9,883Perfumes and Cosmetics 4,517 3,916 3,717Watches and Jewelry 3,308 2,782 2,697Selective Retailing 11,233 9,534 8,903Other activities and eliminations (366) (395) (357)
Total 35,664 30,638 29,016
Revenue by geographic region of delivery
12%Other markets
18%Europe (excluding France)
26%United States
Asia (excluding Japan) 27%
Japan 7%
France 10%
Revenue by invoicing currency
29,01630,638
35,664
2013 2014 2015
Profit from recurring operations(EUR millions)
Stores(number)
Stores by geographic region(number as of December 31, 2015)
2013
3,384
2014
3,708
2015
3,860
732United States
482France
1,012Europe (a)
276Other markets
(a) Excluding France. (b) Excluding Japan.
951Asia (b)
407Japan
22%Euro
32%US dollar
Japanese yen 7%
Other currencies 32%
Hong Kong dollar 7%
Profit from recurring operations 2015 2014 2013by business group (EUR millions)
Wines and Spirits 1,363 1,147 1,367Fashion and Leather Goods 3,505 3,189 3,135Perfumes and Cosmetics 525 415 414Watches and Jewelry 432 283 367Selective Retailing 934 882 908Other activities and eliminations (154) (201) (174)
Total 6,605 5,715 6,017
6,0175,715
6,605
2013 2014 2015
1_VA_V4 01/02/2016 10:33 Page2

3Financial Documents - December 31, 2015
Net profit(EUR millions)
4,001
2013 2014 2015
3,947
6,105 (a)
Net profit,Group share(EUR millions)
2013 2014 2015
3,436 3,573
5,648 (a)
2013 2014 2015
6.87
11.27 (a)
7.11
2013 2014 2015
3.10 3.203.55
(b)
4,235
5,3094,805
2013 2014 2015
25,79927,907
23,003
21% 16%19%
2013 2014 2015
7,277 7,080
7,945
2013 2014 2015
Operating investments(EUR millions)
1,955
1,6571,775
2013 2014 2015
3,057 2,832
3,679
2013 2014 2015
(a) Gross amount paid for fiscal year, excluding the impact of regulationsapplicable to the beneficiary.
(b) Amount proposed at the Shareholders’Meeting of April 14, 2016.
(a) Before interest and tax paid.
(a) Of which 2,677 million euros (i.e. 5.34 euros per share) resulting from the distribution of Hermès shares.
(a) Excluding purchase commitments for minorityinterests included in Other non-currentliabilities. See Note 18.1 to the condensedconsolidated financial statements fordefinition of net financial debt.
Dividend per share (a)
(EUR)
Cash from operations beforechanges in working capital (a)
(EUR millions)
Net financial debt (a)
(EUR millions)
Total equity and Net financial debt/Total equity(EUR millions and percentage)
Free cash flow (a)
(EUR millions)
Basic Group share of netearnings per share(EUR)
(a) Net cash from (used in) operating activities and operating investments.
1_VA_V4 01/02/2016 10:33 Page3

SHARE CAPITAL AND VOTING RIGHTS
Number Number of % of share % of voting of shares voting rights(a) capital rights
Arnault family group 236,512,788 460,819,281 46.64% 62.90%Other 270,626,322 271,760,361 53.36% 37.10%
Total 507,139,110 732,579,642 100.00% 100.00%
(a) Total number of voting rights that may be exercised at Shareholders’ Meetings.
Key highlights from 2015 include:
• record revenue and profit from recurring operations;
• strong progress in Europe, the United States and Japan;
• positive impact of exchange rates;
• good performance of Wines & Spirits in all regions with aprogressive normalization of the situation in China;
• the success of both iconic and new products at Louis Vuitton,where profitability remains at an exceptional level;
• progress at Fashion brands, in particular Fendi, Céline, Givenchyand Kenzo;
• remarkable momentum at Christian Dior which gained marketshare globally;
• excellent results at Bvlgari and success of TAG Heuer’srefocusing strategy;
• exceptional progress at Sephora which strengthened its positionin all its markets and in digital;
• free cash flow of 3.7 billion euros, an increase of 30%;
• a gearing of 16% as of the end of December 2015.
Despite a climate of economic, currency and geopoliticaluncer tainties, LVMH is well-equipped to continue its growthmomentum across all business groups in 2016. The Group will maintain a strategy focused on developing its brands bycontinuing to build on strong innovation and a constant questfor quality in their products and their distribution.
Driven by the agility of its teams, their entrepreneurial spirit,the balance of its different businesses and geographic diversity,LVMH enters 2016 with confidence and has, once again, set an objective of increasing its global leadership position inluxury goods.
4 Financial Documents - December 31, 2015
HIGHLIGHTS AND OUTLOOK
1_VA_V4 01/02/2016 15:29 Page4

5Financial Documents - December 31, 2015
BUSINESS REVIEW AND COMMENTS ON THE CONSOLIDATED FINANCIAL STATEMENTS OF LVMH GROUP
1. COMMENTS ON THE CONSOLIDATED INCOME STATEMENT 62. WINES AND SPIRITS 103. FASHION AND LEATHER GOODS 114. PERFUMES AND COSMETICS 125. WATCHES AND JEWELRY 136. SELECTIVE RETAILING 157. COMMENTS ON THE CONSOLIDATED BALANCE SHEET 168. COMMENTS ON THE CONSOLIDATED CASH FLOW STATEMENT 18
1_VA_V4 01/02/2016 10:33 Page5

Change in revenue per half-year period (EUR millions and percentage)
(a) The principles used to determine the net impact of exchange rate fluctuations onrevenue of entities reporting in foreign currencies and the net impact of changes in thescope of consolidation are described on page 9.
Consolidated revenue for fiscal year 2015 was 35,664 millioneuros, up 16% over the preceding fiscal year. It was favorablyimpacted by the appreciation of the average rate of the Group’smain invoicing currencies against the euro, in particular theUS dollar, which appreciated by 16%.
The following change has been made in the Group’s scope ofconsolidation since January 1, 2014: in Other activities, theacquisition of the newspaper Le Parisien-Aujourd’hui en Francein October 2015. This change in the scope of consolidation didnot have a significant effect on revenue growth for the year.
On a constant consolidation scope and currency basis, revenueincreased by 6%.
Revenue by invoicing currency
(as %) 2015 2014 2013
Euro 22 23 23US dollar 32 29 28Japanese yen 7 7 7Hong Kong dollar 7 8 8Other currencies 32 33 34
Total 100 100 100
The breakdown of revenue by invoicing currency changedsignificantly: the contribution of the US dollar rose by 3 pointsto 32% while the contribution of the euro and that of othercurrencies fell by 1 point and 2 points, respectively, to 22%and 39%. The contribution of the Japanese yen remainedstable at 7%.
Revenue by geographic region of delivery
(as %) 2015 2014 2013
France 10 10 11Europe (excluding France) 18 19 19United States 26 24 23Japan 7 7 7Asia (excluding Japan) 27 29 30Other markets 12 11 10
Total 100 100 100
By geographic region of delivery, the relative contribution of Asia(excluding Japan) to Group revenue declined by 2 points, whilethat of Europe (excluding France) declined by 1 point, to 27%and 18% respectively, whereas the United States and Othermarkets witnessed their relative contribution increase by 2 pointsand 1 point, to 26% and 12% respectively. The contributions ofFrance and Japan remained stable at 10% and 7% respectively.
In local currency terms, the change in revenue by geographicregion represents a satisfactory performance for all regions,especially for the United States and Japan.
Revenue by business group
(EUR millions) 2015 2014 2013
Wines and Spirits 4,603 3,973 4,173Fashion and Leather Goods 12,369 10,828 9,883Perfumes and Cosmetics 4,517 3,916 3,717Watches and Jewelry 3,308 2,782 2,697Selective Retailing 11,233 9,534 8,903Other activities and eliminations (366) (395) (357)
Total 35,664 30,638 29,016
By business group, the breakdown of Group revenue remainedunchanged. The contribution of Fashion and Leather Goodsheld steady at 35%; Selective Retailing remained at 31%;Perfumes and Cosmetics and Wines and Spirits both came to13%, while Watches and Jewelry contributed 9%.
Wines and Spirits saw an increase in revenue of 16% based onpublished figures. Revenue for this business group increased by 6% on a constant consolidation scope and currency basis,with the net impact of exchange rate fluctuations raisingWines and Spirits revenue by 10 points. This performance wasmainly driven by higher volumes. Demand remained very strongin the United States and Europe, with China still the secondlargest market for the Wines and Spirits business group.
Fashion and Leather Goods posted organic growth of 4%, and 14% based on published figures. This business group’sperformance continued to benefit from gains made by LouisVuitton. Fendi, Céline, Kenzo, Givenchy and Berluti confirmedtheir potential for strong growth.
1. COMMENTS ON THE CONSOLIDATED INCOME STATEMENT
1.1. Analysis of revenue
6 Financial Documents - December 31, 2015
Comments on the consolidated income statement
BUSINESS REVIEW AND COMMENTS ON THE CONSOLIDATED FINANCIAL STATEMENTS OF LVMH GROUP
Fiscal year 20152nd half-year1st half-year
6%
6%6%
13%
8%10%
Organic growth
Changes in the scope of consolidation (a)
Exchange rate fluctuations (a)
16,70719%
18,95714%
35,66416%
1_VA_V4 01/02/2016 10:33 Page6

(EUR millions) 2015 2014 2013
Revenue 35,664 30,638 29,016Cost of sales (12,553) (10,801) (9,997)
Gross margin 23,111 19,837 19,019
Marketing and selling expenses (13,830) (11,744) (10,767)General and administrative expenses (2,663) (2,373) (2,212)Income (loss) from investments in associates (13) (5) (23)
Profit from recurring operations 6,605 5,715 6,017Operating margin (%) 18.5 18.7 20.7
The Group achieved a gross margin of 23,111 million euros,up 17% compared to the prior fiscal year. As a percentage ofrevenue, the gross margin was 65%, stable with regard to 2014.
Marketing and selling expenses totaled 13,830 million euros,up 18% based on published figures, amounting to an 8% increaseon a constant consolidation scope and currency basis. Thisincrease was mainly due to the development of retail networks,but also to higher communications investments especially in Perfumes and Cosmetics, and Fashion and Leather Goods.The level of these expenses rose by 1 point as a percentage of revenue, amounting to 39%. Among these marketing andselling expenses, advertising and promotion costs amounted to11% of revenue, an increase of 8% on a constant consolidationscope and currency basis.
The geographic breakdown of stores is as follows:
(number) 2015 2014 2013
France 482 467 443Europe (excluding France) 1,012 995 926United States 732 708 669Japan 407 412 370Asia (excluding Japan) 951 870 749Other markets 276 256 227
Total 3,860 3,708 3,384
General and administrative expenses totaled 2,663 million euros,up 12% based on published figures, and up 5% on a constantconsolidation scope and currency basis. They amounted to 8%of revenue, the same proportion as in 2014.
Profit from recurring operations by business group
(EUR millions) 2015 2014 2013
Wines and Spirits 1,363 1,147 1,367Fashion and Leather Goods 3,505 3,189 3,135Perfumes and Cosmetics 525 415 414Watches and Jewelry 432 283 367Selective Retailing 934 882 908Other activities and eliminations (154) (201) (174)
Total 6,605 5,715 6,017
The Group’s profit from recurring operations was 6,605 millioneuros, up 16%. The Group’s operating margin as a percentageof revenue was 18.5%, remaining stable compared withDecember 31, 2014.
1.2. Profit from recurring operations
Revenue for Perfumes and Cosmetics increased by 7% on aconstant consolidation scope and currency basis, and by 15%based on published figures. All of this business group’s brandsperformed well. This performance confirmed the effectivenessof the value-enhancing strategy resolutely pursued by theGroup’s brands in the face of competitive pressures spawned bythe economic crisis. The Perfumes and Cosmetics businessgroup saw appreciable revenue growth in the United Statesand Asia, notably China.
Revenue for Watches and Jewelry increased by 8% on a constantconsolidation scope and currency basis, and by 19% based on
published figures. This business group was boosted by the verystrong momentum of Bvlgari throughout the world and by thevery robust performance delivered by Chaumet and Hublot.For all of the business group’s brands, Europe and Japan werethe most dynamic regions.
Revenue for Selective Retailing increased by 5% on a constantconsolidation scope and currency basis and by 18% based onpublished figures. This performance was driven by Sephora,which generated very appreciable growth in revenue in NorthAmerica and the Middle-East.
7Financial Documents - December 31, 2015
Comments on the consolidated income statement
BUSINESS REVIEW AND COMMENTS ON THE CONSOLIDATED FINANCIAL STATEMENTS OF LVMH GROUP
1_VA_V4 01/02/2016 10:33 Page7
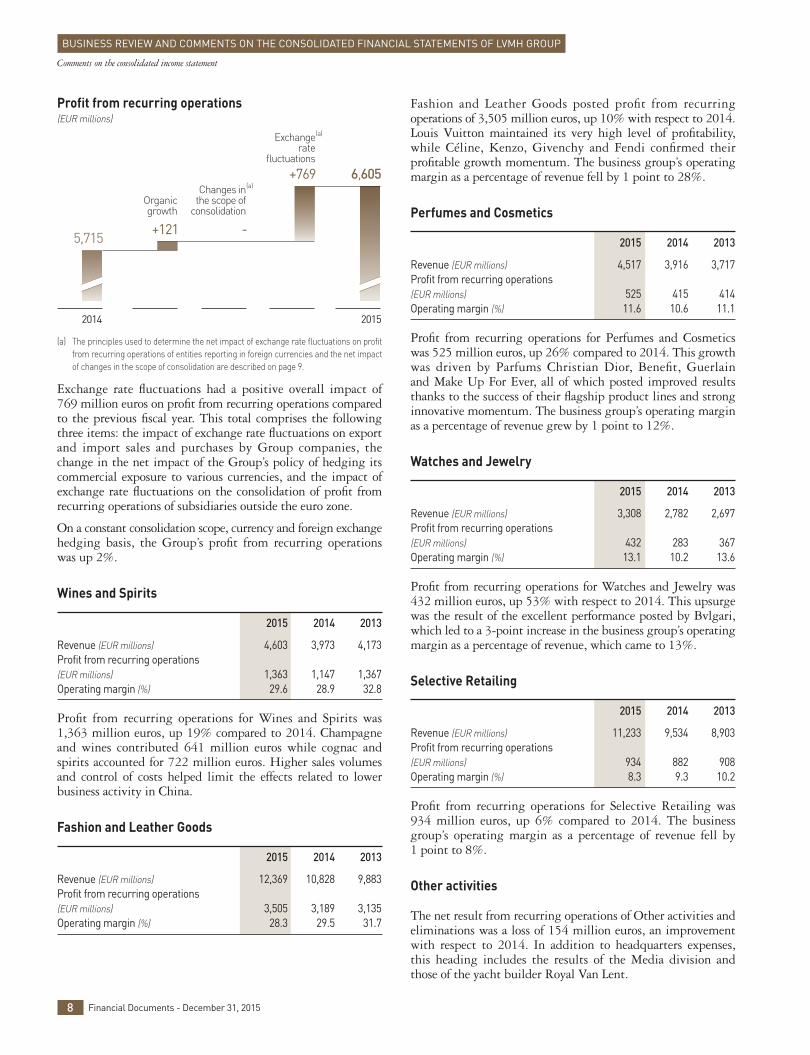
Profit from recurring operations (EUR millions)
(a) The principles used to determine the net impact of exchange rate fluctuations on profitfrom recurring operations of entities reporting in foreign currencies and the net impactof changes in the scope of consolidation are described on page 9.
Exchange rate fluctuations had a positive overall impact of769 million euros on profit from recurring operations comparedto the previous fiscal year. This total comprises the followingthree items: the impact of exchange rate fluctuations on exportand import sales and purchases by Group companies, thechange in the net impact of the Group’s policy of hedging itscommercial exposure to various currencies, and the impact ofexchange rate fluctuations on the consolidation of profit fromrecurring operations of subsidiaries outside the euro zone.
On a constant consolidation scope, currency and foreign exchangehedging basis, the Group’s profit from recurring operationswas up 2%.
Wines and Spirits
2015 2014 2013
Revenue (EUR millions) 4,603 3,973 4,173Profit from recurring operations (EUR millions) 1,363 1,147 1,367Operating margin (%) 29.6 28.9 32.8
Profit from recurring operations for Wines and Spirits was1,363 million euros, up 19% compared to 2014. Champagneand wines contributed 641 million euros while cognac andspirits accounted for 722 million euros. Higher sales volumesand control of costs helped limit the effects related to lowerbusiness activity in China.
Fashion and Leather Goods
2015 2014 2013
Revenue (EUR millions) 12,369 10,828 9,883Profit from recurring operations (EUR millions) 3,505 3,189 3,135Operating margin (%) 28.3 29.5 31.7
Fashion and Leather Goods posted profit from recurringoperations of 3,505 million euros, up 10% with respect to 2014.Louis Vuitton maintained its very high level of profitability,while Céline, Kenzo, Givenchy and Fendi confirmed theirprofitable growth momentum. The business group’s operatingmargin as a percentage of revenue fell by 1 point to 28%.
Perfumes and Cosmetics
2015 2014 2013
Revenue (EUR millions) 4,517 3,916 3,717Profit from recurring operations (EUR millions) 525 415 414Operating margin (%) 11.6 10.6 11.1
Profit from recurring operations for Perfumes and Cosmeticswas 525 million euros, up 26% compared to 2014. This growthwas driven by Parfums Christian Dior, Benefit, Guerlain and Make Up For Ever, all of which posted improved resultsthanks to the success of their flagship product lines and stronginnovative momentum. The business group’s operating marginas a percentage of revenue grew by 1 point to 12%.
Watches and Jewelry
2015 2014 2013
Revenue (EUR millions) 3,308 2,782 2,697Profit from recurring operations (EUR millions) 432 283 367Operating margin (%) 13.1 10.2 13.6
Profit from recurring operations for Watches and Jewelry was432 million euros, up 53% with respect to 2014. This upsurgewas the result of the excellent performance posted by Bvlgari,which led to a 3-point increase in the business group’s operatingmargin as a percentage of revenue, which came to 13%.
Selective Retailing
2015 2014 2013
Revenue (EUR millions) 11,233 9,534 8,903Profit from recurring operations (EUR millions) 934 882 908Operating margin (%) 8.3 9.3 10.2
Profit from recurring operations for Selective Retailing was934 million euros, up 6% compared to 2014. The businessgroup’s operating margin as a percentage of revenue fell by 1 point to 8%.
Other activities
The net result from recurring operations of Other activities andeliminations was a loss of 154 million euros, an improvementwith respect to 2014. In addition to headquarters expenses,this heading includes the results of the Media division andthose of the yacht builder Royal Van Lent.
8 Financial Documents - December 31, 2015
Comments on the consolidated income statement
BUSINESS REVIEW AND COMMENTS ON THE CONSOLIDATED FINANCIAL STATEMENTS OF LVMH GROUP
+769
5,715
2014
+121
Organicgrowth
-
6,605
2015
Exchangerate
fluctuations
(a)
Changes inthe scope of
consolidation
(a)
1_VA_V4 01/02/2016 10:33 Page8

(EUR millions) 2015 2014 2013
Profit from recurring operations 6,605 5,715 6,017Other operating income and expenses (221) (284) (119)
Operating profit 6,384 5,431 5,898
Net financial income (expense) (414) 2,947 (198)Income taxes (1,969) (2,273) (1,753)
Net profit before minority interests 4,001 6,105 3,947
Minority interests (428) (457) (511)Net profit, Group share 3,573 5,648 3,436
Other operating income and expenses amounted to a netexpense of 221 million euros, compared to a net expense of284 million euros in 2014. In 2015, Other operating incomeand expenses included 136 million euros in amortization andimpairment charges for brands and goodwill. The remaindermainly consisted of costs for the reorganization of manufacturingprocesses and sales structures, mostly in Fashion and LeatherGoods and Watches and Jewelry businesses.
The Group’s operating profit was 6,384 million euros, up 18%compared to 2014.
The net financial expense for the fiscal year was 414 millioneuros, compared with net financial income of 2,947 millioneuros in 2014. This item comprises:
- the aggregate cost of net financial debt, which amounted to78 million euros, down 37 million euros compared to 2014,thanks to the combined impacts of lower interest rates andthe decrease in the average amount of debt outstanding;
- other financial income and expenses, which amounted to anet expense of 336 million euros, compared to net income of3,062 million euros in 2014. As a reminder, this positive resultessentially consisted of capital gains arising on the distributionin kind of Hermès shares in 2014. The expense related to the ineffective portion of foreign exchange derivatives was437 million euros, versus an expense of 238 million euros a year earlier; the sharp appreciation of the US dollar withrespect to the euro led the Group to adapt its derivativesportfolio over the first half of the year. Lastly, other incomefrom financial instruments, which mainly arose from capitalgains on sales of short-term investments, amounted to netincome of 101 million euros.
The Group’s effective tax rate was 33%, an increase of 6 pointsversus 2014 and 2 points versus the tax rate adjusted for thespecific impact of the Hermès share distribution transaction.
Profit attributable to minority interests was 428 million euros,compared to 457 million euros in 2014; this total mainlyincludes profit attributable to minority interests in MoëtHennessy and DFS.
The Group’s share of net profit was 3,573 million euros, comparedwith 5,648 million euros in 2014. This represented 10% of revenue in 2015, down 8 points with respect to 2014. The Group’s share of net profit in 2015 was up 20% comparedto the Group’s share of net profit in 2014, restated for theimpact of the Hermès transaction.
Comments on the determination of the impact of exchange rate fluctuations and changes in the scope of consolidation
The impact of exchange rate fluctuations is determined by translating the accounts for the fiscal year of entities having a functional currency other than the euro at the prior fiscal year’sexchange rates, without any other restatements.
The impact of changes in the scope of consolidation is determined:- for the fiscal year’s acquisitions, by deducting from revenue for the fiscal year the amount of revenue generated during that fiscal year by the acquired entities, as of their initial consolidation;- for the prior fiscal year’s acquisitions, by deducting from revenue for the fiscal year the amount of revenue generated over the months during which the acquired entities were not
consolidated in the prior fiscal year;- for the fiscal year’s disposals, by adding to revenue for the fiscal year the amount of revenue generated by the divested entities in the prior fiscal year over the months during which those
entities were no longer consolidated in the current fiscal year;- for the prior fiscal year’s disposals, by adding to revenue for the fiscal year the amount of revenue generated in the prior fiscal year by the divested entities.
Profit from recurring operations is restated in accordance with the same principles.
1.3. Other income statement items
9Financial Documents - December 31, 2015
Comments on the consolidated income statement
BUSINESS REVIEW AND COMMENTS ON THE CONSOLIDATED FINANCIAL STATEMENTS OF LVMH GROUP
1_VA_V4 01/02/2016 10:33 Page9

2015 2014 2013
Revenue (EUR millions) 4,603 3,973 4,173Of which: Champagne and wines 2,221 1,985 1,937
Cognac and spirits 2,382 1,988 2,236
Sales volume (millions of bottles) Champagne 61.4 59.6 57.4Cognac 76.0 70.4 69.1Other spirits 18.6 17.3 16.9Still and sparkling wines 45.4 45.1 44.7
Revenue by geographic regionof delivery (%) France 6 6 7Europe (excluding France) 19 21 19United States 30 27 23Japan 6 6 5Asia (excluding Japan) 23 24 31Other markets 16 16 15
Total 100 100 100
Profit from recurring operations (EUR millions) 1,363 1,147 1,367Operating margin (%) 29.6 28.9 32.8
Operating investments of the period (EUR millions) 233 152 186
Highlights
The Wines and Spirits business group had a very good year,marked by solid gains in champagne and a strong performancefrom Hennessy. The rapid growth at Glenmorangie, Ardbegand Belvedere, and in the Estates & Wines portfolio, contributedto the business group’s growth. Volumes were up 3% inchampagne and 8% in cognac. In a mixed global environment,the excellence of the products, the robust innovation policyimplemented by the brands, and the responsiveness of MoëtHennessy’s distribution network played a key role in theseaccomplishments.
For Moët & Chandon, 2015 was a year of many innovations: anew prestige cuvée showcasing the House’s winemaking prowess,a bold move into the nightlife market with the first luminescentchampagne bottles, and a new international communicationscampaign. Buoyed by solid performances in the United States,Europe and Japan, Moët & Chandon achieved record volumesand strengthened its leading market position.
Dom Pérignon continued to develop internationally and rollout its range of premium products. The brand’s motto “ThePower of Creation”, aimed at elevating the tasting experienceof its vintage champagnes.
Mercier developed and expanded its product range with thelaunch of a Blanc de Noirs cuvée.
Ruinart continued to focus on premium cuvées and its strong tiesto contemporary design. The brand strengthened its positionin France and accelerated its international expansion with solidgrowth in all regions.
Veuve Clicquot proved as innovative as ever, performing wellacross its full product range thanks to the strong results of itshigh-profile Carte Jaune cuvée, the gains made by Rosé NonVintage and the success of Clicquot Rich, the first champagnedesigned specifically for use in mixed drinks. The brand builton its market-leading position in the United States.
Krug continued to increase its brand awareness and performancegains. While still pursuing the momentum in the Americanmarket, the brand also developed in Europe and made solidprogress in Japan and the Asia-Pacific region.
Estates & Wines had a good year, with excellent performancefrom the Chandon brand and promising developments at newlyestablished estates (China, India). The 2015 harvest was ofexceptional quality at all northern-hemisphere vineyards,signaling the arrival of a historic new vintage.
Hennessy celebrated its 250th birthday with high profilecommunications initiatives around the world, recording asubstantial increase in sales volumes and passing the 6 millioncase mark. Its results in the United States were remarkable acrossall cognac quality grades thanks to the robust performance ofits star product Hennessy Very Special, its upmarket strategyand successful communications. In China, the second half of theyear saw a rebound in sales, during a year marked bycontinuous destocking by retailers. Hennessy continued toconcentrate its volumes on the highest-performing regions anddeveloped its business not only in its historic markets but alsoin many new and promising countries such as Indonesia andthe Philippines, emerging African and American markets, andtravel retail channels.
Glenmorangie and Ardbeg continued to grow robustly on theback of strong demand for single malt premium whisky andincreasing brand awareness. Their quality and innovation policyearned them award recognition and good sales. Belvederevodka received a successful boost due to the high visibilityafforded by its sponsorship of Spectre, the 24th James Bondfilm, and enjoyed numerous international distinctions.
Outlook
Powered by their value creation and innovation strategy, thebrands of the Wines and Spirits business group are on a positivetrack for the months to come. In 2016 there will be newproduct launches as well as strong marketing, event and digitalinitiatives to bolster the brands’ image and appeal. Significantinvestments in communications will be made in the most
10 Financial Documents - December 31, 2015
Wines and Spirits
2. WINES AND SPIRITS
BUSINESS REVIEW AND COMMENTS ON THE CONSOLIDATED FINANCIAL STATEMENTS OF LVMH GROUP
1_VA_V4 01/02/2016 10:33 Page10
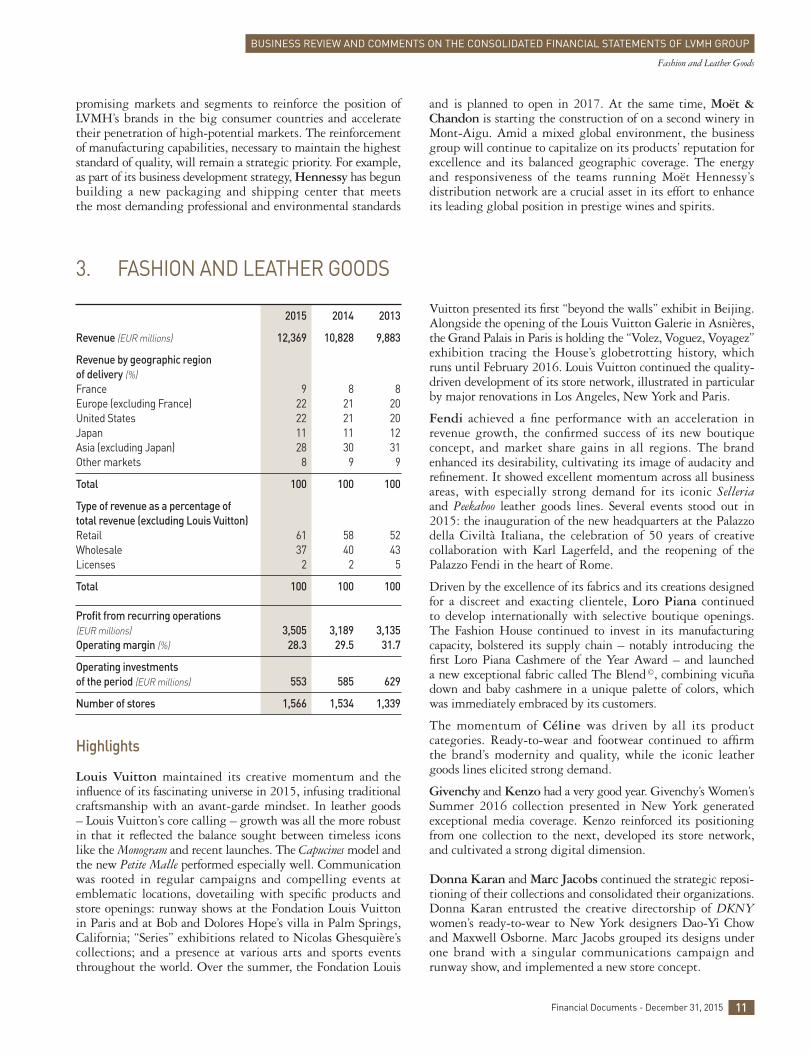
2015 2014 2013
Revenue (EUR millions) 12,369 10,828 9,883
Revenue by geographic region of delivery (%) France 9 8 8Europe (excluding France) 22 21 20United States 22 21 20Japan 11 11 12Asia (excluding Japan) 28 30 31Other markets 8 9 9
Total 100 100 100
Type of revenue as a percentage of total revenue (excluding Louis Vuitton) Retail 61 58 52Wholesale 37 40 43Licenses 2 2 5
Total 100 100 100
Profit from recurring operations (EUR millions) 3,505 3,189 3,135Operating margin (%) 28.3 29.5 31.7
Operating investments of the period (EUR millions) 553 585 629
Number of stores 1,566 1,534 1,339
Highlights
Louis Vuitton maintained its creative momentum and theinfluence of its fascinating universe in 2015, infusing traditionalcraftsmanship with an avant-garde mindset. In leather goods– Louis Vuitton’s core calling – growth was all the more robustin that it reflected the balance sought between timeless iconslike the Monogram and recent launches. The Capucines model andthe new Petite Malle performed especially well. Communicationwas rooted in regular campaigns and compelling events atemblematic locations, dovetailing with specific products andstore openings: runway shows at the Fondation Louis Vuittonin Paris and at Bob and Dolores Hope’s villa in Palm Springs,California; “Series” exhibitions related to Nicolas Ghesquière’scollections; and a presence at various arts and sports eventsthroughout the world. Over the summer, the Fondation Louis
Vuitton presented its first “beyond the walls” exhibit in Beijing.Alongside the opening of the Louis Vuitton Galerie in Asnières,the Grand Palais in Paris is holding the “Volez, Voguez, Voyagez”exhibition tracing the House’s globetrotting history, whichruns until February 2016. Louis Vuitton continued the quality-driven development of its store network, illustrated in particularby major renovations in Los Angeles, New York and Paris.
Fendi achieved a fine performance with an acceleration inrevenue growth, the confirmed success of its new boutiqueconcept, and market share gains in all regions. The brandenhanced its desirability, cultivating its image of audacity andrefinement. It showed excellent momentum across all businessareas, with especially strong demand for its iconic Selleria and Peekaboo leather goods lines. Several events stood out in2015: the inauguration of the new headquarters at the Palazzodella Civiltà Italiana, the celebration of 50 years of creativecollaboration with Karl Lagerfeld, and the reopening of thePalazzo Fendi in the heart of Rome.
Driven by the excellence of its fabrics and its creations designedfor a discreet and exacting clientele, Loro Piana continued to develop internationally with selective boutique openings.The Fashion House continued to invest in its manufacturingcapacity, bolstered its supply chain – notably introducing thefirst Loro Piana Cashmere of the Year Award – and launched a new exceptional fabric called The Blend ©, combining vicuñadown and baby cashmere in a unique palette of colors, whichwas immediately embraced by its customers.
The momentum of Céline was driven by all its productcategories. Ready-to-wear and footwear continued to affirm the brand’s modernity and quality, while the iconic leathergoods lines elicited strong demand.
Givenchy and Kenzo had a very good year. Givenchy’s Women’sSummer 2016 collection presented in New York generatedexceptional media coverage. Kenzo reinforced its positioningfrom one collection to the next, developed its store network,and cultivated a strong digital dimension.
Donna Karan and Marc Jacobs continued the strategic reposi -tioning of their collections and consolidated their organizations.Donna Karan entrusted the creative directorship of DKNYwomen’s ready-to-wear to New York designers Dao-Yi Chowand Maxwell Osborne. Marc Jacobs grouped its designs underone brand with a singular communications campaign andrunway show, and implemented a new store concept.
3. FASHION AND LEATHER GOODS
promising markets and segments to reinforce the position ofLVMH’s brands in the big consumer countries and acceleratetheir penetration of high-potential markets. The reinforcementof manufacturing capabilities, necessary to maintain the higheststandard of quality, will remain a strategic priority. For example,as part of its business development strategy, Hennessy has begunbuilding a new packaging and shipping center that meets the most demanding professional and environmental standards
and is planned to open in 2017. At the same time, Moët &Chandon is starting the construction of on a second winery inMont-Aigu. Amid a mixed global environment, the businessgroup will continue to capitalize on its products’ reputation forexcellence and its balanced geographic coverage. The energyand responsiveness of the teams running Moët Hennessy’sdistribution network are a crucial asset in its effort to enhanceits leading global position in prestige wines and spirits.
11Financial Documents - December 31, 2015
Fashion and Leather Goods
BUSINESS REVIEW AND COMMENTS ON THE CONSOLIDATED FINANCIAL STATEMENTS OF LVMH GROUP
1_VA_V4 01/02/2016 11:16 Page11

2015 2014 2013
Revenue (EUR millions) 4,517 3,916 3,717
Revenue by product category (%) Perfumes 41 43 45Cosmetics 40 39 37Skincare products 19 18 18
Total 100 100 100
Revenue by geographic region of delivery (%) France 12 13 13Europe (excluding France) 26 30 32United States 14 13 12Japan 4 4 5Asia (excluding Japan) 29 26 24Other markets 15 14 14
Total 100 100 100
Profit from recurring operations (EUR millions) 525 415 414Operating margin (%) 11.6 10.6 11.1
Operating investments of the period (EUR millions) 229 221 229
Number of stores 203 162 123
Highlights
Perfumes and Cosmetics had an eventful year, recording robustgrowth and new market share gains. LVMH’s Houses continuedto capitalize on the vibrancy of their emblematic product linesand a vigorous innovation policy.
Parfums Christian Dior built on its growth and gainedmarket share across the globe. Performance was driven by theunprecedented worldwide success of its new men’s fragranceSauvage – as embodied by Johnny Depp – and the buoyancy of its iconic perfumes: J’adore, which offered the new Touche deParfum; Miss Dior, driven by a fresh communications campaignand its worlwide success; and Dior Homme, which deliveredgrowth in the world’s main national markets. Dior developpedits collections by re-releasing the iconic amphora bottle and a new exceptional fragrance, Fève Délicieuse, designed by itsperfumer François Demachy for the Collection Privée ChristianDior. Spurred by the creative flair of Peter Philips since 2014,the brand’s make-up segment reaffirmed its leading positionwith even bolder collections and numerous new releases such as Dior Addict Lipstick and Nude Air serum foundation. In skincare, where Dior has achieved some age-fighting scientificbreakthroughs, Dreamskin did well as well as the Prestige range.
Guerlain continued to grow profitably, helped along by theongoing success of the various incarnations of La Petite RobeNoire and the performance of L’Homme Idéal, which is wellestablished on its markets. Its skincare lines Orchidée Impérialeand Abeille Royale flourished, and its iconic make-up creationsTerracotta and Météorites posted excellent results. La Ruche,
4. PERFUMES AND COSMETICS
Under the creative direction of Jonathan Anderson, Loewecontinued its stylistic evolution and updated its iconic productlines. The launch of the Puzzle bag – a perfect illustration ofthe brand’s craftsmanship – is already a great success.
Berluti had an eventful year, with numerous launches and theopening of a new workshop in Ferrara, which was necessary to accommodate its strong growth.
Thomas Pink, which maintained strong growth in its onlinesales, bolstered its digital strategy with the preparation of anew omni-channel platform.
Pucci appointed Massimo Giorgetti as its new creative director.
Outlook
2016 will be an eventful year for Louis Vuitton. The House willillustrate its unwavering creativity and its spirit of innovationthroughout all its collections. One of the year’s highlights willbe the launch of a Louis Vuitton fragrance and the inaugurationof a creative laboratory in Grasse to support its ambition in
conquering this new territory. These developments will beaccompanied by communications all closely related to thebrand’s latest news. Louis Vuitton will continue to enhance thequality of its retail network and will pursue initiatives aimedat offering its customers an exceptional experience and qualityof service through a global approach encompassing both in-store and digital initiatives. Fendi will boost its momentum,driven by a bold, sophisticated offering and a focus on itsunique craftsmanship. Innovation will take center stage onceagain in 2016 with a number of new product launches, and the Rome-based Fashion House will continue its expansion,opening stores in the downtown areas of key cities and in newmarkets. A highlight of the year for Loro Piana in 2016 willbe the opening of a flagship store on Avenue Montaigne inParis. Loro Piana will continue to concentrate its investmentson textile research and development and on sourcing the finestand most precious natural fibers. By focusing on their specificobjectives, all the fashion brands will continue to reinforcetheir development model with a view to ensuring profitable,controlled growth over time.
12 Financial Documents - December 31, 2015
Perfumes and Cosmetics
BUSINESS REVIEW AND COMMENTS ON THE CONSOLIDATED FINANCIAL STATEMENTS OF LVMH GROUP
1_VA_V4 01/02/2016 11:14 Page12

2015 2014 2013
Revenue (EUR millions) 3,308 2,782 2,697
Revenue by geographic region of delivery (%) France 7 6 6Europe (excluding France) 25 27 27United States 11 12 12Japan 13 13 13Asia (excluding Japan) 27 26 27Other markets 17 16 15
Total 100 100 100
Profit from recurring operations (EUR millions) 432 283 367Operating margin (%) 13.1 10.2 13.6
Operating investments of the period (EUR millions) 204 191 187
Number of stores 395 380 363
Highlights
The Watches and Jewelry business group posted strong growth,with major gains in jewelry. The backdrop of economic andmonetary uncertainty continued to make watch retailers prudentin their purchasing decisions. The boutiques achieved solidgrowth thanks to the success of their iconic product lines andthe creativity of new offerings. The brands focused on buildingtheir reputations and invested selectively in their distributionnetworks and manufacturing capabilities.
Bvlgari continued to thrive in terms of both revenue and profits,delivering a remarkable performance in jewelry thanks to thesuccess of the emblematic Serpenti, Bvlgari-Bvlgari and B.Zero1product lines and the new Diva collection. Fine jewelry madespectacular gains with a contribution from the new GiardiniItaliani collection, inspired by the creative artistry of Italiangardens and epitomizing the brand’s peerless mastery ofexceptional colored gemstone arrangements. The watchmakingsegment benefited from the success of the new Lucea collection,the ongoing progress of Serpenti, and the growth of the Octo line for men. A thorough campaign of selective store openings
5. WATCHES AND JEWELRY
the brand’s new skincare and make-up manufacturing site inChartres, is an asset to cosmetics development and a symbol ofGuerlain’s long-term commitment to high quality, eco designand the transmission of know-how in France’s Cosmetic Valley.
Parfums Givenchy made progress with support from all of itsproduct categories. The fragrance Gentlemen Only, an embodimentof masculine elegance, continued to record growth alongside thepromising success of the new women’s fragrance Live Irrésistible.Development in make-up was driven notably by the brand’stop lipstick, Le Rouge.
Kenzo Parfums successfully launched Flower by Kenzo L’Élixir,with a communications campaign embodying the spontaneityand poetry of the brand.
Benefit maintained its strong momentum and continued togain market share in the United States, Europe and the MiddleEast, with the support of some extremely effective digitalcommunications. The major innovation of 2015 was Roller Lashmascara, a high-performance product that also conveys Benefit’ssignature fun-and-quirky tone, which achieved rapid success.
Make Up For Ever expanded rapidly, validating its businessdevelopment model based on exceptional creativity and theprofessional quality of its make-up. Its new foundation productsreleased in 2015, Ultra HD and Step 1, proved highly successful.
Fresh maintained a high rate of growth, especially in Asia,propelled by its unique approach to beauty and its ranges ofnaturally-derived products. 2015 marked the beginning of thebrand’s development in Europe, with counters opening at theGaleries Lafayette in Paris and Harrods in London.
Acqua di Parma benefited from the excellent performance ofits Colonia line, which embodies timeless elegance and theItalian art of living.
Outlook
Going into 2016, LVMH’s brands are setting themselves newtargets for market share gains, which will mean showcasingtheir passion for excellence and adopting an active strategy of innovation, communication and digital initiatives. ParfumsChristian Dior will continue to cultivate its reputation as oneof the world’s great perfume houses, develop its appeal, and growits customer base in synergy with Couture. Its key strategicpriorities will be developing Sauvage and building on itsflagship product lines. Just as important will be the attentiondevoted to the expertise of its customer advisers and thecontinuous improvement of the Dior experience at its points ofsale. Guerlain has undertaken an intensive innovation plan forall of its product categories, one consequence of which will be a make-up offshoot of La Petite Robe Noire. In Paris, Guerlainwill open its first fragrances-only shop in January. ParfumsGivenchy will develop its cosmetics offering, expand on itsexisting perfumes with new scent versions, and add to its Live Irrésistible product line. In a few strategic countries, KenzoParfums will launch a new and highly creative product line inkeeping with the spirit of the Fashion house. Benefit, MakeUp For Ever, Fresh, and Acqua di Parma will continue toaffirm their creative focus, reinforce the one-of-a-kind marketpositioning that has enabled them to thrive, and expand theirinternational distribution.
13Financial Documents - December 31, 2015
Watches and Jewelry
BUSINESS REVIEW AND COMMENTS ON THE CONSOLIDATED FINANCIAL STATEMENTS OF LVMH GROUP
1_VA_V4 01/02/2016 11:13 Page13

and improvements was rewarded with a strong performance by Bvlgari’s own stores. In accessories and fragrances, Bvlgariaccelerated its move upmarket.
TAG Heuer continued to build on its core products. New releasesand special series were added to the iconic Formula 1, Aquaracerand Carrera lines, with powerful communications initiatives to support them. The smartwatch unveiled in New York inNovember, in keeping with the brand’s status as a pioneer,generated a lot of interest and made a remarkable start in termsof revenue on its first markets. TAG Heuer continued improvingits organization and optimizing its store network to build on their quality and profitability. TAG Heuer’s visibility for itstarget audience and its social media presence were enhancedwith an extensive network of partners and ambassadors,including the Red Bull Racing team, the German Bundesligasoccer league, the musician David Guetta and the Chinesesinger G.E.M.
Hublot kept up its high rate of growth, driven by the ClassicFusion line and the emblematic Big Bang, which turned 10 yearsold in 2015. The brand illustrated its creativity and value strategywith many new fine timepieces. The opening of a secondmanufacturing facility in Nyon reinforced Hublot’s technicalmastery of the fabrication process for its UNICO movements and its complications, and enriched its technological andinnovative capacities. The brand’s visibility was boosted bylively communications initiatives including events, a digitalpresence, and prestigious partnerships in the arts and sports.New stores opened in Frankfurt, Dubai, Osaka and Chengdu.
Zenith celebrated its 150th anniversary in 2015, a tribute to itsvalues of craftsmanship and passion for watchmaking. The newElite 6150 received a very enthusiastic welcome, while the iconicEl Primero line continued to thrive. Zenith raised its profile andexpanded its network with the opening of a store in Chengdu.
Chaumet had a year of strong growth, driven by its emblematiclines and a gradual move upmarket. Several new designs enrichedthe Hortensia and Joséphine collections. A “Musée Éphémère”pop-up exhibit was opened on the Place Vendôme in Paris,displaying Chaumet’s historic and current creations on thetheme of naturalism, a hallmark of its heritage.
Montres Dior benefited from the success of the Grand Bal fine timepiece collections. De Beers consolidated its positionas the leading reference in the solitaire diamonds segment. Fredwas buoyed by its iconic Force 10 line and opened a new flagshipboutique in Paris.
Outlook
The Watches and Jewelry business group is actively pursuingits market share growth targets. Its masterful watchmakingand jewelry-making expertise, the creativity of its products and the brands’ reputation and image of excellence remain thekey vectors of its momentum and its future development.Against a mixed economic backdrop, this strategy continues tobe combined with rigorous management and highly targetedresource allocation. Over the coming months, the brands willcontinue to invest in the most buoyant, promising regions as a priority to raise their profiles there. They will focus onoptimizing the geographic coverage of their retail networksand enhancing the quality of their stores while increasing theirproductivity and profitability. At Hublot, specifically, a newflagship store opening in New York will be a highlight of thefirst half of the year. Further efforts will be made to expandmanufacturing capacity and create synergies within the businessgroup. Bvlgari, specifically, will continue the construction ofits new manufacturing facility in Valenza, Italy, set to open inmid-2016. Lastly, in an illustration of their energy, innovativemindset and expertise, all the watches and jewelry brands willenrich their collections, ever guided by a spirit of creativity andcommitment to excellence.
14 Financial Documents - December 31, 2015
Watches and Jewelry
BUSINESS REVIEW AND COMMENTS ON THE CONSOLIDATED FINANCIAL STATEMENTS OF LVMH GROUP
1_VA_V4 01/02/2016 11:13 Page14

2015 2014 2013
Revenue (EUR millions) 11,233 9,534 8,903
Revenue by geographic region of delivery (%) France 13 15 15Europe (excluding France) 8 9 10United States 39 35 33Japan 2 1 1Asia (excluding Japan) 29 31 33Other markets 9 9 8
Total 100 100 100
Profit from recurring operations (EUR millions) 934 882 908Operating margin (%) 8.3 9.3 10.2
Operating investments of the period (EUR millions) 399 389 389
Number of stores Sephora 1,626 1,560 1,481Other trade names 53 54 60
Highlights
Sephora gained market share worldwide and achieved newdouble-digit revenue growth, with remarkable performances inNorth America and the Middle East. Recently entered markets– Australia in particular – were off to a promising start.Expansion continued with close to 100 openings throughoutthe world in 2015. Several flagship stores such as the Mall ofthe Emirates store in Dubai and the Powell Street store in SanFrancisco were renovated to enrich customers’ digital and serviceexperience. Online sales kept up their strong growth, accompaniedin particular by an upgraded mobile offering. Sephora steppedup the pace of its omni-channel development strategy: severalinnovative offerings were launched, such as 48-hour delivery inthe United States and the “Click & Collect” service in France,where products ordered online can be picked up in-store three hours later. Geographic expansion continued with theacquisition of the e-commerce site Luxola, which is present innine countries in Southeast Asia. Sephora also maintained itsfocus on innovation in products and services with a reinforcedexclusive offering, the launch of the Beauty to Go line ofminiature products for everyday use and travel, and the “Play!”initiative in the United States, which lets customers sign up toreceive samples of a selection of products.
Le Bon Marché had a year of strong growth marked byinnovation. One of the key events of 2015 was the opening of its new Footwear space with its magnificent glass ceilings.This renovation helped create remarkable momentum in the Accessories department, which was also boosted by thegood results achieved in Watches and Jewelry. The ongoingtransformation of the Women’s Fashion space generated strong
growth in this segment. Two highlights of the year at Le BonMarché and the Grande Épicerie de Paris food store were theexhibition held at the beginning of the year in association withthe Miami concept store The Webster and another devoted tothe spirit of Brooklyn. The success of the “24 Sèvres” loyaltyprogram exceeded expectations, expanding the customer basein France and drawing in a younger clientele. Internationalcustomers, won over by Le Bon Marché’s culturally rich, Parisianatmosphere, also contributed to revenue growth.
Travel retail activities were faced with a combination ofunfavorable political, economic and monetary factors in Asia,with the exception of Japan, where DFS benefited from highlevels of Chinese tourism. In this context, DFS drew on itsunique expertise and its enormous capacity for innovation to develop its offering in response to the changing expectationsof its globetrotting customers, while continuing to reduceoperating costs. The T Beauty concept was launched in Macaoand Hong Kong, offering a wide selection of brands and beautyproducts in an architectural space that is luxurious, modernand accessible. Another initiative, the wines and spirits duplexstores that opened at Changi Airport in Singapore, set a newbenchmark for excellence in this category in terms of architectureand customer experience. In parallel, the plan to modernizeexisting stores continued, backed by a dynamic policy inmarketing, events and loyalty building with the expansion of the LoyalT program.
The Starboard Cruise Services business on board cruise shipswas boosted by the development of cruise routes in Asia and by its strategy of innovating and differentiating its in-storeofferings by cruise line and customer base. The highlight of 2015was the renewal of the contract with Royal Caribbean.
Outlook
Sephora will continue its international expansion. Staying trueto its profile as a trailblazer in the world of beauty, Sephora will keep crafting the shopping experiences of tomorrow,focusing on personalizing its relationship with each customerand strengthening the link between physical stores and digitalofferings. The training and engagement of its staff, on whichSephora’s success depends, remain at the core of this strategy.Le Bon Marché will continue to cultivate its uniqueness, itsidentity as a trendsetter and the quality of its customer care.The launch of La Grande Épicerie de Paris’s own brand will bea major event in 2016, while the Franck et Fils store will closeits doors to prepare for the 2017 opening of another GrandeÉpicerie de Paris on the city’s Right bank.
Backed by its highly responsive teams and organization, DFSwill continue to focus on the appeal of its network to make it an essential stop for travelers and enrich their experience.Several promising developments will come to fruition in 2016:the opening of the T Galleria in Siem Reap in Cambodia, nearthe fabulous ruins of Angkor; the opening of the new T Galleria– City of Dreams in Macao; and the opening of T Fondaco deiTedeschi, Europe’s first DFS store, on the Grand Canal in Venice,
6. SELECTIVE RETAILING
15Financial Documents - December 31, 2015
Selective retailing
BUSINESS REVIEW AND COMMENTS ON THE CONSOLIDATED FINANCIAL STATEMENTS OF LVMH GROUP
1_VA_V4 01/02/2016 10:33 Page15

LVMH’s consolidated balance sheet totaled 57.6 billion euros asof year-end 2015, representing an 8% increase from year-end2014. Non-current assets rose by 3.4 billion euros and represented67% of total assets, compared with 66% as of year-end 2014.
Tangible and intangible fixed assets grew by 2.6 billion euros,of which 1.2 billion euros was due to the revaluation of purchasecommitments for minority interests, and 0.9 billion euros wasdue to exchange rate fluctuations. Investments for the year, net of disposals as well as amortization and depreciationcharges, represented an additional increase of 0.3 billion euros.The comments on the cash flow statement provide furtherinformation on investments.
Other non-current assets increased by 0.8 billion euros, amountingto 3.8 billion euros, as a result of the increase in deferred taxassets, for 0.5 billion euros, and the increase in investments injoint ventures and associates, for 0.2 billion euros, arising fromthe acquisition of equity stake in Repossi and L Catterton, in particular.
Inventories increased by 0.6 billion euros. The comments on thecash flow statement provide further information on this change.
Other current assets grew by 0.2 billion euros, as a result of theincrease in operating receivables for 0.7 billion euros, mainlytrade accounts receivable, which is in line with the Group’sbusiness growth. This increase is offset by the decrease of thelevel of cash, for 0.5 billion euros.
Other non-current liabilities, totaling 14.6 billion euros, increasedby 1.4 billion euros, due to the 1.4 billion euro increase in theliability in respect of purchase commitments for minorityinterests. The 0.3 billion euro decrease in provisions was offsetby an equivalent increase in deferred tax liabilities.
Lastly, other current liabilities increased by 1.0 billion euros,totaling 9.0 billion euros, of which 0.3 billion euros were relatedto exchange rates changes, 0.2 billion euros to the changes inconsolidation scope, and 0.2 billion euros to increased tax andsocial charge liabilities. These changes are due to the developmentof the Group’s business activities.
(EUR billions) 2015 2014 Change
Tangible and intangible assets 34.9 32.3 2.6Other non-current assets 3.8 3.0 0.8
Non-current assets 38.7 35.3 3.4
Inventories 10.1 9.5 0.6Other current assets 8.8 8.6 0.2
Current assets 18.9 18.1 0.8
Assets 57.6 53.4 4.2
(EUR billions) 2015 2014 Change
Total equity 25.8 23.0 2.8Long term borrowings 4.5 5.0 (0.5)Other non-current liabilities 14.6 13.2 1.4
Equity and non-current liabilities 44.9 41.2 3.7
Short term borrowings 3.7 4.2 (0.5)Other current liabilities 9.0 8.0 1.0
Current liabilities 12.7 12.2 0.5
Liabilities and equity 57.6 53.4 4.2
7. COMMENTS ON THE CONSOLIDATED BALANCE SHEET
Balance sheet as of December 31, 2015
next to the Rialto Bridge, one of the world’s most-visited touristattractions. In response to the wide variety of cruise routes and a changing customer base, Starboard Cruise Services
will continue to innovate and refine its product selections, witha focus on the highest-contributing categories.
16 Financial Documents - December 31, 2015
Comments on the consolidated balance sheet
BUSINESS REVIEW AND COMMENTS ON THE CONSOLIDATED FINANCIAL STATEMENTS OF LVMH GROUP

Net financial debt and equity
(EUR billions) 2015 2014 Change
Long term borrowings 4.5 5.0 (0.5)Short term borrowings and derivatives 3.7 4.2 (0.5)
Gross borrowings after derivatives 8.2 9.2 (1.0)
Cash and cash equivalents and current available for sale financial assets (4.0) (4.4) 0.4
Net financial debt 4.2 4.8 (0.6)
Equity 25.8 23.0 2.8Net financial debt / Total equity ratio 16% 21% (5.0)
The ratio of net financial debt to equity, which was 21% as ofDecember 31, 2014, dropped significantly, falling by 5 pointsto 16%, thanks to the combined impact of the increase in equity,for 2.8 billion euros, and the reduction in net financial debt, for 0.6 billion euros.
Total equity amounted to 25.8 billion euros as of year-end 2015,up 2.8 billion euros compared to year-end 2014. This changeprimarily reflects the strong earnings achieved by the Group,
distributed only partially, representing a net increase of 2.1 billioneuros. In addition to this, a positive impact of 0.8 billion euroswas recorded due to exchange rate fluctuations on the reservesof entities reporting in foreign currency, mainly US dollars,Hong Kong dollars and Swiss francs. As of December 31, 2015,total equity was equal to 45% of total assets, compared to 43%as of year-end 2014.
Gross borrowings after derivatives totaled 8.2 billion euros asof year-end 2015, representing a 1 billion euro decrease comparedto year-end 2014. During the year, LVMH redeemed the bondsissued in 2009 (250 million euros) and 2011 (500 millioneuros) in addition to the 200 million Swiss franc bond issued in2008. Other borrowings also fell by 0.4 billion euros, contributingto the decrease of the debt. Conversely, commercial paperoutstanding increased by 0.3 billion euros and foreign currencyliabilities rose by 0.1 billion euros as a result of exchange ratefluctuations. Cash, cash equivalents and current available forsale financial assets totaled 4.0 billion euros at the end of the fiscal year, down 0.4 billion euros from 4.4 billion euros as of year-end 2014; net financial debt was therefore down 0.6 billion euros.
As of year-end 2015, the Group’s undrawn confirmed creditlines amounted to 3.4 billion euros, substantially exceedingthe outstanding portion of its commercial paper program,which came to 2.2 billion euros as of December 31, 2015.
17Financial Documents - December 31, 2015
Comments on the consolidated balance sheet
BUSINESS REVIEW AND COMMENTS ON THE CONSOLIDATED FINANCIAL STATEMENTS OF LVMH GROUP
1_VA_V4 01/02/2016 10:33 Page17

Cash from operations before changes in working capital totaled7,945 million euros, compared to 7,080 million euros a yearearlier, representing an increase of 12%. Net cash from operatingactivities before changes in working capital (i.e. after interestand income taxes paid) amounted to 6,063 million euros, up14% from fiscal year 2014.
Interest paid, which totaled 75 million euros, was downsignificantly compared to its 2014 amount, mainly thanks tothe impacts of lower interest rates on borrowings, as well as thereduction in net financial debt.
Income taxes paid came to 1,807 million euros, up 10% comparedto the 1,639 million euros paid a year earlier, arising from theGroup’s earnings growth.
The 429 million euro increase in the working capital requirementwas much lower than the 718 million euro increase observed a year earlier. The 569 million euro rise in inventories wassignificantly lower than the 928 million euro increase in 2014.It concerned Wines and Spirits in particular, and to a lesserextent Perfumes and Cosmetics and Watches and Jewelry.
Operating investments net of disposals resulted in an outflowof 1,955 million euros in 2015, compared to 1,775 millioneuros a year earlier. They consisted mainly of investments by Sephora, Louis Vuitton, DFS and Bvlgari in their retailnetworks; investments by Parfums Christian Dior in newcounters; investments by the champagne houses and Hennessyin their production facilities; and investments in real estate foradministrative use, sales operations or rental purposes.
In 2015, purchases of non-current available for sale financialassets and consolidated investments accounted for a 511 million
euro outflow, of which 240 million euros were for purchases of consolidated investments. These included the acquisition ofthe newspaper Le Parisien-Aujourd’hui en France, a 95% stakein the e-commerce site Luxola, and investments in Repossi andL Catterton. The remaining net outflow of 271 million eurosarose from the management of non-current available for salefinancial assets, including an outflow of 265 million eurosarising from income tax related to non-current available for salefinancial assets.
Transactions relating to equity generated an outflow of 2,090 mil -lion euros. A portion of this amount, 1,671 million euros,related to dividends paid during the fiscal year by LVMH SE,excluding the amount attributable to treasury shares, of which992 million euros was for the final dividend payment in respectof fiscal year 2014 and 679 million euros was for the interimdividend payment in respect of fiscal year 2015. In addition,dividends paid out to minority shareholders of consolidatedsubsidiaries amounted to 228 million euros and income taxespaid on transactions relating to equity amounted to 304 millioneuros. Conversely, share subscription options exercised duringthe fiscal year and capital increases subscribed by minorityshareholders of Group subsidiaries generated an inflow of116 million euros.
The net cash inflow after all operating, investment, and equity-related activities thus amounted to 1,078 million euros. Financingactivities generated a cash outflow of 1,438 million euros, and after the negative impact of the change in the cumulativetranslation adjustment of 33 million euros, the cash balance atthe end of the fiscal year was down 393 million euros comparedto year-end 2014.
8. COMMENTS ON THE CONSOLIDATED CASH FLOW STATEMENT
(EUR millions) 2015 2014 Change
Cash from operations before changes in working capital 7,945 7,080 865Cost of net financial debt: interest paid (75) (116) 41Income taxes paid (1,807) (1,639) (168)
Net cash from operating activities before changes in working capital 6,063 5,325 738
Change in working capital (429) (718) 289Operating investments (1,955) (1,775) (180)
Free cash flow 3,679 2,832 847
Financial investments (511) (232) (279)Transactions relating to equity (2,090) (1,961) (129)
Change in cash before financing activity 1,078 639 439
18 Financial Documents - December 31, 2015
Comments on the consolidated cash flow statement
BUSINESS REVIEW AND COMMENTS ON THE CONSOLIDATED FINANCIAL STATEMENTS OF LVMH GROUP
1_VA_V4 01/02/2016 10:33 Page18

19Financial Documents - December 31, 2015
CONDENSED CONSOLIDATED FINANCIAL STATEMENTS
CONSOLIDATED INCOME STATEMENT 20CONSOLIDATED STATEMENT OF COMPREHENSIVE GAINS AND LOSSES 21CONSOLIDATED BALANCE SHEET 22CONSOLIDATED STATEMENT OF CHANGES IN EQUITY 23CONSOLIDATED CASH FLOW STATEMENT 24SELECTED NOTES TO THE CONSOLIDATED FINANCIAL STATEMENTS 25
2_VA_V4 01/02/2016 10:38 Page19

20 Financial Documents - December 31, 2015
CONDENSED CONSOLIDATED FINANCIAL STATEMENTS
CONSOLIDATED INCOME STATEMENT
(EUR millions, except for earnings per share) Notes 2015 2014 2013
Revenue 23 35,664 30,638 29,016Cost of sales (12,553) (10,801) (9,997)
Gross margin 23,111 19,837 19,019
Marketing and selling expenses (13,830) (11,744) (10,767)General and administrative expenses (2,663) (2,373) (2,212)Income (loss) from joint ventures and associates 7 (13) (5) (23)
Profit from recurring operations 23/24 6,605 5,715 6,017
Other operating income and expenses 25 (221) (284) (119)
Operating profit 6,384 5,431 5,898
Cost of net financial debt (78) (115) (101)Other financial income and expenses (336) 3,062 (97)
Net financial income (expense) 26 (414) 2,947 (198)
Income taxes 27 (1,969) (2,273) (1,753)
Net profit before minority interests 4,001 6,105 3,947
Minority interests 17 (428) (457) (511)
Net profit, Group share 3,573 5,648 3,436
Basic Group share of net earnings per share (EUR) 28 7.11 11.27 6.87Number of shares on which the calculation is based 502,395,491 501,309,369 500,283,414
Diluted Group share of net earnings per share (EUR) 28 7.08 11.21 6.83Number of shares on which the calculation is based 504,894,946 503,861,733 503,217,497
2_VA_V4 01/02/2016 10:38 Page20

21Financial Documents - December 31, 2015
CONDENSED CONSOLIDATED FINANCIAL STATEMENTS
CONSOLIDATED STATEMENT OF COMPREHENSIVE GAINS AND LOSSES
(EUR millions) 2015 2014 2013
Net profit before minority interests 4,001 6,105 3,947
Translation adjustments 631 534 (346)Tax impact 135 104 (48)
766 638 (394)
Change in value of available for sale financial assets (32) 494 963Amounts transferred to income statement (91) (3,326) (16)Tax impact 20 184 (35)
(103) (2,648) 912
Change in value of hedges of future foreign currency cash flows (63) (30) 304Amounts transferred to income statement 33 (163) (265)Tax impact 3 57 (17)
(27) (136) 22Gains and losses recognized in equity, transferable to income statement 636 (2,146) 540
Change in value of vineyard land 64 (17) 369Amounts transferred to consolidated reserves - (10) -Tax impact (21) 9 (127)
43 (18) 242
Employee benefit commitments: change in value resulting from actuarial gains and losses 42 (161) 80Tax impact (16) 52 (22)
26 (109) 58Gains and losses recognized in equity, not transferable to income statement 69 (127) 300
Comprehensive income 4,706 3,832 4,787Minority interests (558) (565) (532)
Comprehensive income, Group share 4,148 3,267 4,255
2_VA_V4 01/02/2016 10:38 Page21
22 Financial Documents - December 31, 2015
CONDENSED CONSOLIDATED FINANCIAL STATEMENTS
CONSOLIDATED BALANCE SHEET
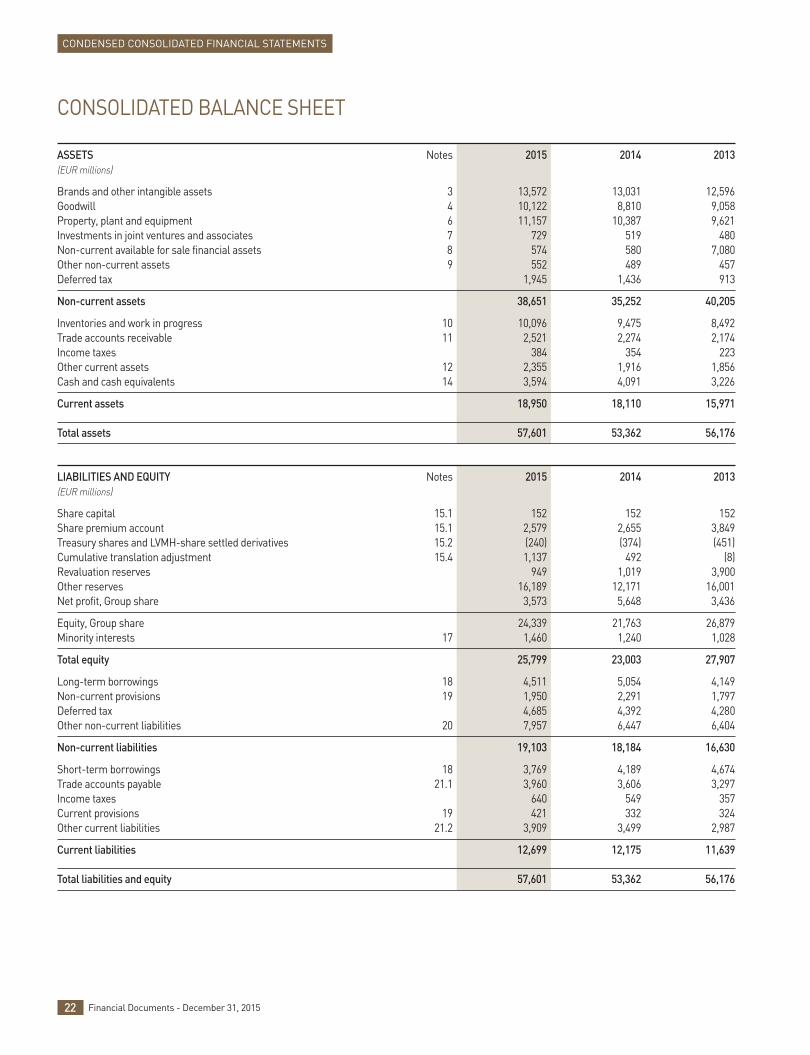
ASSETS Notes 2015 2014 2013(EUR millions)
Brands and other intangible assets 3 13,572 13,031 12,596Goodwill 4 10,122 8,810 9,058Property, plant and equipment 6 11,157 10,387 9,621Investments in joint ventures and associates 7 729 519 480Non-current available for sale financial assets 8 574 580 7,080Other non-current assets 9 552 489 457Deferred tax 1,945 1,436 913
Non-current assets 38,651 35,252 40,205
Inventories and work in progress 10 10,096 9,475 8,492Trade accounts receivable 11 2,521 2,274 2,174Income taxes 384 354 223Other current assets 12 2,355 1,916 1,856Cash and cash equivalents 14 3,594 4,091 3,226
Current assets 18,950 18,110 15,971
Total assets 57,601 53,362 56,176
LIABILITIES AND EQUITY Notes 2015 2014 2013(EUR millions)
Share capital 15.1 152 152 152Share premium account 15.1 2,579 2,655 3,849Treasury shares and LVMH-share settled derivatives 15.2 (240) (374) (451)Cumulative translation adjustment 15.4 1,137 492 (8)Revaluation reserves 949 1,019 3,900Other reserves 16,189 12,171 16,001Net profit, Group share 3,573 5,648 3,436
Equity, Group share 24,339 21,763 26,879Minority interests 17 1,460 1,240 1,028
Total equity 25,799 23,003 27,907
Long-term borrowings 18 4,511 5,054 4,149Non-current provisions 19 1,950 2,291 1,797Deferred tax 4,685 4,392 4,280Other non-current liabilities 20 7,957 6,447 6,404
Non-current liabilities 19,103 18,184 16,630
Short-term borrowings 18 3,769 4,189 4,674Trade accounts payable 21.1 3,960 3,606 3,297Income taxes 640 549 357Current provisions 19 421 332 324Other current liabilities 21.2 3,909 3,499 2,987
Current liabilities 12,699 12,175 11,639
Total liabilities and equity 57,601 53,362 56,176
2_VA_V4 01/02/2016 10:38 Page22

23Financial Documents - December 31, 2015
CONDENSED CONSOLIDATED FINANCIAL STATEMENTS
23
CONSOLIDATED STATEMENT OF CHANGES IN EQUITY
(EUR millions) Number Share Share Treasury Cumulative Revaluation reserves Net profit Total equity of shares capital premium shares and translation and other account LVMH- adjustment Available Hedges Vineyard Employee reserves Group Minority Total share for sale of future land benefit share interests settled financial foreign commit-
derivatives assets currency ments cash flows
Notes 15.1 15.2 15.4 17
As of December 31, 2012 508,163,349 152 3,848 (414) 342 1,943 118 758 (88) 17,765 24,424 1,084 25,508
Gains and losses recognized in equity (350) 912 18 188 51 - 819 21 840Net profit 3,436 3,436 511 3,947
Comprehensive income - - - (350) 912 18 188 51 3,436 4,255 532 4,787Stock option plan and similar expenses 31 31 3 34(Acquisition) / disposal of treasury shares and LVMH-share settled derivatives (103) (7) (110) - (110)Exercise of LVMHshare subscription options 1,025,418 67 67 - 67Retirement of LVMH shares (1,395,106) (66) 66 - - -Capital increase in subsidiaries - 8 8Interim and final dividends paid (1,500) (1,500) (228) (1,728)Acquisition of a controlling interest in Loro Piana - 235 235Changes in control of consolidated entities 1 1 (1) -Acquisition and disposal of minority interests’ shares (73) (73) (76) (149)Purchase commitments for minority interests’ shares (216) (216) (529) (745)As of December 31, 2013 507,793,661 152 3,849 (451) (8) 2,855 136 946 (37) 19,437 26,879 1,028 27,907Gains and losses recognized in equity 500 (2,648) (122) (15) (96) - (2,381) 108 (2,273)Net profit 5,648 5,648 457 6,105
Comprehensive income - - - 500 (2,648) (122) (15) (96) 5,648 3,267 565 3,832Stock option plan and similar expenses 37 37 2 39(Acquisition) / disposal of treasury shares and LVMH-share settled derivatives 27 (17) 10 - 10Exercise of LVMH share subscription options 980,323 59 59 - 59Retirement of LVMH shares (1,062,271) (50) 50 - - -Capital increase in subsidiaries - 3 3Interim and final dividends paid (1,579) (1,579) (328) (1,907)Distribution in kind of Hermès shares. See Note 8. (1,203) (5,652) (6,855) - (6,855)Changes in controlof consolidated entities (5) (5) 11 6Acquisition and disposal of minority interests’ shares (2) (2) 32 30Purchase commitments for minority interests’ shares (48) (48) (73) (121)
As of December 31, 2014 507,711,713 152 2,655 (374) 492 207 14 931 (133) 17,819 21,763 1,240 23,003
Gains and losses recognized in equity 645 (103) (25) 33 25 - 575 130 705Net profit 3,573 3,573 428 4,001Comprehensive income - - - 645 (103) (25) 33 25 3,573 4,148 558 4,706Stock option plan and similar expenses 35 35 2 37(Acquisition) / disposal of treasury shares and LVMH-share settled derivatives 23 (13) 10 - 10Exercise of LVMH share subscription options 552,137 35 35 - 35Retirement of LVMH shares (1,124,740) (111) 111 - - -Capital increase in subsidiaries - 89 89Interim and final dividends paid (1,659) (1,659) (229) (1,888)Changes in control of consolidated entities (9) (9) 1 (8)Acquisition and disposal of minority interests’ shares 5 5 (3) 2Purchase commitments for minority interests’ shares 11 11 (198) (187)
As of December 31, 2015 507,139,110 152 2,579 (240) 1,137 104 (11) 964 (108) 19,762 24,339 1,460 25,799
2_VA_V4 01/02/2016 10:38 Page23

24 Financial Documents - December 31, 2015
CONDENSED CONSOLIDATED FINANCIAL STATEMENTS
CONSOLIDATED CASH FLOW STATEMENT
(EUR millions) Notes 2015 2014 2013
I. OPERATING ACTIVITIES AND OPERATING INVESTMENTSOperating profit 6,384 5,431 5,898Income / (loss) and dividends from joint-ventures and associates 7 27 26 49Net increase in depreciation, amortization and provisions 2,081 1,895 1,435Other computed expenses (456) (188) (29)Other adjustments (91) (84) (76)
Cash from operations before changes in working capital 7,945 7,080 7,277Cost of net financial debt: interest paid (75) (116) (111)Income taxes paid related to interim and final dividends paid by LVMH SE (1,807) (1,639) (1,832)
Net cash from operating activities before changes in working capital 6,063 5,325 5,334Change in working capital 14.1 (429) (718) (620)
Net cash from operating activities 5,634 4,607 4,714Operating investments 14.2 (1,955) (1,775) (1,657)
Net cash from operating activities and operating investments (free cash flow) 3,679 2,832 3,057
II. FINANCIAL INVESTMENTS Purchase of non-current available for sale financial assets 8 (78) (57) (197)Proceeds from sale of non-current available for sale financial assets 8 68 160 38Dividends received 8 4 69 71Income taxes paid related to financial investments (265) (237) (11)Impact of purchase and sale of consolidated investments 2 (240) (167) (2,161)
Net cash from (used in) financial investments (511) (232) (2,260)
III. TRANSACTIONS RELATING TO EQUITY Capital increases of LVMH SE 15.1 35 59 66Capital increases of subsidiaries subscribed by minority interests 17 81 3 7Acquisition and disposals of treasury shares and LVMH-share settled derivatives 15.2 1 1 (113)Interim and final dividends paid by LVMH SE(a) 15.3 (1,671) (1,619) (1,501)Income taxes paid related to interim and final dividends paid (304) (79) (137)Interim and final dividends paid to minority interestsin consolidated subsidiaries 17 (228) (336) (220)Purchase and proceeds from sale of minority interests (4) 10 (150)
Net cash from (used in) transactions relating to equity (2,090) (1,961) (2,048)
Change in cash before financing activities 1,078 639 (1,251)
IV. FINANCING ACTIVITIES Proceeds from borrowings 1,008 2,407 3,095Repayment of borrowings (2,443) (2,100) (1,057)Purchase and proceeds from sale of current available for sale financial assets 13 (3) (106) 101
Net cash from (used in) financing activities (1,438) 201 2,139
V. EFFECT OF EXCHANGE RATE CHANGES (33) 27 47
NET INCREASE (DECREASE) IN CASH AND CASH EQUIVALENTS (I+II+III+IV+V) (393) 867 935
CASH AND CASH EQUIVALENTS AT BEGINNING OF PERIOD 14 3,783 2,916 1,981CASH AND CASH EQUIVALENTS AT END OF PERIOD 14 3,390 3,783 2,916
TOTAL INCOME TAXES PAID (2,376) (1,955) (1,980)
Transactions included in the table above, generating no change in cash: - acquisition of assets by means of finance leases 4 5 7
(a) The distribution in kind of Hermès shares had no impact on cash, apart from related income tax effects. See Note 8.
2_VA_V4 01/02/2016 10:38 Page24

SELECTED NOTES TO THE CONSOLIDATED FINANCIAL STATEMENTS
1. ACCOUNTING POLICIES 262. CHANGES IN THE PERCENTAGE INTEREST IN CONSOLIDATED ENTITIES 343. BRANDS, TRADE NAMES AND OTHER INTANGIBLE ASSETS 354. GOODWILL 365. IMPAIRMENT TESTING OF INTANGIBLE ASSETS
WITH INDEFINITE USEFUL LIVES 366. PROPERTY, PLANT AND EQUIPMENT 377. INVESTMENTS IN JOINT VENTURES AND ASSOCIATES 388. NON-CURRENT AVAILABLE FOR SALE FINANCIAL ASSETS 399. OTHER NON-CURRENT ASSETS 3910. INVENTORIES AND WORK IN PROGRESS 3911. TRADE ACCOUNTS RECEIVABLE 4012. OTHER CURRENT ASSETS 4113. CURRENT AVAILABLE FOR SALE FINANCIAL ASSETS 4114. CASH AND CASH EQUIVALENTS 4215. EQUITY 4316. STOCK OPTION AND SIMILAR PLANS 4517. MINORITY INTERESTS 4618. BORROWINGS 4719. PROVISIONS 4920. OTHER NON-CURRENT LIABILITIES 4921. TRADE ACCOUNTS PAYABLE AND OTHER CURRENT LIABILITIES 5022. FINANCIAL INSTRUMENTS AND MARKET RISK MANAGEMENT 5123. SEGMENT INFORMATION 5424. EXPENSES BY NATURE 5725. OTHER OPERATING INCOME AND EXPENSES 5726. NET FINANCIAL INCOME / (EXPENSE) 5827. INCOME TAXES 5828. EARNINGS PER SHARE 5929. PROVISIONS FOR PENSIONS, CONTRIBUTION TO MEDICAL COSTS
AND OTHER EMPLOYEE BENEFIT COMMITMENTS 5930. OFF-BALANCE SHEET COMMITMENTS 6031. EXCEPTIONAL EVENTS AND LITIGATION 6132. SUBSEQUENT EVENTS 61
25Financial Documents - December 31, 2015
2_VA_V4 01/02/2016 10:38 Page25

Definitions of Profit from recurring operations and Other operating income and expenses
The Group’s main business is the management and developmentof its brands and trade names. Profit from recurring operationsis derived from these activities, whether they are recurring ornon-recurring, core or incidental transactions.
Other operating income and expenses comprise income statementitems which, due to their nature, amount or frequency, maynot be considered as inherent to the Group’s recurring operations.This caption reflects in particular the impact of changes in thescope of consolidation and the impairment of brands, tradenames and goodwill, as well as any significant amount of gains
1.4. Presentation of financial statements
The first accounts prepared by the Group in accordance withIFRS were the financial statements for the year endedDecember 31, 2005, with a transition date of January 1, 2004.IFRS 1 allowed for exceptions to the retrospective applicationof IFRS at the transition date. The procedures implemented by the Group with respect to these exceptions are listed below:
- business combinations: the exemption from retrospectiveapplication was not applied. The recognition of the merger ofMoët Hennessy and Louis Vuitton in 1987 and all subsequent
acquisitions were restated in accordance with IFRS 3; IAS 36Impairment of Assets and IAS 38 Intangible Assets wereapplied retrospectively as of this date;
- foreign currency translation of the financial statements ofsubsidiaries outside the euro zone: translation reserves relatingto the consolidation of subsidiaries that prepare their accountsin foreign currency were reset to zero as of January 1, 2004and offset against “Other reserves”.
1.3. First-time adoption of IFRS
Standards, amendments and interpretations for which application became mandatory in 2015
The standards applicable to LVMH with effect from January 1,2015 are:
- the amendment to IAS 19 relating to the recognition ofemployee contributions to post-employment benefits;
- IFRIC Interpretation 21 on the accounting for levies.
The application of these standards did not have a materialimpact on the Group’s financial statements.
Standards, amendments and interpretations for whichapplication is mandatory with effect from January 1, 2016
The amendments to IAS 16 and IAS 41 for biological assets are the only new standarts applicable to LVMH with effect fromJanuary 1, 2016. The application of these amendments will not have any impact on the Group’s financial statements sinceLVMH does not revalue these assets, given that their marketvalue differs little from their historical cost (see Note 1.13).
Other changes in the accounting framework and standardsfor which application is mandatory with effect later thanJanuary 1, 2016
The Group receives information on the progress of ongoingdiscussions held at IFRIC and IASB related to the recognitionof purchase commitments for minority interests’ shares andchanges in their amount. See Note 1.12 for a description of therecognition method applied by LVMH to these commitments.
The impact of the application of IFRS 15 on revenue recognitionwith effect from January 1, 2018 is being assessed. It should beof little significance in light of the nature of the Group’sbusiness activities. The impact of the application of IFRS 9 onfinancial instruments with effect from January 1, 2018 is alsobeing assessed.
The impact of the application of IFRS 16 related to leases with effect from January 1, 2019 (subject to its adoption byEuropean Union) will be assessed in 2016.
1.2. Changes in the accounting framework applicable to LVMH
The consolidated financial statements for the year endedDecember 31, 2015 were established in accordance with inter -national accounting standards and interpretations (IAS / IFRS)adopted by the European Union and applicable on December 31,2015. These standards and interpretations have been appliedconsistently to the fiscal years presented. The 2015 consolidatedfinancial statements were approved for publication by theBoard of Directors on February 2, 2016.
The consolidated financial statements presented are “condensed”,which means that they only include notes that are significantor facilitate understanding of changes in the Group’s businessactivity and financial position during the year. They areextracted from the consolidated financial statements approvedby the Board of Directors which include all of the notes to the financial statements required under IFRS, as adopted in the European Union.
1. ACCOUNTING POLICIES
1.1. General framework and environment
26 Financial Documents - December 31, 2015
CONDENSED CONSOLIDATED FINANCIAL STATEMENTS
Selected notes to the consolidated financial statements
2_VA_V4 01/02/2016 10:38 Page26

Transactions of consolidated companies denominated in acurrency other than their functional currencies are translated totheir functional currencies at the exchange rates prevailing atthe transaction dates.
Accounts receivable, accounts payable and debts denominatedin currencies other than the entities’ functional currencies are
translated at the applicable exchange rates at the balance sheetdate. Unrealized gains and losses resulting from this translationare recognized:
- within cost of sales in the case of commercial transactions;- within net financial income / expense in the case of financial
transactions.
1.8. Foreign currency transactions and hedging of exchange rate risks
The consolidated financial statements are stated in euros; thefinancial statements of entities stated in a different functionalcurrency are translated into euros:
- at the period-end exchange rates for balance sheet items;
- at the average rates for the period for income statement items.
Translation adjustments arising from the application of theserates are recorded in equity under “Cumulative translationadjustment”.
1.7. Foreign currency translation of the financial statements of entities outside the euro zone
The subsidiaries in which the Group holds a direct or indirectde facto or de jure controlling interest are fully consolidated.
Jointly controlled companies and companies where the Grouphas significant influence but no controlling interest are accountedfor using the equity method. Although jointly controlled,those entities are fully integrated within the Group’s operatingactivities. LVMH now discloses their net profit, as well as that
of entities using the equity method for previous closings (seeNote 7), in a separate line, which forms part of profit fromrecurring operations.
The assets, liabilities, income, and expenses of the Wines andSpirits distribution subsidiaries held jointly with the Diageogroup are consolidated only in proportion to the LVMHgroup’s share of operations (see Note 1.25).
1.6. Methods of consolidation
For the purpose of preparing the consolidated financial statements,measurement of certain balance sheet and income statementitems requires the use of hypotheses, estimates or other forms ofjudgment. This is particularly true of the valuation of intangibleassets (see Note 5), purchase commitments for minority interests(see Note 20) and of the determination of the amount ofprovisions for contingencies and losses (see Note 19) or for
impairment of inventories (see Note 10) and, if applicable,deferred tax assets (see Note 27). Such hypotheses, estimates orother forms of judgment which are undertaken on the basis of the information available, or situations prevalent at the dateof preparation of the financial statements, may prove differentfrom the subsequent actual events.
1.5. Use of estimates
or losses arising on the disposal of fixed assets, restructuring costs,costs in respect of disputes, or any other non-recurring incomeor expense which may otherwise distort the comparability ofprofit from recurring operations from one period to the next.
Cash flow statement
Net cash from operating activities is determined on the basis of operating profit, adjusted for non-cash transactions.Additionally, from December 31, 2014:
- dividends received are presented according to the nature of theunderlying investments; thus, dividends from joint venturesand associates are presented in Net cash from operatingactivities, while dividends from other unconsolidated entitiesare presented in Net cash from financial investments;
- tax paid is presented according to the nature of the transactionfrom which it arises: in Net cash from operating activities for the portion attributable to operating transactions; in Netcash from financial investments for the portion attributableto transactions in available for sale financial assets, notablytax paid on gains from their sale; in Net cash from transactionsrelating to equity for the portion attributable to transactionsin equity, notably distribution taxes arising on the paymentof dividends.
The cash flow statement for the fiscal year ended December 31,2013 has been restated to reflect this new presentation ofdividends received and tax paid (previously presented in Netcash from operating activities).
27Financial Documents - December 31, 2015
CONDENSED CONSOLIDATED FINANCIAL STATEMENTS
Selected notes to the consolidated financial statements
2_VA_V4 01/02/2016 10:38 Page27

Approaches to determining fair value Amounts recorded at balance sheet date
Vineyard land Based on recent transactions in similar assets. See Note 1.13. Note 6
Grape harvests Based on purchase prices for equivalent grapes. See Note 1.16. Note 10
Derivatives Based on market data and according to commonly used valuation models. See Note 1.21. Note 22.4
Borrowings hedged against changes Based on market data and according to commonly used valuation models. in value due to interest rate fluctuations See Note 1.20. Note 18
Liabilities in respect of purchase Generally, based on the market multiples of comparable companies. Note 20commitments for minority interests’ See Note 1.12.shares priced according to fair value
Available for sale financial assets Quoted investments: price quotations at the close of trading Note 8, Note 13 on the balance sheet date. Non-quoted investments: estimated net realizable value, either according to formulas based on market data or based on private quotations. See Note 1.15.
Other current and non-current Using the effective interest rate method. See Note 1.17. Note 9, Note 11, Note 12assets, trade accounts receivable (Loans and receivables)
Trade accounts payable, other current Using the effective interest rate method. Note 20, Note 21and non-current liabilities, excluding commitments to purchase minority interests (Financial liabilities)
Cash and cash equivalents Closing price quotation. See Note 1.18. Note 14
No other asset or liability has been remeasured at market value at the balance sheet date.
Fair value (or market value) is the price that would be obtainedfrom the sale of an asset or paid to transfer a liability in anorderly transaction between market participants.
The assets and liabilities measured at fair value at each balancesheet date are as follows:
1.9. Fair value measurement
28 Financial Documents - December 31, 2015
CONDENSED CONSOLIDATED FINANCIAL STATEMENTS
Selected notes to the consolidated financial statements
Foreign exchange gains and losses arising from the translationor elimination of inter-company transactions or receivables andpayables denominated in currencies other than the entity’sfunctional currency are recorded in the income statement unlessthey relate to long-term inter-company financing transactionswhich can be considered as transactions relating to equity. Inthe latter case, translation adjustments are recorded in equityunder “Cumulative translation adjustment”.
Derivatives which are designated as hedges of commercialtransactions denominated in a currency other than the functionalcurrency of the entity are recognized in the balance sheet attheir market value (see Note 1.9) at the balance sheet date andany change in the market value of such derivatives is recognized:
- within cost of sales for the effective portion of hedges ofreceivables and payables recognized in the balance sheet atthe end of the period;
- within equity (as “Revaluation reserves”) for the effectiveportion of hedges of future cash flows (this part is transferred
to cost of sales at the time of recognition of the hedged assetsand liabilities);
- within net financial income / expense for the ineffective portionof hedges; changes in the value of discount and premiumassociated with forward contracts, as well as in the time valuecomponent of options, are systematically considered asineffective portions.
When derivatives are designated as hedges of subsidiaries’ equitydenominated in a functional currency other than the euro (netinvestment hedge), any change in fair value of the derivatives is recognized within equity under “Cumulative translationadjustment” for the effective portion and within net financialincome / expense for the ineffective portion.
Market value changes of derivatives not designated as hedgesare recorded within net financial income / expense.
See also Note 1.21 regarding the definition of the concepts of effective and ineffective portions.
2_VA_V4 01/02/2016 10:38 Page28

When the Group takes de jure or de facto control of a business,its assets, liabilities and contingent liabilities are estimated at their market value as of the date when control is obtainedand the difference between the cost of taking control and theGroup’s share of the market value of those assets, liabilities andcontingent liabilities is recognized as goodwill.
The cost of taking control is the price paid by the Group in the context of an acquisition, or an estimate of this price if thetransaction is carried out without any payment of cash,excluding acquisition costs which are disclosed under “Otheroperating income and expenses”.
The difference between the carrying amount of minority interestspurchased after control is obtained and the price paid for theiracquisition is deducted from equity.
Goodwill is accounted for in the functional currency of theacquired entity.
Goodwill is not amortized but is subject to annual impairmenttesting using the methodology described in Note 1.14. Anyimpairment expense recognized is included within “Otheroperating income and expenses”.
1.11. Changes in the percentage interest in consolidated entities
Only acquired brands and trade names that are well known andindividually identifiable are recorded as assets based on theirmarket values at their dates of acquisition.
Brands and trade names are chiefly valued using the method ofthe forecast discounted cash flows, or of comparable transactions(i.e. using the revenue and net profit coefficients employed for recent transactions involving similar brands), or of stockmarket multiples observed for related businesses. Othercomplementary methods may also be employed: the relief fromroyalty method, involving equating a brand’s value with thepresent value of the royalties required to be paid for its use; themargin differential method, applicable when a measurabledifference can be identified in the amount of revenue generatedby a branded product in comparison with a similar unbrandedproduct; and finally the equivalent brand reconstitution methodinvolving, in particular, estimation of the amount of advertisingand promotion expenses required to generate a similar brand.
Costs incurred in creating a new brand or developing an existingbrand are expensed.
Brands, trade names and other intangible assets with finiteuseful lives are amortized over their estimated useful lives. Theclassification of a brand or trade name as an asset of definite orindefinite useful life is generally based on the following criteria:
- the brand or trade name’s positioning in its market expressedin terms of volume of activity, international presence andnotoriety;
- its expected long-term profitability;
- its degree of exposure to changes in the economic environment;
- any major event within its business segment liable tocompromise its future development;
- its age.
Amortizable lives of brands and trade names with definite usefullives range from 15 to 40 years, depending on their estimatedperiod of utilization.
Any impairment expense of brands and trade names and, insome cases, amortization expense, are recognized within “Otheroperating income and expenses”.
Impairment tests are carried out for brands, trade names and otherintangible assets using the methodology described in Note 1.14.
Research expenditure is not capitalized. New product developmentexpenditure is not capitalized unless the final decision to launchthe product has been taken.
Intangible assets other than brands and trade names are amortizedover the following periods:
- leasehold rights, key money: based on market conditions,generally over the lease period;
- rights attached to sponsorship agreements and mediapartnerships: over the life of the agreements, depending onhow the rights are used;
- development expenditure: three years at most;
- software: one to five years.
29Financial Documents - December 31, 2015
CONDENSED CONSOLIDATED FINANCIAL STATEMENTS
Selected notes to the consolidated financial statements
1.10. Brands, trade names and other intangible assets
2_VA_V4 01/02/2016 10:38 Page29

Intangible and tangible fixed assets are subject to impairmenttesting whenever there is any indication that an asset may beimpaired, and in any event at least annually in the case ofintangible assets with indefinite useful lives (mainly brands,trade names and goodwill). When the carrying amount of assetswith indefinite useful lives is greater than the higher of theirvalue in use or market value, the resulting impairment loss isrecognized within “Other operating income and expenses”,allocated on a priority basis to any existing goodwill.
Value in use is based on the present value of the cash flowsexpected to be generated by these assets. Market value isestimated by comparison with recent similar transactions or on the basis of valuations performed by independent experts for the purposes of a disposal transaction.
Cash flows are forecast for each business segment, defined as one or several brands or trade names under the responsibility
of a dedicated management team. Smaller scale cash generatingunits, e.g. a group of stores, may be distinguished within aparticular business segment.
The forecast data required for the cash flow method is based onannual budgets and multi-year business plans prepared bymanagement of the related business segments. Detailed forecastscover a five-year period, a period which may be extended in the case of certain brands undergoing strategic repositioning, orwhich have a production cycle exceeding five years. An estimatedterminal value is added to the value resulting from discountedforecast cash flows which corresponds to the capitalization inperpetuity of cash flows most often arising from the last year ofthe plan. When several forecast scenarios are developed, theprobability of occurrence of each scenario is assessed. Forecastcash flows are discounted on the basis of the rate of return to be expected by an investor in the applicable business and anassessment of the risk premium associated with that business.
1.14. Impairment testing of fixed assets
With the exception of vineyard land, the gross value of property,plant and equipment is stated at acquisition cost. Any borrowingcosts incurred prior to the placed-in-service date or during theconstruction period of assets are capitalized.
Vineyard land is recognized at the market value at the balancesheet date. This valuation is based on official published data forrecent transactions in the same region. Any difference comparedto historical cost is recognized within equity in “Revaluationreserves”. If market value falls below acquisition cost theresulting impairment is charged to the income statement.
Vines for champagnes, cognacs and other wines produced by the Group, are considered as biological assets as defined inIAS 41 Agriculture. As their valuation at market value differslittle from that recognized at historical cost, no revaluation isundertaken for these assets.
Buildings mostly occupied by third parties are reported asinvestment property, at acquisition cost. Investment propertyis thus not remeasured at market value.
Assets acquired under finance leases are capitalized on the basisof the lower of their market value and the present value offuture lease payments.
The depreciable amount of property, plant and equipmentcomprises the acquisition cost of their components less residualvalue, which corresponds to the estimated disposal price of the asset at the end of its useful life.
Property, plant and equipment is depreciated on a straight-linebasis over its estimated useful life; the estimated useful livesare as follows:
- buildings, including investment property 20 to 50 years- machinery and equipment 3 to 25 years- leasehold improvements 3 to 10 years- producing vineyards 18 to 25 years
Expenses for maintenance and repairs are charged to the incomestatement as incurred.
1.13. Property, plant and equipment
The Group has granted put options to minority shareholders of certain fully consolidated subsidiaries.
Pending specific guidance from IFRSs regarding this issue, the Group recognizes these commitments as follows:
- the value of the commitment at the balance sheet date appearsin “Other non-current liabilities”;
- the corresponding minority interests are cancelled;
- for commitments granted prior to January 1, 2010, the differencebetween the amount of the commitments and cancelledminority interests is maintained as an asset on the balancesheet under goodwill, as well as subsequent changes in thisdifference. For commitments granted as from January 1, 2010,the difference between the amount of the commitments andminority interests is recorded in equity, under “Other reserves”.
This accounting policy has no effect on the presentation ofminority interests within the income statement.
1.12. Purchase commitments for minority interests
30 Financial Documents - December 31, 2015
CONDENSED CONSOLIDATED FINANCIAL STATEMENTS
Selected notes to the consolidated financial statements
2_VA_V4 01/02/2016 10:38 Page30

Cash and cash equivalents comprise cash and highly liquidmoney-market investments subject to an insignificant risk ofchanges in value over time.
Money-market investments are measured at their market value,based on price quotations at the close of trading and on theexchange rate prevailing at the balance sheet date, with any changesin value recognized as part of net financial income / expense.
1.18. Cash and cash equivalents
Trade accounts receivable, loans and other receivables are recordedat their face value. A provision for impairment is recorded if their net realizable value, based on the probability of theircollection, is less than their carrying amount.
The amount of long-term loans and receivables (i.e. those fallingdue in more than one year) is subject to discounting, the effectsof which are recognized under net financial income / expense,using the effective interest rate method.
1.17. Trade accounts receivable, loans and other receivables
Inventories other than wine produced by the Group are recordedat the lower of cost (excluding interest expense) and netrealizable value; cost comprises manufacturing cost (finishedgoods) or purchase price, plus incidental costs (raw materials,merchandise).
Wine produced by the Group, especially champagne, is measuredon the basis of the applicable harvest market value, which isdetermined by reference to the average purchase price ofequivalent grapes, as if the grapes harvested had been purchasedfrom third parties. Until the date of the harvest, the value ofgrapes is calculated pro rata temporis on the basis of the estimatedyield and market value.
Inventories are valued using the weighted average cost or FIFOmethod, depending on the type of business.
Due to the length of the aging process required for champagneand spirits (cognac, whisky), the holding period for theseinventories generally exceeds one year. However, in accordancewith industry practices, these inventories are classified ascurrent assets.
Provisions for impairment of inventories are chiefly recognizedfor businesses other than Wines and Spirits. They are generallyrequired because of product obsolescence (end of season orcollection, date of expiry, etc.) or lack of sales prospects.
1.16. Inventories and work in progress
Financial assets are classified as current or non-current based ontheir nature.
Non-current available for sale financial assets comprise strategicand non-strategic investments whose estimated period andform of ownership justify such classification.
Current available for sale financial assets include temporaryinvestments in shares, shares of SICAVs, FCPs and othermutual funds, excluding investments made as part of the dailycash management, which are accounted for as “Cash and cashequivalents” (see Note 1.18).
Available for sale financial assets are measured at their listed valueat the balance sheet date in the case of quoted investments, and at their estimated net realizable value at that date in thecase of unquoted investments.
Positive or negative changes in value are taken to equity within“Revaluation reserves”. If an impairment loss is judged to bedefinitive, an impairment is recognized and charged to netfinancial income / expense; the impairment is only reversedthrough the income statement at the time of sale of theunderlying available for sale financial assets.
1.15. Available for sale financial assets
31Financial Documents - December 31, 2015
CONDENSED CONSOLIDATED FINANCIAL STATEMENTS
Selected notes to the consolidated financial statements
2_VA_V4 01/02/2016 10:38 Page31

LVMH shares and options to purchase LVMH shares that areheld by the Group are measured at their acquisition cost andrecognized as a deduction from consolidated equity, irrespectiveof the purpose for which they are held.
In the event of disposal, the cost of the shares disposed of isdetermined by allocation category (see Note 15.2) using theFIFO method with the exception of shares held under stockoption plans for which the calculation is performed for eachplan using the weighted average cost method. Gains and losseson disposal, net of income taxes, are taken directly to equity.
1.22. Treasury shares and LVMH-share-settled derivatives
The Group enters into derivative transactions as part of itsstrategy for hedging foreign exchange and interest rate risks.
IAS 39 subordinates the use of hedge accounting to demonstrationand documentation of the effectiveness of hedging relationshipswhen hedges are implemented and subsequently throughouttheir existence. A hedge is considered to be effective if the ratio of changes in the value of the derivative to changes in the value of the hedged underlying remains within a range of80 to 125%.
Derivatives are recognized in the balance sheet at their marketvalue at the balance sheet date. Changes in their value areaccounted for as described in Note 1.8 in the case of foreignexchange hedges, and as described in Note 1.20 in the case ofinterest rate hedges.
Market value is based on market data and on commonly usedvaluation models and may be confirmed in the case of complexinstruments by reference to values quoted by independentfinancial institutions.
Derivatives with maturities in excess of twelve months aredisclosed as non-current assets and liabilities.
1.21. Derivatives
Borrowings are measured at amortized cost, i.e. nominal value net of premium and issue expenses, which are chargedprogres sively to net financial income / expense using the effectiveinterest method.
In the case of hedging against fluctuations in the value ofborrowings resulting from changes in interest rates, both the hedged amount of borrowings and the related hedginginstruments are measured at their market value at the balancesheet date, with any changes in those values recognized withinnet financial income / expense. Market value of hedged borrowingsis determined using similar methods to those describedhereafter in Note 1.21.
In the case of hedging against fluctuations in future interestpayments, the related borrowings remain measured at theiramortized cost while any changes in value of the effective hedgeportions are taken to equity as part of revaluation reserves.
Changes in value of non-hedging derivatives, and of theineffective portions of hedges, are recognized within net financialincome / expense.
Financial debt bearing embedded derivatives is measured atmarket value; changes in market value are recognized withinnet financial income / expense.
Net financial debt comprises short and long-term borrowings,the market value at the balance sheet date of interest ratederivatives, less the amount at the balance sheet date of currentavailable for sale financial assets, cash and cash equivalents, in addition to the market value at the balance sheet date offoreign exchange derivatives related to any of the aforemen -tioned items.
See also Note 1.21 regarding the definition of the concepts of effective and ineffective portions.
1.20. Borrowings
A provision is recognized whenever an obligation exists towardsa third party resulting in a probable disbursement for theGroup, the amount of which may be reliably estimated.
When execution of its obligation is expected to occur in morethan one year, the provision amount is discounted, the effectsof which are recognized in net financial income / expense usingthe effective interest rate method.
32 Financial Documents - December 31, 2015
CONDENSED CONSOLIDATED FINANCIAL STATEMENTS
Selected notes to the consolidated financial statements
1.19. Provisions
2_VA_V4 01/02/2016 10:38 Page32
Definition of revenue
Revenue mainly comprises retail sale within the Group’s storenetwork and sales through agents and distributors. Sales madein stores owned by third parties are treated as retail transactionsif the risks and rewards of ownership of the inventories areretained by the Group.
Direct sales to customers are made through retail stores inFashion and Leather Goods and Selective Retailing, as well as certain Watches and Jewelry and Perfumes and Cosmeticsbrands. These sales are recognized at the time of purchase byretail customers.
Wholesale sales concern Wines and Spirits, as well as certainPerfumes and Cosmetics and Watches and Jewelry brands. The Group recognizes revenue when title transfers to thirdparty customers, generally upon shipment.
Revenue includes shipment and transportation costs re-billedto customers only when these costs are included in products’selling prices as a lump sum.
Revenue is presented net of all forms of discount. In particular,payments made in order to have products referenced or, in accor -dance with agreements, to participate in advertising campaignswith the distributors, are deducted from related revenue.
Provisions for product returns
Perfumes and Cosmetics and, to a lesser extent, Fashion andLeather Goods and Watches and Jewelry companies may acceptthe return of unsold or outdated products from their customersand distributors.
Where this practice is applied, revenue and the correspondingtrade receivables are reduced by the estimated amount of suchreturns, and a corresponding entry is made to inventories. The estimated rate of returns is based on statistics of historicalreturns.
Businesses undertaken in partnership with Diageo
A significant proportion of revenue for the Group’s Wines and Spirits businesses is generated within the framework ofdistribution agreements with Diageo generally taking the formof shared entities which sell and deliver both groups’ productsto customers. According to those agreements, the assets, liabilities,income, and expenses of such entities are consolidated only inproportion to the Group’s share of operations. The applicationof IFRS 11 from January 1, 2014 did not have any impact onthis method.
1.25. Revenue recognition
The tax expense comprises current tax payable by consolidatedcompanies and deferred tax resulting from temporary differences.
Deferred tax is recognized in respect of temporary differencesarising between the value of assets and liabilities for purposesof consolidation and the value resulting from application of taxregulations.
Deferred tax is measured on the basis of the income tax ratesenacted at the balance sheet date; the effect of changes in ratesis recognized during the periods in which changes are enacted.
Future tax savings from tax losses carried forward are recordedas deferred tax assets on the balance sheet which are impaired if they are deemed not recoverable; only amounts for whichfuture use is deemed probable are recognized.
Deferred tax assets and liabilities are not discounted.
Taxes payable in respect of the distribution of retained earningsof subsidiaries give rise to provisions if distribution is deemedprobable.
1.24. Current and deferred tax
When retirement indemnity plans, pension plans, contributionto medical costs and other commitments entail the payment bythe Group of contributions to third party organizations whichassume the exclusive responsibility for subsequently paying theretirement indemnities, pensions or contribution to medicalcosts, these contributions are expensed in the period in whichthey fall due with no liability recorded on the balance sheet.
When retirement indemnity plans, pension plans, contributionto medical costs and other commitments are to be borne by the Group, a provision is recorded in the balance sheet in theamount of the corresponding actuarial commitment for theGroup. Changes in this provision are recognized as follows:
- the portion related to the cost of services rendered by employeesand net interest for the fiscal year is recognized in profit (loss)from recurring operations for the fiscal year;
- the portion related to changes in actuarial assumptions and to differences between projected and actual data (experienceadjustments) is recognized in gains and losses taken to equity,in accordance with the amendement to IAS 19 applicablefrom January 1, 2013.
If this commitment is either partially or wholly funded bypayments made by the Group to external financial organizations,these dedicated funds are deducted from the actuarialcommitment recorded in the balance sheet.
The actuarial commitment is calculated based on assessmentsthat are specifically designed for the country and the Groupcompany concerned. In particular, these assessments includeassumptions regarding discount rates, salary increases, inflation,life expectancy and staff turnover.
33Financial Documents - December 31, 2015
CONDENSED CONSOLIDATED FINANCIAL STATEMENTS
Selected notes to the consolidated financial statements
1.23. Pensions, contribution to medical costs and other employee benefit commitments
2_VA_V4 01/02/2016 10:38 Page33

See also Note 7 regarding in the percentage interest in joint ventures and associates.
Selective Distribution
In July 2015, Sephora acquired a 95% equity interest in the e-commerce site Luxola, which is present in nine countries ofSouth-East Asia.
Other activities
In October 2015, LVMH acquired a 100% equity interest inLe Parisien-Aujourd’hui en France. The acquisition comprisesthe publishing, printing and sales activities of this newspaperand the weekly Le Parisien Magazine.
2. CHANGES IN THE PERCENTAGE INTEREST IN CONSOLIDATED ENTITIES
Earnings per share are calculated based on the weighted averagenumber of shares in circulation during the period, excludingtreasury shares.
Diluted earnings per share are calculated based on the weightedaverage number of shares before dilution and adding theweighted average number of shares that would result from the
exercise of existing subscription options during the period orany other diluting instrument. It is assumed for the purposesof this calculation that the funds received from the exercise of options, plus the amount not yet expensed for stock optionand similar plans (see Note 1.27), would be employed torepurchase LVMH shares at a price corresponding to theiraverage trading price over the fiscal year.
1.28. Earnings per share
Share purchase and subscription option plans give rise torecognition of an expense based on the amortization of theexpected gain to the beneficiaries calculated according to theBlack & Scholes method on the basis of the closing share priceon the day before the Board Meeting at which the plan isinstituted.
For bonus share plans, the expected gain is calculated on thebasis of the closing share price on the day before the BoardMeeting at which the plan is instituted, less the amount of dividends expected to accrue during the vesting period. A discount may be applied to the value of the bonus sharesthus calculated to account for a period of non-transferability,where applicable.
For all plans, the amortization expense is apportioned on astraight-line basis in the income statement over the vesting period,with a corresponding impact on reserves in the balance sheet.
For cash-settled compensation plans index-linked to the changein LVMH share price, the gain over the vesting period isestimated at each balance sheet date based on the LVMH shareprice at that date, and is charged to the income statement on apro rata basis over the vesting period, with a correspondingbalance sheet impact on provisions. Between that date and the settlement date, the change in the expected gain resultingfrom the change in the LVMH share price is recorded in theincome statement.
1.27. Stock option and similar plans
Advertising and promotion expenses include the costs ofproducing advertising media, purchasing media space, manu -facturing samples and publishing catalogs, and in general, thecost of all activities designed to promote the Group’s brandsand products.
Advertising and promotion expenses are recorded upon receiptor production of goods or upon completion of services rendered.
1.26. Advertising and promotion expenses
34 Financial Documents - December 31, 2015
CONDENSED CONSOLIDATED FINANCIAL STATEMENTS
Selected notes to the consolidated financial statements
2_VA_V4 01/02/2016 10:38 Page34

Translation adjustments arose mainly on intangible assetsrecognized in US dollars and in Swiss francs, based on fluctuationsin the exchange rate between these currencies and the euro by the close of the fiscal year. This affected in particular the
DFS Galleria trade name and the Donna Karan brand, as regardsfluctuations relative to the US dollar and the TAG Heuer and Hublot brands as regards fluctuations relative to the Swiss franc.
35Financial Documents - December 31, 2015
CONDENSED CONSOLIDATED FINANCIAL STATEMENTS
Selected notes to the consolidated financial statements
3. BRANDS, TRADE NAMES AND OTHER INTANGIBLE ASSETS
(EUR millions) 20 15 20 14 20 13
Gross Amortization Net Net Net and impairment
Brands 10,805 (601) 10,204 9,957 9,866Trade names 4,033 (1,663) 2,370 2,155 1,933License rights 94 (76) 18 19 20Leasehold rights 652 (318) 334 344 320Software, websites 1,239 (920) 319 278 235Other 724 (397) 327 278 222
Total 17,547 (3,975) 13,572 13,031 12,596
Of which: assets held under finance leases 14 (14) - - -
Movements during the fiscal year ended December 31, 2015 in the net amounts of brands, trade names and other intangible assetswere as follows:
Gross value Brands Trade names Software, Leasehold Other intangible Total(EUR millions) websites rights assets
As of December 31, 2014 10,519 3,651 1,049 624 694 16,537
Acquisitions - - 119 36 161 316Disposals and retirements - - (19) (23) (41) (83)Changes in the scope of consolidation 26 - 17 4 9 56Translation adjustment 260 382 29 9 28 708Reclassifications - - 44 2 (33) 13
As of December 31, 2015 10,805 4,033 1,239 652 818 17,547
Accumulated amortization Brands Trade names Software, Leasehold Other intangible Totaland impairment websites rights assets (EUR millions)
As of December 31, 2014 (562) (1,496) (771) (280) (397) (3,506)
Amortization expense (19) (1) (133) (40) (104) (297)Impairment expense - - (1) (3) - (4)Disposals and retirements - - 19 9 42 70Changes in the scope of consolidation - - (14) - (4) (18)Translation adjustment (20) (166) (19) (3) (15) (223)Reclassifications - - (1) (1) 5 3
As of December 31, 2015 (601) (1,663) (920) (318) (473) (3,975)
Net carrying amount as of December 31, 2015 10,204 2,370 319 334 345 13,572
2_VA_V4 01/02/2016 10:38 Page35

5. IMPAIRMENT TESTING OF INTANGIBLE ASSETS WITH INDEFINITE USEFUL LIVES
Brands, trade names, and other intangible assets with indefinite useful lives were subject to impairment testing as of December 31, 2015,according to which no significant risk of impairment was identified. See Note 25 regarding the impairment and amortizationexpense recorded during the fiscal year.
Changes in the scope of consolidation in fiscal year 2015 weremainly related to the acquisition of the newspaper Le Parisien-Aujourd’hui en France and the 95% stake in Luxola.
Translation adjustments arose mainly on goodwill recognizedin US dollars and in Swiss francs, based on the appreciation of these currencies relative to the euro by the fiscal year-end.
This affected Benefit, Starboard Cruise Services and DonnaKaran as regards US dollars, and TAG Heuer and Hublot asregards Swiss francs.
Please refer also to Note 20 for goodwill arising on purchasecommitments for minority interests.
36 Financial Documents - December 31, 2015
CONDENSED CONSOLIDATED FINANCIAL STATEMENTS
Selected notes to the consolidated financial statements
4. GOODWILL
(EUR millions) 2015 2014 2013
Gross Impairment Net Net Net
Goodwill arising on consolidated investments 7,944 (1,721) 6,223 6,119 6,199Goodwill arising on purchase commitments for minority interests 3,899 - 3,899 2,691 2,859
Total 11,843 (1,721) 10,122 8,810 9,058
Changes in net goodwill during the fiscal years presented break down as follows:
(EUR millions) 2015 2014 2013
Gross Impairment Net Net Net
As of January 1 10,320 (1,510) 8,810 9,058 7,708
Changes in the scope of consolidation (See Note 2) 111 - 111 81 1,142Changes in purchase commitments for minority interests 1,195 - 1,195 (162) 294Changes in impairment - (116) (116) (209) (57)Translation adjustment 217 (95) 122 42 (29)
As of December 31 11,843 (1,721) 10,122 8,810 9,058
2_VA_V4 01/02/2016 10:38 Page36

37Financial Documents - December 31, 2015
CONDENSED CONSOLIDATED FINANCIAL STATEMENTS
Selected notes to the consolidated financial statements
6. PROPERTY, PLANT AND EQUIPMENT
(EUR millions) 20 15 20 14 20 13
Gross Depreciation Net Net Net and impairment
Land 1,311 (75) 1,236 1,104 1,055Vineyard land and producing vineyards 2,538 (97) 2,441 2,364 2,294Buildings 3,194 (1,509) 1,685 1,430 1,311Investment property 610 (48) 562 632 605Leasehold improvements, machinery and equipment 9,522 (6,346) 3,176 3,014 2,593Assets in progress 759 (4) 755 684 800Other tangible fixed assets 1,727 (425) 1,302 1,159 963
Total 19,661 (8,504) 11,157 10,387 9,621
Of which: assets held under finance leases 291 (199) 92 99 105historical cost of vineyard land and producing vineyards 739 (97) 642 631 537
Movements in property, plant and equipment during the fiscal year break down as follows:
Gross value Vineyard land Land and Investment Leasehold improvements, Assets in Other Total(EUR millions) and producing buildings property machinery and equipment progress tangible vineyards fixed assets Stores Production, Other logistics
As of December 31, 2014 2,455 3,952 679 5,167 1,995 1,238 688 1,592 17,766
Acquisitions 5 241 5 474 102 97 602 213 1,739Change in the market value of vineyard land 64 - - - - - - - 64Disposals and retirements (2) (59) - (347) (43) (81) (2) (33) (567)Changes in the scope of consolidation - 1 - 1 38 15 (29) - 26Translation adjustment - 165 27 302 27 55 34 27 637Other movements, including transfers 16 205 (101) 593 34 (145) (534) (72) (4)
As of December 31, 2015 2,538 4,505 610 6,190 2,153 1,179 759 1,727 19,661
Depreciation Vineyard land Land and Investment Leasehold improvements, Assets in Other Totaland impairment and producing buildings property machinery and equipment progress tangible (EUR millions) vineyards fixed assets Stores Production, Other logistics
As of December 31, 2014 (91) (1,418) (47) (3,194) (1,354) (838) (4) (433) (7,379)
Depreciation expense (6) (160) (3) (787) (128) (118) - (64) (1,266)Impairment expense - (14) - (1) - - (1) - (16)Disposals and retirements - 58 - 344 42 79 1 34 558Changes in the scope of consolidation - (1) - - (37) (13) - - (51)Translation adjustment - (64) (1) (197) (18) (39) - (21) (340)Other movements, including transfers - 15 3 (184) 8 89 - 59 (10)
As of December 31, 2015 (97) (1,584) (48) (4,019) (1,487) (840) (4) (425) (8,504)
Net carrying amount as of December 31, 2015 2,441 2,921 562 2,171 666 339 755 1,302 11,157
2_VA_V4 01/02/2016 10:38 Page37

As of December 31, 2015, investments in joint ventures andassociates consisted primarily of:
• for joint arrangements:
- a 50% equity stake in the Château Cheval Blanc wine estate(Gironde, France), which produces the eponymous Saint-Émilion Grand Cru Classé A;
- a 50% equity stake in De Beers Diamond Jewellers, whosenetwork of boutiques sells the De Beers brand jewelry;
- a 50% equity stake in Montres Dior, which designs andmanufactures Dior watches. See also Note 32.1.
• for other companies:
- a 40% equity stake in Mongoual SA, a real estate companywhich owns an office building in Paris (France), which is thehead office of LVMH Moët Hennessy - Louis Vuitton;
- a 45% equity stake in PT. Sona Topas Tourism Industry Tbk(STTI), an Indonesian retail company, which notably holdsduty-free sales licenses in airports;
- a 46% equity stake in JW Anderson, a London-based ready-to-wear brand acquired in September 2013;
- a 41.7% equity stake in Repossi, an Italian jewelry brand,acquired in November 2015;
- a 35.8% equity stake in L Catterton, an investment fundmanagement company created in December 2015 in partnershipwith Catterton.
7. INVESTMENTS IN JOINT VENTURES AND ASSOCIATES
(EUR millions) 20 15 20 14 20 13
Gross Impairment Net Of which joint Net Of which joint Net Of which joint arrangements arrangements arrangementsShare of net assets of joint venturesand associates as of January 1 519 - 519 351 480 328 483 320
Share of net profit (loss) for the period (13) - (13) (4) (5) (15) (23) (31)Dividends paid (14) - (14) (6) (21) (5) (26) (11)Changes in the scope of consolidation 212 - 212 - 7 - 6 -Capital increases subscribed 3 - 3 3 16 11 38 38Translation adjustment 5 - 5 4 8 4 (17) (3)Other movements, including transfers 17 - 17 5 34 28 19 15
Share of net assets of joint ventures and associates as of December 31 729 - 729 353 519 351 480 328
38 Financial Documents - December 31, 2015
CONDENSED CONSOLIDATED FINANCIAL STATEMENTS
Selected notes to the consolidated financial statements
Other tangible fixed assets include in particular the works of artowned by the Group.
Purchases of property, plant and equipment include investmentsby Sephora, Louis Vuitton, DFS, and Bvlgari in their retailnetworks, investments by Parfums Christian Dior in newcounters, and investments by the champagne houses and Hennessyin their production equipment, as well as investments in realestate for administrative use, sales operations or rental purposes.
Translation adjustments arose mainly on property, plant andequipment recognized in US dollars, based on fluctuations inthe US dollar to euro exchange rate as of December 31, 2015.
The impact of marking vineyard land to market was 1,799 millioneuros as of December 31, 2015 (1,733 million euros as ofDecember 31, 2014; 1,757 million euros as of December 31,2013). See Notes 1.9 and 1.13 on the measurement method for vineyard land.
The market value of investment property, according to appraisalsby independent third parties, was 1 billion euros as ofDecember 31, 2015. The valuation methods used are based onmarket data.
2_VA_V4 01/02/2016 10:38 Page38

39Financial Documents - December 31, 2015
CONDENSED CONSOLIDATED FINANCIAL STATEMENTS
Selected notes to the consolidated financial statements
8. NON-CURRENT AVAILABLE FOR SALE FINANCIAL ASSETS
(EUR millions) 2015 2014 2013
Gross Impairment Net Net Net
Total 777 (203) 574 580 7,080
Non-current available for sale financial assets changed as follows during the fiscal years presented:
(EUR millions) 2015 2014 2013
As of January 1 580 7,080 6,004
Acquisitions 74 50 197Disposals at net realized value (68) (160) (38)Changes in market value (3) 455 941Distribution in kind of Hermès shares - (6,797) -Changes in impairment (22) (12) (5)Changes in the scope of consolidation - - 1Translation adjustment 31 33 (11)Reclassifications (18) (69) (9)
As of December 31 574 580 7,080
9. OTHER NON-CURRENT ASSETS
(EUR millions) 2015 2014 2013
Warranty deposits 273 236 223Derivatives 60 75 68Loans and receivables 187 156 151Other 32 22 15
Total 552 489 457
10. INVENTORIES AND WORK IN PROGRESS
(EUR millions) 2015 2014 2013
Gross Impairment Net Net Net
Wines and eaux-de-vie in the process of aging 4,224 (11) 4,213 4,002 3,717Other raw materials and work in progress 1,471 (336) 1,135 1,273 1,157
5,695 (347) 5,348 5,275 4,874
Goods purchased for resale 1,760 (188) 1,572 1,323 1,163Finished products 3,971 (795) 3,176 2,877 2,455
5,731 (983) 4,748 4,200 3,618
Total 11,426 (1,330) 10,096 9,475 8,492
2_VA_V4 01/02/2016 10:38 Page39

40 Financial Documents - December 31, 2015
CONDENSED CONSOLIDATED FINANCIAL STATEMENTS
Selected notes to the consolidated financial statements
The net change in inventories for the fiscal years presented breaks down as follows:
(EUR millions) 2015 2014 2013
Gross Impairment Net Net Net
As of January 1 10,700 (1,225) 9,475 8,492 7,994
Change in gross inventories 569 - 569 929 769Effect of provision for returns(a) (2) - (2) 12 (5)Impact of marking harvests to market (16) - (16) (7) 2Changes in impairment - (317) (317) (313) (242)Changes in the scope of consolidation 6 - 6 10 292Translation adjustment 459 (78) 381 347 (297)Other, including reclassifications (291) 291 - 5 (21)
As of December 31 11,425 (1,329) 10,096 9,475 8,492
(a) See Note 1.25.
Changes in the scope of consolidation in 2013 were mainly related to the consolidation of Loro Piana.
Translation adjustments arose mainly on inventories recognized in US dollars, based on the appreciation of the US dollar relative to the euro over the fiscal year.
The effects of marking harvests to market on Wines and Spirits’ cost of sales and value of inventory are as follows:
(EUR millions) 2015 2014 2013
Effect of marking the period’s harvest to market 18 24 37Effect of inventory sold during the period (34) (31) (35)
Net effect on cost of sales of the period (16) (7) 2
Net effect on the value of inventory as of period-end 150 166 173
See Notes 1.9 and 1.16 on the method of marking harvests to market.
11. TRADE ACCOUNTS RECEIVABLE
(EUR millions) 2015 2014 2013
Trade accounts receivable, nominal amount 2,820 2,546 2,416Provision for impairment (64) (66) (67)Provision for product returns(a) (235) (206) (175)
Net amount 2,521 2,274 2,174
(a) See Note 1.25.
2_VA_V4 01/02/2016 10:38 Page40

12. OTHER CURRENT ASSETS
(EUR millions) 2015 2014 2013
Current available for sale financial assets 385 253 171Derivatives 297 304 494Tax accounts receivable, excluding income taxes 602 449 355Advances and payments on account to vendors 159 162 173Prepaid expenses 357 313 283Other receivables 555 435 380
Total 2,355 1,916 1,856
Please also refer to Note 13 Current available for sale financial assets and Note 22 Financial instruments and market risk management.
13. CURRENT AVAILABLE FOR SALE FINANCIAL ASSETS
(EUR millions) 2015 2014 2013
Unlisted securities, shares in non-money market SICAVs and funds - - 12Listed securities 385 253 159
Total 385 253 171
Of which: historical cost of current available for sale financial assets 393 180 136
The trade accounts receivable balance is comprised primarily of receivables from wholesalers or agents, who are limited in number and with whom the Group maintains ongoingrelationships for the most part. As of December 31, 2015,
coverage of customer credit risk had been requested frominsurers for the majority of trade receivables, approximately88% of the amount of which was granted, versus 90% fromDecember 31, 2014.
41Financial Documents - December 31, 2015
CONDENSED CONSOLIDATED FINANCIAL STATEMENTS
Selected notes to the consolidated financial statements
The change in trade accounts receivable for the fiscal years presented breaks down as follows:
(EUR millions) 2015 2014 2013
Gross Impairment Net Net Net
As of January 1 2,546 (272) 2,274 2,174 1,972
Changes in gross receivables 46 - 46 30 291Changes in provision for impairment - - - (5) (4)Changes in provision for product returns - (20) (20) (25) (1)Changes in the scope of consolidation 142 (1) 141 5 50Translation adjustment 96 (8) 88 62 (136)Reclassifications (10) 2 (8) 33 2
As of December 31 2,820 (299) 2,521 2,274 2,174
2_VA_V4 01/02/2016 10:38 Page41

14. CASH AND CASH EQUIVALENTS
(EUR millions) 2015 2014 2013
Fixed term deposits (less than 3 months) 808 1,270 809SICAV and FCP money market funds 577 784 538Ordinary bank accounts 2,209 2,037 1,879
Cash and cash equivalents per balance sheet 3,594 4,091 3,226
The reconciliation between cash and cash equivalents as shown in the balance sheet and net cash and cash equivalents appearing inthe cash flow statement is as follows:
(EUR millions) 2015 2014 2013
Cash and cash equivalents 3,594 4,091 3,226Bank overdrafts (204) (308) (310)
Net cash and cash equivalents per cash flow statement 3,390 3,783 2,916
14.1. Change in working capital
The change in working capital breaks down as follows for the fiscal years presented:
(EUR millions) Notes 2015 2014 2013
Change in inventories and work in progress 10 (569) (928) (769)Change in trade accounts receivable(a) 11 (49) (22) (288)Change in trade accounts payable 21 93 176 203Change in other receivables and payables 96 56 234
Change in working capital(b) (429) (718) (620)
(a) Including a negative effect of 3 million euros related to amounts owed to customers (8 million euros as of December 31, 2014; 1 million euros as of December 31, 2013).(b) Increase / (Decrease) in cash and cash equivalents.
The market value of current available for sale financial assets isdetermined using the methods described in Note 1.9. See alsoNote 22.2 for the breakdown of these assets according to the
measurement methods used and Note 1.15 for the methodused to determine impairment losses on current available forsale financial assets.
42 Financial Documents - December 31, 2015
CONDENSED CONSOLIDATED FINANCIAL STATEMENTS
Selected notes to the consolidated financial statements
The net value of current available for sale financial assets changed as follows during the periods presented:
(EUR millions) 2015 2014 2013
As of January 1 253 171 177
Acquisitions 377 - -Disposals at net realized value (241) (15) (27)Changes in market value (29) 39 22Changes in impairment 7 - -Changes in the scope of consolidation - - -Translation adjustment - - (1)Reclassifications 18 58 -
As of December 31 385 253 171
2_VA_V4 01/02/2016 10:38 Page42

Changes in the share capital and share premium account, in value and in terms of number of shares, break down as follows:
(EUR millions) 2015 2014 2013
Number Amount Amount Amount
Share Share premium Total capital account
As of January 1 507,711,713 152 2,655 2,807 4,001 4,000
Exercise of share subscription options 552,137 - 35 35 59 67Distribution in kind of Hermès shares - - - - (1,203) -Retirement of shares (1,124,740) - (111) (111) (50) (66)
As of December 31 507,139,110 152 2,579 2,731 2,807 4,001
As of December 31, 2015, issued and fully paid-up shares totaled507,139,110 (507,711,713 shares as of December 31, 2014and 507,793,661 shares as of December 31, 2013), with a parvalue of 0.30 euros per share, including 229,780,453 shares with
double voting rights (226,167,633 as of December 31, 2014and 224,907,923 as of December 31, 2013). Double votingrights are attached to registered shares held for more than three years.
14.2. Operating investments
Operating investments comprise the following elements for the fiscal years presented:
(EUR millions) Notes 2015 2014 2013
Purchase of intangible fixed assets 3 (316) (316) (253)Purchase of tangible fixed assets 6 (1,739) (1,532) (1,581)Changes in accounts payable related to fixed asset purchases 81 78 108
Net cash used in purchases of fixed assets(a) (1,974) (1,770) (1,726)Net cash from fixed assets disposals(a) 41 45 98Guarantee deposits paid and other cash flows related to operating investments (22) (50) (29)
Operating investments (1,955) (1,775) (1,657)
(a) Increase / (Decrease) in cash and cash equivalents.
15. EQUITY
15.1. Share capital and share premium account
43Financial Documents - December 31, 2015
CONDENSED CONSOLIDATED FINANCIAL STATEMENTS
Selected notes to the consolidated financial statements
2_VA_V4 01/02/2016 10:38 Page43

(EUR millions, except for data per share in EUR) 2015 2014 2013
Interim dividend for the current fiscal year (2015: 1,35 euro; 2014: 1,25 euro; 2013: 1,10 euro) 685 634 609Distribution in kind of Hermès shares - 6,855 -Impact of treasury shares (6) (7) (9)
Gross amount disbursed for the fiscal year 679 7,482 600
Final dividend for the previous fiscal year (2014: 1.95 euro; 2013: 1.90 euro; 2012: 1.80 euro) 998 965 914Impact of treasury shares (18) (13) (14)
Gross amount disbursed for the previous fiscal year 980 952 900
Total gross amount disbursed during the period(a) 1,659 8,434 1,500
(a) Excludes the impact of tax regulations applicable to the beneficiary.
In accordance with French regulations, dividends are takenfrom the profit for the fiscal year and reserves available fordistribution of the parent company, after deducting applicablewithholding tax and the value attributable to treasury shares.
As of December 31, 2015, the amount available for distributionwas 13,501 million euros; after taking into account the proposeddividend distribution in respect of the 2015 fiscal year, theamount available for distribution is 12,385 million euros.
44 Financial Documents - December 31, 2015
CONDENSED CONSOLIDATED FINANCIAL STATEMENTS
Selected notes to the consolidated financial statements
15.2. LVMH treasury shares
The portfolio of LVMH treasury shares is allocated as follows:
(EUR millions) 2015 2014 2013
Number Amount Amount Amount
Share subscription option plans 2,979,961 140 156 203Share purchase option plans - - - -Bonus share plans 1,264,960 86 102 101Other plans - - 8 39
Shares held for stock option and similar plans(a) 4,244,921 226 266 343
Liquidity contract 95,000 14 13 13Shares pending retirement - - 95 95
LVMH shares 4,339,921 240 374 451
(a) See Note 16 regarding stock option and similar plans.
“Other plans” correspond to future plans.
The market value of LVMH shares held under the liquidity contract as of December 31, 2015 amounts to 14 million euros.
The portfolio movements of LVMH treasury shares in fiscal year 2015 were as follows:
(EUR millions) Number Amount Effect on cash
As of December 31, 2014 5,851,370 374
Share purchases 1,799,806 281 (281)Bonus shares definitively allocated (386,709) (24) -Retirement of shares (1,124,740) (111) -Proceeds from disposal at net realized value (1,799,806) (283) 282Gain / (loss) on disposal - 3 -
As of December 31, 2015 4,339,921 240 1
15.3. Dividends paid by the parent company LVMH SE
2_VA_V4 01/02/2016 10:38 Page44

15.4. Cumulative translation adjustment
The change in the translation adjustment recognized under equity, Group share net of hedging effects of net assets denominated in foreign currency, breaks down as follows by currency:
(EUR millions) 2015 Change 2014 2013
US dollar 486 339 147 (203)Swiss franc 733 283 450 406Japanese yen 79 27 52 52Hong Kong dollar 454 228 226 (15)Pound sterling 36 42 (6) (52)Other currencies (133) (54) (79) (67)Foreign currency net investment hedges (518) (220) (298) (129)
Total, Group share 1,137 645 492 (8)
16. STOCK OPTION AND SIMILAR PLANS
16.1. Share subscription option plans
The number of unexercised purchase options and the weighted average exercise price changed as follows during the fiscal yearspresented:
20 15 20 14 20 13
Number Weighted average Number Weighted average Number Weighted average exercise price exercise price exercise price (EUR) (EUR) (EUR)
Share subscription options outstanding as of January 1 3,384,313 66.15 4,177,489 69.97 5,229,396 68.86
Options expired (11,026) 55.46 (152,815) 58.42 (26,489) 63.56Adjustments made following the distribution in kind of Hermès shares - - 339,962 (7.33) - -Options exercised (552,137) 63.06 (980,323) 60.71 (1,025,418) 64.52
Share subscription options outstanding as of December 31 2,821,150 55.68 3,384,313 66.15 4,177,489 69.97
45Financial Documents - December 31, 2015
CONDENSED CONSOLIDATED FINANCIAL STATEMENTS
Selected notes to the consolidated financial statements
The final dividend for fiscal year 2015, as proposed to theShareholders’ Meeting of April 14, 2016, is 2.20 euros per share,representing a total amount of 1,116 million euros, excluding
the amount to be deducted in relation to treasury shares held at date of payment.
2_VA_V4 01/02/2016 10:38 Page45

17. MINORITY INTERESTS
(EUR millions) 2015 2014 2013
As of January 1 1,240 1,028 1,084
Minority interests’ share of net profit 428 457 511Dividends paid to minority interests (229) (328) (228)
Effects of changes in control of consolidated entities:- consolidation of Loro Piana - - 235- other movements 1 11 (1)
Effects of acquisition and disposal of minority interests’ shares:- acquisition of minority interests in Château d’Yquem - - (51)- other movements (3) 32 (25)
Total effects of changes in the percentage interest in consolidated entities (2) 43 158
Capital increases subscribed by minority interests 89 3 8Minority interests’ share in gains and losses recognized in equity 130 108 21Minority interests’ share in stock option plan expenses 2 2 3Effects of changes in minority interests subject to purchase commitments (198) (73) (529)
As of December 31 1,460 1,240 1,028
See Note 1.27 regarding the method used to determine theaccounting expense.
The LVMH share closing price the day before the grant date of the plan amounted to 171.20 euros for the plan institutedon April 16, 2015 and 158.05 euros for the plan instituted onOctober 22, 2015.
At the time of these allocations, the average unit value of non-vested bonus shares granted in 2015 was 146.96 euros for beneficiaries who are French residents for tax purposes and 144.94 euros for beneficiaries with their tax residenceoutside France.
46 Financial Documents - December 31, 2015
16.2. Bonus share plans
The number of subscription options not exercised changed as follows over the course of the fiscal years presented:
(number of shares) 2015 2014 2013
Non-vested shares as of January 1 1,492,627 1,484,118 1,273,136
Non-vested allocations during the period 388,794 368,548 436,434Adjustment made following the distribution in kind of Hermès shares - 159,417 -Allocations vested during the period (386,709) (478,278) (193,440)Allocations expired during the period (38,644) (41,178) (32,012)
Non-vested shares as of December 31 1,456,068 1,492,627 1,484,118
Vested share allocations were settled in existing shares held.
16.3. Expense for the period
(EUR millions) 2015 2014 2013
Expense for the period for share subscription option plans and bonus share plans 37 39 34
CONDENSED CONSOLIDATED FINANCIAL STATEMENTS
Selected notes to the consolidated financial statements
2_VA_V4 01/02/2016 10:38 Page46

In 2015, the 250 million euro and 500 million euro bondsissued in 2009 and 2011 respectively, and the 200 millionSwiss franc bond issued in 2008 were repaid.
Net financial debt does not take into consideration purchasecommitments for minority interests included in “Other non-current liabilities” (see Note 20).
18. BORROWINGS
18.1. Net financial debt
(EUR millions) 2015 2014 2013
Bonds and Euro Medium Term Notes (EMTN) 4,202 4,794 3,866Bank borrowings and finance lease 309 260 283
Long term borrowings 4,511 5,054 4,149
Bonds and Euro Medium Term Notes (EMTN) 710 925 1,013Commercial paper 2,281 2,004 2,348Bank overdrafts 204 308 310Other short term borrowings 574 952 1,003
Short term borrowings 3,769 4,189 4,674
Gross amount of borrowings 8,280 9,243 8,823
Interest rate risk derivatives (66) (94) (117)
Gross borrowings after derivatives 8,214 9,149 8,706
Current available for sale financial assets (385) (253) (171)Cash and cash equivalents (3,594) (4,091) (3,226)
Net financial debt 4,235 4,805 5,309
Minority interests are composed primarily of Diageo’s 34%stake in Moët Hennessy. Diageo’s stake in Moët Hennessy maybe assessed using the revenue, operating profit, and core assetsof the Wines and Spirits business group, which are presentedin Note 23. Since the 34% stake held by Diageo in MoëtHennessy is subject to a purchase commitment, it is reclassified
at year-end under Other non-current liabilities and is thereforeexcluded from the total amount of minority interests at thefiscal year-end date. See Notes 1.12 and 20.
There is also a minority interest of 39% held by Mr. Miller inDFS, which is part of the Selective Retailing business group.
The change in minority interests’ share in gains and losses recognized in equity breaks down as follows:
(EUR millions) Cumulative Hedges of Vineyard Revaluation Total share translation future foreign land adjustments of minority adjustment currency of employee interests cash flows benefits
As of December 31, 2012 (35) 11 162 (16) 122Changes for the fiscal year (44) 4 54 7 21
As of December 31, 2013 (79) 15 216 (9) 143Changes for the fiscal year 138 (14) (3) (13) 108
As of December 31, 2014 59 1 213 (22) 251Changes for the period 121 (2) 10 1 130
As of December 31, 2015 180 (1) 223 (21) 381
47Financial Documents - December 31, 2015
CONDENSED CONSOLIDATED FINANCIAL STATEMENTS
Selected notes to the consolidated financial statements
2_VA_V4 01/02/2016 10:38 Page47

48 Financial Documents - December 31, 2015
CONDENSED CONSOLIDATED FINANCIAL STATEMENTS
Selected notes to the consolidated financial statements
18.2. Analysis of gross borrowings by payment date and by type of interest rate
(EUR millions) Gross Effects Gross borrowings borrowings of derivatives after derivatives
Fixed Floating Total Fixed Floating Total Fixed Floating Total rate rate rate rate rate rate
Maturity: 2016 2,767 1,002 3,769 1 (6) (5) 2,768 996 3,7642017 1,443 65 1,508 (1,408) 1,384 (24) 35 1,449 1,4842018 596 - 596 - (5) (5) 596 (5) 5912019 714 300 1,014 (351) 339 (12) 363 639 1,0022020 607 - 607 (401) 394 (7) 206 394 6002021 664 - 664 (650) 637 (13) 14 637 651
Thereafter 122 - 122 - - - 122 - 122
Total 6,913 1,367 8,280 (2,809) 2,743 (66) 4,104 4,110 8,214
See Note 22.3 regarding the market value of interest rate risk derivatives.
The breakdown by quarter of gross borrowings falling due in 2016 is as follows:
(EUR millions) Falling due in 2016
First quarter 2,569Second quarter 385Third quarter 718Fourth quarter 97Total 3,769
18.3. Analysis of gross borrowings by currency after derivatives
(EUR millions) 2015 2014 2013
Euro 6,302 7,033 6,899US dollar 366 226 106Swiss franc 909 995 970Japanese yen 228 229 222Other currencies 409 666 509
Total 8,214 9,149 8,706
In general, the purpose of foreign currency borrowings is to hedge the net foreign currency-denominated assets of consolidatedcompanies located outside of the euro zone.
2_VA_V4 01/02/2016 10:38 Page48

20. OTHER NON-CURRENT LIABILITIES
(EUR millions) 2015 2014 2013
Purchase commitments for minority interests 7,421 6,008 6,035Derivatives (see Note 22) 2 16 51Employee profit sharing 93 88 85Other liabilities 441 335 233
Total 7,957 6,447 6,404
Provisions for contingencies and losses correspond to the estimateof the impact on assets and liabilities of risks, disputes, oractual or probable litigation arising from the Group’s activities;such activities are carried out worldwide, within what is oftenan imprecise regulatory framework that is different for eachcountry, changes over time, and applies to areas ranging fromproduct composition to the tax computation.
In particular, the Group’s entities in France and abroad may besubject to tax inspections and, in certain cases, to rectificationclaims from local administrations. These rectification claims,together with any uncertain tax positions that have beenidentified but not yet officially reassessed, give rise to appropriateprovisions, the amount of which is regularly reviewed inaccordance with the criteria of IAS 37 Provisions and IAS 12Income Taxes. Changes in provisions mainly reflect theresolution of certain discussions with the tax authorities,customs or others, both in France and abroad.
19. PROVISIONS
(EUR millions) 2015 2014 2013
Provisions for pensions, medical costs and similar commitments 632 640 452Provisions for contingencies and losses 1,297 1,618 1,332Provisions for reorganization 21 33 13
Non-current provisions 1,950 2,291 1,797
Provisions for pensions, medical costs and similar commitments 4 3 5Provisions for contingencies and losses 353 314 291Provisions for reorganization 64 15 28
Current provisions 421 332 324
Total 2,371 2,623 2,121
In fiscal year 2015, the changes in provisions were as follows:
(EUR millions) Dec. 31, Increases Amounts Amounts Changes in Other items Dec. 31, 20 14 used released the scope of (including 2015 consolidation translation adjustment)
Provisions for pensions, medical costs and similar commitments 643 104 (91) (9) 10 (21) 636Provisions for contingencies and losses 1,932 411 (636) (105) 9 39 1,650Provisions for reorganization 48 74 (47) (4) 12 2 85
Total 2,623 589 (774) (118) 31 20 2,371
of which: profit from recurring operations 354 (179) (85) net financial income (expense) 6 - - other 229 (595) (33)
49Financial Documents - December 31, 2015
CONDENSED CONSOLIDATED FINANCIAL STATEMENTS
Selected notes to the consolidated financial statements
2_VA_V4 01/02/2016 10:38 Page49

21. TRADE ACCOUNTS PAYABLE AND OTHER CURRENT LIABILITIES
21.1. Trade accounts payable
The change in trade accounts payable breaks down follows:
(EUR millions) 2015 2014 2013
As of January 1 3,606 3,297 3,118
Changes in trade accounts payable 93 176 203Changes in credit trade accounts receivable (3) 8 1Changes in the scope of consolidation 129 5 112Translation adjustment 133 109 (99)Reclassifications 2 11 (38)
As of December 31 3,960 3,606 3,297
21.2. Other current liabilities
(EUR millions) 2015 2014 2013
Derivatives (see Note 22) 185 274 76Employees and social institutions 1,260 1,110 1,007Employee profit sharing 98 74 84Taxes other than income taxes 553 458 405Advances and payments on account from customers 205 184 158Deferred payment for tangible and financial non-current assets 504 433 404Deferred income 208 190 156Other liabilities 896 776 697
Total 3,909 3,499 2,987
50 Financial Documents - December 31, 2015
CONDENSED CONSOLIDATED FINANCIAL STATEMENTS
Selected notes to the consolidated financial statements
As of December 31, 2015, 2014 and 2013, purchase commit -ments for minority interests mainly include the put optiongranted to Diageo plc for its 34% share in Moët Hennessy,with six-months’ advance notice and for 80% of the fair valueof Moët Hennessy at the exercise date of the commitment.With regard to this commitment’s valuation, the fair value wasdetermined by applying the share price multiples of comparablefirms to Moët Hennessy’s consolidated operating results.
Moët Hennessy SNC and Moët Hennessy International SAS(“Moët Hennessy”) hold the LVMH group’s investments in theWines and Spirits businesses, with the exception of the equityinvestments in Château d’Yquem, Château Cheval Blanc andClos des Lambrays, and excluding certain Champagne vineyards.
Purchase commitments for minority interests also includecommitments relating to minority shareholders in Loro Piana(20%, see Note 2), Ile de Beauté (35%), Heng Long (35%) anddistribution subsidiaries in various countries, mainly in theMiddle East.
2_VA_V4 01/02/2016 10:38 Page50

22.2. Summary of derivatives
Derivatives are recorded in the balance sheet for the amounts and in the captions detailed as follows:
(EUR millions) Notes 2015 2014 2013
Interest rate risk Assets: non-current 57 61 67current 14 42 68
Liabilities: non-current - (3) (9)current (5) (6) (9)
22.3 66 94 117
Foreign exchange risk Assets: non-current 3 14 1current 283 217 389
Liabilities: non-current (2) (13) (42)current (178) (268) (60)
22.4 106 (50) 288
Other risks Assets: non-current - - -current - 45 37
Liabilities: non-current - - -current (2) - (7)
(2) 45 30
Total Assets: non-current 9 60 75 68current 12 297 304 494
Liabilities: non-current 20 (2) (16) (51)current 21 (185) (274) (76)
170 89 435
Financial instruments are mainly used by the Group to hedgerisks arising from Group activity and protect its assets.
The management of foreign exchange and interest rate risk, inaddition to transactions involving shares and financial instruments,is centralized.
The Group has implemented a stringent policy, as well asrigorous management guidelines to manage, measure, andmonitor these market risks.
These activities are organized based on a segregation of dutiesbetween risk measurement, hedging (front office), administration(back office) and financial control.
The backbone of this organization is an integrated informationsystem which allows hedging transactions to be monitoredquickly.
The Group’s hedging strategy is presented to the AuditCommittee. Hedging decisions are made according to anestablished process that includes regular presentations to theGroup’s Executive Committee and detailed documentation.
Counterparties are selected based on their rating and inaccordance with the Group’s risk diversification strategy.
22. FINANCIAL INSTRUMENTS AND MARKET RISK MANAGEMENT
22.1. Organization of foreign exchange, interest rate and equity market risk management
51Financial Documents - December 31, 2015
CONDENSED CONSOLIDATED FINANCIAL STATEMENTS
Selected notes to the consolidated financial statements
2_VA_V4 01/02/2016 10:38 Page51

A significant part of Group companies’ sales to customers andto their own retail subsidiaries as well as certain purchases aredenominated in currencies other than their functional currency;the majority of these foreign currency-denominated cash flowsare inter-company cash flows. Hedging instruments are used to reduce the risks arising from the fluctuations of currenciesagainst the exporting and importing companies’ functionalcurrencies and are allocated to either accounts receivable oraccounts payable (fair value hedges) for the fiscal year, or totransactions anticipated for future periods (cash flow hedges).
Future foreign currency-denominated cash flows are brokendown as part of the budget preparation process and are hedgedprogressively over a period not exceeding one year unless alonger period is justified by probable commitments. As such,and according to market trends, identified foreign exchangerisks are hedged using forward contracts or options.
In addition, the Group may also use appropriate financialinstruments to hedge the net worth of subsidiaries outsidethe euro zone, in order to limit the impact of foreign currencyfluctuations against the euro on consolidated equity.
Derivatives used to manage interest rate risk outstanding as of December 31, 2015 break down as follows:
(EUR millions) Nominal amounts by maturity Market value(a) (b)
Less than One to More than Total Fair value Not Total one year five years five years hedges allocated
Interest rate swaps in euros, floating rate payer - 2,808 - 2,808 62 - 62Foreign currency swaps 332 1,242 - 1,574 2 1 3Other interest rate risk derivatives 500 184 - 684 - 1 1
Total 64 2 66
(a) Gain / (Loss).(b) See Note 1.9 regarding the methodology used for market value measurement.
22.4. Derivatives used to manage foreign exchange risk
The aim of the Group’s debt management policy is to adaptthe debt maturity profile to the characteristics of the assetsheld, to contain borrowing costs, and to protect net profit fromthe effects of significant changes in interest rates.
For these purposes, the Group uses interest rate swaps andoptions.
22.3. Derivatives used to manage interest rate risk
52 Financial Documents - December 31, 2015
CONDENSED CONSOLIDATED FINANCIAL STATEMENTS
Selected notes to the consolidated financial statements
2_VA_V4 01/02/2016 10:38 Page52

The Group’s investment policy is designed to take advantage of a long-term investment horizon. Occasionally, the Groupmay invest in equity-based financial instruments with the aim ofenhancing the dynamic management of its investment portfolio.
The Group is exposed to risks of share price changes eitherdirectly, as a result of its holding of equity investments andcurrent available for sale financial assets, or indirectly, as a resultof its holding of funds which are themselves partially investedin shares.
The Group may also use equity-based derivatives to createsynthetically an economic exposure to certain assets, or to hedgecash-settled compensation plans index-linked to the LVMHshare price. If applicable, the carrying amount of these unlistedfinancial instruments corresponds to the estimate of the amount,provided by the counterparty, of the valuation at the balancesheet date. The valuation of financial instruments thus takesinto consideration market parameters such as interest rates andshare prices.
Derivatives used to manage foreign exchange risk outstanding as of December 31, 2015 break down as follows:
(EUR millions) Nominal amounts by fiscal year of allocation Market value(a)(b)
20 15 2016 Beyond Total Fair value Future Foreign Not Total hedges cash flow currency net allocated hedges investment hedges
Options purchasedPut USD 86 136 - 222 - 1 - - 1Put JPY 19 - - 19 - - - - -Put GBP - - - - - - - - -Other - - - - - - - - -
105 136 - 241 - 1 - - 1
CollarsWritten USD 7 4,069 - 4,076 - 19 - - 19Written JPY 9 747 - 756 - 8 - - 8Written Other 30 179 - 209 (1) 7 - - 6
46 4,995 - 5,041 (1) 34 - - 33
Forward exchange contracts(c)
USD (7) (10) (2) (19) 2 2 - - 4JPY (37) (18) - (55) 3 2 - 1 6GBP 4 10 - 14 1 - - - 1Other 56 (11) - 45 2 - - - 2
16 (29) (2) (15) 8 4 - 1 13
Foreign exchange swaps(c)
USD 3,402 - - 3,402 (47) - 103 - 56CHF 425 - - 425 (2) - (27) - (29)GBP 287 - - 287 10 - 37 - 47JPY 302 - - 302 (5) 1 (1) - (5)HKD 180 - - 180 - - (9) - (9)Other 847 50 12 909 2 - (3) - (1)
5,443 50 12 5,505 (42) 1 100 - 59
Total (35) 40 100 1 106
(a) Gain / (Loss).(b) See Note 1.9 regarding the methodology used for market value measurement.(c) Sale / (Purchase).
22.5. Financial instruments used to manage other risks
53Financial Documents - December 31, 2015
CONDENSED CONSOLIDATED FINANCIAL STATEMENTS
Selected notes to the consolidated financial statements
2_VA_V4 01/02/2016 10:39 Page53

23.1. Information by business group
Fiscal year 2015
(EUR millions) Wines and Fashion and Perfumes Watches Selective Other and Eliminations Total Spirits Leather and and Retailing holding and not Goods Cosmetics Jewelry companies allocated(a)
Sales outside the Group 4,575 12,333 3,867 3,250 11,206 433 - 35,664Intra-Group sales 28 36 650 58 27 15 (814) -
Total revenue 4,603 12,369 4,517 3,308 11,233 448 (814) 35,664
Profit from recurring operations 1,363 3,505 525 432 934 (154) - 6,605Other operating income and expenses (15) (154) (3) (31) (8) (10) - (221)Depreciation and amortization expense (132) (641) (183) (199) (366) (42) - (1,563)Impairment expense (15) (96) (1) - (5) (19) - (136)
Intangible assets and goodwill(b) 4,900 7,207 1,231 5,850 3,560 946 - 23,694Property, plant and equipment 2,484 2,125 525 501 1,550 3,972 - 11,157Inventories 4,795 1,566 447 1,361 1,909 230 (212) 10,096Other operating assets 1,392 874 782 731 761 920 7,194(c) 12,654
Total assets 13,571 11,772 2,985 8,443 7,780 6,068 6,982 57,601
Equity - - - - - - 25,799 25,799Liabilities 1,426 2,451 1,400 922 2,425 1,131 22,047(d) 31,802
Total liabilities and equity 1,426 2,451 1,400 922 2,425 1,131 47,846 57,601
Operating investments(e) (233) (553) (229) (204) (399) (337) - (1,955)
The Group’s brands and trade names are organized into sixbusiness groups. Four business groups – Wines and Spirits,Fashion and Leather Goods, Perfumes and Cosmetics andWatches and Jewelry – comprise brands dealing with the samecategory of products that use similar production and distributionprocesses. The Selective Retailing business comprises the Group’s
own-label retailing activities. Other activities and holdingcompanies comprise brands and businesses that are not associatedwith any of the above mentioned business groups, most oftenrelating to the Group’s new businesses and holding or realestate companies.
23. SEGMENT INFORMATION
The Group, mainly through its Watches and Jewelry businessgroup, may be exposed to changes in the prices of certainprecious metals, such as gold. In certain cases, in order to ensurevisibility with regard to production costs, hedges may beimplemented. This is achieved either by negotiating the forecastprice of future deliveries of alloys with precious metal refiners,or the price of semi-finished products with producers; ordirectly by purchasing hedges from top-ranking banks. In thelatter case, gold may be purchased from banks, or future and / or
options contracts may be taken out with a physical delivery of the gold. Derivatives outstanding relating to the hedging ofprecious metal prices as of December 31, 2015 have a negativemarket value of 2 million euros. Considering nominal values of 145 million euros for those derivatives, a uniform 1% changein their underlying assets’ prices as of December 31, 2015 wouldhave a net impact on the Group’s consolidated reserves in anamount of less than 1.5 million euros. These instruments maturein 2016.
54 Financial Documents - December 31, 2015
CONDENSED CONSOLIDATED FINANCIAL STATEMENTS
Selected notes to the consolidated financial statements
2_VA_V4 01/02/2016 10:39 Page54

Fiscal year 2014
(EUR millions) Wines and Fashion and Perfumes Watches Selective Other and Eliminations Total Spirits Leather and and Retailing holding and not Goods Cosmetics Jewelry companies allocated(a)
Sales outside the Group 3,945 10,796 3,368 2,720 9,511 298 - 30,638Intra-Group sales 28 32 548 62 23 14 (707) -
Total revenue 3,973 10,828 3,916 2,782 9,534 312 (707) 30,638
Profit from recurring operations 1,147 3,189 415 283 882 (162) (39) 5,715Other operating income and expenses (34) (110) (14) 1 (74) (53) - (284)Depreciation and amortization expense (119) (555) (149) (171) (296) (41) - (1,331)Impairment expense (22) (71) (9) (1) (85) (34) - (222)
Intangible assets and goodwill(b) 3,758 7,242 1,183 5,635 3,161 862 - 21,841Property, plant and equipment 2,339 2,165 477 425 1,415 3,566 - 10,387Inventories 4,567 1,561 398 1,244 1,668 239 (202) 9,475Other operating assets 1,340 781 664 635 668 608 6,963(c) 11,659
Total assets 12,004 11,749 2,722 7,939 6,912 5,275 6,761 53,362
Equity - - - - - - 23,003 23,003Liabilities 1,461 2,265 1,325 743 2,053 932 21,580(d) 30,359
Total liabilities and equity 1,461 2,265 1,325 743 2,053 932 44,583 53,362
Operating investments(e) (152) (585) (221) (191) (389) (237) - (1,775)
Fiscal year 2013
(EUR millions) Wines and Fashion and Perfumes Watches Selective Other and Eliminations Total Spirits Leather and and Retailing holding and not Goods Cosmetics Jewelry companies allocated(a)
Sales outside the Group 4,146 9,834 3,230 2,646 8,880 280 - 29,016Intra-Group sales 27 49 487 51 23 15 (652) -
Total revenue 4,173 9,883 3,717 2,697 8,903 295 (652) 29,016
Profit from recurring operations 1,367 3,135 414 367 908 (172) (2) 6,017Other operating income and expenses (4) (63) (6) 2 (5) (43) - (119)Depreciation and amortization expense (109) (448) (128) (139) (261) (39) - (1,124)Impairment expense 1 (50) (1) - (7) (12) - (69)
Intangible assets and goodwill(b) 3,948 7,213 1,068 5,572 2,989 864 - 21,654Property, plant and equipment 2,182 2,031 404 390 1,313 3,301 - 9,621Inventories 4,242 1,371 356 1,079 1,438 160 (154) 8,492Other operating assets 1,384 738 590 650 552 674 11,822(c) 16,409
Total assets 11,756 11,353 2,418 7,691 6,292 4,999 11,668 56,176
Equity - - - - - - 27,907 27,907Liabilities 1,296 2,128 1,130 713 1,814 712 20,477(d) 28,269
Total liabilities and equity 1,296 2,128 1,130 713 1,814 712 48,384 56,176
Operating investments(e) (186) (629) (229) (187) (389) (37) - (1,657)
(a) Eliminations correspond to sales between business groups; these generally consist of sales from business groups other than Selective Retailing to Selective Retailing. Selling pricesbetween the different business groups correspond to the prices applied in the normal course of business for sales transactions to wholesalers or distributors outside the Group.
(b) Intangible assets and goodwill correspond to the net carrying amounts shown under Notes 3 and 4.(c) Assets not allocated include available for sale financial assets, other financial assets, and income tax receivables. As of December 31, 2013, they included the 23.2% shareholding
in Hermès International, representing an amount of 6,437 million euros. The Hermès shares were distributed as an exceptional distribution in kind on December 17, 2014; see Note 8.(d) Liabilities not allocated include financial debt and both current and deferred tax liabilities.(e) Increase / (Decrease) in cash and cash equivalents.
55Financial Documents - December 31, 2015
CONDENSED CONSOLIDATED FINANCIAL STATEMENTS
Selected notes to the consolidated financial statements
2_VA_V4 01/02/2016 10:39 Page55

23.2. Information by geographic region
Revenue by geographic region of delivery breaks down as follows:
(EUR millions) 2015 2014 2013
France 3,552 3,212 3,118Europe (excluding France) 6,408 5,830 5,453United States 9,345 7,262 6,640Japan 2,487 2,107 2,057Asia (excluding Japan) 9,636 8,740 8,647Other 4,236 3,487 3,101
Revenue 35,664 30,638 29,016
Operating investments by geographic region are as follows:
(EUR millions) 2015 2014 2013
France 633 651 585Europe (excluding France) 385 326 313United States 336 255 238Japan 66 50 70Asia (excluding Japan) 411 387 339Other 124 106 112
Operating investments 1,955 1,775 1,657
No geographic breakdown of segment assets is provided since a significant portion of these assets consists of brands and goodwill,which must be analyzed on the basis of the revenue generated by these assets in each region, and not in relation to the region of theirlegal ownership.
23.3. Quarterly information
Quarterly sales by business group break down as follows:
(EUR millions) Wines and Fashion and Perfumes Watches Selective Other and Eliminations Total Spirits Leather and and Retailing holding Goods Cosmetics Jewelry companies
First quarter 992 2,975 1,094 723 2,656 90 (207) 8,323Second quarter 938 2,958 1,065 829 2,635 153 (194) 8,384Third quarter 1,199 2,939 1,102 852 2,614 83 (208) 8,581Fourth quarter 1,474 3,497 1,256 904 3,328 122 (205) 10,376
Total 2015 4,603 12,369 4,517 3,308 11,233 448 (814) 35,664
First quarter 888 2,639 941 607 2,222 78 (169) 7,206Second quarter 789 2,391 898 659 2,160 74 (168) 6,803Third quarter 948 2,647 961 706 2,234 65 (173) 7,388Fourth quarter 1,348 3,151 1,116 810 2,918 95 (197) 9,241
Total 2014 3,973 10,828 3,916 2,782 9,534 312 (707) 30,638
First quarter 967 2,383 932 608 2,113 72 (162) 6,913Second quarter 828 2,328 872 667 2,085 96 (157) 6,719Third quarter 1,032 2,428 879 655 2,093 56 (153) 6,990Fourth quarter 1,346 2,744 1,034 767 2,612 71 (180) 8,394
Total 2013 4,173 9,883 3,717 2,697 8,903 295 (652) 29,016
56 Financial Documents - December 31, 2015
CONDENSED CONSOLIDATED FINANCIAL STATEMENTS
Selected notes to the consolidated financial statements
2_VA_V4 01/02/2016 10:39 Page56

In certain countries, leases for stores entail the payment of both minimum amounts and variable amounts, especially for stores with lease payments indexed to revenue. The total lease expense for the Group’s stores breaks down as follows:
(EUR millions) 2015 2014 2013
Fixed or minimum lease payments 1,619 1,288 1,078Variable portion of indexed leases 604 412 413Airport concession fees – fixed portion or minimum amount 594 557 537Airport concession fees – variable portion 571 485 443
Commercial lease expenses 3,388 2,742 2,471
Personnel costs consist of the following elements:
(EUR millions) 2015 2014 2013
Salaries and social charges 6,122 5,323 4,858Pensions, contribution to medical costs and expensesin respect of defined benefit plans 90 93 88Stock option plan and related expenses 37 39 34
Personnel costs 6,249 5,455 4,980
25. OTHER OPERATING INCOME AND EXPENSES
(EUR millions) 2015 2014 2013
Net gains (losses) on disposals of fixed assets 1 1 7Restructuring costs (98) (36) (14)Transaction costs relating to the acquisition of consolidated companies (2) (8) (21)Impairment or amortization of brands, trade names, goodwill and other property (136) (246) (88)Other items, net 14 5 (3)
Other operating income and expenses (221) (284) (119)
Impairment and amortization expenses are mostly for brands and goodwill.
Restructuring costs mainly concern Fashion and Leather Goods and Watches and Jewelry businesses.
Advertising and promotion expenses mainly consist of the costof media campaigns and point-of-sale advertising, and alsoinclude personnel costs dedicated to this function.
As of December 31, 2015, a total of 3,860 stores were operatedby the Group worldwide (3,708 in 2014; 3,384 in 2013),particularly by Fashion and Leather Goods and Selective Retailing.
24. EXPENSES BY NATURE
Profit from recurring operations includes the following expenses:
(EUR millions) 2015 2014 2013
Advertising and promotion expenses 4,017 3,484 3,310Commercial lease expenses 3,388 2,742 2,471Personnel costs 6,249 5,455 4,980Research and development expenses 97 79 71
57Financial Documents - December 31, 2015
CONDENSED CONSOLIDATED FINANCIAL STATEMENTS
Selected notes to the consolidated financial statements
2_VA_V4 01/02/2016 10:39 Page57

27. INCOME TAXES
(EUR millions) 2015 2014 2013
Current income taxes for the fiscal year (2,245) (2,458) (1,958)Current income taxes relating to previous fiscal years 32 30 13
Current income taxes (2,213) (2,428) (1,945)
Change in deferred income taxes 137 153 185Impact of changes in tax rates on deferred taxes 107 2 7
Deferred income taxes 244 155 192
Total tax expense per income statement (1,969) (2,273) (1,753)
Tax on items recognized in equity 121 406 (249)
In 2015, the net gain / (loss) related to available for sale financialassets and other financial instruments was mainly due to capitalgains arising on the sale of available for sale financial assets.
In 2014, the net gain / (loss) related to available for sale financialassets and other financial instruments consisted mainly of the 3,189 million euro capital gain recognized following theexceptional distribution in kind of Hermès shares.
26. NET FINANCIAL INCOME / (EXPENSE)
(EUR millions) 2015 2014 2013
Borrowing costs (111) (144) (138)Income from cash, cash equivalents and current available for sale financial assets 33 30 30Fair value adjustment of borrowings and interest rate hedges - (1) 7
Cost of net financial debt (78) (115) (101)
Dividends received from non-current available for sale financial assets 4 74 71Ineffective portion of foreign currency hedges (437) (238) (159)Net gain / (loss) related to available for sale financial assets and other financial instruments 129 3,263 23Other items, net (32) (37) (32)
Other financial income / (expenses) (336) 3,062 (97)
Net financial income / (expense) (414) 2,947 (198)
Income from cash, cash equivalents and current available for sale financial assets comprises the following items:
(EUR millions) 2015 2014 2013
Income from cash and cash equivalents 18 18 20Interest from current available for sale financial assets 15 12 10
Income from cash, cash equivalents and current available for sale financial assets 33 30 30
The ineffective portion of exchange rate derivatives breaks down as follows:
(EUR millions) 2015 2014 2013
Ineffective portion of commercial foreign exchange derivatives (378) (222) (146)Ineffective portion of foreign exchange derivatives related to net investments denominated in foreign currency (2) 6 (6)Ineffective portion of other foreign exchange derivatives (57) (22) (7)
Ineffective portion of foreign exchange derivatives (437) (238) (159)
58 Financial Documents - December 31, 2015
CONDENSED CONSOLIDATED FINANCIAL STATEMENTS
Selected notes to the consolidated financial statements
2_VA_V4 01/02/2016 10:39 Page58
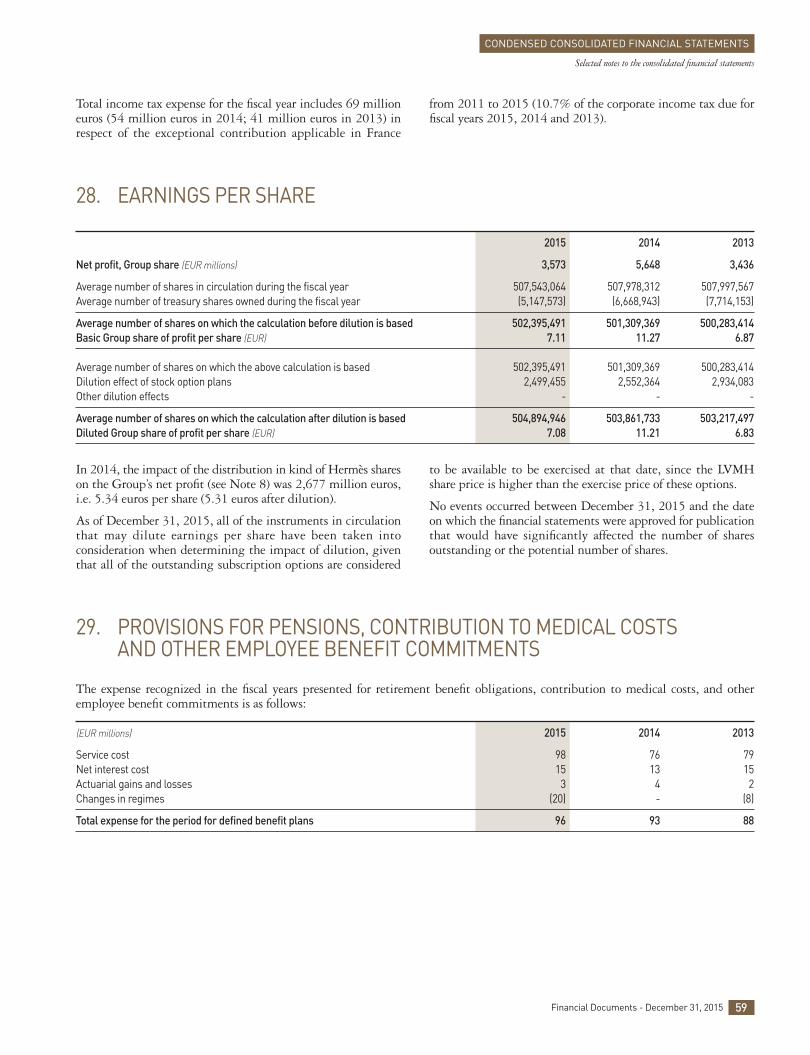
29. PROVISIONS FOR PENSIONS, CONTRIBUTION TO MEDICAL COSTS AND OTHER EMPLOYEE BENEFIT COMMITMENTS
The expense recognized in the fiscal years presented for retirement benefit obligations, contribution to medical costs, and otheremployee benefit commitments is as follows:
(EUR millions) 2015 2014 2013
Service cost 98 76 79Net interest cost 15 13 15Actuarial gains and losses 3 4 2Changes in regimes (20) - (8)
Total expense for the period for defined benefit plans 96 93 88
In 2014, the impact of the distribution in kind of Hermès shareson the Group’s net profit (see Note 8) was 2,677 million euros,i.e. 5.34 euros per share (5.31 euros after dilution).
As of December 31, 2015, all of the instruments in circulationthat may dilute earnings per share have been taken intoconsideration when determining the impact of dilution, giventhat all of the outstanding subscription options are considered
to be available to be exercised at that date, since the LVMHshare price is higher than the exercise price of these options.
No events occurred between December 31, 2015 and the dateon which the financial statements were approved for publicationthat would have significantly affected the number of sharesoutstanding or the potential number of shares.
28. EARNINGS PER SHARE
2015 2014 2013
Net profit, Group share (EUR millions) 3,573 5,648 3,436
Average number of shares in circulation during the fiscal year 507,543,064 507,978,312 507,997,567Average number of treasury shares owned during the fiscal year (5,147,573) (6,668,943) (7,714,153)
Average number of shares on which the calculation before dilution is based 502,395,491 501,309,369 500,283,414Basic Group share of profit per share (EUR) 7.11 11.27 6.87
Average number of shares on which the above calculation is based 502,395,491 501,309,369 500,283,414Dilution effect of stock option plans 2,499,455 2,552,364 2,934,083Other dilution effects - - -
Average number of shares on which the calculation after dilution is based 504,894,946 503,861,733 503,217,497Diluted Group share of profit per share (EUR) 7.08 11.21 6.83
59Financial Documents - December 31, 2015
CONDENSED CONSOLIDATED FINANCIAL STATEMENTS
Selected notes to the consolidated financial statements
Total income tax expense for the fiscal year includes 69 millioneuros (54 million euros in 2014; 41 million euros in 2013) inrespect of the exceptional contribution applicable in France
from 2011 to 2015 (10.7% of the corporate income tax due forfiscal years 2015, 2014 and 2013).
2_VA_V4 01/02/2016 10:39 Page59

In addition, the Group may enter into operating leases orconcession contracts that have variable guaranteed amounts.For example, in June 2012, DFS was awarded three additionalfive-year concessions at Hong Kong International Airport. The
concession agreement provides for the payment of a variableconcession fee which is dependent notably on the number ofpassengers using the airport. In 2015, the amount of this feewas about 440 million euros.
As of December 31, 2015, the maturity schedule of these commitments is as follows:
(EUR millions) Less than One to More than Total one year five years five years
Grapes, wines and eaux-de-vie 746 1,219 78 2,043Other purchase commitments for raw materials 69 21 4 94Industrial and commercial fixed assets 706 98 4 808Investments in joint venture shares and non-current available for sale financial assets 20 52 14 86
30.2. Lease and similar commitments
In connection with its business activities, the Group enters into agreements for the rental of premises or airport concession contracts.The Group also finances a portion of its equipment through long-term operating leases.
The fixed minimum portion of commitments in respect of the irrevocable period of operating lease or concession contracts were as follows as of December 31, 2015:
(EUR millions) 2015 2014 2013
Less than one year 1,860 1,658 1,394One to five years 4,599 3,788 3,572More than five years 3,021 1,952 1,854
Commitments given for operating leases and concessions 9,480 7,398 6,820
Less than one year 18 13 10One to five years 14 16 14More than five years 2 - -
Commitments received for sub-leases 34 29 24
Some Wines and Spirits companies have contractual purchasearrangements with various local producers for the future supplyof grapes, still wines and eaux-de-vie. These commitments are
valued, depending on the nature of the purchases, on the basisof the contractual terms or known year-end prices and estimatedproduction yields.
30. OFF-BALANCE SHEET COMMITMENTS
30.1. Purchase commitments
(EUR millions) 2015 2014 2013
Grapes, wines and eaux-de-vie 2,043 1,706 994Other purchase commitments for raw materials 94 69 110Industrial and commercial fixed assets 808 458 379Investments in joint venture shares and non-current available for sale financial assets 86 99 98
60 Financial Documents - December 31, 2015
CONDENSED CONSOLIDATED FINANCIAL STATEMENTS
Selected notes to the consolidated financial statements
2_VA_V4 01/02/2016 10:39 Page60

32. SUBSEQUENT EVENTS
No significant subsequent events occurred between December 31, 2015 and February 2, 2016, the date on which the financialstatements were approved for publication by the Board of Directors.
On December 17, 2012, the Mayor of Paris granted two distinctbuilding permits authorizing the architectural project for therestructuring and reconstruction of the former La Samaritainedepartment stores 2 (Seine block) and 4 (Rivoli block). Both of these permits were the subject of an action for cancellationbefore the Paris Administrative Court (Tribunal administratifde Paris). On April 11, 2014, the Paris Administrative Courtrejected the action for cancellation filed against the buildingpermit authorizing the restructuring of former departmentstore 2, which is registered as a Historic Monument (Seine block).That first permit thereby became definitive. On May 13, 2014,the Paris Administrative Court cancelled the second building
permit order authorizing the partial demolition of formerdepartment store 4 and the reconstruction of a contemporarybuilding designed by the architectural firm SANAA (Rivoliblock). The company Grands Magasins de La Samaritaine and the City of Paris filed an appeal against this judgment. OnJanuary 5, 2015, the Paris Administrative Court of Appeal(Cour administrative d’appel de Paris) dismissed their appeals.La Samaritaine and the City of Paris filed a cassation appealbefore the Council of State (Conseil d’État), which in a judgmentdated June 19, 2015, overturned the judgment of theAdministrative Court of Appeal, thereby definitively validatingthe second building permit.
30.3. Collateral and other guarantees
As of December 31, 2015, these commitments break down as follows:
(EUR millions) 2015 2014 2013
Securities and deposits 455 366 412Other guarantees 136 88 90
Guarantees given 591 454 502
Guarantees received 28 27 28
Maturity dates of these commitments are as follows:
(EUR millions) Less than One to More than Total one year five years five years
Securities and deposits 218 228 9 455Other guarantees 55 66 15 136
Guarantees given 273 294 24 591
Guarantees received 11 6 11 28
30.4. Other commitments
The Group is not aware of any significant off-balance sheet commitments other than those described above.
31. EXCEPTIONAL EVENTS AND LITIGATION
61Financial Documents - December 31, 2015
CONDENSED CONSOLIDATED FINANCIAL STATEMENTS
Selected notes to the consolidated financial statements
2_VA_V4 01/02/2016 10:39 Page61

Financial Documents - December 31, 201562
2_VA_V4 01/02/2016 10:39 Page62

SIMPLIFIED ACCOUNTING INFORMATION OF LVMH MOËT HENNESSY - LOUIS VUITTON SE
INCOME STATEMENT 64CHANGE IN EQUITY 64
Financial Documents - December 31, 2015 63
2_VA_V4 01/02/2016 10:39 Page63

Financial Documents - December 31, 201564
INCOME STATEMENT
Income/(Expenses) 20 15 20 14(EUR millions - French accounting principles)
Financial income from subsidiaries and other 6,605 7,359Profit from recurring operations before tax 6,010 7,560Exceptional income / (expense) - -Income tax income / (expense) 10 (399)Net profit 6,020 7,161
CHANGE IN EQUITY
(EUR millions - Share capital Other Retained Interim Net profit TotalFrench accounting principles) and share reserves and earnings dividends equity premium regulated provisions
As of December 31, 2014 before appropriation of 2014 net profit 2,807 388 - (627) 7,161 9,729
Appropriation of 2014 net profit - - 7,161 - (7,161) -2014 dividend: final - - (1,625) 627 - (998)Impact of treasury shares - - 18 - - 18
Exercise of share subscription options 35 - - - - 35
Retirement of LVMH shares (111) - - - - (111)
2015 interim dividend - - - (685) - (685)Impact of treasury shares - - - 6 - 6
Net profit for 2015 - - - - 6,020 6,020
As of December 31, 2015 2,731 388 5,554 (679) 6,020 14,014
SIMPLIFIED ACCOUNTING INFORMATION OF LVMH MOËT HENNESSY - LOUIS VUITTON SE
Income statement. Change in equity
2_VA_V4 01/02/2016 10:39 Page64

Design and production: Agence Marc Praquin
2_VA_V4 01/02/2016 10:39 Page65
For any information:LVMH, 22 avenue Montaigne - 75008 Paris
Tel. +33 1 44 13 22 22 - Fax +33 1 44 13 21 19
www.lvmh.com
2_VA_V4 01/02/2016 10:39 Page66