transit time, trailing time, and cerebral blood flow during brain activation: measurement using...
TRANSCRIPT
Transit Time, Trailing Time, and Cerebral Blood FlowDuring Brain Activation: Measurement Using Multislice,Pulsed Spin-Labeling Perfusion Imaging
Yihong Yang,1* Wolfgang Engelien,1 Su Xu,2 Hong Gu,1 David A. Silbersweig,1 andEmily Stern1
Transit time and trailing time in pulsed spin-labeling perfusionimaging are likely to be modulated by local blood flow changes,such as those accompanying brain activation. The majority oftransit/trailing time is due to the passage of the tagged bloodbolus through the arteriole/capillary regions, because of lowerblood flow velocity in these regions. Changes of transit/trailingtime during activation could affect the quantification of CBF infunctional neuroimaging studies, and are therefore important tocharacterize. In this work, the measurement of transit and trailingtimes and CBF during sensorimotor activation using multisliceperfusion imaging with pulsed arterial spin-labeling is described.While CBF elevated dramatically (;;80.7%) during the sensorimo-tor activation, sizable reductions of transit time (;;0.11 sec) andtrailing time (;;0.26 sec) were observed. Transit and trailing timeswere dependent on the distances from the leading and trailingedges of the tagged blood bolus to the location of the imagingslices. The effects of transit/trailing time changes on CBF quanti-fication during brain activation were analyzed by simulation stud-ies. Significant errors can be caused in the estimation of CBF ifsuch changes of transit/trailing time are not taken into account.Magn Reson Med 44:680–685, 2000. © 2000 Wiley-Liss, Inc.
Key words: transit time; trailing time; CBF; perfusion MRI; brainactivation
Magnetic resonance perfusion imaging techniques witharterial spin-labeling (ASL) have shown promise in themapping of cerebral blood flow (CBF) under normal andpathological conditions (1,2). Recent ASL perfusion imag-ing techniques have demonstrated the feasibility of detect-ing CBF changes during brain activation (3–9). These per-fusion imaging techniques use magnetically labeled bloodwater as an endogenous tracer to obtain information aboutblood flow in the tissue. Compared to conventional perfu-sion techniques with administration of exogenous tracers(10,11), the reduced invasiveness of the ASL perfusionimaging allows repeated measurements within a studysession, and thus makes the techniques more applicablefor brain activation studies with complex stimulation par-adigms. Compared to the relatively venous-weightedblood oxygenation level dependent (BOLD) methods(12,13), the perfusion techniques may target signal
changes closer to the capillary site, and therefore may bemore closely related to neuronal activity. Furthermore,quantitative CBF changes during brain activation can beobtained by the ASL techniques with suppression of “vas-cular” artifacts (9,14), providing a physiologically and bio-physically meaningful parameter for enhanced data inter-pretation.
Transit and trailing times are the times required for theleading and trailing edges, respectively, of tagged arterialblood to reach the capillary exchange site. The longitudi-nal relaxation of tagged spins during transit time can giverise to an underestimate of CBF measurement (9,14). Theeffects of transit time on CBF estimation in signal-intensitydifference perfusion imaging is relatively small when tran-sit time is much shorter than blood T1 (such as in brainperfusion of small animals), although significant errors canbe introduced in T1-difference approaches (17). In humanbrain, however, transit time was measured to be approxi-mately 0.7–1.1 sec for blood tagged a few centimetersinferior to the imaging site, and blood T1 was measured tobe 1.2 sec at 1.5 T (9,14). Therefore, the effects of transittime could be significant in human cerebral perfusionstudies, as indicated by experiments and simulations(6,8,9,14–16,20,21).
Transit time and trailing time are likely modulated bylocal blood flow changes, since most of the transit timetakes place at the arteriole/capillary level due to lowerflow velocity passing through these regions. CBF duringbrain activation increases significantly (30–110% duringvisual or sensorimotor stimulation) (7,9,18,19), althoughlower excursions are often seen with more subtle activa-tion paradigms. Transit and trailing times could reducesizably during brain activation due to the elevated flowvelocity in the vessels. Preliminary studies on transit timemeasurement during brain activation using a continuousASL perfusion technique (20) and pulsed ASL perfusion ina single slice (21) have been reported. In this work wedescribe a comprehensive study of the effects of transitand trailing times on quantification of CBF. Transit time,trailing time, and CBF during sensorimotor activationwere measured using multislice, pulsed ASL perfusionimaging. The effects of transit/trailing time changes onquantitative CBF measurement were analyzed using sim-ulation studies.
MATERIALS AND METHODS
Pulsed ASL Perfusion Imaging
A quantitative, multislice perfusion imaging techniquewith pulsed ASL (9) was employed in this study. As
1Functional Neuroimaging Laboratory, Department of Psychiatry, Weill Med-ical College of Cornell University, New York, New York.2Department of Medical Physics, Memorial Sloan-Kettering Cancer Center,New York, New York.Grant sponsors: Whitaker Foundation; DeWitt-Wallace Fund of New YorkCommunity Trust.*Correspondence to: Yihong Yang, Ph.D., Functional Neuroimaging Labora-tory, Dept. of Psychiatry, Weill Medical College of Cornell University, 525 E.68th St., Box 140, Room F-1306, New York, NY 10021.E-mail: [email protected] 24 March 2000; revised 19 June 2000; accepted 19 June 2000.
Magnetic Resonance in Medicine 44:680–685 (2000)
© 2000 Wiley-Liss, Inc. 680
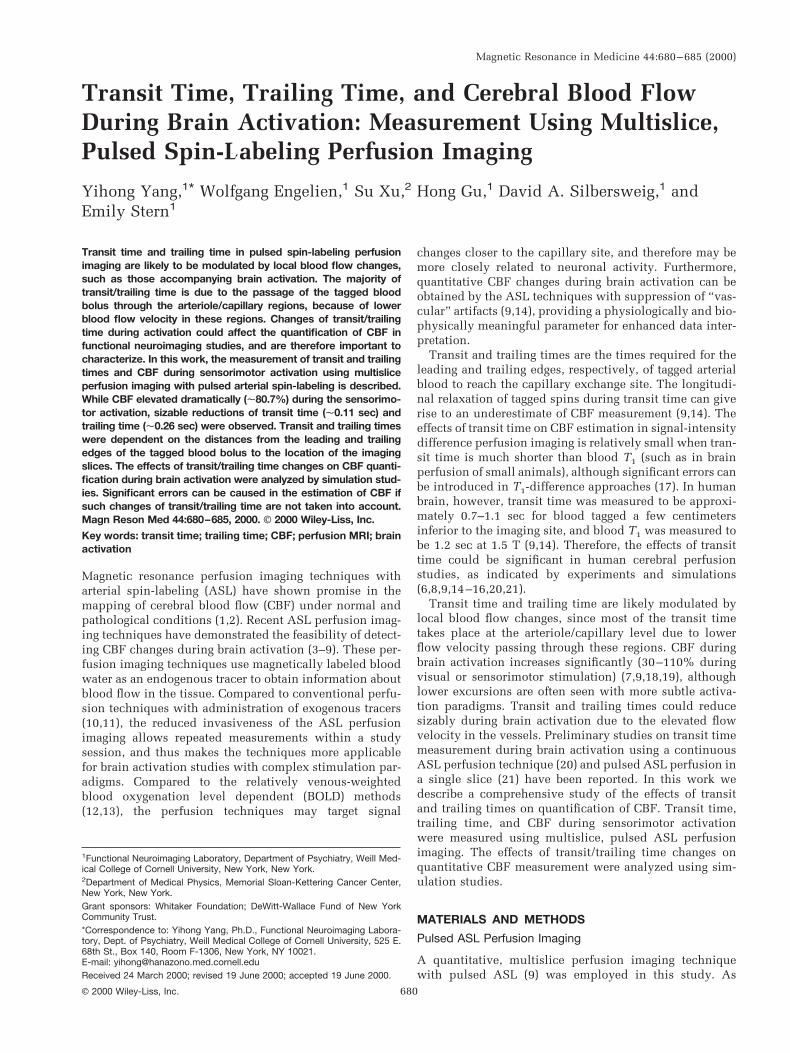
shown schematically in Fig. 1, multislice perfusion mea-surement was achieved by a combination of pulsed ASLwith fast spiral scanning (22,23). An adiabatic inversionpulse (combined with slab selection gradients) was usedfor alternating slab-selective and non-slab-selective inver-sion, followed by an inversion time (TI) delay and multi-slice data acquisition with spiral scanning. Six axial slices(5 mm thick) encompassing the primary sensorimotor cor-tices were acquired from superior to inferior to avoid un-intented perturbation of arterial spins passing the imagingslab. Bipolar gradients (with a first-order gradient momentof 2.7 rad z m–1 z sec ) were applied after each excitationpulse to suppress signals from intra-arterial spins (9,25).The thickness of the imaging slab was 30 mm (6 3 5mm)and the inversion slab was 50 mm, to avoid interferencecaused by an imperfect slab profile. The distances from theedge of the inversion slab to the center of the imagingslices were 12.5, 17.5, 22.5, 27.5, 32.5, and 37.5 mm,respectively. Perfusion images were acquired with TE of20 msec, TRslice of 60 msec, and Tdelay of 1.84 sec (see Fig.1). A frequency offset corrected inversion (FOCI) inversionpulse (24) was implemented in the perfusion sequence toimprove the sharpness of the slab inversion profile (25).
Transit Time, Trailing Time, and CBF Measurements
The transit time, trailing time, and blood flow were calcu-lated from a series of perfusion experiments with varyingTI values. The amplitude of the difference signal at time tobtained from “tagged” and “control” scans, DM(t), isgiven by the expression (9)
DM~t!M0
5 f1 5 0, for 0 # t , ta [1]
DM~t!M0
5 f2 5 22 z Q/l z1
dRz e2R1at z $1 2 e2dRz~t2ta!%,
for ta # t , td [2]
DM~t!M0
5 f3 5 f2~t 5 td! z e2R1z~t2td!, for t $ td [3]
where M0 is the amplitude of the fully relaxed signal, Q isthe CBF, l is the partition coefficient of brain water, ta isthe arterial transit time for the leading edge of the taggedbolus to reach the capillary exchange site, and td is thetime for the trailing edge of the tagged bolus to reach thecapillary exchange site. R1a and R1 are the longitudinalrelaxation rate of arterial blood and tissue, respectively,and dR 5 R1 – R1a. Perfusion images were acquired with TIvalues of 0.3, 0.45, 0.6, 0.75, 0.9, 1.1, 1.3, 1.6, 1.9, and2.3 sec, respectively. The apparent T1 was measured sep-arately by a set of inversion recovery experiments with TRof 6 sec, and TI of 0.02, 0.04, 0.07, 0.15, 0.3, 0.5, 1.0, 1.5,2.5, and 5.0 sec, respectively. The transit and trailing timesand CBF were estimated by least-squares fitting of thedifference images (DM) to the perfusion model describedby Eqs. [1]–[3] (9).
Brain Activation Experiment
MRI studies were performed on normal subjects on a1.5 Tesla GE-LX2 scanner (General Electric, Milwaukee,WI), with a maximum gradient strength of 23 mT z m–1 andmaximum gradient slew rates of 120 T z m–1 z s–1. Allstudies were done as part of a protocol approved by theInstitutional Review Board at New York Presbyterian Hos-pital/Weill Medical College of Cornell University. Brainactivation experiments with primary sensorimotor cortexstimulation were performed on five normal volunteers(one female and four males, 25–32 years old) with theperfusion imaging sequence. Six axial images encompass-ing the primary sensorimotor cortices were prescribedwith an in-plane matrix size of 64 3 64 and FOV of 240 3240 mm2. A time series of 96 volumes was acquired at eachTI, during which the subject switched between rest andfinger tapping for three cycles. The stimulation protocol
FIG. 1. Schematic diagram for multislice perfusionimaging with pulsed arterial spin labeling. An FOCIadiabatic inversion pulse was used for alternatingslab-selective and non-slab-selective inversion,followed by a TI delay and multislice data acquisi-tion with fast spiral scanning. Six axial slices en-compassing the primary sensorimotor corticeswere acquired from superior to inferior to avoidunintented perturbation of arterial spins passingthrough the imaging slab. Bipolar gradients wereapplied after each excitation pulse (not shown inthe figure) to suppress signals from intra-arterialspins. The distance from the edge of the inversionslab to an imaging slice was Ln, where n is the nthslice.
Transit Time and CBF During Brain Activation 681
entailed self-paced (;1 Hz), sequential thumb-to-digit op-positions (in the order of 2, 3, 4, 5, 5, 4, 3, 2) with bothhands. A head holder modified from a professional foot-ball helmet (Riddell Sports Inc., Elyria, OH) was devel-oped and used to restrict head movement during brainactivation studies.
Data Processing
Data were processed off-line on SUN-SPARC (Sun Micro-systems, Mountain View, CA) workstations. Spiral imageswere reconstructed with a regridding algorithm with aGaussian convolution window to re-sample the data on anorthogonal equidistant grid in k-space (26). To minimizehead motion artifacts, the time series of 3D brain volumeswas registered using a multi-resolution least-squares dif-ference algorithm with cubic spline interpolation (27,28).Functional data corresponding to rest and finger tappingperiods were sorted according to the stimulation para-digm, considering a hemodynamic response delay (;4 sec)of the brain. Difference images (DM) were obtained bysubtracting the control images from the tagged images ateach TI. Student’s t test was used to identify significantlyactivated voxels with a significance level of a , 0.01. Aregion-of-interest (ROI) was obtained from the activatedvoxels (typically 120–140 voxels). Difference signals (DM)in the activated ROI were averaged to provide a sufficientsignal-to-noise ratio (SNR) in curve fitting for the estimateof transit/trailing time and CBF. The signals during acti-vation and rest states were used separately for the estima-tion.
RESULTS AND DISCUSSION
Brain activations in the sensorimotor cortices were de-tected robustly and consistently in all subjects with the
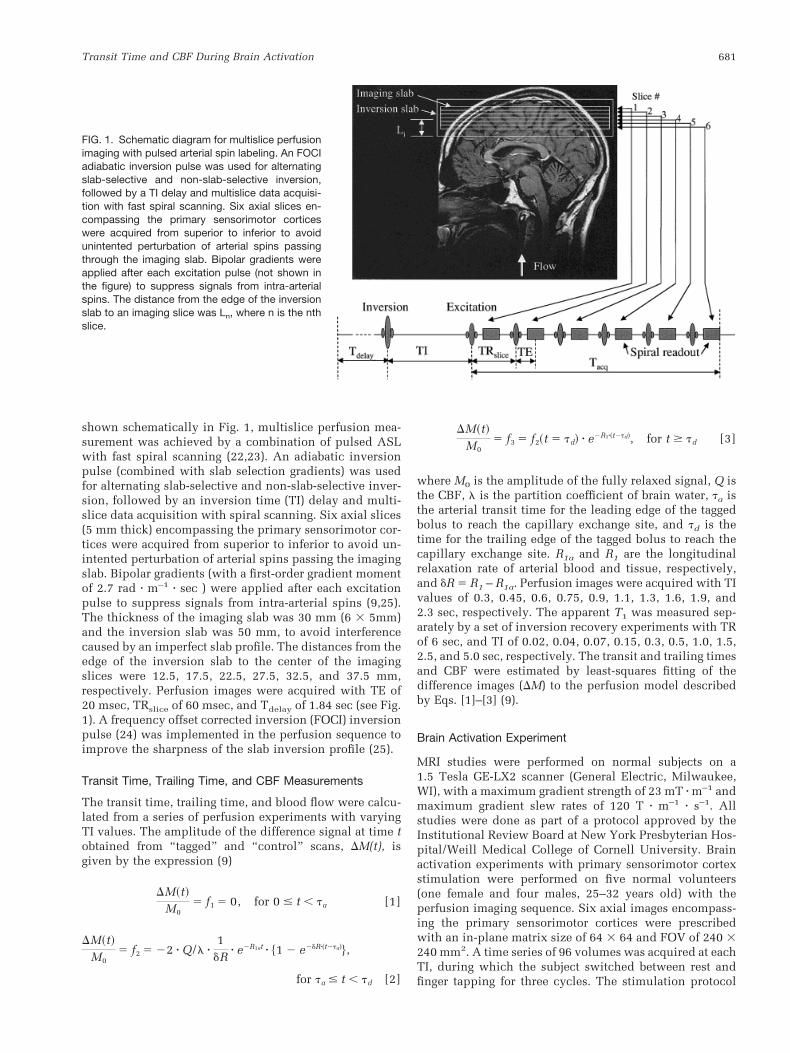
perfusion imaging paradigm. Figure 2a shows a typicalexample of the activation maps overlaid on their corre-sponding T1-weighted anatomical images. Activation inthe primary sensorimotor cortex and the supplementarymotor area is clearly visible. A time course of the perfu-sion-related signal change (DM) during rest and activationstates in the activated area is shown in Fig. 2b. Theseperfusion data (acquired at actual TI of 1.54 sec) were oneof the 10 perfusion data sets (acquired at varying TIs) usedfor the curve fitting to estimate the perfusion parameters(transit and trailing times and CBF). It is shown in the timeseries that DM intensity increased substantially from therest state to the activation state, which corresponds to asignificant increase of CBF.
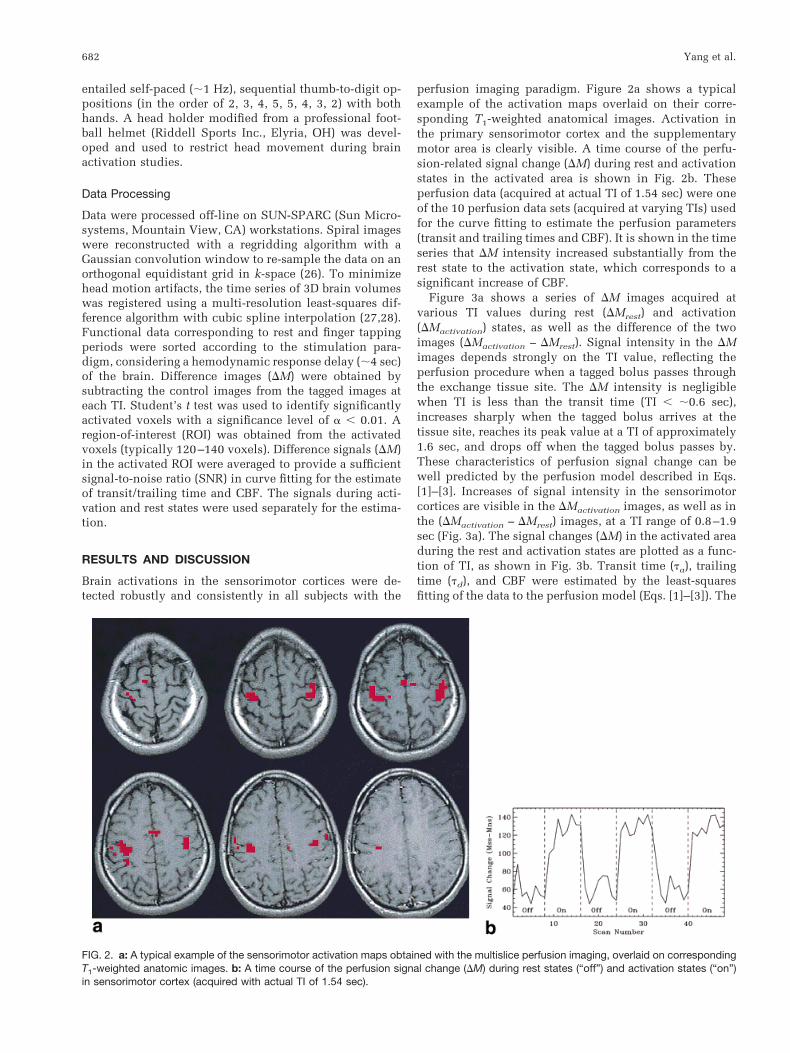
Figure 3a shows a series of DM images acquired atvarious TI values during rest (DMrest) and activation(DMactivation) states, as well as the difference of the twoimages (DMactivation – DMrest). Signal intensity in the DMimages depends strongly on the TI value, reflecting theperfusion procedure when a tagged bolus passes throughthe exchange tissue site. The DM intensity is negligiblewhen TI is less than the transit time (TI , ;0.6 sec),increases sharply when the tagged bolus arrives at thetissue site, reaches its peak value at a TI of approximately1.6 sec, and drops off when the tagged bolus passes by.These characteristics of perfusion signal change can bewell predicted by the perfusion model described in Eqs.[1]–[3]. Increases of signal intensity in the sensorimotorcortices are visible in the DMactivation images, as well as inthe (DMactivation – DMrest) images, at a TI range of 0.8–1.9sec (Fig. 3a). The signal changes (DM) in the activated areaduring the rest and activation states are plotted as a func-tion of TI, as shown in Fig. 3b. Transit time (ta), trailingtime (td), and CBF were estimated by the least-squaresfitting of the data to the perfusion model (Eqs. [1]–[3]). The
FIG. 2. a: A typical example of the sensorimotor activation maps obtained with the multislice perfusion imaging, overlaid on correspondingT1-weighted anatomic images. b: A time course of the perfusion signal change (DM) during rest states (“off”) and activation states (“on”)in sensorimotor cortex (acquired with actual TI of 1.54 sec).
682 Yang et al.
ta, td, and CBF were 0.66 sec, 2.05 sec, and 66 cc/100g/min, respectively, at rest, and were 0.54 sec, 1.79 sec,and 120 cc/100 g/min, respectively, during activation. Thedecreased transit and trailing times during brain activationare likely caused primarily by the elevated flow velocity inthe local microvessels. This is similar to the results from
an autoradiography experiment on rat brain, in which asignificant decrease of transit time in hypercapnia wasobserved (29).
The transit and trailing times may vary among the slicesbecause they are dependent on the distance from the lead-ing and trailing edges of the tagged bolus to the location of
FIG. 3. Measurement of transit time, trailing time, and CBF. a: A series of DM images acquired at various TI values during rest (DMrest) andactivation (DMactivation) states, as well as the difference of the two images (DMactivation – DMrest). Increases of signal intensities are visible inthe sensorimotor areas in the DMactivation and the difference (DMactivation – DMrest) images. b: Signal intensities (DM) integrated in theactivated area are plotted as a function of TI for the rest and activation states. The solid lines are the curves obtained by least-squares fittingof the data to the perfusion model described in Eqs. [1]–[3].
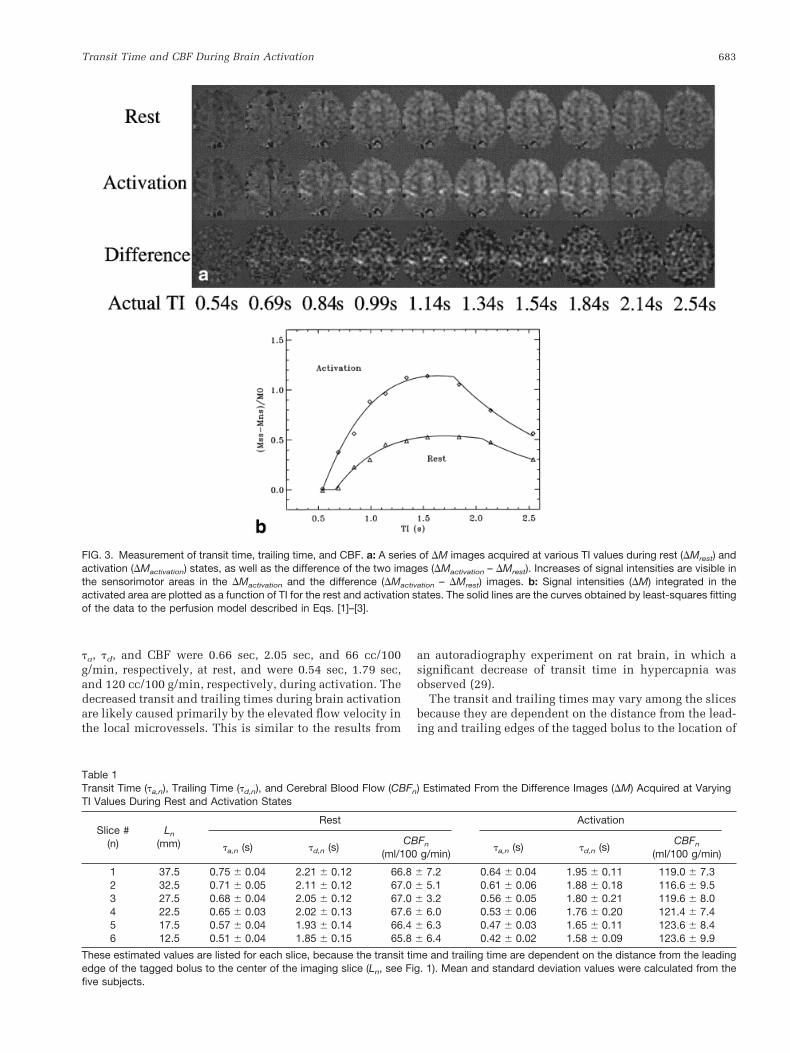
Table 1Transit Time (ta,n), Trailing Time (td,n), and Cerebral Blood Flow (CBFn) Estimated From the Difference Images (DM) Acquired at VaryingTI Values During Rest and Activation States
Slice #(n)
Ln
(mm)
Rest Activation
ta,n (s) td,n (s)CBFn
(ml/100 g/min)ta,n (s) td,n (s)
CBFn
(ml/100 g/min)
1 37.5 0.75 6 0.04 2.21 6 0.12 66.8 6 7.2 0.64 6 0.04 1.95 6 0.11 119.0 6 7.32 32.5 0.71 6 0.05 2.11 6 0.12 67.0 6 5.1 0.61 6 0.06 1.88 6 0.18 116.6 6 9.53 27.5 0.68 6 0.04 2.05 6 0.12 67.0 6 3.2 0.56 6 0.05 1.80 6 0.21 119.6 6 8.04 22.5 0.65 6 0.03 2.02 6 0.13 67.6 6 6.0 0.53 6 0.06 1.76 6 0.20 121.4 6 7.45 17.5 0.57 6 0.04 1.93 6 0.14 66.4 6 6.3 0.47 6 0.03 1.65 6 0.11 123.6 6 8.46 12.5 0.51 6 0.04 1.85 6 0.15 65.8 6 6.4 0.42 6 0.02 1.58 6 0.09 123.6 6 9.9
These estimated values are listed for each slice, because the transit time and trailing time are dependent on the distance from the leadingedge of the tagged bolus to the center of the imaging slice (Ln, see Fig. 1). Mean and standard deviation values were calculated from thefive subjects.
Transit Time and CBF During Brain Activation 683

the slices. In addition, each slice was acquired at a slightlydifferent “actual inversion time,” due to the time neededfor acquiring preceding slices. The actual inversion timefor each slice was TIn 5 TI 1 n z TRslice (see Fig. 1), wheren is the nth slice acquired. For the above reasons, the ta, td,
and CBF were estimated for each slice individually. Table1 summarizes the estimated transit time, trailing time, andCBF values for each slice (ta,n, td,n, and CBFn,) during restand activation states from the five subjects. Examining theta,n, td,n, and CBFn, values among slices, transit and trail-ing times increased roughly in proportion to the distancefrom the leading edge of the tagged bolus to the imagingslice (Ln), whereas blood flow remained relatively stableacross the slices. Comparing the ta,n, td,n, and CBFn valuesbetween rest and activation states, transit and trailingtimes decreased sizably (0.11 6 0.01 and 0.26 6 0.02 sec,respectively), and blood flow increased substantially (54 63 ml/100 g/min or 80.7%), during the sensorimotor acti-vation.
Changes of transit and trailing times during brain acti-vation have been described in previous studies. Boxton etal. (21) reported a preliminary transit/trailing time mea-surement using a single-slice EPISTAR sequence in a sin-gle subject, as a demonstration for a general kinetic modelfor ASL perfusion imaging. Gonzalez-Atavales et al. (20)
reported a multislice study using a continuous ASL tech-nique, but transit time was only measured as an averagevalue in ROIs, rather than in each slice. In our study,however, we measured transit and trailing times in multi-ple brain sections during rest and activation. The variationin transit/trailing time for different slices was explicitlytaken into account in the analysis. The spatial dependenceof transit and trailing times was estimated, and the infor-mation will be useful for planning and interpreting quan-titative multislice ASL perfusion experiments. Anotherdifference between our study and the previous studies wasthat crusher gradients were used in our study to eliminatesignals contributed from arterial blood. Therefore, transitand trailing times to the capillary bed rather than thearterial compartment were measured, providing more ac-curate information for perfusion quantification.
It is worth noting that the sizable change of transit andtrailing times during activation could affect blood flowquantification. Figure 4a shows the signal changes (DM)calculated from Eqs. [1]–[3] with several ta/td settings, anda constant CBF value of 120 ml/100 g/min (representingblood flow during activation). The DM curves with ta/td
settings representing the rest state (ta/td 5 0.65/2.05 sec)and ignoring transit and trailing times (ta/td 5 0/` sec)deviated significantly from the DM curve with the ta/td
setting representing the activation state (ta/td 5 0.54/1.80sec). Significant errors could be caused by using an inap-propriate ta/td setting to estimate blood flow. Figure 4bshows the estimated CBF from the simulated DM data(ta/td 5 0.54/1.80 sec, CBF 5 120 ml/100 g/min, represent-ing activation state) using the three ta/td settings. A signif-icant underestimation of CBF would be caused at all TIvalues if transit and trailing times are ignored (ta/td 5 0/`sec). An overestimation or underestimation of CBF wouldbe caused (depending on the TI value) by using the transit/trailing setting at the resting state (ta/td 5 0.69/2.00 sec). Inthe TI range (1.0–1.8 sec) usually used for CBF measure-ments, an error of 10–30% would be introduced by usingthe rest state ta/td setting. Based on the analysis above,transit and trailing times should be seriously considered inperfusion quantification, either by measuring them empir-ically and taking them into account in perfusion modelsfor CBF estimation, or by developing perfusion methods inwhich data are acquired under conditions insensitive tothe transit and trailing times (6).
CONCLUSION
Transit and trailing times and CBF were measured duringbrain activation with a multislice, pulsed ASL perfusionimaging technique. During sensorimotor activation, com-pared to rest state, transit and trailing times reduced siz-ably, while CBF increased substantially. Transit and trail-ing times are dependent on the distances between theedges of the tagged blood bolus to the locations of theimaging slices. The changes of transit and trailing timesduring activation can significantly affect blood flow quan-tification in brain activation studies. Perfusion methodstaking into account the transit/trailing time changes aretherefore necessary for improving quantitative CBF mea-surement in functional neuroimaging studies.
FIG. 4. Effects of transit and trailing times on CBF quantification. a:Signal intensities of the DM images with different transit/trailing timesettings. The solid line (ta/td 5 0.54/1.80 sec), dotted line (ta/td 50.65/2.05 sec), and dashed line (ta/td 5 0/` sec) represent typicalta/td values in activation state, rest state, and when ignoring transit/trailing time. CBF was 120 ml/100 g/min in all three conditions. b:Blood flow values estimated from the simulated DM data represent-ing activation states (ta/td 5 0.54/1.80 sec, CBF 5 120 ml/100g/min) using the three transit/trailing time settings: ta/td 5 0.54/1.80sec (solid line), ta/td 5 0.65/2.05 sec (dotted line), and ta/td 5 0/`sec (dashed line).
684 Yang et al.
ACKNOWLEDGMENTS
The authors acknowledge Dr. M. Yongbi, Dr. J.H. Duyn,and Dr. J.A. Frank at the National Institutes of Health fordiscussions and help in the perfusion sequence.
REFERENCES
1. Detre JA, Leigh JS, Williams DS, Koretsky AP. Perfusion imaging. MagnReson Med 1992;23:37–45.
2. Williams DS, Detre JA, Leigh JS, Koretsky AP. 1992. Magnetic reso-nance imaging of perfusion using spin inversion of arterial water. ProcNatl Acad Sci USA 1992;89:212–216.
3. Edelman RR, Siewert B, Darby DG, Thangaraj V, Nobre AC, MesulamMM, Warrash S. Qualitative mapping of cerebral blood flow and func-tional localization with echo-plan MR imaging and signal targetingwith alternative radio frequency. Radiology 1994;192:513–520.
4. Kim S-G. Quantification of relative cerebral blood flow change byflow-sensitive alternating inversion recovery (FAIR) technique: appli-cation to functional mapping. Magn Reson Med 1995;34:293–301.
5. Kwong KK, Chesler DA, Weisskoff RM, Donahue KM, Davis TL, Oster-gaard L, Campbell TA, Rosen BR. MR perfusion studies with T1-weighted echo planar imaging. Magn Reson Med 1995;34:878–887.
6. Alsop DC, Detre JA. Reduced transit-time sensitivity in noninvasivemagnetic resonance imaging of human cerebral blood flow. J CerebBlood Flow Metab 1996;16:1236–1249.
7. Ye FQ, Smith AM, Yang Y, Duyn J, Mattay VS, Rattiman U, Frank JA,Weinberger DR, McLaughlin AC. 1999. Quantitation of regional cere-bral blood flow increases during motor activation: a steady-state, arte-rial spin tagging study. NeuroImage 1997;6:104–112.
8. Wong EC, Buxton RB, Frank LR. Implementation of quantitative perfu-sion imaging techniques for functional brain mapping using pulsedarterial spin labeling. NMR Biomed 1997;10:237–249.
9. Yang Y, Frank JA, Hou L, Ye FQ, McLaughlin AC, Duyn JH. Multisliceimaging of quantitative cerebral perfusion with pulsed arterial spinlabeling. Magn Reson Med 1998;39:825–832.
10. Willringer A, Rosen BR, Belliveau JW, Ackerman JL, Lauffer RB, Bux-ton RB, Chao YS, Wedeen VJ, Brady TJ. Dynamic imaging with lan-thanide chelates in normal brain: contrast due to magnetic susceptibil-ity effects. Magn Reson Med 1988;6:164–174.
11. Belliveau JW, Kennedy DN Jr, Mckinstry RC, Buchbinder BR, WeisskoffRM, Cohen MS, Vevea JM, Brady TJ, Rosen BR. Functional mapping ofthe human visual cortex by magnetic resonance imaging. Science 1991;254:716–719.
12. Ogawa S, Lee TM, Nayak AS, Glynn P. Oxygenation-sensitive contrastin magnetic resonance imaging of rodent brain at high magnetic fields.Magn Reson Med 1990;14:68–78.
13. Kwong KK, Belliveau JW, Chesler DA, Goldberg IE, Weiskoff RM,Poncelet BP, Kennedy DN, Hoppel BE, Cohen MS, Turner R, Cheng H,Brady TJ, Rosen BR. Dynamic magnetic resonance imaging of humanbrain activity during primary sensory stimulation. Proc Natl Acad SciUSA 1992;89:5675–5679.
14. Ye FQ, Mattay VS, Jezzard P, Frank JA, Weinberger DR, McLaughlinAC. Correction for vascular artifacts in cerebral blood flow values
measured by using arterial spin labeling techniques. Magn Reson Med1997;37:226–235.
15. Zhang WG, Williams DS, Detre JA, Koretsky AP. Measurement of brainperfusion by volume-localized NMR spectroscopy using inversion ofarterial water spins: accounting for transit-time and cross-relaxation.Magn Reson Med 1992;25:362–371.
16. Wong EC, Buxton RB, Frank LR. Quantitative imaging of perfusionusing a single subtruction (QUIPSS and QUIPSS II). Magn Reson Med1998;39:702–708.
17. Zhou J, van Ziji PCM. Effects of transit times on quantification ofcerebral blood flow by the FAIR T1-difference approach. Magn ResonMed 1999;42:890–894.
18. Mintun MA, Fox PT, Raichle ME. A highly accurate method of local-izing regions of neuronal activation in the human brain with positionemission tomography. J Cereb Blood Flow Metab 1989;9:96–103.
19. Ye FQ, Yang Y, Duyn J, Mattay VS, Frank JA, Weinberger DR, McLaugh-lin AC. Quantitation of regional cerebral blood flow increases duringmotor activation: a multislice, steady-state, arterial spin tagging study.Magn Reson Med 1999;42:404–407.
20. Gonzalez-Atavales J, Alsop DC, Detre JA. Quantification of flowchanges accompanying task activation using transit-time sensitive ASLimaging. In: Proceedings of the 7th Annual Meeting of ISMRM,Philadephia, 1999. p 1732.
21. Buxton RB, Frank LR, Wong EC, Siewert B, Warach S, Edelman RR. Ageneral kinetic model for quantitative perfusion imaging with arterialspin labeling. Magn Reson Med 1998;40:383–396.
22. Yang Y, Glover GH, van Gelderen P, Mattay VS, Santha AKS, SaxtonRH, Moonen CTW, Weinberger DR, Frank JA, Duyn JH. Fast 3D func-tional magnetic resonance imaging at 1.5T with spiral acquisition.Magn Reson Med 1996;36:620–626.
23. Yang Y, Glover GH, van Gelderen P, Patel AC, Mattay VS, Frank JA,Duyn JH. A comparison of fast MR scan techniques for cerebral activa-tion studies at 1.5 Tesla. Magn Reson Med 1998;39:61–67.
24. Ordidge RJ, Wylezinska M, Hugg JW, Biutterworth E, Franconi F.Frequency offset corrected inversion (FOCI) pulses for use in localizedspectroscopy. Magn Reson Med 1996;36:562–566.
25. Yongbi MN, Yang Y, Frank JA, Duyn JH. Multislice perfusion imagingin human brain using the C-FOCI inversion pulse: comparison withhyperbolic secant. Magn Reson Med 1999;42:1098–1105.
26. Jackson JI, Meyer CH, Nishimura DG, Macovski A. Selection of convo-lution function for Fourier inversion using gridding. IEEE Trans MedImaging 1991;10:473–478.
27. Unser M, Aldroubi A. A multi-resolution image registration procedureusing spline pyramids. In: Proceedings of SPIE, Mathematical imaging:wavelet application in signal and image processing, Vol. 2034, SanDiego, CA, 1993. p 160–170.
28. Thevenaz P, Ruttimann UE, Unser M. Iterative multi-scale registrationwithout landmarks. In: Proceedings of the International Conference onImage Processing, Vol. 3, Washington, D.C., 1995. p 228–231.
29. Bereczki D, Wei L, Otsuka T, Acuff V, Pettigrew K, Patlak C, Fenster-macher J. Hypoxia increase velocity of blood flow through parenchy-mal microvascular systems in rat brain. J Cereb Blood Flow Metab1993;13:475–486.
Transit Time and CBF During Brain Activation 685