free-breathing multislice native myocardial t … multislice native myocardial t 1 mapping ......
TRANSCRIPT
FULL PAPER
Free-Breathing Multislice Native Myocardial T1 MappingUsing the Slice-Interleaved T1 (STONE) Sequence
Sebastian Weing€artner,1,2 S�ebastien Roujol,1 Mehmet Akcakaya,1
Tamer A. Basha,1 and Reza Nezafat1*
Purpose: To develop a novel pulse sequence for free-
breathing, multislice, native myocardial T1 mapping.Methods: The slice-interleaved T1 (STONE) sequence consists
of multiple sets of single-shot images of different slices, acquiredafter a single nonselective inversion pulse. Each slice is onlyselectively excited once after each inversion pulse to allow sam-
pling of the unperturbed longitudinal magnetization in the adja-cent slices. For respiratory motion, a prospective slice-trackingrespiratory navigator is used to decrease through-plane motion
followed by a retrospective image registration to reduce in-planemotion. STONE T1 maps were calculated using both a two-
parameter and three-parameter fit model. The accuracy and pre-cision of the STONE sequence for different T1, T2, and inversionpulse efficiency were studied using numerical simulations and
phantom experiments. T1 maps from 14 subjects were acquiredwith the STONE sequence and T1s were compared to the MOdi-
fied Look-Locker Inversion recovery sequence (MOLLI).Results: In numerical simulations and phantom experiments,the STONE sequence using a two-parameter fit model yields
more accurate T1 times compared to MOLLI, with similar highprecision. The three-parameter fit model further improves the
accuracy, but with a reduced precision. The native myocardialT1 times were higher in the STONE sequence using two- orthree-parameter fit compared to MOLLI. The standard deviation
of the T1 times was lower in the STONE T1 maps with a two-parameter fit compared with MOLLI or a three-parameter fit.
Conclusion: The STONE sequence allows accurate and pre-cise quantification of native myocardial T1 times with the addi-tional benefit of covering the entire ventricle. Magn ResonMed 000:000–000, 2014. VC 2014 Wiley Periodicals, Inc.
Key words: Myocardial T1 mapping; inversion recovery; multi-slice; MOLLI
INTRODUCTION
Recent advances in cardiac MR (CMR) allow for the non-invasive imaging of interstitial diffuse fibrosis usingquantitative T1 mapping. In this technique, the voxel-wise calculation of the longitudinal magnetization recov-
ery time provides spatially-resolved quantitative charac-terization of the myocardial tissue composition. There isemerging evidence of differences in myocardial T1 timesbetween various cardiomyopathies, which may improvediagnostic and prognostic value of CMR (1). Both nativeand postcontrast myocardial T1 times have been used toevaluate patients with various cardiomyopathies (2–6).Furthermore, extracellular volume (ECV) can be calcu-lated by measuring native and postcontrast T1, takinginto account the patient hematocrit (7).
Over the past decade, there have been significant
advances in imaging sequences for myocardial T1 map-
ping. The MOdified Look-Locker (8) Inversion recovery
(MOLLI) is widely used for myocardial T1 mapping
(9–13). However, it suffers from inaccurate T1 estimates
due to heart rate (14), T2 (15), and magnetization transfer
dependency (16). To reduce the scan time and eliminate
heart rate variability, variations of the MOLLI sequence
like the 5(3)3 MOLLI scheme (17) or the shortened
MOLLI (ShMOLLI) were developed (14). However, these
sequences still suffer from inaccurate measurements
leading to underestimated T1 of healthy myocardium by
up to �30% (18). Saturation recovery based myocardial
T1 mapping was also investigated (19) and recently revis-
ited by introduction of the SAturation recovery single-
SHot Acquisition sequence (SASHA) (20). This sequence
reduces sensitivity to T2 and heart rate, but it has lower
precision compared to MOLLI (18). SAturation Pulse-
Prepared Heart-rate independent Inversion-REcovery
(SAPPHIRE) T1 mapping, uses a magnetization prepara-
tion using a combination of saturation and inversion
pulses, for accurate T1 mapping with an increased
dynamic range compared to saturation recovery (21).
Similar to SASHA, SAPPHIRE suffers from lower preci-
sion in assessing native T1 times compared to MOLLI
(18). Therefore, there is still a need for an accurate and
precise T1 mapping imaging sequence.Myocardial T1 mapping is frequently performed using
a 2D sequence during breath-holds, with the acquisitionof a single breath-hold per slice. The majority of pub-lished studies use a single mid left ventricular (LV) slicefor the calculation of T1 maps, and report a single T1
time for each patient (6,22,23). However, a single valuedoes not necessarily characterize the regional myocardialtissue composition over the entire ventricle. While insome myopathies such as amyloidosis, there may not bemuch variation across the myocardium, in many cardio-myopathies, such as hypertrophic cardiomyopathies,there are regional variations that could directly impactT1 measurements (23,24). Therefore, full LV coverage isrequired for accurate characterization of the LV
1Department of Medicine, Beth Israel Deaconess Medical Center andHarvard Medical School, Boston, Massachusetts, USA.2Department of Computer Assisted Clinical Medicine, University MedicalCenter Mannheim, Heidelberg University, Mannheim, Germany.
Grant sponsor: NIH; Grant number: R01EB008743-01A2; Grant sponsor:Samsung Electronics.
*Correspondence to: Reza Nezafat, Ph.D., Beth Israel Deaconess MedicalCenter, 330 Brookline Avenue, Boston, MA, 02215. E-mail: [email protected]
Received 28 March 2014; revised 6 June 2014; accepted 4 July 2014
DOI 10.1002/mrm.25387Published online 00 Month 2014 in Wiley Online Library (wileyonlinelibrary.com).
Magnetic Resonance in Medicine 00:00–00 (2014)
VC 2014 Wiley Periodicals, Inc. 1
myocardium. 3D T1 mapping has recently been proposedfor volumetric LV coverage for postcontrast T1 (25) andnative T1 (26). However, 3D T1 mapping sequences stillsuffer from long scan times and require advanced recon-struction techniques, which are not yet clinically avail-able. Therefore, currently, multiple separate 2D scanshave to be performed for different slices to obtain com-plete LV coverage. This requires numerous breath-holds,which are not convenient for patients.
In this study, we propose a novel Slice-interleaved T1
(STONE) sequence for free-breathing multislice inversion-recovery based T1 mapping sequence with volumetric LVcoverage by interleaving data acquisition of different sli-ces during the recovery time of adjacent slices. The accu-racy and precision of the proposed method is evaluatedin numerical simulations, phantom and in vivo experi-ments and compared to T1 mapping measurements usingMOLLI.
METHODS
All imaging was performed on a 1.5 Tesla (T) scanner(Philips Achieva, Philips, Best, The Netherlands) with a32-channel cardiac receiver coil array. The in vivoexperiments were HIPAA compliant and approved byour Institutional Review Board. Written informed con-sent was obtained from each subject before the imaging.
Sequence
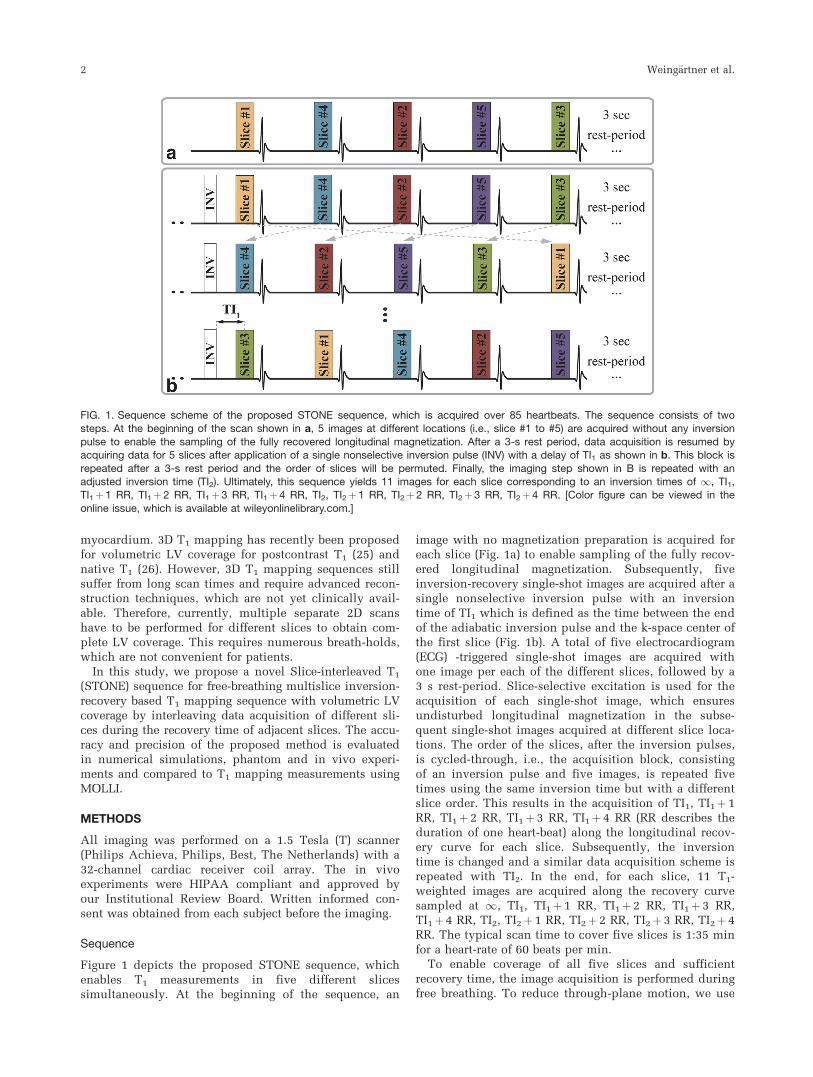
Figure 1 depicts the proposed STONE sequence, whichenables T1 measurements in five different slicessimultaneously. At the beginning of the sequence, an
image with no magnetization preparation is acquired foreach slice (Fig. 1a) to enable sampling of the fully recov-ered longitudinal magnetization. Subsequently, fiveinversion-recovery single-shot images are acquired after asingle nonselective inversion pulse with an inversiontime of TI1 which is defined as the time between the endof the adiabatic inversion pulse and the k-space center ofthe first slice (Fig. 1b). A total of five electrocardiogram(ECG) -triggered single-shot images are acquired withone image per each of the different slices, followed by a3 s rest-period. Slice-selective excitation is used for theacquisition of each single-shot image, which ensuresundisturbed longitudinal magnetization in the subse-quent single-shot images acquired at different slice loca-tions. The order of the slices, after the inversion pulses,is cycled-through, i.e., the acquisition block, consistingof an inversion pulse and five images, is repeated fivetimes using the same inversion time but with a differentslice order. This results in the acquisition of TI1, TI1þ 1RR, TI1þ 2 RR, TI1þ3 RR, TI1þ4 RR (RR describes theduration of one heart-beat) along the longitudinal recov-ery curve for each slice. Subsequently, the inversiontime is changed and a similar data acquisition scheme isrepeated with TI2. In the end, for each slice, 11 T1-weighted images are acquired along the recovery curvesampled at 1, TI1, TI1þ1 RR, TI1þ 2 RR, TI1þ 3 RR,TI1þ 4 RR, TI2, TI2þ 1 RR, TI2þ2 RR, TI2þ3 RR, TI2þ 4RR. The typical scan time to cover five slices is 1:35 minfor a heart-rate of 60 beats per min.
To enable coverage of all five slices and sufficientrecovery time, the image acquisition is performed duringfree breathing. To reduce through-plane motion, we use
FIG. 1. Sequence scheme of the proposed STONE sequence, which is acquired over 85 heartbeats. The sequence consists of twosteps. At the beginning of the scan shown in a, 5 images at different locations (i.e., slice #1 to #5) are acquired without any inversion
pulse to enable the sampling of the fully recovered longitudinal magnetization. After a 3-s rest period, data acquisition is resumed byacquiring data for 5 slices after application of a single nonselective inversion pulse (INV) with a delay of TI1 as shown in b. This block is
repeated after a 3-s rest period and the order of slices will be permuted. Finally, the imaging step shown in B is repeated with anadjusted inversion time (TI2). Ultimately, this sequence yields 11 images for each slice corresponding to an inversion times of 1, TI1,TI1þ1 RR, TI1þ2 RR, TI1þ3 RR, TI1þ4 RR, TI2, TI2þ1 RR, TI2þ2 RR, TI2þ3 RR, TI2þ4 RR. [Color figure can be viewed in the
online issue, which is available at wileyonlinelibrary.com.]
2 Weing€artner et al.
prospective slice tracking using a pencil beam navigatorpositioned on the dome of the right hemidiaphragm.Spatially selective re-inversion at the navigator positionis performed directly after each inversion pulse, toensure a constant navigator signal across all inversiontimes. To minimize residual cross-talk, the slices are per-formed in a specific order after the inversion pulse,which maximizes the distance between two consecutiveslices, as shown in Figure 1. The in-plane motion iscompensated for by retrospective image registrationusing a nonrigid image registration algorithm for myocar-dial T1 mapping (27). This algorithm simultaneouslyestimates a nonrigid motion field and intensity varia-tions, and uses an additional regularization term to con-strain the deformation field using automatic featuretracking.
Reconstruction
T1 maps are generated by voxel-wise curve-fitting of theinversion-recovery signal-model to the image intensities.We propose to generate T1 maps with two different sig-nal models:
A: Two-parameter fit model for the inversion recoverysignal S2P, defined by:
S2pðtÞ ¼ M0ð1� 2e�t
T1Þ; [1]
where M0 is the signal with full longitudinal magnetiza-tion recovery and T1 the longitudinal relaxation time.The model assumes perfect inversion pulse efficiencyand no disturbance of magnetization due to imagingpulses before the acquisition of the central k-space line.
B: Three-parameter fit model for the inversion recov-ery signal S3P, defined by:
S3pðtÞ ¼ M0ð1� Be�t
T1Þ; [2]
with an additional parameter B, which models the appa-rent inversion efficiency. This was previously shown to
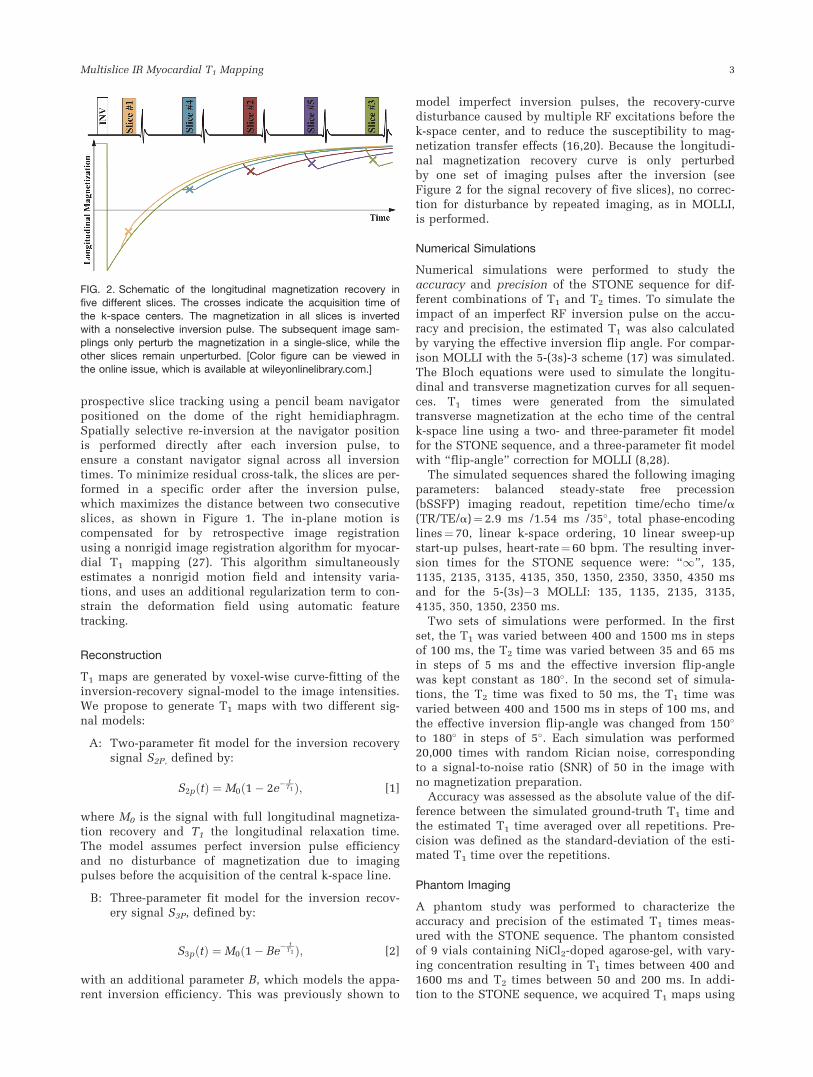
model imperfect inversion pulses, the recovery-curvedisturbance caused by multiple RF excitations before thek-space center, and to reduce the susceptibility to mag-netization transfer effects (16,20). Because the longitudi-nal magnetization recovery curve is only perturbedby one set of imaging pulses after the inversion (seeFigure 2 for the signal recovery of five slices), no correc-tion for disturbance by repeated imaging, as in MOLLI,is performed.
Numerical Simulations
Numerical simulations were performed to study theaccuracy and precision of the STONE sequence for dif-ferent combinations of T1 and T2 times. To simulate theimpact of an imperfect RF inversion pulse on the accu-racy and precision, the estimated T1 was also calculatedby varying the effective inversion flip angle. For compar-ison MOLLI with the 5-(3s)-3 scheme (17) was simulated.The Bloch equations were used to simulate the longitu-dinal and transverse magnetization curves for all sequen-ces. T1 times were generated from the simulatedtransverse magnetization at the echo time of the centralk-space line using a two- and three-parameter fit modelfor the STONE sequence, and a three-parameter fit modelwith “flip-angle” correction for MOLLI (8,28).
The simulated sequences shared the following imagingparameters: balanced steady-state free precession(bSSFP) imaging readout, repetition time/echo time/a(TR/TE/a)¼ 2.9 ms /1.54 ms /35�, total phase-encodinglines¼ 70, linear k-space ordering, 10 linear sweep-upstart-up pulses, heart-rate¼ 60 bpm. The resulting inver-sion times for the STONE sequence were: “1”, 135,1135, 2135, 3135, 4135, 350, 1350, 2350, 3350, 4350 msand for the 5-(3s)�3 MOLLI: 135, 1135, 2135, 3135,4135, 350, 1350, 2350 ms.
Two sets of simulations were performed. In the firstset, the T1 was varied between 400 and 1500 ms in stepsof 100 ms, the T2 time was varied between 35 and 65 msin steps of 5 ms and the effective inversion flip-anglewas kept constant as 180�. In the second set of simula-tions, the T2 time was fixed to 50 ms, the T1 time wasvaried between 400 and 1500 ms in steps of 100 ms, andthe effective inversion flip-angle was changed from 150�
to 180� in steps of 5�. Each simulation was performed20,000 times with random Rician noise, correspondingto a signal-to-noise ratio (SNR) of 50 in the image withno magnetization preparation.
Accuracy was assessed as the absolute value of the dif-ference between the simulated ground-truth T1 time andthe estimated T1 time averaged over all repetitions. Pre-cision was defined as the standard-deviation of the esti-mated T1 time over the repetitions.
Phantom Imaging
A phantom study was performed to characterize theaccuracy and precision of the estimated T1 times meas-ured with the STONE sequence. The phantom consistedof 9 vials containing NiCl2-doped agarose-gel, with vary-ing concentration resulting in T1 times between 400 and1600 ms and T2 times between 50 and 200 ms. In addi-tion to the STONE sequence, we acquired T1 maps using
FIG. 2. Schematic of the longitudinal magnetization recovery infive different slices. The crosses indicate the acquisition time of
the k-space centers. The magnetization in all slices is invertedwith a nonselective inversion pulse. The subsequent image sam-
plings only perturb the magnetization in a single-slice, while theother slices remain unperturbed. [Color figure can be viewed inthe online issue, which is available at wileyonlinelibrary.com.]
Multislice IR Myocardial T1 Mapping 3
5-(3s)�3 MOLLI. A bSSFP imaging readout with the fol-lowing sequence parameters was used for imaging: in-plane resolution¼ 2.1 � 2.1 mm2, slice thickness¼8 mm, field of view (FOV)¼ 360 � 356 mm2, TR/TE/�a¼ 2.9 ms /1.54 ms /35�, SENSE rate¼ 2, number ofphase encoding lines¼ 78, linear k-space ordering, 10linear sweep up pulses. An ECG signal was simulatedwith 60 bpm. Ten repetitions of each sequence were per-formed. The slice-gap in the STONE T1 maps was 8 mm.For all three sequences, a slice-selective Sinc-Gauss RFexcitation pulse with duration of 0.43 ms was used forimaging and an adiabatic hyperbolic-secant inversionpulse with 11 ms pulse-duration for magnetization prep-aration. MOLLI was performed with the acquisition ofonly one slice, aligned to the central slice of the STONEsequence. All DICOM images were exported and used forestimating the voxel-wise T1 maps. The STONE T1 mapswere calculated using both two- and three-parameter fitmodels. MOLLI T1 maps were generated by fitting athree-parameter fit model with additional correction forthe disturbance from the repeated imaging pulses (28).
An inversion recovery spin-echo sequence (IR-SE) wasused to measure reference T1 values for each vial. Fifteen2D IR-SE images were acquired using 15 different inver-sion times between 50 and 5000 ms with the followingimaging parameters: in-plane spatial resolution¼ 1.3 �1.3 mm2, slice-thickness¼ 8 mm, FOV¼ 120 � 120 mm2,TR/TE/�a¼ 10 s/10 ms/90�, and scan time¼ 3:20 h. Voxel-wise T1 times were calculated off-line by fitting a three-parameter fit model to the 15 IR-SE images.
T1 Analysis
For each method, the average T1 time for each vial wasmeasured as the average over a manually drawn regionof interest (ROI) averaged over all repetitions. The accu-racy was defined as the difference between the averageT1 time and the IR-SE T1. Precision was defined as thestandard deviation of the estimated T1 times in the ROIof all repetitions
In Vivo Imaging
We recruited seven healthy adult subjects (four males,age 28 6 12 years), and seven patients (five males, age64 6 10 years) referred for clinical cardiac MR. Thepatient indications and symptoms leading to CMR wereas follows: (i) A postpulmonary vein isolation (PVI)patient suffering from atrial fibrillation (AFib). (ii) Apatient with left ventricular hypertrophy suffering fromdyspnea, which was evaluated for infiltrative diseaseand hypertrophic cardiomyopathy. (iii) A patient withbicuspid aortic valve disease with a dilated aorta. (iv) Apatient with a pericardial cyst, which was scanned forestimation of the cyst mass and chamber compression.(v) A coronary artery disease patient with new viral car-diomyopathy, evaluated for myocarditis. (vi) A cardiacsarcoidosis patient evaluated for scar assessment. (vii) Apatient with palpitations and showing right ventriculardilation and trabeculations, which was scanned for eval-uation of an arrhythmogenic right ventricle.
Each subject was imaged using two sequences: (i)STONE with five slices, (ii) 5-(3s)-3 MOLLI with three sli-
ces acquired in three separate breath-holds. Both sequen-ces were performed using a bSSFP read-out and thefollowing parameters: in-plane resolution¼2.1 �2.1 mm2, slice-thickness¼ 8 mm, FOV¼ 360 � 352 mm2,TR/TE/a¼ 2.6 ms/1.0 ms/35�, SENSE-rate¼ 2, number ofphase encoding lines¼ 78, linear ordering, 10 linearramp-up start-up pulses. Five short-axis slices with 8 mmslice-gap were acquired with the STONE sequence, usinga fixed respiratory navigator slice tracking factor of 0.6.Three slices, aligned to the central three slices of theSTONE sequence, were acquired with MOLLI.
T1 maps from the STONE sequence were generatedusing both two- and three-parameter fit models. MOLLIT1 maps were generated with a three-parameter fit modeland retrospective correction for the magnetization pertur-bation of the imaging pulses.
T1 Measurements
An ROI was manually drawn in the septum for eachmethod and each slice. All three slices were analyzed forMOLLI and only the corresponding central three slices forthe STONE T1 maps. The average T1 time for a patient wasassessed as the average T1 within an ROI averaged over allslices. The mean of the standard deviation of the myocar-dial T1 times within each ROI averaged over all slices wasalso calculated for each subject. T1 times are also pre-sented in an AHA 16 segment model (29). Manuallydrawn epi- and endocardial contours in the central threeslices were used to segment the myocardium with refer-ence to the insertion point of the right ventricle.
Statistical Analysis
The average T1 time and the mean standard deviationwithin the myocardium of the three methods were statis-tically compared using a paired Student’s t-test. A P-value of <0.05 was considered to be statistically signifi-cant. Furthermore, for the STONE method, the averageT1 times were analyzed across the slices. The hypothesisof no statistical significant difference between differentslices was studied using a mixed-effects model analysis.Bonferroni correction was applied which results in astatistically significant threshold P< 0.05 / 10¼ 0.005
RESULTS
Simulation
Accuracy
The accuracy of the three methods with varying simu-lated T1 and T2 times assuming perfect inversion-efficiency (top row), and with varying simulated T1
times and inversion efficiency with constant T2 of 50 ms(bottom row), are compared in Figure 3. The simulationsshow that, the multislice T1 sequence with a three-parameter fit, results in the highest accuracy. TheSTONE sequence with a two-parameter fit model wasmore accurate than MOLLI. The deviation from the trueT1 time with MOLLI and the STONE sequence with atwo-parameter fit increased with longer T1 times, shorterT2 times and worse inversion efficiency, resulting in anunderestimation of up to 306 ms (MOLLI) and 176 ms
4 Weing€artner et al.
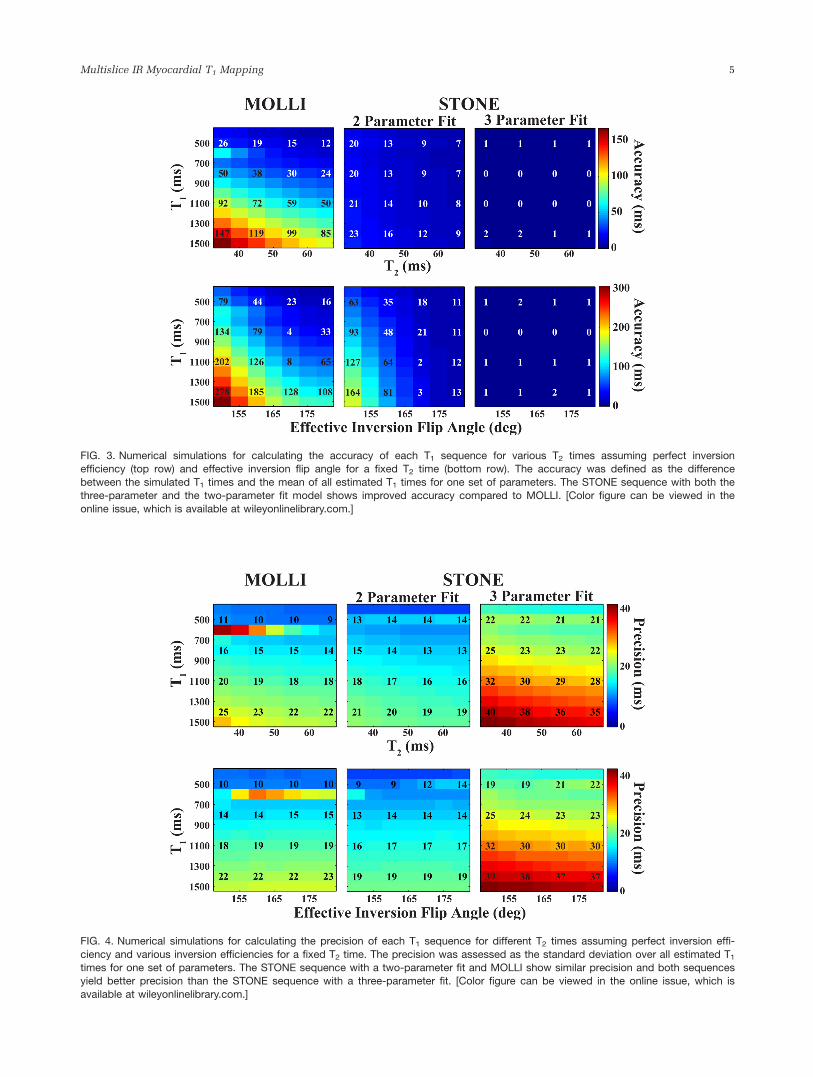
FIG. 3. Numerical simulations for calculating the accuracy of each T1 sequence for various T2 times assuming perfect inversionefficiency (top row) and effective inversion flip angle for a fixed T2 time (bottom row). The accuracy was defined as the difference
between the simulated T1 times and the mean of all estimated T1 times for one set of parameters. The STONE sequence with both thethree-parameter and the two-parameter fit model shows improved accuracy compared to MOLLI. [Color figure can be viewed in the
online issue, which is available at wileyonlinelibrary.com.]
FIG. 4. Numerical simulations for calculating the precision of each T1 sequence for different T2 times assuming perfect inversion effi-
ciency and various inversion efficiencies for a fixed T2 time. The precision was assessed as the standard deviation over all estimated T1
times for one set of parameters. The STONE sequence with a two-parameter fit and MOLLI show similar precision and both sequencesyield better precision than the STONE sequence with a three-parameter fit. [Color figure can be viewed in the online issue, which is
available at wileyonlinelibrary.com.]
Multislice IR Myocardial T1 Mapping 5
(STONE two-parameter). The multislice with a three-parameter fit maintained T1 times close to the spin-echoreference for all simulated ranges of T1 and T2 times(difference< 4 ms). The accuracy for parameters thatcan be expected for in vivo assessment of native T1 times(T1 � 1200 ms, T2 � 50 ms, effective inversion flip-angle� 160� (1)) was 145 ms with MOLLI, 70 ms and 0.1 mswith the STONE sequence using a two- and a three-parameter fit, respectively.
Precision
Figure 4 depicts the precision of the three methods in thesimulation study with varying T1 and T2 times assuming
perfect inversion-efficiency (top row), and with varying T1
times and inversion efficiency with constant T2 of 50 ms(bottom row). The precision of all methods decreases withincreasing T1 and decreasing T2, but with small variationsfor different inversion efficiencies in the numericalsimulations. MOLLI and the STONE method with a two-parameter fit show increased precision compared to theSTONE sequence with a three-parameter fit. The standarddeviation of the estimated T1 time for expected precontrastin vivo parameters (i.e., T1 � 1200 ms, T2 � 50 ms, effec-tive inversion flip-angle � 160� [1]) was 20 ms withMOLLI, 17 ms and 33 ms with STONE using a two- and athree-parameter fit, respectively.
Phantom
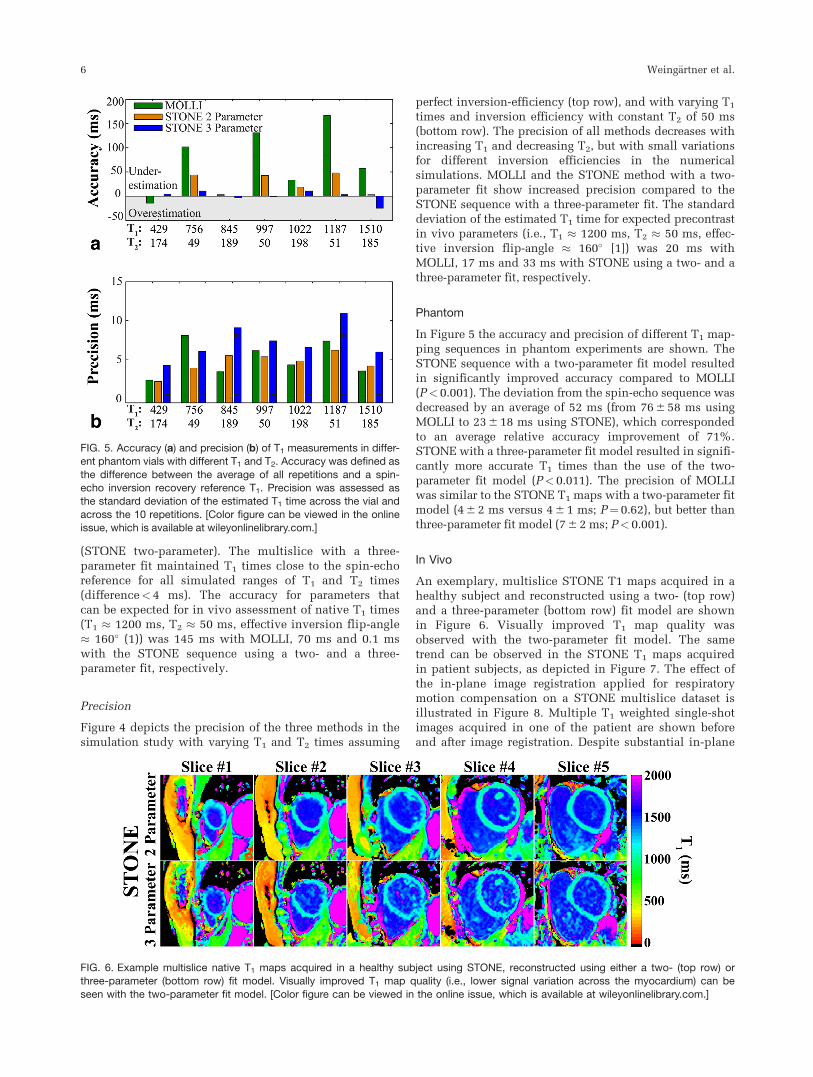
In Figure 5 the accuracy and precision of different T1 map-ping sequences in phantom experiments are shown. TheSTONE sequence with a two-parameter fit model resultedin significantly improved accuracy compared to MOLLI(P<0.001). The deviation from the spin-echo sequence wasdecreased by an average of 52 ms (from 76 6 58 ms usingMOLLI to 23 6 18 ms using STONE), which correspondedto an average relative accuracy improvement of 71%.STONE with a three-parameter fit model resulted in signifi-cantly more accurate T1 times than the use of the two-parameter fit model (P< 0.011). The precision of MOLLIwas similar to the STONE T1 maps with a two-parameter fitmodel (4 6 2 ms versus 4 6 1 ms; P¼ 0.62), but better thanthree-parameter fit model (7 6 2 ms; P< 0.001).
In Vivo
An exemplary, multislice STONE T1 maps acquired in ahealthy subject and reconstructed using a two- (top row)and a three-parameter (bottom row) fit model are shownin Figure 6. Visually improved T1 map quality wasobserved with the two-parameter fit model. The sametrend can be observed in the STONE T1 maps acquiredin patient subjects, as depicted in Figure 7. The effect ofthe in-plane image registration applied for respiratorymotion compensation on a STONE multislice dataset isillustrated in Figure 8. Multiple T1 weighted single-shotimages acquired in one of the patient are shown beforeand after image registration. Despite substantial in-plane
FIG. 5. Accuracy (a) and precision (b) of T1 measurements in differ-ent phantom vials with different T1 and T2. Accuracy was defined as
the difference between the average of all repetitions and a spin-echo inversion recovery reference T1. Precision was assessed asthe standard deviation of the estimated T1 time across the vial and
across the 10 repetitions. [Color figure can be viewed in the onlineissue, which is available at wileyonlinelibrary.com.]
FIG. 6. Example multislice native T1 maps acquired in a healthy subject using STONE, reconstructed using either a two- (top row) orthree-parameter (bottom row) fit model. Visually improved T1 map quality (i.e., lower signal variation across the myocardium) can be
seen with the two-parameter fit model. [Color figure can be viewed in the online issue, which is available at wileyonlinelibrary.com.]
6 Weing€artner et al.
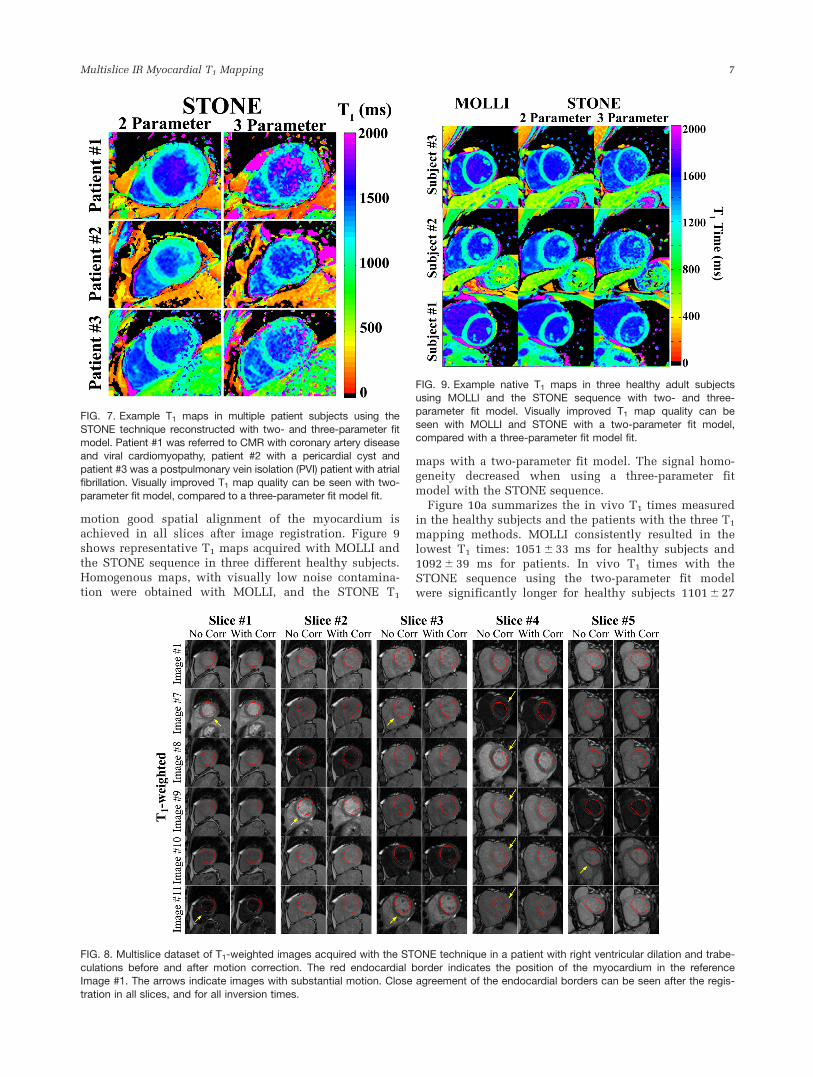
motion good spatial alignment of the myocardium isachieved in all slices after image registration. Figure 9shows representative T1 maps acquired with MOLLI andthe STONE sequence in three different healthy subjects.Homogenous maps, with visually low noise contamina-tion were obtained with MOLLI, and the STONE T1
maps with a two-parameter fit model. The signal homo-geneity decreased when using a three-parameter fitmodel with the STONE sequence.
Figure 10a summarizes the in vivo T1 times measuredin the healthy subjects and the patients with the three T1
mapping methods. MOLLI consistently resulted in thelowest T1 times: 1051 6 33 ms for healthy subjects and1092 6 39 ms for patients. In vivo T1 times with theSTONE sequence using the two-parameter fit modelwere significantly longer for healthy subjects 1101 6 27
FIG. 7. Example T1 maps in multiple patient subjects using the
STONE technique reconstructed with two- and three-parameter fitmodel. Patient #1 was referred to CMR with coronary artery diseaseand viral cardiomyopathy, patient #2 with a pericardial cyst and
patient #3 was a postpulmonary vein isolation (PVI) patient with atrialfibrillation. Visually improved T1 map quality can be seen with two-
parameter fit model, compared to a three-parameter fit model fit.
FIG. 8. Multislice dataset of T1-weighted images acquired with the STONE technique in a patient with right ventricular dilation and trabe-
culations before and after motion correction. The red endocardial border indicates the position of the myocardium in the referenceImage #1. The arrows indicate images with substantial motion. Close agreement of the endocardial borders can be seen after the regis-
tration in all slices, and for all inversion times.
FIG. 9. Example native T1 maps in three healthy adult subjectsusing MOLLI and the STONE sequence with two- and three-
parameter fit model. Visually improved T1 map quality can beseen with MOLLI and STONE with a two-parameter fit model,compared with a three-parameter fit model fit.
Multislice IR Myocardial T1 Mapping 7
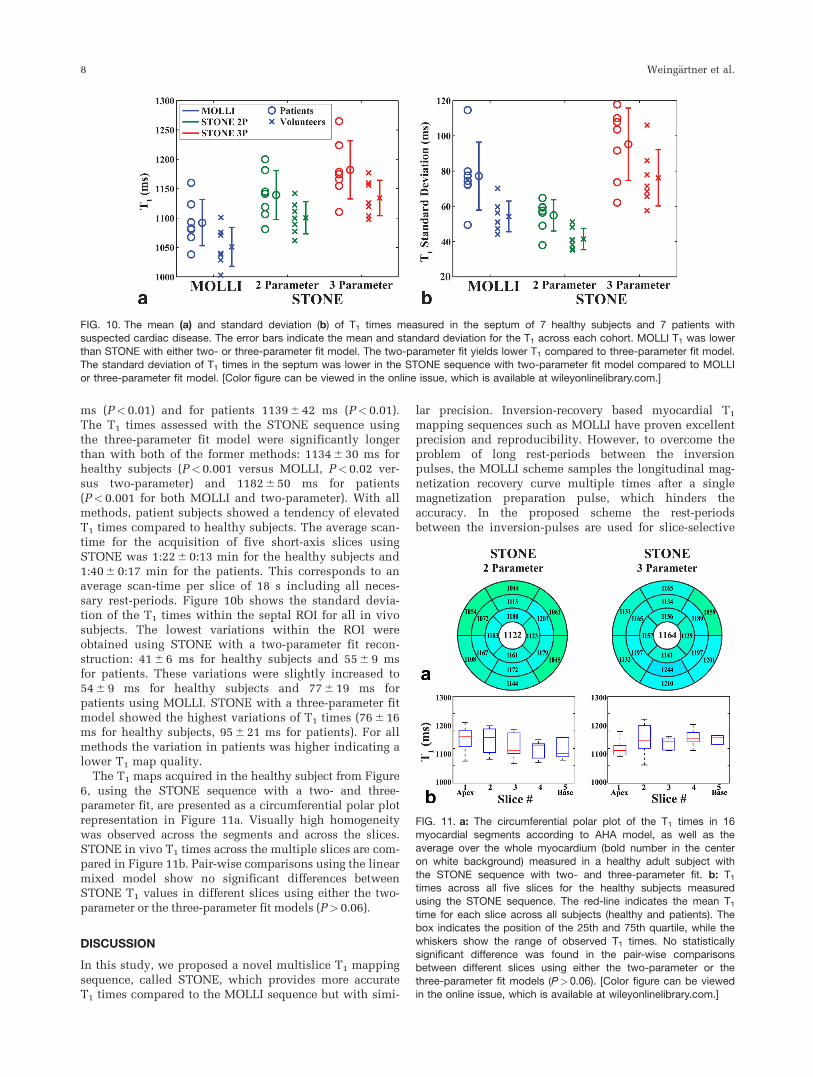
ms (P<0.01) and for patients 1139 6 42 ms (P< 0.01).The T1 times assessed with the STONE sequence usingthe three-parameter fit model were significantly longerthan with both of the former methods: 1134 6 30 ms forhealthy subjects (P<0.001 versus MOLLI, P< 0.02 ver-sus two-parameter) and 1182 6 50 ms for patients(P< 0.001 for both MOLLI and two-parameter). With allmethods, patient subjects showed a tendency of elevatedT1 times compared to healthy subjects. The average scan-time for the acquisition of five short-axis slices usingSTONE was 1:22 6 0:13 min for the healthy subjects and1:40 6 0:17 min for the patients. This corresponds to anaverage scan-time per slice of 18 s including all neces-sary rest-periods. Figure 10b shows the standard devia-tion of the T1 times within the septal ROI for all in vivosubjects. The lowest variations within the ROI wereobtained using STONE with a two-parameter fit recon-struction: 41 6 6 ms for healthy subjects and 55 6 9 msfor patients. These variations were slightly increased to54 6 9 ms for healthy subjects and 77 6 19 ms forpatients using MOLLI. STONE with a three-parameter fitmodel showed the highest variations of T1 times (76 6 16ms for healthy subjects, 95 6 21 ms for patients). For allmethods the variation in patients was higher indicating alower T1 map quality.
The T1 maps acquired in the healthy subject from Figure6, using the STONE sequence with a two- and three-parameter fit, are presented as a circumferential polar plotrepresentation in Figure 11a. Visually high homogeneitywas observed across the segments and across the slices.STONE in vivo T1 times across the multiple slices are com-pared in Figure 11b. Pair-wise comparisons using the linearmixed model show no significant differences betweenSTONE T1 values in different slices using either the two-parameter or the three-parameter fit models (P>0.06).
DISCUSSION
In this study, we proposed a novel multislice T1 mappingsequence, called STONE, which provides more accurateT1 times compared to the MOLLI sequence but with simi-
lar precision. Inversion-recovery based myocardial T1
mapping sequences such as MOLLI have proven excellentprecision and reproducibility. However, to overcome theproblem of long rest-periods between the inversionpulses, the MOLLI scheme samples the longitudinal mag-netization recovery curve multiple times after a singlemagnetization preparation pulse, which hinders theaccuracy. In the proposed scheme the rest-periodsbetween the inversion-pulses are used for slice-selective
FIG. 10. The mean (a) and standard deviation (b) of T1 times measured in the septum of 7 healthy subjects and 7 patients withsuspected cardiac disease. The error bars indicate the mean and standard deviation for the T1 across each cohort. MOLLI T1 was lower
than STONE with either two- or three-parameter fit model. The two-parameter fit yields lower T1 compared to three-parameter fit model.The standard deviation of T1 times in the septum was lower in the STONE sequence with two-parameter fit model compared to MOLLI
or three-parameter fit model. [Color figure can be viewed in the online issue, which is available at wileyonlinelibrary.com.]
FIG. 11. a: The circumferential polar plot of the T1 times in 16myocardial segments according to AHA model, as well as the
average over the whole myocardium (bold number in the centeron white background) measured in a healthy adult subject with
the STONE sequence with two- and three-parameter fit. b: T1
times across all five slices for the healthy subjects measuredusing the STONE sequence. The red-line indicates the mean T1
time for each slice across all subjects (healthy and patients). Thebox indicates the position of the 25th and 75th quartile, while the
whiskers show the range of observed T1 times. No statisticallysignificant difference was found in the pair-wise comparisonsbetween different slices using either the two-parameter or the
three-parameter fit models (P>0.06). [Color figure can be viewedin the online issue, which is available at wileyonlinelibrary.com.]
8 Weing€artner et al.
imaging of other slices. This allows for sampling of anundisturbed magnetization recovery curve without theneed for extensive rest-periods, resulting in a scan-time ofless than 20 s per slice, while not requiring a correctionfor the disturbance of the imaging pulses of a repeatedimaging read-out.
Residual disturbance of the longitudinal magnetizationmight be induced by the excitation in neighboring slices,due to imperfect slice-profiles, residual respiratory motionor cardiac motion. To minimize the through-plane motion,prospective slice tracking using a respiratory navigatorwas performed and the slice ordering was chosen to maxi-mize the distance between slices in successive heartbeats.We used an 8 mm slice gap with five slices to minimizethe potential cross-talk effects. We arbitrarily chose thenumber and location of the sampling points on the T1
recovery curve to parallel that of a MOLLI sequence. Dif-ferent number of sampling points or slices, allowing forincreased slice-gap, may be achieved by a slight modifica-tion of the imaging sequence, but this was not studied.
Respiratory and cardiac motion are known to be majordetrimental factors for the quality of myocardial T1maps. As previously proposed methods, includingMOLLI, the proposed STONE technique is based on par-allel imaging accelerated 2D single-shot images with anacquisition window length of approximately 200 ms.Hence, the proposed technique is equally susceptible toblurring induced in the single-shot images by cardiacmotion during the acquisition window. However, as theproposed technique is performed during free-breathing,heavy respiratory motion during the acquisition windowcan potentially lead to an increased level of blurring inthe single-shot images compared to MOLLI.
The SSFP startup pulses and acquisition of multiple k-space lines in the linear ordering disturb the longitudi-nal magnetization before the central k-space line isacquired. However, it has been shown that the effect ofpulses in single-shot bSSFP imaging, as used in mostrecent T1 mapping sequences, on the longitudinal mag-netization can be modeled as an affine transformation(30). Hence, the accuracy is maintained if a three-parameter fit model is used. However, if a two-parameterfit model is used these pulses induce dependence on theT2 time, the flip-angle and the TR (20), as well as theinversion-efficiency. As the numerical simulations andthe phantom experiments show, this loss in accuracywith the proposed sequence is considerably lower thanfor the case of repeated imaging of a disturbed longitudi-nal magnetization used in MOLLI. As shown in Kellmanand Hansen (31) and observed in this study, a fit withthe two-parameter fit model provides a significant gainof precision with a trade-off of decreased accuracy.
The flip-angle was chosen as 35� for the proposedsequence to minimize the loss in accuracy if a two-parameter fit model is used for reconstruction. A higherflip-angle causes greater disturbance of the magnetizationbefore the acquisition of the central k-space line. Hence,if STONE is used with the two-parameter fit model inthis case, the accuracy of the method will be impaired.On the other hand, a higher flip-angle leads to animproved image SNR, resulting in better precision.Hence, if STONE is used with a three-parameter fit
model only, the application of a high flip-angle mayincrease the precision, without impairing the accuracy, ifsufficient rest-periods are inserted. Further studies inoptimizing the flip angle are needed to investigate thetrade-off between accuracy and precision for the pro-posed STONE sequence.
A phase-sensitive reconstruction has previously beenproposed for MOLLI T1 mapping (32). In this reconstruc-tion the phase information is used to restore the signalpolarity of the magnitude images before the T1 fit, elimi-nating the need for integrated polarity restoration basedon the fit residual. This was shown to increase the preci-sion of inversion recovery based T1 mapping sequences.The phase-maps of the 2D single-shot images acquiredwith the STONE technique, can be spatially registeredusing the deformation maps obtained in the magnitudeimage registration. This potentially allows for phase-information based polarity restoration and the applica-tion of the phase-sensitive reconstruction technique.Future research is warranted to study the increase in pre-cision using a phase-sensitive reconstruction in STONE.
For the in vivo T1 time analysis, the standard deviationof the T1 times within a septal ROI was used as a surro-gate for the in vivo precision. This measure is highly sus-ceptible to the positioning of the ROI, partial volumingeffects and artifacts. Hence, its use as a surrogate for thenoise-resilience of a T1 mapping technique is limited.
The accuracy of the T1 times could not be comparedin vivo as there is currently no feasible method for theacquisition of reference T1 times in the myocardiumavailable. However, careful evaluations in simulationsand phantom measurements indicate improved accuracywith the proposed technique. Furthermore, STONEresults in longer in vivo T1 times than MOLLI, which isknown to underestimate the native T1 values (14).
The proposed method was implemented and tested ona 1.5T scanner only. Higher magnetic field strength maybe advantageous for myocardial T1 mapping due tohigher SNR, which can improve the precision of the T1
maps. Improved SNR will also enable shortened acquisi-tion window lengths of the single-shot images whichreduces the impact of cardiac motion. However, bSSFPimaging at 3T may also result in increased artifacts dueto off-resonance. Furthermore, achieving perfectinversion-pulses will be more challenging, which couldimpact accuracy of the measurement using a two-parameter fit-model. Comprehensive evaluation of thistechnique at 3T is warranted.
Although the sequence can be applied for postcontrastT1 mapping, this was not analyzed in the current study.The precise estimation of short postcontrast T1 timesmay require a denser sampling of short-inversion times.With the STONE sequence, this can be achieved byreducing the number of slices, and increasing the num-ber of imaging sets by varying the TI. In addition to post-contrast T1 of myocardium, the blood T1 is also neededfor calculation of ECV. For blood T1, the impact ofinflow saturation and disturbance of the inflowing bloodneed to be taken into account. However for blood T1,usually only a single value is needed. Further studies arewarranted to investigate the accuracy and precision ofECV calculation for the STONE sequence.
Multislice IR Myocardial T1 Mapping 9
CONCLUSIONS
The STONE sequence allows accurate and precise esti-mation of native myocardial T1 times over multipleslices.
ACKNOWLEDGMENT
Sebastian Weing€artner is supported by a fellowship fromthe Deutsche Telekom Stiftung.
REFERENCES
1. Kellman P, Herzka DA, Hansen MS. Adiabatic inversion pulses for
myocardial T1 mapping. Magn Reson Med 2013;71:1428–1434.
2. Messroghli DR, Walters K, Plein S, Sparrow P, Friedrich MG,
Ridgway JP, Sivananthan MU. Myocardial T1 mapping: application
to patients with acute and chronic myocardial infarction. Magn Reson
Med 2007;58:34–40.
3. Mewton N, Liu CY, Croisille P, Bluemke D, Lima JAC. Assessment of
myocardial fibrosis with cardiovascular magnetic resonance. J Am
Coll Cardiol 2011;57:891–903.
4. Ng ACT, Auger D, Delgado V, et al. Association between diffuse myo-
cardial fibrosis by cardiac magnetic resonance contrast-enhanced T1
mapping and subclinical myocardial dysfunction in diabetic patients:
a pilot study. Circ Cardiovasc Imaging 2012;5:51–59.
5. Iles L, Pfluger H, Phrommintikul A, Cherayath J, Aksit P, Gupta SN,
Kaye DM, Taylor AJ. Evaluation of diffuse myocardial fibrosis in
heart failure with cardiac magnetic resonance contrast-enhanced T1
mapping. J Am Coll Cardiol 2008;52:1574–1580.
6. Sibley CT, Noureldin RA, Gai N, et al. T1 Mapping in cardiomyopa-
thy at cardiac MR: comparison with endomyocardial biopsy. Radiol-
ogy 2012;265:724–732.
7. Arheden H, Saeed M, Higgins CB, Gao DW, Bremerich J, Wyttenbach
R, Dae MW, Wendland MF. Measurement of the distribution volume
of gadopentetate dimeglumine at echo–planar MR imaging to quantify
myocardial infarction: comparison with 99mTc-DTPA autoradiogra-
phy in rats. Radiology 1999;211:698–708.
8. Messroghli DR, Radjenovic A, Kozerke S, Higgins DM, Sivananthan
MU, Ridgway JP. Modified Look-Locker inversion recovery (MOLLI)
for high-resolution T1 mapping of the heart. Magn Reson Med 2004;
52:141–146.
9. Messroghli DR, Plein S, Higgins DM, Walters K, Jones TR, Ridgway
JP, Sivananthan MU. Human myocardium: single-breath-hold MR T1
mapping with high spatial resolution - reproducibility study. Radiol-
ogy 2006;238:1004–1012.
10. Kawel N, Nacif M, Zavodni A, Jones J, Liu S, Sibley C, Bluemke D.
T1 mapping of the myocardium: intra-individual assessment of post-
contrast T1 time evolution and extracellular volume fraction at 3T for
Gd-DTPA and Gd-BOPTA. J Cardiovasc Magn Reson 2012;14:26.
11. Rogers T, Dabir D, Mahmoud I, Voigt T, Schaeffter T, Nagel E,
Puntmann VO. Standardization of T1 measurements with MOLLI in
differentiation between health and disease - the ConSept study.
J Cardiovasc Magn Reson 2013;15:78.
12. Raman FS, Kawel-Boehm N, Gai N, Freed M, Han J, Liu CY, Lima JA,
Bluemke DA, Liu S. Modified look-locker inversion recovery T1 map-
ping indices: assessment of accuracy and reproducibility between
magnetic resonance scanners. J Cardiovasc Magn Reson 2013;15:64.
13. Kellman P, Herzka DA, Arai AE, Hansen MS. Influence of Off-
resonance in myocardial T1-mapping using SSFP based MOLLI
method. J Cardiovasc Magn Reson 2013;15:63.
14. Piechnik S, Ferreira V, Dall’Armellina E, Cochlin L, Greiser A,
Neubauer S, Robson M. Shortened Modified Look-Locker Inversion
recovery (ShMOLLI) for clinical myocardial T1-mapping at 1.5 and 3 T
within a 9 heartbeat breathhold. J Cardiovasc Magn Reson 2010;12:69.
15. Chow K, Flewitt J, Pagano J, Green J, Friedrich M, Thompson R. T2-
dependent errors in MOLLI T1 values: simulations, phantoms, and
in-vivo studies. J Cardiovasc Magn Reson 2012;14:1–2.
16. Robson MD, Piechnik SK, Tunnicliffe EM, Neubauer S. T measure-
ments in the human myocardium: the effects of magnetization trans-
fer on the SASHA and MOLLI sequences. Magn Reson Med 2013;70:
664–670.
17. Kellman P, Arai AE, Xue H. T1 and extracellular volume mapping in
the heart: estimation of error maps and the influence of noise on pre-
cision. J Cardiovasc Magn Reson 2013;15:56.
18. Roujol S, Weingartner S, Foppa M, Chow K, Kawaji K, Ngo L,
Kellman P, Manning WJ, Thompson RB, Nezafat R. Accuracy and
reproducibility of four T1 mapping sequences: A head-to-head com-
parison of MOLLI, ShMOLLI, SASHA, and SAPPHIRE. Radiology
2014. doi: 10.1148/radiol.14140296.
19. Higgins DM, Ridgway JP, Radjenovic A, Sivananthan UM, Smith MA.
T1 measurement using a short acquisition period for quantitative car-
diac applications. Med Phys 2005;32:1738–1746.
20. Chow K, Flewitt JA, Green JD, Pagano JJ, Friedrich MG, Thompson
RB. Saturation recovery single-shot acquisition (SASHA) for myocar-
dial T mapping. Magn Reson Med 2014;71:2082–2095.
21. Weing€artner S, Akcakaya M, Basha T, Kissinger KV, Goddu B, Berg
S, Manning WJ, Nezafat R. Combined saturation/inversion recovery
sequences for improved evaluation of scar and diffuse fibrosis in
patients with arrhythmia or heart rate variability. Magn Reson Med
2014;71:1024–1034.
22. Puntmann VO, D’Cruz D, Smith Z, Pastor A, Choong P, Voigt T, Carr-
White G, Sangle S, Schaeffter T, Nagel E. Native myocardial T1 map-
ping by cardiovascular magnetic resonance imaging in subclinical
cardiomyopathy in patients with systemic lupus erythematosus. Circ
Cardiovasc Imaging 2013;6:295–301.
23. Ellims AH, Iles LM, Ling LH, Hare JL, Kaye DM, Taylor AJ. Diffuse
myocardial fibrosis in hypertrophic cardiomyopathy can be identified
by cardiovascular magnetic resonance, and is associated with left
ventricular diastolic dysfunction. J Cardiovasc Magn Reson 2012;14:
76.
24. Lu M, Zhao S, Yin G, et al. T1 mapping for detection of left ventricu-
lar myocardial fibrosis in hypertrophic cardiomyopathy: a prelimi-
nary study. Eur J Radiol 2013;82:e225–e231.
25. Weing€artner S, Akcakaya M, Roujol S, Basha T, Stehning C, Kissinger
KV, Goddu B, Berg S, Manning WJ, Nezafat R. Free-breathing post-
contrast three-dimensional T1 mapping: volumetric assessment of
myocardial T1 values. Magn Reson Med 2014. doi: 10.1002/
mrm.25124.
26. Clique H, Cheng H-LM, Marie P-Y, Felblinger J, Beaumont M. 3D
myocardial T1 mapping at 3T using variable flip angle method: pilot
study. Magn Reson Med 2014;71:823–829.
27. Roujol S, Foppa M, Weingartner S, Manning WJ, Nezafat R. Adaptive
registration of varying contrast-weighted images for improved tissue
characterization (ARCTIC): Application to T1 mapping. Magn Reson
Med 2014. doi: 10.1002/mrm.25270.
28. Deichmann R, Haase A. Quantification of T1 values by SNAPSHOT-
FLASH NMR imaging. J Magn Reson 1992;96:608–612.
29. Cerqueira MD, Weissman NJ, Dilsizian V, Jacobs AK, Kaul S, Laskey
WK, Pennell DJ, Rumberger JA, Ryan T, Verani MS. Standardized
myocardial segmentation and nomenclature for tomographic imaging
of the heart. A statement for healthcare professionals from the Car-
diac Imaging Committee of the Council on Clinical Cardiology of the
American Heart Association. Circulation 2002;105:539–542.
30. Scheffler K. On the transient phase of balanced SSFP sequences.
Magn Reson Med 2003;49:781–783.
31. Kellman P, Hansen MS. T1-mapping in the heart: accuracy and preci-
sion. J Cardiovasc Magn Reson 2014;16:2.
32. Xue H, Greiser A, Zuehlsdorff S, Jolly M-P, Guehring J, Arai AE,
Kellman P. Phase-sensitive inversion recovery for myocardial T1
mapping with motion correction and parametric fitting. Magn Reson
Med 2013;69:1408–1420.
10 Weing€artner et al.