transforming india’s lifelines - ruchi soya · nutrition security food processing agriculture...
TRANSCRIPT

N U T R I T I O N S E C U R I T Y
F O O D P R O C E S S I N G
A G R I C U LT U R E
T R A N S F O R M I N G I N D I A’ S L I F E L I N E S
RUCHI SOYA INDUSTRIES LIMITED31 ST ANNUAL REPORT 2016-17

Forward-looking StatementsIn this Annual Report, we have disclosed forward-looking information to enable investors to comprehend our prospects and take investment decisions. This report and other statements - written and oral - that we periodically make contain forward-looking statements that set out anticipated results based on the management’s plans and assumptions. We have tried, wherever possible, to identify such statements by using words such as ‘anticipate’, ‘estimate’, ‘expect’, ‘project’, ‘intend’, ‘plan’, ‘believe’, and words of similar substance in connection with any discussion of future performance. We cannot guarantee that these forward-looking statements will be realised, although we believe that we have been prudent in our assumptions. The achievements of results are subject to risks, uncertainties and even inaccurate assumptions. Should known or unknown risks or uncertainties materialise, or should underlying assumptions prove inaccurate, actual results could vary materially from those anticipated, estimated or projected. Readers should keep this in mind. We undertake no obligation to publicly update any forward-looking statement, whether as a result of new information, future events or otherwise.
CORPORATE OVERVIEW 01-08
Transforming India’s Lifeline 01
Ruchi Soya in a Nutshell 02
Edible Oil Business in India 03
Food Business in India 03
Manufacturing Locations 04
Capacity Break-up 05
Financial Performance 05
Message from the Managing Director 06
Enabling Community Growth 08
51-223FINANCIAL STATEMENTS
Standalone Financial Statements 51
Consolidated Financial Statements 137
NOTICE 224-234
09-50STATUTORY REPORTS
Directors’ Report 09
Management Discussion and Analysis Report 37
Corporate Governance Report 42
CONTENTS
Ruchi Soya is associated with close to 1 crore farmers through soybean, palm, mustard and other crops

At Ruchi Soya Industries, we are acutely aware of the importance of this lifeline and are continually working with our family of over 10 million farmers to strengthen and protect this crucial aspect of the country’s economy. In the key oilseed crop of soybean, we impact close to 4 million famers.
Agriculture in India is still dependent on the monsoon with only around 35% of agricultural land covered by irrigation. At Ruchi Soya, we are encouraging and working with our family of farmers to increase the use of drip irrigation techniques to achieve ‘per drop more crop’. We also organise camps to educate farmers on the latest developments in agri-technology.
Farmers need assurance in the face of the vagaries of nature. Ruchi’s palm plantation business touches the lives of over 50,000 farmers, with farm inputs, technical assistance and other farming techniques to benefit farmers in achieving better productivity and income growth with the added surety of the offtake arrangement. The farmer count is expected to double with additional area under palm cultivation in a span of 5 years. A similar approach is followed in Ruchi’s association with farmers cultivating other crops like soybean, mustard or castor. Ruchi Soya believes that its pro farmer initiatives and efforts are in line with the vision of our Hon’ble Prime Minister to double farmers’ incomes by 2022.
In the last two years, Ruchi Soya has signed MOUs with the states of Maharashtra, Rajasthan and Karnataka for setting up post-harvest management facilities including agri-produce
Agriculture constitutes the lifeline of the Indian economy and this holds as true today as it was in early and medieval India. With the second largest agriculture land globally, agriculture provides livelihood to around 58% of India’s population. But there are still areas which need to be transformed to secure the country’s lifeline for an assured future.
procurement, warehousing, cold storage and processing facilities.
Ruchi Soya has also been an ardent promoter of nutritional security for all Indians since its inception. In line with this vision, our company has undertaken massive fortification programs for our cooking oil products. This micro-nutrient fortification program has helped millions of Indians gain the advantage of good health. As one of the leading manufacturers of soya products, Ruchi Soya has helped ensure high quality vegetarian protein availability for masses.
TRANSFORMING INDIA’S LIFELINE
In the last two years, Ruchi Soya has signed MOUs with the states of Maharashtra, Rajasthan and Karnataka for setting up post-harvest management facilities including agri-produce procurement, warehousing, cold storage and processing facilities.
Ruchi Soya believes that its pro farmer initiatives and efforts are in line with the vision of our Hon’ble Prime Minister to double farmers’ incomes by 2022.

Committed to renewable energy, environmental protection and sustainability
31 Years of corporate existence
19 Manufacturing locations across India
11.5 LAKHS No. of retail outlets
5,800 No. of Distributors
118 No. of Company Depots
2 LAKHS + HECTARES Land access in India for palm oil plantations with exclusive procurement rights across six states
RUCHI SOYA IN A NUTSHELL
India’s No.1 food and agriproducts company as per Fortune India 500 Rankings - 2016
Enjoys leadership position in soy foods category in India and is among India’s largest players in the cooking oils segment
Owns leading brands - Nutrela, Mahakosh, Sunrich, Ruchi Gold and Ruchi Star
Among the pioneers of oil palm plantation in India
One of the leading exporters of value-added soybean products - soy meal, textured soy protein and soy lecithin
Ruchi Soya Industries Limited
2

Premium
BrandsPremium
Value
Value Value Mass
Overview Presence in both branded
and non-branded segments with participation in domestic and international markets
One of the largest exporters of value-added soy products like Textured Soy Protein, Toasted/ Un-toasted/ White Soy Flakes and Soy Lecithin
Sunflower Soyabean Mustard
Nutrela – 70% market share in India in premium soya chunks
Commands a premium of 50% to other popular brands
Mahakosh Hunky Chunky – Fighter brand to convert loose users into branded consumers
Soyabean Sunflower Rice Bran Cotton Seed Filtered Groundnut Oil Mustard Oil
Sunrich Refined Sunflower Oil
Refined Palmolein Mustard Oil
(Kachchi Ghani)
FOOD BUSINESS IN INDIA
Ruchi Soya’s objective has been to cater to Indian consumers across varied price points. To meet this end it has created multiple brands across categories - be it premium, value or mass; covering the entire length and breadth of the country.
EDIBLE OIL BUSINESS IN INDIA
Nutrela Healthy Oils
Nutrela
Mahakosh Hunky Chunky
SunrichMahakosh Refined Edible Oils
Ruchi Gold
Brand Ambassador Brand Ambassador
Madhuri Dixit Popular South Indian actress, Priyanka Upendra
RUCHI SOYATotal Branded
Sales ` 8,646 Crores (2016-17)
OTHER PRODUCTS
Ruchi Star Soyabean Oil Ruchi No. 1 - Vanaspati
Annual Report 2016-17
3

MANUFACTURING LOCATIONS
19 Manufacturing Locations Across India1. Jammu2. Sri Ganganagar3. Baran4. Kota5. Guna6. Kandla 7. Gadarwara8. Haldia9. Manglia10. Nagpur
11. Washim12. Daloda13. Patalganga14. Mangalore15. Chennai16. Kakinada17. Vijayawada18. Durgawati19. Peddapuram
2
345
69
1011
12
13
19
14 15
1617
187
8
1
Proximity to Ports Proximity to strategic inland locations for sourcing and distribution Pan-India Manufacturing Footprint
Note: Map not to scale
Ruchi Soya Industries Limited
4
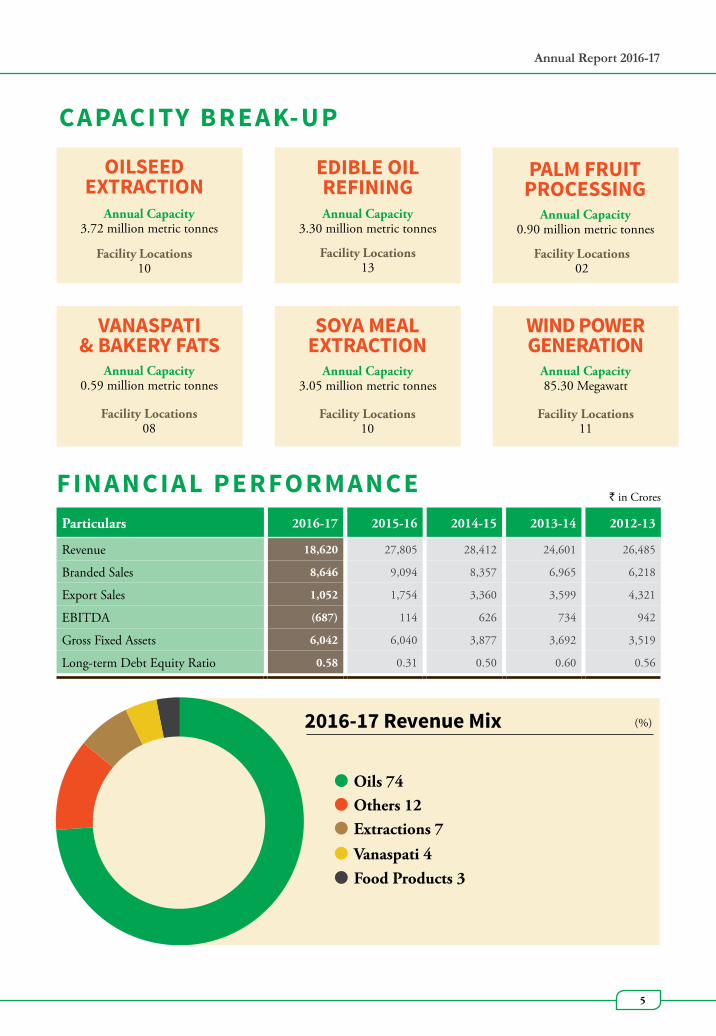
CAPACITY BREAK-UP
FINANCIAL PERFORMANCE
OILSEED EXTRACTION
Annual Capacity 3.72 million metric tonnes
Facility Locations 10
EDIBLE OIL REFININGAnnual Capacity
3.30 million metric tonnes
Facility Locations 13
PALM FRUIT PROCESSING
Annual Capacity 0.90 million metric tonnes
Facility Locations 02
VANASPATI & BAKERY FATS
Annual Capacity 0.59 million metric tonnes
Facility Locations 08
SOYA MEAL EXTRACTION
Annual Capacity 3.05 million metric tonnes
Facility Locations 10
WIND POWER GENERATION
Annual Capacity 85.30 Megawatt
Facility Locations 11
Particulars 2016-17 2015-16 2014-15 2013-14 2012-13
Revenue 18,620 27,805 28,412 24,601 26,485
Branded Sales 8,646 9,094 8,357 6,965 6,218
Export Sales 1,052 1,754 3,360 3,599 4,321
EBITDA (687) 114 626 734 942
Gross Fixed Assets 6,042 6,040 3,877 3,692 3,519
Long-term Debt Equity Ratio 0.58 0.31 0.50 0.60 0.56
` in Crores
2016-17 Revenue Mix
Oils 74
Extractions 7Others 12
Vanaspati 4Food Products 3
(%)
Annual Report 2016-17
5

DEAR SHAREHOLDERS,We entered 2016-17 hoping for a good monsoon, but an erratic monsoon did not allow agribusiness the opportunity to fully recover from the effects of the previous years of bad weather. It would be pertinent to point out that after the floods in 2013 the back to back failure of the monsoons in 2014 and 2015 occurred only for the third time in the last 143 years. The brunt of this drought was faced mainly by the farmers and agri-commodity industry, and the effects spilled over leading to our reporting losses for the second time.
But in these trying times, it has been the trust of our customers and stakeholders that have seen us emerge stronger to face tomorrow with faith and conviction. Our strength in these
MESSAGE FROM THE MANAGING DIRECTOR
difficult times has come from our relentless focus on quality to make us the most reliable edible oil and soy foods manufacturer today.
TAKING ACTIONWe have not stood silently but have faced the challenges with a clear strategy. As an integrated agribusiness leader with a presence from farm to fork, we have worked on the various aspects of our business to limit the negatives and enhance the positives. We undertook consolidation of our operations and rationalised production in line with availability of raw materials and market demand. We also implemented certain austerity measures and cost-cutting initiatives. These include implementation of
But in these trying times, it has been the trust of our customers and stakeholders that have seen us emerge stronger to face tomorrow with faith and conviction. Our strength in these difficult times has come from our relentless focus on quality to make us the most reliable edible oil and soy foods manufacturer today.
Ruchi Soya Industries Limited
6

7
energy efficient technologies at the plant level, optimisation of crushing capacities and plant operations,
A conscious decision was taken to reduce exposure to the low margin trading businesses. Instead, we have focussed on strengthening our manufacturing, brands and distribution with an eye on operational efficiency to emerge leaner and stronger. This is reflected in the increased contribution of our branded FMCG business to the topline. Our brands Nutrela, Mahakosh and Ruchi Gold continue to be leaders in their areas and hold great promise for the future. Our value-added food products, Textured Soy Protein (TSP) under the brands Nutrela and Mahakosh, displayed strong growth. A positive note was an increase in the export of Oil Seed Extractions to the tune of over 50%.
Edible Oil Processing and Packaging as per the agreements with Patanjali Ayurved began and we are sure that this will contribute to improving Ruchi Soya’s capacity utilisation, efficiency and profitability. The fruits of our labour will be visible in the coming years.
The demonetisation in November 2016 was a step to benefit the nation in the long run. Farmers faced problems in the immediate aftermath of demonetisation due to cash being their primary mode of transaction. To support the farmers through this difficult period, Ruchi Soya launched the ‘Kisan Kalyan Ayojan’ digital banking initiative to educate and guide farmers to the transition to a digital economy. Through this initiative, we have helped over 30,000 farmers to make the move to cashless transactions.
The recent increase in import duty on edible oils is a big positive for organised edible oil players. The increase in duty differential from 7.5% to 10% between refined and crude palm oil will bring down the quantum of refined palm oil imports and give an impetus to the domestic refining industry by encouraging import of crude palm oil. This is in line with the ‘Make in India’ credo as we move towards nutritional security.
LOOKING AHEADThe future is bright and promising. India’s large population backed
by rising urban and rural incomes is a key to increasing demand for agricultural products. The government is operationalising many schemes to ensure that agriculture gets the right stimulus to meet future demand. The schemes launched include the Pradhan Mantri Fasal Bima Yojana for crop insurance, Pradhan Mantri Krishi Sinchayee Yojana for promoting investment in irrigation, the Paramparagat Krishi Vikas Yojana to promote organic farming and the setting up of the Agricultural Technology Management Agency for delivering services and information to farmers.
The Hon’ble Prime Minister’s announcements on the eve of 2017 have also shone a positive light on the farmer’s future with a long-term vision to provide farmers better access to loans from co-operative banks and societies through a fund infusion into NABARD. Even small farmers will have access to credit with the incorporation of ‘Kisan Credit Cards’ into the ‘RuPay’ fold.
India’s agricultural sector provides more jobs and sustainable incomes than all other sectors put together. India’s agricultural products fetch higher earnings than even trade in services or manufacturing. With proactive support, India can further enhance its farm exports and contribute to the nation’s prosperity and development. Progress in agriculture will also address other glaring social problems like village and town planning, urban migration and access to basic health care and nutrition in rural areas. Better access to credit for farmers will help them gain sustainable incomes and invest in assets for growth and better returns.
DINESH SHAHRAManaging Director A conscious decision
was taken to reduce exposure to the low margin trading businesses. Instead, we have focussed on strengthening our manufacturing, brands and distribution with an eye on operational efficiency to emerge leaner and stronger.
The future is bright and promising. India’s large population backed by rising urban and rural incomes is a key to increasing demand for agricultural products. The government is operationalising many schemes to ensure that agriculture gets the right stimulus to meet future demand.
Annual Report 2016-17
7

ENABLING COMMUNITY GROWTH
As a corporate citizen, we consider community as an integral part of our growth strategy. And thus, undertake significant initiatives to improve the quality of life of marginalised communities. We make earnest efforts to bring significant and lasting change among socially and economically backward communities by promoting education, healthcare, livelihoods, and rural and urban infrastructure, among others.
At Ruchi Soya, we constantly align our business priorities with social responsibility, which help us move towards a sustainable future.
We undertake interventions in the areas of sports, disaster relief, conservation of environment and so on. Majority of our CSR activities and programmes are carried out by our CSR arm - Shri Mahadeo Shahra Sukrat Trust.
We organise self-help group (SHG) training and IGP Workshops for women empowerment, and are involved with Gau Shakti project, Village Quality Education Programme, among others. Besides, we support self-learning centres, computer training programmes, science exhibition to promote education and so on. We also conduct health check-up camps, cataract camps and facilitate surgeries.
Kisan Kalyan Ayojan In the aftermath of demonetisation, we embarked on a nationwide initiative
– ‘Kisan Kalyan Ayojan’. This activity is an effort to train farmers and induct them into the digital ecosystem. In many ways, it was an extension of the foundation laid by us in Andhra Pradesh - about two decades back we introduced cashless transactions by helping palm farmers open bank accounts.
Through this programme, we engaged with thousands of farmers across India including Nagpur in Maharashtra, Indore in Madhya Pradesh and Lunglei in Mizoram, among others. We conducted this digitalisation drive with the support of nationalised banks including State Bank of India.
Mr. Rajesh Sonkar, MLA (centre) with Mr. Sushil Doshi (to his left), followed by Mr. Varad Murti Mishra, Additional Collector & CEO Zila Panchayat and Pradeep Koolwal, Global Head of Crushing, Ruchi Soya Industries Limited at the launch of ‘Kisan Kalyan Ayojan’ in Indore (MP)
Farmers from Indore and surrounding areas participating in Ruchi Soya’s digital banking drive in partnership with SBI
‘Navi Disha’ Women’s Empowerment Planning Workshop conducted by Ruchi Soya in Patalganga (near Navi Mumbai)
Ruchi Soya Industries Limited
8

Annual Report 2016-17
9
Directors’ Report
INDIAN ACCOUNTING STANDARDS (Ind AS)
As mandated by the Ministry of Corporate Affairs, the Companyhas adopted Indian Accounting Standards (“Ind AS”) from1st April, 2016 with a transition date of 1st April, 2015. The financialstatements of the Company for the financial year 2016-17 have beenprepared in accordance with Ind AS, prescribed under Section 133of the Companies Act, 2013 read with the Companies (IndianAccounting Standards) Rules, 2015 and the other recognizedaccounting practices and policies to the extent applicable.
TRANSFER TO RESERVES
The Company has not transferred any amount to the reservesduring the year under review.
DIVIDEND
Considering the continued weak performance of the Companyand losses incurred during the year, the Board of Directors
does not recommend any dividend for the year ended31st March, 2017.
OPERATIONS AND STATE OF AFFAIRS
During the year under review, the total revenue of your Companywas ̀ 18,620.38 Crores as against ` 27,805.18 Crores during theprevious financial year. The Company has incurred loss after taxof ` 1,257.20 Crores as compared to loss after tax of` 1,061.58 Crores during the previous year. The performance forthe year under review was primarily impacted due to stretchedworking capital cycle, lower level of liquidity impacting capacityutilization and business operations.
The performance of the company has been adversely affectedduring the last couple of years on account of factors beyond thecontrol of the company. The company is primarily engaged inAgro commodities/commodities sector which are heavily subject
(` in Crores)
Dear Members,
Your Directors are pleased to present the Thirty First Annual Report together with the Audited Financial Statements of theCompany for the year ended 31st March, 2017.
FINANCIAL RESULTS
2016-17 2015-16
Total Income 18,620.38 27,805.18
Profit /(Loss) before Depreciation, Amortisation/ImpairmentExpenses, Tax and Exceptional Items (1,519.28) (1,106.27)Less : Depreciation, Amortization and Impairment Expenses 156.05 160.22Profit/(Loss) before Exceptional items and tax (1,675.33) (1,266.49)
Add : Exceptional Items 44.90 2.39Profit/(Loss) before tax (1,630.43) (1,264.10)
Add : Tax expenses 373.23 202.52Profit/(Loss) for the period (1,257.20) (1,061.58)
Add: Balance brought forward from previous year 1,315.70 2,384.52Less: Items of Other Comprehensive Income directly
recognized in retained earning (0.81) 1.23Remeasurement of the defined measurement plans 0.28 (0.42)
Amount available for appropriation 59.03 1,322.13
APPROPRIATION
General Reserve - -Proposed dividend – Preference - -
– Equity - 5.34Dividend distribution tax - 1.09Balance as at end of the year 59.03 1,315.70

Ruchi Soya Industries Limited
10
to the vagaries of nature. With continuous drought during thelast few years throughout the country, the crop output/area undercultivation was significantly reduced which in turn reduced thecapacity utilisation of the company. The company was adverselyaffected with the high volatility in prices in commodity marketsglobally in the last two years. Coupled with the above factors, thecommercial disparity in operation and poor offtake/demand inexport markets also further impacted the top line and bottomline of the company.
Due to the weak economic outlook, the realisation of debtorsare delayed with rising finance costs/inadequate working capitalfor operations leading to stress in the cash flows. The Boardafter undertaking a detailed analysis on the operating parameters/performance and taking into account the overall debt positionof the company along with the various steps undertaken forimprovement of performance is confident/optimistic that theCompany would be able to implement effective measures innormal course of business to revive and strengthen the operationsof the Company. Accordingly, the financial statements for theFinancial Year 2016-17 have been prepared on a going concernbasis.
A Techno Economic Viability study of the company was carriedout on the directions of the lenders to the company during theyear under review. The outcome of the study showed that thecompany can earn satisfactory operating cash flows based on thestrong brand position of the company in the markets, goodwill,long standing in the FMCG sector, Intrinsic value of the brandsand the experience of the promoters/management in thisbusiness. The company has been actively in discussions with thelenders in finding a viable long term solution on debt structuringin line with the earnings potential.
Accordingly, the lenders had discussed to invoke a Strategic DebtRestructuring scheme as per the RBI Guidelines on the company.However, the same could not materialise due to want of majorityrequirement for implementation of the said scheme. Subsequentlythe company and lenders have been in active discussions in findinga viable long term solution for debt restructuring of the company.A Steering Committee comprising of major lenders was formedto discuss various possible alternatives for a long term viablesolution for the structuring of the debts of the company as wellas a long term solution in the interest of all the stakeholders.
The discussions with the lenders are progressing at regularintervals and considering the viable debt restructuring solutionthat can be reached upon, the financial statements with the notesaccompanying the financial statements have been prepared on agoing concern basis.
During the year under review, the rating agency CARE has revisedthe rating from CARE B/CARE A4 to CARE D/CARE D forthe Company’s long term/short term bank facilities.
FUTURE OUTLOOK
The Company is evaluating various options of unlocking thevalue of businesses and deleveraging plans to address the resourceconstraints, support debt structuring and improve operations ofthe Company. The Company is also taking initiatives andevaluating various opportunities to emerge out of the challenges
such as (a) Rationalization of unviable Business lines includingsupply chain operations and focus on core business withorientation towards branded sales , (b) Sales of non core/strategicinvestment assets, (c) Right sizing of manpower andadministrative costs, (d) Strategy for reducing fixed cost and makeit more variable as possible, more particularly in crushing business,to make it viable and (e) Integration of functional operations,sales force optimization and IT cost rationalization.
The Company is also taking steps to utilise surplus manufacturingcapacities by processing for third parties to ensure better capacityutilization, boost employee morale, recover costs and improvemargins. This will enable us to utilize unutilized and underutilizedproduction capacity. With a firm and consistent focus on brandedsegment, the Company anticipates better operational performancein the current year.
EXPORTS
The export of the Company during the year was ̀ 1,376.96 Croresas compared to ` 3,885.96 Crores during the last financial yeardespite of volatile market conditions and foreign exchangefluctuations in the global market. The decline in the export wasmainly due to lower capacity utilization of crushing plants andintense competition in the export market.
CHANGE IN SHARE CAPITAL
During the year under review, there has been no change in theShare capital of the Company.
CONSOLIDATED FINANCIAL STATEMENTS
In accordance with the provisions of Section 129(3) of theCompanies Act, 2013 and Regulation 34 of the SEBI (ListingObligations and Disclosure Requirements) Regulations, 2015, theConsolidated Financial Statements form part of this AnnualReport. The Consolidated Financial Statements are prepared inaccordance with the Indian Accounting Standards (IND AS)notified under section 133 of the Companies Act, 2013 readwith Companies (Accounts) Rules, 2014. The ConsolidatedFinancial Statements for the financial year ended 31st March, 2017are the Company’s first IND-AS compliant annual consolidatedfinancial statements with comparative figures for the year ended31st March, 2016.
DIRECTORS
As per the provisions of Section 152 of the Companies Act,2013, Mr. Kailash Chandra Shahra, Chairman of the Companyretires by rotation at the ensuing Annual General Meeting. Mr.Kailash Chandra Shahra has expressed his willingness to retirefrom the Board of Directors at the ensuing Annual GeneralMeeting and does not offer himself for re-appointment asDirector due to his advanced age and health reasons. The Boardof Directors takes on record its sincere appreciation for theinvaluable contribution made by him in the formation and growthof the Company during his long tenure with the Company.
The members may note that post retirement of Mr. KailashChandra Shahra, the Board of Directors will comprise of five
Annual Report 2016-17
11
directors i.e. three Independent Directors, one Managing Directorand one Executive Director. The Board of Directors is of theopinion that the vacancy caused due to retirement by rotation ofMr. Kailash Chandra Shahra is not required to be filled up.
During the year under review, the members of the Company atits 30th Annual General Meeting held on September 14, 2016 hadre-appointed Mr. Vijay Kumar Jain as an Executive Director ofthe Company for a period of three years with effect from April1, 2016, liable to retire by rotation, pursuant to the provisions ofSection 196,197 and 203 of the Companies Act, 2013 (“the Act”).Mr. Sajeve Deora and Mr. Prabhu Dayal Dwivedi, have resignedfrom Directorship of the Company with effect from April 21,2016 and April 28, 2017 respectively. The Board of Directorsplaces on record its sincere appreciation for the invaluablecontribution made by them during their association with theCompany.
All Independent Directors of the Company have givendeclarations under Section 149(7) of the Companies Act, 2013,that they meet the criteria of independence as laid down underSection 149(6) of the Companies Act, 2013 and SEBI (ListingObligations and Disclosure Requirements) Regulations, 2015.
None of the Directors of your Company is disqualified for beingappointed as Director, as specified in Section 164(2) of theCompanies Act, 2013 read with Rule 14(1) of the Companies(Appointment and Qualification of Directors) Rules, 2014.
The details of the familiarization programme for IndependentDirectors with the Company in respect of their roles, rights,responsibilities in the Company, nature of the industry in whichthe Company operates and other related matters are available onthe website of the Company i.e. www.ruchisoya.com.
KEY MANAGERIAL PERSONNEL
The Key Managerial Personnel (KMPs) of the Company are asfollows:
Mr. Dinesh Chandra Shahra, Managing Director
Mr. Vijay Kumar Jain, Executive Director
Mr. V. Suresh Kumar, Chief Financial Officer (upto September3, 2016)
Mr. Anil Singhal, Chief Financial Officer (from September 13,2016)
Mr. R. L. Gupta, Company Secretary
Mr. V Suresh Kumar has resigned from the position of ChiefFinancial Officer (CFO) of the Company with effect fromSeptember 3, 2016. The Board of Directors places on record itssincere appreciation for the valuable contribution made by himduring his tenure as chief financial officer with the Companyand look forward to his sustained contribution as a part of seniormanagement.
During the year, there was no change in the key managerialpersonnel of the Company except change in Chief FinancialOfficer of the Company.
DIRECTORS’ RESPONSIBILITY STATEMENT
In accordance with the provisions of Section 134(5) of theCompanies Act 2013, your directors confirm that:a) in the preparation of the annual accounts for the financial
year ended 31st March, 2017, the applicable accountingstandards had been followed along with proper explanationrelating to material departures;
b) the directors had selected such accounting policies andapplied them consistently and made judgments and estimatesthat are reasonable and prudent so as to give a true and fairview of the state of affairs of the Company as at 31st March,2017 and of the loss of the Company for that period;
c) the directors had taken proper and sufficient care for themaintenance of adequate accounting records in accordancewith the provisions of the Companies Act, 2013 forsafeguarding the assets of the company and for preventingand detecting fraud and other irregularities;
d) the directors had prepared the annual accounts on a goingconcern basis;
e) the directors had laid down internal financial controls to befollowed by the Company and that such internal financialcontrols are adequate and were operating effectively; and
f) the directors had devised proper systems to ensurecompliance with the provisions of all applicable laws andthat such systems were adequate and operating effectively.
BOARD EVALUATION
Pursuant to the provisions of Companies Act, 2013 and the SEBI(Listing Obligations and Disclosure Requirements) Regulations,2015, the Board has carried out an annual evaluation of its ownperformance, Board Committees and individual Directors. Atthe meeting of the Board, all the relevant factors that are materialfor evaluating the performance of individual Directors, the Boardas a whole and its various Committees, were discussed in detail.A structured questionnaire each in line with circular issued bySEBI, for evaluation of the Board, its various Committees andindividual Directors, was prepared and recommended to theBoard by the Nomination and Remuneration Committee, fordoing the required evaluation, after taking into consideration theinputs received from the Directors, covering various aspects ofthe Board’s functioning, such as adequacy of the compositionof the Board and its Committees, execution and performance ofspecific duties, obligations and governance, etc.
The performance evaluation of the Independent Directors wascarried out by the entire Board excluding the Director beingevaluated. The performance evaluation of the Chairman, Boardas a whole and non-independent Directors was also carried outby the Independent Directors at their separate meeting. TheDirectors expressed their satisfaction with the evaluation process.
MEETINGS OF THE BOARD
The Board of Directors of the Company met five times duringthe financial year 2016-17. The meetings were held on 30th May,

Ruchi Soya Industries Limited
12
2016, 12th August, 2016, 13th September, 2016, 14th December,2016 and 14th February, 2017.
EXTRACT OF ANNUAL RETURN
Extract of Annual Return of the Company in form MGT-9 isannexed as Annexure I to this report.
AUDITOR AND AUDITORS’ REPORT
STATUTORY AUDITORS
As per the provisions of the Companies Act, 2013, the periodof office of M/s. P. D. Kunte & Co., Chartered Accountants(Firm Registration No. 105479W), Statutory Auditors of theCompany, expires at the conclusion of the ensuing31st Annual General Meeting. The Board of Directors placeson record their sincere appreciation for the services rendered bythem as Statutory Auditors of the Company.
The Board of Directors has, based on the recommendation ofthe Audit Committee, proposes to appoint M/s. Chaturvedi &Shah, Chartered Accountants (Firm Registration No. 101720W)as Statutory Auditors of the Company for a period of five yearsto hold the office from the conclusion of 31st Annual GeneralMeeting until the conclusion of 36th Annual General Meetingof the Company, subject to ratification of their appointment bymembers at every Annual General Meeting, if so required underthe Act, for approval of the members at the ensuing AnnualGeneral Meeting. M/s. Chaturvedi & Shah, CharteredAccountants, have confirmed their eligibility and qualificationrequired under the Companies Act, 2013 and a valid certificateissued by the Peer Review Board of the Institute ofChartered Accountants of India as required under SEBIRegulations, 2015 for holding the office, as Statutory Auditorsof the Company.
The report of Statutary Auditors is forming part of this AnnualReport and the summary of basis for qualified opinion/emphasisof matter is as follows:
Note 8c(a) and 17a(H) to the financial statements : The Companyhas not received confirmations in respect of bank balancesaggregating to debit balances of ̀ 12.21 crores and credit balancesof ̀ 614.22 crores. In the absence of confirmations, the variation,if any, between the amounts of bank balances, interest and othercosts recorded by the Company and the amounts as per therecords of the banks cannot be ascertained. The Company hassought and followed up for balance confirmation from respectiveBanks.
Note 36 to the financial statements : The matters as set forth inthe note indicate the existence of material uncertainty about theCompany’s ability to continue as a going concern. However, asmentioned in the said note, in view of the various steps initiatedby the Company, future outlook as assessed by the managementand the business plans of the company, the financial statementshave been prepared on a going concern basis.
The other notes on financial statements referred to in theAuditors’ Report are self explanatory and do not call for anyfurther comment.
There is no impact of qualified opinion in the Audit Reportreferred to above on turnover/total income, total expenditure,net loss, EPS, total assets/liabilities, net worth of the companyfor the year under review. Such qualification has appeared firsttime.
BRANCH AUDITORS
M/s. KR & Co., Chartered Accountants (Firm Registration No.025217N) were appointed as Branch Auditors of the Companyin the 28th Annual General Meeting of the Company for a periodof five years i.e. until the conclusion of the 33rd Annual GeneralMeeting of the Company, subject to ratification of theirappointment by members at every Annual General Meeting heldafter the 28th Annual General Meeting. The Board proposesratification of the appointment of M/s. KR & Co., CharteredAccountants as Branch Auditors of the Company for approvalof the members in the ensuing Annual General Meeting.M/s. KR & Co., Chartered Accountants have furnished a writtenconsent and certificate to the effect that the ratification of theirappointment, if made, would be in accordance with the provisionsof Section 139 and 141 of the Companies Act, 2013. As requiredunder Regulation 33(1)(d) of SEBI (Listing Obligations andDisclosure Requirements) Regulations, 2015, the Branch Auditorshave also confirmed that they hold a valid certificate issued bythe Peer Review Board of the Institute of Chartered Accountantsof India.
COST AUDITORS
The Board of Directors, on the recommendation of the AuditCommittee has re-appointed M/s. K.G. Goyal & Co., CostAccountants (Registration No. 000017), to conduct audit of thecost accounting records of the Company for the financial year2017-18 at a remuneration of ` 4.40 lakh (Rupees Four LacsForty Thousand Only) subject to payment of applicable taxesthereon and re-imbursement of out of pocket expenses. Asrequired under Section 148 of the Companies Act, 2013, aresolution regarding ratification of the remuneration payable toM/s. K.G. Goyal & Co., Cost Accountants, forms part of theNotice convening the 31st Annual General Meeting of theCompany.
SECRETARIAL AUDITORS
In terms of the provisions of Section 204 of the CompaniesAct, 2013 read with the Companies (Appointment andRemuneration of Managerial Personnel) Rules, 2014, the Boardof Directors of the Company had re-appointed Mr. PrashantDiwan, Practicing Company Secretary, to conduct SecretarialAudit of the Company for the year ended 31st March, 2017. TheSecretarial Audit Report for the financial year ended March 31,2017 is annexed as Annexure II to this report. The SecretarialAudit Report does not contain any qualification, reservation oradverse remark.However, the reference to specific event / action which tookplace during the year is self explanatory and the Company istaking due legal recourse where required.

Annual Report 2016-17
13
SUBSIDIARIES, JOINT VENTURES AND ASSOCIATECOMPANIES
As on 31st March, 2017, the Subsidiaries, Joint Ventures andAssociate Companies of your Company are as follows:Subsidiary Companies
Ruchi Worldwide Limited (Subsidiary)Mrig Trading Private Limited (Subsidiary)Ruchi J-Oil Private Limited (Subsidiary)Ruchi Ethiopia Holdings Limited, Dubai (Subsidiary)Ruchi Industries Pte. Limited, Singapore (Subsidiary)RSIL Holdings Private Limited (Subsidiary)Ruchi Agri PLC, Ethiopia (Step-down Subsidiary)Ruchi Agri Plantation (Cambodia) Pte. Limited, Cambodia (Step-down Subsidiary)Palmolien Industries Pte. Limited, Cambodia (Step-downSubsidiary)Ruchi Agri Trading Pte. Limited, Singapore (Step-downSubsidiary)Ruchi Agri SARLU, Madgascar (Step-down Subsidiary)Ruchi Middle East DMCC, Dubai (Step Down Subsidiary)
Joint Ventures
Indian Oil Ruchi Biofuels LLPRuchi Hi-Rich Seeds Private Limited (Step-down Subsidiary upto17th June, 2016)
Associate Companies
GHI Energy Private LimitedRuchi Kagome Foods India Private Limited (Upto 20th May, 2016,as the Company has disposed off its stake in the AssociateCompany on such date).The statement containing salient features of the financialstatements and highlights of performance of its Subsidiaries,Joint Venture and Associate Companies and their contributionto the overall performance of the Company during the period isattached with the financial statements of the Company in formAOC-1. The Annual Report of your Company, containing interalia the audited standalone and consolidated financial statements,has been placed on the website of the Company atwww.ruchisoya.com. Further, the audited financial statementstogether with related information of each of the subsidiaryCompanies have also been placed on the website of the Companyat www.ruchisoya.com.The policy for determining material subsidiary as approved bythe Board of Directors of the Company are available on thewebsite of the Company at www.ruchisoya.com.
PARTICULARS OF LOANS & ADVANCES,GUARANTEES, INVESTMENTS AND SECURITIESParticulars of loans/advances, investments, guarantees made andsecurities provided during the year as required under theprovisions of Section 186 of the Companies Act, 2013 andSchedule V of the SEBI (Listing Obligations and DisclosureRequirements) Regulations, 2015, are provided in the notes to
the standalone financial statements (Please refer Note 38 to thestandalone financial statements).
PARTICULARS OF CONTRACTS ORARRANGEMENTS WITH RELATED PARTIES
All transactions entered into by the Company with related partiesduring the financial year were on arm’s length basis, in the ordinarycourse of business and were in compliance with the applicableprovisions of the Companies Act, 2013 and the SEBI (ListingObligations and Disclosure Requirements) Regulations, 2015.There were no materially significant related party transactionsmade by the Company with related parties which may havepotential conflict with the interest of the Company at large orwhich warrants the approval of the shareholders. Accordingly,no transactions are reportable in terms of the provisions ofSection 134 of the Companies Act, 2013 read with Rule 8 of theCompanies (Accounts) Rules, 2014. However, the details oftransactions with related parties are provided in Note 41 to thefinancial statements in accordance with the Accounting Standardsand the SEBI (Listing Obligations and Disclosure Requirements)Regulations, 2015.All related party transactions are placed before the AuditCommittee for review and approval. Prior omnibus approval isobtained from the Audit Committee of the Board for thetransactions which are foreseen and repetitive in nature. Astatement of all related party transactions is placed before theAudit Committee on a quarterly basis, specifying the nature, valueand terms and conditions of the transactions. The policy onmateriality of related party transactions and on dealing with relatedparty transactions as approved by the Audit Committee as wellas Board may be accessed on the Company’s website atwww.ruchisoya.com.
CONSERVATION OF ENERGY, TECHNOLOGYABSORPTION AND FOREIGN EXCHANGEEARNINGS AND OUTGO
The information on conservation of energy, technologyabsorption and foreign exchange earnings and outgo stipulatedunder Section 134(3)(m) of the Companies Act, 2013 readwith the Companies (Accounts) Rules, 2014, is annexed asAnnexure III to this report.
INTERNAL CONTROL SYSTEM AND THEIRADEQUACY
The Company has in place internal control systems,commensurate with the size, scale and complexity of itsoperations. The Company has appropriate policies and proceduresfor ensuring the orderly and efficient conduct of its business,including adherence of the Company’s policies, safeguarding ofits assets, prevention and detection of frauds and errors, accuracyand completeness of accounting records and timely preparationof reliable financial information. The internal auditor monitorsand evaluates the efficacy and adequacy of internal control systemsin the Company. Based on the report of the internal auditor,respective departments undertake corrective action in theirrespective areas and thereby strengthen the controls. Significantaudit observations and corrective actions thereon are presentedto the Audit Committee of the Board and the Committee actively

Ruchi Soya Industries Limited
14
reviews the adequacy and effectiveness of internal control systemand suggests improvements for strengthening them in accordancewith the change in business scenario, if required.
RISK MANAGEMENT
Your Company believes that managing risks helps in maximizingreturns. Risk management comprises all the organizational rulesand actions for early identification of risks in the course of doingbusiness and the management of such risks. Your Company hasformally adopted a Risk Management Policy to identify and assessthe key risk areas, monitor and report compliance and effectivenessof the policy and procedure. The Company has a risk managementframework in place for identification, evaluating and managementof risks. In line with your Company’s commitment to deliversustainable value, this framework aims to provide an integratedand organized approach for evaluating and managing risks. TheRisk Management Committee and Audit Committee periodicallyreviews the risks and suggest steps to be taken to control andmitigate the same through a properly defined framework. Further,the risks associated to the Company’s business are provided inthe Management Discussion and Analysis Report.
CORPORATE GOVERNANCE
The Company adheres to best practices on CorporateGovernance. Your Company upholds the standards ofgovernance and is compliant with the Corporate Governanceprovisions as stipulated under the SEBI (Listing Obligationsand Disclosure Requirements) Regulations, 2015. TheCompany’s core values of transparency and business prudencehave since inception been followed in every line of decisionmaking. A separate report on Corporate Governance in termsof the SEBI (Listing Obligations and Disclosure Requirements)Regulations, 2015 forms integral part of this report. A Certificateregarding compliance of the conditions of CorporateGovernance issued by Statutory Auditors is annexed asAnnexure IV to this report. The necessary disclosures asrequired under Schedule V of the Companies Act, 2013 areprovided in the Corporate Governance Report.
EMPLOYEE STOCK OPTION SCHEME (ESOS)
Your Company values its employees and is committed to adoptbest HR practices for rewarding them suitably and in this line,the Company had implemented the Employees Stock OptionScheme, 2007 (“the Scheme’) and made grants to eligibleemployees under this scheme from time to time. During the year,the Company has not issued any stock options to any employeesof the Company. The details of shares issued under the Schemeand the disclosures in compliance with Section 62 of theCompanies Act, 2013 and read with rule 12 of Companies (ShareCapital and Debentures) Rules, 2014 and the Securities andExchange Board of India (Share based Employee Benefits)Regulations, 2014 are annexed as Annexure V to this report.During the financial year 2016-17, there has been no change inthe Scheme. Further, it is confirmed that the Scheme is incompliance with SEBI (Share Based Employee Benefits)Regulations, 2014. The applicable disclosures as stipulated underRegulation 14 of SEBI (Share Based Employee Benefits)Regulations, 2014 with regard to the Scheme are available on thewebsite of the Company at www.ruchisoya.com.
PARTICULARS OF EMPLOYEES
Information required pursuant to Section 197(12) of theCompanies Act, 2013 (“the Act”) read with Rule 5(1) of theCompanies (Appointment and Remuneration of ManagerialPersonnel) Rules, 2014 is annexed as Annexure VI to this report.The statement containing particulars of employees as requiredunder Section 197(12) of the Act read with Rule 5(2) and 5(3) ofthe Companies (Appointment and Remuneration of ManagerialPersonnel) Rules, 2014, is provided in a separate annexure formingpart of this report. Further, the Annual Report is being sent tothe members excluding the aforesaid annexure. In terms of theprovisions of Section 136 of the Act, the said annexure is open forinspection at the Registered Office of the Company. Anyshareholder interested in obtaining a copy of the same may writeto the Company Secretary and the same will be furnished on request.
VIGIL MECHANISM/WHISTLE BLOWER POLICY
The Company has adopted a Vigil Mechanism/Whistle BlowerPolicy in terms of the provisions of Companies Act, 2013 andthe SEBI (Listing Obligations and Disclosure Requirements)Regulations, 2015, to provide a formal mechanism to the Directorsand employees of the Company to report their genuine concernsand grievances about unethical behaviour, actual or suspectedfraud or violation of the Company’s code of conduct or ethics.The policy provides adequate safeguards against victimization ofDirectors and employees who avail such mechanism and alsoprovides for direct access to the Vigilance Officer and theChairman of Audit Committee. The Audit Committee of theBoard is entrusted with the responsibility to oversee the vigilmechanism. During the year, no personnel was denied access tothe Audit Committee. The Vigil Mechanism/Whistle BlowerPolicy is available on the website of the Company atwww.ruchisoya.com.
NOMINATION, REMUNERATION ANDEVALUATION POLICY
In accordance with the provisions of Section 178 of theCompanies Act, 2013 and the SEBI (Listing Obligations andDisclosure Requirements) Regulations, 2015, the Company hasput in place a Nomination, Remuneration and Evaluation Policywhich lays down a framework in relation to criteria for selectionand appointment of Directors, Key Managerial Personnel andSenior Management of the Company alongwith theirremuneration. The Nomination, Remuneration and Evaluationpolicy is annexed as Annexure VII to this report. The same isalso available on the website of the Company i.e.www.ruchisoya.com.
CORPORATE SOCIAL RESPONSIBILITY COMMITTEE
The Company has a duly constituted Corporate SocialResponsibility (CSR) Committee, which is responsible for fulfillingthe CSR objectives of the Company. The Committee comprisesof Mr. N. Murugan (Chair person), Mr. Dinesh Chandra Shahraand Mr. Vijay Kumar Jain (Members). The CSR Committee hasformulated and recommended to the Board, a Corporate SocialResponsibility Policy (CSR Policy) which was approved by theBoard and is available on the website of the Company atwww.ruchisoya.com.

Annual Report 2016-17
15
The Company believes in inclusive development of thecommunity where we operate and the society at large. TheCompany’s development programs endeavor to create a positiveimpact on the community by empowering people with knowledge,skill, health and educational support for growth and development.We have created a synergistic alignment between our social andeconomic goals. During the year, the Company was not requiredto spend any amount on CSR activities/programs as the Companydid not have positive average net profits calculated in terms ofthe provisions of Section 135 read with Section 198 of theCompanies Act, 2013. The Annual report on CSR activities asrequired under the Companies (Corporate Social ResponsibilityPolicy) Rules, 2014 is annexed as Annexure VIII to this Report.
OTHER COMMITTEES OF THE BOARD
As on 31st March, 2017, the Board had four Committees vizAudit Committee, Nomination and Remuneration Committeeand Stakeholders Relationship Committee as mandated underthe provisions of Companies Act, 2013 and the SEBI (ListingObligations and Disclosure Requirements) Regulations, 2015.The details of the role of Audit Committee, Nomination andRemuneration Committee and Stakeholders RelationshipCommittee along with their composition, number of meetingsheld during the financial year and attendance at the meetings areprovided in the Corporate Governance Report, which forms anintegral part of this Report.
MANAGEMENT DISCUSSION AND ANALYSISREPORT
The Management Discussion and Analysis Report for the yearunder review, as stipulated under Regulation 34 of the SEBI (ListingObligations and Disclosure Requirements) Regulations, 2015, isprovided in a separate section forming part of the Annual Report.
DISCLOSURE UNDER SEXUAL HARASSMENT OFWOMEN AT WORKPLACE (PREVENTION,PROHIBITION & REDRESSAL) ACT, 2013
The Company has adopted a policy on prevention, prohibitionand redressal of sexual harassment at workplace in line withthe provisions of Sexual Harassment of Women at Workplace(Prevention, Prohibition and Redressal) Act, 2013 and the Rulesmade thereunder. The aim of the policy is to provide protectionto employees at the workplace and prevent and redresscomplaints of sexual harassment and for matters connected orincidental thereto, with the objective of providing a safe workingenvironment, where employees feel secure. All employees(permanent, contractual, temporary, trainees) are covered underthe said policy. An Internal Complaints Committee (ICC) hasalso been set up to redress complaints received on sexualharassment. No complaint was pending at the beginning of theyear and none was received during the year.
SIGNIFICANT AND MATERIAL ORDERS PASSED BYREGULATORS AND COURTS
During the year, the Securities and Exchange Board of India(SEBI) had passed an ex-parte ad-interim order on 24th May, 2016restricting the Company and other parties from buying, sellingor dealing in the securities market either directly or indirectly, inany manner, whatsoever till further instructions. Later on, on
8th March, 2017, the SEBI had confirmed the above referredorder with an interim relief to the Company by permitting totrade or deal in commodity derivative markets for the limitedpurpose of hedging the physical market positions under thesupervision of the Exchanges. Except the above, no othersignificant or material orders were passed by the Regulators orCourts or Tribunals.
GENERAL DISCLOSURES
Your Directors state that no disclosure or reporting is requiredin respect of the following items as there were no transactionson these items during the year under review:1. Details relating to deposits covered under Chapter V of the
Act.2. Issue of equity shares with differential rights as to dividend,
voting or otherwise.3. Issue of shares (including sweat equity shares) to employees
of the Company under any scheme.4. Neither the Managing Director nor the Executive Director
of the Company receives any remuneration or commissionfrom any of its subsidiaries.
5. No fraud has been reported by the Auditors to the AuditCommittee or the Board.
6. No change in the nature of business of the Company duringthe year.
7. No material changes and commitments affecting the financialposition of the Company occurred between the end of thefinancial year to which these financial statements relate andthe date of this Report.
CAUTIONARY STATEMENT
The statements made in this Directors’ Report and ManagementDiscussion and Analysis Report describing the Company’sobjectives, projections, outlook, expectations and others may be“forward-looking statements” within the meaning of applicablelaws and regulations. Actual results may differ from expectationsthose expressed or implied. Important factors that could makedifference to the Company’s operations includes change ingovernment policies, global market conditions, import-exportpolicy, foreign exchange fluctuations, financial position, rawmaterial availability, tax regimes and other ancillary factors.
ACKNOWLEDGEMENT
Your Directors place on record their sincere appreciation for thevalued contribution, co-operation and support extended to theCompany by the Shareholders, Banks, Financial Institutions,Central Government, State Governments and other GovernmentAuthorities and look forward to their continued support. YourDirectors also wish to express their deep appreciation for thededicated and sincere services rendered by employees of theCompany.
For and on behalf of the Board of Directors
Dinesh Shahra Vijay Kumar JainPlace : Mumbai Managing Director Executive DirectorDate : August 19, 2017 DIN : 00533055 DIN : 00098298

Ruchi Soya Industries Limited
16
FORM NO. MGT-9
EXTRACT OF ANNUAL RETURNas on financial year ended on 31.03.2017
[Pursuant to Section 92(3) of the Companies Act, 2013 and rule 12(1) of the Companies (Management & Administration) Rules, 2014]I. REGISTRATION & OTHER DETAILS:
i CIN L15140MH1986PLC038536
ii Registration Date January 6, 1986
iii Name of the Company Ruchi Soya Industries Limited
iv Category/Sub-category of the Company Company Limited by Shares
v Address of the Registered office & contact details Ruchi House, Royal Palms,Survey No. 169, Aarey Milk Colony,Near Mayur Nagar, Goregaon (East),Mumbai - 400065, Maharashtra,Tel: +91 22 61090100/200email: [email protected]
vi Whether listed company Yes
vii Name , Address & Contact details of the Registrar & Transfer Agent Sarthak Global Limited170/10 Flim Colony, R. N. T. Marg,Indore - 452001Phone: +91 731 4279626/2523545email: [email protected]
Annexure I to the Directors’ Report
II. PRINCIPAL BUSINESS ACTIVITIES OF THE COMPANY
All the business activities contributing 10% or more of the total turnover of the Company are as given below:
Sl. Name & Description of main products/services NIC Code of the % to total turnoverNo. Product/service of the Company
1 Oils 10402 72.21
III. PARTICULARS OF HOLDING , SUBSIDIARY & ASSOCIATE COMPANIES
Sl. Name & Address of the Company CIN/GLN Holding/ % of ApplicableNo. Subsidiary/ Shares Section
Associate Held
1 Ruchi Worldwide Limited U15499MH1996PLC100016 Subsidiary 52.48 2(87)Ruchi House, Royal Palms, Survey No. 169, Aarey MilkColony, Near Mayur Nagar, Goregaon (East),Mumbai - 400 065, Maharashtra
2 Mrig Trading Private Limited U51909MH2003PTC138972 Subsidiary 100 2(87)614, Tulsiani Chambers, Nariman Point,Mumbai - 400 021, Maharashtra
3 Ruchi J-Oil Private Limited U15141MP2013PTC030932 Subsidiary 51 2(87)Akodiya Road, Sujalpur - 465 333,Madhya Pradesh
4 Ruchi Ethiopia Holdings Limited Not Applicable Subsidiary 100 2(87)409, City Tower-1, Sheikh Zayad Road,P.O. Box 118767 Dubai, U.A.E.

Annual Report 2016-17
17
III. PARTICULARS OF HOLDING, SUBSIDIARY & ASSOCIATE COMPANIES (Contd.)
Sl. Name & Address of the Company CIN/GLN Holding/ % of ApplicableNo. Subsidiary/ Shares Section
Associate Held
5 Ruchi Industries Pte. Limited Not Applicable Subsidiary 100 2(87)22 North Canal Road, #01-00,Singapore - 048834.
6 RSIL Holdings Private Limited U67190MH2014PTC254659 Subsidiary 100 2(87)616, Tulsiani Chambers, Nariman Point,Mumbai - 400 021
7 Ruchi Hi-rich Seeds Private Limited (upto June 17, 2016) U73100MH2014PTC255066 Step-down 55* 2(87)616, Tulsiani Chambers, Nariman Point, SubsidiaryMumbai-400021
8 Ruchi Agri PLC Not Applicable Step-down 100 2(87)Village Ubala, Gog Woreda, Pugnido, SubsidiaryGambella Regional State, Ethiopia
9 Ruchi Agri Plantation (Cambodia) Pte. Limited Not Applicable Step-down 100 2(87)#216D, St. 63, Boeung Keng Kang 1, SubsidiaryChaMkarmon, Phnom Penh City, Cambodia
10 Palmolien Industries Pte. Limited, Not Applicable Step-down 100 2(87)Cambodia #216D, St. 63, Boeung Keng Kang 1, SubsidiaryChaMkarmon, Phnom Penh City, Cambodia
11 Ruchi Agri Trading Pte. Limited Not Applicable Step-down 100 2(87)22 North Canal Road, # 01-00, Singapore-048834 Subsidiary
12 Ruchi Agri SARLU Not Applicable Step-down 100 2(87)Lot IIIG 82 Bis Ambatolampy Ambohimanarina Subsidiary101 Antananarivo, Analamunga Region, Madagascar
13 Ruchi Middle East DMCC Not Applicable Step-down 100 2(87)Unit No. 30-01-1518, Jewellery & Gemplex Subsidiary3 Plot No: DMCC-PH2-J&G PlexS, Jewellery & Gemplex,Dubai UAE
14 GHI Energy Private Limited U40109TN2010PTC076296 Associate 49 2(6)No. 40-41, East Mada Church Street, RoyapuramChennai - 600 013, Tamilnadu
15 Ruchi Kagome Foods India Private Limited (upto May 20, U15122MH2013PTC244632 Associate 40 2(6)2016) Unit No 507, 5th floor, Powai Plaza, HiranandaniGardens, Powai, Mumbai- 400076, Maharashtra
* As on March 31, 2017, the Company holds 32.52% in Ruchi Hi-Rich Seeds Private Ltd. and the same is an associate of the subsidiary of theCompany in terms of section 2 (6) of the Companies Act, 2013.

Ruchi Soya Industries Limited
18
IV . SHAREHOLDING PATTERN (Equity Share Capital Breakup as percentage to total Equity)(i) Category-wise ShareholdingCategory of Shareholders
Demat Physical Total % of Total Demat Physical Total % of TotalShares Shares
A. Promoters
(1) Indiana) Individual/HUF 10,31,95,858 — 10,31,95,858 30.89 8,96,40,022 — 8,96,40,022 26.83 (4.06)b) Central Govt. — — — — — — — — —c) State Govt. — — — — — — — — —d) Bodies Corporate 8,66,62,684 — 8,66,62,684 25.94 10,17,37,120 — 10,17,37,120 30.45 4.51e) Banks/FI — — — — — — — — —f) Any other — — — — — — — — —Sub-total (A)(1) 18,98,58,542 — 18,98,58,542 56.83 19,13,77,142 — 19,13,77,142 57.28 0.45
(2) Foreign
a) NRI- Individuals — — — — — — — — —b) Other- Individuals — — — — — — — — —c) Bodies Corporate — — — — — — — — —d) Banks/FI — — — — — — — — —e) Any other — — — — — — — — —Sub-total (A)(2) — — — — — — — — —
Total Shareholding of Promoters(A)= (A)(1)+(A) (2) 18,98,58,542 — 18,98,58,542 56.83 19,13,77,142 — 19,13,77,142 57.28 0.45
B. Public Shareholding
(1) Institutions
a) Mutual Funds 1,867 31,500 33,367 0.01 — 31,500 31,500 0.01 —b) Banks/FI 3,74,290 13,625 3,87,915 0.12 4,20,867 13,625 4,34,492 0.13 0.01C) Central Govt. — — — — — — — — —d) State Govt. — — — — — — — — —e) Venture Capital Funds — — — — — — — — —f) Insurance Companies — — — — — — — — —g) FIIs 1,70,46,901 9,625 1,70,56,526 5.10 15,04,061 9,625 15,13,686 0.45 (4.65)h) Foreign Venture Capital Funds — — — — — — — — —i) Others (specify) — — — — — — — — —Sub-total (B)(1) 1,74,23,058 54,750 1,74,77,808 5.23 19,24,928 54,750 19,79,678 0.59 (4.64)
(2) Non Institutions
a) Bodies corporatesi) Indian 2,13,73,412 2,99,215 2,16,72,627 6.49 2,29,90,302 2,99,215 2,32,89,517 6.97 0.48ii) Overseas 6,37,13,687 84,94,030 7,22,07,717 21.61 7,77,23,547 84,94,030 8,62,17,577 25.81 4.20b) Individualsi) Individual shareholders holding
nominal share capital upto` 1 lakh 1,94,05,781 28,12,221 2,22,18,002 6.65 2,25,34,313 27,44,701 2,52,79,014 7.57 0.92
ii) Individual shareholders holdingnominal share capital in excessof ` 1 lakh 83,57,602 15,05,500 98,63,102 2.95 40,83,380 15,05,500 55,88,880 1.67 (1.28)
c) OthersClearing Members and Trust 8,02,924 — 8,02,924 0.24 3,68,914 — 3,68,914 0.11 (0.13)Sub-total (B)(2): 11,36,53,406 1,31,10,966 12,67,64,372 37.94 12,77,00,456 1,30,43,446 14,07,43,902 42.13 4.19
Total Public Shareholding (B) =(B)(1)+(B)(2) 13,10,76,464 1,31,65,716 14,42,42,180 43.17 12,96,25,384 1,30,98,196 14,27,23,580 42.72 (0.45)
C. Shares held by Custodianfor GDRs & ADRs — — — — — — — — —
Grand Total (A+B+C) 32,09,35,006 1,31,65,716 33,41,00,722 100 32,10,02,526 1,30,98,196 33,41,00,722 100 —
No. of Shares held at the beginning of the year No. of Shares held at the end of the year % Changeduring the
year

Annual Report 2016-17
19
(ii) Shareholding of Promoters
Sl. Shareholder’s Name Shareholding at the beginning Shareholding at the end % changeNo. of the year of the year in share
No. of % of total % of Shares No. of % of total % of Shares holdingShares Shares of Pledged / Shares Shares of Pledged / during the
the Company encumbered the encumbered year
to total Company to totalshares shares
1 Abha Shahra 38,28,926 1.15 — 38,28,926 1.15 — —2 Dinesh Shahra 21,11,383 0.63 — 21,11,383 0.63 — —3 Dinesh Shahra (HUF) 1,72,05,836 5.15 — — — — (5.15)4 Kailash Shahra 1,98,500 0.06 — 1,98,500 0.06 — —5 Mridula Shahra 9,92,055 0.30 — 9,92,055 0.30 — —6 Neeta Shahra 2,00,300 0.06 — 2,00,300 0.06 — —7 Santosh Shahra (HUF) 6,51,340 0.19 — 6,51,340 0.19 — —8 Suresh Shahra 2,54,080 0.08 — — — — (0.08)9 Savitridevi Shahra 8,23,683 0.25 0.25 10,48,683 0.32 — 0.0710 Neeta Umesh Shahra (Trustee of
Suyash Trust) 500 — — 500 — —11 Umesh Shahra 5,48,860 0.16 0.14 5,48,860 0.16 — —12 Ushadevi Shahra 6,74,850 0.20 — 6,74,850 0.20 — —13 Amrita Shahra 26,21,354 0.78 — 26,21,354 0.78 — —14 Ankesh Shahra 33,62,921 1.01 — 33,62,921 1.01 — —15 Sarvesh Shahra 53,06,872 1.59 — 54,06,872 1.62 — 0.0316 Amisha Shahra 30,32,570 0.91 — 30,32,570 0.91 — —17 Suresh Shahra (HUF) 1,75,000 0.05 — — — — (0.05)18 Manish Shahra 1,62,120 0.05 — — — — (0.05)19 Neha Shahra 5,450 — — 5,450 — — —20 Bhawana Goel 1,00,000 0.03 — 1,00,000 0.03 — —21 Nitesh Shahra 55,71,153 1.67 — 59,87,353 1.79 — 0.1222 Kailash Shahra HUF 85,000 0.03 — 85,000 0.03 — —23 Vishesh Shahra 1,15,300 0.03 — 1,15,300 0.03 — —24 Mamta Khandelwal 8,500 — — 8,500 — — —25 APL International Pvt. Limited 71,21,805 2.13 — 71,21,805 2.13 — —26 Arandi Investment Pvt. Limited 86,79,170 2.60 — 86,79,170 2.60 — —27 National Steel & Agro Industries
Limited 2,07,500 0.06 — 2,07,500 0.06 — —28 Mahakosh Holdings Private Limited 25,11,906 0.75 — 25,11,906 0.75 — —29 Ruchi Infrastructure Limited 82,59,625 2.47 — 82,59,625 2.47 2.39 —30 Dinesh Shahra (Trustee of Ruchi Soya
Industries Ltd Beneficiary Trust) 76,30,115 2.28 — 76,30,115 2.28 — —31 Dinesh Shahra (holding on behalf
of Disha Foundation Trust) 4,74,40,350 14.20 14.20 2,49,40,350 7.47 7.47 (6.73)32 Mahakosh Papers Pvt. Ltd. 7,87,875 0.24 — 7,87,875 0.24 — —33 Ruchi Acroni Ind Limited 13,48,475 0.40 — 26,17,075 0.78 — 0.3834 Shahra Estate Pvt. Ltd. 10,12,610 0.30 — 10,12,610 0.30 — —35 Ruchi Global Ltd. 7,31,330 0.22 0.19 7,31,330 0.22 0.19 —36 Ruchi Infotech Ltd. 1,66,665 0.05 — 1,66,665 0.05 — —37 Suresh Chandra Santosh Kumar shahra
(Trustee of Mahakosh Family Trust) 88,840 0.03 — 88,840 0.03 — —38 Soyumm Marketing Private Limited 3,23,04,323 9.67 8.47 4,56,35,159 13.66 8.47 3.9939 Shahra Brothers Pvt. Ltd. 29,31,400 0.88 — 29,31,400 0.88 — —40 Spectra Realties Pvt. Ltd. 1,81,00,000 5.42 — 1,84,00,000 5.51 5.42 0.0941 Evershine Oleochem Limited 25,00,000 0.75 — 25,00,000 0.75 0.75 —42 Shahra Securities Pvt Ltd. — — — 1,75,000 0.05 — 0.0543 Dinesh Khandelwal (Trustee of
Disha Foundation Trust) — — — 2,60,00,000 7.78 6.73 7.78Total 18,98,58,542 56.83 23.25 19,13,77,142 57.28 31.42 0.45
Ruchi Soya Industries Limited
20
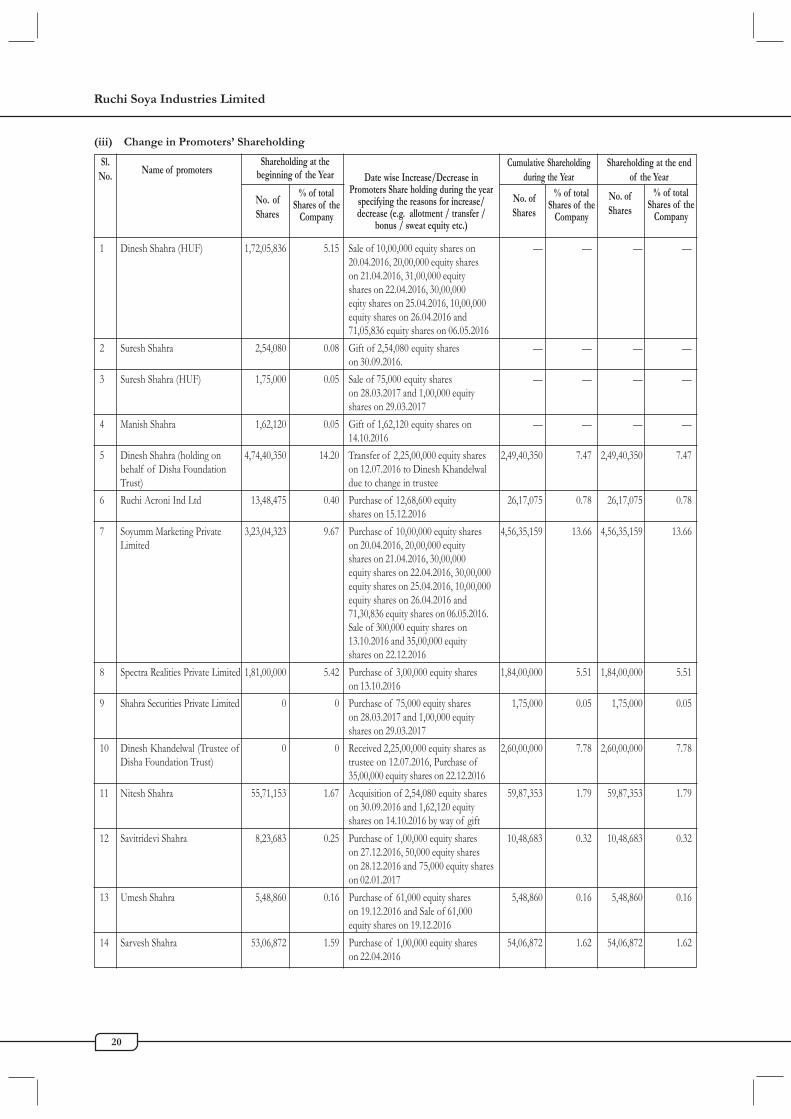
1 Dinesh Shahra (HUF) 1,72,05,836 5.15 Sale of 10,00,000 equity shares on — — — —20.04.2016, 20,00,000 equity shareson 21.04.2016, 31,00,000 equityshares on 22.04.2016, 30,00,000eqity shares on 25.04.2016, 10,00,000equity shares on 26.04.2016 and71,05,836 equity shares on 06.05.2016
2 Suresh Shahra 2,54,080 0.08 Gift of 2,54,080 equity shares — — — —on 30.09.2016.
3 Suresh Shahra (HUF) 1,75,000 0.05 Sale of 75,000 equity shares — — — —on 28.03.2017 and 1,00,000 equityshares on 29.03.2017
4 Manish Shahra 1,62,120 0.05 Gift of 1,62,120 equity shares on — — — —14.10.2016
5 Dinesh Shahra (holding on 4,74,40,350 14.20 Transfer of 2,25,00,000 equity shares 2,49,40,350 7.47 2,49,40,350 7.47behalf of Disha Foundation on 12.07.2016 to Dinesh KhandelwalTrust) due to change in trustee
6 Ruchi Acroni Ind Ltd 13,48,475 0.40 Purchase of 12,68,600 equity 26,17,075 0.78 26,17,075 0.78shares on 15.12.2016
7 Soyumm Marketing Private 3,23,04,323 9.67 Purchase of 10,00,000 equity shares 4,56,35,159 13.66 4,56,35,159 13.66Limited on 20.04.2016, 20,00,000 equity
shares on 21.04.2016, 30,00,000equity shares on 22.04.2016, 30,00,000equity shares on 25.04.2016, 10,00,000equity shares on 26.04.2016 and71,30,836 equity shares on 06.05.2016.Sale of 300,000 equity shares on13.10.2016 and 35,00,000 equityshares on 22.12.2016
8 Spectra Realities Private Limited 1,81,00,000 5.42 Purchase of 3,00,000 equity shares 1,84,00,000 5.51 1,84,00,000 5.51on 13.10.2016
9 Shahra Securities Private Limited 0 0 Purchase of 75,000 equity shares 1,75,000 0.05 1,75,000 0.05on 28.03.2017 and 1,00,000 equityshares on 29.03.2017
10 Dinesh Khandelwal (Trustee of 0 0 Received 2,25,00,000 equity shares as 2,60,00,000 7.78 2,60,00,000 7.78Disha Foundation Trust) trustee on 12.07.2016, Purchase of
35,00,000 equity shares on 22.12.201611 Nitesh Shahra 55,71,153 1.67 Acquisition of 2,54,080 equity shares 59,87,353 1.79 59,87,353 1.79
on 30.09.2016 and 1,62,120 equityshares on 14.10.2016 by way of gift
12 Savitridevi Shahra 8,23,683 0.25 Purchase of 1,00,000 equity shares 10,48,683 0.32 10,48,683 0.32on 27.12.2016, 50,000 equity shareson 28.12.2016 and 75,000 equity shareson 02.01.2017
13 Umesh Shahra 5,48,860 0.16 Purchase of 61,000 equity shares 5,48,860 0.16 5,48,860 0.16on 19.12.2016 and Sale of 61,000equity shares on 19.12.2016
14 Sarvesh Shahra 53,06,872 1.59 Purchase of 1,00,000 equity shares 54,06,872 1.62 54,06,872 1.62on 22.04.2016
(iii) Change in Promoters’ Shareholding
Sl.No. Name of promoters
Shareholding at thebeginning of the Year
Cumulative Shareholdingduring the Year
Shareholding at the endof the Year
No. ofShares
% of totalShares of the
Company
Date wise Increase/Decrease inPromoters Share holding during the year
specifying the reasons for increase/decrease (e.g. allotment / transfer /
bonus / sweat equity etc.)
No. ofShares
% of totalShares of the
Company
No. ofShares
% of totalShares of the
Company

Annual Report 2016-17
21
(iv) Shareholding Pattern of Top Ten Shareholders (Other than Directors, Promoters and Holders of GDRs & ADRs)
Sl. No. Name of Top Ten Shareholders Shareholding at the beginning Cumulative Shareholdingof the year as on 01.04.2016 at the end of the year
as on 31.03.2017
% of total % of totalNo. of Shares Shares of the No. of Shares Shares of the
Company Company
1 Sawit Plantation Pte Ltd. 1,96,12,913 5.87 1,96,12,913 5.872 Cresta Fund Ltd. 1,49,66,373 4.48 1,49,66,373 4.483 Albula Investment Fund Ltd. 1,44,08,754 4.31 1,44,08,754 4.314 Elara India Opportunities Fund Limited 1,38,69,097 4.15 1,38,69,097 4.155 Merdale Investment Co. Ltd. 42,49,645 1.27 42,49,645 1.276 Clemfield Industries Ltd. 40,01,080 1.20 40,01,080 1.207 New Leaina Investments Limited 39,79,267 1.19 39,79,267 1.198 Ganpati Multi Commodity Business
India Private Limited* — — 38,00,000 1.149 Afro Asia Ind Ltd. 21,61,000 0.65 21,61,000 0.6510 Dimensional Emerging Markets Value Fund* 20,42,966 0.61 20,08,134 0.6011 Suresh Kumar Gupta** 38,21,185 1.14 21,185 0.0112 Urvashi World Wide Pvt. Ltd.** 21,39,330 0.64 6,45,730 0.19
The shares of the Company are traded on a daily basis and hence the datewise increase / decrease in shareholding is not indicated.*Not in the list of Top 10 Shareholders as on 01.04.2016. The same has been refelected above since the Shareholder was on the Top10 Shareholders as on 31.03.2017.** Ceased to be in the list of Top 10 Shareholders as on 31.03.2017. The same is reflected above since the Shareholder was one of theTop 10 shareholders as on 01.04.2016.
(v) Shareholding of Directors and Key Managerial Personnel
Sl. No. Name of Directors/ Shareholding at the beginning Cumulative ShareholdingKey Managerial Personnel of the year at the end of the year
% of total % of totalNo. of Shares Shares of the No. of Shares Shares of the
Company Company
1 Dinesh Chandra Shahra 21,11,383 0.63 21,11,383 0.63
2 Kailash Chandra Shahra 1,98,500 0.06 1,98,500 0.06
3 Sajeve Deora* 56,000 0.02 56,000 0.02
4 Vijay Kumar Jain 141 — 141 —
5 V Suresh Kumar** 28,005 0.01 28,005 0.01
6 Ramji Lal Gupta 33,000 0.01 33,000 0.01
* Mr. Sajeve Deora has resigned from Directorship of the Company with effect from April 21, 2016.**Mr. V Suresh Kumar has resigned from the post of Chief Financial Officer (CFO) of the Company with effect fromSeptember 3, 2016.None of the other Directors/ Key Managerial Personnel hold any shares in the Company. There is no change in the shareholding ofDirectors and Key Managerial Personnel of the Company during the year.

Ruchi Soya Industries Limited
22
V. INDEBTEDNESSIndebtedness of the Company including interest outstanding/accrued but not due for payment:
(` in lakh)
Secured Loans Unsecured Deposits TotalParticulars
excluding deposits Loans Indebtedness
Indebtedness at the beginning of thefinancial year
i) Principal Amount 3,37,989.14 1,87,203.71 5,25,192.85ii) Interest accrued 819.53 804.28 1,623.81Tital (i+ii) 3,38,808.67 1,88,007.99 5,26,816.66
Change in Indebtedness during thefinancial year
Addition (net of reduction) 1,31,165.83 (1,25,045.43) 6,120.40i) Principal Amount 4,57,988.93 62,847.52 5,20,836.45ii) Interest accrued 11,985.57 115.04 12,100.61Total (i+ii) 4,69,974.50 62,962.56 5,32,937.06
VI. REMUNERATION OF DIRECTORS AND KEY MANAGERIAL PERSONNELA. Remuneration to Managing Director, Whole time director and/or Manager (` in lakh)
Sl. No. Particulars of Remuneration Name of MD/WTD/ Manager
Dinesh Shahra Vijay Kumar Jain Total Amount
1 Gross salary(a) Salary as per provisions contained in section 17(1) of
the Income Tax Act, 1961 124.28 44.85 169.13(b) Value of perquisites u/s 17(2) of the Income tax Act, 1961 34.43 — 34.43(c ) Profits in lieu of salary under section 17(3) of the —
Income Tax Act, 1961 — — —2 Stock option — — —3 Sweat Equity — — —4 Commission — — —
– as % of profit — — —– others (specify) — — —
5 Others, please specifyTotal (A) 158.71 44.85 203.56
Annual Report 2016-17
23
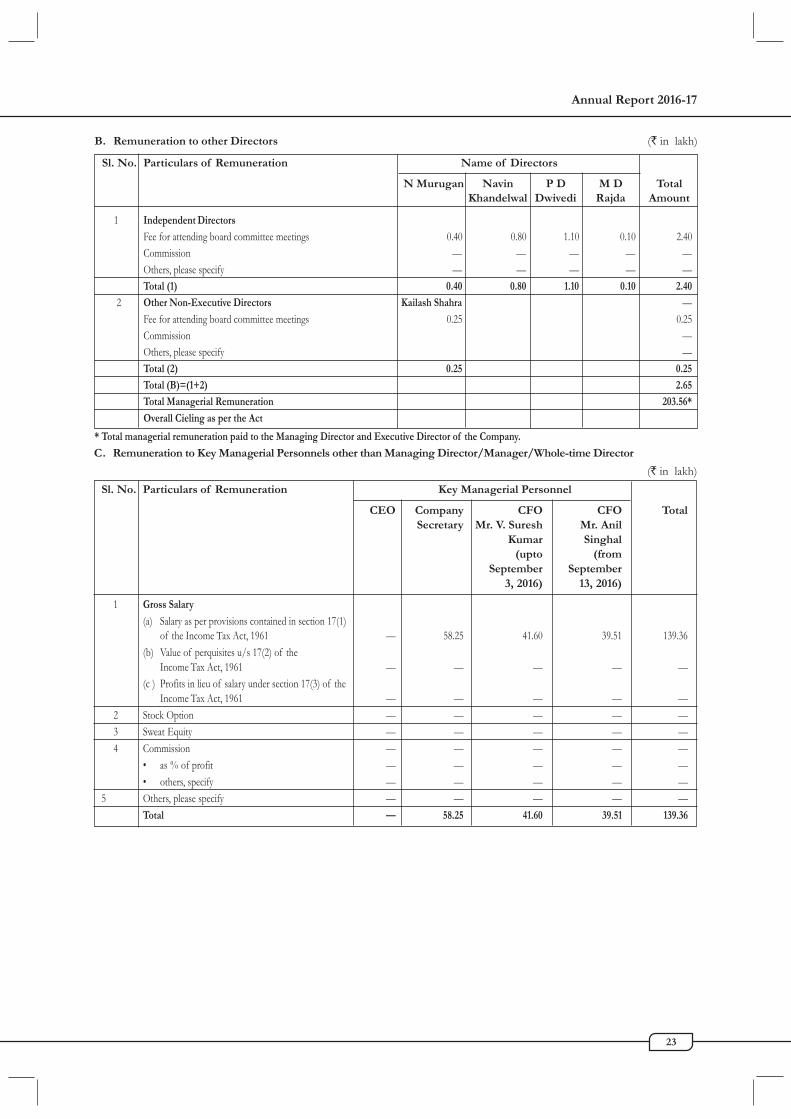
B. Remuneration to other Directors (` in lakh)
Sl. No. Particulars of Remuneration Name of Directors
N Murugan Navin P D M D TotalKhandelwal Dwivedi Rajda Amount
1 Independent Directors
Fee for attending board committee meetings 0.40 0.80 1.10 0.10 2.40Commission — — — — —Others, please specify — — — — —Total (1) 0.40 0.80 1.10 0.10 2.40
2 Other Non-Executive Directors Kailash Shahra —Fee for attending board committee meetings 0.25 0.25Commission —Others, please specify —Total (2) 0.25 0.25
Total (B)=(1+2) 2.65
Total Managerial Remuneration 203.56*
Overall Cieling as per the Act
* Total managerial remuneration paid to the Managing Director and Executive Director of the Company.
C. Remuneration to Key Managerial Personnels other than Managing Director/Manager/Whole-time Director
(` in lakh)Sl. No. Particulars of Remuneration Key Managerial Personnel
CEO Company CFO CFO TotalSecretary Mr. V. Suresh Mr. Anil
Kumar Singhal(upto (from
September September3, 2016) 13, 2016)
1 Gross Salary
(a) Salary as per provisions contained in section 17(1)of the Income Tax Act, 1961 — 58.25 41.60 39.51 139.36
(b) Value of perquisites u/s 17(2) of theIncome Tax Act, 1961 — — — — —
(c ) Profits in lieu of salary under section 17(3) of theIncome Tax Act, 1961 — — — — —
2 Stock Option — — — — —3 Sweat Equity — — — — —4 Commission — — — — —
• as % of profit — — — — —• others, specify — — — — —
5 Others, please specify — — — — —Total — 58.25 41.60 39.51 139.36

Ruchi Soya Industries Limited
24
VII. PENALTIES/PUNISHMENT/COMPOUNDING OF OFFENCES
Type Section of the Brief Details of Authority AppealCompanies Description Penalty / (RD/NCLT made, if any
Act Punishment/ /Court) (give details)Compoundingfees imposed
A. COMPANY
PenaltyPunishmentCompounding
B. DIRECTORS
PenaltyPunishmentCompounding
C. OTHER OFFICERS IN DEFAULT
PenaltyPunishmentCompounding
NIL

Annual Report 2016-17
25
Annexure II to the Directors’ ReportSECRETARIAL AUDIT REPORT
Form No. MR-3
FOR THE FINANCIAL YEAR ENDED 31ST MARCH 2017
[Pursuant to section 204 (1) of the Companies Act, 2013 and Rule No. 9 of the Companies(Appointment and Remuneration of Managerial Personnel) Rules, 2014]
ToThe MembersRuchi Soya Industries LimitedRuchi House, Royal Palms, Survey No. 169Aarey Milk Colony, Near Mayur NagarGoregaon (East), Mumbai – 400 065I have conducted the Secretarial Audit of the compliance of applicable statutory provisions and the adherence to good corporatepractices by Ruchi Soya Industries Limited having CIN: L15140MH1986PLC038536 (hereinafter called “the Company”).Secretarial Audit was conducted in a manner that provided me a reasonable basis for evaluating the corporate conducts/statutorycompliances and expressing my opinion thereon.Based on my verification of the Company’s books, papers, minute books, forms and returns filed and other records maintained by thecompany and also the information provided by the Company, its officers, agents and authorized representatives during the conduct ofsecretarial audit, I hereby report that in my opinion, the Company has, during the audit period covering the financial year ended on 31st
March, 2017 generally complied with the statutory provisions listed hereunder and also that the Company has proper Board processesand compliance mechanism in place to the extent, in the manner and subject to the reporting made hereinafter:I have examined the books, papers, minute books, forms and returns filed and other records maintained by the Company for thefinancial year ended 31st March, 2017 according to the provisions of:(i) The Companies Act, 2013 (the Act) and the rules made thereunder;(ii) The Securities Contracts (Regulation) Act, 1956 (‘SCRA’) and the rules made thereunder;(iii) The Depositories Act, 1996 and the Regulations and Bye-laws framed thereunder;(iv) Foreign Exchange Management Act, 1999 and the rules and regulations made thereunder to the extent of External Commercial
Borrowings;(v) The following Regulations and Guidelines prescribed under the Securities and Exchange Board of India Act, 1992 (‘SEBI Act’):-
(a) The Securities and Exchange Board of India (Substantial Acquisition of Shares and Takeovers) Regulations, 2011;(b) The Securities and Exchange Board of India (Prohibition of Insider Trading) Regulations, 2015;(c) The Securities and Exchange Board of India (Employee Stock Option Scheme and Employee Stock Purchase Scheme)
Guidelines, 1999; and The Securities and Exchange Board of India (Share Based Employee Benefits) Regulations,2014; and
(d) The Securities and Exchange Board of India (Registrar to an Issue and Share Transfer Agents) Regulations, 1993regarding the Companies Act and dealing with client;
(vi) Food Safety and Standards Act, 2006.As per the explanations given to me in the representations made by the management and relied upon by me, during the periodunder review, provisions of the following regulations were not applicable to the Company:
(i) Foreign Exchange Management Act, 1999 and the rules and regulations made thereunder to the extent of OverseasDirect Investment and Foreign Direct Investment.
(ii) The following Regulations and Guidelines prescribed under the Securities and Exchange Board of India Act, 1992(‘SEBI Act’):-(a) The Securities and Exchange Board of India (Issue of Capital and Disclosure Requirements) Regulations, 2009;(b) The Securities and Exchange Board of India (Issue and Listing of Debt Securities) Regulations, 2008;(c) The Securities and Exchange Board of India (Delisting of Equity Shares) Regulations, 2009; and(d) The Securities and Exchange Board of India (Buyback of Securities) Regulations, 1998.
I have also examined compliance with the applicable clauses of the following:(i) Secretarial Standards 1 & 2 issued by the Institute of Company Secretaries of India under the Companies Act, 2013.(ii) The Securities and Exchange Board of India (Listing Obligations and Disclosure Requirements) Regulations, 2015.
During the period under review the Company has generally complied with the provisions of the Act, Rules, Regulations, Guidelines,Standards, etc. to the extent applicable.

Ruchi Soya Industries Limited
26
I further report that:The Board of Directors of the Company is duly constituted with proper balance of Executive Directors, Non – ExecutiveDirectors and Independent Directors. The changes in the composition of the Board of Directors that took place during the periodunder review were carried out in compliance with the provisions of the Act.Adequate notice is generally given to all directors to schedule the Board Meetings, agenda and detailed notes on agenda weregenerally sent at least seven days in advance and a system exists for seeking and obtaining further information and clarifications onthe agenda items before the meeting and for meaningful participation at the meeting.Majority decision is carried through and as informed, there were no dissenting members’ views and hence not recorded as part ofthe minutes.I further report that as per the explanations given to me in the representations made by the management and relied upon by methere are adequate systems and processes in the company commensurate with the size and operations of the company to monitorand ensure compliance with applicable laws, rules, regulations and guidelines.As per the information provided and explanations given to me in the representations made by the management and relied upon byme, I further report that, the following are the specific event/ action took place, having a major bearing on the Company’s affairs,in pursuance of the above referred laws, rules, regulations, guidelines, etc.,1) The Company has disposed off its entire stake in the JV Company viz. Ruchi Kagome Foods India Pvt. Ltd. resulting into
termination of Joint Venture arrangement.2) The Company has been served with a copy of winding up petition filed by two of its Creditors before the Hon’ble High
Court of Bombay.3) The Company has received the confirmation of the direction issued in ad interim ex parte orders dated March 2, 2016 and
May 24, 2016 from Securities and Exchange Board of India (SEBI) which restrained the company from buying, selling ordealing in the securities market, either directly or indirectly, in any manner whatsoever, and such order shall continue to be inforce till further directions. However the SEBI has granted relief to trade in commodity derivatives markets for the limitedpurpose of hedging physical market positions under the supervision of the exchanges.
CS Prashant DiwanPractising Company SecretaryFCS: 1403 CP: 1979
Date : August 14, 2017Place : MumbaiThis report is to be read with our letter of even date which is annexed as Annexure A and forms an integral part of this report.
Annexure “A”
ToThe MembersRuchi Soya Industries LimitedRuchi House, Royal Palms, Survey No. 169Aarey Milk Colony, Near Mayur NagarGoregaon (East), Mumbai – 400 065My report of even date is to be read along with this letter.1. Maintenance of secretarial record is the responsibility of the management of the company. My responsibility is to express an
opinion on these secretarial records based on my audit.2. I have followed the audit practices and processes as were appropriate to obtain reasonable assurance about the correctness of
the contents of Secretarial records. The verification was done on test basis to ensure that correct facts are reflected insecretarial records. I believe that the processes and practices, I followed provide a reasonable basis for my opinion.
3. I have not verified the correctness and appropriateness of financial records and Books of Account of the company.4. Where ever required, I have obtained the Management representation about the compliance of laws, rules and regulations
and happening of events etc.5. The compliance of the provisions of Corporate, Specific and other applicable laws, rules, regulations, standards is the
responsibility of management. My examination was limited to the verification of procedures on test basis.6. The Secretarial Audit report is neither an assurance as to the future viability of the company nor of the efficacy or effectiveness
with which the management has conducted the affairs of the company.CS Prashant DiwanPractising Company SecretaryFCS: 1403 CP: 1979
Date : August 14, 2017Place : Mumbai
Annual Report 2016-17
27
Annexure III to the Directors’ ReportCONSERVATION OF ENERGY, TECHNOLOGY ABSORPTION, FOREIGN EXCHANGE EARNINGS ANDOUTGO
Your Company operates in a safe and environmentally responsible manner for the long-term benefit of all stakeholders. TheCompany works towards minimizing the impact of its operations on the environment and is committed to take effective measuresto conserve energy, promote the use of renewable energy and drive energy efficiency in its operations. During the year underreview, several steps were taken for conservation of energy, some of which are listed below:
(A) CONSERVATION OF ENERGY
(I) The steps taken or impact on conservation of energy:
A number of energy conservation techniques were initiated and successfully implemented. Some of the key initiativesundertaken in the manufacturing units were as follows:-
Steam Energy Saving :
Regular monitoring of steam trap to save heat/ steam energy. Insulation on valves, bend, flanges to avoid heat loss &steam energy saving.Insulation of oil tank for saving steam energy. Condensate recovery system to utilize to save heat/steam energy. Reduction of open steam in process hence to reduce steam energy at refinery. Conversion of diesel fuelbased boiler to husk based boiler to reduce operational cost Thermal insulation audit done periodically to save heat/energy. Installation of Plate heat exchanger to utilize heat of final crude oil or refined oil to save steam energy. Designingof process equipment on low steam pressure to reduce steam consumption. Boiler Blower coupled directly with motor toreduce transmission losses in place of belt drive system. To increase turbine utilization vacuum system designed on lowpressure & preventing venting of steam. Installation of Pressure reducing station/ valve to proper utilize heat of steam.Reduce heat load by utilization of flue gas heat for heating of boiler feed water.
Electrical Enery saving :
Old & inefficient motors replaced by energy efficient IE3 motors. Old & inefficient gear boxes worm reduction replacedby helical type for power saving. Variable frequency drive installed to reduce excess power consumption by motors.Helogen lighting replaced by LED to save electrical energy. Higher capacity pumps & motors replaced by efficent pumps& motors after conducting audit. Capacitor installation to improve power factor & reduce electrical energy losses. Byautomation on cooling tower fan with temperature of water we reduce power consumption. By operating plant with PLFsystem we reduce power & operational cost.
Others Area:
To reduce effluent water load we installed nozzle centifuse at palm oil plant to recover oil from effluent water.Utilizationof agro fuel with coal to reduce operation cost or steam cost. Installation of Reject recycle RO plant to reduce wastage ofwater. Utilization of RO reject water/ blow down water directly in cooling tower of refinery to reduce water consumptionin process. Start physical refining process oil to reduce chemical consumption installation of bag filter on process equipmentto create dust free environment.
(II) The steps taken by the Company for utilizing alternate sources of energy:
During the year under review, the steps were taken to use the solar street lights by replacing traditional street lights atCompany’s various plants and to utilize the forced circulation Solar water heating system by replacing conventionalsteam heating system in finished products packing.
(III) The capital investment on energy conservation equipment’s:
An amount of ` 39.56 Lakh was incurred towards capital investment on energy conservation equipments during theyear under review.
(B) TECHNOLOGY ABSORPTION
(I) The efforts made towards technology absorption:
In order to maintain its leadership position, your Company is continuously focusing on upgrading its product andmanufacturing technology as well as acquiring new and advanced technology to meet the emerging expectations of thecustomers. The R&D department is actively involved in the development and implementation of advanced utilitygeneration system to make manufacturing process efficient and has procured Indigenous Technology of Co-generation(STG set-Steam Turbine & Generator set). An expert consultant has been hired for installation of Co-generation unit(Steam Operated Turbine-Electricity Generation Unit). The activities are in full consonance with the Company’s objectiveof utilizing the most advanced energy efficient solutions at minimum cost.
Ruchi Soya Industries Limited
28
(II) The benefits derived like product improvement, cost reduction, product development or import substitution:
Introduction of new technologies has helped the Company to achieve more efficient operations, manufacture highquality and safe products, reduce energy cost and better energy utilization. By adoption of latest advanced technologies,the Company intends to capitalize and bookshelf the developed technology for incorporation into the quality productsat competitive price for making them more attractive to the end customers. The Company is also taking measures tomitigate all future risks related to technology by taking appropriate emerging technology, green initiatives etc. to meetfuture emission standards.
(III) In case of imported technology (imported during the last three years reckoned from the beginning of thefinancial year):
(a) The details of technology imported : None(b) The year of import : Not Applicable(c) Whether the technology been fully absorbed : Not Applicable(d) If not fully absorbed, areas where absorption has not taken place, and the reasons thereof : Not Applicable
(IV) The expenditure incurred on Research and Development:
Expenditure incurred on research and development are charged under primary heads of accounts and not allocatedseparately.
(V) Foreign exchange earnings and Outgo:
The foreign exchange earned in terms of actual inflows during the year was ̀ 1,376.96 Crores (Previous year ̀ 3,885.96Crores) and the foreign exchange outgo during the year in terms of actual outflows was ` 5,155.04 Crores (previousyear ` 12,112.03 Crores).

Annual Report 2016-17
29
To the MembersRUCHI SOYA INDUSTRIES LIMITED
INDEPENDENT AUDITORS’ CERTIFICATE ON CORPORATE GOVERNANCE
1. This certificate is issued in accordance with the terms of our engagement with Ruchi soya Industries Limited (‘the Company’).
2. We have examined the compliance of conditions of Corporate Governance by the Company, for the year ended on31st March, 2017, as stipulated in regulations 17 to 27 and clauses (b) to (i) of regulation 46(2) and para C and D of Schedule Vof the SEBI (Listing Obligations and Disclosure Requirements) Regulations, 2015 (the Listing Regulations).
MANAGEMENTS’ RESPONSIBILITY
3. The compliance of conditions of Corporate Governance is the responsibility of the Management. This responsibility includesthe design, implementation and maintenance of internal control and procedures to ensure the compliance with the conditionsof the Corporate Governance stipulated in Listing Regulations.
AUDITOR’S RESPONSIBILITY
4. Our responsibility is limited to examining the procedures and implementation thereof, adopted by the Company for ensuringcompliance with the conditions of the Corporate Governance. It is neither an audit nor an expression of opinion on thefinancial statements of the Company.
5. We have examined the books of account and other relevant records and documents maintained by the Company for thepurposes of providing reasonable assurance on the compliance with Corporate Governance requirements by the Company.
6. We have carried out an examination of the relevant records of the Company in accordance with the Guidance Note onCertification of Corporate Governance issued by the Institute of Chartered Accountants of India (the ICAI), the Standardson Auditing specified under Section 143(10) of the Companies Act 2013, in so far as applicable for the purpose of thiscertificate and as per the Guidance Note on Reports or Certificates for Special Purposes issued by the ICAI which requiresthat we comply with the ethical requirements of the Code of Ethics issued by the ICAI.
7. We have complied with the relevant applicable requirements of the Standard on Quality Control (SQC) 1, Quality Controlfor Firms that Perform Audits and Reviews of Historical Financial Information, and Other Assurance and Related ServicesEngagements.
OPINION
8. Based on our examination of the relevant records and according to the information and explanations provided to us and therepresentations provided by the Management, we certify that the Company has complied with the conditions of CorporateGovernance as stipulated in regulations 17 to 27 and clauses (b) to (i) of regulation 46(2) and para C and D of Schedule Vof the Listing Regulations during the year ended March 31, 2017.
9. We state that such compliance is neither an assurance as to the future viability of the Company nor the efficiency or effectivenesswith which the Management has conducted the affairs of the Company.
For P. D. Kunte & Co. (Regd.)Chartered Accountants
Firm Regn. No. 105479W
D.P. SaprePlace : Mumbai PartnerDate : August 19, 2017 Membership No. 40740
Annexure IV to the Directors’ Report
Auditors’ Certificate on Corporate Governance

Ruchi Soya Industries Limited
30
Annexure V to the Directors’ ReportInformation and Disclosure as required under Section 62 of the Companies Act, 2013 read with Rule 12(9) of the Companies(Share Capital and Debentures) Rules, 2014 and Regulation 14 of the Securities Exchange Board of India (Share Based EmployeeBenefits) Regulations, 2014 in relation to Employee Stock Option Scheme – 2007 as on March 31, 2017are as given below:I General Terms & Conditions
(a) Date of Shareholders’ approval November 28, 2007 as modified on June 16, 2009(b) Total number of options approved under ESOS 54,71,000 Options (granted 41,30,000 options)(c) Vesting Requirements and Conditions The options will vest only if the eligible employee of the Company
is in the continuous employment as on the date of vesting.Other Conditions:
The holders of the Employee Stock Options are entitled toexercise the option within a period of three years from the dateof first vesting, failing which post expiry of grace period of oneyear they stand cancelled. In the case of termination ofemployment by the Company, all options, vested or not, standcancelled immediately. In case of voluntary resignation, all un-vested options stand cancelled.The resigning employees may exercise the vested optionsconcurrently with the resignation, beyond which such optionsstand cancelled. In the event of death of an employee, retirementor the employee becoming totally and permanently disabled, allunvested options vest immediately and can be exercised duringthe original term of the option.
(d) Exercise price or pricing formula Eligible employees are entitled against each option to subscribefor one equity share of face value of ̀ 2/- each at a premium of` 33/- per share.
(e) Maximum term of options granted Refer (c) above under heading ‘Vesting requirements andConditions’ – Other Conditions.
(f) Source of shares Primary(g) Variation in terms of option NILII Method used to account for ESOS (i) Intrinsic value - for options vested before the date of
transition to Ind AS i.e. 1st April, 2015.(ii) Fair value - for options vested after date of transition to
Ind AS i.e. 1st April, 2015.III Where the Company opts for expensing of the
options using the intrinsic value of the options,the difference between the employeecompensation cost that shall have beenrecognized if it had used the fair value of theoptions shall have been recognized if it had usedthe fair value of the options shall be disclosed.The impact of this difference on profits and onEPS of the Company shall also be disclosed.
IV Option movement during the year 2016-17
(a) No. of options outstanding at the beginning ofthe period 8,48,450
(b) No. of options granted during the year —(c) No. of options forfeited/lapsed during the year 1,13,950(d) No. of options exercised during the year Nil(e) No. of shares arising as a result of exercise of options Nil(f) Money realized by exercise of options (Amount in `) Nil
Not Applicable

Annual Report 2016-17
31
(g) Loan repaid by the Trust during the year fromexercise price received Not Applicable
(h) No. of options outstanding at the end of the year 7,34,500(i) No. of options exercisable at the end of the year 7,34,500V Weighted average exercise prices and weighted Weighted average exercise price: ` 35 per Share.
average fair values of options shall be disclosedseparately for options whose exercise price either Weighted average fair value of options: ` 45.63 per Share.equals or exceeds or is less than the market priceof the stock options.
VI Employee wise details (Name of Employee,designation, number of options granted duringthe year, exercise price) of options granted to:
(a) Senior Managerial Personnel (Including KMP) None(b) Any other employee who receives a grant in any one None
year of option amounting to 5% or more of optiongranted during that year
(c) Identified employees who were granted option during Noneany one year, equal to or exceeding 1% of the issuedcapital (excluding outstanding warrants andconversions) of the Company at the time of grant
VII A description of the method and significantassumptions used during the year to estimatethe fair value of options.
The Securities and Exchange Board of India (SEBI) hasprescribed two methods to account for stock grants; (i) theintrinsic value method; (ii) the fair value method. The Companyhas adopted (i) Intrinsic value - for options vested before date oftransition to Ind AS i.e. 1st April, 2015 (ii) fair value - for optionsvested after date of transition to Ind AS i.e. 1st April, 2015 toaccount for the stock options it grants to the employees. TheCompany issues the Grants at Fixed price of ̀ 35 per share. Henceother details are not applicable.

Ruchi Soya Industries Limited
32
Annexure VI to the Directors’ Report
The information pursuant to section 197 (12) of the Companies Act, 2013 read with Rule 5(1) of the Companies (Appointmentand Remuneration of Managerial Personnel) Rules, 2014 are given below:1. The ratio of the remuneration of each director to the median remuneration of the employees of the company for the
financial year;Mr. Dinesh Shahra is the Managing Director and Mr. Vijay Kumar Jain, is the Executive Director of the Company. The ratioof their remuneration to the median remuneration of the employees of the Company for the financial year 2016-17 was asunder:Mr. Dinesh Shahra 43.66 : 1.00Mr. Vijay Kumar Jain 16.37 : 1.00The other Directors are non-executive or independent directors and hence were paid only sitting fee.
2. The percentage increase in remuneration of each Director, Chief Financial Officer, Chief Executive Officer, CompanySecretary or Manager, if any, in the financial year 2016-17;Mr. Dinesh Shahra —Mr. Vijay Kumar Jain 19.80Mr. V Suresh Kumar* —Mr. Anil Singhal** 47.50Mr. Ramji Lal Gupta —* Mr. V Suresh Kumar was the Chief Financial Officer of the Company upto 3rd September, 2016.** Mr. Anil Singhal was appointed as a Chief Financial Officer of the Company with effect from 13th September, 2016.
3. The percentage increase in the median remuneration of employees in the financial year: Nil.4. The number of permanent employees on the rolls of Company: 3133 as on March 31, 2017.5. Average percentile increase already made in the salaries of employees other than the managerial personnel in the last financial
year and its comparison with the percentile increase in the managerial remuneration and justification thereof and point outif there are any exceptional circumstances for increase in the managerial remuneration;At managerial level, the medium increase was 6.22% in the financial year 2016-17 as compared to 6% at staff and workerlevel.
6. Affirmation that the remuneration is as per the remuneration policy of the Company:The remuneration is as per the Nomination, Remuneration and Evaluation policy of the Company.
Annual Report 2016-17
33
Annexure VII to the Directors’ Report
Nomination, Remuneration and Evaluation Policy
This Nomination, Remuneration and Evaluation Policy (the“Policy”) applies to the Board of Directors (the “Board”), KeyManagerial Personnel (the “KMP”) and the Senior ManagementPersonnel of Ruchi Soya Industries Limited (the “Company”).“Key Managerial Personnel (KMP) means—(i) Managing Director;(ii) Company Secretary,(iii) Whole-time Director;(iv) Chief Financial Officer; and(v) Such other Officer as may be prescribed.
The term “Senior Management Personnel” means all membersother than the Directors and KMPs of the Company, who arethe functional heads of the different functions of the Company.This Policy is in compliance with Section 178 of the CompaniesAct, 2013 read along with the applicable rules thereto and SEBI(Listing Obligations and Disclosure Requirements) Regulations,2015 (LODR).
1. Purpose
The primary objective of the Policy is to provide aframework and set standards for the selection, nomination,remuneration and evaluation of the Directors, KeyManagerial Personnel and officials comprising the seniormanagement. The Company aims to achieve a balance ofmerit, experience and skills amongst its Directors, KeyManagerial Personnel and Senior Management.
2. Accountabilities
2.1 The Board is ultimately responsible for the appointmentof Directors and Key Managerial Personnel.
2.2 The Board has delegated responsibility for assessingand selecting the candidates for the role of Directors,Key Managerial Personnel and the SeniorManagement of the Company to the Nomination andRemuneration Committee which makesrecommendations and nominations to the Board.
3. Nomination and Remuneration Committee
The Nomination and Remuneration Committee isresponsible for:3.1 reviewing the structure, size and composition
(including the skills, knowledge and experience) ofthe Board at least annually and makingrecommendations on any proposed changes to theBoard to complement the Company’s corporatestrategy, with the objective to diversify the Board;
3.2 identifying individuals suitably qualified to beappointed as the KMPs or in the senior managementof the Company;
3.3 recommending to the Board on the selection ofindividuals nominated for directorship;
3.4 making recommendations to the Board on theremuneration payable to the Directors/ KMPs/SeniorOfficials so appointed/reappointed;
3.5 assessing the independence of independent directors;3.6 such other key issues/matters as may be referred by
the Board or as may be necessary in view of theLODR and provision of the Companies Act 2013and Rules thereunder;
3.7 to make recommendations to the Board concerningany matters relating to the continuation in office ofany Director at any time including the suspension ortermination of service of an Executive Director asan employee of the Company subject to the provisionof the law and their service contract;
3.8 ensure that level and composition of remunerationis reasonable and sufficient, relationship ofremuneration to performance is clear and meetsappropriate performance benchmarks;
3.9 to devise a policy on Board diversity and3.10 to develop a succession plan for the Board and to
regularly review the plan.The Nomination and Remuneration Committee comprisesof the following:a) The Committee shall consist of a minimum 3 non-
executive directors, majority of them beingindependent.
b) Minimum two (2) members shall constitute a quorumfor the Committee meeting.
c) Membership of the Committee shall be disclosed inthe Annual Report.
d) Term of the Committee shall be continued unlessterminated by the Board of Directors.
CHAIRMAN
a) Chairman of the Committee shall be an IndependentDirector.
b) Chairperson of the Company may be appointed as amember of the Committee but shall not be aChairman of the Committee.
c) In the absence of the Chairman, the members of theCommittee present at the meeting shall choose oneamongst them to act as Chairman.
d) Chairman of the Nomination and RemunerationCommittee could be present at the Annual GeneralMeeting or may nominate some other member toanswer the shareholders’ queries.
COMMITTEE MEMBERS’ INTERESTS
a) A member of the Committee is not entitled to bepresent when his or her own remuneration is discussedat a meeting or when his or her performance is beingevaluated.
b) The Committee may invite such executives, as itconsiders appropriate, to be present at the meetingsof the Committee.
VOTINGa) Matters arising for determination at Committee meetings
shall be decided by a majority of votes of the Members

Ruchi Soya Industries Limited
34
present and voting and any such decision shall for allpurposes be deemed a decision of the Committee.
b) In the case of equality of votes, the Chairman of themeeting will have a casting vote.
4. Appointment of Directors/KMPs/Senior Officials
4.1 Enhancing the competencies of the Board and attractingas well as retaining talented employees for role of KMP/a level below KMP are the basis for the Nominationand Remuneration Committee to select a candidate forappointment to the Board. When recommending acandidate for appointment, the Nomination andRemuneration Committee has regard to:- assessing the appointee against a range of
criteria which includes but not be limited toqualifications, skills, regional and industryexperience, background and other qualitiesrequired to operate successfully in the position,with due regard for the benefits fromdiversifying the Board;
- the extent to which the appointee is likely tocontribute to the overall effectiveness of theBoard, work constructively with the existingdirectors and enhance the efficiencies of theCompany;
- the skills and experience that the appointeebrings to the role of KMP/Senior Official andhow an appointee will enhance the skill sets andexperience of the Board as a whole;
- the nature of existing positions held by theappointee including directorships or otherrelationships and the impact they may have onthe appointee’s ability to exercise independentjudgment;
4.2 Personal specifications:- Degree holder in relevant disciplines;- Experience of management in a diverse
organization;- Excellent interpersonal, communication and
representational skills;- Demonstrable leadership skills;- Commitment to high standards of ethics,
personal integrity and probity;- Commitment to the promotion of equal
opportunities, community cohesion and healthand safety in the workplace;
- Having continuous professional developmentto refresh knowledge and skills.
5. Letters of Appointment
Each of the Directors/KMPs/Senior Officials is requiredto sign the letter of appointment with the Companycontaining the terms of appointment and the role assignedin the Company.
6. Remuneration of Directors, Key Managerial Personneland Senior Management Personnel
The guiding principle is that the level and composition of
remuneration shall be reasonable and sufficient to attract,retain and motivate Directors, Key Management Personneland other senior officials.
The Directors, Key Management Personnel and other seniorofficial’s remuneration shall be based and determined onthe individual person’s responsibilities and performance andin accordance with the limits as prescribed under theCompanies Act, 2013 and rules made thereunder, if any.
The Nomination & Remuneration Committee shalldetermine and recommend individual remunerationpackages for Directors, KMPs and Senior Officials of theCompany to the Board of Directors after taking intoaccount factors it deems relevant, including but not limitedto market, business performance and practices incomparable companies, having due regard to financial andcommercial health of the Company as well as prevailinglaws and government/other guidelines.
(i) Remuneration:
(a) Base Compensation (Fixed Salary):
Must be competitive and reflective of theindividual’s role, responsibility and experiencein relation to performance of day-to-dayactivities, usually reviewed on an annual basis(includes salary, allowances and other statutory/non-statutory benefits which are normal partof remuneration package in line with marketpractices).
(b) Variable Salary:
The Nomination and Remuneration Committeemay in its discretion structure any portion ofremuneration to link rewards to corporate andindividual performance for fulfilment ofspecified improvement targets or the attainmentof certain financial or other objectives set bythe Board. The amount payable shall bedetermined by the Committee, based onperformance against pre-determined financialand non-financial metrics.
(ii) Statutory Requirements:
Section 197(5) provides for remuneration by way ofa fee to a director for attending meetings of the Boardof Directors and Committee meetings or for any otherpurpose as may be decided by the Board.
Section 197(1) of the Companies Act, 2013 providesfor the total managerial remuneration payable by theCompany to its directors, including managing directorand whole time director, and its manager in respectof any financial year shall not exceed eleven percentof the net profits of the Company computed in themanner laid down in Section 198 in the manner asprescribed under the Act.
The Company with the approval of the Shareholdersand Central Government may authorise the paymentof remuneration exceeding eleven percent of the netprofits of the company, subject to the provisions ofSchedule V to the Companies Act, 2013.

Annual Report 2016-17
35
The Company may with the approval of theshareholders authorise the payment of remunerationupto five percent of the net profits of the Companyto its any one Managing Director/Whole TimeDirector/Manager and ten percent in case of morethan one such official.The Company may pay remuneration to its directors,other than Managing Director and Whole TimeDirector upto one percent of the net profits of theCompany, if there is a managing director or wholetime director or manager and three percent of thenet profits in any other case.The net profits for the purpose of the aboveremuneration shall be computed in the manner referredto in Section 198 of the Companies Act, 2013.
6.1 The Independent Directors shall not be entitled toany stock option and may receive remuneration byway of fee for attending meetings of the Board orCommittee thereof or for any other purpose as maybe decided by the Board and profit relatedcommission as may be approved by the members.The sitting fee to the Independent Directors shallnot be less than the sitting fee payable to otherdirectors.
6.2 The remuneration payable to the Directors shall beas per the Company’s policy and subject to theprovisions of the Companies Act, 2013 and shall bevalued as per the Income Tax Rules.
6.3 The remuneration payable to the Key ManagerialPersonnel and the Senior Management shall be, asmay be decided by the Board and subject to theprovisions of the Companies Act, 2013 having regardto their experience, leadership abilities, initiative takingabilities and knowledge base.
7. Evaluation/ Assessment of Directors/ KMPs/SeniorOfficials of the Company –
The evaluation/assessment of the Directors, KMPs andthe senior officials of the Company is to be conducted onan annual basis to comply with the requirements of theLODR and the Companies Act, 2013.The following criteria may assist in determining howeffective the performances of the Directors/KMPs/Seniorofficials have been:• leadership & stewardship abilities;
• contributing to clearly defined corporate objectives& plans;
• communication of expectations & concerns clearlywith subordinates;
• obtain adequate, relevant & timely information fromexternal sources;
• review & approval achievement of strategic andoperational plans, objectives, budgets;
• regular monitoring of corporate results againstprojections;
• identify, monitor & mitigate significant corporate risks• assess policies, structures & procedures;• direct, monitor & evaluate KMPs, senior officials;• review management’s succession plan;• effective meetings;• assuring appropriate board size, composition,
independence, structure;• clearly defining roles & monitoring activities of
committees; and• review of company’s ethical conduct.Evaluation on the aforesaid parameters will be conductedby the Independent Directors for each of the Executive/Whole-time / Non-Independent Directors in a separatemeeting of the Independent Directors.The Executive / Whole-time /Non-Independent Directorsalong with the Independent Directors will evaluate/assesseach of the Independent Directors on the aforesaidparameters. Only the Independent Director being evaluatedwill not participate in the said evaluation discussion.The Nomination and Remuneration Committee shall alsocarry out evaluation of the performance of Directors ofthe Company at regular interval.
8. Review and Amendment
8.1 The Nomination and Remuneration Committee or theBoard may review the policy as and when it deems necessary.
8.2 The Nomination and Remuneration Committee may issuethe guidelines, procedures, formats, reporting mechanismand manual in supplement and better implementation tothis policy, if it thinks necessary.This policy may be amended or substituted by the Boardof Directors on the recommendation of the Nominationand Remuneration Committee.

Ruchi Soya Industries Limited
36
Annexure VIII to the Directors’ Report
ANNUAL REPORT ON CORPORATE SOCIALRESPONSIBILITY (CSR) ACTIVITIES
1. A brief outline of the Company’s CSR policy, includingoverview of projects or programs proposed to beundertaken and a reference to the web-link to the CSRpolicy and projects or programs.
The Company had proposed to undertake the activities/programs relating to promoting education, healthcareactivities, women empowerment, sustainable livelihood,enhancing vocational skills etc. at local areas around theCompany’s operations.The Corporate Social ResponsibilityPolicy of the Company as approved by the Board ofDirectors, may be accessed on the Company’s website atwww.ruchisoya.com. Since the Company does not haveaverage net profit calculated under Section 135 read withSection 198 of the Companies Act, 2013, the Companyhas not spent any amount on its Corporate SocialResponsibility programs/activities during the financial year2016-17. However, Shri Mahadeo Shahra Sukrat Trustcontinued the ongoing activities.
2. The Composition of the CSR Committee:
The Company has a Corporate Social ResponsibilityCommittee of Directors comprising of Mr. N. Murugan,Chairman, Mr. Dinesh Shahra and Mr. Vijay Kumar Jainas Members.
3. Average net profit of the Company for last three financialyears: Nil
4. Prescribed CSR Expenditure (Two percent of the amountas in item 3 above): Nil
5. Details of CSR spent during the financial year: Nil
(a) Total amount to be spent for the financial year: Nil
(b) Amount unspent, if any: Not applicable
(c) Manner in which the amount spent during thefinancial year: Not applicable
6. In case the Company has failed to spend the two per centof the average net profit of the last three financial yearsor any part thereof, the Company shall provide the reasonsfor not spending the amount in its Board Report: Notapplicable
7. A responsibility statement of the CSR Committee thatthe implementation and monitoring of CSR Policy is incompliance with CSR objectives and Policy of theCompany:
We hereby affirm that the CSR Policy as approved by theBoard has been implemented and the CSR Committee aswell as Board monitors the implementation of the CSRactivities/programs undertaken by the Company incompliance of CSR objectives and Policy of the Company.
Dinesh Shahra N. MuruganManaging Director Chairman-CSR Committee(DIN: 00533055) (DIN: 01309393)
Place : MumbaiDate : August 19, 2017
Annual Report 2016-17
37
Management Discussionand Analysis ReportIndustry structure and Development
The primary business of your Company is processing of oilseedsand refining of imported crude oil for edible use. The Companyproduces oil meal, food products from soya and value addedproducts from downstream and upstream businesses. Thecompany has an integrated value chain in palm and soyasegments having a farm to fork business model.India is a USD 2 trillion economy with GDP growing at morethan 7% and a population of over 1.2 Billion people. It is theworld’s largest edible oil importer, with oil and oil seed turnoverof USD 25 Billion and import-export turnover of aroundUSD 13 Billion.Edible Oil is an important component of household food basket.India is importing around 14 Million tonnes of edible oil perannum at the cost of approx. ` 70,000 crore (USD 11 Billion)per annum. The total production of edible oil in the country isaround 9 Million MT, while the domestic requirement is around23 Million MT. The demand-supply gap is bridged by imports.Palm oil contributes 60% of vegetable oil import due to highproductivity per hectare , proximity of exporting nations suchas Malaysia and Indonesia and competitive pricing. However,the country’s edible oil imports have soared by almost 50% inthe last five years, with import of palm oil growing by 25% andsoya oil jumping by 300%.Our export of Soybean Meal has gone up substantially higherat 9,16,306 MT (Valued approx ` 2,236 Crore) during 2016-17as against 3,87,298 MT (valued approx ` 1,300 Crore) due tohigher domestic soya seed production than the previous year.
Opportunities and threats
Our per capita consumption of edible oil is 16 kg per annumwhich is quite low in comparison to developed counties wherethe level is 50-60 kg. Our consumption is also much below theworld average of 27/28 kg. Thus there is strong potential tocatch up with the global average considering the over alleconomic growth and improvement in per capita disposableincome for food.The consistent rise in import of edible oil to bridge the demand– supply gap impacts the trade imbalance and results insignificant outflow of foreign exchange. There is strong needto improve the production and productivity of domestic oilseed sector and promote domestic supply of edible oil to addressthe growing the demand –supply gap imbalance.
Rising Palmolein Import hurting domestic refiningindustry
Every country protects their domestic industry from unfaircompetition. Accordingly, Malaysia and Indonesia are protectingand encouraging their refineries by levy of higher export tax onCrude palm oil (raw material) to encourage refining in theirown country. However, in India, the situation is contrary. Currentimport duty structure inadvertently encouraging the import of
refined palm oil at the cost of domestic refining industry.Industry associations/bodies have once again represented tothe Government, bringing to the notice about the status ofdomestic refining industry and strongly pleaded to increase theduty difference between crude and refined vegetable oil to 15%from present level of 7.5% to help the refining industry to comeout from the present crisis.Recently, the Government responded positively to the requestof the Industry and increased the duties of both crude andrefined oils with differential level at 10% from the earlier levelof 7.50%.With increasing Edible oil consumption due to increase inpopulation as well as economic affluence and with a nearstagnant oilseed production, the import of Edible Oils isskyrocketing. Currently we import around 14 million tons,(valued around ̀ 70,000 crores). This quantum has the potentialto increase to 25 million tons by the year 2025. Dependence onimports to the extent of 70% has already compromised theEdible Oil food security of our country and the situation isworsening year after year. Oilseeds production ought to increasesubstantially to meet the growing demand for edible oils forhuman consumption as well as oilmeal and oil cake as sourceof protein for livestock sector.
Focussing on increase in domestic edible oil supplycontributing to sustainable farm income
Oil Palm is one of the world’s most efficient crop in terms ofyield of vegetable oil per hectare and today it is largest sourceof vegetable oil in the world. An average oil yield of 4-5 tones/ hectare has been recorded with oil palm against the highestoil yield 1.3 tonnes / hectare from rapeseed. However, weneed to encourage both the segments to promote domesticsupply, improve the income of farmers, contribute toemployment generation and the overall development of theregions in which the oil palm and mustard seeds are produced.Considering the surplus capacity in domestic crushing units,we need to evaluate opportunities to improve the utilisationfor the benefit of all the stakeholders. The above will enableimprovement in the income potential for the farmingcommunity, provide market support for procurement of farmproduce and contribute to the nation as responsiblecorporate citizens.
Oil palm policy to facilitate investments into oil palm sectorfor domestic supply of oil palm
The industry association has repeatedly drawn the attention ofthe Government to declare oil palm as “plantation crop” andexempt the land declared suitable for the oil palm cultivationfrom Land Ceiling Act to attract corporate body towards oilpalm plantation. Recently, Government responded positivelyand decided to relax the land ceiling limit for oil palm cultivationand also revised the norms of assistance mainly for plantingmaterial, maintenance cost, inter cropping cost and bore-wellto make the oil palm plantation attractive, Also, last year,

Ruchi Soya Industries Limited
38
Karnataka State Government had declared oil palm as plantationcrop. It is hoped that other States will also follow the Karnatakaby declaring oil palm as a plantation crop.
Improvement in production of Mustard seed
India is producing about 27 to 28 million tonnes of Oilseeds outof which 7.0 million tonnes in Mustard oilseeds. Industryassociations have proposed Mustard oilseeds production targetof 15 million tonnes by 2025, with a sub target of 10 milliontonnes by 2020 thereby doubling the income of farmers toaccomplish vision of Honourable Prime Minister of India in thenext five years.
Industry Outlook
Consumption growth
As per the industry sources, India’s consumption growth ispegged at 5% p.a and the country is expected to be consumingaround 34 Million tonnes of edible oil by 2025, with aprojected vegetable oil imports bill of US$25 Billion. Thegrowth in consumption presents an opportunity to buildaround a sustainable business model to participate in theimport and domestic production to capitalise the businessprospects.
Oil palm as a plantation crop
The key relaxation in the changes in the domestic palm sectorwill facilitate the corporate investments into the segment pavingfor significant increase in domestic palm production in the yearsahead. As the yield per hectare is far higher in palm than anyother edible oil seed and the encouragement given by the stateand central Governments will facilitate the growth of oil palm,development of the oil palm growing areas and significantincrease of income to the farming community .
Changing pattern of agriculture
Considering the improvement in the overall growth in theeconomy and the increase in disposal of income, consumerswill pay more for the goods with quality, safety from healthpoint of view and convenience to access procurement. In thelong run, this will pave from production led agriculture todemand driven agriculture with focus on multi consumeroriented approach.
Demonetisation
The demonetisation drive initiated by the Government of Indiaduring November, 2016 has changed the way in which businessesare conducted with transparency and accountability. It has alsoreduced unfair competition from the unorganised sector.
Goods and Service Tax (GST)
The implementation of GST marks the significant milestone inthe history of Indian taxation reforms. It will help in creating acommon market and is expected to have a far- reaching impacton the entire indirect tax system, the tax base, supply chainmanagement ,the production and pricing of goods and services.It seeks to address the issue of inefficiencies in the tax system,prevent cascading impact of multi-level taxation, plug revenueleakages and promote transparency in business.
Efficient utilisation of production facilities and strategicpartnership
Considering the vast scope in edible oil, food and feed businesssegment in India and the implementation of economic reforms,large companies having efficient production facilities,manufacturing plants at strategic locations, pan India distributionset up, strong logistics, focus on consistent quality at costefficient servicing capabilities will enjoy better advantages inaccessing (a) the outsourcing requirements for processing forthird parties and (b) strategic partnerships and tie ups to benefitthe stakeholders on a sustainable basis. This will benefitcompanies to focus on core strengths and build a business modelwith flexibilities and cost efficiencies to cater to the changingdemand- supply dynamics and the supply chain requirementsin the future.
INFORMATION TECHNOLOGY
SAP has been implemented in all plants, depots, regional officesand head office of the Company enabling alignment of strategiesand operations, better supply chain control at operational leveland access to consolidated data of the Company throughintegrated system.During the year, the Company has put in place processes forGST implementation. Also for better internal control, MobilityAttendance system and Face Detection machines introduced atvarious plants. For better transparency in the PurchaseManagement, Vendex System is introduced & integrated withSAP System. Vendex System captures all pre purchase activitiesonline, where in vendor can provide quotations and the systemautomatically makes comparisons.
HUMAN RESOURCES
The approved Human Resources Framework was furthercascaded below middle management level with focus onPerformance Management. Refresher courses were organizedto enhance clarity on processes and to cover new joinees. Qualityof SMART Goal setting, performance review, feedback processand Individual development plans were taken to next level. TheAnnual Performance Review was made more objective byensuring Goal Sheet Scores for all Middle and SeniorManagement employees and final rating was done on the basisof relative percentile positioning of performance.
Under strategic objective of establishing “High PerformanceWork Culture, the “Critical Resources” and “Dead Woods” wereidentified. The action plan for enhancing engagement, providingneed based learning opportunities and consequently enhancingtheir opportunities for career growth was executed for CriticalResources. The identified “Dead Woods” were separated onthe principles of soft landing, paving ways for enhancedworkforce ability, energy and passion levels.
The realignment of Popular and Consumer Brands Divisionverticals was completed with seamless merger of supportfunctions bringing huge synergies, lean organization set ups,amalgamation of work culture and mutual adoption of bestpractices. The focus on Coaching process led to enhanced peopleproductivity.

Annual Report 2016-17
39
The “HR Review” with Senior and Business Leadership teamcontinued as a core people process towards review of goals atmacro level, sponsoring new initiatives and allocating resourcesfor execution.
RISK AND CONCERNS
Price Volatility
Your Company is exposed to commodity price fluctuations inits business. All major raw materials as well as finished goodsbeing agro-based are subject to market price variations. Pricesof these commodities continue to be linked to both domesticand international prices, which in turn are dependent on variousMacro/ Micro factors. Also Commodities are increasinglybecoming asset classes. Prices of the Raw materials and finishedproducts manufactured by your Company fluctuate widely dueto a host of local and international factors. Your Companycontinues to place a strong emphasis on the risk managementand has successfully introduced and adopted various measuresfor hedging the price fluctuations in order to minimize its impacton profitability. Also, your Company has initiated setting-up ofa framework to upgrade itself to a robust risk managementsystem.
Government Policies
The policies announced by the Government have beenprogressive and are expected to remain likewise in future, andhave generally taken an equitable view towards various stakeholders, including domestic farmers, industry, consumers etc.
Freight & Port Infrastructure
A substantial part of the international operations of yourCompany are within the Asian region, and given the followingimport and export activities of your Company, the element offreight is not likely to cause any adverse effect on the operationalperformance. Your Company has a proactive information andmanagement system to address the issues arising out of portcongestions to the maximum extent possible and has also made
sufficient arrangements for storage infrastructure at the ports.
Weather Conditions & Monsoon
Your Company has processing facilities at major ports andseveral inland locations, and therefore, the business model ofyour Company is designed to carry-on a majority of itsproduction operations even in situations of extreme changes inweather conditions due to balanced business model to cater tothe strong domestic consumption in India.
Volatility in Foreign Currencies
Your Company is exposed to risks arising out of volatility inforeign currencies, the exposure on this account extends to:(a) Products imported for sale in domestic markets;(b) Products exported to other territories and(c) Foreign currency Loans.Your Company utilises the hedging instruments available in themarkets on an ongoing basis and manages the currencyexposures pro-actively.
Fuel Prices
Fuel prices continue to be an area of concern as fuel particularlyCoal is widely used in manufacturing operations has a directimpact on total costs. Your Company has taken productivitylinked measures aimed at controlling costs and taken furthersteps to focus on production of high margin products.
Domestic Economy
Your Company is well geared with multi-processing capabilitiesto cater to the variances and changing consumer preferences.Also keeping in view the overall growth of the economy,emerging health consciousness and growing retail in India, it isexpected that the packaged edible oil consumption will continueto outgrow the overall edible oil growth.
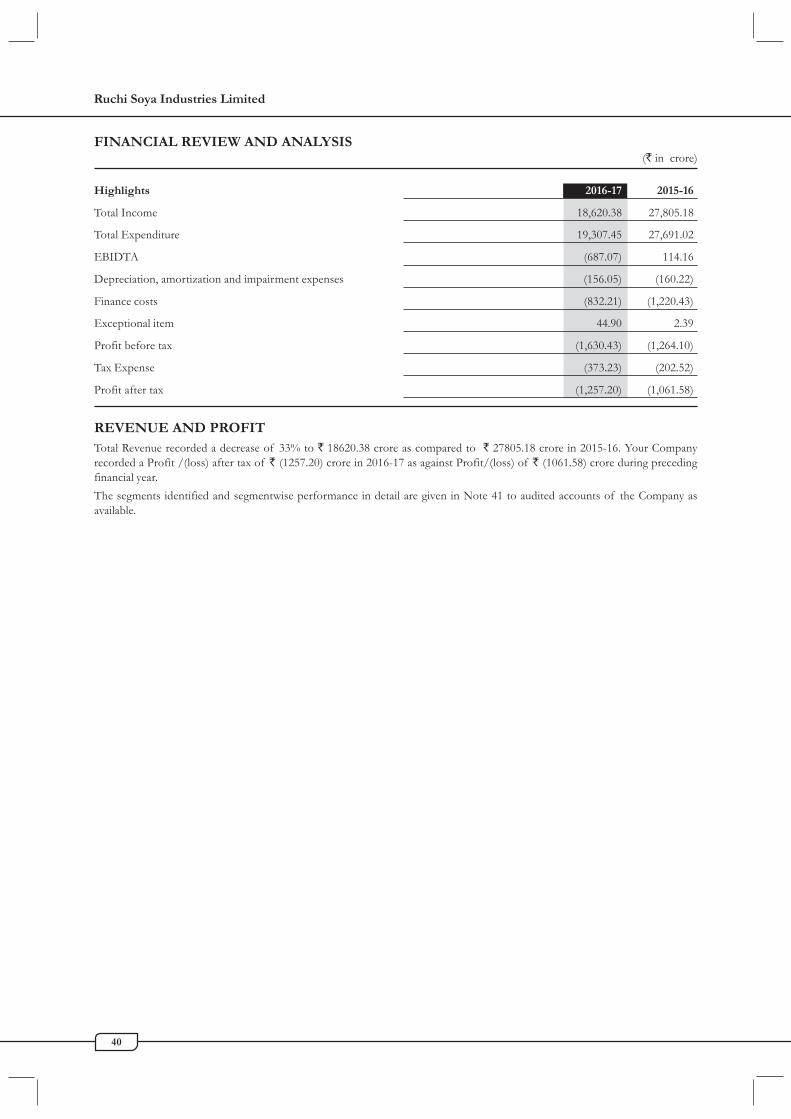
Ruchi Soya Industries Limited
40
FINANCIAL REVIEW AND ANALYSIS(` in crore)
Highlights 2016-17 2015-16
Total Income 18,620.38 27,805.18
Total Expenditure 19,307.45 27,691.02
EBIDTA (687.07) 114.16
Depreciation, amortization and impairment expenses (156.05) (160.22)
Finance costs (832.21) (1,220.43)
Exceptional item 44.90 2.39
Profit before tax (1,630.43) (1,264.10)
Tax Expense (373.23) (202.52)
Profit after tax (1,257.20) (1,061.58)
REVENUE AND PROFITTotal Revenue recorded a decrease of 33% to ` 18620.38 crore as compared to ` 27805.18 crore in 2015-16. Your Companyrecorded a Profit /(loss) after tax of ` (1257.20) crore in 2016-17 as against Profit/(loss) of ` (1061.58) crore during precedingfinancial year.The segments identified and segmentwise performance in detail are given in Note 41 to audited accounts of the Company asavailable.

Annual Report 2016-17
41
TEN YEARS FINANCIAL HIGHLIGHTS 591.83 773.63Ten Year Financial Performance - at a Glance
(` in crore)
Ind AS Indian GAAP2016-17 2015-16 2014-15 2013-14 2012-13 2011-12 2010-11 2009-10 2008-09 2007-08
Total Income 18,620 27,805 28,412 24,601 26,485 26,224 16,763 13,530 12,172 11,069EBITDA (687) 114 626 734 942 890 648 437 292 430PBT (1,630) (1,264) 81 50 304 228 306 272 151 254PAT (1,257) (1,062) 61 13 236 122 213 172 93 159Equity Share Capital 65 65 67 67 67 67 67 53 38 38Preference Share Capital 2 2 2 2 2 2 2 - 45 45Total Equity/Net Worth 1,024 2,473 2,206 2,336 2,364 2,202 2,156 1,925 1,140 1,061Total Borrowings(net of FDRs onBuyers credit) 5,329 5,268 3,246 2,710 2,900 2,380 2,086 1,098 914 1,187Gross Fixed Assets 6,042 6,040 3,877 3,692 3,519 3,211 2,808 2,511 1,744 1,502Export Turnover 1,052 1,754 3,360 3,599 4,321 3,234 2,267 1,346 1,693 1,361Long Term Debt-EquityRatio (Times) 0.58 0.31 0.50 0.60 0.56 0.49 0.43 0.46 0.80 1.12Key IndicatorsPer equity share (in `)Book value 31 76 66 70 70 66 67 77 60 58Dividend — — 0.16 0.16 0.32 0.32 0.50 0.50 0.50 0.50Turnover per Equityshare of ` 2 each. 570 852 850 737 794 787 521 546 647 584
Notes:
1. Total borrowings are net of borrowings backed by fixed deposits with banks.
2. The Company has sub-divided each equity share of ` 10/- into five equity shares of ` 2/- each during the year 2007-08.Therefore, the key indicators as mentioned above for the year 2007-08 are not comparable with those of earlier years.
3. Book value, earning and turnover per share has been computed on weighted average number of equity shares outstanding atthe end of the year.
4. The Company has adopted Ind As from April 1, 2016. Accordingly, all previous year figures are as per then applicable IndianGAAP, hence not comparable.
5. Previous year’s figures have been regrouped, whenever necessary.
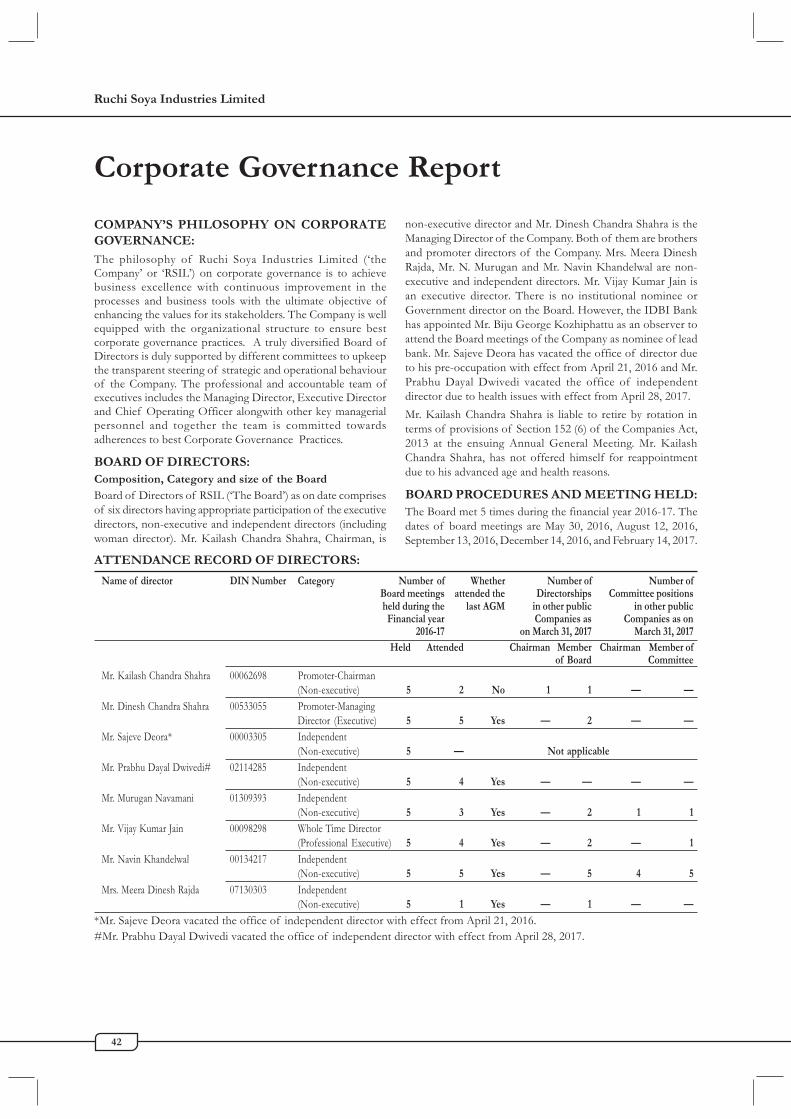
Ruchi Soya Industries Limited
42
COMPANY’S PHILOSOPHY ON CORPORATEGOVERNANCE:
The philosophy of Ruchi Soya Industries Limited (‘theCompany’ or ‘RSIL’) on corporate governance is to achievebusiness excellence with continuous improvement in theprocesses and business tools with the ultimate objective ofenhancing the values for its stakeholders. The Company is wellequipped with the organizational structure to ensure bestcorporate governance practices. A truly diversified Board ofDirectors is duly supported by different committees to upkeepthe transparent steering of strategic and operational behaviourof the Company. The professional and accountable team ofexecutives includes the Managing Director, Executive Directorand Chief Operating Officer alongwith other key managerialpersonnel and together the team is committed towardsadherences to best Corporate Governance Practices.
BOARD OF DIRECTORS:Composition, Category and size of the BoardBoard of Directors of RSIL (‘The Board’) as on date comprisesof six directors having appropriate participation of the executivedirectors, non-executive and independent directors (includingwoman director). Mr. Kailash Chandra Shahra, Chairman, is
Corporate Governance Report
non-executive director and Mr. Dinesh Chandra Shahra is theManaging Director of the Company. Both of them are brothersand promoter directors of the Company. Mrs. Meera DineshRajda, Mr. N. Murugan and Mr. Navin Khandelwal are non-executive and independent directors. Mr. Vijay Kumar Jain isan executive director. There is no institutional nominee orGovernment director on the Board. However, the IDBI Bankhas appointed Mr. Biju George Kozhiphattu as an observer toattend the Board meetings of the Company as nominee of leadbank. Mr. Sajeve Deora has vacated the office of director dueto his pre-occupation with effect from April 21, 2016 and Mr.Prabhu Dayal Dwivedi vacated the office of independentdirector due to health issues with effect from April 28, 2017.Mr. Kailash Chandra Shahra is liable to retire by rotation interms of provisions of Section 152 (6) of the Companies Act,2013 at the ensuing Annual General Meeting. Mr. KailashChandra Shahra, has not offered himself for reappointmentdue to his advanced age and health reasons.
BOARD PROCEDURES AND MEETING HELD:The Board met 5 times during the financial year 2016-17. Thedates of board meetings are May 30, 2016, August 12, 2016,September 13, 2016, December 14, 2016, and February 14, 2017.
ATTENDANCE RECORD OF DIRECTORS:
Name of director DIN Number Category Number of Whether Number of Number ofBoard meetings attended the Directorships Committee positionsheld during the last AGM in other public in other public
Financial year Companies as Companies as on2016-17 on March 31, 2017 March 31, 2017
Held Attended Chairman Member Chairman Member ofof Board Committee
Mr. Kailash Chandra Shahra 00062698 Promoter-Chairman(Non-executive) 5 2 No 1 1 — —
Mr. Dinesh Chandra Shahra 00533055 Promoter-ManagingDirector (Executive) 5 5 Yes — 2 — —
Mr. Sajeve Deora* 00003305 Independent(Non-executive) 5 — Not applicable
Mr. Prabhu Dayal Dwivedi# 02114285 Independent(Non-executive) 5 4 Yes — — — —
Mr. Murugan Navamani 01309393 Independent(Non-executive) 5 3 Yes — 2 1 1
Mr. Vijay Kumar Jain 00098298 Whole Time Director(Professional Executive) 5 4 Yes — 2 — 1
Mr. Navin Khandelwal 00134217 Independent(Non-executive) 5 5 Yes — 5 4 5
Mrs. Meera Dinesh Rajda 07130303 Independent(Non-executive) 5 1 Yes — 1 — —
*Mr. Sajeve Deora vacated the office of independent director with effect from April 21, 2016.#Mr. Prabhu Dayal Dwivedi vacated the office of independent director with effect from April 28, 2017.
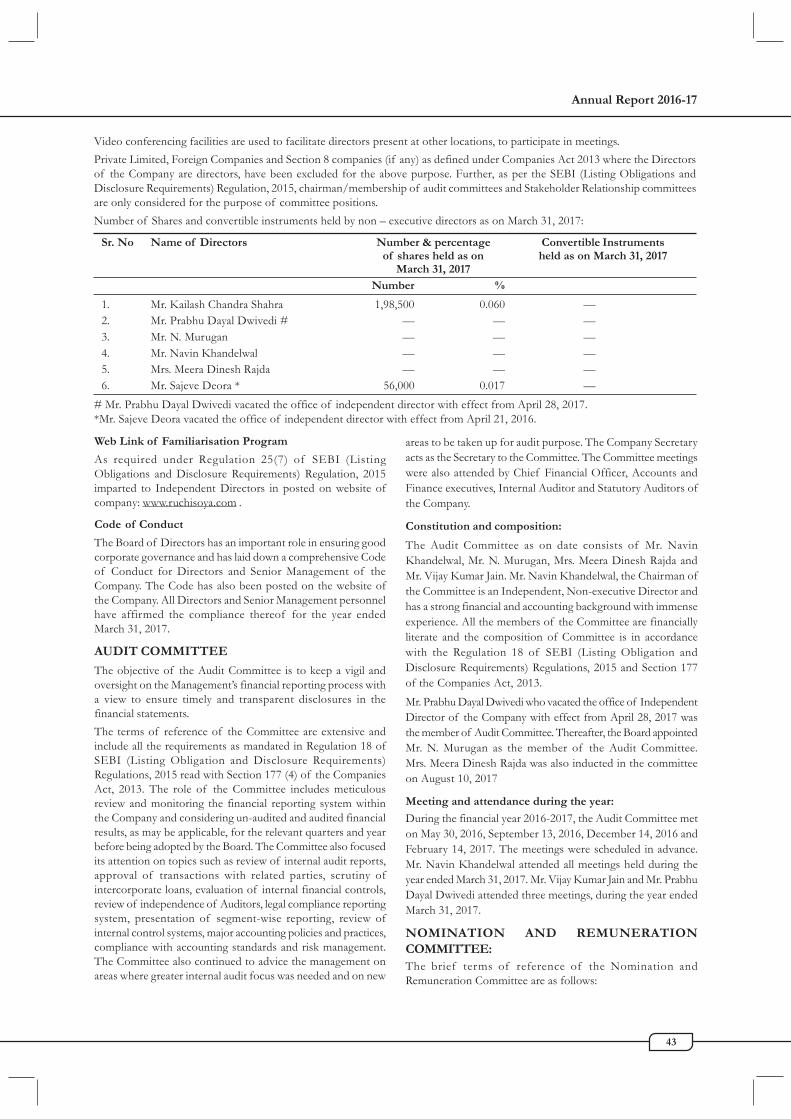
Annual Report 2016-17
43
areas to be taken up for audit purpose. The Company Secretaryacts as the Secretary to the Committee. The Committee meetingswere also attended by Chief Financial Officer, Accounts andFinance executives, Internal Auditor and Statutory Auditors ofthe Company.
Constitution and composition:
The Audit Committee as on date consists of Mr. NavinKhandelwal, Mr. N. Murugan, Mrs. Meera Dinesh Rajda andMr. Vijay Kumar Jain. Mr. Navin Khandelwal, the Chairman ofthe Committee is an Independent, Non-executive Director andhas a strong financial and accounting background with immenseexperience. All the members of the Committee are financiallyliterate and the composition of Committee is in accordancewith the Regulation 18 of SEBI (Listing Obligation andDisclosure Requirements) Regulations, 2015 and Section 177of the Companies Act, 2013.Mr. Prabhu Dayal Dwivedi who vacated the office of IndependentDirector of the Company with effect from April 28, 2017 wasthe member of Audit Committee. Thereafter, the Board appointedMr. N. Murugan as the member of the Audit Committee.Mrs. Meera Dinesh Rajda was also inducted in the committeeon August 10, 2017
Meeting and attendance during the year:
During the financial year 2016-2017, the Audit Committee meton May 30, 2016, September 13, 2016, December 14, 2016 andFebruary 14, 2017. The meetings were scheduled in advance.Mr. Navin Khandelwal attended all meetings held during theyear ended March 31, 2017. Mr. Vijay Kumar Jain and Mr. PrabhuDayal Dwivedi attended three meetings, during the year endedMarch 31, 2017.
NOMINATION AND REMUNERATIONCOMMITTEE:The brief terms of reference of the Nomination andRemuneration Committee are as follows:
Web Link of Familiarisation Program
As required under Regulation 25(7) of SEBI (ListingObligations and Disclosure Requirements) Regulation, 2015imparted to Independent Directors in posted on website ofcompany: www.ruchisoya.com .
Code of Conduct
The Board of Directors has an important role in ensuring goodcorporate governance and has laid down a comprehensive Codeof Conduct for Directors and Senior Management of theCompany. The Code has also been posted on the website ofthe Company. All Directors and Senior Management personnelhave affirmed the compliance thereof for the year endedMarch 31, 2017.
AUDIT COMMITTEE
The objective of the Audit Committee is to keep a vigil andoversight on the Management’s financial reporting process witha view to ensure timely and transparent disclosures in thefinancial statements.The terms of reference of the Committee are extensive andinclude all the requirements as mandated in Regulation 18 ofSEBI (Listing Obligation and Disclosure Requirements)Regulations, 2015 read with Section 177 (4) of the CompaniesAct, 2013. The role of the Committee includes meticulousreview and monitoring the financial reporting system withinthe Company and considering un-audited and audited financialresults, as may be applicable, for the relevant quarters and yearbefore being adopted by the Board. The Committee also focusedits attention on topics such as review of internal audit reports,approval of transactions with related parties, scrutiny ofintercorporate loans, evaluation of internal financial controls,review of independence of Auditors, legal compliance reportingsystem, presentation of segment-wise reporting, review ofinternal control systems, major accounting policies and practices,compliance with accounting standards and risk management.The Committee also continued to advice the management onareas where greater internal audit focus was needed and on new
Video conferencing facilities are used to facilitate directors present at other locations, to participate in meetings.Private Limited, Foreign Companies and Section 8 companies (if any) as defined under Companies Act 2013 where the Directorsof the Company are directors, have been excluded for the above purpose. Further, as per the SEBI (Listing Obligations andDisclosure Requirements) Regulation, 2015, chairman/membership of audit committees and Stakeholder Relationship committeesare only considered for the purpose of committee positions.Number of Shares and convertible instruments held by non – executive directors as on March 31, 2017:
Sr. No Name of Directors Number & percentage Convertible Instrumentsof shares held as on held as on March 31, 2017
March 31, 2017
Number %
1. Mr. Kailash Chandra Shahra 1,98,500 0.060 —2. Mr. Prabhu Dayal Dwivedi # — — —3. Mr. N. Murugan — — —4. Mr. Navin Khandelwal — — —5. Mrs. Meera Dinesh Rajda — — —6. Mr. Sajeve Deora * 56,000 0.017 —
# Mr. Prabhu Dayal Dwivedi vacated the office of independent director with effect from April 28, 2017.*Mr. Sajeve Deora vacated the office of independent director with effect from April 21, 2016.

Ruchi Soya Industries Limited
44
1. Formulation of the criteria for determining qualifications,positive attributes and independence of a director andrecommend to the Board of Directors a policy relatingto, the remuneration of the directors, key managerialpersonnel and other employees;
2. Formulation of criteria for evaluation of IndependentDirectors and the Board of Directors;
3. Devising a policy on diversity of Board of Directors;4. Identifying persons who are qualified to become directors
and who may-be appointed in senior management inaccordance with the criteria laid down and recommended tothe Board of Directors for their appointment and removal.
5. Whether to extend or continue the terms of appointmentof the Independent Directors, on the basis of the reportof performance evaluation of Independent Director.
Constitution and composition:
The Nomination and Remuneration Committee is chairedby Mr. N. Murugan and its other members areMrs. Meera Dinesh Rajda and Mr. Navin Khandelwal. TheChairman of the Committee is an Independent and non-executive director. The composition of committee is incompliance with Regulation 19 of SEBI (Listing Obligationand Disclosure Requirements) Regulations, 2015 and Section178 of the Companies Act, 2013. Mr. Prabhu Dayal Dwivedi,who was member of the Committee, has vacated the office ofDirector of the Company with effect from April 28, 2017.Thereafter, the Board appointed Mrs. Meera Dinesh Rajda asthe member of the Nomination and Remuneration Committee.
Meeting and attendance during the year
During the financial year 2016-17 the Nomination andRemuneration Committee met on May 30, 2016, August 12, 2016and September 13, 2016. Mr. Prabhu Dayal Dwivedi attended allthe meetings and Mr. Navin Khandelwal and Mr. N. Muruganattended two meetings held during the year ended March 31, 2017.
Performance Evaluation criteria for Independent Directors:
As per the Nomination, Remuneration and Evaluation Policyof the Company, the evaluation/assessment of the Directors,KMPs and the senior officials of the Company is to beconducted on an annual basis and to satisfy the requirementsof the SEBI (Listing Obligation and Disclosure Requirements)Regulations, 2015 and Companies Act, 2013.The following criteria assists in determining how effective theperformance of the Directors/KMPs/Senior officials have been:• Leadership & stewardship abilities• Contributing to clearly define corporate objectives & plans• Communication of expectations & concerns clearly with
subordinates• Obtain adequate, relevant & timely information from
external sources.• Review & approval of achievement of strategic and
operational plans, objectives, budgets• Regular monitoring of corporate results against projections• Identify, monitor & mitigate significant corporate risks
• Assess policies, structures & procedures• Direct, monitor & evaluate KMPs, senior officials• Review management’s succession plan• Effective meetings• Assuring appropriate board size, composition,
independence, structure• Clearly defining roles & monitoring activities of committees• Review of corporation’s ethical conductEvaluation on the aforesaid parameters will be conducted bythe Independent Directors for each of the Executive/Non-Independent Directors in a separate meeting of the IndependentDirectors.The Executive Director/Non-Independent Directors along withthe Independent Directors will evaluate/assess each of theIndependent Directors on the aforesaid parameters. Only theIndependent Director being evaluated will not participate inthe said evaluation discussion.The Nomination and Remuneration Committee shall carry outevaluation of the performance of Directors of the Companyat regular interval.Performance evaluation criteria for independent Directors isincluded in Nomination, Remuneration and Evaluation Policyfor the Directors, Key Managerial Personnel and other employeesof the Company. The same is available on the website of theCompany at www.ruchisoya.com.
REMUNERATION OF DIRECTORS:(a) Remuneration of the Managing Director:
The particulars of remuneration paid to Mr. DineshShahra, Managing Director during the financial year 2016-17 is as under:(i) Salary : `124.28 lakh(ii) Perquisites in cash or kind : ` 19.51 lakh(iii) Contribution to Provident and other fund : ` 14.92 lakh
(b) Remuneration of the Whole-time Directors(Professional Executive):
During the financial year 2016-17, the followingremuneration (Salary, allowances, perquisites andcontribution to Provident and other fund) was paid tothe whole-time director:
Mr. Vijay Kumar Jain : ` 44.85 lakh
Notes:
1. The above does not include reimbursement ofexpenses incurred for the Company.
2. The above remuneration does not includecontribution to gratuity and provision for leaveencashment, as these are lump sum amounts for allemployees based on actuarial valuation.
(c) Remuneration of Non-Executive Directors:
Except the payment of sitting fees, no other remuneration,commission, etc. is paid / payable for the year to the non-executive directors. As approved by the Board of Directorsand in accordance with the Articles of Association of theCompany, the non-executive directors are paid ` 10,000/-

Annual Report 2016-17
45
for each Board meeting and ̀ 5,000/- for each committeemeeting attended by the non-executive directors.
The following table shows the amount of sitting fees paid tothe non-executive directors for the financial year 2016-17:
Sr. Name of Directors Sitting feesNo. (Amount in `)
1 Mr. Kailash Chandra Shahra 25,0002 Mr. Prabhu Dayal Dwivedi * 1,10,0003 Mr. N. Murugan 40,0004 Mr. Navin Khandelwal 80,0005 Mrs. Meera Dinesh Rajda 10,000* Mr. Prabhu Dayal Dwivedi vacated office of independentdirector with effect from April 28, 2017.
STAKEHOLDERS’ RELATIONSHIPCOMMITTEE:
The Committee considers and resolves the grievances of theshareholders of the Company, including complaints related totransfer of shares, non – receipt of annual report and non-receipt of declared dividends, etc.
Constitution and composition:
Stakeholders Relationship Committee of the Board comprisesof Mr. Vijay Kumar Jain, Executive Director andMr. N. Murugan, Independent Director (Chairman). Thecomposition of committee is in compliance with Regulation 20of SEBI (Listing Obligation and Disclosure Requirements)Regulations, 2015. Mr. R. L. Gupta V.P (Corporate Planning) &Company Secretary is the Compliance Officer of the Company.Mr. Prabhu Dayal Dwivedi who vacated the office ofIndependent Director with effect from April 28, 2017 was thechairman of Stakeholders' Relationship Committee. Thereafterthe Board appointed Mr. N. Murugan as the Chairman of theCommittee.
Meeting and attendance:
During the financial year 2016-17, the Stakeholders’ RelationshipCommittee met on April 14, 2016, August 10, 2016, November25, 2016 and February 27, 2017. Mr. Vijay Kumar Jain attendedall the meetings and Mr. Prabhu Dayal Dwivedi attended threemeetings held during the year ended March 31, 2017.
DETAIL OF COMPLAINTS RECEIVED ANDRESOLVED DURING THE YEAR:
Sr. Particulars No. ofNo. Complaints
1. Complaints received 162. Complaints solved 163. Complaints pending —
INFORMATION ON GENERAL BODYMEETINGS
Annual General Meetings:
The last three Annual General Meetings (AGMs) of theCompany were held at Sunville Deluxe Pavilion, Sunville
Building, 9, Dr. Annie Besant Road, Worli, Mumbai-400 018.The date and time of holding of the said AGMs and particularsof special resolutions passed thereat are as under:
28th AGM held on September 26, 2014 at 11.45 A. M.
Alteration in the Articles of Association.Further issue of securities.Approval of borrowing powers under section 180(1)(c)of the Companies Act, 2013.
29th AGM held on September 23, 2015 at 11.45 A. M.
Approval for Remuneration paid to Mr. Dinesh Shahra(Managing Director)Further issue of securities.Approval for remuneration paid to Mr. Sarvesh Shahra
30th AGM held on September 14, 2016 at 10.45 A.M
Approval for Re-appointment of Mr. Vijay Kumar Jain asWhole Time Director.Approval for excess remuneration paid/payable toMr. Dinesh Chandra Shahra, Managing Director.Approval for revision for remuneration payable toMr. Dinesh Chandra Shahra, Managing Director.
Extra-ordinary General Meeting:
No extra-ordinary general meeting of the members of theCompany was convened after the 30th Annual General Meetingof the Company held on September 14, 2016.Postal Ballot:
No postal ballot was conducted during the year under review.At present, there is no proposal for passing any SpecialResolution through Postal Ballot.
SHAREHOLDERS’ COMMUNICATION:
Quarterly un-audited financial statements prepared in accordancewith the Accounting Standards notified under Rule 7 of theCompanies (Accounts) Rules, 2014 in respect of Section 133 ofthe Companies Act, 2013 and other recognized accountingpractices and policies, are generally published in Free PressJournal and Nav Shakti. Beside this, the Company has its ownwebsite (www.ruchisoya.com) on which important public domaininformation is posted. Besides being placed on the website, allthe financial, vital and price sensitive official news releases arealso properly communicated to the concerned stock exchanges.The website also contains information on several other matters,such as corporate presentation to investors and analysts,Net worth history, Turnover and Net profit for precedingyears etc.
GENERAL SHAREHOLDERS’ INFORMATION
Annual General Meeting:
Day and Date : Wednesday, the September 27, 2017Time : 11.30 AMVenue : Rangswar Hall, Chavan Centre, Yashwantrao
Chavan Pratishthan, Gen. JagannathraoBhonsle Marg, Mumbai - 400021

Ruchi Soya Industries Limited
46
Cut off date for the purpose of voting by electronic means:September 15, 2017
The Financial year of the company under review is from April1, 2016 to March 31, 2017. No dividend has been proposed forthe Financial year under review.
Listing on Stock Exchanges and Stock Codes:
The Equity Shares of the Company are listed on the followingStock Exchanges:
Stock code
a) BSE Ltd. (BSE) 500368b) National Stock Exchange of
India Limited (NSE) RUCHISOYA
The ISIN of the Company is INE619A01027.Registrars and Share Transfer Agent:
Sarthak Global Limited, 170/10, Film Colony, R. N. T. Marg,Indore-452 001.
Share Transfer System:
Shares lodged in physical form with the Company/its Registrars & Share Transfer Agent are processed and generally returned,duly transferred within 15 days, except in cases where litigation is involved. In respect of shares held in dematerialized mode, thetransfer takes place instantaneously between the transferor and transferee at the depository participant(s) through which electronicdebit/ credit of the accounts are involved.Shareholding Pattern and Distribution of Shareholding as at March 31, 2017
a) Shareholding Pattern:
Category No. of shares held* % of holdingPromoter holding1 Promoters Indian Promoters 19,13,77,142 57.28 Foreign Promoters — —2 Persons acting in concert — — Sub-total 19,13,77,142 57.28Non-Promoters Holding 1 Institutions a) MFs/ UTI 31,500 0.01 b) Banks/ FIs/Insurance Companies 4,34,492 0.13 (Central/State Govt. Institutions/Non-Govt. c) FIIs 15,13,686 0.45 Sub-total 19,79,678 0.59
The Company has duly paid the annual listing fee for the Financial Year 2016-17 and 2017-18 to the BSE Limited andNational Stock Exchange of India Limited.
MARKET PRICE DATA:
The monthly high and low quotations at the BSEduring the financial year 2016-17 are as follows:
Period High (`̀̀̀̀) Low (`̀̀̀̀)
April, 2016 32.80 28.05May, 2016 28.80 17.75June, 2016 23.90 19.05July, 2016 24.80 21.20August, 2016 24.20 19.40September, 2016 22.70 19.00October, 2016 24.70 21.10November, 2016 24.15 18.60December, 2016 20.85 18.50January, 2017 29.20 18.80February, 2017 31.80 22.75March, 2017 31.00 26.40
COMPARISON OF STOCK PERFORMANCE OF RSILWITH BSE SENSEX
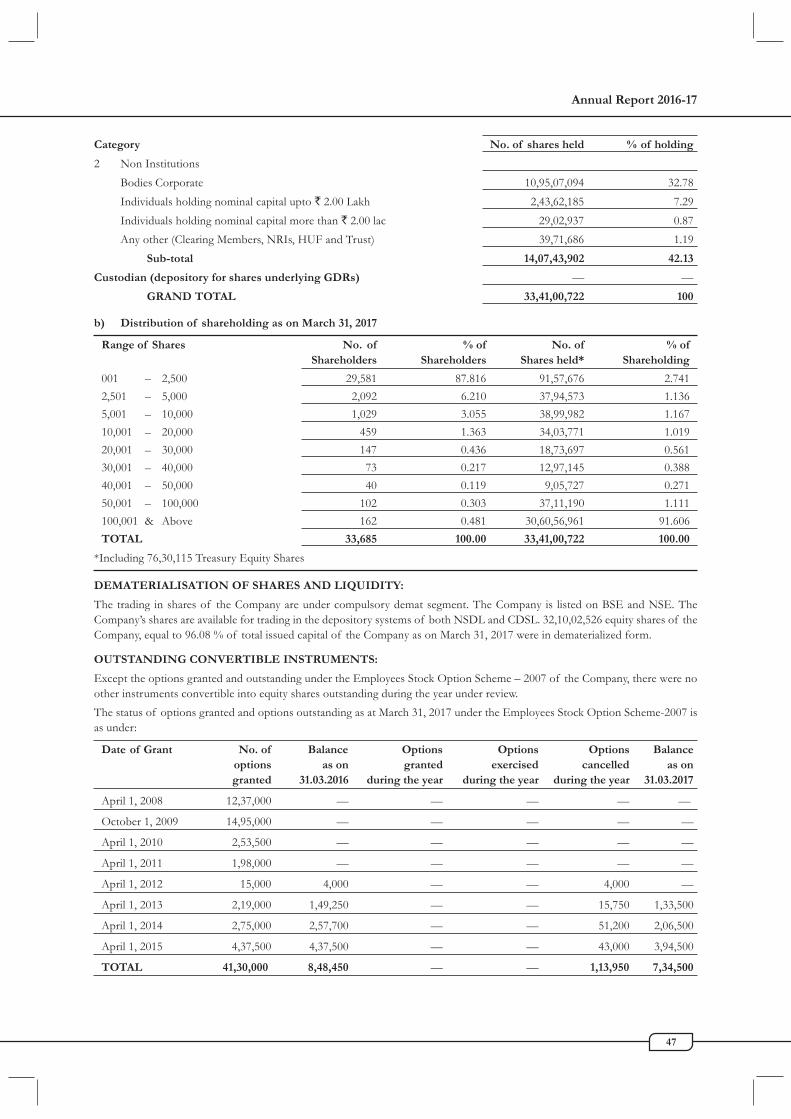
Annual Report 2016-17
47
2 Non Institutions Bodies Corporate 10,95,07,094 32.78 Individuals holding nominal capital upto ` 2.00 Lakh 2,43,62,185 7.29 Individuals holding nominal capital more than ` 2.00 lac 29,02,937 0.87 Any other (Clearing Members, NRIs, HUF and Trust) 39,71,686 1.19 Sub-total 14,07,43,902 42.13
Custodian (depository for shares underlying GDRs) — — GRAND TOTAL 33,41,00,722 100
b) Distribution of shareholding as on March 31, 2017
Range of Shares No. of % of No. of % ofShareholders Shareholders Shares held* Shareholding
001 – 2,500 29,581 87.816 91,57,676 2.7412,501 – 5,000 2,092 6.210 37,94,573 1.1365,001 – 10,000 1,029 3.055 38,99,982 1.16710,001 – 20,000 459 1.363 34,03,771 1.01920,001 – 30,000 147 0.436 18,73,697 0.56130,001 – 40,000 73 0.217 12,97,145 0.38840,001 – 50,000 40 0.119 9,05,727 0.27150,001 – 100,000 102 0.303 37,11,190 1.111100,001 & Above 162 0.481 30,60,56,961 91.606TOTAL 33,685 100.00 33,41,00,722 100.00
*Including 76,30,115 Treasury Equity Shares
DEMATERIALISATION OF SHARES AND LIQUIDITY:
The trading in shares of the Company are under compulsory demat segment. The Company is listed on BSE and NSE. TheCompany’s shares are available for trading in the depository systems of both NSDL and CDSL. 32,10,02,526 equity shares of theCompany, equal to 96.08 % of total issued capital of the Company as on March 31, 2017 were in dematerialized form.
OUTSTANDING CONVERTIBLE INSTRUMENTS:
Except the options granted and outstanding under the Employees Stock Option Scheme – 2007 of the Company, there were noother instruments convertible into equity shares outstanding during the year under review.The status of options granted and options outstanding as at March 31, 2017 under the Employees Stock Option Scheme-2007 isas under:
Date of Grant No. of Balance Options Options Options Balanceoptions as on granted exercised cancelled as ongranted 31.03.2016 during the year during the year during the year 31.03.2017
April 1, 2008 12,37,000 — — — — —
October 1, 2009 14,95,000 — — — — —
April 1, 2010 2,53,500 — — — — —
April 1, 2011 1,98,000 — — — — —
April 1, 2012 15,000 4,000 — — 4,000 —
April 1, 2013 2,19,000 1,49,250 — — 15,750 1,33,500
April 1, 2014 2,75,000 2,57,700 — — 51,200 2,06,500
April 1, 2015 4,37,500 4,37,500 — — 43,000 3,94,500
TOTAL 41,30,000 8,48,450 — — 1,13,950 7,34,500
Category No. of shares held % of holding

Ruchi Soya Industries Limited
48
MANUFACTURING PLANT LOCATIONS OF THE
COMPANY:
• Mangliagaon, A.B. Road, Indore (M.P.)
• Baikampady Industrial Area, Mangalore (Karnataka)
• Vi l lage Esambe, Taluka Khalapur, Distt . Raigad(Maharashtra)
• Bijoyramchak, Ward No. 9, P.O. Durgachak, Haldia (WestBengal)
• Village Butibori, Tehsil Nagpur (Maharashtra)
• Village Kamati, Gadarwada, Distt. Narsinghpur (M.P.)
• Gram Mithi Rohar, Taluka Gandhidham, Distt. Bhuj(Gujarat)
• Kannigaiper Village, Uthukottai Taluk, Thiruvallur Distt.(Tamilnadu)
• RIICO Udyog Vihar, Sriganganagar (Rajasthan)
• RIICO Industrial Area, Govindpur Bawari, Post TaleraDistt. Bundi (Rajasthan)
• Kusmoda, A.B. Road, Guna (M.P.)
• Kota Road, Baran (Rajasthan)
• SIDCO Industrial Estate, Bari Brahmana, Jammu(J & K)
• Village Daloda, Dist. Mandsaur (M.P.)
• Survey No. 178, Surkandi Road, Washim (Maharashtra)
• Bapulapadu Mandal, Ampapuram Village, KrishnaDistrict, Vijaywada (A.P.)
• IDA, ADB Road, Peddapuram, East Godawari District(A.P.).
• Village Karanpura, Durgawati, Dist. Kaimur (Bihar)
• Sur vey No. 162 & 163, Bhuvad, Taluka- Anjar,Dist- Kutch, (Gujrat)
• Beach Road, Dummalpet, Kakinada (Andhra Pradesh)
ADDRESS FOR CORRESPONDENCE:
The shareholders may send their communications, queries,suggestions and grievances to the Compliance Officer at thefollowing address:
Mr. R.L. GuptaCompany SecretaryRuchi House, Royal Palms, Survey No. 169,Aarey Milk Colony, Near Mayur Nagar,Goregaon (East), Mumbai - 400065Email address: [email protected]
The shareholders may also e-mail their queries, suggestionsand grievances at [email protected] .
OTHER DISCLOSURES:
(a) Transactions with related parties:
The Company has not entered into any transaction ofmaterial nature with related parties that may have anypotential conflict with the interest of the Company. The“Policy on materiality of related party transactions anddealing with related party transaction” as approved bythe Board may be accessed on the Company’s websiteat www.ruchisoya.com
(b) Compliance by the Company:
The Company has complied with the requirement ofstock exchanges, SEBI and other statutory authoritieson matters related to capital markets during last threeyears. No penalties have been imposed on the Companyor strictures passed by any Stock Exchange or SEBI orany other authorities relating to capital markets. TheCompany, as a legal entity has, however, been by an ex-parte ad-interim order dated 24th May, 2016 passed bySEBI, restrained from buying, selling or dealing in thesecurities market, either directly or indirectly, in anymanner whatsoever, till further directions, Later on, byan order dated 8th March, 2017, the SEBI hasconfirmed the above referred order with an interimrelief to the Company by permitting to trade or deal incommodity derivative markets for the limited purposeof hedging the physical market positions under thesupervision of the Exchanges. The Company is takingdue legal recourse against the same.
(c) Vigil Mechanism and Whistle Blower Policy:
The Company promotes ethical behavior and has inplace mechanism for reporting and redressal of illegaland unethical behavior. The Company has a vigilmechanism and Whist le Blower Policy for dueprotection of whistle blowers. It is hereby confirmedthat no personnel has been denied access to the AuditCommittee.
The Company has complied with mandatory and mostof the discretionary requirements as per Regulation 27of the SEBI (Listing Obligations and DisclosureRequirements) Regulations, 2015.
(d) Web link:
Policy for determination of material subsidiary isavai lable on website of the company:www.ruchisoya.com. The other disclosure in terms ofRegulation 46(2) are also made available in the saidwebsite link.
(e) Commodity Price risk, foreign exchange risk andhedging activities:
The Company has adopted Commodity Price Risk
Annual Report 2016-17
49
Management Policy and Foreign Exchange RiskManagement Policy. The compliance of the same ismonitored by the Risk Management Committee whichis reporting to the Board of Directors of the Company.
During the F.Y. 2016-17, the Company had managedthe foreign exchange risk and hedged to the extentconsidered necessary. The Company enters into forwardcontracts for hedging foreign exchange exposuresagainst exports and imports. The details of foreigncurrency exposure are disclosed in Note No. 46 to theAnnual Accounts.
(f) Demat suspense account
There are no unclaimed shares / securities of theCompany in terms of SEBI (Listing Obligations andDisclosure Requirements) Regulations, 2015.
(g) Disclosures on compliance with cor porategovernance
Pursuant to regulation 26(3) read with Para D ofSchedule V of the SEBI ((Listing Obligations and
Disclosure Requirements) Regulations, 2015 the BoardMembers and Senior Management personnel of theCompany have confirmed compliance to their Code ofConduct as applicable to them for the financial yearended March 31, 2017.
Disclosures on compliance with corporate governancerequirements specified in Regulations 17 to 27 havebeen included in the relevant sections of this report.Appropriate information has been placed on theCompany’s website pursuant to clauses (b) to (i) of sub-regulation (2) of Regulation 46 of the List ingRegulations.
For Ruchi Soya Industries Limited
Place: Mumbai Dinesh ShahraDate : August 19, 2017 Managing Director

Ruchi Soya Industries Limited
50
CEO / CFO CERTIFICATE{Issue in accordance with provisions of Regulation 17(8) of
SEBI (Listing Obligations & Disclosure Requirements) Regulations 2015}
To,The Board of DirectorsRuchi soya Industries Limited
1. We have reviewed financial statements and the cash flow statement of Ruchi soya Industries Limited for the year endedMarch 31, 2017 and to the best of our knowledge and belief:
i. these statements do not contain any materially untrue statement or omit any material fact or contain statements thatmight be misleading;
ii. these statements together present a true and fair view of the Company’s affairs and are in compliance with existingaccounting standards, applicable laws and regulations.
2. There are, to the best of our knowledge and belief, no transactions entered into by the Company during the year which arefraudulent, illegal or violative of the Company’s Code of Conduct.
3. We accept responsibility for establishing and maintaining internal controls for financial reporting and we have evaluated theeffectiveness of Company’s internal control systems pertaining to financial reporting. We have not come across any reportabledeficiencies in the design or operation of such internal controls.
4. We have indicated to the Auditors and the Audit Committee:
i. that there are no significant changes in internal control over financial reporting during the year;
ii. that there are changes in accounting policies during the year on account of Ind AS adoption and the same have beendisclosed in the notes to the financial statements; and
iii. that there are no instances of significant fraud of which we have become aware.
Yours Sincerely
Place : Mumbai Dinesh Shahra Anil SinghalDate : August 19, 2017 Managing Director Chief Financial Officer

Annual Report 2016-17
51
Independent Auditors’ Report
To the Members of RUCHI SOYA INDUSTRIES LIMITED
REPORT ON THE STANDALONE Ind AS FINANCIALSTATEMENTS
We have audited the accompanying Standalone Ind AS FinancialStatements of RUCHI SOYA INDUSTRIES LIMITED(“the Company”), which comprise the Balance Sheet as at March31, 2017, the Statement of Profit and Loss (including OtherComprehensive Income), the Cash Flow Statement, theStatement of Changes in Equity for the year then ended and asummary of the significant accounting policies and otherexplanatory informations, in which are incorporated the returnsof the Company’s branches at Peddapuram and Ampapuramfor the year ended on that date audited by the branch auditors(hereinafter referred to as “Standalone Ind AS FinancialStatements”)
MANAGEMENT’S RESPONSIBILITY FOR THESTANDALONE Ind AS FINANCIAL STATEMENTS
The Company’s Board of Directors is responsible for the mattersstated in Section 134(5) of the Companies Act, 2013 (“the Act”)with respect to the preparation of these Standalone Ind ASFinancial Statements that give a true and fair view of the financialposition, financial performance including other comprehensiveincome, cash flows and statement of changes in equity of theCompany in accordance with the accounting principles generallyaccepted in India, including the Indian Accounting Standards(Ind AS) specified under Section 133 of the Act, read withrelevant rules issued thereunder.This responsibility also includes maintenance of adequateaccounting records in accordance with the provisions of theAct for safeguarding the assets of the Company and forpreventing and detecting frauds and other irregularities; selectionand application of appropriate accounting policies; makingjudgments and estimates that are reasonable and prudent; anddesign, implementation and maintenance of adequate internalfinancial controls, that were operating effectively for ensuringthe accuracy and completeness of the accounting records,relevant to the preparation and presentation of the StandaloneInd AS Financial Statements that give a true and fair view andare free from material misstatement, whether due to fraud orerror.
AUDITOR’S RESPONSIBILITY
Our responsibility is to express an opinion on these StandaloneInd AS Financial Statements based on our audit.We have taken into account the provisions of the Act, theaccounting and auditing standards and matters which arerequired to be included in the audit report under the provisionsof the Act and the Rules made there under.We conducted our audit in accordance with the Standards onAuditing specified under Section 143(10) of the Act. Those
Standards require that we comply with ethical requirements andplan and perform the audit to obtain reasonable assurance aboutwhether the financial statements are free from materialmisstatement.An audit involves performing procedures to obtain auditevidence about the amounts and the disclosures in theStandalone Ind AS Financial Statements. The proceduresselected depend on the auditor’s judgment, including theassessment of the risks of material misstatement of theStandalone Ind AS Financial Statements, whether due to fraudor error. In making those risk assessments, the auditor considersinternal financial control relevant to the Company’s preparationof the Standalone Ind AS Financial Statements that give a trueand fair view in order to design audit procedures that areappropriate in the circumstances. An audit also includesevaluating the appropriateness of the accounting policies usedand the reasonableness of the accounting estimates made bythe Company’s Board of Directors, as well as evaluating theoverall presentation of the Standalone Ind AS FinancialStatements.We believe that the audit evidence we have obtained is sufficientand appropriate to provide a basis for our audit opinion on theStandalone Ind AS Financial Statements.
BASIS FOR QUALIFIED OPINION
Attention is drawn to Note 8c (a) and 17a (H) relating to thenon-receipt of confirmations in respect of bank balancesaggregating to debit balance of ̀ 1,221.23 lakh and credit balanceof ` 61,421.93 lakh. In the absence of confirmations, thevariation, if any, between the amounts of bank balances, interestand other costs recorded by the Company and the amounts asper the records of the banks cannot be ascertained.
QUALIFIED OPINION
Except as stated in the above paragraph on ‘Basis for QualifiedOpinion’, in our opinion and to the best of our informationand according to the explanations given to us, the aforesaidStandalone Ind AS Financial Statements give the informationrequired by the Act in the manner so required and give a trueand fair view in conformity with the accounting principlesgenerally accepted in India of the state of affairs of theCompany as at March 31, 2017, and its loss, total comprehensiveincome, its cash flows and Changes in Equity for the year endedon that date.
EMPHASIS OF MATTER
Without qualifying our opinion, attention is drawn to:-a. Note 36 relating to the preparation of the Standalone Ind
AS Financial Statements on a going concern basis. Thematters as set forth in Note 36 indicate the existence ofmaterial uncertainty about the Company’s ability tocontinue as a going concern. However, as mentioned in

Ruchi Soya Industries Limited
52
Note 36, in view of the various steps initiated by theCompany, future outlook as assessed by the managementand the business plans of the Company, the StandaloneInd AS Financial Statements have been prepared on agoing concern basis.
b. Note 12L (v) relating to the Scheme of Amalgamationand Arrangement between Mac Oil Palm Limited and theCompany and their respective shareholders sanctioned bythe Hon’ble High Court of Judicature at Mumbai in anearlier year, pursuant to which, an amount of` 19,264.77 lakh has been debited to BusinessDevelopment Reserve.Had the Scheme approved by the Hon’ble High Courtnot prescribed the accounting treatment, the accumulatedbalance in the General Reserve and Securities Premiumaccount as at March 31, 2017 would have been higher by` 5,193.54 lakh and ̀ 23,842.30 lakh respectively, loss forthe year would have been higher by ` 19,264.77 lakh, theaccumulated balance in Retained Earnings as at March31, 2017 would have been lower by ` 43,640.39 lakh, thebalance in Revaluation Reserve would have been higherby ` 14,665.23 lakh and the balance in BusinessDevelopment Reserve would have been ` Nil.However, the aggregate balance in Reserves and Surplusas at March 31, 2017 would have remained the same.Other Matters
We did not audit the financial statements of two branchesincluded in the Standalone Ind AS Financial Statementswhich reflect total net assets of ` 47,465.11 lakh as atMarch 31, 2017 and total revenues from operations of` 3,578.17 lakh for the year ended on that date and netcash outflows of ` 93.96 lakh. The financial statementsof these branches have been audited by the branch auditorswhose reports have been furnished to us and our opinionin so far as it relates to the amounts and disclosuresincluded in respect of these branches, is based solely onthe report of the branch auditors.Our opinion is not modified in respect of this matter.
REPORT ON OTHER LEGAL AND REGULATORYREQUIREMENTS
1. As required by the Companies (Auditor’s Report) Order,2016 (“the Order”) issued by the Central Government ofIndia in terms of section 143(11) of the Act, we give inthe ‘‘Annexure A’’ a statement on the matters specifiedin the paragraph 3 and 4 of the Order, to the extentapplicable.
2. As required by Section 143 (3) of the Act, we report that:a) We have sought and, except for the matters described
in the basis for Qualified Opinion paragraph above,have obtained all the information and explanations
which to the best of our knowledge and belief werenecessary for the purposes of our audit.
b) Except for the possible effects of the mattersdescribed in the Basis of Qualified Opinionparagraph above, in our opinion, proper books ofaccount as required by law have been kept by theCompany so far as it appears from our examinationof those books and proper returns adequate for thepurposes of our audit have been received from thebranches not visited by us.
c) The reports on the accounts of the branch officesof the Company audited under Section 143(8) ofthe Act by branch auditors have been sent to us andhave been properly dealt with by us in preparing thisreport.
d) The Balance Sheet, the Statement of Profit and Lossincluding Other Comprehensive income, the CashFlow Statement and the Statement of Changes inEquity dealt with by this Report are in agreementwith the relevant books of account and with thereturns received from the branches not visited byus.
e) Except for the possible effects of the matters asdescribed in the Basis of Qualified opinionparagraph, in our opinion, the aforesaid StandaloneInd AS Financial Statements comply with theAccounting Standards prescribed under Section 133of the Act read with relevant Rule issued thereunder.
f) The matters described in Basis of Qualified Opinionparagraph above, in our opinion, may have an adverseeffect on the functioning of the Company.
g) On the basis of the written representations receivedfrom the directors as on March 31, 2017 taken onrecord by the Board of Directors, none of thedirectors is disqualified as on March 31, 2017 frombeing appointed as a director in terms of Section164(2) of the Act.
h) With respect to the adequacy of the internal financialcontrol over financial reporting of the Company andthe operating effectiveness of such controls, referto our separate Report in “Annexure B”.
i) With respect to the other matters to be included inthe Auditor’s Report in accordance with Rule 11 ofthe Companies (Audit and Auditors) Rules, 2014 asamended, in our opinion and to the best of ourinformation and according to the explanations givento us:i. The Company has disclosed the impact of
pending litigations on its financial position inits Standalone Ind AS Financial Statements –
Annual Report 2016-17
53
Refer Note 34 relating to Contingent Liabilitiesand Commitments;
ii. The Company has made provision as requiredunder applicable law or accounting standard,for material foreseeable losses, if any, on longterm contracts including derivative contracts.
iii. There has been no delay in transferringamounts, required to be transferred, to theInvestor Education and Protection Fund bythe Company.
iv. The Company has provided requisitedisclosures in the Standalone Ind AS FinancialStatements as regards to its holdings anddealings in the Specified Bank Notes (asdefined in the Notification S.O. 3407(E) datedNovember 8, 2016 of the Ministry of Finance)during the period from November 8, 2016 to
December 30, 2016. Based on the auditprocedures performed and representations asprovided to us by the management, we reportthat the disclosures are in accordance with thebooks of accounts maintained by the Companyand as produced to us by the management. –Refer Note 8(c)(b).
For P. D. Kunte & Co. (Regd.)Chartered Accountants
Firm Regn. No. 105479W
D. P. SaprePlace : Mumbai PartnerDate : May 30, 2017 Membership No. 40740

Ruchi Soya Industries Limited
54
Annexure A to Independent Auditors’ ReportReferred to in paragraph 1 of the Report on Other Legal and Regulatory Requirements of even date to the members of RUCHISOYA INDUSTRIES LIMITED on the Standalone Ind AS Financial Statements for the year ended March 31, 2017.
Name of the Statute Nature of Dues Amount Period to which Forum where Disputed Dispute relates Dispute is Pending
(` in lakh)
The Central Sales Tax Act, Vat Tax/Sales Tax/Entry Tax/ 14,251.86 1999-00 to 2015-16 High Court1956, VAT Act and Sales Tax Demand and penalty, 8,965.60 1997-98 to 2013-14 TribunalLocal Sales Tax Acts as applicable. 4,657.28 2001-02 to 2013-14 Commissioner Appeals
16,545.85 1997-98 to 2014-15 DC Appeals / JointCommissioner (Appeals)
i. (a) The Company has maintained proper records showingfull particulars, including quantitative details andsituation of fixed assets.
(b) As explained to us, the fixed assets of the Companyhave been physically verified by the Managementduring / at the end of the year, which in our opinionis reasonable, having regard to the size of theCompany and the nature of its assets. No materialdiscrepancies between the book records and thephysical inventory have been noticed. In our opinion,the frequency of verification is reasonable.
(c) In our opinion and according to the information andexplanations given to us, except for the instances listedbelow, the title deeds of immovable properties asdisclosed in Note 3 of the Standalone Ind ASFinancial Statements are held in the name of theCompany:
(` in lakh)Particulars Leasehold Freehold Buildings Total
Land Land
Total Numberof Cases 1 3 — 4
Gross Block as onMarch 31, 2017 71.55 110.05 — 181.60
Net Block as onMarch 31, 2017 — 110.05 — 110.05
ii. The inventory (other than goods in transit and stocks withthird parties) has been physically verified by theManagement during / at the end of the year. In our opinion,the frequency of verification is reasonable. In respect ofinventory lying with third parties, these have substantiallybeen confirmed by them. As explained to us, there were nomaterial discrepancies noticed on physical verification ofinventory as compared to the book records.
iii. The Company has granted unsecured loan to one of theCompany covered in the register maintained under section189 of the Companies Act, 2013.
(a) In our opinion, the rate of interest charged in respectof the said loan is prima facie not prejudicial to theinterests of the Company. There are no other termsand conditions stipulated in the respect of the saidloan.
(b) In respect of the said loan, there is no stipulation asto the repayment of the principal amount andpayment of interest. Hence, we have not commentedon regularity of repayment of principal amounts andpayment of interest in respect of these loans.
(c) In view of our comments in sub-clause (b) above,clause (c) of paragraph 3 of the Order is notapplicable to the Company for the year under audit.
iv. In respect of loans, investments, guarantees and security,the Company has complied with the provisions of Section185 and 186 of the Companies Act, 2013.
v. The Company has not accepted deposits within the meaningof section 73 to 76 of the Companies Act, 2013 and therules framed there under. Hence, clause (v) of the Order isnot applicable to the Company for the year under audit.
vi. We have broadly reviewed the cost records made andmaintained by the Company pursuant to the Rulesprescribed by the Central Government under sub-section(1) of section 148 of the Companies Act, 2013. We have,however, not made a detailed examination of the recordswith a view to determine whether they are accurate orcomplete.
vii (a) According to the information and explanations givento us and the records of the Company examined byus, in our opinion, the Company is generally regularin depositing undisputed statutory dues includingprovident fund, employee’s state insurance, income-tax, sales-tax, service tax, duty of customs, duty ofexcise, value added tax, cess and any other statutorydues with the appropriate authorities.
(b) According to the information and explanations givento us, there are no dues of income tax, sales tax, wealthtax, service tax, duty of customs, duty of excise, valueadded tax or cess that have not been deposited onaccount of any dispute, except as follows:

Annual Report 2016-17
55
Name of the Statute Nature of Dues Amount Period to Which Forum Where DisputeDisputed Dispute relates is Pending
(` in lakh)
Annexure A to Independent Auditors’ Report(Contd..)
552.26 2005-06, 2007-08, Assessment2010-11 and 2013-14
334.49 2002 to 2006 Settlement CommissionThe Central Excise Excise Duty 439.90 2004-05, 2005-06 High CourtAct, 1944 5,358.39 2001-02 to 2014-15 Tribunal
170.78 2005-06 to 2014-15 Commissioner (Appeals)Service Tax under Service Tax 939.97 2002-03, 2008-09 TribunalFinance Act, 1994 to 2012-13
159.73 2006-07 to 2013-14, Commissioner2014-15 (Appeals)
The Customs Custom Duty 1,354.92 2001-02, 2002-03, Supreme CourtDuty Act, 1962 2003-04 & 2015-16
1,104.48 2001-02 to 2004-05 High Court2006-07, 2007-08and 2015-16
13,067.74 1998-99, 2003-04 Tribunal CESTATto 2006-07 and2012-13 to 2013-14
187.86 2003-04, 2005-06, Commissioner2006-07, 2013-14 (Appeals)
334.04 2001-02, 2004-05 AC Appeals /and 2009-10 DC Appeals
The Income Tax Act, 1961 Income Tax 22,613.03 2007-08 to 2013-14 Commissioner Appeals50.32 2007-08 DC Appeals / Joint
Commissioner (Appeals)18.04 2006-07 to 2014-15 Assessment
Other Acts Octroi/ Electricity Duty/ 12.25 2004-2005, 2003- 2013 Supreme CourtLocal Body Tax 238.49 2005-06, 2006-07, High Court
2010-11, 2012-13 to2014-15
16.54 2004-2006 TribunalTotal 91,373.82
viii. Except for instances of delay in repayment of principal amounts and payment of interest given below, the Company has notdefaulted in repayment of dues to banks which remained outstanding as on March 31, 2017.
i) In respect of Term loans from banks:
Particulars Bank Name Amount of continuing default Due date for paymentof Loans as on March 31, 2017 (` in lakh)
Principal InterestAmount
Term Loan State Bank of India (CTL IV) 3,000.00 171.51 December 31, 2016 and March 31, 2017Term Loan State Bank of India (CTL V) 3,000.00 364.32 December 31, 2016 and March 31, 2017Term Loan State Bank of India 353.66 27.10 March 31, 2017Term Loan DBS Bank Ltd. (ECB III) 7,780.63 740.67 September 6, 2016 and March 6, 2017Term Loan DBS Bank Ltd. (ECB II) 6,224.51 329.07 September 26, 2016 and March 27, 2017Term Loan Standard Chartered Bank 3,227.25 137.45 August 1, 2016, September 1, 2016 and
(ECB III) February 1, 2017Total 23,586.05 1,770.13

Ruchi Soya Industries Limited
56
Annexure A to Independent Auditors’ Report(Contd..)
ii) In respect of Short term loans from banks
Particulars Banks Name Amount of continuing Due date for Amount Date ofof Loans default as on March 31, 2017 payment paid payment
(`̀̀̀̀ in lakh)
of Principal of Interest (`̀̀̀̀ in lakh)Amount [Refer Note (a)
below]
Export Packing Various Banks May 19, 2016 to April 3, 2017 toCredit 59,073.01 1,813.19 February 28, 2017 1,361.26 April 20, 2017Inland Letter Various Banks October 25, 2016 to April 15, 2017of Credit 29,785.16 338.38 March 31, 2017 2,676.22 to April 21, 2017Foreign Bill Various Banks August 2, 2016 toDiscounting 4,591.66 100.38 September 19, 2016 - -Buyers Credit Various Banks 82,175.38 4,073.19 August 8, 2016 to 5,580.03 April 7, 2017 to
March 27, 2017 April 19, 2017Foreign Letter Various Banks May 10, 2016 to April 5, 2017 toof Credit 90,536.28 4,866.11 March 27, 2017 2,270.59 April 10, 2017Short Term Various Banks 15,687.84 1,169.98 May 7, 2016 to - -Loan August 24, 2016Total 2,81,849.32 12,361.24Note: a) Includes amount of ` 6,072.31 lakh debited by bank in fund based facility.The Company has not issued any debentures.
ix During the year, the Company has not raised any moneyby way of initial public offer, further public offer (includingdebts instruments) and term loans. Accordingly, theprovisions of clause (ix) of the Order are not applicable tothe Company for the year under audit.
x During the course of examination of the books and recordsof the Company, carried out in accordance with thegenerally accepted auditing practices in India and accordingto the information and explanations given to us, no materialfraud by the Company or on the Company by its officersor employees has been noticed or reported during the courseof our audit.
xi In our opinion, the managerial remuneration for the currentyear has been paid or provided in accordance with Section197 read with Schedule V of Companies Act, 2013.
xii In our opinion and according to the information andexplanations given to us, the Company is not a NidhiCompany. Accordingly, paragraph 3(xii) of the Order isnot applicable to the Company for the year under audit.
xiii According to the information and explanations given to usand based on our examination of records of the Company,transactions with the related parties are in compliance withsection 177 and section 188 of Companies Act, 2013 andthe details have been disclosed in the Financial Statementsas required by the applicable accounting standards.
xiv Based upon the audit procedures performed and theinformation and explanations given by the management,the Company has not made any preferential allotment orprivate placement of shares or fully or partly convertibledebentures during the year under audit. Accordingly, theprovisions of clause (xiv) of the Order are not applicableto the Company for the year under audit.
xv. Based upon the audit procedures performed and accordingto the information and explanations given by themanagement, the Company has not entered into any non-cash transactions with directors or persons connected withthem. Accordingly, the provisions of clause (xv) of theOrder are not applicable to the Company for the year underaudit.
xvi. In our opinion, the Company is not required to be registeredunder section 45-IA of the Reserve Bank of India Act,1934 and accordingly, the provisions of clause 3 (xvi) ofthe Order are not applicable to the Company for the yearunder audit.
For P. D. Kunte & Co. (Regd.)Chartered Accountants
Firm Regn. No. 105479W
D. P. SaprePlace: Mumbai PartnerDate: May 30, 2017 Membership. No. 40740
Annual Report 2016-17
57
We have audited the internal financial controls over financialreporting of Ruchi Soya Industries Limited (“the Company”)as of March 31, 2017 in conjunction with our audit of theStandalone Ind AS Financial Statements of the Company forthe year ended on that date.MANAGEMENT’S RESPONSIBILITY FORINTERNAL FINANCIAL CONTROLSThe Company’s management is responsible for establishing andmaintaining internal financial controls based on internal controlover financial reporting criteria established by the Companyconsidering the essential components of internal control statedin the Guidance Note on Audit of Internal Financial ControlsOver Financial Reporting issued by the Institute of CharteredAccountants of India (ICAI).These responsibilities include the design, implementation andmaintenance of adequate internal financial controls that wereoperating effectively for ensuring the orderly and efficient conductof its business, including adherence to Company’s policies, thesafeguarding of its assets, the prevention and detection of fraudsand errors, the accuracy and completeness of the accountingrecords and the timely preparation of reliable financial information,as required under the Companies Act, 2013.AUDITOR’S RESPONSIBILITYOur responsibility is to express an opinion on the Company’sinternal financial controls over financial reporting based onour audit. We conducted our audit in accordance with theGuidance Note on Audit of Internal Financial Controls OverFinancial Reporting (the “Guidance Note”) and the Standardson Auditing, issued by ICAI and deemed to be prescribedunder section 143(10) of the Companies Act, 2013, to theextent applicable to an audit of internal financial controls.Those Standards and the Guidance Note require that wecomply with ethical requirements and plan and perform theaudit to obtain reasonable assurance about whether adequateinternal financial controls over financial reporting wasestablished and maintained and if such controls operatedeffectively in all material respects.Our audit involves performing procedures to obtain auditevidence about the adequacy of the internal financial controlssystem over financial reporting and their operatingeffectiveness. Our audit of internal financial controls overfinancial reporting included obtaining an understanding ofinternal financial controls over financial reporting, assessingthe risk that a material weakness exists, and testing andevaluating the design and operating effectiveness of internalcontrol based on the assessed risk. The procedures selecteddepend on the auditor’s judgment, including the assessmentof the risks of material misstatement of the financialstatements, whether due to fraud or error.We believe that the audit evidence we have obtained is sufficientand appropriate to provide a basis for our audit opinion on theCompany’s internal financial controls system over financialreporting.
Annexure B to the Independent Auditors’ Reportof even date on the Standalone Ind AS Financial Statements of Ruchi Soya Industries LimitedReport on the Internal Financial Controls over Financial Reporting under Clause (i) of Sub-section 3 of Section 143 ofthe Companies Act, 2013 ("the Act")
MEANING OF INTERNAL FINANCIAL CONTROLSOVER FINANCIAL REPORTINGA Company’s internal financial control over financial reportingis a process designed to provide reasonable assurance regardingthe reliability of financial reporting and the preparation offinancial statements for external purposes in accordance withgenerally accepted accounting principles. A Company’s internalfinancial control over financial reporting includes those policiesand procedures that (1) pertain to the maintenance of recordsthat, in reasonable detail, accurately and fairly reflect thetransactions and dispositions of the assets of the company; (2)provide reasonable assurance that transactions are recorded asnecessary to permit preparation of financial statements inaccordance with generally accepted accounting principles, andthat receipts and expenditures of the company are being madeonly in accordance with authorisations of management anddirectors of the company; and (3) provide reasonable assuranceregarding prevention or timely detection of unauthorisedacquisition, use, or disposition of the company’s assets that couldhave a material effect on the financial statements.INHERENT LIMITATIONS OF INTERNALFINANCIAL CONTROLS OVER FINANCIALREPORTINGBecause of the inherent limitations of internal financial controlsover financial reporting, including the possibility of collusionor improper management override of controls, materialmisstatements due to error or fraud may occur and not bedetected. Also, projections of any evaluation of the internalfinancial controls over financial reporting to future periods aresubject to the risk that the internal financial control over financialreporting may become inadequate because of changes inconditions, or that the degree of compliance with the policiesor procedures may deteriorate.OPINIONAccording to the information and explanations given to us andbased on the audit of test of controls, except for strengtheningof documentation of policies regarding delegation of authority& access rights to financial records and process for archival ofrecords & periodic review, which we are informed is in processand expected to be in place by accounting year ending March 31,2018, in our opinion, the Company has, in all material respects,an adequate internal financial controls system over financialreporting and such internal financial controls over financialreporting were operating effectively as at March 31, 2017, basedon the internal control over financial reporting criteria establishedby the Company considering the essential components of internalcontrol stated in the Guidance Note on Audit of Internal FinancialControls Over Financial Reporting issued by the Institute ofChartered Accountants of India.
For P. D. Kunte & Co. (Regd.)Chartered Accountants
Firm Registration No. 105479W
D.P. SaprePlace : Mumbai PartnerDate : May 30, 2017 Membership No.40740

Ruchi Soya Industries Limited
58
Ruchi Soya Industries LimitedBalance Sheet
(` in lakh)
As at As at As atNotes March 31, 2017 March 31, 2016 April 1, 2015
I. ASSETS(1) Non-current assets
(a) Property, Plant and Equipment 3 3,98,014.84 4,11,909.77 4,17,106.60(b) Capital work-in-progress 3 2,916.26 4,202.04 10,016.74(c) Intangible assets 4 1,51,695.08 1,51,770.88 1,51,840.83(d) Financial Assets 5
(i) Investments 5(a) 8,778.25 14,480.83 14,568.32(ii) Loans 5(b) 6,559.01 7,333.39 5,671.77(iii) Others 5(c) 938.76 1,146.50 1,079.68
(e) Other non-current assets 6 11,492.59 10,583.82 7,359.43Total Non-current assets 5,80,394.79 6,01,427.24 6,07,643.36
(2) Current assets(a) Inventories 7 1,23,885.56 2,35,815.35 3,05,020.59(b) Financial Assets 8
(i) Investments 8(a) 108.59 89.81 91.20(ii) Trade receivables 8(b) 5,07,528.11 6,37,682.08 6,06,476.03(iii) Cash and cash equivalents 8(c) 8,156.33 6,964.92 5,740.03(iv) Bank balances other than (iii) above 8(d) 6,199.65 7,138.31 46,211.90(v) Loans 8(e) 1,119.09 9,800.41 8,256.31(vi) Others 8(f) 4,832.01 8,267.02 5,191.33
(c) Other Current Assets 9 93,001.04 1,38,029.44 1,27,298.77Assets Classified as held for Sale 10 367.56 - -Total Current assets 7,45,197.94 10,43,787.34 11,04,286.16
Total Assets 13,25,592.73 16,45,214.58 17,11,929.52II. EQUITY AND LIABILITIES
EQUITY(a) Equity share capital 11 6,529.41 6,529.41 6,528.61(b) Other Equity 12 95,841.21 2,40,811.20 3,52,236.90Total Equity 1,02,370.62 2,47,340.61 3,58,765.51LIABILITIES
(1) Non-Current Liabilities(a) Financial Liabilities 13
(i) Borrowings 13(a) 6,061.75 6,238.33 6,985.91(ii) Other financial liabilities 13(b) - 80.53 325.53
(b) Provisions 14 - 232.64 318.87(c) Deferred tax liabilities (Net) 15 44,535.95 81,531.00 1,01,358.48(d) Other non-current liabilities 16 799.32 9,925.69 19,137.24Total Non-Current Liabilities 51,397.02 98,008.19 1,28,126.03
(2) Current liabilities(a) Financial Liabilities 17
(i) Borrowings 17(a) 4,55,592.08 4,41,591.24 3,10,738.48(ii) Trade payables 17(b) 5,18,070.32 5,98,367.03 6,19,393.79(iii) Other financial liabilities 17(c) 1,83,059.47 1,67,933.11 1,59,936.79
(b) Other current liabilities 18 14,031.53 90,766.93 1,32,416.05(c) Provisions 19 849.63 1,207.47 1,002.89(d) Current tax liabilities (Net) 20 49.06 - 1,549.98Liabilities directly associated with assets classified as held for sale 21 173.00 - -Total Current liabilities 11,71,825.09 12,99,865.78 12,25,037.98
Total Equity and Liabilities 13,25,592.73 16,45,214.58 17,11,929.52
See accompanying Notes to the financial statements from 1 to 48
As per our report of even date attached For and on behalf of the Board of DirectorsFor and on behalf ofP. D. Kunte & Co. (Regd.) R. L. Gupta Dinesh ShahraChartered Accountants Company Secretary Managing Director
DIN:00533055D. P. Sapre Anil Singhal Vijay Kumar JainPartner Chief Financial Officer Executive DirectorMembership no. 40740 DIN:00098298Place: MumbaiDate: May 30, 2017
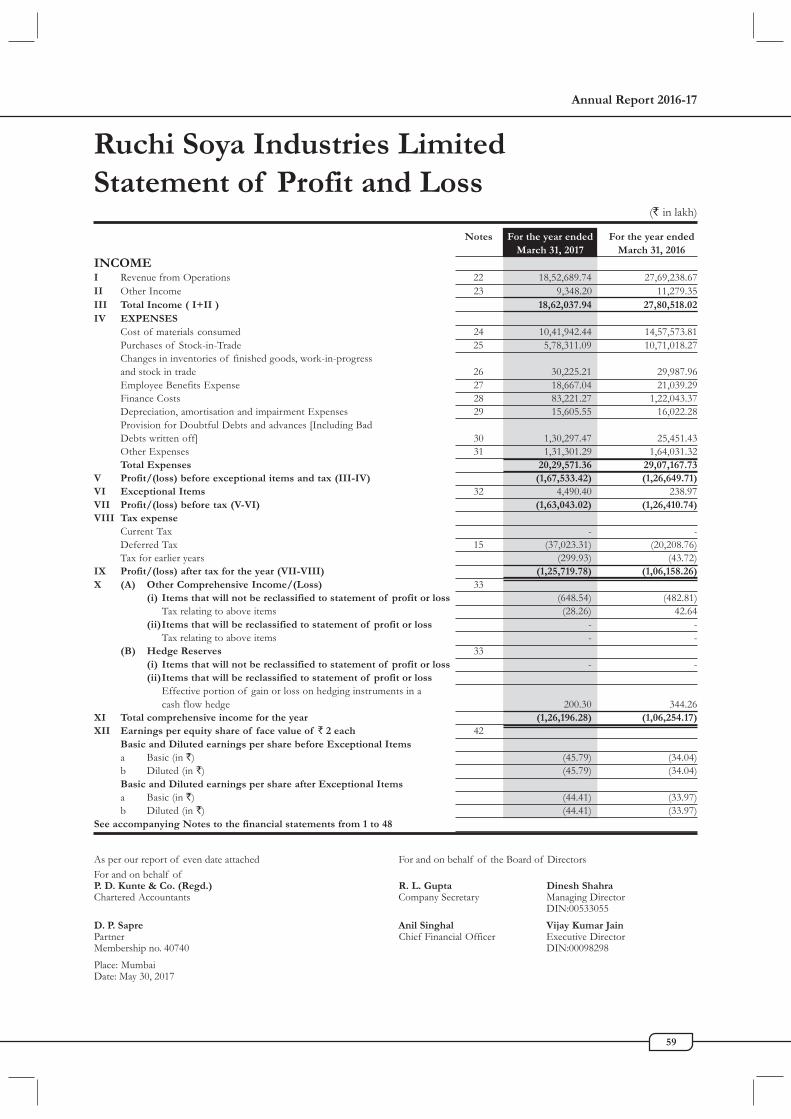
Annual Report 2016-17
59
Ruchi Soya Industries LimitedStatement of Profit and Loss
(` in lakh)
As per our report of even date attached For and on behalf of the Board of DirectorsFor and on behalf ofP. D. Kunte & Co. (Regd.) R. L. Gupta Dinesh ShahraChartered Accountants Company Secretary Managing Director
DIN:00533055D. P. Sapre Anil Singhal Vijay Kumar JainPartner Chief Financial Officer Executive DirectorMembership no. 40740 DIN:00098298Place: MumbaiDate: May 30, 2017
Notes For the year ended For the year endedMarch 31, 2017 March 31, 2016
INCOMEI Revenue from Operations 22 18,52,689.74 27,69,238.67II Other Income 23 9,348.20 11,279.35III Total Income ( I+II ) 18,62,037.94 27,80,518.02IV EXPENSES
Cost of materials consumed 24 10,41,942.44 14,57,573.81Purchases of Stock-in-Trade 25 5,78,311.09 10,71,018.27Changes in inventories of finished goods, work-in-progressand stock in trade 26 30,225.21 29,987.96Employee Benefits Expense 27 18,667.04 21,039.29Finance Costs 28 83,221.27 1,22,043.37Depreciation, amortisation and impairment Expenses 29 15,605.55 16,022.28Provision for Doubtful Debts and advances [Including BadDebts written off] 30 1,30,297.47 25,451.43Other Expenses 31 1,31,301.29 1,64,031.32Total Expenses 20,29,571.36 29,07,167.73
V Profit/(loss) before exceptional items and tax (III-IV) (1,67,533.42) (1,26,649.71)VI Exceptional Items 32 4,490.40 238.97VII Profit/(loss) before tax (V-VI) (1,63,043.02) (1,26,410.74)VIII Tax expense
Current Tax - -Deferred Tax 15 (37,023.31) (20,208.76)Tax for earlier years (299.93) (43.72)
IX Profit/(loss) after tax for the year (VII-VIII) (1,25,719.78) (1,06,158.26)X (A) Other Comprehensive Income/(Loss) 33
(i) Items that will not be reclassified to statement of profit or loss (648.54) (482.81)Tax relating to above items (28.26) 42.64
(ii)Items that will be reclassified to statement of profit or loss - -Tax relating to above items - -
(B) Hedge Reserves 33(i) Items that will not be reclassified to statement of profit or loss - -(ii)Items that will be reclassified to statement of profit or loss
Effective portion of gain or loss on hedging instruments in acash flow hedge 200.30 344.26
XI Total comprehensive income for the year (1,26,196.28) (1,06,254.17)XII Earnings per equity share of face value of ` 2 each 42
Basic and Diluted earnings per share before Exceptional Itemsa Basic (in `) (45.79) (34.04)b Diluted (in `) (45.79) (34.04)Basic and Diluted earnings per share after Exceptional Itemsa Basic (in `) (44.41) (33.97)b Diluted (in `) (44.41) (33.97)
See accompanying Notes to the financial statements from 1 to 48

Ruchi Soya Industries Limited
60
Ruchi Soya Industries Limited
Statement of Changes in Equity (SOCIE)
a.E
qu
ity
shar
e ca
pit
al(`
in L
akh)
Mar
ch 3
1, 2
017
Mar
ch 3
1, 2
016
No.
of
Shar
es A
mou
nt
No.
of
Shar
es A
mou
nt
Balan
ce a
t the
beg
inni
ng o
f th
e re
port
ing
perio
d 3
,341
.01
6,6
82.0
2 3
,340
.61
6,6
81.2
1Ch
ange
s in
Equ
ity sh
are
capi
tal d
urin
g th
e ye
ar–
Shar
es is
sued
und
er E
mpl
oyee
Sto
ck O
ptio
n du
ring
the
year
— —
0.4
0 0
.81
3,3
41.0
1 6
,682
.02
3,3
41.0
1 6
,682
.02
Less
: 76
,30,
115
Trea
sury
Equ
ity S
hare
s [Re
fer N
ote
11(i)
] 7
6.30
152
.60
76.
30 1
52.6
0Ba
lance
at t
he e
nd o
f th
e re
port
ing
perio
d 3
,264
.71
6,5
29.4
1 3
,264
.71
6,5
29.4
1
b.O
ther
Eq
uit
y(i
)A
s at
Mar
ch 3
1, 2
017
[Ref
er N
ote
12]
(` in
Lak
h) P
artic
ular
sRe
serv
es an
d Su
rplu
sTo
tal
Not
eSh
are
Cap
ital
Shar
eSe
curit
iesGe
nera
lBu
sines
sCa
pital
Effec
tive
Fore
ign
Equi
tyRe
taine
dRe
fere
nce
appl
icatio
nRe
dem
ptio
nO
ptio
nsPr
emiu
mRe
serv
ede
velop
men
tRe
serv
epo
rtion
ofCu
rrenc
yIn
strum
ents
Earn
ings
mon
eyRe
serv
eO
utsta
ndin
gRe
serv
ere
serv
eCa
sh F
lowM
oneta
ryth
rouh
pend
ing
Acco
unt
Hed
ges
Item
othe
r Com
-all
otm
ent
Tran
slatio
npr
ehen
sive
Diffe
renc
eIn
com
eAc
coun
t
Bala
nce a
t the
beg
inni
ng of
the r
epor
ting
perio
d-
8,770
.9898
.7645
,186.4
541
,775.9
819
,325.4
43,3
28.75
(200
.30)
(605
.38)
(8,43
9.77)
131,5
70.29
240,8
11.20
Chang
es in
accou
nting
policy
or pr
ior pe
riod e
rrors
--
Profi
t/( Lo
ss) fo
r the y
ear-
--
--
--
--
(125,7
19.78
)(12
5,719
.78)
Othe
r Com
prehen
sive I
ncome
for th
e year
( net
of ta
x)33
--
--
--
--
(730.1
9)53
.39(67
6.80)
Tot
al co
mpr
ehen
sive i
ncom
e for
the y
ear
--
--
--
--
-(7
30.19
)(12
5,666
.39)
(126,3
96.58
)
Trans
fer to
retain
earni
ngs
-
Defe
rred h
edging
gains
/ (los
ses) a
nd co
st of h
edging
transf
erred
to P&
L duri
ng Th
e year
3320
0.30
200.3
0
Trans
action
s with
the o
wners
in th
eir ca
pacity
as th
e own
ers-
- Emp
loyee
Stock
optio
n exp
enses
12 B
11.49
11.49
Othe
r chan
ges du
ring t
he yea
r-
--
--
- Curr
ent Ye
ar cha
rge to
Busin
ess de
velop
ment
Reser
ve12
E(19
,264.7
6)(19
,264.7
6)
- Char
ge du
ring t
he yea
r to Fo
reign
Curre
ncy M
oneta
ryIte
m Tra
nslatio
n Diffe
rence
Accou
nt12
H47
9.56
479.5
6
Bala
nce a
t the
end
of th
e rep
ortin
g pe
riod
-8,7
70.98
110.2
545
,186.4
541
,775.9
860
.683,3
28.75
0.00
(125.8
2)(9
,169.9
6)5,9
03.90
95,84
1.21

Annual Report 2016-17
61
Ruchi Soya Industries Limited
Statement of Changes in Equity (SOCIE)(Contd.)
(ii)
As
at M
arch
31,
201
6 [R
efer
Not
e 12
] (`
in L
akh)
Par
ticul
ars
Rese
rves
and
Surp
lus
Tota
lN
ote
Shar
e C
apita
lSh
are
Secu
rities
Gene
ral
Busin
ess
Capi
talEf
fectiv
eFo
reig
nEq
uity
Retai
ned
Refer
ence
appl
icatio
nRe
dem
ptio
nO
ptio
nsPr
emiu
mRe
serv
ede
velop
men
tRe
serv
epo
rtion
ofCu
rrenc
yIn
strum
ents
Earn
ings
mon
eyRe
serv
eO
utsta
ndin
gRe
serv
ere
serv
eCa
sh F
lowM
oneta
ryth
rouh
pend
ing
Acco
unt
Hed
ges
Item
othe
r Com
-all
otm
ent
Tran
slatio
npr
ehen
sive
Diffe
renc
eIn
com
eAc
coun
t
Balan
ce at
the b
egin
ning
of th
e rep
ortin
g pe
riod
-8,7
70.98
106.0
045
,152.9
641
,775.9
824
,051.0
33,3
28.75
(544
.56)
(776
.45)
(8,08
0.18)
238,4
52.39
352,2
36.90
Profit/
( Loss
) for th
e year
--
--
--
--
-(10
6,158
.26)
(106,1
58.26
) Tr
ansac
tion C
ost ar
ising o
n sha
re iss
ued d
uring
the y
ear12
C-
-0.1
00.1
0( N
et of
tax `
0.05 L
akh)
Other
Comp
rehens
ive In
come f
or the
year
(net o
f tax)
33-
--
--
--
-(35
9.59)
(80.58
)(44
0.17)
Tota
l com
preh
ensiv
e inc
ome f
or th
e yea
r-
--
--
--
--
(359
.59)
(106,2
38.74
)(10
6,598
.33)
Defer
red he
dging
gains
/ (los
ses) a
nd co
st of h
edging
transf
erred
to P&
L duri
ng Th
e year
3334
4.26
344.2
6Tr
ansa
ctio
ns w
ith th
e own
ers i
n th
eir ca
pacit
y as t
he ow
ners
-
- Issu
e of E
quity
Share
s12
C33
.59-
33.59
- Equ
ity D
ividend
s Paid
durin
g the
year (
Includ
ing D
DT)
pertain
g to F
inanci
al year
2014
-1512
J(64
3.36)
(643.3
6)- E
mploy
ee Sto
ck op
tion e
xpens
es12
B(7.
24)
(7.24
)O
ther
chan
ges d
urin
g th
e yea
r-
--
--
- Tran
sactio
n Cost
arisin
g on s
hare is
sue ( N
et of
tax `
0.05
Lakh
)12
C(0.
10)
(0.10
)- C
urrent
Year
charge
to Bu
siness
devel
opme
nt Re
serve
12 E
(4,72
5.59)
(4,72
5.59)
- Char
ge du
ring t
he yea
r to Fo
reign
Curre
ncy M
oneta
ry Ite
mTra
nslatio
n Diffe
rence
Accou
nt12
H17
1.07
171.0
7Ba
lance
at th
e end
of th
e rep
ortin
g pe
riod
-8,7
70.98
98.76
45,18
6.45
41,77
5.98
19,32
5.44
3,328
.75(2
00.30
)(6
05.38
)(8
,439.7
7)13
1,570
.2924
0,811
.20

Ruchi Soya Industries Limited
62
Ruchi Soya Industries LimitedStatement of Cash Flow
(` in lakh)
Particulars For the year ended For the year endedMarch 31, 2017 March 31, 2016
(A) CASH FLOW FROM OPERATING ACTIVITIESProfit/(Loss) before tax (1,63,043.02) (1,26,410.74)Adjustments for:Depreciation, amortisation and impairment Expenses 15,605.55 16,022.28Net Gain on Sale/Discard of Fixed Assets (7.43) 112.34Amounts charged directly to Other Comprehensive Income (648.54) (482.81)Share-based payment expense 11.48 13.07Impairment on investments and Fair value adjustments (net) 3,577.35 1,084.58Deemed Investment on account of corporate guarantee (352.20) (1,023.75)Interest Income (3,311.85) (7,531.54)Dividend Income - (28.60)Finance costs 83,221.27 1,22,043.37Provision for Doubtful Debts, Advances and Bad Debts 1,26,962.89 25,048.40Provision for Gratuity and compensated absences (357.85) 204.59Amount Debited to Business Development Reserve (19,264.76) (4,725.59)(Gain)/loss on sale of Investment[Including classified under Exceptional items] (4,490.40) (0.95)Provision from loss in LLP 18.31 -Net unrealised exchange loss/(gain) (13,144.05) (3,820.78)Operating profit before working capital changes 24,776.76 20,503.85Working capital adjustments(Increase)/ Decrease in inventories 1,11,929.78 69,205.26(Increase)/ Decrease in trade and other receivables (2,858.03) (56,522.64)(Increase)/ Decrease in other assets 49,395.01 (14,503.24)(Increase)/ Decrease in Other Balance with Banks 938.65 39,073.60(Increase)/Decrease in Long-term loans & advances 774.38 (1,661.62)(Increase)/ Decrease in Short-term loans & advances 8,681.31 (1,544.10)Increase/ (Decrease) in trade and other payables (63,371.04) (17,119.55)Increase/ (Decrease) in other liabilities (70,615.63) (42,765.10)Cash generated from operations 59,651.20 (5,333.54)Income Tax paid (1,008.12) (3,700.67)NET CASH FLOWS FROM OPERATING ACTIVITIES 58,643.08 (9,034.21)Cash flow from investing activitiesPayment for purchase and construction of Property, Plant and Equipment (855.24) (5,294.59)Proceeds from sale of Property, Plant and Equipment 236.07 241.43Proceeds from sales/(Purchase) of Investments 6,967.38 28.98Interest Income 3,311.85 7,531.54Dividend Income - 28.60
(B) NET CASH FLOWS FROM INVESTING ACTIVITIES 9,660.07 2,535.96Cash flow from financing activitiesProceeds from issue of share capital - 14.11Increase/(decrease) in Borrowings and Finance charges (67,111.73) 8,243.59Dividend - (534.56)
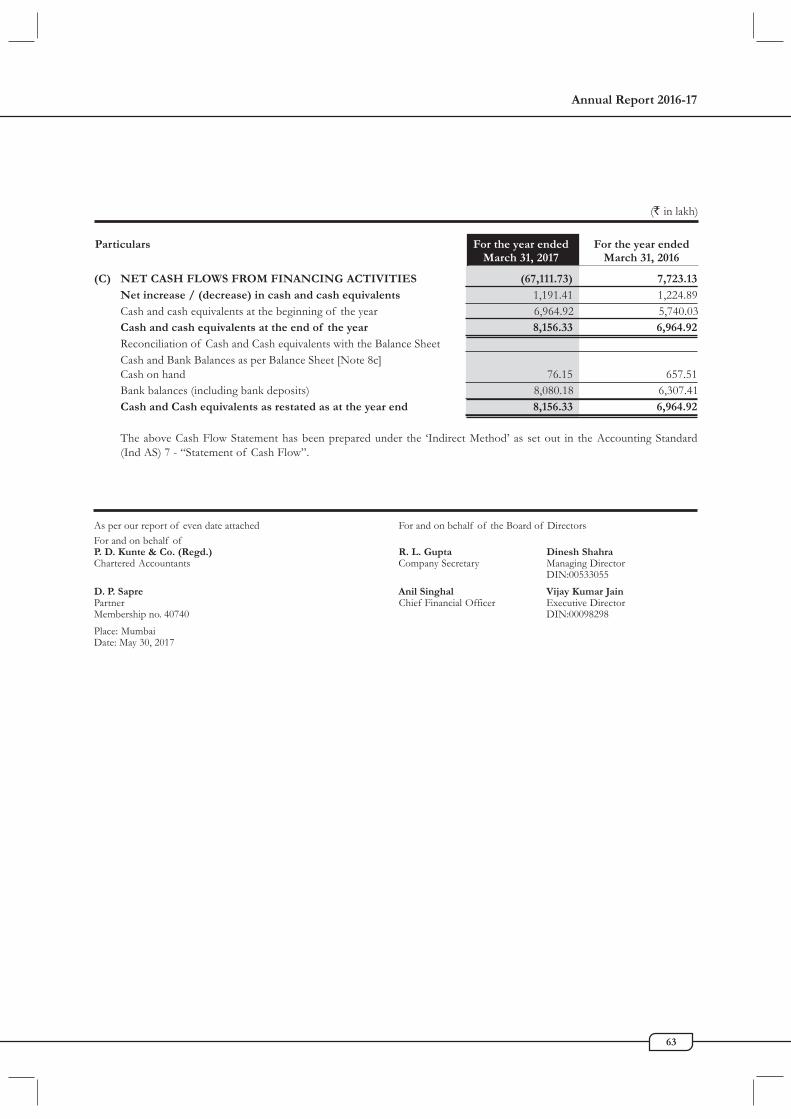
Annual Report 2016-17
63
(` in lakh)
Particulars For the year ended For the year endedMarch 31, 2017 March 31, 2016
As per our report of even date attached For and on behalf of the Board of DirectorsFor and on behalf ofP. D. Kunte & Co. (Regd.) R. L. Gupta Dinesh ShahraChartered Accountants Company Secretary Managing Director
DIN:00533055D. P. Sapre Anil Singhal Vijay Kumar JainPartner Chief Financial Officer Executive DirectorMembership no. 40740 DIN:00098298Place: MumbaiDate: May 30, 2017
(C) NET CASH FLOWS FROM FINANCING ACTIVITIES (67,111.73) 7,723.13Net increase / (decrease) in cash and cash equivalents 1,191.41 1,224.89Cash and cash equivalents at the beginning of the year 6,964.92 5,740.03Cash and cash equivalents at the end of the year 8,156.33 6,964.92Reconciliation of Cash and Cash equivalents with the Balance SheetCash and Bank Balances as per Balance Sheet [Note 8c]Cash on hand 76.15 657.51Bank balances (including bank deposits) 8,080.18 6,307.41Cash and Cash equivalents as restated as at the year end 8,156.33 6,964.92
The above Cash Flow Statement has been prepared under the ‘Indirect Method’ as set out in the Accounting Standard(Ind AS) 7 - “Statement of Cash Flow”.

Ruchi Soya Industries Limited
64
1 CORPORATE INFORMATIONRuchi Soya Industries Limited (‘the Company’) is aPublic Limited Company engaged primarily in the businessof processing of oil-seeds and refining of crude oil foredible use. The Company also produces oil meal, foodproducts from soya and value added products fromdownstream and upstream processing. The Company is alsoengaged in trading in various products and generation ofpower from wind energy. The Company has manufacturingplants across India and is listed on the Bombay StockExchange Limited (BSE) and National Stock Exchange ofIndia Limited (NSE). The Company’s registered office isat Ruchi House, Royal Palms, Survey No. 169, Aarey MilkColony, Near Mayur Nagar, Goregaon (E), Mumbai –400065, Maharastra.
2 BASIS OF PREPARATION ANDSIGNIFICANT ACCOUNTING POLICIES
(A) BASIS OF PREPARATION
a Statement of Compliance
In accordance with the notification issued by the Ministryof Corporate Affairs, the Company has adopted Ind ASnotified under the Companies (Indian AccountingStandards) Rules, 2015 with effect from April 1, 2016. Thetransition from previous GAAP to Ind AS has beenaccounted for in accordance with the Ind AS 101 “FirstTime Adoption of Indian Accounting Standards”, withApril 1, 2015 being the transition date.In accordance with the Ind AS 101 “First time adoptionof Indian Accounting Standard”, the Company haspresented a reconciliation [from the presentation of financialstatements under accounting standards notified under theCompanies (Accounting Standards) Rules, 2006 (“PreviousGAAP”) to Ind AS] of total equity as at April 1, 2015,March 31, 2017 and Statement of Profit and Loss for theyear ended March 31, 2016. [Refer Note 48]
b Functional and presentation currency
These financial statements are presented in Indian rupees(`), which is the Company’s functional currency. All amountshave been rounded to the nearest lakh, unless otherwiseindicated. [10 Lakh=1Million]
c Basis of Measurement
These financial statements have been prepared on ahistorical cost convention basis, except for the following:
(i) Certain financial assets and liabilities that are measured atFair Value.
(ii) Assets held for sale- Measured at the lower of (a) carryingamount and (b) Fair Value less cost to sell.
(iii) Net defined benefit plans- Plan assets measured at FairValue less present value of defined benefit obligation.Determining the Fair Value
While measuring the Fair Value of an asset or a liability,the Company uses observable market data as far aspossible. Fair values are categorised into different levelsin a Fair Value hierarchy based on the inputs used in thevaluation techniques as follows.Level 1 : Quoted prices (unadjusted) in active marketsfor identical assets or liabilities.Level 2 : inputs other than quoted prices included in Level1 that are observable for the asset or liability, either directly(i.e. as prices) or indirectly (i.e. derived from prices).Level 3 : inputs for the asset or liability that are not basedon observable market data (unobservable inputs).If the inputs used to measure the Fair Value of an assetor a liability fall into different levels of the Fair Valuehierarchy, then the fair value measurement is categorisedin its entirety in the same level of the Fair Value hierarchyas the lowest level input that is significant to the entiremeasurement.
d Use of Estimates and Judgement
The preparation of financial statements in accordance withInd AS requires management to make judgements, estimatesand assumptions that affect the application of accountingpolicies and the reported amount of assets, liabilities, incomeand expenses. Actual results may differ from these estimates.Estimates and underlying assumptions are reviewed on anongoing basis. Revisions to the accounting estimates arerecognized in the period in which the estimates are knownor materialised.The most significant estimates andassumptions are described below:
(i) Judgements
Information about judgements made in applying accountingpolicies that have the significant effect on amountsrecognised in the financial statement are as below:- Leases identification- Whether an agreement contains a lease.- Classification of lease - Whether Operating or Finance
(ii) Assumptions and Estimations
Information about assumption and estimation uncertainitiesthat have significant risk of resulting in a material adjustmentare as below:
1 Impairment test of non financial assets
For the purpose of assessing recoverability of non-financialassets, assets are grouped at the lower levels for which thereare individually identifiable cash flows (Cash Generating Units).
Notesto Financial Statement for the year ended March 31, 2017
NOTE 1-2
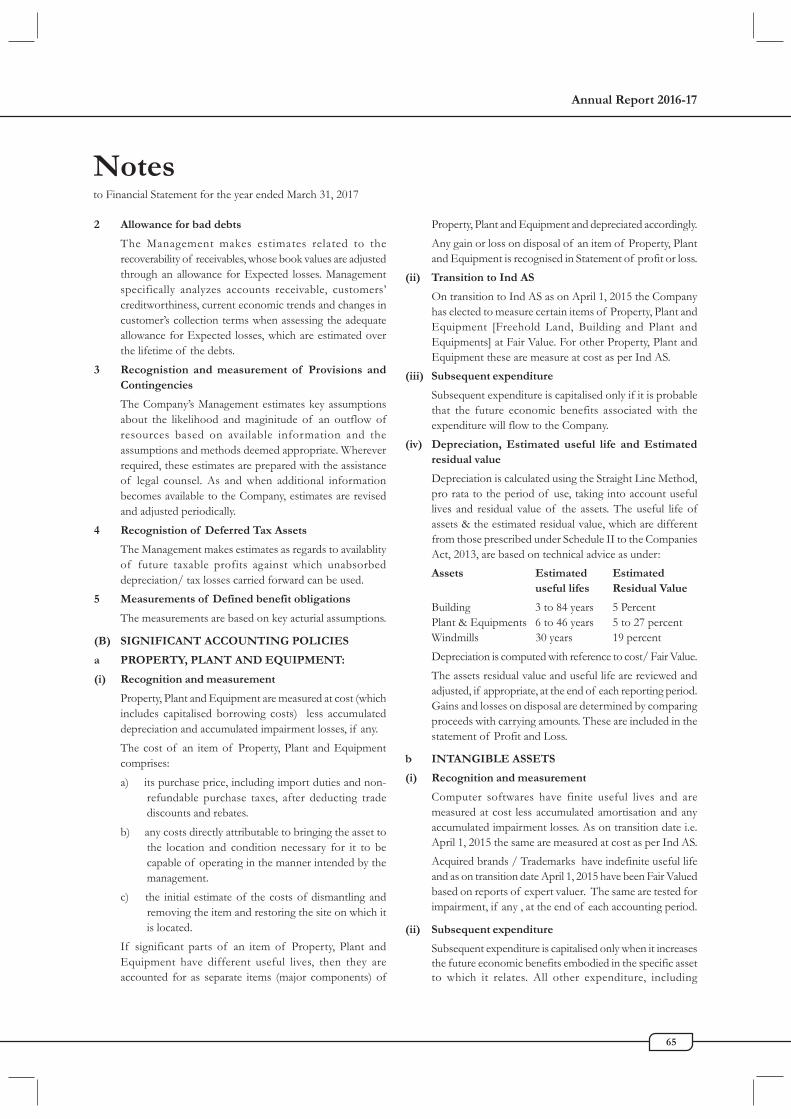
Annual Report 2016-17
65
Notesto Financial Statement for the year ended March 31, 2017
2 Allowance for bad debts
The Management makes estimates related to therecoverability of receivables, whose book values are adjustedthrough an allowance for Expected losses. Managementspecifically analyzes accounts receivable, customers’creditworthiness, current economic trends and changes incustomer’s collection terms when assessing the adequateallowance for Expected losses, which are estimated overthe lifetime of the debts.
3 Recognistion and measurement of Provisions andContingencies
The Company’s Management estimates key assumptionsabout the likelihood and maginitude of an outflow ofresources based on available information and theassumptions and methods deemed appropriate. Whereverrequired, these estimates are prepared with the assistanceof legal counsel. As and when additional informationbecomes available to the Company, estimates are revisedand adjusted periodically.
4 Recognistion of Deferred Tax Assets
The Management makes estimates as regards to availablityof future taxable profits against which unabsorbeddepreciation/ tax losses carried forward can be used.
5 Measurements of Defined benefit obligations
The measurements are based on key acturial assumptions.
(B) SIGNIFICANT ACCOUNTING POLICIES
a PROPERTY, PLANT AND EQUIPMENT:
(i) Recognition and measurement
Property, Plant and Equipment are measured at cost (whichincludes capitalised borrowing costs) less accumulateddepreciation and accumulated impairment losses, if any.The cost of an item of Property, Plant and Equipmentcomprises:a) its purchase price, including import duties and non-
refundable purchase taxes, after deducting tradediscounts and rebates.
b) any costs directly attributable to bringing the asset tothe location and condition necessary for it to becapable of operating in the manner intended by themanagement.
c) the initial estimate of the costs of dismantling andremoving the item and restoring the site on which itis located.
If significant parts of an item of Property, Plant andEquipment have different useful lives, then they areaccounted for as separate items (major components) of
Property, Plant and Equipment and depreciated accordingly.Any gain or loss on disposal of an item of Property, Plantand Equipment is recognised in Statement of profit or loss.
(ii) Transition to Ind AS
On transition to Ind AS as on April 1, 2015 the Companyhas elected to measure certain items of Property, Plant andEquipment [Freehold Land, Building and Plant andEquipments] at Fair Value. For other Property, Plant andEquipment these are measure at cost as per Ind AS.
(iii) Subsequent expenditure
Subsequent expenditure is capitalised only if it is probablethat the future economic benefits associated with theexpenditure will flow to the Company.
(iv) Depreciation, Estimated useful life and Estimatedresidual value
Depreciation is calculated using the Straight Line Method,pro rata to the period of use, taking into account usefullives and residual value of the assets. The useful life ofassets & the estimated residual value, which are differentfrom those prescribed under Schedule II to the CompaniesAct, 2013, are based on technical advice as under:Assets Estimated Estimated
useful lifes Residual Value
Building 3 to 84 years 5 PercentPlant & Equipments 6 to 46 years 5 to 27 percentWindmills 30 years 19 percentDepreciation is computed with reference to cost/ Fair Value.The assets residual value and useful life are reviewed andadjusted, if appropriate, at the end of each reporting period.Gains and losses on disposal are determined by comparingproceeds with carrying amounts. These are included in thestatement of Profit and Loss.
b INTANGIBLE ASSETS
(i) Recognition and measurement
Computer softwares have finite useful lives and aremeasured at cost less accumulated amortisation and anyaccumulated impairment losses. As on transition date i.e.April 1, 2015 the same are measured at cost as per Ind AS.Acquired brands / Trademarks have indefinite useful lifeand as on transition date April 1, 2015 have been Fair Valuedbased on reports of expert valuer. The same are tested forimpairment, if any , at the end of each accounting period.
(ii) Subsequent expenditure
Subsequent expenditure is capitalised only when it increasesthe future economic benefits embodied in the specific assetto which it relates. All other expenditure, including
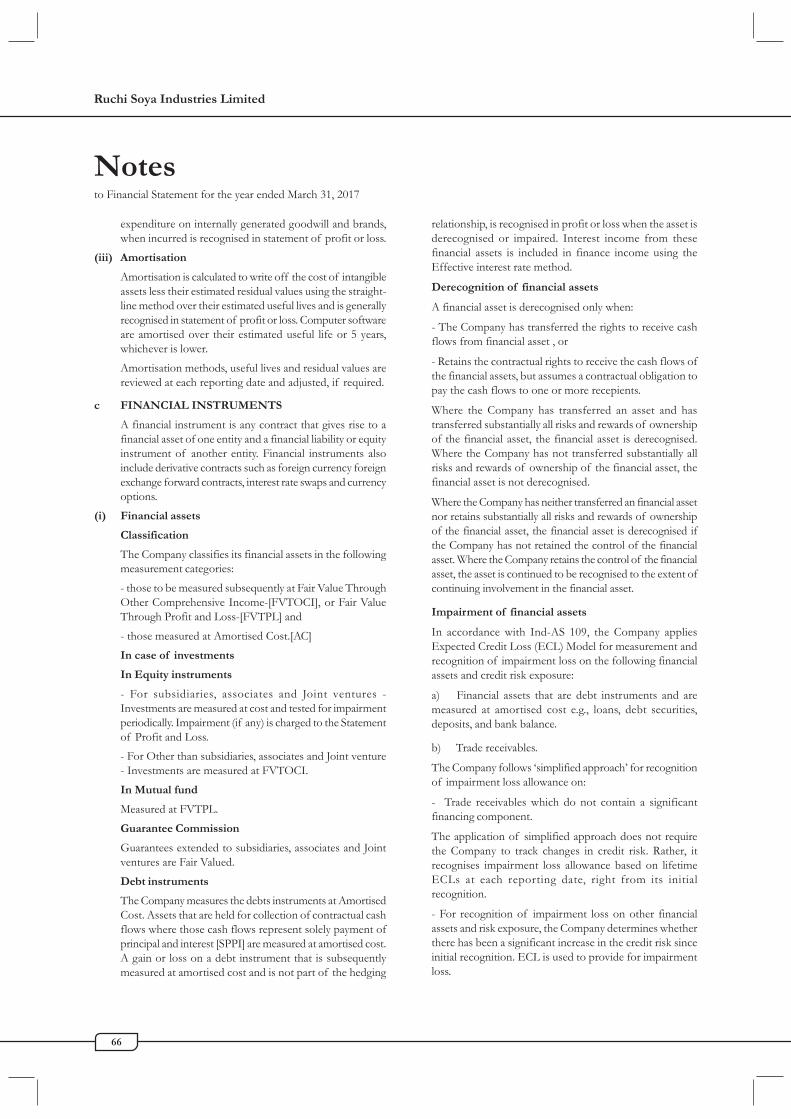
Ruchi Soya Industries Limited
66
Notesto Financial Statement for the year ended March 31, 2017
expenditure on internally generated goodwill and brands,when incurred is recognised in statement of profit or loss.
(iii) Amortisation
Amortisation is calculated to write off the cost of intangibleassets less their estimated residual values using the straight-line method over their estimated useful lives and is generallyrecognised in statement of profit or loss. Computer softwareare amortised over their estimated useful life or 5 years,whichever is lower.Amortisation methods, useful lives and residual values arereviewed at each reporting date and adjusted, if required.
c FINANCIAL INSTRUMENTS
A financial instrument is any contract that gives rise to afinancial asset of one entity and a financial liability or equityinstrument of another entity. Financial instruments alsoinclude derivative contracts such as foreign currency foreignexchange forward contracts, interest rate swaps and currencyoptions.
(i) Financial assets
Classification
The Company classifies its financial assets in the followingmeasurement categories:- those to be measured subsequently at Fair Value ThroughOther Comprehensive Income-[FVTOCI], or Fair ValueThrough Profit and Loss-[FVTPL] and- those measured at Amortised Cost.[AC]In case of investments
In Equity instruments
- For subsidiaries, associates and Joint ventures -Investments are measured at cost and tested for impairmentperiodically. Impairment (if any) is charged to the Statementof Profit and Loss.- For Other than subsidiaries, associates and Joint venture- Investments are measured at FVTOCI.In Mutual fund
Measured at FVTPL.Guarantee Commission
Guarantees extended to subsidiaries, associates and Jointventures are Fair Valued.Debt instruments
The Company measures the debts instruments at AmortisedCost. Assets that are held for collection of contractual cashflows where those cash flows represent solely payment ofprincipal and interest [SPPI] are measured at amortised cost.A gain or loss on a debt instrument that is subsequentlymeasured at amortised cost and is not part of the hedging
relationship, is recognised in profit or loss when the asset isderecognised or impaired. Interest income from thesefinancial assets is included in finance income using theEffective interest rate method.
Derecognition of financial assets
A financial asset is derecognised only when:
- The Company has transferred the rights to receive cashflows from financial asset , or
- Retains the contractual rights to receive the cash flows ofthe financial assets, but assumes a contractual obligation topay the cash flows to one or more recepients.
Where the Company has transferred an asset and hastransferred substantially all risks and rewards of ownershipof the financial asset, the financial asset is derecognised.Where the Company has not transferred substantially allrisks and rewards of ownership of the financial asset, thefinancial asset is not derecognised.
Where the Company has neither transferred an financial assetnor retains substantially all risks and rewards of ownershipof the financial asset, the financial asset is derecognised ifthe Company has not retained the control of the financialasset. Where the Company retains the control of the financialasset, the asset is continued to be recognised to the extent ofcontinuing involvement in the financial asset.
Impairment of financial assets
In accordance with Ind-AS 109, the Company appliesExpected Credit Loss (ECL) Model for measurement andrecognition of impairment loss on the following financialassets and credit risk exposure:
a) Financial assets that are debt instruments and aremeasured at amortised cost e.g., loans, debt securities,deposits, and bank balance.
b) Trade receivables.
The Company follows ‘simplified approach’ for recognitionof impairment loss allowance on:
- Trade receivables which do not contain a significantfinancing component.
The application of simplified approach does not requirethe Company to track changes in credit risk. Rather, itrecognises impairment loss allowance based on lifetimeECLs at each reporting date, right from its initialrecognition.
- For recognition of impairment loss on other financialassets and risk exposure, the Company determines whetherthere has been a significant increase in the credit risk sinceinitial recognition. ECL is used to provide for impairmentloss.

Annual Report 2016-17
67
(ii) Financial liabilities
Classification
The Company classifies its financial liabilities in thefollowing measurement categories:- those to be measured subsequently at FVTPL and- those measured at ACThe classification depends on the Company’s businessmodel for managing the financial assets and the contractualterms of the cash flows.Initial recognition and measurement
Financial liabilities are classified, at initial recognition, asfinancial liabilities at FVTPL or AC.All financial liabilities are recognised initially at Fair Valueand, in the case of loans and borrowings and payables, netof directly attributable transaction costs.The Company’s financial liabilities include trade and otherpayables, loans and borrowings including bank overdrafts,financial guarantee contracts and derivative financialinstruments.Financial liabilities at FVTPL
Financial liabilities at FVTPL include financial liabilitiesdesignated upon initial recognition as at Fair Value ThroughProfit or Loss. Financial liabilities are classified as held fortrading if they are incurred for the purpose of repurchasingin the near term. This category also includes derivativefinancial instruments entered into by the Company thatare not designated as hedging instruments in hedgerelationships as defined by Ind-AS 109. Separatedembedded derivatives are also classified as held for tradingunless they are designated as effective hedging instruments.Gains or losses on liabilities held for trading are recognisedin the profit or loss.Financial liabilities designated upon initial recognition atFVTPL are designated at the initial date of recognition,only if the criteria in Ind-AS 109 are satisfied. For liabilitiesdesignated as FVTPL, Fair Value gains/ losses attributableto changes in own credit risk are recognized in OCI. Thesegains/loss are not subsequently transferred to statementof profit or loss. However, the Company may transfer thecumulative gain or loss within equity. All other changes infair value of such liability are recognised in the statementof profit or loss.Loans and borrowings
After initial recognition, interest-bearing loans andborrowings are subsequently measured at amortised costusing the Effective Interest Rate (EIR) method. Gains andlosses are recognised in profit or loss when the liabilitiesare derecognised as well as through the EIR amortisationprocess.
AC is calculated by taking into account any discount orpremium on acquisition and fees or costs that are an integralpart of the EIR. The EIR amortisation is included as financecosts in the statement of profit and loss.This category generally applies to interest-bearing loans andborrowings.Derecognition
A financial liability is derecognised when the obligationunder the liability is discharged or cancelled or expires. Whenan existing financial liability is replaced by another fromthe same lender on substantially different terms, or the termsof an existing liability are substantially modified, such anexchange or modification is treated as the derecognitionof the original liability and the recognition of a new liability.The difference in the respective carrying amounts isrecognised in the statement of profit or loss.Offsetting of financial instruments
Financial assets and financial liabilities are offset and thenet amount is reported in the balance sheet if there is acurrently enforceable legal right to offset the recognisedamounts and there is an intention to settle on a net basis, torealise the assets and settle the liabilities simultaneously.The legally enforceable right must not be contingent onfuture events and must be enforceable in the normal courseof business and in the event of default, insolvency orbankruptcy of the Company or the counterparty.Derivative financial instruments
The Company uses derivative financial instruments, suchas forward currency contracts, interest rate swaps andforward commodity contracts to hedge its foreign currencyrisks, interest rate risks and commodity price risksrespectively. Such derivative financial instruments are initiallyrecognised at Fair Value on the date on which a derivativecontract is entered into and are subsequently re-measuredat Fair Value. Derivatives are carried as financial assets whenthe Fair Value is positive and as financial liabilities whenthe Fair Value is negative.
d INVENTORIES
Inventories are measured at the lower of cost and netrealisable value after providing for obsolence, if any, exceptfor Stock-in-Trade which are measured at Fair Value andRealisable by-products which are measured at net realisablevalue. The cost of inventories is determined using theweighted average method and includes expenditure incurredin acquiring inventories, production or conversion and othercosts incurred in bringing them to their respective presentlocation and condition. In the case of manufacturedinventories and work in progress, cost includes anappropriate share of production overheads based on normaloperating capacity.The comparision of cost and Net
Notesto Financial Statement for the year ended March 31, 2017

Ruchi Soya Industries Limited
68
Realisable value is made on an item by item basis.Net realisable value is estimated selling price in the ordinarycourse of business, less estimated cost of completion andthe estimated costs neccasary to make the sale. The netrealisable value of work in progress is determined withreference to selling prices of finished products.
e TRADE RECEIVABLES
Trade receivable are recognised intially at Fair Value andsubsequently measured at AC using the effective interestmethod less provision for impairment. As per Ind AS 109the Company has applied ECL for recognising the allowancefor doubtful debts. Where Company has offered extendedcredit period [ECP] to the debtors, the said amount isrecorded at present value, with corresponding credit in thestatement of profit and loss over the tenure of the extendedcredit period.
f CASH AND CASH EQUIVALENT
For the purpose of presentation in the statement of thecash flows, cash and cash equivalent includes the cash onhand, deposits held at call with financial institutions othershort term, highly liquid investments with original maturityof three months or less that are readily convertible to knownamounts of cash and which are subject to an insignificantrisk of changes in value.
g CONTRIBUTED EQUITY
Equity shares are classified as equity. Incidental costs directlyattributable to the issue of new shares or options are shownin equity as a deduction, net of tax, from the proceeds.
I Dividends
Provision is made for the amount of any dividend declared,in the year in which it is approved by shareholders.
II Earnings per share
(i) Basic earnings per share
Basic earnings per shares is calculated by dividing Profit/(Loss) attributable to equity holders (adjusted for amountsdirectly charged to Reserves) before/after ExceptionalItems (net of tax) by Weighted average number of Equityshares, (excluding treasury shares).
(ii) Diluted earnings per share
Diluted earnings per shares is calculated by dividing Profit/(Loss) attributable to equity holders (adjusted for amountsdirectly charged to Reserves) before/after ExceptionalItems (net of tax) by Weighted average number ofEquity shares (excluding treasury shares) considered forbasic earning per shares including dilutive potential Equityshares.
h BORROWINGS
Borrrowings are initially recognised at Fair Value, net oftransaction costs incurred. Borrowings are subsequently
measured at AC. Any difference between the proceeds (net of transaction costs) and the redemption amount isrecognised in profit or loss over the period of borrowingsusing the effective interest method. Processing/Upfrontfee are treated as prepaid asset and netted off fromborrowings. The same is amortised over the period of thefacility to which it relates.Preference shares are classified as liabilities. The dividendson these preference shares, if approved, by shareholders inthe forthcoming Annual General Meeting, are recognisedin profit or loss as finance costs, in the year when approved.Borrowings are derecognised from the balance sheet whenthe obligation specified in the contract is discharged,cancelled or expired. The difference between the carryingamount of the financial liablity that has been extinguishedor transferred to another party and the consideration paidincluding any non cash assets transferred or liabilityassumed, is recognised in Statement of profit or loss asother gains or (losses).Borrowings are classified as current liabilites unless theCompany has an unconditional right to defer the settlementof laiblities for aleast twelve months after the reportingperiod.Where there is a breach of a material provision of a longterm loan arrangement on or before the end of thereporting period with the effect that the liablity becomespayable on demand on the reporting date, the same isclassified as current unless the lender agreed, after thereporting period and before the approval of financialstatements for issue, not to demand payment as aconsequence of the breach.
i TRADE AND OTHER PAYABLES
These amounts represent liabilities for goods and servicesprovided to the Company prior to the end of financial yearwhich are unpaid at the period end. Trade and other payablesare presented as current liabilities unless payment is notdue within 12 months after the reporting period. They arerecognised initially at their Fair Value and subsequentlymeasured at amortised cost using the effective interestmethod.
j FOREIGN CURRENCY TRANSACTIONS
Transactions in foreign currencies are translated into thefunctional currencies of the Company at the exchange rateprevaling at the date of the transactions. Monetary assets(other then investments in companies registered outsideIndia) and liabilities denominated in foreign currencies aretranslated into the functional currency at the exchange rateat the reporting date.Investments in companies registered outside India areconverted at rate prevailing at the date of aquisition. Non-monetary assets and liabilities that are measured at Fair Value
Notesto Financial Statement for the year ended March 31, 2017

Annual Report 2016-17
69
in a foreign currency are translated into the functionalcurrency at the exchange rate when the Fair Value wasdetermined. Non-monetary items that are measured basedon historical cost in a foreign currency are not translated.Difference on account of changes in foreign currency aregenerally charged to the statement of profit & loss exceptthe following:The Company has availed the exemption available underPara D13AA of Ind AS - 101 of "First time adoption ofIndian Accounting Standards". Accordingly, exchange gainsand losses on foreign currency borrowings taken prior toApril 1, 2016 which are related to the acquisition orconstruction of qualifying assets are adjusted in the carryingcost of such asset. In other cases, the exchange differenceis accumulated in a foreign currency monetary itemtranslation difference account and amortised over thebalance period of such long term asset/liability.
k REVENUE
(i) Sale of goods
Revenue is recognised when the significant risk and rewardsof the ownership have been transferred to the buyer,recovery of consideration is probable, the associated costand possible return of goods can be measured reliably, thereis no continuing effective control/managerial involvementin respect of the goods, and the amount of revenue can bemeasured reliably.Revenue from sale of goods in the course of ordinaryactivities is measured at the Fair Value of the considerationreceived or receivables net of returns, trade discount,volume rebates and taxes and duties on behalf ofgovernment. This inter alia involves discounting of theconsideration due to the present value if the paymentextends beyond normal credit terms.The timing of the transfer of control varies depending onthe individual terms of the sale.Income from sale of power is recognised on the basis ofunits wheeled during the period. Income from carboncredits are recognised on credit of Carbon EmissionReduction (CER) by the approving authority in the mannerin which it is unconditionally available to the generatingCompany.
(ii) Sale of Services
Revenue from services is recognised when agreedcontractual task has been completed.
(iii) Other Income
a) Dividend income is recognised when right to receivedividend is estaiblished.
b) Interest and other income are recognised on accrual basison time proportion basis and measured at effectiveinterest rate.
l GOVERNMENT GRANTS
(i) Grants from the Government are recognised at their FairValue where there is an reasonable assurance that the grantwill be received and the Company will comply with all theattached conditions.
(ii) Government grant relating to purchase of Property, Plantand Equipment are included in ''Other current/ non-currentliabilities'' as Government Grant - Deferred Income andare credited to Profit or loss on a straight line basis overthe expected life of the related asset and presented within''Other Operating revenue''.
m EMPLOYEE BENEFITS
(i) During Employment benefits
(a) Short term employee benefits
Short-term employee benefits are expensed as the relatedservice is provided. A liability is recognised for the amountexpected to be paid if the Company has a present legal orconstructive obligation to pay this amount as a result ofpast service provided by the employee and the obligationcan be estimated reliably.
(b) Share-based payment transactions
Equity settled share based payments to employees andothers providing similar services are measured at the FairValue of the equity instruments at the grant date. Detailsregarding equity settled share based transactions are set outin Note 12L (ii).The Fair Value determined at the grant date of the equity-settled share based payments is expensed on a straight linebasis over the vesting period, based on the company'sestimate of equity instruments that will eventually vest, witha corresponding increase in equity. At the end of eachreporting period, the company revises its estimate of thenumber of equity instruments expected to vest. The impactof the revision of the original estimate, if any, is recognisedin Statement of profit and loss such that the cumulativeexpenses reflects the revised estimate, with a correspondingadjustment to the Share Based Payments Reserves. Thedilutive effect of outstanding options is reflected asadditional share dilution in the computation of dilutedearning per share.TRANSITION PROVISIONS
The Company has elected not to apply Ind AS 102 tooptions that vested prior to April 1, 2015.
(ii) Post Employment benefits
(a) Defined contribution plans
A defined contibution plan is a post employment benefitplan under which Company pays fixed contribution into aseparate entity and will have no legal or constructiveobligation to pay futhur amounts. The Company makes
Notesto Financial Statement for the year ended March 31, 2017
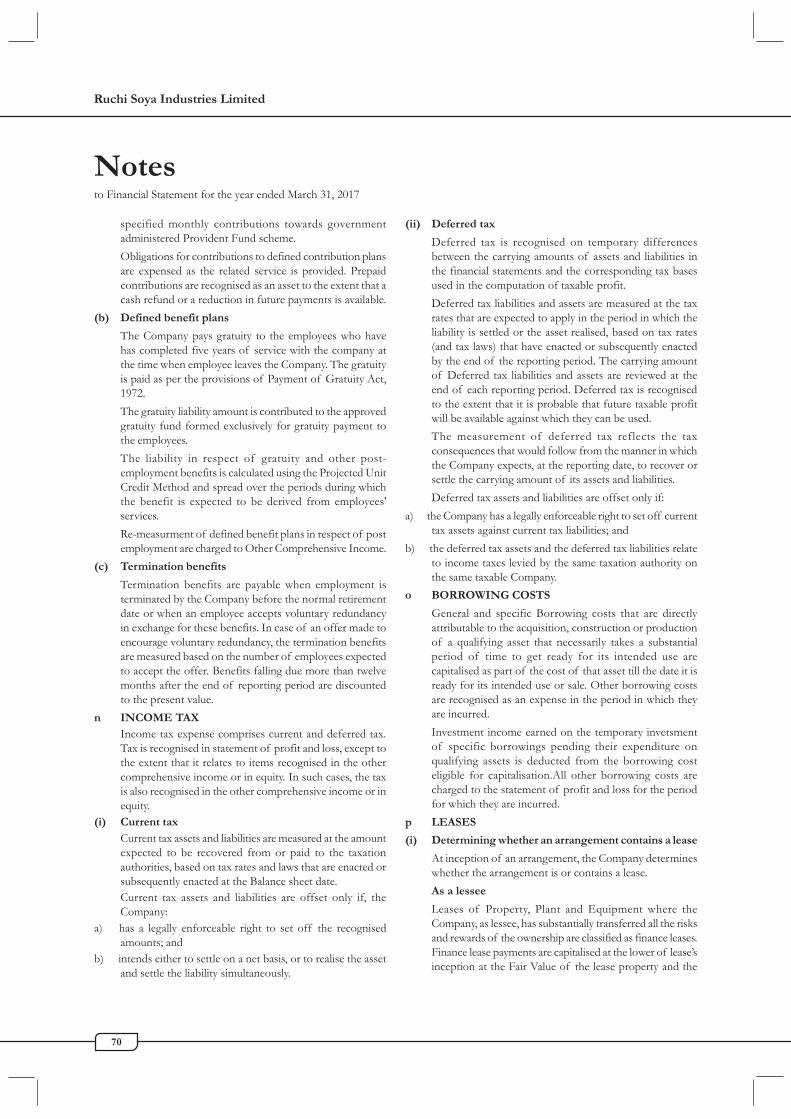
Ruchi Soya Industries Limited
70
specified monthly contributions towards governmentadministered Provident Fund scheme.Obligations for contributions to defined contribution plansare expensed as the related service is provided. Prepaidcontributions are recognised as an asset to the extent that acash refund or a reduction in future payments is available.
(b) Defined benefit plans
The Company pays gratuity to the employees who havehas completed five years of service with the company atthe time when employee leaves the Company. The gratuityis paid as per the provisions of Payment of Gratuity Act,1972.The gratuity liability amount is contributed to the approvedgratuity fund formed exclusively for gratuity payment tothe employees.The liability in respect of gratuity and other post-employment benefits is calculated using the Projected UnitCredit Method and spread over the periods during whichthe benefit is expected to be derived from employees'services.Re-measurment of defined benefit plans in respect of postemployment are charged to Other Comprehensive Income.
(c) Termination benefits
Termination benefits are payable when employment isterminated by the Company before the normal retirementdate or when an employee accepts voluntary redundancyin exchange for these benefits. In case of an offer made toencourage voluntary redundancy, the termination benefitsare measured based on the number of employees expectedto accept the offer. Benefits falling due more than twelvemonths after the end of reporting period are discountedto the present value.
n INCOME TAXIncome tax expense comprises current and deferred tax.Tax is recognised in statement of profit and loss, except tothe extent that it relates to items recognised in the othercomprehensive income or in equity. In such cases, the taxis also recognised in the other comprehensive income or inequity.
(i) Current taxCurrent tax assets and liabilities are measured at the amountexpected to be recovered from or paid to the taxationauthorities, based on tax rates and laws that are enacted orsubsequently enacted at the Balance sheet date.Current tax assets and liabilities are offset only if, theCompany:
a) has a legally enforceable right to set off the recognisedamounts; and
b) intends either to settle on a net basis, or to realise the assetand settle the liability simultaneously.
(ii) Deferred tax
Deferred tax is recognised on temporary differencesbetween the carrying amounts of assets and liabilities inthe financial statements and the corresponding tax basesused in the computation of taxable profit.Deferred tax liabilities and assets are measured at the taxrates that are expected to apply in the period in which theliability is settled or the asset realised, based on tax rates(and tax laws) that have enacted or subsequently enactedby the end of the reporting period. The carrying amountof Deferred tax liabilities and assets are reviewed at theend of each reporting period. Deferred tax is recognisedto the extent that it is probable that future taxable profitwill be available against which they can be used.The measurement of deferred tax reflects the taxconsequences that would follow from the manner in whichthe Company expects, at the reporting date, to recover orsettle the carrying amount of its assets and liabilities.Deferred tax assets and liabilities are offset only if:
a) the Company has a legally enforceable right to set off currenttax assets against current tax liabilities; and
b) the deferred tax assets and the deferred tax liabilities relateto income taxes levied by the same taxation authority onthe same taxable Company.
o BORROWING COSTS
General and specific Borrowing costs that are directlyattributable to the acquisition, construction or productionof a qualifying asset that necessarily takes a substantialperiod of time to get ready for its intended use arecapitalised as part of the cost of that asset till the date it isready for its intended use or sale. Other borrowing costsare recognised as an expense in the period in which theyare incurred.Investment income earned on the temporary invetsmentof specific borrowings pending their expenditure onqualifying assets is deducted from the borrowing costeligible for capitalisation.All other borrowing costs arecharged to the statement of profit and loss for the periodfor which they are incurred.
p LEASES
(i) Determining whether an arrangement contains a lease
At inception of an arrangement, the Company determineswhether the arrangement is or contains a lease.As a lessee
Leases of Property, Plant and Equipment where theCompany, as lessee, has substantially transferred all the risksand rewards of the ownership are classified as finance leases.Finance lease payments are capitalised at the lower of lease’sinception at the Fair Value of the lease property and the
Notesto Financial Statement for the year ended March 31, 2017

Annual Report 2016-17
71
present value of minimum lease payments. Thecorresponding rental obligations, if any, net of financecharges are included in borrowings or other financialliabilities as appropiate. Each lease payment is allocatedbetween the liability and the finance cost. The finance costis charged to the profit or loss over the lease period so as toproduce a constant periodic rate; of Interest on theremianing balance of liability for each period.Leases in which a significant portion of risk and rewardsof ownership are not transferred to the Company as a lesseeare classified as opearting lease. Payments made underoperating leases are charged to Profit and Loss on a straightline basis over the period of lease except where anothersystematic basis is more representative of time pattern inwhich economic benefits from the leased assets areconsumed.As a lessor
Lease Income from opearting leases where the Companyis a lessor is recognised as income on a straight line basisover the lease term unless the receipts are structured toincrease in line with the expected general inflation tocompensate for the expected inflationary cost increases.
q Non- Current assets held for sale:
Non Current assets are classified as held for sale if theircarrying amount will be recovered principally through asale transaction rather than through continuing use and sale
Notesto Financial Statement for the year ended March 31, 2017
is considered highly probable. They are measured at lowerof their (a.) carrying amount and (b.) Fair Value less cost tosell. Non current assets are not depreciated or amortisedwhen they are classified as held for sale.
r Provisions and contingent liabilities
Provisions are recognised when the Company has a presentlegal or constructive obligation as a result of past events, itis probable that an outflow of resources will be required tosettle the obiligation and the amount can be reliablyestimated.Provisions are measured at the present value ofmanagement’s best estimate of the expenditure requiredto settle the present obligation at the end of the reportingperiod. The discount rate used to determine the presentvalue is a pre tax rate that reflects current marketassessments of the time value of money and the risksspecific to the liability. The increase in the provision due tothe passage of time is recognised as interest expenses.Contingent liabilities are disclosed in respect of possbileobiligations that arise from past events but their existencewill be confirmed by the occurrence or non occurrence ofone or more uncertain future events not wholly within thecontrol of Company or where any present obligation cannotbe measured in terms of future outflow of resourcesor where a reliable estimate of the obligation cannot bemade.

Ruchi Soya Industries Limited
72
Notesto Financial Statement for the year ended March 31, 2017
Parti
cular
s F
reeh
old
land
Leas
e Hol
d La
ndBu
ildin
gsPl
ant &
Win
dmill
s F
urni
ture
Vehi
cles
Offi
ceTo
tal
Cap
ital w
ork-
[Refe
r Not
e[R
efer N
ote
[Refe
r Not
eEq
uipm
ent
& F
ixtu
res
Equi
pmen
tsin
-pro
gres
s 3a
(v) b
elow]
3a (i
v) b
elow]
3a(i)
, (ii)
, (iii
),[R
efer N
ote
(iv) a
nd (v
)3a
(ii),
(iv)
belo
w]an
d (v
) belo
w]
A. Y
ear e
nded
Mar
ch 31
, 201
7
Gros
s car
ryin
g am
ount
Ope
ning
gro
ss ca
rryin
g am
ount
1,60,8
56.76
757.4
859
,913.4
11,6
1,802
.4955
,067.7
51,7
09.82
2,937
.673,6
31.23
4,46,6
76.61
4,202
.04
Add :
Add
itions
[Refer
Note
3a (i)
]83
.36-
122.3
91,7
49.48
-18
.6432
.6610
7.73
2,114
.2690
0.06
Less
: Asse
ts clas
sified
as hel
d for
sale [
Refer
Note
10 ]
277.5
6-
--
--
--
277.5
6-
Less
: Disp
osals
--
-16
.91-
0.83
359.9
180
.7545
8.40
-Le
ss :Tr
ansfer
s2,1
85.84
Clos
ing
gros
s car
ryin
g am
ont
1,60,6
62.56
757.4
860
,035.8
01,6
3,535
.0555
,067.7
51,7
27.63
2,610
.423,6
58.22
4,48,0
54.90
2,916
.26Ac
cum
ulat
ed d
epre
ciatio
n an
d im
pairm
ent
Ope
ning
accu
mul
ated
dep
recia
tion
as at
Apr
il 1,
2016
-16
1.64
2,400
.5510
,851.4
515
,384.4
51,1
76.98
1,743
.723,0
48.04
34,76
6.83
-
Add :
Dep
reciat
ion ch
arge d
uring
the y
ear-
9.45
2,444
.8910
,269.3
41,8
54.06
103.3
725
4.66
245.1
415
,180.9
1-
Add :
Impai
rmen
t loss
--
241.8
380
.26-
--
-32
2.08
-Le
ss :D
isposa
ls/ A
djustm
ents
--
-0.3
2-
0.36
172.4
456
.6422
9.76
-Le
ss :As
sets c
lassife
d as h
eld fo
r sale
[ Refe
r Note
10 ]
--
--
--
--
--
Clos
ing
accu
lated
dep
recia
tion
and
impa
irmen
t-
171.0
85,0
87.27
21,20
0.73
17,23
8.51
1,279
.991,8
25.94
3,236
.5450
,040.0
6-
Net
carry
ing
amou
nt1,6
0,662
.5658
6.40
54,94
8.53
1,42,3
34.32
37,82
9.24
447.6
478
4.48
421.6
73,9
8,014
.842,9
16.26
B. Y
ear e
nded
Mar
ch 31
, 201
6Gr
oss c
arrin
g am
ount
Dee
med
cost
as at
Apr
il 1,
2015
1,60,8
75.58
757.4
858
,120.4
51,5
3,955
.3854
,358.0
11,6
62.85
3,003
.233,4
60.17
4,36,1
93.15
10,01
6.74
Add :
Add
itions
[Refer
Note
3a (i)
]31
.68-
1,841
.428,0
39.64
709.7
447
.0215
5.84
236.1
511
,061.4
83,6
69.24
Less
: Asse
ts clas
sified
as hel
d for
sale [
Refer
Note
10 ]
--
--
--
--
--
Less
: Disp
osals
50.50
-48
.4719
2.53
-0.0
422
1.40
65.09
578.0
3-
Less
:Trans
fers
9,483
.94Cl
osin
g gr
oss c
arry
ing
amon
t1,6
0,856
.7675
7.48
59,91
3.41
1,61,8
02.49
55,06
7.75
1,709
.822,9
37.67
3,631
.234,4
6,676
.614,2
02.04
Accu
mul
ated
depr
eciat
ion
Ope
ning
accu
mul
ated
dep
recia
tion
as at
Apr
il 1,
2015
-13
6.77
-78
.7313
,530.3
81,0
72.50
1,533
.192,7
35.00
19,08
6.56
-Ad
d : D
eprec
iation
charg
e duri
ng th
e year
-24
.872,4
03.99
10,84
1.21
1,854
.0610
4.53
307.8
436
8.03
15,90
4.53
-Le
ss : A
ssets c
lassifi
ed as
held f
or sal
e [ Re
fer N
ote 10
]-
--
--
--
--
-Le
ss :D
isposa
ls/ A
djustm
ents
--
3.44
68.49
-0.0
497
.3154
.9822
4.26
-Cl
osin
g ac
cum
ulat
ed d
epre
ciatio
n-
161.6
42,4
00.55
10,85
1.45
15,38
4.45
1,176
.981,7
43.72
3,048
.0434
,766.8
3N
et ca
rryin
g am
ount
1,60,8
56.76
595.8
557
,512.8
61,5
0,951
.0339
,683.3
053
2.84
1,193
.9558
3.19
4,11,9
09.77
4,202
.04
Not
e 3a:
(i) A
dditio
n duri
ng th
e year
inclu
des -
(a)Int
erest c
apitali
sed `
Nil [F
Y 201
5-16
` 4.04
Lakh
] inclu
ding N
il [FY
2015
-16 `
2.72
Lakh
] und
er cap
ital wo
rk in
progre
ss.(b)
Adjus
tment
on ac
count
of ex
chang
e diffe
rences
loss
of `
515.3
4 Lakh
[FY
2015
-16 `
1,833
.05 L
akh] R
efer N
ote 39
.(ii)
Proper
ty, Pla
nt and
Equip
ment
includ
es ass
ets ha
ving w
ritten
down
value
of ( `
580.5
9 Lakh
) [FY
2015
-16 `
7,59
4.43 L
akh] re
presen
ting p
lant &
equip
ments
and b
uildin
g whic
h are
not w
holly
used.
The C
ompan
y is in
the p
rocess
of fin
ding a
lterna
te use
of su
chass
ets or
their
ultim
ate di
sposal
.(iii
)Buil
dings
includ
e ` 0.
02 L
akh [F
Y 201
5-16 `
0.02
Lakh
] bein
g cost
of Sh
ares in
Co-op
erativ
e Soci
eties.
Title
deeds
in re
spect
of sh
ares a
moun
ting t
o ` .0
05 L
akh ar
e in th
e proc
ess of
transf
er.
NO
TE
-3P
RO
PE
RT
Y, P
LA
NT
AN
D E
QU
IPM
EN
T (`
in L
akh)

Annual Report 2016-17
73
Notesto Financial Statement for the year ended March 31, 2017
(iv) Assets Given on lease [Included under Note 3 above]
Particulars Lease Hold Buildings Plant & TotalLand Equipment
A. Year ended March 31, 2017Gross carrying amountOpening gross carrying amount 12.73 151.01 11.57 175.30Additions — — — —Disposals — — — —Closing gross carrying amount 12.73 151.01 11.57 175.30Accumulated amortisation and impairmentOpening 2.11 8.02 0.24 10.37Amortisation charge for the year 0.26 8.02 0.30 8.57Disposals — — — —Closing accumulated amortisation and impairment 2.37 16.03 0.54 18.94Closing net carrying amount 10.36 134.97 11.03 156.37
B. Year ended March 31, 2016Gross carrying amountDeemed cost as at April 1, 2015 12.73 151.01 11.57 175.30Additions — — — —Assets included in a disposal group classified asheld for sale [ Refer Note 10 ] — — — —Disposals — — — —Closing gross carrying amount 12.73 151.01 11.57 175.30Accumulated depreciationOpening accumulated depreciation as at April 1, 2015 1.86 — — 1.86Depreciation charge during the year 0.26 8.02 0.24 8.51Assets included in a disposal group classified asheld for sale [ Refer Note 10 ] — — — —Disposals — — — —Closing accumulated depreciation 2.11 8.02 0.24 10.37Net carrying amount 10.62 142.99 11.33 164.93
(v) Valuation method & key assumptions used : [ Refer Note 12 (K) ]Independent Fair Valuation of certain Property, Plant and Equipment [ Freehold Land, Building & Plant & Equipment] hasbeen done as on April 1, 2015. The remaining assets have been valued based on Ind AS 16 - Property, Plant & Equipment. TheFair Valuation is based on physical inspection and verification conducted at the respective locations. The best evidence of fairvalue is current prices in an active market value for similar properties at such locations. Where such information is not available,we have considered information from a variety of sources including:• Current Price in an active market for properties of different nature or recent prices of similar properties in less active
markets, adjusted to reflect those differences• discounted cash flow projections based on reliable estimates of future cash flows• capitalised income projections based upon a property's estimated net market income, and a capitalisation rate derived from
an analysis of market evidence.For determining the Fair Valuation the Main inputs used are Government prescribed guidelines, broker quotes, rental growthrates, expected vacancy rates, terminal yields and discount rates based on comparable transactions and industry data.Significant estimate: Fair Valuation, Estimated remaining useful Life and Estimated residual value of fixed assets have beentaken as determined by Expert valuer.
NOTE-3 PROPERTY, PLANT AND EQUIPMENT (Contd.) (` in Lakh)
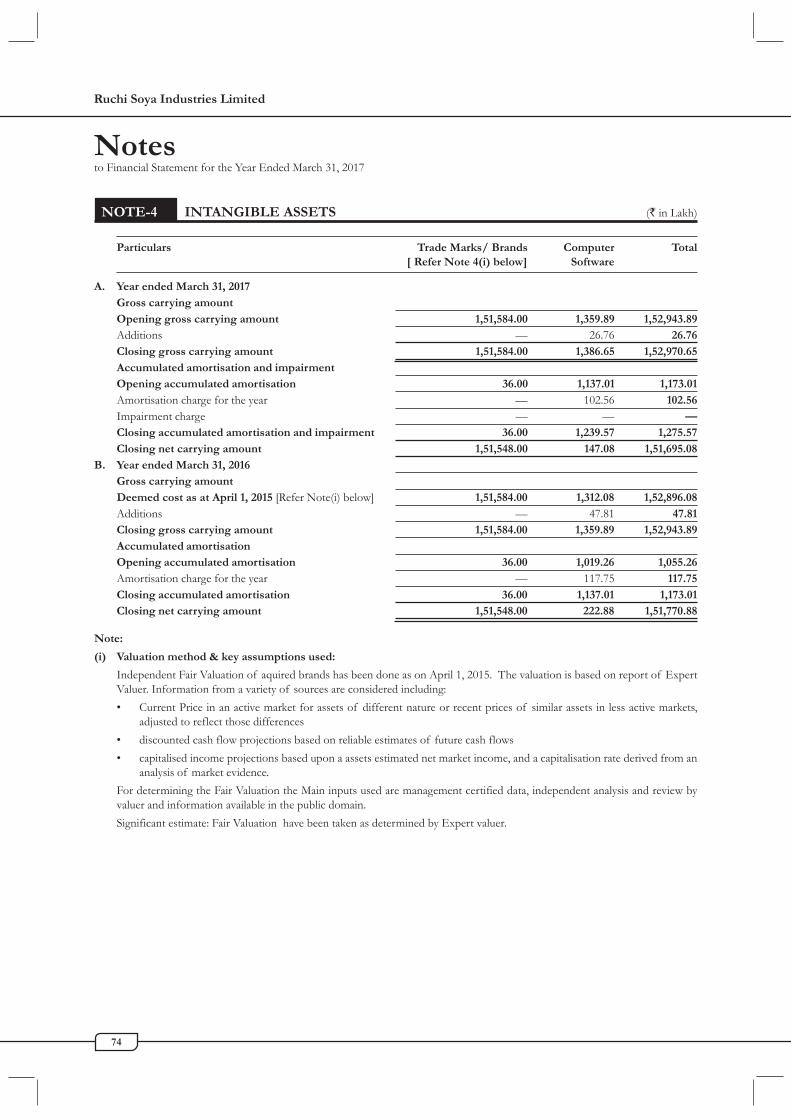
Ruchi Soya Industries Limited
74
NOTE-4 INTANGIBLE ASSETS (` in Lakh)
Particulars Trade Marks/ Brands Computer Total[ Refer Note 4(i) below] Software
A. Year ended March 31, 2017Gross carrying amountOpening gross carrying amount 1,51,584.00 1,359.89 1,52,943.89Additions — 26.76 26.76Closing gross carrying amount 1,51,584.00 1,386.65 1,52,970.65Accumulated amortisation and impairmentOpening accumulated amortisation 36.00 1,137.01 1,173.01Amortisation charge for the year — 102.56 102.56Impairment charge — — —Closing accumulated amortisation and impairment 36.00 1,239.57 1,275.57Closing net carrying amount 1,51,548.00 147.08 1,51,695.08
B. Year ended March 31, 2016Gross carrying amountDeemed cost as at April 1, 2015 [Refer Note(i) below] 1,51,584.00 1,312.08 1,52,896.08Additions — 47.81 47.81Closing gross carrying amount 1,51,584.00 1,359.89 1,52,943.89Accumulated amortisationOpening accumulated amortisation 36.00 1,019.26 1,055.26Amortisation charge for the year — 117.75 117.75Closing accumulated amortisation 36.00 1,137.01 1,173.01Closing net carrying amount 1,51,548.00 222.88 1,51,770.88
Note:
(i) Valuation method & key assumptions used:
Independent Fair Valuation of aquired brands has been done as on April 1, 2015. The valuation is based on report of ExpertValuer. Information from a variety of sources are considered including:• Current Price in an active market for assets of different nature or recent prices of similar assets in less active markets,
adjusted to reflect those differences• discounted cash flow projections based on reliable estimates of future cash flows• capitalised income projections based upon a assets estimated net market income, and a capitalisation rate derived from an
analysis of market evidence.For determining the Fair Valuation the Main inputs used are management certified data, independent analysis and review byvaluer and information available in the public domain.Significant estimate: Fair Valuation have been taken as determined by Expert valuer.
Notesto Financial Statement for the Year Ended March 31, 2017
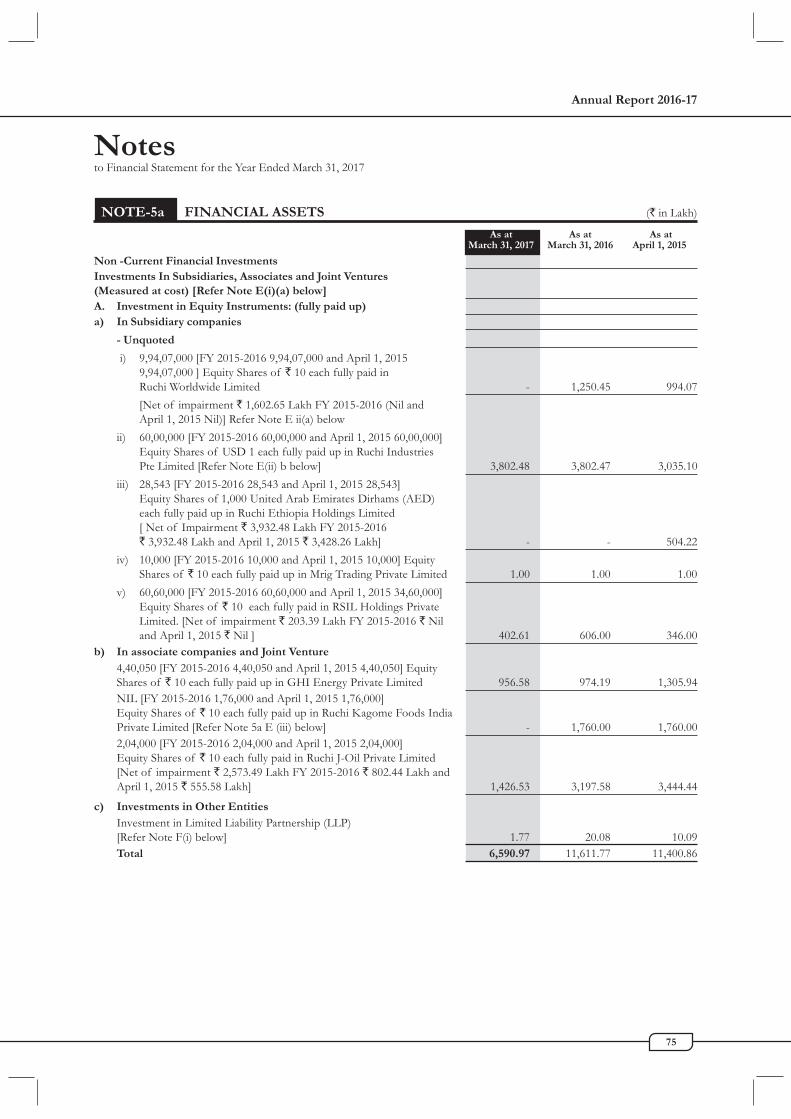
Annual Report 2016-17
75
Notesto Financial Statement for the Year Ended March 31, 2017
NOTE-5a FINANCIAL ASSETS (` in Lakh)
As at As at As atMarch 31, 2017 March 31, 2016 April 1, 2015
Non -Current Financial InvestmentsInvestments In Subsidiaries, Associates and Joint Ventures(Measured at cost) [Refer Note E(i)(a) below]A. Investment in Equity Instruments: (fully paid up)a) In Subsidiary companies
- Unquoted
i) 9,94,07,000 [FY 2015-2016 9,94,07,000 and April 1, 20159,94,07,000 ] Equity Shares of ` 10 each fully paid inRuchi Worldwide Limited - 1,250.45 994.07[Net of impairment ` 1,602.65 Lakh FY 2015-2016 (Nil andApril 1, 2015 Nil)] Refer Note E ii(a) below
ii) 60,00,000 [FY 2015-2016 60,00,000 and April 1, 2015 60,00,000]Equity Shares of USD 1 each fully paid up in Ruchi IndustriesPte Limited [Refer Note E(ii) b below] 3,802.48 3,802.47 3,035.10
iii) 28,543 [FY 2015-2016 28,543 and April 1, 2015 28,543]Equity Shares of 1,000 United Arab Emirates Dirhams (AED)each fully paid up in Ruchi Ethiopia Holdings Limited[ Net of Impairment ` 3,932.48 Lakh FY 2015-2016` 3,932.48 Lakh and April 1, 2015 ` 3,428.26 Lakh] - - 504.22
iv) 10,000 [FY 2015-2016 10,000 and April 1, 2015 10,000] EquityShares of ` 10 each fully paid up in Mrig Trading Private Limited 1.00 1.00 1.00
v) 60,60,000 [FY 2015-2016 60,60,000 and April 1, 2015 34,60,000]Equity Shares of ` 10 each fully paid in RSIL Holdings PrivateLimited. [Net of impairment ` 203.39 Lakh FY 2015-2016 ` Niland April 1, 2015 ` Nil ] 402.61 606.00 346.00
b) In associate companies and Joint Venture4,40,050 [FY 2015-2016 4,40,050 and April 1, 2015 4,40,050] EquityShares of ` 10 each fully paid up in GHI Energy Private Limited 956.58 974.19 1,305.94NIL [FY 2015-2016 1,76,000 and April 1, 2015 1,76,000]Equity Shares of ` 10 each fully paid up in Ruchi Kagome Foods IndiaPrivate Limited [Refer Note 5a E (iii) below] - 1,760.00 1,760.002,04,000 [FY 2015-2016 2,04,000 and April 1, 2015 2,04,000]Equity Shares of ` 10 each fully paid in Ruchi J-Oil Private Limited[Net of impairment ` 2,573.49 Lakh FY 2015-2016 ` 802.44 Lakh andApril 1, 2015 ` 555.58 Lakh] 1,426.53 3,197.58 3,444.44
c) Investments in Other EntitiesInvestment in Limited Liability Partnership (LLP)[Refer Note F(i) below] 1.77 20.08 10.09Total 6,590.97 11,611.77 11,400.86

Ruchi Soya Industries Limited
76
B Investment in Equity Instruments - Other than in subsidiary,associate and Joint Venture companies[Designated at FVOCI (Refer Note E(i) b below and 33 (A) I (ii)) ]
a) Quotedi) 8,83,500 [FY 2015-2016 8,83,500 and April 1, 2015 8,83,500]
Equity Shares of ` 10 each fully paid up in National Steel &Agro Industries Limited 226.62 110.44 125.46
ii) 4,00,000 [FY 2015-2016 4,00,000 and April 1, 2015 4,00,000]Equity Shares of ` 10 each fully paid up in Anik Industries Limited 109.80 126.40 90.60
iii) 2,73,24,239 [FY 2015-2016 2,73,24,239 and April 1, 2015 2,73,24,239]Equity Shares of ` 1 each fully paid up in Ruchi Infrastructure Limited 972.74 1,776.08 2,136.74
iv) 17,71,700 [FY 2015-16 17,71,700 and April 1, 2015 17,71,700]Equity Shares of ` 10 each fully paid up in Ruchi Strips &Alloys Limited 46.06 72.28 97.26
v) 1,19,300 [FY 2015-16 1,19,300 and April 1, 2015 1,19,300]Equity Shares of ` 10 each fully paid up in SarthakGlobal Limited 26.07 26.06 27.68
vi) 1,80,000 [FY 2015-2016 1,80,000 and April 1, 2015 1,80,000]Equity Shares of ` 2 each fully paid up in Blue Chip India Limited 0.59 1.12 0.40
vii) 35,000 [FY 2015-2016 35,000 and April 1, 2015 35,000]Equity Shares of ` 10 each fully paid up in SharadrajTradelink Limited 19.25 19.25 19.25
b) Unquotedi) 25,000 [FY 2015-2016 25,000 and April 1, 2015 25,000]
Equity shares of ` 10 each fully paid-up in Ruchi Infotech Limited 2.50 2.50 2.50ii) 6,00,000 [FY 2015-2016 6,00,000 and April 1, 2015 6,00,000]
Equity shares of ` 10 each fully paid-up in Ruchi AcroniIndustries Limited 235.56 235.56 228.66
iii) 35,000 [FY 2015-2016 35,000 and April 1, 2015 35,000]Equity shares of ` 10 each fully paid-up in E-Ruchi Marketing(P) Limited 3.50 3.50 3.50
iv) 16,100 [FY 2015-16 16,100 and April 1, 2015 16,100]Equity Shares of ` 10 each fully paid up in National Boardof Trade Private Limited 0.01 0.01 0.01
v) 21,500 [FY 2015-2016 21,500 and April 1, 2015 21,500] EquityShares of ` 10 each fully paid up in Hereld Commerce Limited — — —Total 1,642.71 2,373.20 2,732.06
C Investment in Preference Shares measured at ACUnquoted10,46,435 [FY 2015-2016 10,46,435 and April 1, 2015 10,46,435]6% Non Cumulative, Non Convertible Redeemable PreferenceShares of ` 100 each fully paid up in GHI Energy Private Limited 543.49 493.74 432.95
Notesto Financial Statement for the Year Ended March 31, 2017
NOTE-5a FINANCIAL ASSETS (Contd.) (` in Lakh)
As at As at As atMarch 31, 2017 March 31, 2016 April 1, 2015

Annual Report 2016-17
77
D Investment in Government or Trust Securities measured atAmortised costNational Saving Certificates/Kisan Vikas Patra(deposited with Government authorities) 1.08 2.12 2.45Total 544.57 495.86 435.40GRAND TOTAL: 8,778.25 14,480.83 14,568.32
Aggregate amount of quoted investments - Cost 10,763.23 10,763.23 10,763.23Fair Market Value of quoted investments 1,401.14 2,131.63 2,497.39Aggregate amount of unquoted investments - Cost 15,700.49 17,095.51 16,066.13Aggregate amount of fair valuation-unquoted investments (11.38) (11.38) (11.38)Aggregate amount of Impairment of unquoted investments (8,312.01) (4,734.92) (3,983.84)Category-wise Non-current investementFinancial assets carried at AC 544.57 495.86 435.40Financial assets measured at cost 6,590.97 11,611.77 11,400.86Financial assets measured at FVOCI 1,642.71 2,373.20 2,732.06
E i) (a) Investments in Subsidiaries, Associates and Joint ventures are measured at cost and tested for impairment. Impairment(if any) denotes permanent diminution and charged to Statement of Profit and loss. Impairment in cases of unlistedsecurities is determined based on the valuation reports and in case of listed securities the same is determined basedon the prevaling market prices.
(b) Investments in other than Subsidiaries, Associates and Joint ventures are measured at FVTOCI. and is charged/added to "Other Comprehensive Income". Fair Valuation of unlisted securities is determined based on the valuationreports and in case of listed securities the same is determined based on the prevaling market prices.
ii) (a) The Company has extended the guarantee to various banks on behalf of Ruchi Worldwide Limited amounting to` 38,968.80 Lakh [FY 2015-2016 ̀ 37,849.97 Lakh and April 1, 2015 is ̀ 45,278.90 Lakh] for Guarantee commissioncharged amounting to ` Nil [FY 2015-2016 Nil and April 1, 2015 Nil]. Deemed cost of guarantee amounting to` 608.58 Lakh (FY 2015-16 ` 256.38 Lakh and April 1, 2015 ` Nil) is added as deemed investment. [Refer Note34(A)(b)(iii)]
(b) The Company has extended the guarantee to banks on behalf of Ruchi Agri Trading Private Limited [ a whollyowned subsidiary of Ruchi Industries Pte. Limited ] amounting to Nil [FY 2015-2016 USD 159.5 Million andApril 1, 2015 is USD 154 Million] for Guarantee commission charged amounting to ` Nil [FY 2015-2016 Nil andApril 1, 2015 Nil]. Deemed cost of guarantee amouting to ` 767.38 Lakh [ FY 2015-16 ` 767.38 Lakh and April 1,2015 ` Nil ] is added as deemed investment. [Refer Note 34(A)(b)(iii)]
iii) During the year ended March 31, 2017, the Company has divested its entire holding of 1,76,000 shares in Ruchi KagomeFoods India Private Limited for consideration of ` 6,300.00 Lakh. The Surplus of ` 4,490.40 Lakh on divestment hasbeen shown in the statement of profit and loss as an Exceptional item. [Refer Note 32(b)]
F (i) The Company is a Partner in the Limited Liability Partnership (LLP). Details are as below:
Name of the Partners of Indian Oil Ruchithe LLP Firm Biofuels LLP
Ruchi Soya Indian OilIndustries Limited Corporation Limited
Total Capital ` 319.6Shares of each Partner 50% 50%
Notesto Financial Statement for the Year Ended March 31, 2017
NOTE-5a FINANCIAL ASSETS (Contd.) (` in Lakh)
As at As at As atMarch 31, 2017 March 31, 2016 April 1, 2015
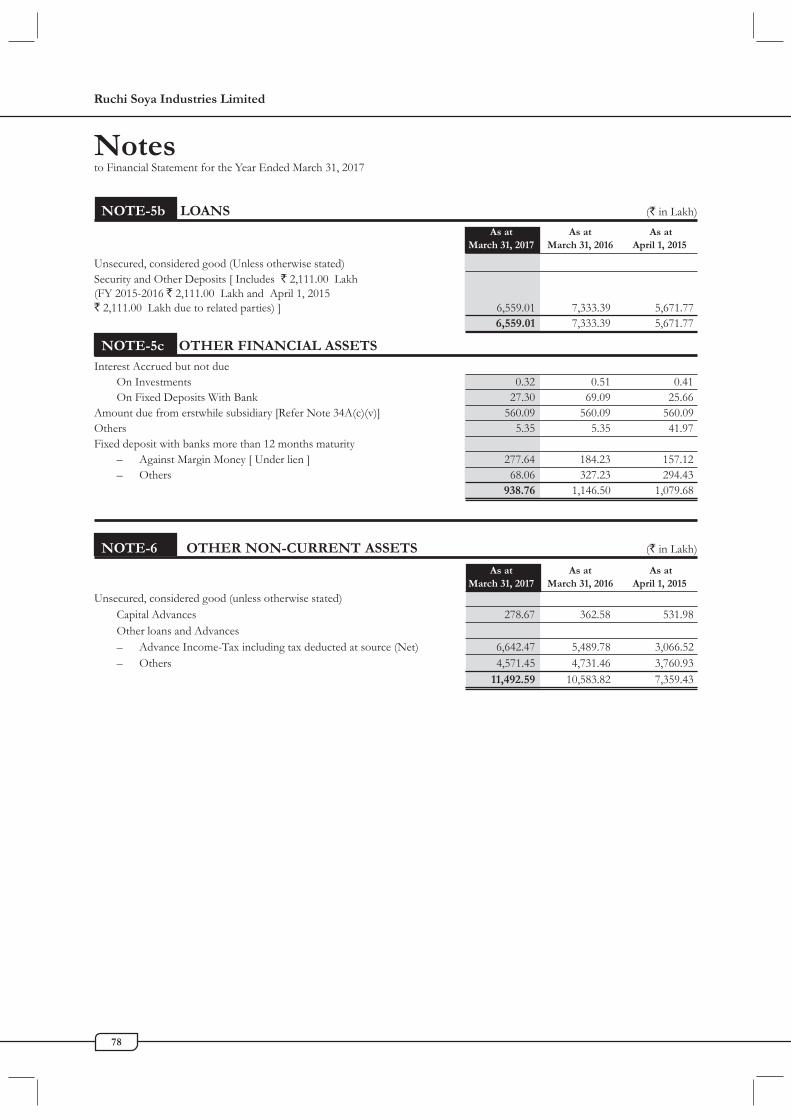
Ruchi Soya Industries Limited
78
NOTE-5b LOANS (` in Lakh)
Notesto Financial Statement for the Year Ended March 31, 2017
As at As at As atMarch 31, 2017 March 31, 2016 April 1, 2015
Unsecured, considered good (Unless otherwise stated)Security and Other Deposits [ Includes ` 2,111.00 Lakh(FY 2015-2016 ` 2,111.00 Lakh and April 1, 2015` 2,111.00 Lakh due to related parties) ] 6,559.01 7,333.39 5,671.77
6,559.01 7,333.39 5,671.77
NOTE-5c OTHER FINANCIAL ASSETSInterest Accrued but not due
On Investments 0.32 0.51 0.41On Fixed Deposits With Bank 27.30 69.09 25.66
Amount due from erstwhile subsidiary [Refer Note 34A(c)(v)] 560.09 560.09 560.09Others 5.35 5.35 41.97Fixed deposit with banks more than 12 months maturity
– Against Margin Money [ Under lien ] 277.64 184.23 157.12– Others 68.06 327.23 294.43
938.76 1,146.50 1,079.68
NOTE-6 OTHER NON-CURRENT ASSETS (` in Lakh)
As at As at As atMarch 31, 2017 March 31, 2016 April 1, 2015
Unsecured, considered good (unless otherwise stated)Capital Advances 278.67 362.58 531.98Other loans and Advances– Advance Income-Tax including tax deducted at source (Net) 6,642.47 5,489.78 3,066.52– Others 4,571.45 4,731.46 3,760.93
11,492.59 10,583.82 7,359.43

Annual Report 2016-17
79
Notesto Financial Statement for the Year Ended March 31, 2017
NOTE-7 INVENTORIES (` in Lakh)
As at As at As atMarch 31, 2017 March 31, 2016 April 1, 2015
(As valued and certified by the Management)(At lower of cost and net realisable value except for stock-in-trademeasured at Fair Value and realisable by-products at net realisable value)[ Refer Note (i) below]a) Raw Materials (including packing material)
Goods in transit 18,808.70 21,449.87 60,028.85others 42,232.37 1,19,851.41 1,19,318.35
b) Work-in-progress 478.43 1,042.39 1,643.22c) Finished goods
Goods in transit 1,457.74 1,840.40 1,038.01others 49,980.46 76,524.15 1,06,429.63
d) Stock- in- trade ( in respect of goods acquired for trading)[Refer Note (i) below] 1,103.26 2,436.98 3,258.29
e) Realisable by-products 3,611.79 5,012.97 5,187.30f) Stores and Spares 3,948.67 4,264.48 4,268.01g) Consumables 2,264.14 3,392.70 3,848.93
1,23,885.56 2,35,815.35 3,05,020.59Note:(i) The following inventories are measured at Fair Value
Particulars Fair Value Fair Value Fair Value(`̀̀̀̀ In Lakh) (`̀̀̀̀ In Lakh) (`̀̀̀̀ In Lakh)
Stock-in-trade 1,103.26 2,436.98 3,258.29Measurement of Fair Value : Classified as Level 2 [ Refer Note 45 B]Valuation Techniques :Stock-in-Trade measured at Fair Value are based on quotations of Commodity Exchange (NCDEX),as well as quotations from Solvent Extractor's Association of India ( Non Government Organisation) recognised by Ministry ofAgriculture, Government of India).
NOTE-8a CURRENT INVESTMENTS (` in Lakh)
As at As at As atMarch 31, 2017 March 31, 2016 April 1, 2015
QuotedA. INVESTMENTS IN MUTUAL FUNDS
(Measured at fair value through Profit and Loss) [FVTPL]i) 1,00,000 Units [FY 2015-2016 1,00,000 Units and
April 1, 2015 1,00,000 Units] of SBI MagnumMulticap fund- Growth of ` 10 each. 40.51 32.59 32.14
ii) 60,681.871 Units [FY 2015-2016 60,681.871 Units andApril 1, 2015 60,681.871 Units] of SBI Magnum EquityFund -Regular plan- Growth of ` 41.20 each. 52.19 44.16 45.76
iii) 50,000 Units [FY 2015-2016 50,000 Units andApril 1, 2015 50,000 Units] of SBI InfrastructureFund-Regular plan Growth of ` 10 each. 6.82 5.31 5.89
iv) 774.446 Units [FY 2015-2016 774.446 Units andApril 1, 2015 774.446 Units] of PNB PrincipalEmerging Blue Chip Fund - Regular planGrowth of ` 10 each. 0.70 0.50 0.53
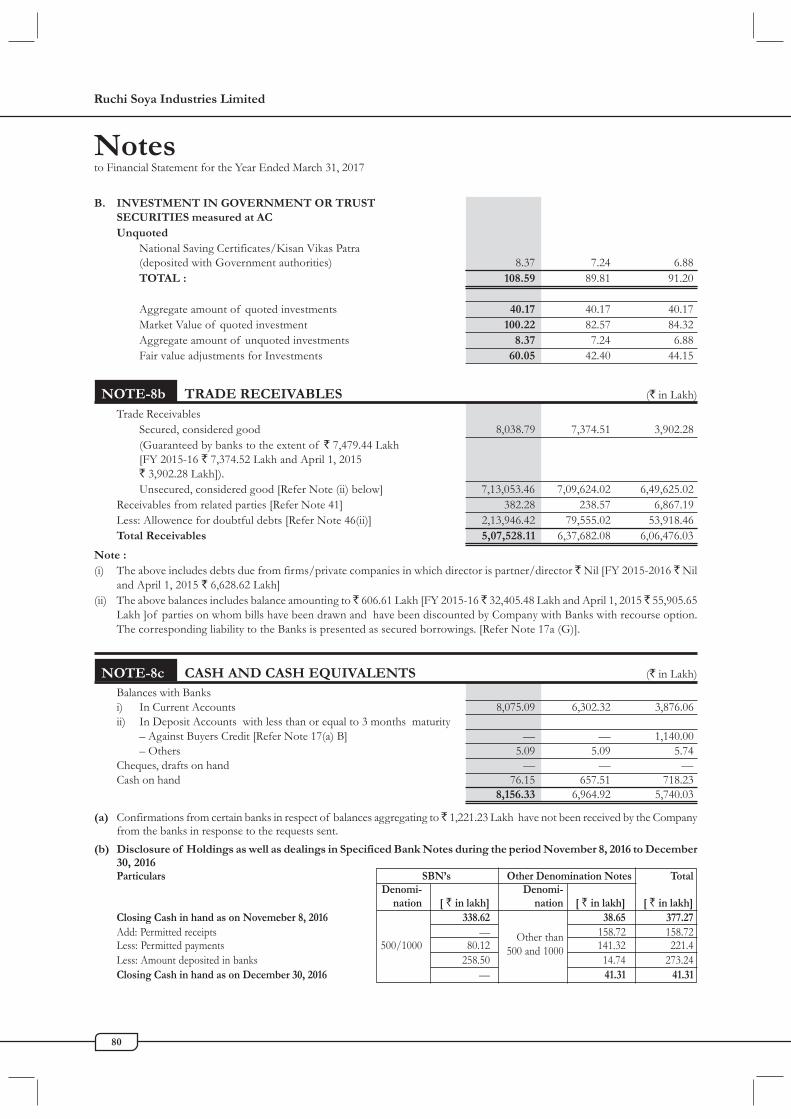
Ruchi Soya Industries Limited
80
Notesto Financial Statement for the Year Ended March 31, 2017
B. INVESTMENT IN GOVERNMENT OR TRUSTSECURITIES measured at ACUnquoted
National Saving Certificates/Kisan Vikas Patra(deposited with Government authorities) 8.37 7.24 6.88TOTAL : 108.59 89.81 91.20
Aggregate amount of quoted investments 40.17 40.17 40.17Market Value of quoted investment 100.22 82.57 84.32Aggregate amount of unquoted investments 8.37 7.24 6.88Fair value adjustments for Investments 60.05 42.40 44.15
NOTE-8b TRADE RECEIVABLES (` in Lakh)Trade Receivables
Secured, considered good 8,038.79 7,374.51 3,902.28(Guaranteed by banks to the extent of ` 7,479.44 Lakh[FY 2015-16 ` 7,374.52 Lakh and April 1, 2015` 3,902.28 Lakh]).Unsecured, considered good [Refer Note (ii) below] 7,13,053.46 7,09,624.02 6,49,625.02
Receivables from related parties [Refer Note 41] 382.28 238.57 6,867.19Less: Allowence for doubtful debts [Refer Note 46(ii)] 2,13,946.42 79,555.02 53,918.46Total Receivables 5,07,528.11 6,37,682.08 6,06,476.03
Note :(i) The above includes debts due from firms/private companies in which director is partner/director ` Nil [FY 2015-2016 ` Nil
and April 1, 2015 ` 6,628.62 Lakh](ii) The above balances includes balance amounting to ̀ 606.61 Lakh [FY 2015-16 ̀ 32,405.48 Lakh and April 1, 2015 ̀ 55,905.65
Lakh ]of parties on whom bills have been drawn and have been discounted by Company with Banks with recourse option.The corresponding liability to the Banks is presented as secured borrowings. [Refer Note 17a (G)].
NOTE-8c CASH AND CASH EQUIVALENTS (` in Lakh)Balances with Banksi) In Current Accounts 8,075.09 6,302.32 3,876.06ii) In Deposit Accounts with less than or equal to 3 months maturity
– Against Buyers Credit [Refer Note 17(a) B] — — 1,140.00– Others 5.09 5.09 5.74
Cheques, drafts on hand — — —Cash on hand 76.15 657.51 718.23
8,156.33 6,964.92 5,740.03
(a) Confirmations from certain banks in respect of balances aggregating to ̀ 1,221.23 Lakh have not been received by the Companyfrom the banks in response to the requests sent.
(b) Disclosure of Holdings as well as dealings in Specificed Bank Notes during the period November 8, 2016 to December30, 2016Particulars SBN’s Other Denomination Notes Total
Denomi- Denomi-nation [ ` in lakh] nation [ ` in lakh] [ ` in lakh]
Closing Cash in hand as on Novemeber 8, 2016 338.62 38.65 377.27Add: Permitted receipts — 158.72 158.72Less: Permitted payments 500/1000 80.12
Other than141.32 221.4
Less: Amount deposited in banks 258.50500 and 1000
14.74 273.24Closing Cash in hand as on December 30, 2016 — 41.31 41.31

Annual Report 2016-17
81
Notesto Financial Statement for the Year Ended March 31, 2017
We have appropriately disclosed the details of Specified Bank Notes (SBN) held and transacted during the period from 8thNovember, 2016 to 30th December, 2016 pursuant to the requirments of Notification G.S.R 308 (E) dated 30th March, 2017 ofthe Government of India. Further we confirm that we have complied with all relevant guidelines/ notifications issued byReserve Bank of India from time to time in respect of holding and dealing with Specified Bank Notes, and that the company hadproper controls, system and procedures in place for such compliances.
NOTE-8d BANK BALANCES OTHER THAN CASH AND CASH EQUIVALENTS ABOVE (` in Lakh)Earmarked Unclaimed Dividend Accounts 31.98 38.50 41.55In Deposit Accounts
Original Maturity less than or equal to 3 months– Against Margin Money [ Under lien ] 103.31 100.43 467.63
More than 3 months but less than or equal to 12 months maturity.– Against Buyers Credit [Refer Note 17(a) B] — — 40,310.30– Against Margin Money [ Under lien ] 4,841.32 4,124.82 4,414.13– Others 1,223.04 2,874.56 978.29
6,199.65 7,138.31 46,211.90
NOTE-8e LOANS (` in Lakh)Unsecured, considered good (unless otherwise stated):
Security and Other Deposits 869.69 934.13 966.82Loans to Related parties [Refer Note 38 (ii) and 41] 9.96 794.96 1,892.14Loans to Others 2.98 - -Others:a) Loan to employees 236.46 440.27 394.03b) Intercorporate Deposits [Refer Note i and ii below]
To Related parties - - 158.28To Others [Refer Note 38(ii)] - 7,631.05 4,845.04
1,119.09 9,800.41 8,256.31
Note :(i) Intercorporate Deposits include ̀ Nil [FY 2015-2016 ̀ Nil and April 1, 2015 ̀ 158.28 Lakh] kept with Related parties [Refer Note 41](ii) In respect of certain advances included under inter-corporate deposits, the Company has charged interest on advances given on
net daily products of balances due from/payable to these companies during the year. The Company has been advised that thisis in compliance with the provisions of section 186 of the Companies Act, 2013.
NOTE-8f OTHER FINANCIAL ASSETS (` in Lakh)Unsecured considered good
Interest Accrued but not dueOn Investments 5.89 5.42 5.23On Fixed Deposits with Banks 181.46 139.43 1,436.94On Other deposits 48.63 936.24 863.97
Derivative Assets– Forward exchange forward contract - 3,503.81 577.80– Foreign curreny options - 593.18 669.67– Interest rate swaps - - -– Commodity Contracts 4,128.65 876.36 129.41Other Receivables 467.38 2,212.58 1,508.31
4,832.01 8,267.02 5,191.33
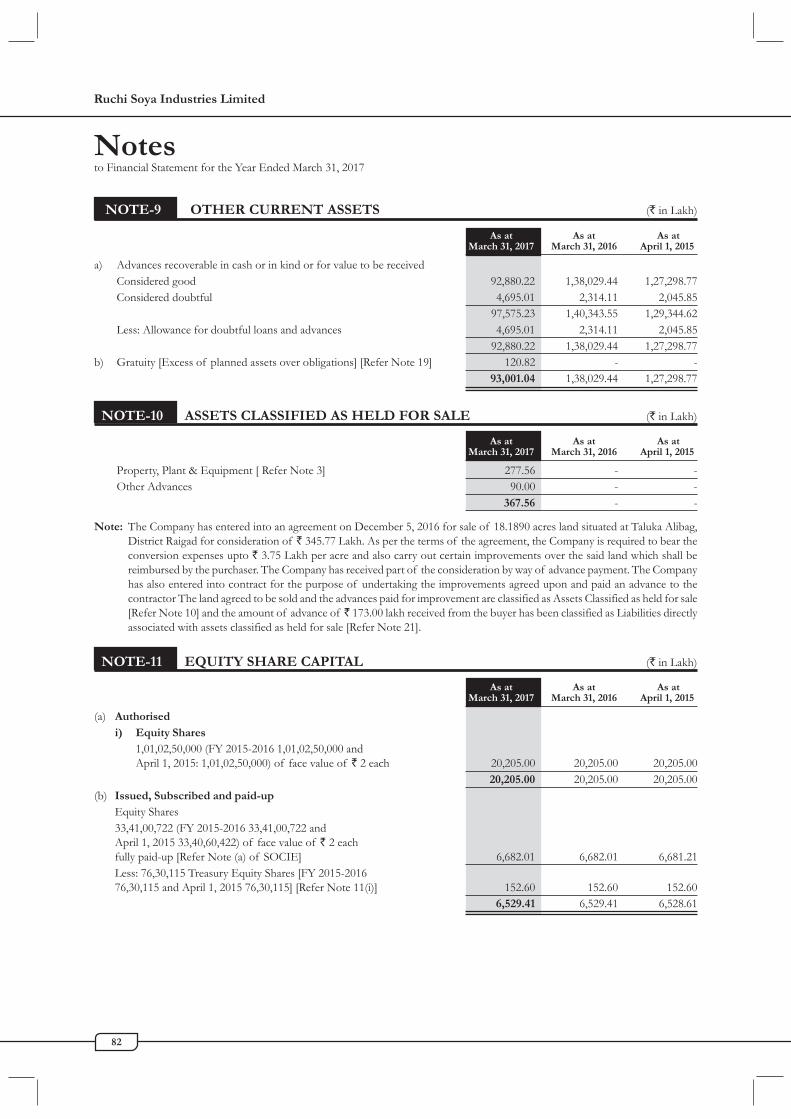
Ruchi Soya Industries Limited
82
Notesto Financial Statement for the Year Ended March 31, 2017
NOTE-9 OTHER CURRENT ASSETS (` in Lakh)
As at As at As atMarch 31, 2017 March 31, 2016 April 1, 2015
a) Advances recoverable in cash or in kind or for value to be receivedConsidered good 92,880.22 1,38,029.44 1,27,298.77Considered doubtful 4,695.01 2,314.11 2,045.85
97,575.23 1,40,343.55 1,29,344.62Less: Allowance for doubtful loans and advances 4,695.01 2,314.11 2,045.85
92,880.22 1,38,029.44 1,27,298.77b) Gratuity [Excess of planned assets over obligations] [Refer Note 19] 120.82 - -
93,001.04 1,38,029.44 1,27,298.77
NOTE-10 ASSETS CLASSIFIED AS HELD FOR SALE (` in Lakh)
As at As at As atMarch 31, 2017 March 31, 2016 April 1, 2015
Property, Plant & Equipment [ Refer Note 3] 277.56 - -Other Advances 90.00 - -
367.56 - -
Note: The Company has entered into an agreement on December 5, 2016 for sale of 18.1890 acres land situated at Taluka Alibag,District Raigad for consideration of ` 345.77 Lakh. As per the terms of the agreement, the Company is required to bear theconversion expenses upto ` 3.75 Lakh per acre and also carry out certain improvements over the said land which shall bereimbursed by the purchaser. The Company has received part of the consideration by way of advance payment. The Companyhas also entered into contract for the purpose of undertaking the improvements agreed upon and paid an advance to thecontractor The land agreed to be sold and the advances paid for improvement are classified as Assets Classified as held for sale[Refer Note 10] and the amount of advance of ̀ 173.00 lakh received from the buyer has been classified as Liabilities directlyassociated with assets classified as held for sale [Refer Note 21].
NOTE-11 EQUITY SHARE CAPITAL (` in Lakh)
As at As at As atMarch 31, 2017 March 31, 2016 April 1, 2015
(a) Authorisedi) Equity Shares
1,01,02,50,000 (FY 2015-2016 1,01,02,50,000 andApril 1, 2015: 1,01,02,50,000) of face value of ` 2 each 20,205.00 20,205.00 20,205.00
20,205.00 20,205.00 20,205.00(b) Issued, Subscribed and paid-up
Equity Shares33,41,00,722 (FY 2015-2016 33,41,00,722 andApril 1, 2015 33,40,60,422) of face value of ` 2 eachfully paid-up [Refer Note (a) of SOCIE] 6,682.01 6,682.01 6,681.21Less: 76,30,115 Treasury Equity Shares [FY 2015-201676,30,115 and April 1, 2015 76,30,115] [Refer Note 11(i)] 152.60 152.60 152.60
6,529.41 6,529.41 6,528.61
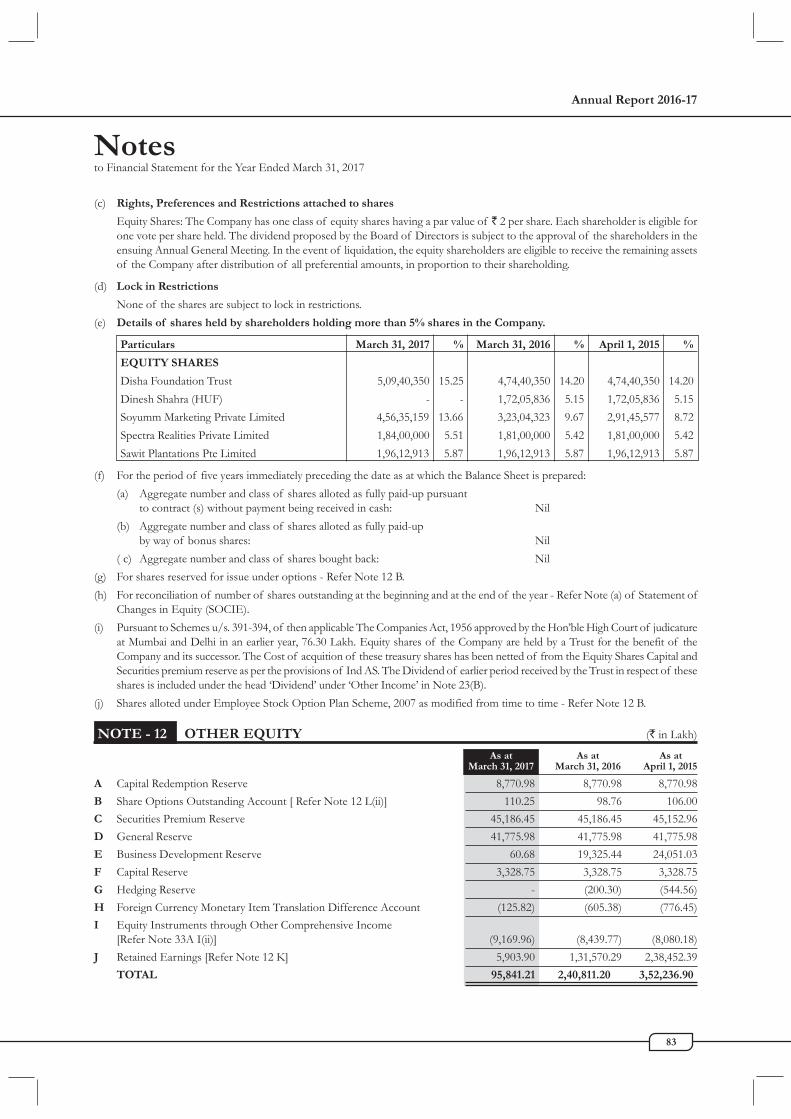
Annual Report 2016-17
83
Notesto Financial Statement for the Year Ended March 31, 2017
(c) Rights, Preferences and Restrictions attached to shares
Equity Shares: The Company has one class of equity shares having a par value of ` 2 per share. Each shareholder is eligible forone vote per share held. The dividend proposed by the Board of Directors is subject to the approval of the shareholders in theensuing Annual General Meeting. In the event of liquidation, the equity shareholders are eligible to receive the remaining assetsof the Company after distribution of all preferential amounts, in proportion to their shareholding.
(d) Lock in Restrictions
None of the shares are subject to lock in restrictions.(e) Details of shares held by shareholders holding more than 5% shares in the Company.
Particulars March 31, 2017 % March 31, 2016 % April 1, 2015 %
EQUITY SHARES
Disha Foundation Trust 5,09,40,350 15.25 4,74,40,350 14.20 4,74,40,350 14.20Dinesh Shahra (HUF) - - 1,72,05,836 5.15 1,72,05,836 5.15Soyumm Marketing Private Limited 4,56,35,159 13.66 3,23,04,323 9.67 2,91,45,577 8.72Spectra Realities Private Limited 1,84,00,000 5.51 1,81,00,000 5.42 1,81,00,000 5.42Sawit Plantations Pte Limited 1,96,12,913 5.87 1,96,12,913 5.87 1,96,12,913 5.87
(f) For the period of five years immediately preceding the date as at which the Balance Sheet is prepared:(a) Aggregate number and class of shares alloted as fully paid-up pursuant
to contract (s) without payment being received in cash: Nil(b) Aggregate number and class of shares alloted as fully paid-up
by way of bonus shares: Nil( c) Aggregate number and class of shares bought back: Nil
(g) For shares reserved for issue under options - Refer Note 12 B.(h) For reconciliation of number of shares outstanding at the beginning and at the end of the year - Refer Note (a) of Statement of
Changes in Equity (SOCIE).(i) Pursuant to Schemes u/s. 391-394, of then applicable The Companies Act, 1956 approved by the Hon’ble High Court of judicature
at Mumbai and Delhi in an earlier year, 76.30 Lakh. Equity shares of the Company are held by a Trust for the benefit of theCompany and its successor. The Cost of acquition of these treasury shares has been netted of from the Equity Shares Capital andSecurities premium reserve as per the provisions of Ind AS. The Dividend of earlier period received by the Trust in respect of theseshares is included under the head ‘Dividend’ under ‘Other Income’ in Note 23(B).
(j) Shares alloted under Employee Stock Option Plan Scheme, 2007 as modified from time to time - Refer Note 12 B.
NOTE - 12 OTHER EQUITY (` in Lakh)
As at As at As atMarch 31, 2017 March 31, 2016 April 1, 2015
A Capital Redemption Reserve 8,770.98 8,770.98 8,770.98B Share Options Outstanding Account [ Refer Note 12 L(ii)] 110.25 98.76 106.00C Securities Premium Reserve 45,186.45 45,186.45 45,152.96D General Reserve 41,775.98 41,775.98 41,775.98E Business Development Reserve 60.68 19,325.44 24,051.03F Capital Reserve 3,328.75 3,328.75 3,328.75G Hedging Reserve - (200.30) (544.56)H Foreign Currency Monetary Item Translation Difference Account (125.82) (605.38) (776.45)I Equity Instruments through Other Comprehensive Income
[Refer Note 33A I(ii)] (9,169.96) (8,439.77) (8,080.18)J Retained Earnings [Refer Note 12 K] 5,903.90 1,31,570.29 2,38,452.39
TOTAL 95,841.21 2,40,811.20 3,52,236.90
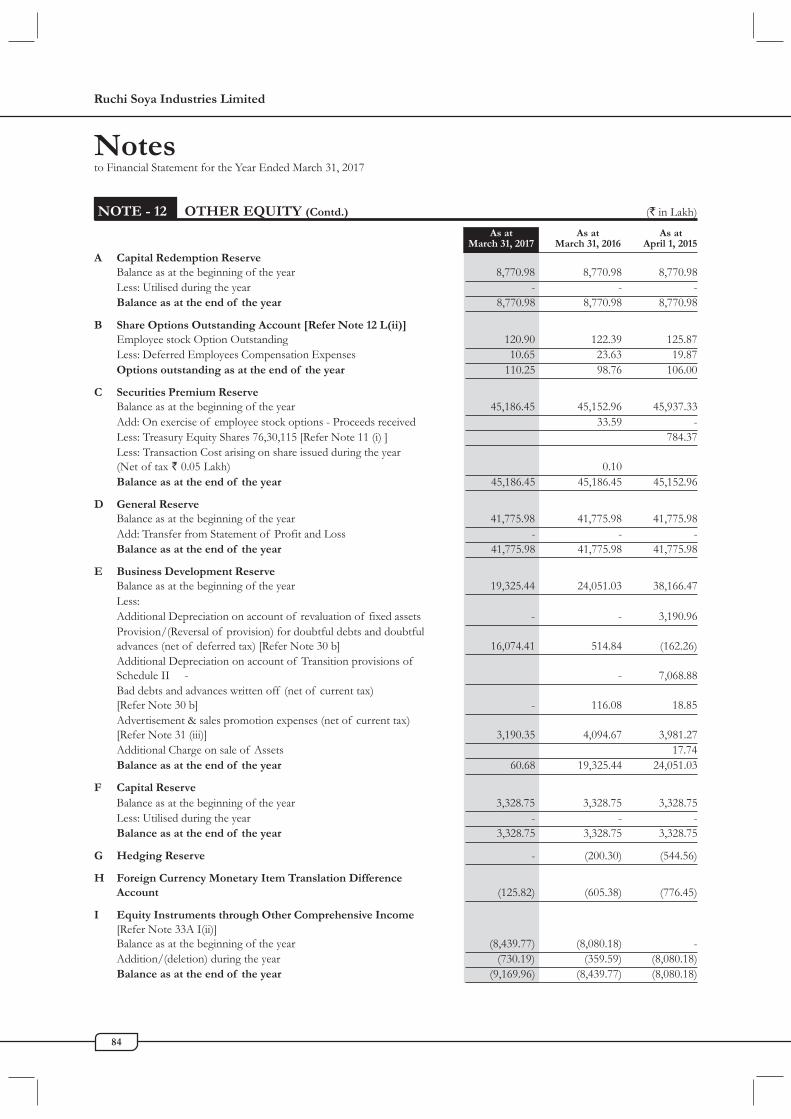
Ruchi Soya Industries Limited
84
Notesto Financial Statement for the Year Ended March 31, 2017
A Capital Redemption ReserveBalance as at the beginning of the year 8,770.98 8,770.98 8,770.98Less: Utilised during the year - - -Balance as at the end of the year 8,770.98 8,770.98 8,770.98
B Share Options Outstanding Account [Refer Note 12 L(ii)]Employee stock Option Outstanding 120.90 122.39 125.87Less: Deferred Employees Compensation Expenses 10.65 23.63 19.87Options outstanding as at the end of the year 110.25 98.76 106.00
C Securities Premium ReserveBalance as at the beginning of the year 45,186.45 45,152.96 45,937.33Add: On exercise of employee stock options - Proceeds received 33.59 -Less: Treasury Equity Shares 76,30,115 [Refer Note 11 (i) ] 784.37Less: Transaction Cost arising on share issued during the year(Net of tax ` 0.05 Lakh) 0.10Balance as at the end of the year 45,186.45 45,186.45 45,152.96
D General ReserveBalance as at the beginning of the year 41,775.98 41,775.98 41,775.98Add: Transfer from Statement of Profit and Loss - - -Balance as at the end of the year 41,775.98 41,775.98 41,775.98
E Business Development ReserveBalance as at the beginning of the year 19,325.44 24,051.03 38,166.47Less:Additional Depreciation on account of revaluation of fixed assets - - 3,190.96Provision/(Reversal of provision) for doubtful debts and doubtfuladvances (net of deferred tax) [Refer Note 30 b] 16,074.41 514.84 (162.26)Additional Depreciation on account of Transition provisions ofSchedule II - - 7,068.88Bad debts and advances written off (net of current tax)[Refer Note 30 b] - 116.08 18.85Advertisement & sales promotion expenses (net of current tax)[Refer Note 31 (iii)] 3,190.35 4,094.67 3,981.27Additional Charge on sale of Assets 17.74Balance as at the end of the year 60.68 19,325.44 24,051.03
F Capital ReserveBalance as at the beginning of the year 3,328.75 3,328.75 3,328.75Less: Utilised during the year - - -Balance as at the end of the year 3,328.75 3,328.75 3,328.75
G Hedging Reserve - (200.30) (544.56)
H Foreign Currency Monetary Item Translation DifferenceAccount (125.82) (605.38) (776.45)
I Equity Instruments through Other Comprehensive Income[Refer Note 33A I(ii)]Balance as at the beginning of the year (8,439.77) (8,080.18) -Addition/(deletion) during the year (730.19) (359.59) (8,080.18)Balance as at the end of the year (9,169.96) (8,439.77) (8,080.18)
NOTE - 12 OTHER EQUITY (Contd.) (` in Lakh)
As at As at As atMarch 31, 2017 March 31, 2016 April 1, 2015
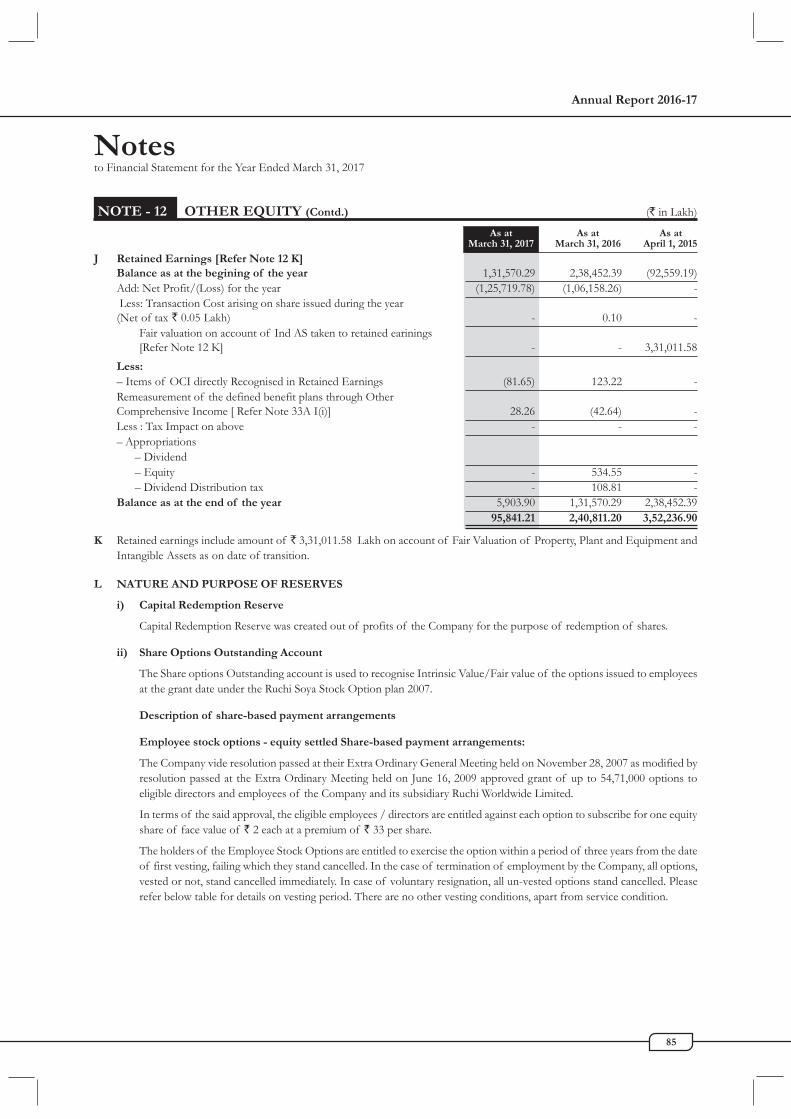
Annual Report 2016-17
85
Notesto Financial Statement for the Year Ended March 31, 2017
J Retained Earnings [Refer Note 12 K]Balance as at the begining of the year 1,31,570.29 2,38,452.39 (92,559.19)Add: Net Profit/(Loss) for the year (1,25,719.78) (1,06,158.26) - Less: Transaction Cost arising on share issued during the year(Net of tax ` 0.05 Lakh) - 0.10 -
Fair valuation on account of Ind AS taken to retained earinings[Refer Note 12 K] - - 3,31,011.58
Less:– Items of OCI directly Recognised in Retained Earnings (81.65) 123.22 -Remeasurement of the defined benefit plans through OtherComprehensive Income [ Refer Note 33A I(i)] 28.26 (42.64) -Less : Tax Impact on above - - -– Appropriations
– Dividend– Equity - 534.55 -– Dividend Distribution tax - 108.81 -
Balance as at the end of the year 5,903.90 1,31,570.29 2,38,452.3995,841.21 2,40,811.20 3,52,236.90
K Retained earnings include amount of ` 3,31,011.58 Lakh on account of Fair Valuation of Property, Plant and Equipment andIntangible Assets as on date of transition.
L NATURE AND PURPOSE OF RESERVES
i) Capital Redemption Reserve
Capital Redemption Reserve was created out of profits of the Company for the purpose of redemption of shares.
ii) Share Options Outstanding Account
The Share options Outstanding account is used to recognise Intrinsic Value/Fair value of the options issued to employeesat the grant date under the Ruchi Soya Stock Option plan 2007.
Description of share-based payment arrangements
Employee stock options - equity settled Share-based payment arrangements:
The Company vide resolution passed at their Extra Ordinary General Meeting held on November 28, 2007 as modified byresolution passed at the Extra Ordinary Meeting held on June 16, 2009 approved grant of up to 54,71,000 options toeligible directors and employees of the Company and its subsidiary Ruchi Worldwide Limited.
In terms of the said approval, the eligible employees / directors are entitled against each option to subscribe for one equityshare of face value of ` 2 each at a premium of ` 33 per share.
The holders of the Employee Stock Options are entitled to exercise the option within a period of three years from the dateof first vesting, failing which they stand cancelled. In the case of termination of employment by the Company, all options,vested or not, stand cancelled immediately. In case of voluntary resignation, all un-vested options stand cancelled. Pleaserefer below table for details on vesting period. There are no other vesting conditions, apart from service condition.
NOTE - 12 OTHER EQUITY (Contd.) (` in Lakh)
As at As at As atMarch 31, 2017 March 31, 2016 April 1, 2015
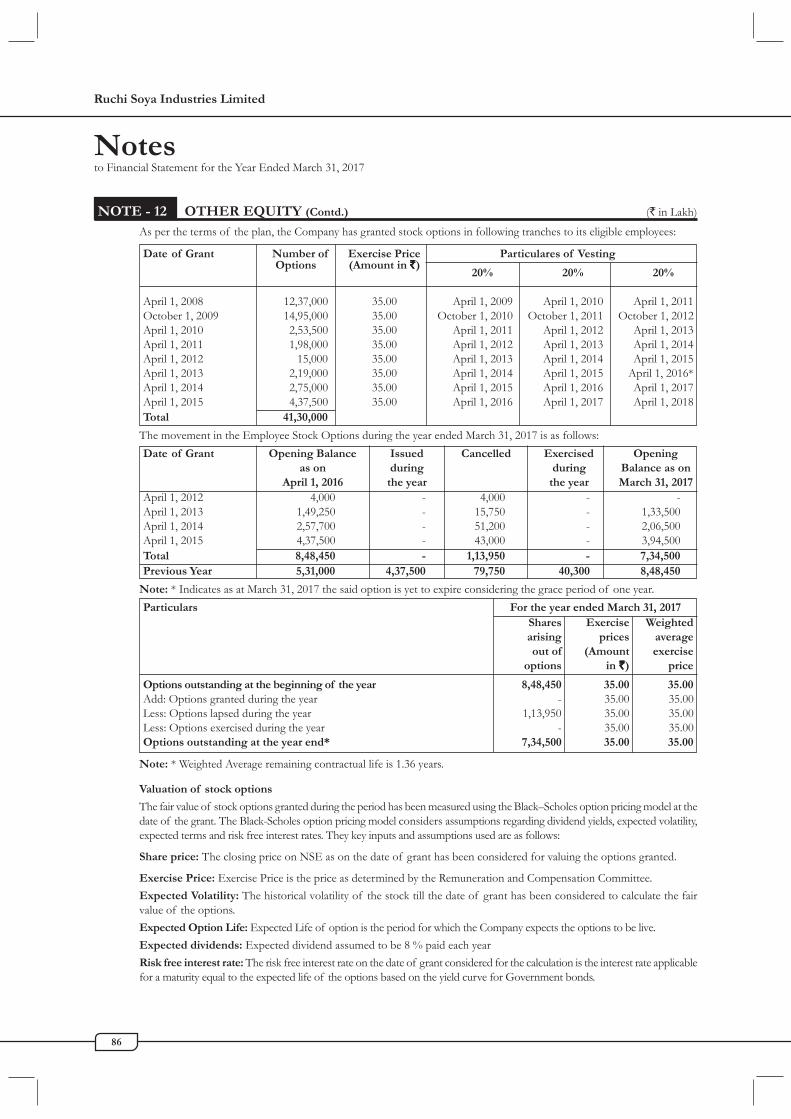
Ruchi Soya Industries Limited
86
Notesto Financial Statement for the Year Ended March 31, 2017
As per the terms of the plan, the Company has granted stock options in following tranches to its eligible employees:
Date of Grant Number of Exercise Price Particulares of VestingOptions (Amount in `̀̀̀̀)
20% 20% 20%
April 1, 2008 12,37,000 35.00 April 1, 2009 April 1, 2010 April 1, 2011October 1, 2009 14,95,000 35.00 October 1, 2010 October 1, 2011 October 1, 2012April 1, 2010 2,53,500 35.00 April 1, 2011 April 1, 2012 April 1, 2013April 1, 2011 1,98,000 35.00 April 1, 2012 April 1, 2013 April 1, 2014April 1, 2012 15,000 35.00 April 1, 2013 April 1, 2014 April 1, 2015April 1, 2013 2,19,000 35.00 April 1, 2014 April 1, 2015 April 1, 2016*April 1, 2014 2,75,000 35.00 April 1, 2015 April 1, 2016 April 1, 2017April 1, 2015 4,37,500 35.00 April 1, 2016 April 1, 2017 April 1, 2018Total 41,30,000
The movement in the Employee Stock Options during the year ended March 31, 2017 is as follows:Date of Grant Opening Balance Issued Cancelled Exercised Opening
as on during during Balance as onApril 1, 2016 the year the year March 31, 2017
April 1, 2012 4,000 - 4,000 - -April 1, 2013 1,49,250 - 15,750 - 1,33,500April 1, 2014 2,57,700 - 51,200 - 2,06,500April 1, 2015 4,37,500 - 43,000 - 3,94,500Total 8,48,450 - 1,13,950 - 7,34,500Previous Year 5,31,000 4,37,500 79,750 40,300 8,48,450
Note: * Indicates as at March 31, 2017 the said option is yet to expire considering the grace period of one year.Particulars For the year ended March 31, 2017
Shares Exercise Weightedarising prices averageout of (Amount exercise
options in `̀̀̀̀) price
Options outstanding at the beginning of the year 8,48,450 35.00 35.00Add: Options granted during the year - 35.00 35.00Less: Options lapsed during the year 1,13,950 35.00 35.00Less: Options exercised during the year - 35.00 35.00Options outstanding at the year end* 7,34,500 35.00 35.00
Note: * Weighted Average remaining contractual life is 1.36 years.
Valuation of stock options
The fair value of stock options granted during the period has been measured using the Black–Scholes option pricing model at thedate of the grant. The Black-Scholes option pricing model considers assumptions regarding dividend yields, expected volatility,expected terms and risk free interest rates. They key inputs and assumptions used are as follows:
Share price: The closing price on NSE as on the date of grant has been considered for valuing the options granted.
Exercise Price: Exercise Price is the price as determined by the Remuneration and Compensation Committee.Expected Volatility: The historical volatility of the stock till the date of grant has been considered to calculate the fairvalue of the options.Expected Option Life: Expected Life of option is the period for which the Company expects the options to be live.Expected dividends: Expected dividend assumed to be 8 % paid each yearRisk free interest rate: The risk free interest rate on the date of grant considered for the calculation is the interest rate applicablefor a maturity equal to the expected life of the options based on the yield curve for Government bonds.
NOTE - 12 OTHER EQUITY (Contd.) (` in Lakh)
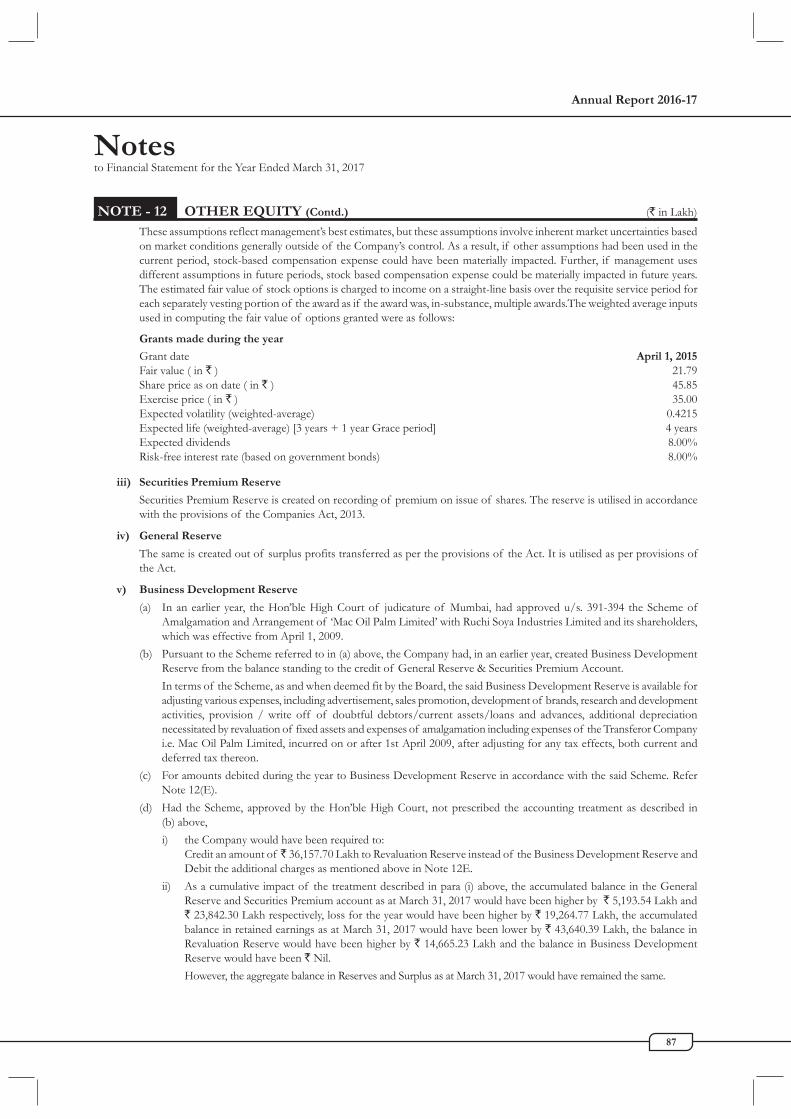
Annual Report 2016-17
87
Notesto Financial Statement for the Year Ended March 31, 2017
These assumptions reflect management’s best estimates, but these assumptions involve inherent market uncertainties basedon market conditions generally outside of the Company’s control. As a result, if other assumptions had been used in thecurrent period, stock-based compensation expense could have been materially impacted. Further, if management usesdifferent assumptions in future periods, stock based compensation expense could be materially impacted in future years.The estimated fair value of stock options is charged to income on a straight-line basis over the requisite service period foreach separately vesting portion of the award as if the award was, in-substance, multiple awards.The weighted average inputsused in computing the fair value of options granted were as follows:
Grants made during the year
Grant date April 1, 2015Fair value ( in ` ) 21.79Share price as on date ( in ` ) 45.85Exercise price ( in ` ) 35.00Expected volatility (weighted-average) 0.4215Expected life (weighted-average) [3 years + 1 year Grace period] 4 yearsExpected dividends 8.00%Risk-free interest rate (based on government bonds) 8.00%
iii) Securities Premium Reserve
Securities Premium Reserve is created on recording of premium on issue of shares. The reserve is utilised in accordancewith the provisions of the Companies Act, 2013.
iv) General Reserve
The same is created out of surplus profits transferred as per the provisions of the Act. It is utilised as per provisions ofthe Act.
v) Business Development Reserve
(a) In an earlier year, the Hon’ble High Court of judicature of Mumbai, had approved u/s. 391-394 the Scheme ofAmalgamation and Arrangement of ‘Mac Oil Palm Limited’ with Ruchi Soya Industries Limited and its shareholders,which was effective from April 1, 2009.
(b) Pursuant to the Scheme referred to in (a) above, the Company had, in an earlier year, created Business DevelopmentReserve from the balance standing to the credit of General Reserve & Securities Premium Account.In terms of the Scheme, as and when deemed fit by the Board, the said Business Development Reserve is available foradjusting various expenses, including advertisement, sales promotion, development of brands, research and developmentactivities, provision / write off of doubtful debtors/current assets/loans and advances, additional depreciationnecessitated by revaluation of fixed assets and expenses of amalgamation including expenses of the Transferor Companyi.e. Mac Oil Palm Limited, incurred on or after 1st April 2009, after adjusting for any tax effects, both current anddeferred tax thereon.
(c) For amounts debited during the year to Business Development Reserve in accordance with the said Scheme. ReferNote 12(E).
(d) Had the Scheme, approved by the Hon’ble High Court, not prescribed the accounting treatment as described in(b) above,i) the Company would have been required to:
Credit an amount of ̀ 36,157.70 Lakh to Revaluation Reserve instead of the Business Development Reserve andDebit the additional charges as mentioned above in Note 12E.
ii) As a cumulative impact of the treatment described in para (i) above, the accumulated balance in the GeneralReserve and Securities Premium account as at March 31, 2017 would have been higher by ` 5,193.54 Lakh and` 23,842.30 Lakh respectively, loss for the year would have been higher by ` 19,264.77 Lakh, the accumulatedbalance in retained earnings as at March 31, 2017 would have been lower by ` 43,640.39 Lakh, the balance inRevaluation Reserve would have been higher by ` 14,665.23 Lakh and the balance in Business DevelopmentReserve would have been ` Nil.However, the aggregate balance in Reserves and Surplus as at March 31, 2017 would have remained the same.
NOTE - 12 OTHER EQUITY (Contd.) (` in Lakh)

Ruchi Soya Industries Limited
88
Notesto Financial Statement for the Year Ended March 31, 2017
vi) Capital Reserve
Capital Reserve amounting to ` 3,228.75 Lakh was created on :a) amalgamation with Palm tech India Ltd by ` 1,087.07 Lakh andb) On cancellation of share warrants issued in an earlier year to the promoter/promoter group on preferential basis by
` 2,241.69 Lakh.
vii) Hedging Reserve
Hedge Reserve is created out of Interest Rate Swaps taken by the Company. For Hedge Reserve details refer Note 44Hedge Accounting.
viii) Foreign Currency Monetary Item Transalation Difference Account
The Company has availed the exemption available under Para D13AA of Ind AS - 101 of “First time adoption of IndianAccounting Standards”. Accordingly, exchange gains and losses on foregin currency borrowings taken prior to April 1, 2016which are related to the acquisition or construction of qualifying assets are adjusted in the carrying cost of such asset.
ix) Equity Instruments through Other Comprehensive Income
The company has elected to recognise changes in fair value of certain class of investements in other comprehensiveincome. These faie value changes are accumulated within this reserve and shall be adjusted on derecognition of investment.
x) Retained Earnings
The same is created out of profits over the years and shall be utilised as per the provisions of the Act. [Refer Note 12K].
NOTE - 13a BORROWINGS (` in Lakh)
As at As at As atMarch 31, 2017 March 31, 2016 April 1, 2015
A Term Loans from Banks [Refer Note E(i), E(ii) and F below]Secured
– Rupee Loans - - -– Foreign Currency Loans - - -
B Long Term Maturity of Finance Lease Obligation - 25.49 40.90
C Deferred payment liabilitiesUnsecured
– Deferred Sales Tax Liability [Refer Note G below] 5,861.75 6,012.84 6,745.01
D Cumulative Redeemable Preference Shares [Refer Note H below]Unsecured
2,00,000 [FY 2015-2016 2,00,000 and April 1, 2015 2,00,000]of face value of ` 100 each fully paid-up 200.00 200.00 200.00
6,061.7 5 6,238.33 6,985.91
NOTE - 12 OTHER EQUITY (Contd.) (` in Lakh)

Annual Report 2016-17
89
Notesto Financial Statement for the Year Ended March 31, 2017
NO
TE
- 1
3aB
OR
RO
WIN
GS
(Con
td.)
(` in
Lak
h)
Ei)
Parti
cular
sIn
tere
stSe
curit
yYe
ar o
fTe
rms o
f Rep
aym
ent
Mar
ch 31
,M
arch
31,
Mar
ch 31
,Ra
teM
atur
ity in
2017
2016
2015
Fina
ncial
[Ref
er N
ote
Year
17a (
H)
Rupe
e Loa
ns
Term
Loan
from
Axis B
ank Li
mited
BBR+
2.5%
Secure
d by a
first p
ari pa
ssu ch
arge o
ver th
e mov
eable
2017
-2018
Repay
able i
n 18 E
qual q
uarter
ly inst
allment
s16
8.26
841.8
31,5
16.12
p.a.
fixed
assets
, facto
ry lan
d and
railw
ay sid
ing, b
othsta
rting a
t the e
nd of
9 mo
nths f
rom da
te of
presen
t & fu
ture, l
ocated
at D
urgaw
ati in
Bihar
andfirs
t disb
ursem
ent (c
omme
nced f
romper
sonal
guara
ntee o
f Mana
ging D
irecto
r of t
heFeb
ruary,
2013
) of t
he san
ction
ed am
ount
Comp
any.
amou
nt of
` 3,0
00 lak
hs.
Term
Loan
from
IDBI
Bank
Not a
pplica
bleSec
ured b
y a fir
st pari
passu
charg
e over
all th
e fixe
d20
15-20
16Re
payabl
e in 1
8 equ
al quar
terly
install
ments
--
1,222
.22ass
ets, b
oth pr
esent
and fu
ture, l
ocated
at H
aldia
(comm
enced
from
Septem
ber, 2
011)
of th
e(W
est Be
ngal),
Patalg
anga a
nd N
agpur
(Maha
rashtr
a)san
ction
ed am
ount
of `
10,00
0 lakh
s.tog
ether
with f
irst ex
clusiv
e char
ge on
the e
ntire
fixed
assets
, both
prese
nt and
futur
e, loca
ted at
Wash
im(M
aharas
htra)
and pe
rsonal
guara
ntee o
f Mana
ging
Direc
tor of
the C
ompan
y.
Term
loan
from
State
Bank
of In
diaMC
LR +
6.60
%a)
Secure
d by f
irst ex
clusiv
e char
ge on
mov
able a
nd20
18-20
19Re
payabl
e in 2
0 equ
al quar
terly
install
ments
2,605
.763,8
27.52
4,848
.66p.a
.im
movab
le fixe
d asse
ts of t
he Co
mpan
y’s un
it(co
mmenc
ed fro
m Ma
rch 20
14) o
f the
locate
d at V
illage
Bhuv
ad, Te
hsil A
njar,
sancti
oned
amou
nt of
‘ 6,50
0 lakh
s.Di
strict
Kutch
, Guja
rat.
b)Co
llatera
l Seco
nd ch
arge o
ver th
e enti
re cu
rrent
assets
inclu
ding s
tocks
of ra
w ma
terial
andfin
ished
good
s, rece
ivable
s and
other
curre
ntass
ets on
pari p
assu b
asis, w
ith ot
her te
rm len
ders
and pe
rsonal
guara
ntee o
f Mana
ging D
irecto
r of
the Co
mpany
.
Corpo
rate L
oan II
I from
Not a
pplica
bleSec
ured b
y a fir
st excl
usive
charge
over
the fix
ed20
15-20
16Re
payabl
e in 2
0 equ
al quar
terly
install
ments
-1,2
63.68
5,072
.39Sta
te Ba
nk of
India
assets
, both
prese
nt and
futur
e, at K
ota (R
ajasth
an),
(comm
enced
from
June 2
011)
of th
eCh
ennai (
Tami
l Nadu
) and
Shrig
angana
gar (R
ajasth
an)san
ction
ed am
ount
of `
25,00
0 lakh
s.and
first p
ari pa
ssu ch
arge o
ver th
e fixe
d asse
ts, bo
thpre
sent a
nd fu
ture, l
ocated
at H
aldia (
West B
engal),
Patalg
anga &
Nagp
ur (M
aharas
htra),
Mang
alore
(Karn
ataka)
and M
anglia
(Madh
ya Pra
desh).
Collat
eral: S
econd
charg
e over
the e
ntire
curren
t asse
tsinc
luding
stocks
of ra
w ma
terial,
finish
ed go
ods a
ndoth
er cur
rent a
ssets o
n pari
passu
basis
with
other
lender
s and
perso
nal gu
arante
e of M
anagin
g Dire
ctor

Ruchi Soya Industries Limited
90
Notesto Financial Statement for the Year Ended March 31, 2017
of th
e Com
pany.
Corpo
rate L
oan IV
from
MCLR
+ 6.
60%
a)Sec
ured b
y an E
xtensi
on of
exclu
sive f
irst ch
arge
2017
-2018
Repay
able i
n 20 e
qual q
uarter
ly ins
tallme
nts9,1
71.52
13,52
8.84
18,21
0.64
State
Bank
of In
dia p.
a.on
mov
able a
nd im
movab
le fixe
d asse
ts loc
ated a
t(co
mmenc
ed fro
m Jun
e 201
3) of
the
Shrig
angana
gar (R
ajasth
an), K
ota (R
ajasth
an) an
dsan
ction
ed am
ount
of `
30,00
0 lakh
s.Ch
ennai (
Tami
l Nadu
) and
exten
sion o
f first
pari
passu
charge
on m
ovabl
e and
immo
vable f
ixed
assets
locat
ed at
Haldi
a (We
st Ben
gal), M
angalo
re(K
arnata
ka) Pa
talgang
a & N
agpur
(Maha
rashtr
a),and
Mang
liya (M
adhya
Prades
h) and
b)Co
llatera
l Seco
nd ch
arge o
ver th
e enti
re cur
rent
assets
inclu
ding s
tocks
of ra
w ma
terial
and fin
ished
good
s rece
ivable
s and
other
curre
nt ass
ets on
pari
passu
basis,
with o
ther te
rm len
ders a
nd pe
rsonal
guara
ntee o
f Mana
ging D
irecto
r of t
he Co
mpan
y.
Corpo
rate L
oan V
from
MCLR
+ 6.
60%
a)Sec
ured b
y first
exclu
sive c
harge/
extens
ion of
2018
-19Re
payabl
e in 2
0 quar
terly
install
ments
17,36
4.33
22,02
1.68
27,71
1.14
State
Bank
of In
dia p.
a.exc
lusive
charg
e on m
ovabl
e and
immo
vable f
ixed
(comm
enced
from
June 2
014) o
f sanc
tioned
assets
of th
e Com
pany’s
unit l
ocated
atam
ount
of ` 3
0,000
lakh
s out
of tha
t first
Shrig
angang
ar A
69-70
& C
366-3
67, R
IICO
four in
stallm
ent sh
all be
` 1,00
0 lakh
s each
,Ud
yog V
ihar, K
ota RI
ICO
Indust
rial A
rea Bu
ndi,
next tw
elve i
nstallm
ents s
hall b
e of
Chenn
ai Ka
nniga
ipuer
Villag
e,Tala
lvali C
handa
` 1,50
0 lakh
s each
, and l
ast fo
urMa
ngliya
villag
e Ind
ore, M
angliya
install
ment
shall b
e of `
2,00
0 lakh
s each
.b)
Secure
d by E
xtensi
on of
first p
ari pa
ssu ch
arge o
nmo
vable a
nd im
movab
le fixe
d asse
ts of
the
Comp
any’s u
nit lo
cated
at Ha
ldia ,
Mang
alore
Bikam
pady I
ndutr
ial Ar
ea, Pa
talgang
a & N
agpur.
Collat
eral S
ecurity
: Seco
nd ch
arge o
ver th
e enti
recur
rent a
ssets i
nclud
ing sto
cks of
raw
mater
ial and
finish
ed go
ods, r
eceiva
bles a
nd ot
her cu
rrent
assets
on pa
ri pass
u basi
s, with
other
term
lender
s and
person
al gu
arante
e of M
anagin
g Dire
ctor o
f the
Comp
any.
Term
loan
from
State
Bank
of In
diaMC
LR +
6.60
%Sec
ured b
y a hy
pothe
cation
of (a
) Wind
powe
r20
25-26
Repay
able i
n 40 e
qual q
uarter
ly ins
tallme
nts4,8
00.00
5,605
.62-
p.a.
receiv
ables
of th
e Com
pany a
gainst
supp
ly of p
ower
(comm
enced
from
June 2
015) o
f sanc
tioned
from
the 22
.50 M
W win
d pow
er pro
ject a
t Pals
odi,
amou
nt of
` 6,00
0 lakh
sRa
tlam, M
adhya
Prades
h to M
P Pow
er tra
ding C
o.Lim
ited a
nd 2.
50 M
W Wi
nd po
wer p
roject
at Sh
inband
,
NO
TE
- 1
3aB
OR
RO
WIN
GS
(Con
td.)
(` in
Lak
h)
Parti
cular
sIn
tere
stSe
curit
yYe
ar o
fTe
rms o
f Rep
aym
ent
Mar
ch 31
,M
arch
31,
Mar
ch 31
,Ra
teM
atur
ity in
2017
2016
2015
Fina
ncial
[Ref
er N
ote
Year
17a (
H)

Annual Report 2016-17
91
Notesto Financial Statement for the Year Ended March 31, 2017
Dhule
, Maha
rashtr
a to M
aharas
htra s
tate e
lectric
itydis
tributi
on Co
mpany
Limi
ted an
d (b)
The m
ovabl
efix
ed ass
ets of
the c
ompan
y rela
ting a
nd pe
rtaini
ng to
the 22
.50 M
W win
d pow
er pro
ject a
t Pals
odi, R
atlam,
Madh
ya Pra
desh a
nd 2.
50 M
W win
dpow
er pro
ject a
tSh
indbad
, Dhu
le, Ma
harast
ra and
perso
nal gu
arante
e of
Manag
ing D
irecto
r of t
he Co
mpany
.
Fore
ign
Curre
ncy L
oans
ECB I
in fo
reign
curre
ncy fro
mNo
t app
licable
Secure
d by a
first c
harge
over
the fix
ed ass
ets, b
oth20
15-16
Repay
able i
n 5 se
mi an
nual i
nstallm
ents
--
3,134
.00DB
S Bank
Ltd.
presen
t and
futur
e, of m
anufac
turing
units
at Gu
na(co
mmenc
ed fro
m Ap
ril, 20
13) o
f(M
adhya
Prades
h), D
aloda
(Madh
ya Pra
desh),
Baran
15%,
20%,
20%,
20%
& 25
% of
(Rajas
than)
and G
adarw
ara (M
adhya
Prades
h).san
ction
ed am
ount
of US
D 20
0.00 l
akhs
ECB I
I in fo
reign
curre
ncy fro
mLIB
OR 6
month
sSec
ured b
y a fir
st char
ge ov
er the
fixed
assets
, both
2016
-17Re
payabl
e in 6
semi
annu
al ins
tallme
nts6,5
53.57
8,092
.619,2
76.64
DBS B
ank Lt
d. +
290 b
ps p.a
.pre
sent a
nd fu
ture, o
f manu
factur
ing Re
finery
unit(s
)(co
mmenc
ed fro
m Sep
tember
, 201
4) of
at Ka
ndla (
Gujar
at).
13%,
13%,
13%,
13%
24%
& 24
% of
sancti
oned
amou
nt of
USD
200 l
akhs.
ECB I
II in
foreig
n curr
ency f
romLIB
OR 6
month
sSec
ured b
y a fir
st char
ge ov
er the
fixed
assets
, both
2017
-18Re
payabl
e in 5
semi
annu
al inst
allment
s16
,950.3
216
,583.2
318
,804.0
0DB
S Bank
Ltd.
+ 37
0 bps
p.a.
presen
t and
futur
e, of m
anufac
turing
units
at Gu
na(co
mmenc
ed fro
m Ma
rch, 2
016)
of(M
adhya
Prades
h), D
aloda
(Madh
ya Pra
desh),
Baran
16.66
%, 20
%, 20
%, 20
% &
23.34
% of
(Rajas
than),
Gada
rwara
(Madh
ya Pra
desh)
and Re
finery
sancti
oned
amou
nt of
USD
300 l
akhs.
unit(s
) at K
andla (
Gujar
at).
ECB I
in fo
reign
curre
ncy fro
mNo
t app
licable
Secure
d by a
first c
harge
over
the w
indmi
lls, bo
th20
15-16
Repay
able i
n 16 q
uaterl
y inst
allment
s-
994.9
93,7
60.80
Stand
ard Ch
artere
d Bank
presen
t & fu
ture, a
t Maliy
a Miya
na (G
ujarat
), Pipl
oda
(comm
enced
from
June, 2
012)
out o
f tha
t(M
adhya
Prades
h), Fa
tehgra
h (Ra
jastha
n), Sh
ergrah
first e
ight in
stallm
ents s
hall b
e 5%
&(Ra
jastha
n), &
Osiy
an (Ra
jastha
n).nex
t eigh
t insta
llment
shall
be 7.5
% of
sancti
oned
amou
nt of
USD
200 l
akhs.
ECB I
I in fo
reign
curre
ncy fro
mNo
t app
licable
Secure
d by a
first c
harge
over
the w
indmi
lls, bo
th20
15-16
Repay
able i
n 6 se
mi an
nual e
qual i
nstallm
ents
--
4,178
.67Sta
ndard
Chart
ered B
ankpre
sent &
futur
e,at P
iplod
a (Ma
dhya
Prades
h), Pa
lsodi
(comm
enced
from
June,
2013
) of
(Madh
ya Pra
desh)
& Fa
tehgra
h (Ra
jathan)
. sa
nction
ed am
ount
of US
D 20
0 lakh
.
ECB I
II in
foreig
n curr
ency f
romLIB
OR 3
month
sSec
ured b
y first
and e
xclusi
ve cha
rge on
mov
able f
ixed
2016
-17Re
payabl
e in 1
8 quar
terly
install
ments
3,364
.704,4
25.38
5,007
.58
NO
TE
- 1
3aB
OR
RO
WIN
GS
(Con
td.)
(` in
Lak
h)
Parti
cular
sIn
tere
stSe
curit
yYe
ar o
fTe
rms o
f Rep
aym
ent
Mar
ch 31
,M
arch
31,
Mar
ch 31
,Ra
teM
atur
ity in
2017
2016
2015
Fina
ncial
[Ref
er N
ote
Year
17a (
H)

Ruchi Soya Industries Limited
92
Notesto Financial Statement for the Year Ended March 31, 2017
Stand
ard Ch
artere
d Bank
+ 34
0 bps
p.a.
assets
, both
prese
nt and
futur
e, of r
efiner
y at K
akinad
a(co
mmenc
ed fro
m Jun
e, 201
2) of
sanct
ioned
( And
hra Pr
adesh)
.am
ount
of US
D 15
8.95 l
akh.
Long
Ter
m M
atur
ity O
fFi
nanc
e Le
ase
Obl
igat
ion
Vehic
le Lo
an fr
om H
DFC
Bank
9.51%
p.a.
Hypo
thec
ation
of ve
hicles
aquir
ed ou
t of
2018
-19Re
payab
le in 6
0 equ
al mon
thly in
stallm
ents
25.49
42.59
58.14
the s
aid lo
an(co
mmen
ced f
rom
July
2013
) of t
hesan
ction
ed am
ount
of `
81 la
kh.
Amor
tisat
ion
Of T
he U
pfro
ntFe
es A
s Per
Ind
AS(14
6.53)
(306.1
5)(44
1.05)
Tota
l Non
Cur
rent
Bor
row
ing
60,8
57.4
376
,921
.82
1,02,
359.
95
Less
: Cl
assi
fied
unde
r
Long
term
debt
s clas
sified
unde
r oth
er fin
ancia
l liab
ilities
[Refe
r Not
e 17 (
c)]36
,510.3
435
,849.4
762
,775.1
7
Curre
nt m
aturit
ies of
Long
term
debt
s [Re
fer N
ote 1
7 (c)]
22,49
5.70
40,76
4.54
39,04
6.30
Curre
nt m
aturit
ies of
finan
ce le
ase ob
ligati
ons [
Refer
Not
e 17 (
c)]25
.4917
.1017
.24
Inter
est ac
crued
[Refe
r Not
e 17 (
c)]1,8
25.90
265.2
248
0.34
Non
-cur
rent
bor
row
ings
as p
er b
alan
ce sh
eet
(0.00
)25
.4940
.90
BBR-
Ban
k Base
Rate
MCL
R-M
argina
l cos
t of f
unds
based
lend
ing R
ate
LIBO
R-Lo
ndon
Inter
bank
Offe
red R
ate
(ii)
The C
ompa
ny ha
s not
satis
fied d
ebt c
oven
ants
as pr
escrib
ed in
the b
ank a
greem
ents,
henc
e the
said
borro
wing
s are
classi
fied u
nder
Othe
r cur
rent f
inanc
ial lia
bilitie
s und
er No
te 17
c.
FD
urin
g th
e ye
ar, t
he C
ompa
ny h
as d
efau
lted
in re
paym
ent o
f th
e lo
ans w
hich
rem
aine
d ou
tsta
ndin
g, a
re a
s fol
low
s:
Part
icul
ars o
f Lo
ans
Bank
Nam
eAm
ount
of
cont
inui
ng d
efau
lt as
on
Mar
ch 3
1, 20
17 (`
in L
akh)
Due
dat
e
of P
rinci
pal A
mou
ntof
Inte
rest
acc
rued
for p
aym
ent
Term
Loan
State
Bank
of In
dia (C
TL -
IV)
3,000
.0017
1.51
Dece
mber
31, 2
016 a
nd M
arch 3
1, 20
17Te
rm Lo
anSta
te Ba
nk of
India
(CTL
- V)
3,000
.0036
4.32
Dece
mber
31, 2
016 a
nd M
arch 3
1, 20
17Te
rm Lo
anSta
te Ba
nk of
India
353.6
627
.10M
arch 3
1, 20
17Te
rm Lo
anDB
S Ban
k Ltd.
(ECB
III)
7,780
.6374
0.67
Sept
embe
r 6, 2
016 a
nd M
arch 6
, 201
7Te
rm Lo
anDB
S Ban
k Ltd.
(ECB
II)
6,224
.5132
9.07
Sept
embe
r 26,
2016
and M
arch 2
7, 20
17Te
rm Lo
anSta
ndard
Cha
rtered
Ban
k (EC
B III
)3,2
27.25
137.4
5Au
gust
1, 20
16 ; S
eptem
ber 1
, 201
6 and
Febr
uary
1, 20
17
Tota
l23
,586
.05
1,770
.13
NO
TE
- 1
3aB
OR
RO
WIN
GS
(Con
td.)
(` in
Lak
h)
Parti
cula
rsIn
tere
stSe
curit
yYe
ar o
fTe
rms o
f R
epay
men
tM
arch
31,
Mar
ch 3
1,M
arch
31,
Rat
eM
atur
ity in
2017
2016
2015
Fina
ncia
l[R
efer
Not
eYe
ar 17
a (H
)

Annual Report 2016-17
93
Notesto Financial Statement for the Year Ended March 31, 2017
G Deferred Payment Liability on account of Deferred Sales tax denotes interest free sales tax deferral under Schemes of StateGovernments of Andhra Pradesh & Tamil Nadu. The same are repayable in annual installments beginning from June 2014 incase of Andhra Pradesh and from August 2015 in case of Tamil Nadu .
H Rights, Preferences and Restrictions attached to shares(i) Preference Shares: 6% Non-Convertible Redeemable Cumulative Preference Shares of ` 100 each were issued pursuant to
the Scheme of Amalgamation and Arrangement between Sunshine Oleochem Limited, Ruchi Soya Industries Limited andtheir respective shareholders sanctioned by the Hon’ble High Court of judicature of Mumbai in an earlier year on the sameterms and conditions as originally issued by Sunshine Oleochem Limited.These preference shares are redeemable as follows:a) First installment of ` 33 per preference share on completion of 144 months from March 31, 2009.b) Second installment of ` 33 per preference share on completion of 156 months from March 31, 2009.c) Third installment of ` 34 per preference share on completion of 168 months from March 31, 2009.
(ii) Reconciliation of number of shares As at As at As atMarch 31, 2017 March 31, 2016 April 1, 2015
Preference SharesBalance at the beginning of the year 2,00,000.00 2,00,000.00 2,00,000.00Add:Shares issued during the year — — —Balance at the end of the year 2,00,000.00 2,00,000.00 2,00,000.00
Details of shares held by shareholders holding more than 5% Preference shares in the Company.
Particulars March 31, % March 31, % April 1, %2017 2016 2015
PREFERENCE SHARESRuchi Infrastructure Limited 2,00,000 100 2,00,000 100 2,00,000 100
NOTE - 13b OTHER FINANCIAL LIABILITIES (` in Lakh)
As at As at As atMarch 31, 2017 March 31, 2016 April 1, 2015
Derivative Liablity– Interest rate swaps [Refer Note 44] - 62.20 307.20Other liabilities - 18.33 18.33
- 80.53 325.53
NOTE - 14 PROVISIONS (` in Lakh)
As at As at As atMarch 31, 2017 March 31, 2016 April 1, 2015
A Provision for employee benefitsi) Gratuity - - -ii) Compensated absences - - -
B Others ProvisionsTaxation (net) - 232.64 318.87
- 232.64 318.87
NOTE - 15 DEFERRED TAX LIABILITIES (Net) (` in Lakh)
For the year endedMarch 31, 2017
Tax expenseA) Amounts recognised in Statement of profit and loss
For the year ended March 31, 2017Current income tax (Changes in estimates related to prior period ) -Tax for earlier years (299.93)
(299.93)
NOTE - 13a BORROWINGS (Contd.) (` in Lakh)

Ruchi Soya Industries Limited
94
Notesto Financial Statement for the Year Ended March 31, 2017
Deferred income tax liability /(asset), netOrigination and reversal of temporary differences (37,023.31)Others -Deferred tax expense (37,023.31)(A) Tax expense for the year charged to the statement of profit and loss (37,323.24)
B) Amounts recognised in Other Comprehensive IncomeFor the year ended March 31, 2017
Before tax Tax (expense) Net of taxbenefit
Items that will not be reclassified to profit or lossRemeasurements of the defined benefit plans 81.67 (28.26) 53.41Equity Instruments through Other Comprehensive Income (730.19) - (730.19)Items that will be reclassified to profit or loss -Fair Value Changes in hedge reserve (net) [Refer Note 12 G] 200.30 - 200.30(B) Total (448.22) (28.26) (476.48)
C) Total Tax expenses for the year (A+B) (37,294.98)
Reconciliation of effective tax rateFor the year ended
March 31, 2017The income tax expenses for the year can be reconciled to the accounting profit as follows:Profit before tax (1,63,043.02)Applicable Tax Rate 34.61%Computed Tax Expense (56,425.93)Tax effect of :Expenses disallowed 60,907.71Additional allowances (30,461.44)Current Tax (25,979.66)Current Tax Provision (A) -Tax for earlier years (B) (299.93)Incremental Deferred Tax Liability on account of Tangible and Intangible Assets (129.34)Incremental Deferred Tax Asset on account of Financial Assets and Other Items 36,865.71Deferred tax Provision (B) (36,995.05)Tax Expenses recognised in Statement of Profit and Loss (A+B) (37,294.98)
Effective Tax Rate 22.87%D) Movement in deferred tax balances
As at Recognised Recognised As at Deferred DeferredApril 1, 2016 in profit in OCI March 31, tax asset tax liability
or loss 2017Deferred Tax Liabilities 1,42,856.90 (129.34) 1,42,727.56 1,42,727.56
Depreciation 1,42,856.90 (129.34) 1,42,727.56 1,42,727.56Deferred Tax Assets (61,325.90) (36,893.97) 28.26 (98,191.61) 98,191.61Provision for doubtful
debts & advances (28,333.27) (47,334.16) (75,667.42) 75,667.42Unabsorbed Depreciation (7,024.31) (3,735.76) (10,760.07) 10,760.07Other timing differences (25,968.32) 14,175.94 28.26 (11,764.12) 11,764.12Net Deferred tax 81,531.00 (37,023.31) 28.26 44,535.95 98,191.61 1,42,727.56
The Company offsets tax assets and liabilities if and only if it has a legally enforceable right to set off current tax assets andcurrent tax liabilities and the deferred tax assets and deferred tax liabilities relate to income taxes levied by the same tax authority.Significant management judgement is required in determining provision for income tax, deferred income tax assets and liabilitiesand recoverability of deferred income tax assets. The recoverability of deferred income tax assets is based on estimates oftaxable income by each jurisdiction in which the relevant entity operates and the period over which deferred income tax assetswill be recovered.
NOTE - 15 DEFERRED TAX LIABILITIES (Net) (` in Lakh)

Annual Report 2016-17
95
Notesto Financial Statement for the Year Ended March 31, 2017
As at As at As atMarch 31, 2017 March 31, 2016 April 1, 2015
(a) Customers’ Advances [Refer Note 34(B)(b)(i) and 34(A)(c)(iv)] - 9,275.82 18,551.64(b) Government Grants - Deferred Income [Refer Note (i) below] 650.96 409.75 274.30(c) Other Liabilities [Refer Note (ii) below] 148.36 240.12 311.30
799.32 9,925.69 19,137.24Note:(i) Government Grants - Deferred Income
Opening Balance 440.29 293.23 293.23Grants during the year 300.00 165.98Less: Income recognised in statement of profit and loss[Refer Note 22(C)(iii)] 36.71 18.92
Closing balance 703.58 440.29 293.23
Classified under Non-Current Liabilities [Refer Note 16 (b)] 650.96 409.75 274.30Classified under Current Liabilities [Refer Note 18 (c)] 52.62 30.54 18.93
703.58 440.29 293.23(ii) Other liabilities include ` 5.87 Lakh [FY 2015-2016 ` 4.23 Lakh
and ` Nil] due to related parties. [Refer Note 41]
NOTE - 17a BORROWINGS (` in Lakh)
As at As at As atMarch 31, 2017 March 31, 2016 April 1, 2015
Loans repayable on demandA Secured
From BanksWorking Capital Loans 3,77,671.94 2,61,332.54 1,30,248.91From OthersWorking Capital Loans 21,285.45 - -
B UnsecuredFrom Banks/Financial Institutions [Refer Note F below] 56,634.69 1,80,258.70 1,80,489.57
4,55,592.08 4,41,591.24 3,10,738.48
C Particulars Interest Rate Security Terms of Repayment
Working Capital Loans from Export Packing Credit (Ranging First pari passu charge within the Working capital Consortium Member Repayable on demand during theConsortium BankLoans from 8.55% p.a. to 11.50% p.a.) banks over the current assets, both present and future, of the facility tenure of 12 months.
and other working capital loans Company and second pari passu charge within the Working capital(Ranging from 11.00% p.a. to Consortium Member banks over the movable and immovable fixed14.60% p.a.) assets, both present and future. Personal guarantee of promoter director/s.
Working Capital Loans from At mutually agreed rate on Specific charge on current assets financed by Repayable on demand during theDBS Bank each drawdown DBS Bank’s facility. Personal guarantee of promoter director. facility tenure of 12 months.Working Capital Loans from At mutually agreed rate on Exclusive charge on the current assets created by Repayable on demand during theEdelweiss Asset Reconstruction each drawdown IDFC Bank’s facility facility tenure of 12 months.Company Limited [EARCL](Availed from IDFC Bank Limitedand assigned by them to EARCL)Working Capital Loans from At mutually agreed rate on Specific charge on stocks and book debts for ` 2,000 Lakh Repayable on demand during theHDFC Bank each drawdown Personal Guarantee of Mr. Dinesh Shahra facility tenure of 12 months.Working Capital Loans from At mutually agreed rate on Specific charge on stocks and book debts. Personal Repayable on demand during theStandard Chartered Bank each drawdown Guarantee of Mr. Dinesh Shahra facility tenureof 12 months.
NOTE - 16 OTHERS NON CURRENT LIABILITIES (` in Lakh)

Ruchi Soya Industries Limited
96
Notesto Financial Statement for the Year Ended March 31, 2017
D Details of Loans Recalled
Particulars of Loans Faclity Recalled Amount as on Date of RecallMarch 31, 2017
(`̀̀̀̀ in Lakh)
DBS Bank Working Capital Facilities under 22,434.16 September 27, 2016multiple banking arrangement
IDFC Bank Working Capital Facilities under 21,285.45 May 19, 2016multiple banking arrangement
E During the year, the Company has defaulted in repayment of the loan which remain outstanding are as follows:
Particulars of Loans Bank Name Amount of continuing default Due date Amount paid Date of paymentas on March 31, 2017 (` in Lakh) for payment (` in Lakh)
of Principal of Interest [ReferAmount Note I below]
Export Packing Credit Various Banks 59,073.01 1,813.19 May 19, 2016 to February 28, 2017 1,361.26 April 3, 2017 to April 20, 2017Inland Letter of Credit Various Banks 29,785.16 338.38 October 25, 2016 to March 31, 2017 2,676.22 April 15, 2017 to April 21, 2017Foreign Bill Discounting Various Banks 4,591.661 100.38 August 2, 2016 to September 19, 2016 — —Buyers Credit Various Banks 82,175.38 4,073.19 August 8, 2016 to March 27, 2017 5,580.03 April 7, 2017 to April 19, 2017Foreign Letter of Credit Various Banks 90,536.28 4,866.12 May 10, 2016 to March 27, 2017 2,270.59 April 5, 2017 to April 10, 2017Short Term Loan Various Banks 15,687.84 1,169.98 May 7, 2016 to August 24, 2016 — —Total 281,849.32 12,361.24
F During the year, the Company has availed buyer’s credit. The amount of ̀ 56,634.69 lakh [FY 2015-2016 ̀ 1,46,288.25 lakh andApril 1, 2015 ` 1,50,489.57 lakh) outstanding on account of buyer’s credit as at March 31, 2017 is guaranteed by the banksagainst fixed deposits of ` Nil [FY 2015-2016 ` Nil, April 1, 2015 ` 41,450.30 lakh][Refer Note 8(c) and 8(d)] placed with themand earmarking against non fund based limit of ` 56,634.69 lakh [FY 2015-2016 ` 1,47,723.89 lakh and April 1, 2015`1,08,250.27 lakh].
G The working capital loans includes Bills drawn on customers and discounted by the company with banks amounting to ̀ 606.61lakh [FY 2015-2016 ` 32,405.48 lakh and April 1, 2015 ` 55,905.65 lakh] with recourse option.
H Confirmations from certain banks in respect of bank balances aggregating to ` 61,421.93 lakh have not been received byCompany from the banks in response to the requests sent. The account balances and the interest and other charges have beenaccounted on the basis of information available with the Company and the provisions of various sanction letters/agreementsavaliable.
I Includes amount of ` 6,072.31 lakh debited by bank in fund based facilities.
NOTE - 17b TRADE PAYABLES (` in Lakh)
As at As at As atMarch 31, 2017 March 31, 2016 April 1, 2015
– Due to Micro, Small and Medium Enterprises [Refer Note (i) below] 678.81 870.21 439.06– Due to Related parties [Refer Note 41] 57,258.20 65,065.20 1,56,665.87– Due to others [Refer Note (ii) below] 4,60,133.31 5,32,431.62 4,62,288.86
5,18,070.32 5,98,367.03 6,19,393.79
NOTE - 17a BORROWINGS (Contd.) (` in Lakh)

Annual Report 2016-17
97
Notesto Financial Statement for the Year Ended March 31, 2017
Note:i) The Company has identified (based on information available) certain suppliers as those registered under Micro,
Small and Medium Enterprises Development Act, 2006 (‘MSMED Act’). The disclosures pursuant to the MSMED Act areas follows:
As atMarch 31,2017 March 31,2016 April 1,2015
Principal amount due to suppliers registered under theMSMED Act and remaining unpaid as at year end 506.08 750.84 356.43Interest due to suppliers registered under the MSMED Act andremaining unpaid as at year end 172.73 119.38 82.63Principal amounts paid to suppliers registered under theMSMED Act, beyond the appointed day during the year 3,154.08 3,547.78 3,696.00Interest paid, under Section 16 of MSMED Act, to suppliersregistered under the MSMED Act, beyond the appointed dayduring the year - - -Interest paid, other than under Section 16 of MSMED Act,to suppliers registered under the MSMED Act, beyond theappointed day during the year - - -Interest due and payable towards suppliers registered under theMSMED Act, for payments already made 169.75 112.38 82.02Interest remaining due and payable for earlier years 119.38 82.63 55.60Amount of Interest due and payable for the period (where theprincipal has been paid but interest under theMSMED Act, 2006 not paid) 50.37 29.75 26.42
ii) Due to others includes Bills Payable amounting to ` 53,978.68 lakh [FY 2015-2016 ` 30,894.56 lakh and April 1, 2015` 54,249.89 lakh]. [Secured against first pari passu charge on current assets of the Company, second pari passu charge onmovable and immovable fixed assets and personal guarantee of promoter director/(s) among working capital consortiummember banks].
NOTE - 17c OTHER FINANCIAL LIABILITIES (` in Lakh)
As at As at As atMarch 31, 2017 March 31, 2016 April 1, 2015
Term Loans from Banks - Secured[Reclassified from non- current borrowings - Refer Note 13a E(ii)]
– Rupee Loans 19,329.77 4,799.83 10,765.10– Foreign Currency Loans 17,180.57 31,049.64 52,010.07
Current maturities of long-term debt– From Banks 22,495.70 40,764.54 39,046.30– From State Government 151.09 732.18 460.35
Current Maturities of finance lease obligations 25.49 17.10 17.24Derivative Liablity
– Commodity Future Contracts - - 479.90– Foreign exchange forward contract - 3,649.04 1,042.65– Foreign curreny options - 411.22 49.22– Interest rate swaps - 138.10 237.36– Commodity Contracts 1,194.92 62,120.14 50,922.81
Interest accrued 12,100.61 1,623.81 1,668.95Unclaimed Dividends [Refer Note (i) below] 31.98 38.50 41.55Agency & Other Deposits 1,078.74 1,500.92 1,206.48Customers’ Advances [Refer Note (ii) below] 1,07,554.28 18,681.60 -
NOTE - 17b TRADE PAYABLES (Contd.) (` in Lakh)

Ruchi Soya Industries Limited
98
Notesto Financial Statement for the Year Ended March 31, 2017
Unamortised Guarantee commission 139.30 509.19 -Others 1,349.20 1,503.89 1,011.87Non-Trade payablesCreditors for capital expenditure 89.96 207.53 856.88Others [Refer note (iii) below] 337.86 185.88 120.06
1,83,059.47 1,67,933.11 1,59,936.79Note:i) There are no amounts due for payment to the Investor Education and Protection Fund under Section 125 of the Companies
Act, 2013 as at the year end.ii) As the Company has not exported goods as per the agreement, these customer advances are now repayable and hence are
classified as financial liability. [ Refer Note 34 B(b)(i)]iii) Non-Trade payables include ` 125.70 lakh [FY 2015-2016 ` 95.48 lakh and April 1, 2015 ` Nil] due to Related parties.
[Refer Note 41]
NOTE - 18 OTHER CURRENT LIABILITIES (` in Lakh)
As at As at As atMarch 31, 2017 March 31, 2016 April 1, 2015
(a) Customers’ Advances 7,336.11 79,008.77 1,23,171.58(b) Other liabilities [Refer Note (i) below] 6,642.80 11,727.62 9,225.54(c) Government Grant - Deferred Income [Refer Note 16 (b) and 22(C)(iii))] 52.62 30.54 18.93
14,031.53 90,766.93 1,32,416.05Note:i) Other liabilities include ` 10.84 lakh [FY 2015-2016 ` 4.13 lakh and April 1, 2015 ` Nil] due to related parties.
[Refer Note 41]
NOTE - 19 PROVISIONS (` in Lakh)
As at As at As atMarch 31, 2017 March 31, 2016 April 1, 2015
i) Provision for Gratuity - 249.12 222.14ii) Provision for Compensated absences 849.63 958.35 768.75iii) Provision for Dividend payable - - 12.00
849.63 1,207.47 1,002.89
The Company contributes to the following post-employment defined benefit plans in India.A Defined Contribution Plans:
The Company has certain defined contribution plans. Contributions are made to provident fund in India for employees atthe specified rate as per regulations. The contributions are made to registered provident fund administered by the Governmentof India. The obligation of the Company is limited to the amount contributed and it Company has no further contractualor any constructive obligation. The Company has recognised ̀ 785.47 lakh [FY 2015-2016 ̀ 933.95 lakh] towards contributionto Provident Fund and ` 67.65 lakh [FY 2015-2016 ` 68.94 lakh] towards Employee State Insurance in Profit and Lossaccount.
NOTE - 17c OTHER FINANCIAL LIABILITIES (Contd.) (` in Lakh)
As at As at As atMarch 31, 2017 March 31, 2016 April 1, 2015

Annual Report 2016-17
99
Notesto Financial Statement for the Year Ended March 31, 2017
B Defined Benefit Plan:
a) Gratuity
The Company provides for gratuity for employees in India as per the Payment of Gratuity Act, 1972. Employees whoare in continous service for a period of 5 years are eligible for gratuity. The amount of gratuity payable on retirement/termination/resignation is paid as per the provision sof the Payment of Gratuity Act, 1972. The gratuity plan is afunded plan and Company makes annual contributions to the Group Gratuity cum Life Assurance Schemes administeredby the LIC of India, a funded defined benefit plan for qualifying employees.The most recent actuarial valuation of plan assets and the present value of the defined benefit obligation for gratuitywere carried out as at March 31, 2017. The present value of the defined benefit obligations and the related currentservice cost and past service cost, were measured using the Projected Unit Credit Method.
b) Leave Obligations
The leave obligations cover the Company’s liability for casual, sick & earned leave. The amount of the provision ispresented as current, since the Company does not have an unconditional right to defer settlement for any of theseobligations. However, based on past experience, the Company does not expect all employees to take the full amount ofaccrued leave or require payment within the next 12 months.Based on the actuarial valuation obtained in this respect, the following table sets out the status of the gratuity plan andthe amounts recognised in the Company’s financial statements as at balance sheet date:
(`̀̀̀̀ in Lakh)March 31, 2017 March 31, 2016 April 1, 2015
Gratuity Leave Gratuity Leave Gratuity LeaveEncashment Encashment Encashment
Defined benefit obligation 2,114.21 908.53 2,208.92 1,012.15 1,852.60 818.39Fair value of plan assets 2,235.04 58.90 1,959.80 53.80 1,630.46 49.64Net defined benefit(obligation)/assets 120.82 (849.63) (249.12) (958.35) (222.14) (768.75)Non-current - - - - - -Current [Refer Note 9(a) & 19 (i) and (ii)] 120.82 (849.63) (249.12) (958.35) (222.14) (768.75)
B. Movement in net defined benefit (asset) liabilityThe following table shows a reconciliation from the opening balances to the closing balances for net defined benefit (asset)liability and its components
(`̀̀̀̀ in Lakh)March 31, 2017 March 31, 2016 April 1, 2015
Gratuity Leave Gratuity Leave Gratuity LeaveEncashment Encashment Encashment
Defined benefit obligationsOpening balance 2,208.92 1,012.15 1,852.60 818.39 1,316.53 675.85Included in profit or loss - - - - 20.71 13.27Current service cost 215.74 170.79 195.05 108.78 143.45 113.34Past service costInterest cost (income) 173.62 79.55 147.28 65.06 123.10 63.19
2,598.28 1,262.49 2,194.93 992.23 1,603.78 865.65Included in OCIRemeasurement loss (gain):Actuarial loss (gain) due to:Demographic assumptions (31.79) 33.60 (5.74) 11.35 12.14 (46.04)Financial assumptions 103.15 29.95 17.01 7.22 207.76 89.47Experience adjustment (153.25) (410.79) 121.10 5.89 115.01 (85.62)Return on plan assets excluding interest income
2,516.40 915.25 2,327.30 1,016.68 1,938.70 823.46OtherContributions paid by the employer - - - - -Benefits paid (402.19) (6.72) (118.38) (4.54) (86.10) (5.07)Closing balance 2,114.21 908.53 2,208.92 1,012.15 1,852.60 818.39
NOTE - 19 PROVISIONS (Contd.) (` in Lakh)

Ruchi Soya Industries Limited
100
Notesto Financial Statement for the Year Ended March 31, 2017
March 31, 2017 March 31, 2016 April 1, 2015Gratuity Leave Gratuity Leave Gratuity Leave
Encashment Encashment EncashmentFair value of plan assetOpening balance 1,959.80 53.80 1,630.46 49.64 1,353.60 46.32Included in profit or loss - - - - 27.01 -Interest income 154.04 4.23 129.62 3.95 117.76 4.03
2,113.84 58.03 1,760.08 53.59 1,498.37 50.35Included in OCIRemeasurement gain (loss):Actuarial gain (loss) due to:Demographic assumptionsFinancial assumptionsExperience adjustment (0.21) 0.35 9.15 0.51 6.84 (0.25)Return on plan assets excluding interest income
2,113.62 58.38 1,769.23 54.10 1,505.21 50.10OtherContributions paid by the employer 523.60 7.24 308.93 4.24 211.35 4.61Benefits paid (402.19) (6.72) (118.37) (4.54) (86.10) (5.07)Closing balance 2,235.04 58.90 1,959.80 53.80 1,630.46 49.64Represented byNet defined benefit assets 120.82 - - - - -Net defined benefit liability - 849.63 249.12 958.35 222.14 768.75
Expense recognised in Statement ofProfit and LossCurrent service cost 215.74 170.79 195.05 108.78 143.45 113.34Net Interest cost 19.58 75.33 17.66 61.12 5.33 59.16Actuarial (gain)/loss on obligation for the period - (347.59) - 23.94 328.08 (41.94)Expense recognised in Statement ofProfit and Loss 235.32 (101.48) 212.71 193.83 476.86 130.56Expense recognised inOther Comprehensive Income (OCI)Actuarial (gain)/loss on obligation for the period (81.86) - 132.37 - - -Return on plan assets excluding interest income 0.21 - (9.15) - - -Net (Income)/Expense for the periodrecognized in OCI [Refer Note 33 A (I) (i)] (81.65) - 123.22 - - -
C. Plan assetsPlan assets comprise the following
March 31, 2017 March 31, 2016 April 1, 2015Gratuity Leave Gratuity Leave Gratuity Leave
Encashment Encashment Encashment
Investment in LIC IndiaInsurer managed fund (100%) 2,235.04 58.90 1,959.80 53.80 1,630.46 49.64
2,235.04 58.90 1,959.80 53.80 1,630.46 49.64
NOTE - 19 PROVISIONS (Contd.) (` in Lakh)
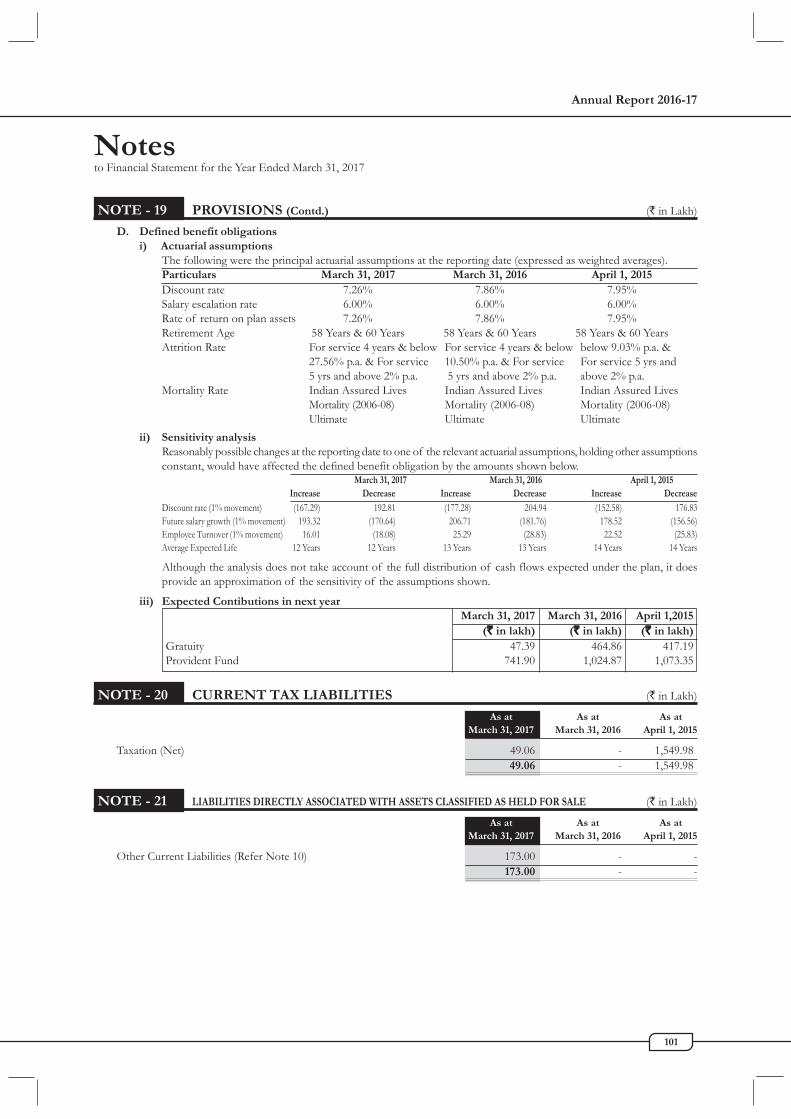
Annual Report 2016-17
101
Notesto Financial Statement for the Year Ended March 31, 2017
D. Defined benefit obligationsi) Actuarial assumptions
The following were the principal actuarial assumptions at the reporting date (expressed as weighted averages).Particulars March 31, 2017 March 31, 2016 April 1, 2015Discount rate 7.26% 7.86% 7.95%Salary escalation rate 6.00% 6.00% 6.00%Rate of return on plan assets 7.26% 7.86% 7.95%Retirement Age 58 Years & 60 Years 58 Years & 60 Years 58 Years & 60 YearsAttrition Rate For service 4 years & below For service 4 years & below below 9.03% p.a. &
27.56% p.a. & For service 10.50% p.a. & For service For service 5 yrs and5 yrs and above 2% p.a. 5 yrs and above 2% p.a. above 2% p.a.
Mortality Rate Indian Assured Lives Indian Assured Lives Indian Assured LivesMortality (2006-08) Mortality (2006-08) Mortality (2006-08)Ultimate Ultimate Ultimate
ii) Sensitivity analysisReasonably possible changes at the reporting date to one of the relevant actuarial assumptions, holding other assumptionsconstant, would have affected the defined benefit obligation by the amounts shown below.
March 31, 2017 March 31, 2016 April 1, 2015Increase Decrease Increase Decrease Increase Decrease
Discount rate (1% movement) (167.29) 192.81 (177.28) 204.94 (152.58) 176.83Future salary growth (1% movement) 193.32 (170.64) 206.71 (181.76) 178.52 (156.56)Employee Turnover (1% movement) 16.01 (18.08) 25.29 (28.83) 22.52 (25.83)Average Expected Life 12 Years 12 Years 13 Years 13 Years 14 Years 14 Years
Although the analysis does not take account of the full distribution of cash flows expected under the plan, it doesprovide an approximation of the sensitivity of the assumptions shown.
iii) Expected Contibutions in next yearMarch 31, 2017 March 31, 2016 April 1,2015
(`̀̀̀̀ in lakh) (`̀̀̀̀ in lakh) (`̀̀̀̀ in lakh)Gratuity 47.39 464.86 417.19Provident Fund 741.90 1,024.87 1,073.35
NOTE - 20 CURRENT TAX LIABILITIES (` in Lakh)
As at As at As atMarch 31, 2017 March 31, 2016 April 1, 2015
Taxation (Net) 49.06 - 1,549.9849.06 - 1,549.98
NOTE - 21 LIABILITIES DIRECTLY ASSOCIATED WITH ASSETS CLASSIFIED AS HELD FOR SALE (` in Lakh)
As at As at As atMarch 31, 2017 March 31, 2016 April 1, 2015
Other Current Liabilities (Refer Note 10) 173.00 - -173.00 - -
NOTE - 19 PROVISIONS (Contd.) (` in Lakh)
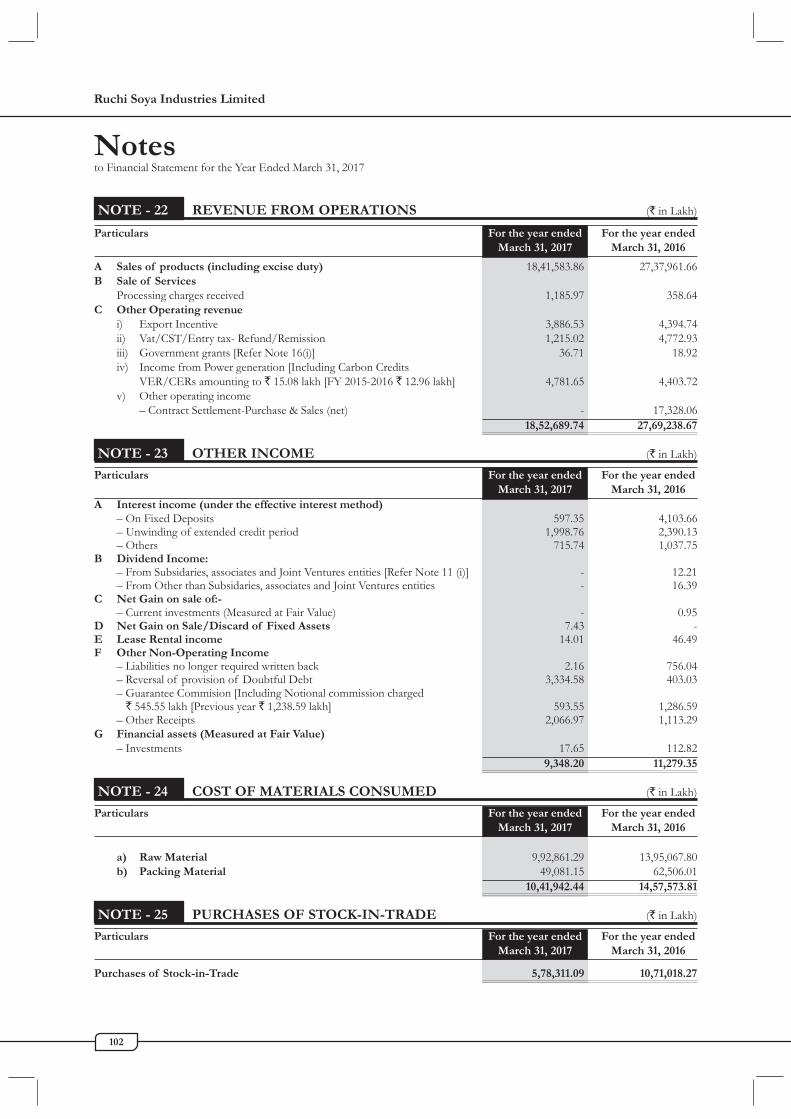
Ruchi Soya Industries Limited
102
Notesto Financial Statement for the Year Ended March 31, 2017
Particulars For the year ended For the year endedMarch 31, 2017 March 31, 2016
A Sales of products (including excise duty) 18,41,583.86 27,37,961.66B Sale of Services
Processing charges received 1,185.97 358.64C Other Operating revenue
i) Export Incentive 3,886.53 4,394.74ii) Vat/CST/Entry tax- Refund/Remission 1,215.02 4,772.93iii) Government grants [Refer Note 16(i)] 36.71 18.92iv) Income from Power generation [Including Carbon Credits
VER/CERs amounting to ` 15.08 lakh [FY 2015-2016 ` 12.96 lakh] 4,781.65 4,403.72v) Other operating income
– Contract Settlement-Purchase & Sales (net) - 17,328.0618,52,689.74 27,69,238.67
NOTE - 23 OTHER INCOME (` in Lakh)
Particulars For the year ended For the year endedMarch 31, 2017 March 31, 2016
A Interest income (under the effective interest method)– On Fixed Deposits 597.35 4,103.66– Unwinding of extended credit period 1,998.76 2,390.13– Others 715.74 1,037.75
B Dividend Income:– From Subsidaries, associates and Joint Ventures entities [Refer Note 11 (i)] - 12.21– From Other than Subsidaries, associates and Joint Ventures entities - 16.39
C Net Gain on sale of:-– Current investments (Measured at Fair Value) - 0.95
D Net Gain on Sale/Discard of Fixed Assets 7.43 -E Lease Rental income 14.01 46.49F Other Non-Operating Income
– Liabilities no longer required written back 2.16 756.04– Reversal of provision of Doubtful Debt 3,334.58 403.03– Guarantee Commision [Including Notional commission charged
` 545.55 lakh [Previous year ` 1,238.59 lakh] 593.55 1,286.59– Other Receipts 2,066.97 1,113.29
G Financial assets (Measured at Fair Value)– Investments 17.65 112.82
9,348.20 11,279.35
NOTE - 24 COST OF MATERIALS CONSUMED (` in Lakh)
Particulars For the year ended For the year endedMarch 31, 2017 March 31, 2016
a) Raw Material 9,92,861.29 13,95,067.80b) Packing Material 49,081.15 62,506.01
10,41,942.44 14,57,573.81
NOTE - 25 PURCHASES OF STOCK-IN-TRADE (` in Lakh)
Particulars For the year ended For the year endedMarch 31, 2017 March 31, 2016
Purchases of Stock-in-Trade 5,78,311.09 10,71,018.27
NOTE - 22 REVENUE FROM OPERATIONS (` in Lakh)

Annual Report 2016-17
103
Notesto Financial Statement for the Year Ended March 31, 2017
NOTE - 26 CHANGES IN INVENTORIES OF FINISHED GOODS, WORK-IN-PROGRESS AND STOCK IN TRADE (` in Lakh)
Particulars For the year ended For the year endedMarch 31, 2017 March 31, 2016
Finished goodsOpening Stock 83,377.53 1,01,315.39Closing Stock 55,050.00 83,377.53
28,327.53 17,937.86Work-in-progressOpening Stock 1,042.39 1,643.22Closing Stock 478.43 1,042.39
563.96 600.83Traded goodsOpening Stock 2,436.98 13,886.25Closing Stock 1,103.26 2,436.98
1,333.72 11,449.2730,225.21 29,987.96
NOTE - 27 EMPLOYEE BENEFITS EXPENSE (` in Lakh)
Particulars For the year ended For the year endedMarch 31, 2017 March 31, 2016
Salary, Wages and Bonus 16,788.03 18,708.88Contribution to Provident and Other Funds 864.79 1,022.49Gratuity [Refer Note 19(i)] 252.24 230.55Leave Compensation Absences [Refer Note 19(ii)] 220.43 399.51Employee Stock Option Scheme (ESOP) [Refer Note 12 L(ii)] 11.48 13.07Staff Welfare expenses 530.07 664.79
18,667.04 21,039.29
NOTE - 28 FINANCE COSTS (` in Lakh)
Particulars For the year ended For the year endedMarch 31, 2017 March 31, 2016
Interest Expense [Refer Note 3(a)(i)(a)] 79,422.61 48,397.59Other borrowing costs 462.66 692.51Exchange differences 3,336.00 72,953.27
83,221.27 1,22,043.37
NOTE - 29 DEPRECIATION, AMORTISATION AND IMPAIRMENT EXPENSE (` in Lakh)
Particulars For the year ended For the year endedMarch 31, 2017 March 31, 2016
Depreciation and Impairment on Property, Plant and Equipment 15,502.99 15,904.53Amortisation of Intangible assets 102.56 117.75
15,605.55 16,022.28
NOTE - 30 PROVISION FOR DOUBTFUL DEBTS AND ADVANCES (INCLUDING BAD DEBTS WRITTEN OFF) (` in Lakh)
Particulars For the year ended For the year endedMarch 31, 2017 March 31, 2016
Provision for Doubtful Debts 1,21,651.56 25,358.58Provision for Advances 2,422.06 92.85Bad debts written off 6,223.85 -
1,30,297.47 25,451.43

Ruchi Soya Industries Limited
104
Note:(a) As per Ind AS -109 on Financial Instruments the Company has applied Expected credit loss model for determining the
provision for trade receivable based on the weighted average of credit losses with respective risks of defaults occurring asweights.
(b) Excludes ` 16,074.41 lakh [FY 2015-2016 ` 514.84 lakh] on account of Provision/(Reversal of provision) for doubtfuldebts and doubtful advances (net of deferred tax) and Excludes ` Nil [FY 2015-2016 ` 116.08 lakh] on account of Baddebts and advances written off (net of current tax) debited to Business Development Reserve.[Refer Note 12 E].
NOTE - 31 OTHER EXPENSES (` in Lakh)
Particulars For the year ended For the year endedMarch 31, 2017 March 31, 2016
Manufacturing ExpensesManufacturing expenses 8,313.24 11,005.44Consumables 6,478.30 8,123.75Consumption of Stores & Spares parts 4,124.90 6,540.07Power & Fuel (net of recoveries) 14,658.94 21,741.41Lease Rental expenses (net of recoveries) 10,099.74 13,799.18Repairs and Maintainence– Plant & Machinery 1,873.92 2,137.35– Buildings 169.38 510.90– Others 579.51 786.52
46,297.93 64,644.62Selling and distribution expensesFreight & forwarding (net of recoveries) 37,316.03 51,564.75Export expenses 2,052.80 2,401.19Advertisement & sales promotion [Refer Note III below] 1,318.08 3,328.62
40,686.91 57,294.56Establishment and Other expensesRates & Taxes 5,648.53 8,459.56Insurance (net of recoveries) 1,231.07 1,517.55CSR Expenditure [Refer Note I below] - 55.89Payment to Auditors [Refer Note II below] 128.70 107.61Donations 37.49 4.90Provision for loss in Limited Liability Partnership 18.31 -Investment write down - Impairment 3,595.00 1,082.83Net Loss on Sale/Discard/Fire of Fixed Assets - 112.34Contract Settlement-Purchase & Sales (net) 7,334.83 -Commission & rebate 3,838.94 4,765.64Travelling & conveyance 1,494.13 2,141.94Bank Commission & charges 7,654.78 7,622.72Loss on NCDEX, MCX and ACE - 5,240.99Other expenses (Net of recoveries) 13,334.67 10,980.17
44,316.45 42,092.141,31,301.29 1,64,031.32
Notesto Financial Statement for the Year Ended March 31, 2017

Annual Report 2016-17
105
Notesto Financial Statement for the Year Ended March 31, 2017
NOTE - 31 OTHER EXPENSES (` in Lakh)
Particulars For the year ended For the year endedMarch 31, 2017 March 31, 2016
Note:I Details of CSR Expenditure
The expenditure incurred on Corporate Social Reseponsibility (CSR) is as under:Particulars 2016-17 2015-16
Promoting gender equality and empowering women - 5.80Promoting of education - 15.88Reducing child mortality and improving maternal health - 8.08Ensuring environmental sustainability - 1.00Social business project - 3.21Others - 21.92Total - 55.89
i) Gross amount required to be spent by the Company during the year ` Nil [FY 2015-2016 is ` 194.06 Lakh] as persection 135 of the Act.
(` in Lakh)ii) Amount spent during the year on: FY 2016-17 FY 2015-16
Amount spent Amount Amount spent Amount Spent,and Paid Spent, Unpaid and Paid Unpaid
– Construction/Acquistion of any asset - - - -– On purpose other than above - - 55.89 -
II Payment to Auditors:- (` in Lakh)Particulars For the year ended For the year ended
March 31, 2017 March 31, 2016i) Remuneration to the Statutory auditors
(a) As Auditors– For Statuory Audit 51.75 51.53
[Inclusive of service tax ` 6.75 lakh] [FY 2015-2016 ` 6.53 lakh]– For Taxation Matters 11.50 11.45
[Inclusive of service tax ` 1.50 lakh] [FY 2015-2016 ` 1.45 lakh]– For Other Matters (Including for certification) 46.47 25.26
[Inclusive of service tax ` 5.34 lakh] [FY 2015-2016 ` 3.71 lakh](b) Travelling and other out of pocket expenses 4.95 5.07
ii) Remuneration to Branch Auditors(a) As Branch auditors – For Branch Audit 7.43 7.47
[Inclusive of service tax ` 0.98 lakh] [FY 2015-2016 ` 1.02 lakh](b) Travelling and other out of pocket expenses 1.54 1.80
iii) Remuneration to Cost AuditorsFor Cost Audit [Inclusive of service tax ` 0.66 lakh][FY 2015-2016 ` 0.64 lakh] 5.06 5.04
III Excludes ` 3,190.35 lakh [FY 2015-2016 ` 4,094.67 lakh] net of currenttax thereon debited to Business Development Reserve.[Refer Note 12 E]
NOTE - 32 EXCEPTIONAL ITEMS (` in Lakh)
Particulars For the year ended For the year endedMarch 31, 2017 March 31, 2016
(a) Reversal of excess Managerial Remunaration paid in earlier year - 74.91(b) On Account of Divestment in Joint Venture [Refer Note 5a-E(iii)] 4,490.40 -(c) Others-Recovery out of missappropriation at two branches pertaining to earlier year - 164.06
4,490.40 238.97

Ruchi Soya Industries Limited
106
Notesto Financial Statement for the Year Ended March 31, 2017
NOTE - 33 OTHER COMPREHENSIVE INCOME (` in Lakh)
Particulars For the year ended For the year endedMarch 31, 2017 March 31, 2016
(A) Other Comprehensive IncomeI Item that will not be reclassified to profit or loss
i) Remeasurement of the defined benefit plans [Refer Note 12J] 81.65 (123.22)ii) Equity Instruments through Other Comprehensive Income
[Refer Note 12 I] (730.19) (359.59)(648.54) (482.81)
Income tax relating to items that will not be reclassifiedto profit or loss (28.26) 42.64
(676.80) (440.17)II Item that will be reclassified to profit or loss
- -- -- -
(B) Hedge ReserveI Item that will not be reclassified to profit or loss
- -II Item that will be reclassified to profit or loss
i) Effective portion of gain or loss on hedging instruments in acash flow hedge [ Refer Note 12 G] 200.30 344.26
200.30 344.26Income tax relating to items that will not be reclassified toprofit or loss - -
200.30 344.26
NOTE - 34 CONTINGENT LIABILITIES AND COMMITMENTS (` in Lakh)
Particulars As at As atMarch 31, 2017 March 31, 2016
A Contingent liabilities(a) Claims against the Company not acknowledged as debts
(to the extent quantified) 1,679.84 1,077.59(b) Guarantees
i) Outstanding bank Guarantees 3,666.60 7,323.21ii) Outstanding letter of credit - -iii) Outstanding corporate gurantees given on behalf of
– Indian Subsidiary (Share in sanctioned amount ` 41,984 Lakh[FY 2015-16 ` 61,065.73 Lakh]) 38,968.80 37,849.97
– Indian Associate (Sanctioned amount ` 9,600.00 Lakh[FY 2015-16 ` 9,600.00 Lakh]) 5,346.00 6,106.00
– Foreign Subsidiary (Sanctioned amount Nil[FY 2015-16 ` 1,05,800.98 Lakh]) - 22,628.43
(c) Other Money for which Company is Contingently liablei) EPCG Licences benefit in event of default of Export Obligation
[Refer Note 34 B (b) ii below] 106.95 358.90ii) Income tax/Sales tax/Excise/Octroi/Custom duty/ESIC/
Electricity Duty/demand disputed 1,01,953.11 1,08,937.26

Annual Report 2016-17
107
Notesto Financial Statement for the Year Ended March 31, 2017
NOTE - 34 CONTINGENT LIABILITIES AND COMMITMENTS (` in Lakh)
Particulars As at As atMarch 31, 2017 March 31, 2016
iii) During an earlier year, the Company had received claims amountingto US$ 66.27 Million (to the extent quantified) from two overseasentities (claimants) in respect of performance guaranteespurportedly given by the Company as a second guarantor on behalfof an overseas entity in respect of contracts entered into betweenthe claimants and the overseas entity. The Company denies givingthe guarantees and has disputed the claims and has taken appropriatelegal actions and making suitable representations in the matter. TheCompany does not expect that any amount will become payable inrespect of the claims made. No provision is made in respect of thesame in the books of account.
iv) Interest liability , if any, in respect of advance from customers inthe event of default. [Refer Note 16(a) and17c (ii)] - 945.37
v) On divestment of shares of Gemini Edibles and Oil Pvt. Ltd. inan earlier year, pursuant to the Share Purchase Agreement, theCompany paid an amount of ̀ 2,836.52 Lakh to the said Companyby way of deposit which is refundable on receipt of variousincentives by the said Company’s from Government authorities.Of the total amount paid, the Company has received refund of` 2,276.43 Lakh till March 31, 2017. The Company expects torecover the balance amount of ` 560.09 Lakh fully. Accordingly,no provision is considered necessary in this regards.
vi) In relation to trading in Castor seed contracts on NationalCommodity and Derivative Exchange Limited (NCDEX), pendinginvestigation by Security Exchange Board of India [SEBI] amountof liability, if any, can not be assertained at this stage.
B Commitments(a) Estimated amount of contracts remaining to be executed on capital
account and not provdied for (Net of advances) 155.36 480.14(b) Other Commitments
i) Export Commitment in relation to advance received[Refer Note 16(a) and 17 c(ii)] - 1,14,404.35
ii) Export Obligations in relation to EPCG Benefits[Refer Note 34 A (c) i above] 961.12 4,442.80
NOTE - 35 SUBSEQUENT EVENTS
There are no significant subsequent events that would require adjustments or disclosures in the financial statements as on the balancesheet date.
NOTE - 36
The Company has made losses during the current year and the preceeding year. As a result of the losses, the liquidity position of theCompany has been substantainly affected resulting in default in payment of its debts and adversely affecting the operations of thecompany, indicating the existence of uncertainity about the ability of the Company to continue as a going concern.
The management has initiated various steps such as cost rationalization, negotiations for debts restructing and disposal of non-coreassets. Considering the strengths of the Company’s brand, future outlook as assessed by the management and the business plans, theCompany is confident of its ability to continue as a going concern. These financials statements have, accordingly been prepared ongoing concern basis. The long term prospects of the Company, however, dependend on the expeditious restructuring of the debts bythe lenders. The managment is hopeful of an early resolution of the matter.
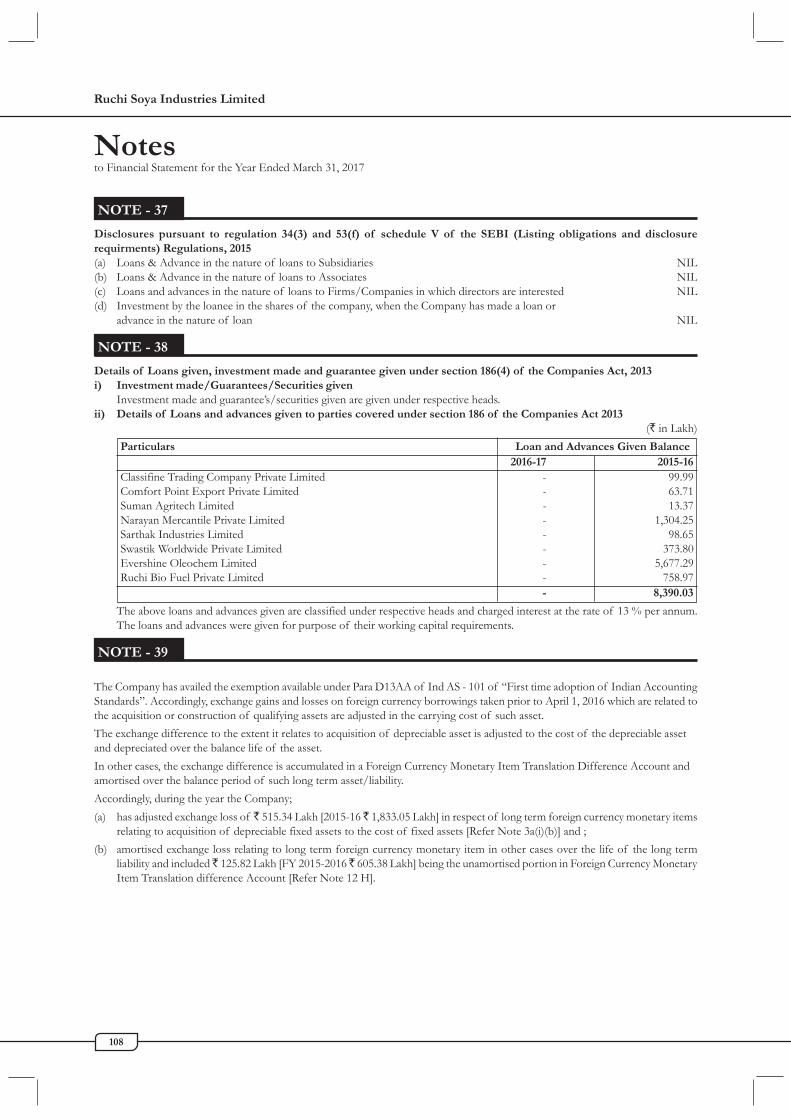
Ruchi Soya Industries Limited
108
Notesto Financial Statement for the Year Ended March 31, 2017
NOTE - 37
Disclosures pursuant to regulation 34(3) and 53(f) of schedule V of the SEBI (Listing obligations and disclosurerequirments) Regulations, 2015(a) Loans & Advance in the nature of loans to Subsidiaries NIL(b) Loans & Advance in the nature of loans to Associates NIL(c) Loans and advances in the nature of loans to Firms/Companies in which directors are interested NIL(d) Investment by the loanee in the shares of the company, when the Company has made a loan or
advance in the nature of loan NIL
NOTE - 38
Details of Loans given, investment made and guarantee given under section 186(4) of the Companies Act, 2013i) Investment made/Guarantees/Securities given
Investment made and guarantee’s/securities given are given under respective heads.ii) Details of Loans and advances given to parties covered under section 186 of the Companies Act 2013
(` in Lakh)Particulars Loan and Advances Given Balance
2016-17 2015-16Classifine Trading Company Private Limited - 99.99Comfort Point Export Private Limited - 63.71Suman Agritech Limited - 13.37Narayan Mercantile Private Limited - 1,304.25Sarthak Industries Limited - 98.65Swastik Worldwide Private Limited - 373.80Evershine Oleochem Limited - 5,677.29Ruchi Bio Fuel Private Limited - 758.97
- 8,390.03
The above loans and advances given are classified under respective heads and charged interest at the rate of 13 % per annum.The loans and advances were given for purpose of their working capital requirements.
NOTE - 39
The Company has availed the exemption available under Para D13AA of Ind AS - 101 of “First time adoption of Indian AccountingStandards”. Accordingly, exchange gains and losses on foreign currency borrowings taken prior to April 1, 2016 which are related tothe acquisition or construction of qualifying assets are adjusted in the carrying cost of such asset.The exchange difference to the extent it relates to acquisition of depreciable asset is adjusted to the cost of the depreciable assetand depreciated over the balance life of the asset.In other cases, the exchange difference is accumulated in a Foreign Currency Monetary Item Translation Difference Account andamortised over the balance period of such long term asset/liability.Accordingly, during the year the Company;(a) has adjusted exchange loss of ̀ 515.34 Lakh [2015-16 ̀ 1,833.05 Lakh] in respect of long term foreign currency monetary items
relating to acquisition of depreciable fixed assets to the cost of fixed assets [Refer Note 3a(i)(b)] and ;(b) amortised exchange loss relating to long term foreign currency monetary item in other cases over the life of the long term
liability and included ̀ 125.82 Lakh [FY 2015-2016 ̀ 605.38 Lakh] being the unamortised portion in Foreign Currency MonetaryItem Translation difference Account [Refer Note 12 H].

Annual Report 2016-17
109
Notesto Financial Statement for the Year Ended March 31, 2017
NOTE - 40 SEGMENT REPORTINGA. General Information
(a) Factors used to identify the entity’s reportable segments, including the basis of organisationBased on the criteriorn as mentioned in Ind-As-108-”Operating Segment”, the Company has identified its reportablesegments, as follows:• Segment-1 Extractions• Segment-2, Vanaspati• Segment-3, Oils• Segment-4, Food Products• Segment-5, Wind Power Generation• Segment-6, OthersUnallocable - All the segments other than segments identified above are collectively included in this segment.The Chief Operating Decision Maker (“CODM”) evaluates the Company’s performance and allocates resources based onan analysis of various performance indicators by operating segments. The CODM reviews revenue and gross profit as theperformance indicator for all of the operating segments.
(b) Following are reportable segments
Reportable segment DescriptionExtractions Various types of seed extractionsVanaspati Vanaspati, Bakery fats and Table spreadOils Crude oils, refined oilsFood Products Textured Soya protein and Soya flourWind Power Generation Electricity Generation from Wind Mills
(c) Other Segement
Others Gram, Wheat, Rice, Maize, Corn, Seeds, Coffee, Marine Products, Tuar, Peas, Barley, Soap,Fresh Fruit Bunch, seedling Plant and Equipment, Cotton Bales, Toiletry preparations andCotton seed oil cake.
By products related to each segment have been included under the respective segment.Extraction is considered as the primary product resulting from the solvent extraction process and crude oil as the secondaryproduct. While computing segment results, all costs related to solvent extraction process are charged to the extractionsegment and recovery on account of crude oil is credited to the said segment. Credit for recovery of crude oil is taken onthe basis of average monthly market price.
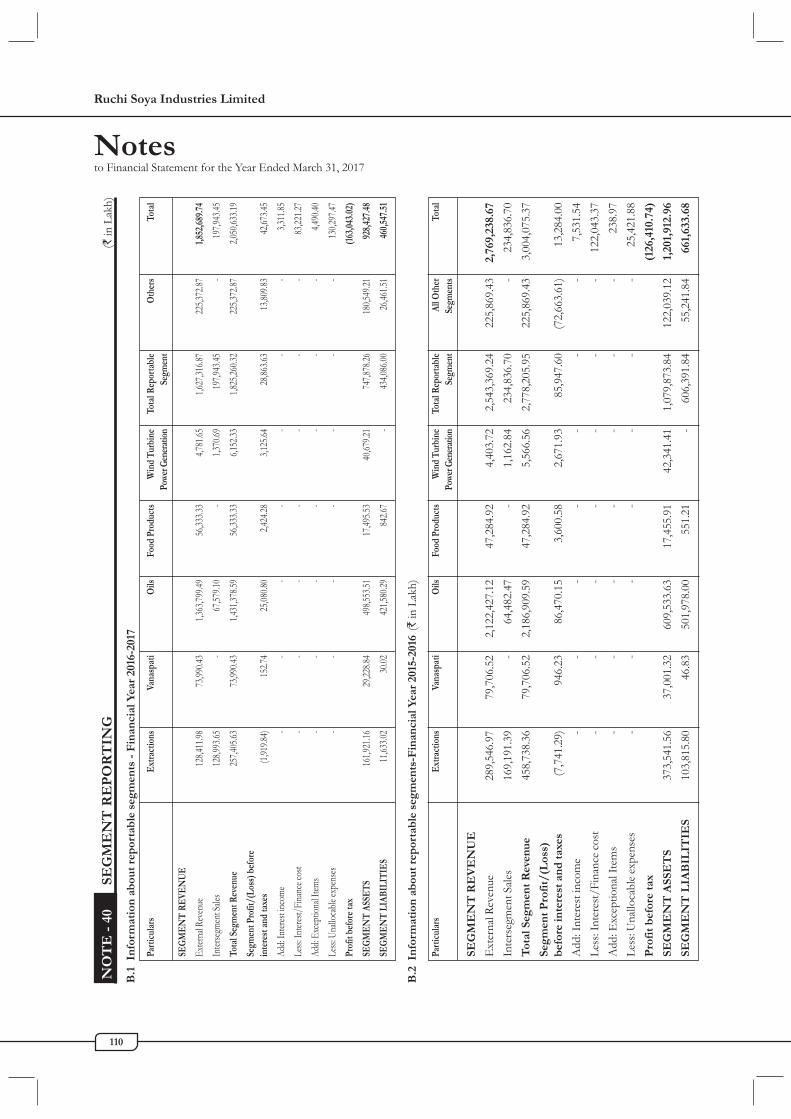
Ruchi Soya Industries Limited
110
Notesto Financial Statement for the Year Ended March 31, 2017
NO
TE
- 4
0SE
GM
EN
T R
EP
OR
TIN
G(`
in L
akh)
B.1
Info
rmat
ion
ab
out
rep
orta
ble
seg
men
ts -
Fin
anci
al Y
ear
2016
-201
7
Part
icul
ars
Ext
ract
ions
Vana
spat
iO
ilsFo
od P
rodu
cts
Win
d Tu
rbin
eTo
tal R
epor
tabl
eO
ther
sTo
tal
Powe
r Gen
erat
ion
Segm
ent
SEG
ME
NT
RE
VEN
UE
Exter
nal R
even
ue12
8,411
.9873
,990.4
31,3
63,79
9.49
56,33
3.33
4,781
.651,6
27,31
6.87
225,3
72.87
1,852
,689
.74
Inter
segme
nt Sa
les12
8,993
.65-
67,57
9.10
-1,3
70.69
197,9
43.45
-19
7,943
.45To
tal S
egm
ent R
even
ue25
7,405
.6373
,990.4
31,4
31,37
8.59
56,33
3.33
6,152
.331,8
25,26
0.32
225,3
72.87
2,050
,633.1
9Se
gmen
t Pro
fit/(
Loss
) bef
ore
inte
rest
and
taxe
s(1,
919.8
4)15
2.74
25,08
0.80
2,424
.283,1
25.64
28,86
3.63
13,80
9.83
42,67
3.45
Add:
Inter
est in
come
--
--
--
-3,3
11.85
Less:
Inter
est/F
inanc
e cos
t-
--
--
--
83,22
1.27
Add:
Exce
ption
al Ite
ms-
--
--
--
4,490
.40Le
ss: U
nallo
cable
expe
nses
--
--
--
-13
0,297
.47Pr
ofit
befo
re ta
x(1
63,0
43.0
2)
SEG
ME
NT
ASS
ET
S16
1,921
.1629
,228.8
449
8,553
.5117
,495.5
340
,679.2
174
7,878
.2618
0,549
.2192
8,42
7.48
SEG
ME
NT
LIA
BILI
TIE
S11
,633.0
230
.0242
1,580
.2984
2.67
-43
4,086
.0026
,461.5
146
0,54
7.51
B.2
Info
rmat
ion
ab
out
rep
orta
ble
seg
men
ts-F
inan
cial
Yea
r 20
15-2
016
(` in
Lak
h)
Part
icul
ars
Ext
ract
ions
Vana
spat
iO
ilsFo
od P
rodu
cts
Win
d Tu
rbin
eTo
tal R
epor
tabl
eAl
l Oth
erTo
tal
Powe
r Gen
erat
ion
Segm
ent
Segm
ents
SEG
ME
NT
RE
VE
NU
E
Ext
erna
l Rev
enue
289,
546.
9779
,706
.52
2,12
2,42
7.12
47,2
84.9
24,
403.
722,
543,
369.
2422
5,86
9.43
2,76
9,23
8.67
Inte
rseg
men
t Sale
s16
9,19
1.39
-64
,482
.47
-1,
162.
8423
4,83
6.70
-23
4,83
6.70
Tot
al S
egm
ent
Rev
enue
458,
738.
3679
,706
.52
2,18
6,90
9.59
47,2
84.9
25,
566.
562,
778,
205.
9522
5,86
9.43
3,00
4,07
5.37
Segm
ent P
rofi
t/(L
oss)
bef
ore
inte
rest
an
d t
axes
(7,7
41.2
9)94
6.23
86,4
70.1
53,
600.
582,
671.
9385
,947
.60
(72,
663.
61)
13,2
84.0
0A
dd: I
nter
est i
ncom
e-
--
--
--
7,53
1.54
Less
: Int
eres
t/Fi
nanc
e cos
t-
--
--
--
122,
043.
37A
dd: E
xcep
tiona
l Ite
ms
--
--
--
-23
8.97
Less
: Una
lloca
ble e
xpen
ses
--
--
--
-25
,421
.88
Pro
fit
bef
ore
tax
(126
,410
.74)
SEG
ME
NT
ASS
ET
S37
3,54
1.56
37,0
01.3
260
9,53
3.63
17,4
55.9
142
,341
.41
1,07
9,87
3.84
122,
039.
121,
201,
912.
96
SEG
ME
NT
LIA
BIL
ITIE
S10
3,81
5.80
46.8
350
1,97
8.00
551.
21-
606,
391.
8455
,241
.84
661,
633.
68

Annual Report 2016-17
111
NOTE - 40 SEGMENT REPORTING
C. Reconciliation of information on reportable segments to Ind AS measures:Nature of transaction Year ended Year ended
March 31, 2017 March 31, 2016i) Revenues
Total revenue for reportable segments 16,27,316.87 25,43,369.24Revenue for other segments 2,25,372.87 2,25,869.43Total Revenue 18,52,689.74 27,69,238.67
(0.00) 0.00ii) Profit/Loss before tax
As per above (1,63,043.02) (1,26,410.74)As per Financials (1,63,043.02) (1,26,410.74)
0.00 (0.00)iii) Assets
Total assets for reportable segments 7,47,878.26 10,79,873.84Assets for other segments 1,80,549.21 1,22,039.12Unallocated amounts 3,97,165.25 4,43,301.63Total assets 13,25,592.73 16,45,214.59
0.00 (0.02)iv) Liabilities
Total liabilities for reportable segments 4,34,086.00 6,06,391.84Liabilities for other segments 26,461.51 55,241.84Unallocated amounts 8,65,045.22 9,83,580.91Total liabilities 13,25,592.73 16,45,214.59
799,953 (0)D. Geographic information
Geography For the year ended For the year endedMarch 31, 2017 March 31, 2016
I RevenueWithin India 17,13,884.44 23,77,735.52Outside India 1,38,805.31 3,91,503.14Total Revenue 18,52,689.74 27,69,238.67
II Non-Current Assets*Within India 5,64,118.77 5,78,466.52Outside India - -Total 5,64,118.77 5,78,466.52
*Non-current assets other than financial assets.
Notesto Financial Statement for the Year Ended March 31, 2017

Ruchi Soya Industries Limited
112
Notesto Financial Statement for the Year Ended March 31, 2017
NOTE-41 RELATED PARTY RELATIONSHIPS, TRANSACTIONS AND BALANCES
As per Ind AS-24, the disclosure of transactions with related parties are given below :
(A) List of related parties where control exists with whom transactions have taken place and relationships.
(i) Person or a close members has control or joint control, significant influence on the reporting entity or ismember of KMP in reporting entity
(a) Name of persons/entities Relation
Mr. Dinesh Shahra Managing DirectorMr. V. K. Jain Whole-time DirectorMr.Ramjilal Gupta Company SecretaryMr. V. Suresh Kumar upto 03.09.2016 Chief Financial OfficerMr. Anil Singhal w.e.f. 13.09.2016 Chief Financial Officer
(b) Name of the close members Relation
Mr. Kailash Shahra Brother of Managing DirectorMs. Amrita Shahra Daughter of Managing DirectorMr. Sarvesh Shahra Son of Managing DirectorMr. Suresh Shahra Brother of Managing DirectorMrs. Abha Devi Shahra Wife of Managing DirectorMr. Ankesh Shahra Son of Managing DirectorMs. Amisha Shahra Daughter of Managing DirectorMrs. Vidhyadevi Khandelwal Sister of Managing Director
(ii) (a) Entity and reporting entity are members of the same group
Name of persons/entities Relation
Ruchi Worldwide Limited SubsidiaryRSIL Beneficiary Trust TrustRSIL Holdings Pvt. Ltd. SubsidiaryRuchi Agri Trading Pte. Limited, Singapore Step-down SubsidiaryMrig Trading Pvt. Limited Subsidiary
(b) One entity is an associate or joint venture of the other entity (or an associate or jointventure of a member of a group of which the other entity is a member)
Name of persons/entities Relation
Ruchi Hi-rich Seeds Pvt Ltd Associate of SubsidiaryRuchi J-Oil Private Limited Joint VentureGHI Energy Private Limited AssociateIndian Oil Ruchi Biofuels LLP Joint VentureRuchi Kagome Foods India Pvt. Ltd (upto 20.05.2016)Associate
(iii) The entity is controlled or jointly controlled by a person identified in (i)
Name of persons/entities
Shahra Brothers Private LimitedMahadeo Shahra & Sons

Annual Report 2016-17
113
Notesto Financial Statement for the Year Ended March 31, 2017
High Tech Realty Pvt. Ltd.Disha Foundation TrustMahakosh Holdings Pvt. Ltd.Shahra Estate Private LimitedRuchi Biofuels Pvt. Ltd.Dinesh Shahra HUFKailash Shahra HUFSuresh Shahra HUFSantosh Shahra HUFRuchi Infrastructure Limited (upto 08.04.2016)Mahadeo Shahra Sukrat Trust
(iv) Others
Mr. Navin Khandelwal Independent DirectorMr. Prabhu Dayal Dwivedi Independent DirectorMr. N. Murugan Independent DirectorMrs. Meera Dinesh Rajda Independent DirectorMr. Sajeve Deora upto 21.04.2016 Independent Director
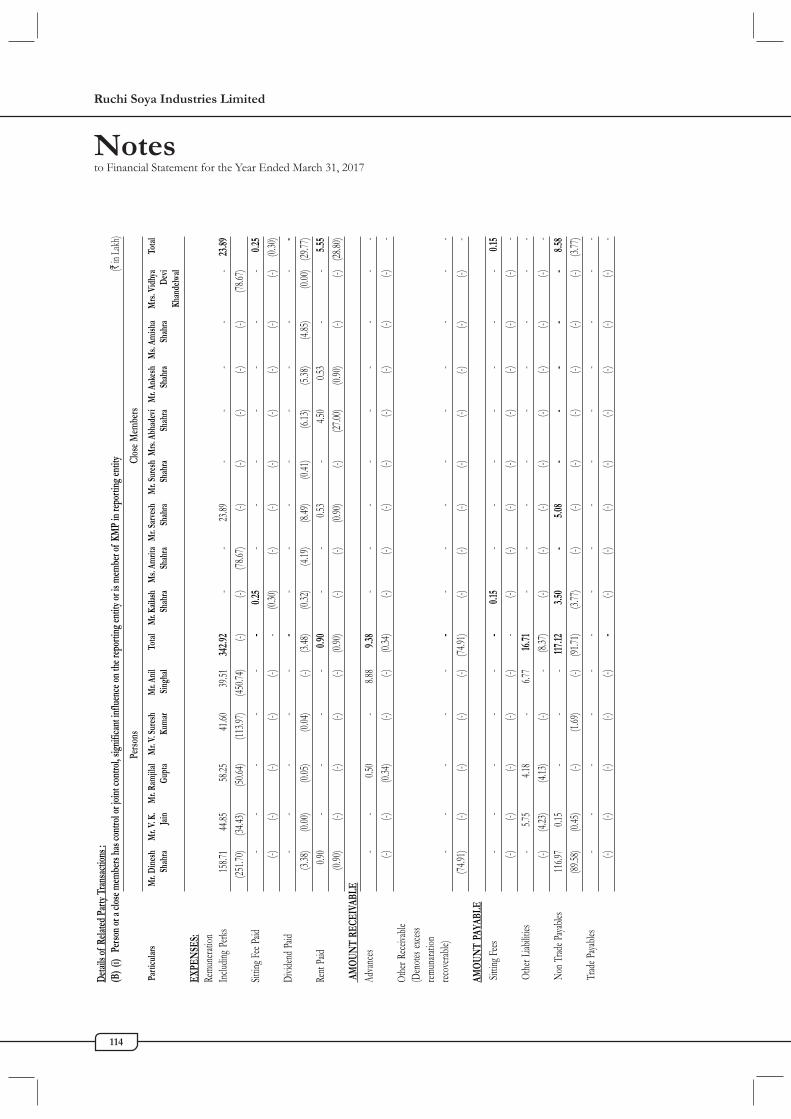
Ruchi Soya Industries Limited
114
Notesto Financial Statement for the Year Ended March 31, 2017
Deta
ils of
Rela
ted P
arty
Tra
nsac
tions
:(B
)(i)
Pers
on or
a clo
se m
embe
rs ha
s con
trol o
r joi
nt co
ntro
l, sig
nific
ant i
nflu
ence
on th
e rep
ortin
g en
tity o
r is m
embe
r of K
MP
in re
porti
ng en
tity
(` in
Lakh
)Pe
rson
sCl
ose M
embe
rs
Par
ticul
ars
Mr.
Din
esh
Mr.
V. K
.M
r. Ram
jilal
Mr.
V. Su
resh
Mr. A
nil
Tota
lM
r. Kail
ash
Ms.
Amrit
aM
r. Sa
rves
hM
r. Sur
esh
Mrs.
Abh
adev
iM
r. Ank
esh
Ms.
Amish
aM
rs. V
idhy
aTo
tal
Shah
ra Ja
in G
upta
Kum
ar Si
ngha
l Sh
ahra
Shah
raSh
ahra
Shah
raSh
ahra
Shah
raSh
ahra
Dev
i K
hand
elwal
EXPE
NSE
S:Re
mune
ration
Includ
ing P
erks
158.7
1 44
.85 58
.25 41
.60 39
.51 3
42.92
- -
23.89
- -
- -
- 2
3.89
(251.7
0) (3
4.43)
(50.6
4) (1
13.97
) (4
50.74
) (-)
(-) (7
8.67)
(-) (-)
(-) (-)
(-) (7
8.67)
Sittin
g Fee
Paid
- -
- -
- -
0.25
- -
- -
- -
- 0
.25 (-)
(-) (-)
(-) (-)
- (0
.30)
(-) (-)
(-) (-)
(-) (-)
(-) (0
.30)
Divid
end P
aid -
- -
- -
- -
- -
- -
- -
- -
(3.38
) (0
.00)
(0.05
) (0
.04)
(-) (3
.48)
(0.32
) (4
.19)
(8.49
) (0
.41)
(6.13
) (5
.38)
(4.85
) (0
.00)
(29.7
7)Re
nt Pa
id 0.
90 -
- -
- 0
.90 -
- 0.
53 -
4.50
0.53
- -
5.55
(0.90
) (-)
(-) (-)
(-) (0
.90)
(-) (-)
(0.90
) (-)
(27.0
0) (0
.90)
(-) (-)
(28.8
0) A
MO
UNT
RECE
IVAB
LEAd
vances
- -
0.50
- 8.
88 9
.38 -
- -
- -
- -
- -
(-) (-)
(0.34
) (-)
(-) (0
.34)
(-) (-)
(-) (-)
(-) (-)
(-) (-)
-Ot
her R
eceiva
ble(D
enote
s exce
ssrem
unara
tion
recov
erable
) -
- -
- -
- -
- -
- -
- -
- -
(74.91
) (-)
(-) (-)
(-) (7
4.91)
(-) (-)
(-) (-)
(-) (-)
(-) (-)
-AM
OUN
T PA
YABL
E Si
tting F
ees -
- -
- -
- 0
.15 -
- -
- -
- -
0.15
(-) (-)
(-) (-)
(-) -
(-) (-)
(-) (-)
(-) (-)
(-) (-)
- O
ther L
iabilit
ies -
5.75
4.18
- 6.
77 16
.71 -
- -
- -
- -
- -
(-) (4
.23)
(4.13
) (-)
- (8
.37)
(-) (-)
(-) (-)
(-) (-)
(-) (-)
- N
on Tr
ade P
ayable
s 11
6.97
0.15
- -
- 11
7.12
3.50
- 5
.08 -
- -
- -
8.58
(89.5
8) (0
.45)
(-) (1
.69)
(-) (9
1.71)
(3.77
) (-)
(-) (-)
(-) (-)
(-) (-)
(3.77
) Tr
ade P
ayable
s -
- -
- -
- -
- -
- -
- -
- -
(-) (-)
(-) (-)
(-) -
(-) (-)
(-) (-)
(-) (-)
(-) (-)
-

Annual Report 2016-17
115
Notesto Financial Statement for the Year Ended March 31, 2017
(` in
Lak
h)(B
)(ii)
Parti
cular
s E
ntity
and
repo
rting
ent
ity a
re m
embe
rs o
f the
sam
e gr
oup
One
ent
ity is
an
asso
ciate
or j
oint
vent
ure
of th
e oth
er e
ntity
( whi
ch m
eans
that
eac
h pa
rent
, sub
sidia
ry a
nd fe
llow
subs
idia
ry is
relat
ed to
the
othe
rs)
(or a
n as
socia
te o
r joi
nt ve
ntur
e of
a m
embe
r of a
gro
up o
f whi
ch th
e ot
her e
ntity
is a
mem
ber)
Ruch
iRS
ILRS
IL H
oldi
ngs
Ruch
iM
rig T
radi
ng T
otal
Ruch
iRu
chi J
-Oil
GHI E
nerg
yIn
dian
Oil
Ruch
i Kag
ome
Tota
lW
orld
wide
Bene
ficia
ryPr
ivate
Lim
ited
Agrit
radi
ngPr
ivate
Lim
ited
Hi-R
ich S
eeds
Priva
te L
imite
dPr
ivate
Ltd
.Ru
chi B
io F
uels,
Food
s Ind
iaLi
mite
d T
rust
Pte.
Lim
ited
Priva
te L
imite
dLi
mite
d lia
bilit
yPv
t. Lt
d.Pa
rtner
ship
REVE
NU
ESa
le of
goo
ds (I
nclu
ding
Pow
er)
673
.54 —
— —
—67
3.54
— 1
,348.2
4 8
,464.6
6 —
— 9
,812.9
0 (1
7,979
.67)
— —
— —
(17,97
9.67)
—(1,
418.0
8) —
— —
(1,41
8.08)
Cont
ract
Set
tlem
ent G
ain
(On
Sales
) 1,
680.9
1 —
— —
— 1,
680.9
1 —
— —
— —
— (—
) (—
) (—
) (—
) (—
) —
(—)
(—)
(—)
(—)
(—)
—Se
rvice
Cha
rges
Rec
eived
/ R
eceiv
able
— —
— —
— —
— 4
.91 —
— —
4.91
(—)
(—)
(—)
(—)
(—)
— (—
) (1
09.73
) (—
) (—
) (—
) (1
09.73
)D
ivide
nd R
eceiv
ed —
— —
— —
— —
— —
— —
— (—
) (1
2.21)
(—)
(—)
(—)
(12.2
1) (—
) (—
) (—
) (—
) (—
) —
Rent
Rec
eived
/Re
ceiva
ble
— —
— —
— —
— —
— —
— —
(—)
(—)
(—)
(—)
(—)
— (—
) (—
) (—
) (—
) (—
) —
Inte
rest
rece
ived
— —
— —
— —
— —
— —
— —
(—)
(—)
(—)
(—)
(—)
— (3
.88)
(—)
(—)
(—)
(—)
(3.88
)Re
imbu
rsem
ent o
f Ex
pens
esRe
ceive
d (N
et)
— —
— —
— —
— 12
4.52
55.2
0 —
1.02
180.7
4 (—
) (—
) (—
) (—
) (—
) —
— (1
5.31)
(61.2
5) (—
) (3
8.68)
(115
.24)
EXPE
NSE
S:Pu
rchase
of go
ods
40,32
8.94
— —
17,71
3.05
— 58
,041.9
9 —
743.4
5 3,
030.6
0 —
— 3
,774.0
5 (1
3,076
.52)
(—)
(—)
(1,98
,649.2
5) (—
) (2
,11,72
5.77)
(—)
(1,14
4.10)
(—)
(—)
(—)
(1,14
4.10)
Purch
ase of
DEP
B &
Othe
r Lice
nce
— —
— —
— —
— —
— —
— —
(2.18
) (—
) (—
) (—
) (—
) (2
.18)
(—)
(—)
(—)
(—)
(—)
—Di
viden
d Paid
— —
— —
— —
— —
— —
— —
(—)
(12.2
1) (—
) (—
) (—
) (1
2.21)
(—)
(—)
(—)
(—)
(—)
—Pr
ocess
ing C
harge
s Paid
— —
— —
— —
— 19
.48 —
— —
19.48
(—)
(—)
(—)
(—)
(—)
— (—
) (8
32.09
) (—
) (—
) (—
) (8
32.09
)Gu
arante
es giv
en 38
,968.8
0 —
— —
— 38
,968.8
0 —
— 5,
346.0
0 —
— 5
,346.0
0 (3
7,849
.97)
(—)
(—)
(22,6
28.43
) (—
) (6
0,478
.39)
(—)
(—)
(61,0
65.73
) (—
) (—
) (6
1,065
.73)
Contr
ibutio
n in L
imite
dLia
bility
Part
nersh
ip —
— —
— —
— —
— —
— —
— (—
) (—
) (—
) (—
) (—
) —
(—)
(—)
(—)
(10.0
0) (—
) (1
0.00)
Invest
ment
in Eq
uity s
hares
— —
— —
— —
— —
— —
— —
— (—
) (—
) (2
60.00
) (—
) (—
) (2
60.00
) (—
) (—
) (—
) (—
) (—
) —
Share
of Lo
ss in
Invest
ment
— —
— —
— —
— —
— —
— —
(—)
(—)
(—)
(—)
(—)
— (—
) (—
) (—
) (—
) (—
) —
AMO
UNT
RECE
IVAB
LE Lo
ans a
nd A
dvan
ces —
0.35
— —
0.23
0.57
— —
— —
— —
(—)
(0.35
) (—
) (—
) (—
) (0
.35)
(—)
(—)
(—)
(—)
(35.3
1) (3
5.31)
Trad
e rece
ivable
s —
— —
— —
— —
382.2
8 —
— —
382.2
8 (—
) (—
) (—
) (—
) (—
) —
(—)
— (—
) (—
) (—
)—
AMO
UNT
PAYA
BLE
Trad
e Paya
bles
38,72
8.89
— —
18,31
1.52
— 57
,040.4
0 —
— —
— —
—(1,
772.5
0) —
—(63
,167.0
8) —
(64,93
9.58)
—(77
.41)
— —
—(77
.41)
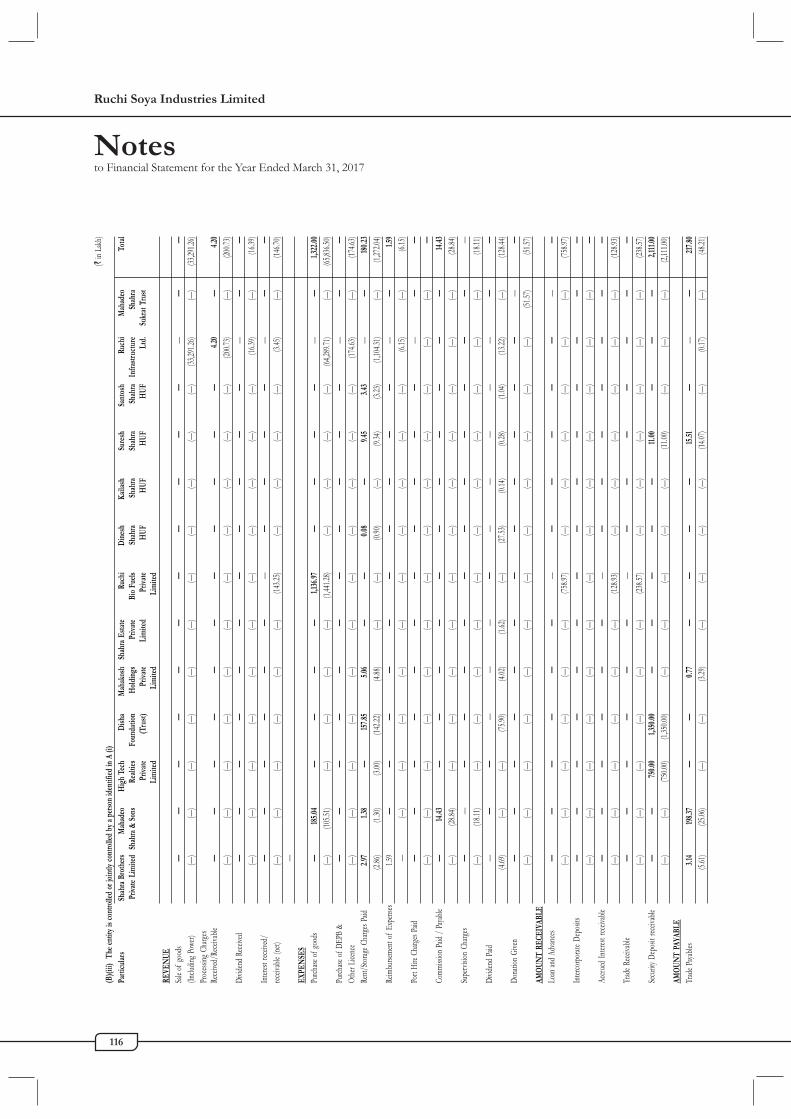
Ruchi Soya Industries Limited
116
Notesto Financial Statement for the Year Ended March 31, 2017
(` in
Lakh
)(B
)(iii)
The
ent
ity is
con
trolle
d or
join
tly c
ontro
lled
by a
per
son
iden
tified
in A
(i)
Parti
cular
s S
hahr
a Br
othe
rsM
ahad
eoH
igh
Tech
Dish
aM
ahak
osh
Shah
ra E
state
Ruch
iD
ines
hKa
ilash
Sure
shSa
ntos
hRu
chi
Mah
adeo
Tota
lPr
ivate
Lim
ited
Shah
ra &
Son
s R
ealti
esFo
unda
tion
Hol
ding
sPr
ivate
Bio
Fuels
Shah
raSh
ahra
Shah
raSh
ahra
Infra
struc
ture
Shah
raPr
ivate
(Tru
st)Pr
ivate
Lim
ited
Priva
teH
UFH
UFH
UFH
UFLt
d.Su
krat
Tru
stLi
mite
dLi
mite
dLi
mite
dRE
VEN
UE
Sale
of go
ods
——
— —
— —
— —
— —
— —
— —
(Inclu
ding P
ower)
(—)
(—)
(—)
(—)
(—)
(—)
(—)
(—)
(—)
(—)
(—)
(33,2
91.26
) (—
) (3
3,291
.26)
Proc
essing
Cha
rges
Recei
ved/R
eceiva
ble —
— —
— —
— —
— —
— —
4.20
— 4
.20 (—
) (—
) (—
) (—
) (—
) (—
) (—
) (—
) (—
) (—
) (—
) (2
00.73
) (—
) (2
00.73
)Di
viden
d Rece
ived
— —
— —
— —
— —
— —
— —
— —
(—)
(—)
(—)
(—)
(—)
(—)
(—)
(—)
(—)
(—)
(—)
(16.3
9) (—
) (1
6.39)
Intere
st rec
eived
/ —
— —
— —
— —
— —
— —
— —
—rec
eivab
le (ne
t) (—
) (—
) (—
) (—
) (—
) (—
) (1
43.25
) (—
) (—
) (—
) (—
) (3
.45)
(—)
(146
.70)
—EX
PEN
SES
Purch
ase of
good
s —
185.0
4 —
— —
— 1,
136.9
7 —
— —
— —
— 1
,322.0
0 (—
) (1
05.51
) (—
) (—
) (—
) (—
) (1
,441.2
8) (—
) (—
) (—
) (—
) (6
4,289
.71)
(—)
(65,8
36.50
)Pu
rchase
of D
EPB
& —
— —
— —
— —
— —
— —
— —
—Ot
her L
icenc
e (—
) (—
) (—
) (—
) (—
) (—
) (—
) (—
) (—
) (—
) (—
) (1
74.63
) (—
) (1
74.63
)Re
nt/Sto
rage C
harge
s Paid
2.97
1.38
— 15
7.85
5.06
— —
0.08
— 9
.45 3
.43 —
— 18
0.23
(2.86
) (1
.30)
(3.00
) (1
42.22
) (4
.88)
(—)
(—)
(0.90
) (—
) (9
.34)
(3.23
) (1
,104.3
1) (—
) (1
,272.0
4)Re
imbu
rseme
nt of
Exp
enses
1.59
— —
— —
— —
— —
— —
— —
1.59
— (—
) (—
) (—
) (—
) (—
) (—
) (—
) (—
) (—
) (—
) (6
.15)
(—)
(6.15
)Po
rt Hi
re Ch
arges
Paid
— —
— —
— —
— —
— —
— —
— —
(—)
(—)
(—)
(—)
(—)
(—)
(—)
(—)
(—)
(—)
(—)
(—)
(—)
—Co
mmiss
ion Pa
id / P
ayable
— 14
.43 —
— —
— —
— —
— —
— —
14.43
(—)
(28.8
4) (—
) (—
) (—
) (—
) (—
) (—
) (—
) (—
) (—
) (—
) (—
) (2
8.84)
Supe
rvisio
n Ch
arges
— —
— —
— —
— —
— —
— —
— —
(—)
(18.1
1) (—
) (—
) (—
) (—
) (—
) (—
) (—
) (—
) (—
) (—
) (—
) (1
8.11)
Divid
end P
aid —
— —
— —
— —
— —
— —
— —
— (4
.69)
(—)
(—)
(75.9
0) (4
.02)
(1.62
) (—
) (2
7.53)
(0.14
) (0
.28)
(1.04
) (1
3.22)
(—)
(128
.44)
Dona
tion G
iven
— —
— —
— —
— —
— —
— —
— —
(—)
(—)
(—)
(—)
(—)
(—)
(—)
(—)
(—)
(—)
(—)
(—)
(51.5
7) (5
1.57)
AMO
UNT
RECE
IVAB
LELo
an an
d Adv
ances
— —
— —
— —
— —
— —
— —
— —
(—)
(—)
(—)
(—)
(—)
(—)
(758
.97)
(—)
(—)
(—)
(—)
(—)
(—)
(758
.97)
Interc
orpora
te De
posit
s —
— —
— —
— —
— —
— —
— —
— (—
) (—
) (—
) (—
) (—
) (—
) (—
) (—
) (—
) (—
) (—
) (—
) (—
) —
Accru
ed In
terest
recei
vable
— —
— —
— —
— —
— —
— —
— —
(—)
(—)
(—)
(—)
(—)
(—)
(128
.93)
(—)
(—)
(—)
(—)
(—)
(—)
(128
.93)
Trad
e Rece
ivable
— —
— —
— —
— —
— —
— —
— —
(—)
(—)
(—)
(—)
(—)
(—)
(238
.57)
(—)
(—)
(—)
(—)
(—)
(—)
(238
.57)
Secu
rity D
eposi
t rece
ivable
— —
750
.00 1
,350.0
0 —
— —
— —
11.00
— —
— 2
,111.0
0 (—
) (—
) (7
50.00
) (1
,350.0
0) (—
) (—
) (—
) (—
) (—
) (1
1.00)
(—)
(—)
(—)
(2,11
1.00)
AMO
UNT
PAYA
BLE
Trad
e Paya
bles
3.14
198.3
7 —
— 0
.77 —
— —
— 15
.51 —
— —
217
.80 (5
.61)
(25.0
6) (—
) (—
) (3
.29)
(—)
(—)
(—)
(—)
(14.0
7) (—
) (0
.17)
(—)
(48.2
1)

Annual Report 2016-17
117
Notesto Financial Statement for the Year Ended March 31, 2017
(B) (iv) Others : (` in Lakh)
Particulars OthersMr. Navin Mr. Prabhu Lal Mr. N. Mrs. Meera Mr. Sajeve Total
Khandelwal Dwivedi Murugan Dinesh Rajda DeoraEXPENSES:Remuneration Including Perks - - - - - -
(-) (-) (-) (-) (-) (-)Sitting Fee Paid 0.80 1.10 0.40 0.10 - 2.40
(0.60) (1.25) (0.65) (0.20) (0.55) (3.25)Dividend Paid - - - - - -
(-) (-) (-) (-) (-) (-)Rent Paid - - - - - -
(-) (-) (-) (-) (-) (-)AMOUNT RECEIVABLEAdvances - - - - - -
(-) (-) (-) (-) (0.05) (0.05)Other Receivable(Denotes excess remunaration recoverable) - - - - - -
(-) (-) (-) (-) (-) (-)AMOUNT PAYABLESitting Fees 0.05 0.35 - - - 0.40
(0.14) (0.14) (0.14) (-) (-) (0.41)Other Liabilities - - - - - -
(-) (-) (-) (-) (-) (-)Non Trade Payables - - 0.02 - - 0.02
(-) (-) (0.02) (-) (-) (0.02)Trade Payables - - - - - -
(-) (-) (-) (-) (-) (-)
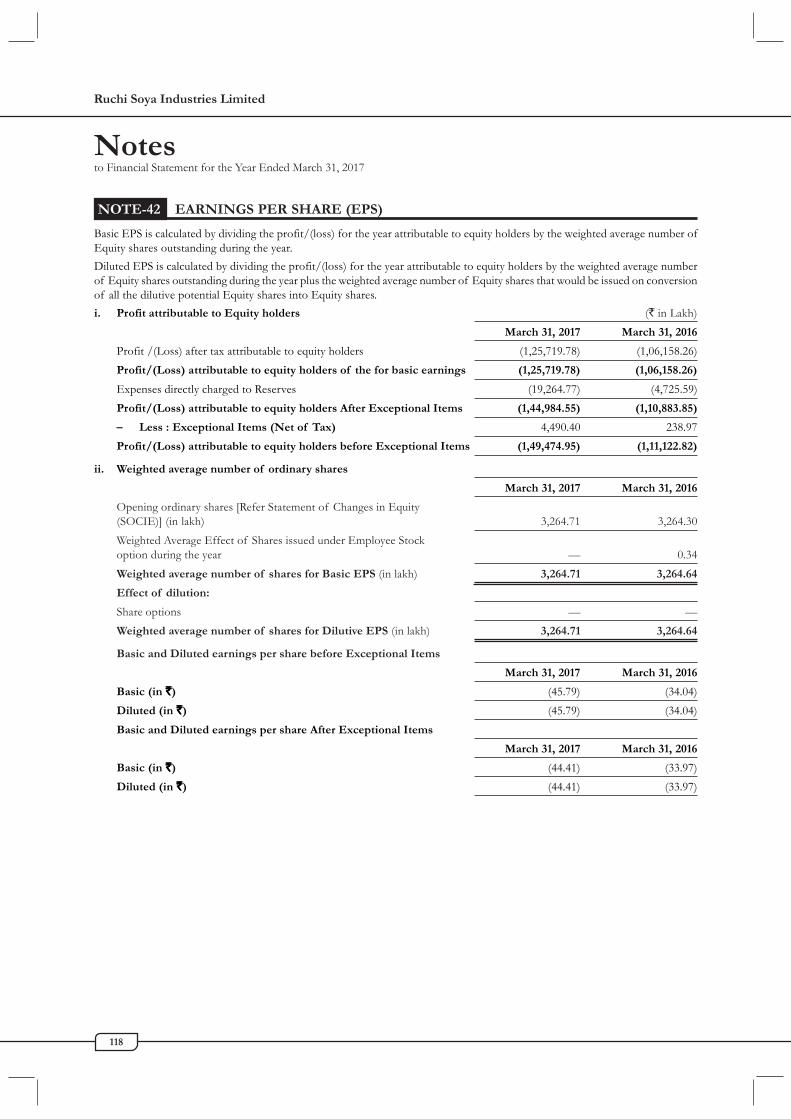
Ruchi Soya Industries Limited
118
Notesto Financial Statement for the Year Ended March 31, 2017
NOTE-42 EARNINGS PER SHARE (EPS)
Basic EPS is calculated by dividing the profit/(loss) for the year attributable to equity holders by the weighted average number ofEquity shares outstanding during the year.Diluted EPS is calculated by dividing the profit/(loss) for the year attributable to equity holders by the weighted average numberof Equity shares outstanding during the year plus the weighted average number of Equity shares that would be issued on conversionof all the dilutive potential Equity shares into Equity shares.i. Profit attributable to Equity holders (` in Lakh)
March 31, 2017 March 31, 2016
Profit /(Loss) after tax attributable to equity holders (1,25,719.78) (1,06,158.26)Profit/(Loss) attributable to equity holders of the for basic earnings (1,25,719.78) (1,06,158.26)
Expenses directly charged to Reserves (19,264.77) (4,725.59)Profit/(Loss) attributable to equity holders After Exceptional Items (1,44,984.55) (1,10,883.85)
– Less : Exceptional Items (Net of Tax) 4,490.40 238.97Profit/(Loss) attributable to equity holders before Exceptional Items (1,49,474.95) (1,11,122.82)
ii. Weighted average number of ordinary shares
March 31, 2017 March 31, 2016
Opening ordinary shares [Refer Statement of Changes in Equity(SOCIE)] (in lakh) 3,264.71 3,264.30Weighted Average Effect of Shares issued under Employee Stockoption during the year — 0.34Weighted average number of shares for Basic EPS (in lakh) 3,264.71 3,264.64
Effect of dilution:
Share options — —Weighted average number of shares for Dilutive EPS (in lakh) 3,264.71 3,264.64
Basic and Diluted earnings per share before Exceptional Items
March 31, 2017 March 31, 2016
Basic (in `̀̀̀̀) (45.79) (34.04)Diluted (in `̀̀̀̀) (45.79) (34.04)Basic and Diluted earnings per share After Exceptional Items
March 31, 2017 March 31, 2016
Basic (in `̀̀̀̀) (44.41) (33.97)Diluted (in `̀̀̀̀) (44.41) (33.97)

Annual Report 2016-17
119
Notesto Financial Statement for the Year Ended March 31, 2017
NOTE-43 OFFSETTING FINANCIAL ASSETS AND FINANCIAL LIABILITIESThe following table presents the recognised financial instruments that are offset, or subject to enforceable master netting arrangementsand other similar agreements but not offset, as at March 31, 2017, March 31, 2016 and April 1, 2015.A March 31, 2017 (` in Lakh)
Particulars Effects of offsetting on the balance sheet Related amounts not offset
Gross Amounts Gross amounts Net amounts Amounts subject Financial Net Amountset off in the presented in the to master netting Instrument
balance sheet balance sheet arrangements collateral
March 31, 2017Financial AssetsCurrent Financial assetsCurrent Financial assets 5,27,943.78 — 5,27,943.78 — 5,27,943.78 —Total 5,27,943.78 — 5,27,943.78 — 5,27,943.78 —Financial liabilities
Borrowings [Refer Note c below] 5,32,937.06 — 5,32,937.06 — 5,27,943.78 4,993.28Total 5,32,937.06 — 5,32,937.06 — 5,27,943.78 4,993.28
B March 31, 2016 (` in Lakh)Particulars Effects of offsetting on the balance sheet Related amounts not offset
Gross Amounts Gross amounts Net amounts Amounts subject Financial Net Amountset off in the presented in the to master netting Instrument
balance sheet balance sheet arrangements collateral
March 31, 2016Financial assetsCurrent Financial assets 6,69,942.55 — 6,69,942.55 — 5,26,855.17 1,43,087.38Total 6,69,942.55 — 6,69,942.55 — 5,26,855.17 1,43,087.38Financial liabilities Borrowings [Refer Note c below] 5,26,816.67 — 5,26,816.67 — 5,26,816.67 - Other financial liability 88,946.01 — 88,946.01 — 38.50 88,907.51Total 6,15,762.68 — 6,15,762.68 — 5,26,855.17 88,907.51
C April 1, 2015 — (` in Lakh)Particulars Effects of offsetting on the balance sheet Related amounts not offset
Gross Amounts Gross amounts Net amounts Amounts subject Financial Net Amountset off in the presented in the to master netting Instrument
balance sheet balance sheet arrangements collateral
April 1, 2015Financial assetsCurrent Financial assets 6,71,966.80 — 6,71,966.80 — 4,21,733.95 2,50,232.85Total 6,71,966.80 — 6,71,966.80 — 4,21,733.95 2,50,232.85Financial liabilities Borrowings [Refer Note c below] 4,21,692.40 — 4,21,692.40 — 4,21,692.40 - Other financial liability 55,968.78 — 55,968.78 — 41.55 55,927.23Total 4,77,661.18 — 4,77,661.18 — 4,21,733.95 55,927.23
Note:(i) Offsetting arrangements
(a) BorrowingsThe Company has taken borrowings by providing interalia current financial assets as security to the banks.
(b) Other Financial LiabilityThe Company has unclaimed dividends liability againts which Company has deposited the said amounts in a separatebank account classified under current financial asset.
(c) Includes amounts classified under ‘other financial liabilities’.(d) For the purpose of offsetting financial assets against financial liabilities as mentioned above, first preference is to be
given to borrowings and then to other financial liabilities.

Ruchi Soya Industries Limited
120
Notesto Financial Statement for the Year Ended March 31, 2017
NOTE-44 HEDGE ACCOUNTING
Inte
rest
rate
risk
The C
ompa
ny's
risk m
anag
emen
t poli
cy is
to en
sure
that
major
ity of
its fo
reign
curre
ncy l
oans
relat
ed in
terest
rate
expo
sure
is at
fixed
rate.
This
is ac
hieve
d by u
sing i
ntere
st rat
e swa
ps to
hedg
e floa
ting r
ate fo
reign
curre
ncy
borro
wing
s. The
Com
pany
appli
es a h
edge
ratio
of 1:
1.A.
Dis
clos
ure
of e
ffect
s of
hedg
e ac
coun
ting
on fi
nanc
ial p
ositi
on(i)
Mar
ch 3
1, 20
17(`
in La
kh)
Type
of
hedg
e an
d ris
ksN
omin
al V
alue
Carr
ying
amou
nt o
fLi
ne it
em in
the
stat
emen
t of
Mat
urity
dat
eH
edge
ratio
Chan
ges i
n(in
USD
)he
dgin
g in
stru
men
tfin
anci
al p
ositi
on w
here
the
hedg
ing
fair
valu
ein
stru
men
t is i
nclu
ded
Cas
h flo
w h
edge
Asse
tsLi
abili
ties
Asse
tsLi
abili
ties
Inter
est r
ate sw
aps
Liab
ilitie
s N
.A N
.A*
200.3
0—
— O
ther
non-
curre
nt fi
nanc
ial lia
bilitie
s—
Oth
er cu
rrent
fina
ncial
liabil
ities
Tota
l—
200.
30
(ii)
Mar
ch 3
1, 20
16(`
in La
kh)
Type
of
hedg
e an
d ris
ksN
omin
al V
alue
Carr
ying
amou
nt o
fLi
ne it
em in
the
stat
emen
t of
Mat
urity
dat
eH
edge
ratio
Chan
ges i
n(in
USD
)he
dgin
g in
stru
men
tfin
anci
al p
ositi
on w
here
the
hedg
ing
fair
valu
ein
stru
men
t is i
nclu
ded
Cas
h flo
w h
edge
Asse
tsLi
abili
ties
Asse
tsLi
abili
ties
Inter
est r
ate sw
aps
Liab
ilitie
s20
16-2
018
Appr
oxim
ately
1:134
4.26
632.6
062
.20 O
ther
non-
curre
nt fi
nanc
ial lia
bilitie
s—
138.1
0 O
ther
curre
nt fi
nanc
ial lia
bilitie
sTo
tal
200.
3034
4.26
(iiii)
April
1, 2
015
(` in
Lakh
)Ty
pe o
f he
dge
and
risks
Nom
inal
Val
ueCa
rryi
ng am
ount
of
Line
item
in th
e st
atem
ent o
fM
atur
ity d
ate
Hed
ge ra
tioCh
ange
s in
(in U
SD)
hedg
ing
inst
rum
ent
finan
cial
pos
ition
whe
re th
e he
dgin
gfa
ir va
lue
inst
rum
ent i
s inc
lude
d
Cas
h flo
w h
edge
Asse
tsLi
abili
ties
Asse
tsLi
abili
ties
Inter
est r
ate sw
aps
Liab
ilitie
s20
15-2
018
Appr
oxim
ately
1:116
.581,1
92.60
307.2
0 O
ther
non-
curre
nt fi
nanc
ial lia
bilitie
s—
237.3
6 O
ther
curre
nt fi
nanc
ial lia
bilitie
sTo
tal
544.
5716
.58
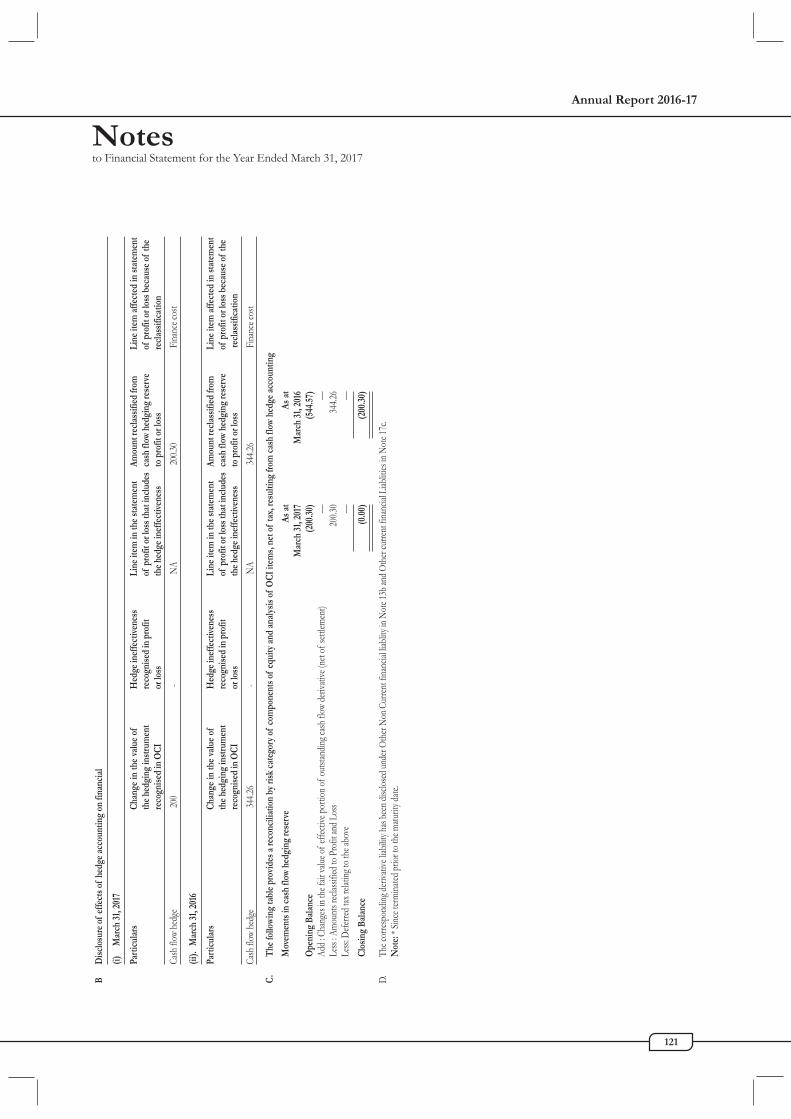
Annual Report 2016-17
121
Notesto Financial Statement for the Year Ended March 31, 2017
BD
iscl
osur
e of
effe
cts o
f he
dge
acco
untin
g on
fina
ncia
l
(i)M
arch
31,
2017
Part
icul
ars
Chan
ge in
the
valu
e of
Hed
ge in
effe
ctiv
enes
sLi
ne it
em in
the
stat
emen
tAm
ount
recl
assi
fied
from
Line
item
affe
cted
in st
atem
ent
the
hedg
ing
inst
rum
ent
reco
gnis
ed in
pro
fitof
pro
fit o
r los
s tha
t inc
lude
sca
sh fl
ow h
edgi
ng re
serv
eof
pro
fit o
r los
s bec
ause
of
the
reco
gnis
ed in
OCI
or lo
ssth
e he
dge
inef
fect
iven
ess
to p
rofit
or l
oss
recl
assi
ficat
ion
Cash
flow
hedg
e 20
0 -
NA
200.3
0 Fi
nanc
e cos
t
(ii).
Mar
ch 3
1, 20
16
Part
icul
ars
Chan
ge in
the
valu
e of
Hed
ge in
effe
ctiv
enes
sLi
ne it
em in
the
stat
emen
tAm
ount
recl
assi
fied
from
Line
item
affe
cted
in st
atem
ent
the
hedg
ing
inst
rum
ent
reco
gnis
ed in
pro
fitof
pro
fit o
r los
s tha
t inc
lude
sca
sh fl
ow h
edgi
ng re
serv
eof
pro
fit o
r los
s bec
ause
of
the
reco
gnis
ed in
OCI
or lo
ssth
e he
dge
inef
fect
iven
ess
to p
rofit
or l
oss
recl
assi
ficat
ion
Cash
flow
hedg
e 34
4.26
- N
A 34
4.26
Fina
nce c
ost
C.
The
follo
win
g ta
ble
prov
ides
a re
conc
iliat
ion
by ri
sk c
ateg
ory
of c
ompo
nent
s of
equi
ty a
nd a
naly
sis o
f O
CI it
ems,
net o
f ta
x, re
sulti
ng fr
om c
ash
flow
hed
ge a
ccou
ntin
g
Mov
emen
ts in
cas
h flo
w h
edgi
ng re
serv
eAs
at
As a
tM
arch
31,
2017
Mar
ch 3
1, 20
16O
peni
ng B
alan
ce (2
00.3
0) (5
44.5
7)Ad
d : C
hang
es in
the f
air va
lue of
effec
tive p
ortio
n of o
utstan
ding c
ash flo
w de
rivati
ve (n
et of
settl
emen
t)—
—Le
ss : A
moun
ts rec
lassif
ied to
Prof
it and
Los
s 20
0.30
344.2
6Le
ss: D
eferre
d tax
relat
ing to
the a
bove
— —
Clos
ing
Bala
nce
(0.0
0) (2
00.3
0)
D.Th
e cor
respo
nding
deriv
ative
liabil
ity ha
s bee
n disc
losed
unde
r Oth
er No
n Cur
rent f
inanc
ial lia
blity
in No
te 13
b and
Oth
er cu
rrent
finan
cial L
iabliti
es in
Note
17c.
Not
e: *
Since
term
inated
prior
to th
e matu
rity d
ate.
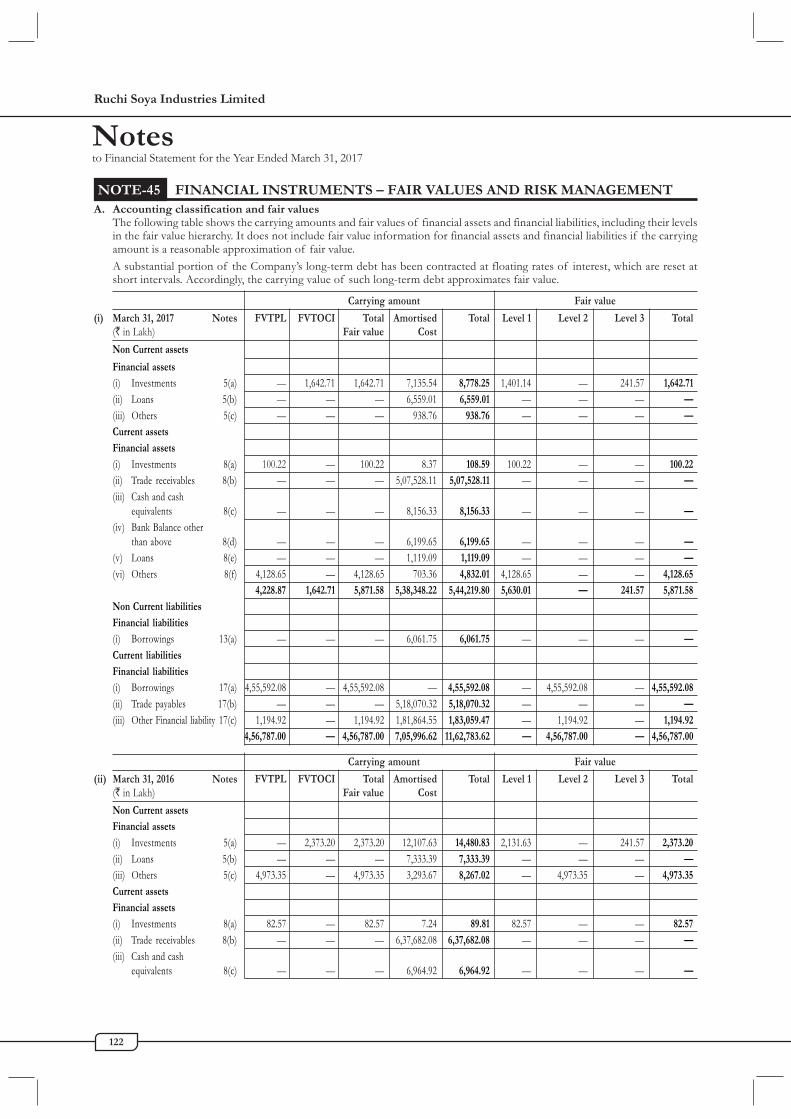
Ruchi Soya Industries Limited
122
Notesto Financial Statement for the Year Ended March 31, 2017
A. Accounting classification and fair valuesThe following table shows the carrying amounts and fair values of financial assets and financial liabilities, including their levelsin the fair value hierarchy. It does not include fair value information for financial assets and financial liabilities if the carryingamount is a reasonable approximation of fair value.A substantial portion of the Company’s long-term debt has been contracted at floating rates of interest, which are reset atshort intervals. Accordingly, the carrying value of such long-term debt approximates fair value.
Carrying amount Fair value
(i) March 31, 2017 Notes FVTPL FVTOCI Total Amortised Total Level 1 Level 2 Level 3 Total(` in Lakh) Fair value Cost
Non Current assets
Financial assets(i) Investments 5(a) — 1,642.71 1,642.71 7,135.54 8,778.25 1,401.14 — 241.57 1,642.71(ii) Loans 5(b) — — — 6,559.01 6,559.01 — — — —(iii) Others 5(c) — — — 938.76 938.76 — — — —Current assetsFinancial assets(i) Investments 8(a) 100.22 — 100.22 8.37 108.59 100.22 — — 100.22(ii) Trade receivables 8(b) — — — 5,07,528.11 5,07,528.11 — — — —(iii) Cash and cash
equivalents 8(c) — — — 8,156.33 8,156.33 — — — —(iv) Bank Balance other
than above 8(d) — — — 6,199.65 6,199.65 — — — —(v) Loans 8(e) — — — 1,119.09 1,119.09 — — — —(vi) Others 8(f) 4,128.65 — 4,128.65 703.36 4,832.01 4,128.65 — — 4,128.65
4,228.87 1,642.71 5,871.58 5,38,348.22 5,44,219.80 5,630.01 — 241.57 5,871.58Non Current liabilitiesFinancial liabilities(i) Borrowings 13(a) — — — 6,061.75 6,061.75 — — — —Current liabilitiesFinancial liabilities(i) Borrowings 17(a) 4,55,592.08 — 4,55,592.08 — 4,55,592.08 — 4,55,592.08 — 4,55,592.08(ii) Trade payables 17(b) — — — 5,18,070.32 5,18,070.32 — — — —(iii) Other Financial liability 17(c) 1,194.92 — 1,194.92 1,81,864.55 1,83,059.47 — 1,194.92 — 1,194.92
4,56,787.00 — 4,56,787.00 7,05,996.62 11,62,783.62 — 4,56,787.00 — 4,56,787.00
Carrying amount Fair value
(ii) March 31, 2016 Notes FVTPL FVTOCI Total Amortised Total Level 1 Level 2 Level 3 Total(` in Lakh) Fair value Cost
Non Current assetsFinancial assets(i) Investments 5(a) — 2,373.20 2,373.20 12,107.63 14,480.83 2,131.63 — 241.57 2,373.20(ii) Loans 5(b) — — — 7,333.39 7,333.39 — — — —(iii) Others 5(c) 4,973.35 — 4,973.35 3,293.67 8,267.02 — 4,973.35 — 4,973.35Current assetsFinancial assets(i) Investments 8(a) 82.57 — 82.57 7.24 89.81 82.57 — — 82.57(ii) Trade receivables 8(b) — — — 6,37,682.08 6,37,682.08 — — — —(iii) Cash and cash
equivalents 8(c) — — — 6,964.92 6,964.92 — — — —
NOTE-45 FINANCIAL INSTRUMENTS – FAIR VALUES AND RISK MANAGEMENT

Annual Report 2016-17
123
Notesto Financial Statement for the Year Ended March 31, 2017
(iv) Bank Balance otherthan above 8(d) — — — 7,138.31 7,138.31 — — — —
(v) Loans 8(e) — — — 9,800.41 9,800.41 — — — —(vi) Other 8(f) — — — 1,146.50 1,146.50 — — — —
5,055.92 2,373.20 7,429.12 6,85,474.15 6,92,903.27 2,214.20 4,973.35 241.57 7,429.12Non Current liabilitiesFinancial liabilities(i) Borrowings 13(a) — — — 6,238.33 6,238.33 — — — —(ii) Other Financial liability 13(b) — — — 18.33 18.33 — — — —Current liabilitiesFinancial liabilities(i) Borrowings 17(a) 4,41,591.24 — 4,41,591.24 — 4,41,591.24 — 4,41,591.24 — 4,41,591.24(ii) Trade payables 17(b) — — — 5,98,367.03 5,98,367.03 — — — —(iii) Other Financial liability 17(c) 66,380.70 — 66,380.70 1,01,614.61 1,67,995.31 — 66,380.70 — 66,380.70
5,07,971.94 — 5,07,971.94 7,06,238.30 12,14,210.24 — 5,07,971.94 — 5,07,971.94
Carrying amount Fair value
(iii) April 1, 2015 Notes FVTPL FVTOCI Total Amortised Total Level 1 Level 2 Level 3 Total(` in Lakh) Fair value Cost
Non Current assets
Financial assets(i) Investments 5(a) — 2,732.06 2,732.06 11,836.26 14,568.32 2,497.39 — 234.67 2,732.06(ii) Loans 5(b) — — — 5,671.77 5,671.77 — — — —(iii) Others 5(c) — — — 1,079.68 1,079.68 — — — —Current assetsFinancial assets(i) Investments 8(a) 84.32 — 84.32 6.88 91.20 84.32 — — 84.32(ii) Trade receivables 8(b) — — — 6,06,476.03 6,06,476.03 — — — —(iii) Cash and cash
equivalents 8(c) — — — 5,740.03 5,740.03 — — — —(iv) Bank Balance other
than above 8(d) — — — 46,211.90 46,211.90 — — — —(v) Loans 8(e) — — — 8,256.31 8,256.31 — — — —(vi) Others 8(f) 1,376.88 — 1,376.88 3,814.45 5,191.33 — 1,376.88 — 1,376.88
1,461.20 2,732.06 4,193.26 6,89,093.31 6,93,286.57 2,581.71 1,376.88 234.67 4,193.26Non Current liabilitiesFinancial liabilities(i) Borrowings 13(a) — — — 6,985.91 6,985.91 — — — —(ii) Other Financial liability 13(b) — — — 18.33 18.33 — — — —Current liabilitiesFinancial liabilities(i) Borrowings 17(a) 3,10,738.48 — 3,10,738.48 — 3,10,738.48 — 3,10,738.48 — 3,10,738.48(ii) Trade payables 17(b) — — — 6,19,393.79 6,19,393.79 — — — —(iii) Other Financial liability 17(c) 53,039.14 — 53,039.14 1,07,204.85 1,60,243.99 479.90 52,559.24 — 53,039.14
3,63,777.62 — 3,63,777.62 7,33,602.88 10,97,380.50 479.90 3,63,297.72 — 3,63,777.62
Carrying amount Fair value
(i) March 31, 2016 Notes FVTPL FVTOCI Total Amortised Total Level 1 Level 2 Level 3 Total(` in Lakh) Fair value Cost

Ruchi Soya Industries Limited
124
Notesto Financial Statement for the Year Ended March 31, 2017
B. Measurement of fair values
Valuation techniques and significant unobservable inputsFair values are categorised into different levels in a fair value hierarchy based on the inputs used in the valuation techniques as follows:Level 1: quoted prices (unadjusted) in active markets for identical assets or liabilities.Level 2: inputs other than quoted prices included in Level 1 that are observable for the asset or liability, either directly (i.e. as prices) or indirectly (i.e.derived from prices).Level 3: inputs for the asset or liability that are not based on observable market data (unobservable inputs).The following tables show the valuation techniques used in measuring Level 2 and Level 3 fair values, as well as the significant unobservable inputs used.Financial instruments measured at fair value
Type Valuation technique
Currency Futures Based on exchange rates listed on NSE/MCX stock exchangeCommodity futures Based on commodity prices listed on MCX/ NCDX/ACE stock exchangeForward contracts Based on FEDAI RatesInterest rate swaps Based on Closing Rates provided by BanksOpen purchase and sale contracts Based on commodity prices listed on NCDEX stock exchange,and prices Available on Solvent
Extractor’s association (SEA) along with quotations from brokers and adjustments made for gradeand location of commodity
Options Based on Closing Rates provided by Banks
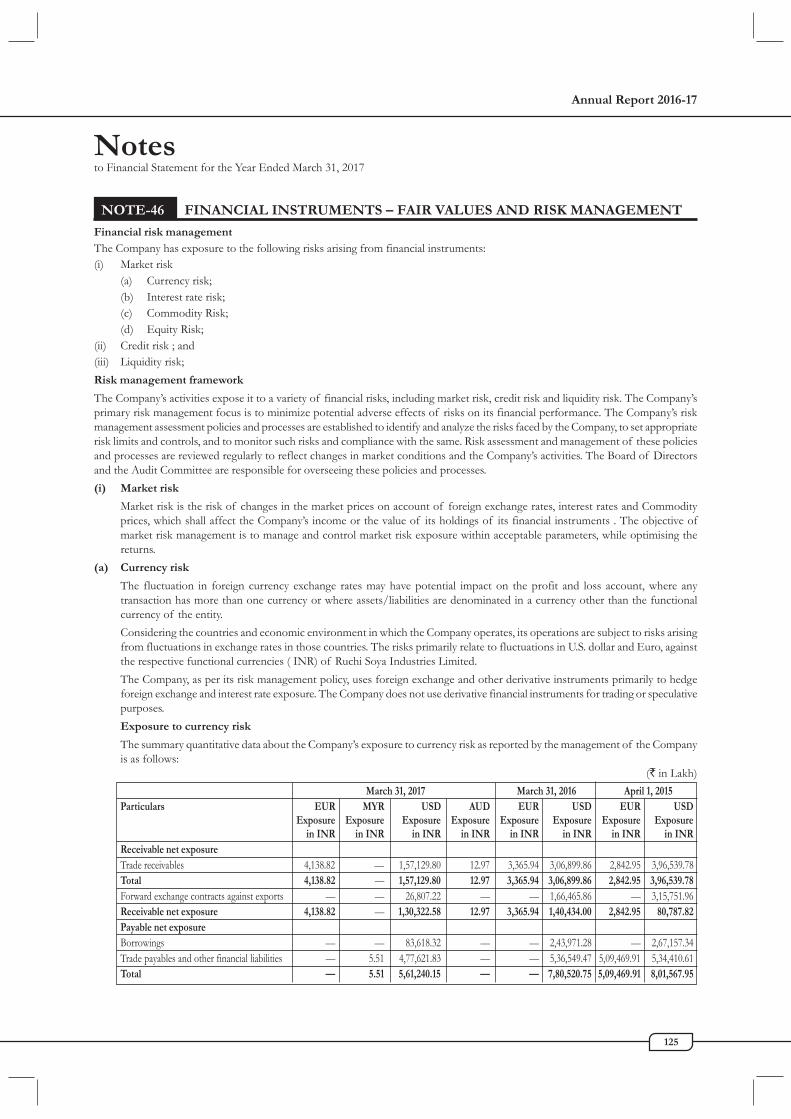
Annual Report 2016-17
125
Notesto Financial Statement for the Year Ended March 31, 2017
NOTE-46 FINANCIAL INSTRUMENTS – FAIR VALUES AND RISK MANAGEMENT
Financial risk managementThe Company has exposure to the following risks arising from financial instruments:(i) Market risk
(a) Currency risk;(b) Interest rate risk;(c) Commodity Risk;(d) Equity Risk;
(ii) Credit risk ; and(iii) Liquidity risk;Risk management framework
The Company’s activities expose it to a variety of financial risks, including market risk, credit risk and liquidity risk. The Company’sprimary risk management focus is to minimize potential adverse effects of risks on its financial performance. The Company’s riskmanagement assessment policies and processes are established to identify and analyze the risks faced by the Company, to set appropriaterisk limits and controls, and to monitor such risks and compliance with the same. Risk assessment and management of these policiesand processes are reviewed regularly to reflect changes in market conditions and the Company’s activities. The Board of Directorsand the Audit Committee are responsible for overseeing these policies and processes.(i) Market risk
Market risk is the risk of changes in the market prices on account of foreign exchange rates, interest rates and Commodityprices, which shall affect the Company’s income or the value of its holdings of its financial instruments . The objective ofmarket risk management is to manage and control market risk exposure within acceptable parameters, while optimising thereturns.
(a) Currency risk
The fluctuation in foreign currency exchange rates may have potential impact on the profit and loss account, where anytransaction has more than one currency or where assets/liabilities are denominated in a currency other than the functionalcurrency of the entity.Considering the countries and economic environment in which the Company operates, its operations are subject to risks arisingfrom fluctuations in exchange rates in those countries. The risks primarily relate to fluctuations in U.S. dollar and Euro, againstthe respective functional currencies ( INR) of Ruchi Soya Industries Limited.The Company, as per its risk management policy, uses foreign exchange and other derivative instruments primarily to hedgeforeign exchange and interest rate exposure. The Company does not use derivative financial instruments for trading or speculativepurposes.Exposure to currency risk
The summary quantitative data about the Company’s exposure to currency risk as reported by the management of the Companyis as follows:
(` in Lakh)March 31, 2017 March 31, 2016 April 1, 2015
Particulars EUR MYR USD AUD EUR USD EUR USDExposure Exposure Exposure Exposure Exposure Exposure Exposure Exposure
in INR in INR in INR in INR in INR in INR in INR in INRReceivable net exposureTrade receivables 4,138.82 — 1,57,129.80 12.97 3,365.94 3,06,899.86 2,842.95 3,96,539.78Total 4,138.82 — 1,57,129.80 12.97 3,365.94 3,06,899.86 2,842.95 3,96,539.78Forward exchange contracts against exports — — 26,807.22 — — 1,66,465.86 — 3,15,751.96Receivable net exposure 4,138.82 — 1,30,322.58 12.97 3,365.94 1,40,434.00 2,842.95 80,787.82Payable net exposureBorrowings — — 83,618.32 — — 2,43,971.28 — 2,67,157.34Trade payables and other financial liabilities — 5.51 4,77,621.83 — — 5,36,549.47 5,09,469.91 5,34,410.61Total — 5.51 5,61,240.15 — — 7,80,520.75 5,09,469.91 8,01,567.95

Ruchi Soya Industries Limited
126
Notesto Financial Statement for the Year Ended March 31, 2017
March 31, 2017 March 31, 2016 April 1, 2015Particulars EUR MYR USD AUD EUR USD EUR USD
Exposure Exposure Exposure Exposure Exposure Exposure Exposure Exposure in INR in INR in INR in INR in INR in INR in INR in INR
Forward exchange contracts against importsand foreign currency payables 6,853.90 1,47,806.66 1,34,318.37Currency option contracts 3,74,032.30 4,77,593.89Payable net exposure — 5.51 5,54,386.25 — — 2,58,681.79 5,09,469.91 1,89,655.69
Total net exposure on Receviables /(Payables) 4,138.82 (5.51) (4,24,063.67) 12.97 3,365.94 (1,18,247.79) (5,06,626.96) (1,08,867.87)
Sensitivity analysis
A 1% strenghtening / weakening of the respective foreign currencies with respect to functional currency of Company wouldresult in increase or decrease in profit or loss as shown in table below. The following analysis has been worked out based on theexposures as of the date of statements of financial position.
Profit/(Loss) March 31, 2017 Profit/(Loss) March 31, 2016 Equity April 1, 2015
Effect in Indian Rupees Strengthening Weakening Strengthening Weakening Strengthening Weakening
EUR 41.39 (41.39) 33.66 (33.66) — —USD (4,240.64) 4,240.64 (1,182.48) 1,182.48 (520.10) 520.10AUD 0.13 (0.13) — — — —MYR (0.06) 0.06 — — — —
(b) Interest rate risk
Interest rate risk is the risk that the fair value or future cash flows of a financial instrument will fluctuate because of changes inmarket interest rates. The Company’s exposure to market risk for changes in interest rates relates to borrowings from financialinstitutions. The Company manages its interest rate risk arising from foreign currency floating rate loans by using interest rateswaps as hedges of variability in cash flows attributable to interest rate risk.For details of the Company’s short-term and long term loans and borrowings, Refer Note 13(a), 17 (a) and 17(c) of thesefinancial statements.Interest rate sensitivity - fixed rate instruments
The Company’s fixed rate borrowings Preference Shares issued to Ruchi Infrastructure Limited @ 6% in the year 2010-2011and Invetments into Preference Shares of GHI Energy Private Limited @ 6% in the year 2011-2012 are carried at amortisedcost. They are therefore not subject to interest rate risk as defined in Ind AS 107, since neither the carrying amount nor thefuture cash flow will fluctuate because of a change in market interest rates.Interest rate sensitivity - variable rate instruments
A reasonably possible change of 100 basis points in interest rates at the reporting date would have increased /(decreased) equityand profit or loss by amounts shown below. This analysis assumes that all other variables, in particular, foreign currencyexchange rates, remain constant. This calculation also assumes that the change occurs at the balance sheet date and has beencalculated based on risk exposures outstanding as at that date. The period end balances are not necessarily representative of theaverage debt outstanding during the period.
(` in Lakh)A. March 31, 2017
Impact on Profit/(loss) before tax Direct impact on Equity
Particulars 100 bp increase 100 bp decrease 100 bp increase 100 bp decrease
On account of Variable RateBorrowings from Banks (5,266.99) 5,266.99 — —Sensitivity (5,266.99) 5,266.99 — —
(` in Lakh)

Annual Report 2016-17
127
Notesto Financial Statement for the Year Ended March 31, 2017
(` in Lakh)B. March 31, 2016
Impact on Profit/(loss) before tax Direct impact on Equity
Particulars 100 bp increase 100 bp decrease 100 bp increase 100 bp decrease
On account of Variable RateBorrowings from Banks (5,198.29) 5,198.29 — —Sensitivity (5,198.29) 5,198.29 — —
(c) Commodity risk
The prices of agricultural commodities are subject to wide fluctuations due to unpredictable factors such as weather, governmentpolicies, changes in global demand resulting from population growth and changes in standards of living and global productionof similar and competitive crops. During its ordinary course of business, the value of the Company’s open sales and purchasescommitments and inventory of raw material changes continuously in line with movements in the prices of the underlyingcommodities. To the extent that its open sales and purchases commitments do not match at the end of each business day, theCompany is subjected to price fluctuations in the commodities market.While the Company is exposed to fluctuations in agricultural commodities prices, its policy is to minimise its risks arising fromsuch fluctuations by hedging its sales either through direct purchases of a similar commodity or through futures contracts onthe commodity exchanges. The prices on the commodity exchanges are generally quoted up to twelve months forward.In the course of hedging its sales either through direct purchases or through futures, the Company may also be exposed to theinherent risk associated with trading activities conducted by its personnel. The Company has in place a risk management systemto manage such risk exposure.At the balance sheet date, a 1% increase/decrease of the commodities price indices, with all other variables remaining constant,would result in (decrease)/increase in profit before tax and equity by the amounts as shown below:
(` in Lakh)Profit/(loss)
March 31, 2017Increase Decrease
Effect of increase / (decrease) in pricesProfit before taxes 657.69 (657.69)Assumptions used for calculationInventory Commodity price * 1%Derivative contract Rate * 1%
(d) Equity risk
Equity Price Risk is related to the change in market reference price of the investments in equity securities. The fair value ofsome of the Company’s investments in Fair value through Other Comprehensive Income securities exposes the Company toequity price risks. In general, these securities are not held for trading purposes. These investments are subject to changes in themarket price of securities. The fair value of equity securities as of March 31, 2017, was ` 1,636.70 Lakh [ FY 2015-2016` 2,367.19 Lakh]. A sensex standard deviation of 5% [ FY 2015-2016 6% ] would result in change in equity prices of securitiesheld as of March 31, 2017 by ` 81.83 Lakh. [ FY 2015-2016 ` 142.03 Lakh]
(ii) Credit Risk
Credit risk is the risk of financial loss to the Company if a customer or counterparty to a financial instrument fails to meet itscontractual obligations and arises principally from the Company’s receivables from customer. The Company establishes anallowance for doubtful debts and impairment that represents its estimate on Expected Loss model .
A. Trade and other receivables
The Company’s exposure to credit risk is influenced mainly by the individual characteristics of each customer. The demographicsof the customer, including the default risk of the industry has an influence on credit risk assessment. Credit risk is managedthrough credit approvals, establishing credit limits and continuously monitoring the creditworthiness of customers to whichthe Company grants credit terms in the normal course of business.
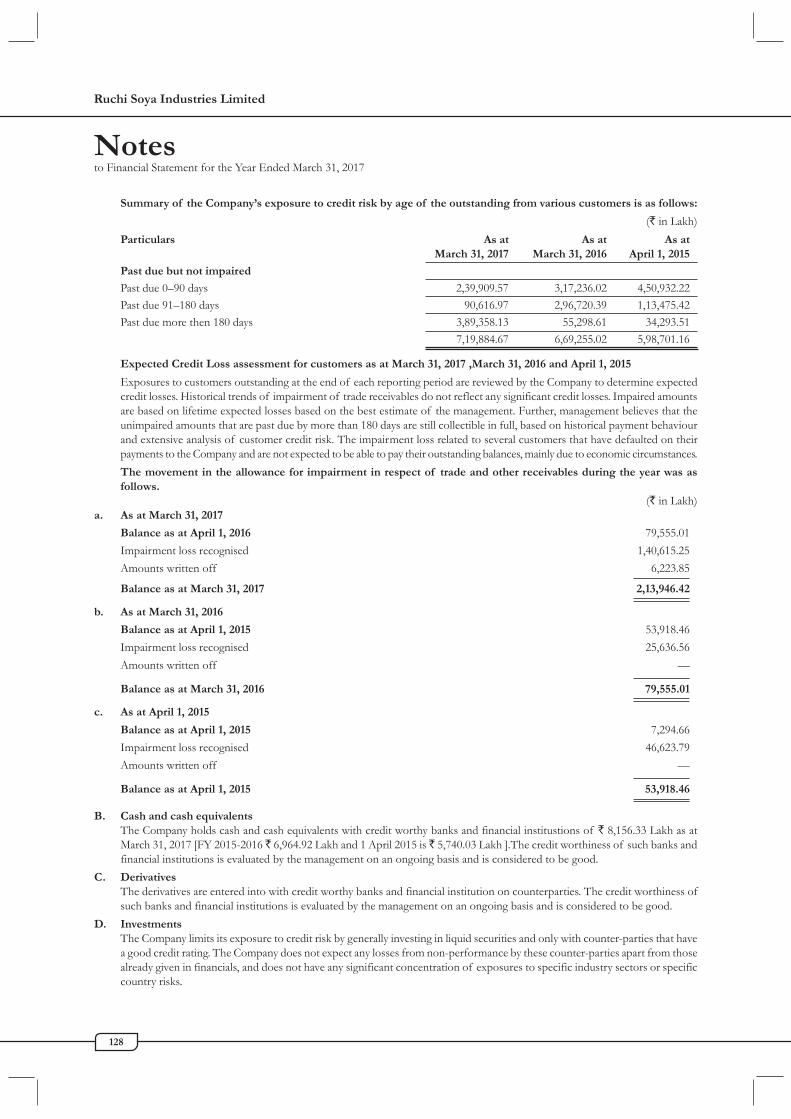
Ruchi Soya Industries Limited
128
Notesto Financial Statement for the Year Ended March 31, 2017
Summary of the Company’s exposure to credit risk by age of the outstanding from various customers is as follows:
(` in Lakh)Particulars As at As at As at
March 31, 2017 March 31, 2016 April 1, 2015
Past due but not impaired
Past due 0–90 days 2,39,909.57 3,17,236.02 4,50,932.22Past due 91–180 days 90,616.97 2,96,720.39 1,13,475.42Past due more then 180 days 3,89,358.13 55,298.61 34,293.51
7,19,884.67 6,69,255.02 5,98,701.16
Expected Credit Loss assessment for customers as at March 31, 2017 ,March 31, 2016 and April 1, 2015
Exposures to customers outstanding at the end of each reporting period are reviewed by the Company to determine expectedcredit losses. Historical trends of impairment of trade receivables do not reflect any significant credit losses. Impaired amountsare based on lifetime expected losses based on the best estimate of the management. Further, management believes that theunimpaired amounts that are past due by more than 180 days are still collectible in full, based on historical payment behaviourand extensive analysis of customer credit risk. The impairment loss related to several customers that have defaulted on theirpayments to the Company and are not expected to be able to pay their outstanding balances, mainly due to economic circumstances.The movement in the allowance for impairment in respect of trade and other receivables during the year was asfollows.
(` in Lakh)a. As at March 31, 2017
Balance as at April 1, 2016 79,555.01Impairment loss recognised 1,40,615.25Amounts written off 6,223.85
Balance as at March 31, 2017 2,13,946.42
b. As at March 31, 2016
Balance as at April 1, 2015 53,918.46Impairment loss recognised 25,636.56Amounts written off —
Balance as at March 31, 2016 79,555.01
c. As at April 1, 2015
Balance as at April 1, 2015 7,294.66Impairment loss recognised 46,623.79Amounts written off —
Balance as at April 1, 2015 53,918.46
B. Cash and cash equivalentsThe Company holds cash and cash equivalents with credit worthy banks and financial institustions of ` 8,156.33 Lakh as atMarch 31, 2017 [FY 2015-2016 ̀ 6,964.92 Lakh and 1 April 2015 is ̀ 5,740.03 Lakh ].The credit worthiness of such banks andfinancial institutions is evaluated by the management on an ongoing basis and is considered to be good.
C. DerivativesThe derivatives are entered into with credit worthy banks and financial institution on counterparties. The credit worthiness ofsuch banks and financial institutions is evaluated by the management on an ongoing basis and is considered to be good.
D. InvestmentsThe Company limits its exposure to credit risk by generally investing in liquid securities and only with counter-parties that havea good credit rating. The Company does not expect any losses from non-performance by these counter-parties apart from thosealready given in financials, and does not have any significant concentration of exposures to specific industry sectors or specificcountry risks.
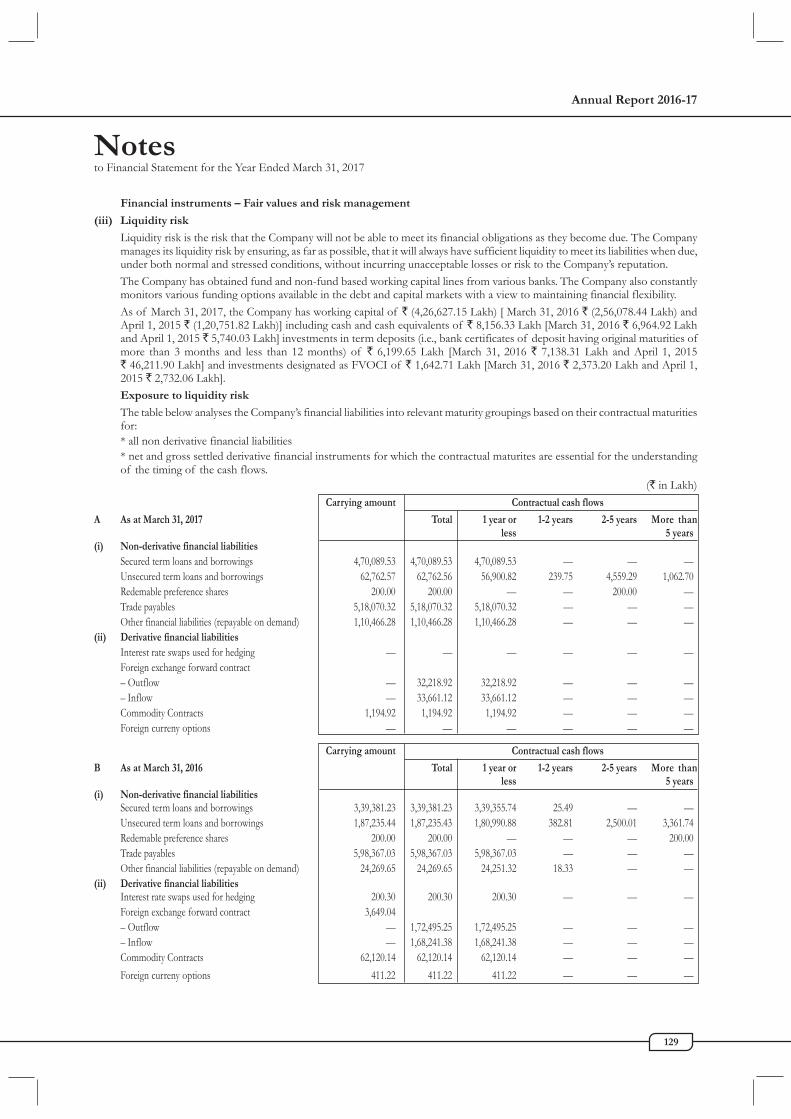
Annual Report 2016-17
129
Notesto Financial Statement for the Year Ended March 31, 2017
Financial instruments – Fair values and risk management
(iii) Liquidity risk
Liquidity risk is the risk that the Company will not be able to meet its financial obligations as they become due. The Companymanages its liquidity risk by ensuring, as far as possible, that it will always have sufficient liquidity to meet its liabilities when due,under both normal and stressed conditions, without incurring unacceptable losses or risk to the Company’s reputation.The Company has obtained fund and non-fund based working capital lines from various banks. The Company also constantlymonitors various funding options available in the debt and capital markets with a view to maintaining financial flexibility.As of March 31, 2017, the Company has working capital of ` (4,26,627.15 Lakh) [ March 31, 2016 ` (2,56,078.44 Lakh) andApril 1, 2015 ` (1,20,751.82 Lakh)] including cash and cash equivalents of ` 8,156.33 Lakh [March 31, 2016 ` 6,964.92 Lakhand April 1, 2015 ` 5,740.03 Lakh] investments in term deposits (i.e., bank certificates of deposit having original maturities ofmore than 3 months and less than 12 months) of ` 6,199.65 Lakh [March 31, 2016 ` 7,138.31 Lakh and April 1, 2015` 46,211.90 Lakh] and investments designated as FVOCI of ` 1,642.71 Lakh [March 31, 2016 ` 2,373.20 Lakh and April 1,2015 ` 2,732.06 Lakh].Exposure to liquidity risk
The table below analyses the Company’s financial liabilities into relevant maturity groupings based on their contractual maturitiesfor:* all non derivative financial liabilities* net and gross settled derivative financial instruments for which the contractual maturites are essential for the understandingof the timing of the cash flows.
(` in Lakh)Carrying amount Contractual cash flows
A As at March 31, 2017 Total 1 year or 1-2 years 2-5 years More thanless 5 years
(i) Non-derivative financial liabilitiesSecured term loans and borrowings 4,70,089.53 4,70,089.53 4,70,089.53 — — —Unsecured term loans and borrowings 62,762.57 62,762.56 56,900.82 239.75 4,559.29 1,062.70Redemable preference shares 200.00 200.00 — — 200.00 —Trade payables 5,18,070.32 5,18,070.32 5,18,070.32 — — —Other financial liabilities (repayable on demand) 1,10,466.28 1,10,466.28 1,10,466.28 — — —
(ii) Derivative financial liabilitiesInterest rate swaps used for hedging — — — — — —Foreign exchange forward contract– Outflow — 32,218.92 32,218.92 — — —– Inflow — 33,661.12 33,661.12 — — —Commodity Contracts 1,194.92 1,194.92 1,194.92 — — —Foreign curreny options — — — — — —
Carrying amount Contractual cash flows
B As at March 31, 2016 Total 1 year or 1-2 years 2-5 years More thanless 5 years
(i) Non-derivative financial liabilitiesSecured term loans and borrowings 3,39,381.23 3,39,381.23 3,39,355.74 25.49 — —Unsecured term loans and borrowings 1,87,235.44 1,87,235.43 1,80,990.88 382.81 2,500.01 3,361.74Redemable preference shares 200.00 200.00 — — — 200.00Trade payables 5,98,367.03 5,98,367.03 5,98,367.03 — — —Other financial liabilities (repayable on demand) 24,269.65 24,269.65 24,251.32 18.33 — —
(ii) Derivative financial liabilitiesInterest rate swaps used for hedging 200.30 200.30 200.30 — — —Foreign exchange forward contract 3,649.04– Outflow — 1,72,495.25 1,72,495.25 — — —– Inflow — 1,68,241.38 1,68,241.38 — — —Commodity Contracts 62,120.14 62,120.14 62,120.14 — — —Foreign curreny options 411.22 411.22 411.22 — — —
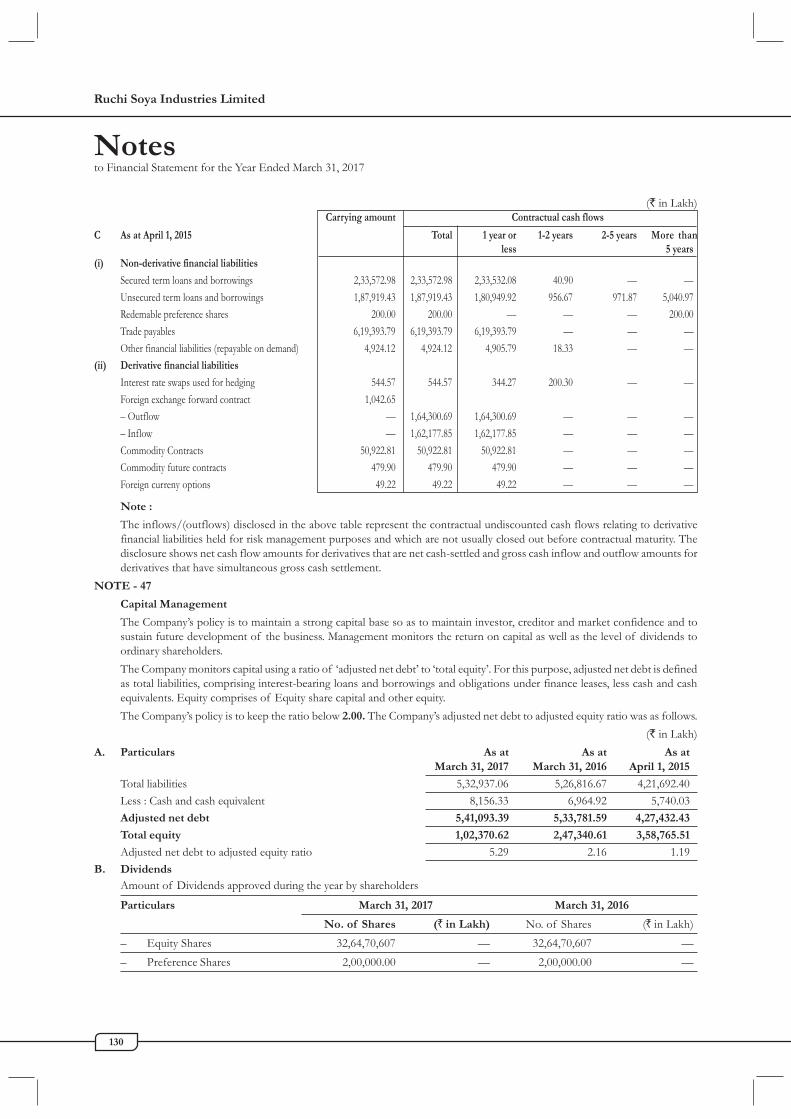
Ruchi Soya Industries Limited
130
Notesto Financial Statement for the Year Ended March 31, 2017
(` in Lakh)Carrying amount Contractual cash flows
C As at April 1, 2015 Total 1 year or 1-2 years 2-5 years More thanless 5 years
(i) Non-derivative financial liabilities
Secured term loans and borrowings 2,33,572.98 2,33,572.98 2,33,532.08 40.90 — —Unsecured term loans and borrowings 1,87,919.43 1,87,919.43 1,80,949.92 956.67 971.87 5,040.97Redemable preference shares 200.00 200.00 — — — 200.00Trade payables 6,19,393.79 6,19,393.79 6,19,393.79 — — —Other financial liabilities (repayable on demand) 4,924.12 4,924.12 4,905.79 18.33 — —
(ii) Derivative financial liabilities
Interest rate swaps used for hedging 544.57 544.57 344.27 200.30 — —Foreign exchange forward contract 1,042.65– Outflow — 1,64,300.69 1,64,300.69 — — —– Inflow — 1,62,177.85 1,62,177.85 — — —Commodity Contracts 50,922.81 50,922.81 50,922.81 — — —Commodity future contracts 479.90 479.90 479.90 — — —Foreign curreny options 49.22 49.22 49.22 — — —
Note :
The inflows/(outflows) disclosed in the above table represent the contractual undiscounted cash flows relating to derivativefinancial liabilities held for risk management purposes and which are not usually closed out before contractual maturity. Thedisclosure shows net cash flow amounts for derivatives that are net cash-settled and gross cash inflow and outflow amounts forderivatives that have simultaneous gross cash settlement.
NOTE - 47
Capital Management
The Company’s policy is to maintain a strong capital base so as to maintain investor, creditor and market confidence and tosustain future development of the business. Management monitors the return on capital as well as the level of dividends toordinary shareholders.The Company monitors capital using a ratio of ‘adjusted net debt’ to ‘total equity’. For this purpose, adjusted net debt is definedas total liabilities, comprising interest-bearing loans and borrowings and obligations under finance leases, less cash and cashequivalents. Equity comprises of Equity share capital and other equity.The Company’s policy is to keep the ratio below 2.00. The Company’s adjusted net debt to adjusted equity ratio was as follows.
(` in Lakh)A. Particulars As at As at As at
March 31, 2017 March 31, 2016 April 1, 2015
Total liabilities 5,32,937.06 5,26,816.67 4,21,692.40Less : Cash and cash equivalent 8,156.33 6,964.92 5,740.03Adjusted net debt 5,41,093.39 5,33,781.59 4,27,432.43
Total equity 1,02,370.62 2,47,340.61 3,58,765.51
Adjusted net debt to adjusted equity ratio 5.29 2.16 1.19B. Dividends
Amount of Dividends approved during the year by shareholders
Particulars March 31, 2017 March 31, 2016
No. of Shares (` in Lakh) No. of Shares (` in Lakh)– Equity Shares 32,64,70,607 — 32,64,70,607 —– Preference Shares 2,00,000.00 — 2,00,000.00 —

Annual Report 2016-17
131
Notesto Financial Statement for the Year Ended March 31, 2017
NOTE-48 TRANSITION TO IND AS:
For the purposes of reporting as set out in Note 1 and 2 , we have transitioned our basis of accounting from Indian generallyaccepted accounting principles (“IGAAP”) to Ind AS. The accounting policies set out in Note 1 and 2 have been applied inpreparing the financial statements for the year ended March 31, 2017. The comparative information presented in these financialstatements for the year ended March 31, 2016 and in the preparation of an opening Ind AS balance sheet at April 1, 2015 (the“transition date”). In preparing our opening Ind AS balance sheet, we have made certain adjustments to amounts reported infinancial statements prepared in accordance with IGAAP. An explanation of how the transition from IGAAP to Ind AS hasaffected our financial position and performance is set out in the following tables. On transition, we did not revise estimatespreviously made under IGAAP except where required by Ind AS.
A. EXEMPTIONS AND EXCEPTIONS AVAILED
Set out below are the applicable Ind AS 101 optional exemptions and mandatory exceptions applied in the transition fromIndian GAAP to Ind AS :
I. Ind AS Exemptions :
(i) Fair valuation of government loans: The Company has applied the exemption available under Ind AS-101 for notmeasuring interest free sales tax deferral loan, existing on the date of transition (April 1, 2015), at fair value and thecorresponding benefit as a government grant.
(ii) Business combination: The Company has applied the exemption as provided in Ind AS-101 for non-application of IndAS 103, “Business Combinations” to business combinations consummated prior to the date of transition (April 1, 2015).
(iii) Share-based payment: The Company has elected to apply the share based payment exemption available under Ind AS101 for application of Ind AS 102, “Share Based Payment”, to grants which remain unvested on April 1, 2015 and togrants made after April 1, 2015.
(iv) Property, Plant and Equipment: On Transition to Ind AS as on April 1, 2015 the Company has elected to measure itsa) Tangilbe assets- Freehold Land, Building and Plant and Equipments and b) Intangible assets-Acquired Trademarks/Brands at Fair value, for other assets elected to measure the same at cost as per Ind AS, if any. The same are consideredas Deemed cost of such Plant, property and Equipment.
(v) Long Term Foreign Currency Monetary Items: The Company has elected to avail the exemption available under IndAS 101, to continue to adjust the exchange differences arising on translation of long term foreign currency monetaryitems outstanding as on the date of transition, to the cost of depreciable assets to the extent it relates to their acquisitionand in other cases to charge the same to profit and loss account over the term of the long term foreign currency monetaryitems and to accumulate the unamortised portion in foreign currency monetary item difference account.
(vi) Derecognition of financial assets and financial liabilities: The Company has opted to apply the exemption availableunder Ind AS 101 to apply the derecognition criteria of Ind AS 109 prospectively for the transactions occurring on orafter the date of transition to Ind AS.
(vii) Business Development Reserve: In an earlier year, the Hon’ble High Court of judicature of Mumbai, had approved u/s. 391-394 of then applicable Companies Act the Scheme of Amalgamation and Arrangement of ‘Mac Oil Palm Limited’with Ruchi Soya Industries Limited and its shareholders, which was effective from April 1, 2009. Pursuant to the Scheme,the Company had, in an earlier year, created Business Development Reserve from the balance standing to the credit ofGeneral Reserve & Securities Premium Account. In terms of the Scheme, as and when deemed fit by the Board, the saidBusiness Development Reserve is available for adjusting various expenses, including advertisement, sales promotion,development of brands, research and development activities, provision / write off of doubtful debtors/current assets/loans and advances, additional depreciation necessitated by revaluation of fixed assets and expenses of amalgamationincluding expenses of the Transferor Company i.e. Mac Oil Palm Limited, incurred on or after 1st April 2009, afteradjusting for any tax effects, both current and deferred tax thereon. As the law would continue to override accountingstandards, continution of accounting treatment as prescribed by court approved schemes before transition date exemptionshall continue under Ind AS.
II. Ind AS mandatory exceptions
Estimates : The Company estimates in accordance with Ind ASs at the date of transition to Ind AS are consitent withestimates made for the same date in accordance with previous GAAP.

Ruchi Soya Industries Limited
132
Notesto Financial Statement for the Year Ended March 31, 2017
B. FINANCIAL RECONCILIATION(` in lakh)
(i) (a) RECONCILIATION OF EQUITY Notes Amount Effects of Amount– MARCH 31, 2016 as per transition as per
IGAAP to Ind AS Ind ASASSETSNon-current assets(a) Property, Plant and Equipment 3 2,30,678.63 1,81,231.14 4,11,909.77(b) Capital work-in-progress 3 4,205.32 (3.28) 4,202.04(c) Intangible assets 4 222.88 1,51,548.00 1,51,770.88(d) Financial Assets 5
(i) Investments 5(a) 22,871.73 (8,390.90) 14,480.83(ii) Loans 5(b) — 7,333.39 7,333.39(iii) Others 5(c) 17,969.24 (16,822.74) 1,146.50
(e) Other non-current assets 6 69.60 10,514.22 10,583.82Total Non-current assets 2,76,017.41 3,25,409.82 6,01,427.24Current assets(a) Inventories 7 2,36,535.75 (720.40) 2,35,815.35(b) Financial Assets 8
(i) Investments 8(a) 47.41 42.40 89.81(ii) Trade receivables 8(b) 6,69,255.02 (31,572.94) 6,37,682.08(iii) Cash and cash equivalents 8(c) 14,614.68 (7,649.76) 6,964.92(iv) Bank balances other than (iii) above 8(d) — 7,138.31 7,138.31(v) Loans 8(e) 1,44,118.38 (1,34,317.97) 9,800.41(vi) Others 8(f) — 8,267.02 8,267.02
(c) Other Current Assets 9 7,076.83 1,30,952.61 1,38,029.44Assets Classified as held for Sale 10Total Current assets 10,71,648.07 (27,860.73) 10,43,787.34Total Assets 13,47,665.49 2,97,549.09 16,45,214.58EQUITY AND LIABILITIESEquity(a) Equity share capital 11 6,882.01 (352.60) 6,529.41(b) Other Equity 12 1,13,509.26 1,27,301.94 2,40,811.20Total Equity 1,20,391.27 1,26,949.34 2,47,340.61LIABILITIESNon-Current Liabilities(a) Financial Liabilities 13
(i) Borrowings 13(a) 42,193.95 (35,955.62) 6,238.33(ii) Other financial liabilities 13(b) — 80.53 80.53
(b) Provisions 14 232.64 — 232.64(c) Deferred tax liabilities (Net) 15 17,858.16 63,672.84 81,531.00(d) Other non-current liabilities 16 11,097.39 (1,171.70) 9,925.69Total Non-Current Liabilities 71,382.14 26,626.05 98,008.19Current liabilities(a) Financial Liabilities 17
(i) Borrowings 17(a) 4,09,185.76 32,405.48 4,41,591.24(ii) Trade payables 17(b) 5,98,367.03 (—) 5,98,367.03(iii) Other financial liabilities 17(c) — 1,67,933.11 1,67,933.11
(b) Other current liabilities 18 1,47,131.80 (56,364.87) 90,766.93(c) Provisions 19 1,207.48 (0.01) 1,207.47(d) Current tax liabilities (Net) 20 — — —Liabilities directly associated with assets classifiedas held for sale 21 — — —Total Current liabilities 11,55,892.08 1,43,973.70 12,99,865.78Total Equity and Liabilities 13,47,665.49 2,97,549.09 16,45,214.58

Annual Report 2016-17
133
Notesto Financial Statement for the Year Ended March 31, 2017
(` in lakh)
(i) (b) RECONCILIATION OF STATEMENT Notes Amount Effects of AmountOF PROFIT AND LOSS FOR THE YEAR as per transition as perMARCH 31, 2016 IGAAP to Ind AS Ind AS
INCOME
I. Revenue from Operations 22 27,73,461.55 (4,222.88) 27,69,238.67II. Other income 23 7,081.61 4,197.74 11,279.35III. Total Income (I+II) 27,80,543.16 (23.39) 27,80,519.77
IV. Expenses
Cost of materials consumed 24 14,62,282.87 (4,709.06) 14,57,573.81Purchase of Traded Goods 25 10,65,597.61 5,420.66 10,71,018.27Changes in inventories of finished goods,work-in-progress and stock-in-trade 26 31,076.91 (1,088.95) 29,987.96Employee Benefits Expenses 27 21,137.34 (98.05) 21,039.29Finance costs 28 61,874.25 60,169.12 1,22,043.37Depreciation and Amortization Expenses 29 14,988.12 1,034.16 16,022.28Provision for Doubtful Debts, advances and Bad Debts 30 — 25,451.43 25,451.43Other Expenses 31 2,19,680.89 (55,649.57) 1,64,031.32Total Expenses (IV) 28,76,637.99 30,529.74 29,07,167.73
V. Profit/(loss) before Exceptional Items andTax (III-IV) (96,094.84) (30,554.87) (1,26,649.71)
VI. Exceptional Items 32 238.98 (0.01) 238.97VII. Profit/(loss) before Tax (V-VI) (95,855.86) (30,554.88) (1,26,410.74)
VIII. Tax expense:
1. Current Tax — — —2. Deferred Tax 15 (7,942.07) (12,266.69) (20,208.76)3. Adjustment of tax for earlier years (43.72) — (43.72)
Less: MAT credit entitlement — — —IX. Profit/(Loss) after tax for the period (VII-VIII) (87,870.08) (18,288.19) (1,06,158.26)
X. (A) Other Comprehensive Income 33(i) Items that will not be reclassified to
statement of profit or loss — (482.81) (482.81)Tax relating to above items — 42.64 42.64
(ii) Items that will be reclassified tostatement of profit or loss — — —Tax relating to above items — — —
(B) Hedge Reserves 33(i) Items that will not be reclassified to
statement of profit or loss — — —(ii) Items that will be reclassified to
statement of profit or loss
Effective portion of gain or loss on hedginginstruments in a cash flow hedge — 344.26 344.26
XI. Total Comprehensive income for the period (87,870.08) (18,384.10) (1,06,254.17)

Ruchi Soya Industries Limited
134
Notesto Financial Statement for the Year Ended March 31, 2017
(` in lakh)
B (ii) RECONCILIATION OF EQUITY Notes Amount Effects of Amount– APRIL 1, 2015 as per transition as per
IGAAP to Ind AS Ind ASASSETSNon-current assets(a) Property, Plant and Equipment 3 2,37,760.19 1,79,346.41 4,17,106.60(b) Capital work-in-progress 3 10,016.74 — 10,016.74(c) Intangible assets 4 292.83 1,51,548.00 1,51,840.83(d) Financial Assets 5
(i) Investments 5(a) 28,182.79 (13,614.47) 14,568.32(ii) Loans 5(b) 13,524.01 (7,852.24) 5,671.77(iii) Others 5(c) — 1,079.68 1,079.68
(e) Other non-current assets 6 26.07 7,333.36 7,359.43Total Non-current assets 2,89,802.62 3,17,840.73 6,07,643.36Current assets(a) Inventories 7 3,05,946.18 (925.59) 3,05,020.59(b) Financial Assets 8
(i) Investments 8(a) 47.05 44.15 91.20(ii) Trade receivables 8(b) 5,98,116.89 8,359.14 6,06,476.03(iii) Cash and cash equivalents 8(c) 52,403.49 (46,663.46) 5,740.03(iv) Bank balances other than (iii) above 8(d) — 46,211.90 46,211.90(v) Loans 8(e) 1,27,234.54 (1,18,978.23) 8,256.31(vi) Others 8(f) — 5,191.33 5,191.33
(c) Other Current Assets 9 12,783.18 1,14,515.59 1,27,298.77Assets Classified as held for Sale 10 — — —Total Current assets 10,96,531.33 7,754.83 11,04,286.16Total Assets 13,86,333.95 3,25,595.57 17,11,929.52EQUITY AND LIABILITIESEquity(a) Equity share capital 11 6,881.21 (352.60) 6,528.61(b) Other Equity 12 2,13,880.80 1,38,356.10 3,52,236.90Total Equity 2,20,762.01 1,38,003.50 3,58,765.51LIABILITIESNon-Current Liabilities(a) Financial Liabilities 13
(i) Borrowings 13(a) 70,002.13 (63,016.22) 6,985.91(ii) Other financial liabilities 13(b) — 325.53 325.53
(b) Provisions 14 318.87 0.00 318.87(c) Deferred tax liabilities (Net) 15 25,800.23 75,558.25 1,01,358.48(d) Other non-current liabilities 16 20,394.95 (1,257.71) 19,137.24Total Non-Current Liabilities 1,16,516.18 11,609.85 1,28,126.03Current liabilities(a) Financial Liabilities 17
(i) Borrowings 17(a) 2,54,832.83 55,905.65 3,10,738.48(ii) Trade payables 17(b) 6,17,626.02 1,767.77 6,19,393.79(iii) Other financial liabilities 17(c) — 1,59,936.79 1,59,936.79
(b) Other current liabilities 18 1,73,400.65 (40,984.60) 1,32,416.05(c) Provisions 19 3,196.26 (2,193.37) 1,002.89(d) Current tax liabilities (Net) 20 — 1,549.98 1,549.98Liabilities directly associated with assets classifiedas held for sale 21 — — —Total Current liabilities 10,49,055.76 1,75,982.22 12,25,037.98Total Equity and Liabilities 13,86,333.95 3,25,595.57 17,11,929.52

Annual Report 2016-17
135
Notesto Financial Statement for the Year Ended March 31, 2017
C. NOTES ON FIRST TIME ADOPTION:
1 Property, Plant & Equipment
As on the transition date to Ind AS i.e. April 1, 2015 the Company has elected to measure its Tangible assets - Freehold Land,Building and Plant and Equipments and Intangible assets - Aquired Trademarks/Brands at Fair Value, for other assets Companyelected to measure the same at cost as per Ind AS. The same are considered as Deemed cost.
2 (a) Investment in Other than subsidiary, associates and Joint Venture [Refer note 5a E(i) b]
(b) Investment in subsidiary, associates and Joint Venture [Refer note 5a E(i) a]
(c) Investments in Mutual funds
The same are measured at FVTPL. As on transition date i.e April 1, 2015 the same are adjusted to retained earnings,subsequent gains /losses are charged to profit and loss account.
3 Leasehold land
The Company has certain lease hold land with a tenure ranging between 10 to 30 years under Ind-AS land is treated as financelease if the lease term is over several decades or the present value of minimum lease payments is substantially equal to the fairvalue of land. Since the above condition is not satisfied, lease arrangements in the range of 10 to 30 years the date of investmentto the date of transition have been classified as operating leases as against the current practice of capitalizing them as leaseholdland. Consequently, leasehold land has been de-recognised and prepaid lease rental have been recognised.
4 Biological asset and Stock in trade
The Company has measured the biological assets and stock in trade at Fair Value.5 Trade receivables
The Company measures recovery of debtors on Expected Credit Loss Model.[ Refer Note 46(ii)]. The Company has allowedsome customers an extended credit period, the same are recognised at its present value, the corresponding difference betweenthe present value and carrying amount is recognised in retained earnings as on transition date i.e April 1, 2015. The unwindingof discount on account of above upto the date of transition is also recognised in retained earnings. Subsequent unwinding isrecognised in statement of profit and loss account.
6 Reversal of premium amortised on forward contracts.
As per previous Indian GAAP, the premium paid on forward contract was amortised over the a period of the contract. The saidaccounting treatment is not required under Ind AS. Hence, the same are now recorded as per requirements of Ind AS and thepremium amortised earlier under Indian GAAP are reversed with corresponding amount recognised in retained earnings.
7 (a) Open purchase and sale contracts
As per requirment of Ind AS, specified Open purchase and sales contract outstanding as on the balance sheet date areFair Valued.
(b) Currency Forward contracts
The Company has Fair Valued the Currency forward contracts on date of transition with a corresponding amountrecognised in retained earnings as on transition date i.e April 1, 2015.
8 Share based payments
Under Indian GAAP, the Company recognised only the intrinsic value for the long-term incentive plan as an expense. Ind-ASrequires the Fair Value of the share options to be determined using an appropriate pricing model recognised over the vestingperiod. Accordingly, the difference between the intrinsic value method and Fair Value method has been recognised in retainedearnings.
9 Amortisation of loan processing fees
The Company has incurred transaction/ processing costs on its borrowings. The said transaction/ processing costs is amortisedover the period of loan. The same has been reduced from the borrowing on the date of initial recognition and amortised usingeffective interest rate method. As a result the long term borrowing has been reduced with a corresponding gain being recognisedin retained earnings.
10 Deferred Tax
The Company has recognised deferred tax as per requirements of Ind AS -12 on “Income taxes” and recoginsed a deferred taxliability arising on account of the Ind AS adjustments as on April 1, 2015 to retained earnings.

Ruchi Soya Industries Limited
136
Notesto Financial Statement for the Year Ended March 31, 2017
11 Corporate guarantees issued
The Company has provided guarantees to Banks on behalf of the other companies. These financial guarantees have beenmeasured at fair value on the date of Initial recognition with corresponding amount being recognised as unamortised guaranteecommission. The same has been amortised over the term of the guarantee on a straight line basis.
12 Proposed Dividend
Under Indian GAAP, proposed dividends are recognised as a liability in the period to which they relate, irrespective of whenthey are declared. Under Ind-AS, a proposed dividend is recognised as a liability in the period in which it is declared by theCompany (usually when approved by shareholders in a general meeting); In the case of the Company, the declaration ofdividend occurs after period end. Therefore, the liability recorded for this dividend as on the date of transition as well as taxrelating to it has been derecognised.
13 Excise Duty
Under Indian GAAP, the Company used to present Revenue net off excise duty. The incidence of excise duty is on manufactureand not on sales since manufacturer is the primary obligor for the payment of excise duty. Management collects excise dutyfrom its customers in the capacity as principal and not as an agent. As a result, excise duty recovered from customers wouldform part of revenue, with an corresponding equal amount charged to the statement of Profit and loss.
14 Employee benefits
Both under Indian GAAP and Ind-AS, the Company recognised costs related to its post-employment defined benefit plan onan actuarial basis. Under Indian GAAP, the entire cost, including actuarial gains and losses, are charged to profit and loss. UnderInd-AS, remeasurements of defined benefits plans are recognised immediately in the balance sheet with a corresponding debitor credit to retained earnings through OCI.
15 Bills of exchanges discounted with recourse terms
The Company had certain debtors which it discounts with the bank. The discounting of such debtors is done with recourseoption. As per Ind AS, the risks and rewards have not been completely transferred to the bank as a result of the discounting.Hence, the Company has recognised the debtor as well as a secured loan in the financial statements in this regards.
As per our report of even date attached For and on behalf of the Board of DirectorsFor and on behalf ofP. D. Kunte & Co. (Regd.) R. L. Gupta Dinesh ShahraChartered Accountants Company Secretary Managing Director
DIN: 00533055
D. P. Sapre Anil Singhal Vijay Kumar JainPartner Chief Financial Officer Executive DirectorMembership no. 40740 DIN: 00098298
Place: MumbaiDate: May 30, 2017

Annual Report 2016-17
137
Independent Auditors’ ReportTO THE MEMBERS OF RUCHI SOYAINDUSTRIES LIMITED
REPORT ON THE CONSOLIDATED Ind ASFINANCIAL STATEMENTS
We have audited the accompanying Consolidated Ind AS FinancialStatements of RUCHI SOYA INDUSTRIES LIMITED(hereinafter referred to as “the Holding Company”) and itssubsidiaries its associates, jointly venture companies and a Trustwhere the Holding Company is a beneficiary (the HoldingCompany together with the subsidiaries, associates, jointlycontrolled entity and a Trust where the Holding Company is abeneficiary referred as “the Group”), which comprises theConsolidated Balance Sheet as at March 31, 2017, theConsolidated Statement of Profit and Loss (including OtherComprehensive Income), the Consolidated Cash Flow Statement,the Consolidated Statement of Changes in Equity for the yearthen ended and a summary of the significant accounting policiesand other explanatory information in which are incorporated thereturns of the Holding Company’s branches at Peddapuram andAmpapuram for the year ended on that date audited by the branchauditors (hereinafter referred to as “the Consolidated Ind ASFinancial Statements”).
MANAGEMENT’S RESPONSIBILITY FORTHE CONSOLIDATED IND AS FINANCIALSTATEMENTS
The Holding Company’s Board of Directors is responsible forthe matters specified in Section 134(5) Companies Act, 2013 (‘theAct’) with respect to the preparation of these Consolidated IndAS Financial Statements that give a true and fair view of theconsolidated financial position, consolidated financialperformance including Other Comprehensive Income,consolidated cash flows and the consolidated statement ofchanges in equity of the Group in accordance with the accountingprinciples generally accepted in India, including the IndianAccounting Standards (Ind AS) specified under Section 133 ofthe Act, read with relevant rules issued thereunder.
The respective Board of Directors of the Companies includedin the Group, the governing body of the jointly controlled entityand Trustee of the trust where the Holding Company is abeneficiary are responsible for maintenance of adequateaccounting records in accordance with the provisions of the Actfor safeguarding the assets of the Group and for preventing anddetecting frauds and other irregularities; selection and applicationof appropriate accounting policies; making judgments andestimates that are reasonable and prudent; and design,implementation and maintenance of adequate internal financialcontrols, that were operating effectively for ensuring the accuracyand completeness of the accounting records, relevant to thepreparation and presentation of the Consolidated Ind ASFinancial Statements that give a true and fair view and are freefrom material misstatement, whether due to fraud or error.
AUDITOR’S RESPONSIBILITYOur responsibility is to express an opinion on these ConsolidatedInd AS Financial Statements based on our audit.We have taken into account the provisions of the Act, theaccounting and auditing standards and matters which are requiredto be included in the audit report under the provisions of theAct and the Rules made there under.We conducted our audit in accordance with the Standards onAuditing specified under Section 143(10) of the Act. ThoseStandards require that we comply with ethical requirements andplan and perform the audit to obtain reasonable assurance aboutwhether the Consolidated Ind AS Financial Statements are freefrom material misstatement.An audit involves performing procedures to obtain audit evidenceabout the amounts and the disclosures in the Consolidated IndAS Financial Statements. The procedures selected depend onthe auditor’s judgment, including the assessment of the risks ofmaterial misstatement of the Consolidated Financial Ind ASStatements, whether due to fraud or error. In making those riskassessments, the auditor considers internal financial controlrelevant to the Holding Company’s preparation of theConsolidated Ind AS Financial Statements that give a true andfair view in order to design audit procedures that are appropriatein the circumstances. An audit also includes evaluating theappropriateness of the accounting policies used and thereasonableness of the accounting estimates made by theHolding Company’s Board of Directors as well as evaluating theoverall presentation of the Consolidated Ind AS FinancialStatements.We believe that the audit evidence we have obtained by us andother auditors in terms of report that are sufficient andappropriate to provide a basis for our audit opinion on theConsolidated Ind AS Financial Statements.
BASIS FOR QUALIFIED OPINIONAttention is drawn to 8c (a) and 17a(H) relating to the non-receiptof confirmations in respect of bank balances aggregating to debitbalance of ` 1,221.23 lakh and credit balance of ` 61,421.93lakh. In the absence of confirmations, the variation, if any,between the amounts of bank balances, interest and other costsrecorded by the Holding Company and the amounts as per therecords of the banks cannot be ascertained.
DISCLAIMER OF OPINIONIn respect of one of the subsidiaries [whose accounts have beenaudited by other auditors and reflect total assets of ̀ (22,994.05)lakh as at March 31, 2017, total revenue of ` (10,706.93) lakhand net outflow of ̀ 107.58 lakh for the year ended on that date,the auditors have expressed a disclaimer relating to balances oftrade receivables, advance from customer, trade payables and loansand advances (amounts not quantified) which are subjectto confirmation / reconciliation and subsequent adjustments,if any.

Ruchi Soya Industries Limited
138
QUALIFIED OPINIONExcept as stated in the ‘Basis for Qualified Opinion’ paragraphand ‘Basis for Disclaimer of Opinion’ paragraph, in our opinionand to the best of our information and according to theexplanations given to us, the aforesaid Consolidated Ind ASFinancial Statements give the information required by the Act inthe manner so required and give a true and fair view in conformitywith the accounting principles generally accepted in India, of thestate of affairs of the Group as at March 31, 2017, its ConsolidatedLoss, Consolidated Total Comprehensive Performance, itsConsolidated Cash Flows and Consolidated Statement ofChanges in Equity for the year ended on that date.
EMPHASIS OF MATTERWithout qualifying our opinion, attention is drawn to:-a. Note 36 relating to the preparation of the Consolidated
Ind AS Financial Statements on a going concern basis. Thematters as set forth in Note 36 indicate the existence ofmaterial uncertainty about the Company’s ability to continueas a going concern. However, as stated in the said Note, inview of the various steps initiated by the Company, futureoutlook as assessed by the management and the businessplans of the Company, the Consolidated Ind ASFinancial Statements have been prepared on a going concernbasis.
b. In respect of two of the subsidiaries and two step downsubsidiaries [whose accounts have been audited by otherauditors and reflect total assets of ` (23,115.05) lakh as atMarch 31, 2017, total revenue of ` (10,634.99) lakh andnet cash outflow of ` 241.64 lakh for the year ended onthat date], the respective auditors have expressed a concernover the ability of the respective companies to continue asa going concern. We have relied on the financial statementsaudited by these auditors which have been prepared as agoing concern.
c. Note 12M(v) relating to the Scheme of Amalgamation andArrangement between Mac Oil Palm Limited and theHolding Company and their respective shareholderssanctioned by the Hon’ble High Court of Judicature atMumbai in an earlier year, pursuant to which, an amountof ` 19,264.77 lakh has been debited to BusinessDevelopment Reserve.Had the Scheme approved by the Hon’ble High Court notprescribed the accounting treatment, the accumulatedbalance in the General Reserve and Securities Premiumaccount as at March 31, 2017 would have been higher by` 5,193.54 lakh and ` 23,842.30 lakh respectively, loss forthe year would have been higher by ` 19,264.77 lakh, theaccumulated balance in Retained Earnings as at March 31,2017 would have been lower by ̀ 43,640.39 lakh, the balancein Revaluation Reserve would have been higher by` 14,665.23 lakh and the balance in Business DevelopmentReserve would have been ` Nil.
However, the aggregate balance in Reserves and Surplus asat March 31, 2017 would have remained the same.
OTHER MATTERS(a) We did not audit the Standalone Ind AS Financial
Statements of three subsidiaries, five step down subsidiaries,and three jointly controlled entities, whose financialstatements reflect total assets of ` (12,668.51) lakh as atMarch 31, 2017, total revenue of ` (17,287.32) lakh andnet cash outflow of ` 541.24 lakh for the year ended onthat date, as considered in the Consolidated Ind ASFinancial Statements. These Standalone Ind AS FinancialStatements have been audited by other auditors whosereports have been furnished to us by the Management andour opinion, in so far as it relates to the amounts anddisclosures included in respect of these entities in theGroup, is based solely on the reports of their auditors.
(b) The Consolidated Ind AS Financial Statement includesfinancial information in respect of one step down subsidiarycompany, which is unaudited and the said financialinformation has been certified by the management. Thesaid financial information reflects total assets (net) of` 3,903.63 lakh as at March 31, 2017 and total revenue forthe year ̀ (570.21) lakh and net cash outflow amounting to` 14,997.23 lakh for the year then ended.
(c) Some of these subsidiaries / step down subsidiaries arelocated outside India, whose financial statements and otherfinancial information have been prepared in accordance withaccounting principles generally accepted in their respectivecountries and which have been audited by other auditorsunder generally accepted auditing standards applicable intheir respective countries. The Company’s management hasconverted the financial statements of such subsidiaries /step down subsidiaries located outside India fromaccounting principles generally accepted in their respectivecountries to accounting principles generally accepted inIndia. We have audited these conversion adjustments madeby the Company’s management. Our opinion in so far as itrelates to the balances and affairs of such subsidiaries/stepdown subsidiaries located outside India is based on thereport of other auditors and the conversion adjustmentsprepared by the management of the Company and auditedby us.
(d) During the year, the Company has divested its investmentsin Ruchi Kagome Foods India Pvt. Ltd. an associate. Inthe absence of information being available, accounting inrespect of the said associate till the date it ceased to anassociate has not been made.
(e) We did not audit the financial statements of two branchesincluded in the Standalone Ind AS Financial Statements ofthe Holding Company which reflect total assets of` 47,465.11 lakh as at March 31, 2017 and total revenuesfrom operations of ` 3,578.17 lakh for the year ended on

Annual Report 2016-17
139
that date and net cash outflows of ̀ 93.96 lakh. The financialstatements of these branches have been audited by thebranch auditors whose reports have been furnished to usand our opinion in so far as it relates to the amounts anddisclosures included in respect of these branches, is basedsolely on the report of the branch auditors.Our opinion is not modified in respect of this matter.
REPORT ON OTHER LEGAL ANDREGULATORY REQUIREMENTSA. As required by Section 143(3) of the Act, based on our
audit and the other financial information of subsidiaries,associates and joint venture companies incorporated inIndia, referred in the Other Matters paragraph above wereport, to the extent applicable, that,a) We have sought and, except for the matters described
in the Basis for Qualified Opinion paragraph andDisclaimer of Opinion paragraph, have obtained allthe information and explanations which to the bestof our knowledge and belief were necessary for thepurposes of our audit.
b) Except for the possible effects of the mattersdescribed in the Basis of Qualified Opinion paragraphand Disclaimer of Opinion paragraph above, in ouropinion, proper books of account as required by lawhave been kept by the Group so far as it appears fromour examination of those books and proper returnsadequate for the purposes of our audit have beenreceived from the branches not visited by us.
c) The reports on the accounts of the branch offices ofthe Holding Company audited under Section 143(8)of the Act by branch auditors have been sent to usand have been properly dealt with by us in preparingthis report.
d) The Consolidated Balance Sheet, the ConsolidatedStatement of Profit and Loss including OtherComprehensive Income, the Consolidated Cash FlowStatement and Consolidated Statement of Changesin Equity dealt with by this Report are in agreementwith the relevant books of account and with thereturns received from the branches of HoldingCompany not visited by us.
e) Except for the possible effects of the matters asdescribed in the Basis of Qualified opinion paragraph,in our opinion, the aforesaid Consolidated Ind ASFinancial Statements comply with the AccountingStandards prescribed under Section 133 of the Actread with relevant Rule issued thereunder.
f) The matters described in paragraph above on the Basisof Qualified Opinion and Disclaimer of Opinionparagraph above, in our opinion, may have an adverseeffect on the functioning of the Group.
g) On the basis of the written representations receivedfrom the directors as on March 31, 2017 taken onrecord by the Board of Directors, none of thedirectors is disqualified as on March 31, 2017 frombeing appointed as a director in terms of Section164(2) of the Act.
h) With respect to the adequacy of the internal financialcontrol over financial reporting of the Group andthe operating effectiveness of such controls, refer toour separate Report in “Annexure A”.
i) With respect to the other matters to be included inthe Auditor’s Report in accordance with Rule 11 ofthe Companies (Audit and Auditors) Rules, 2014, inour opinion and to the best of our information andaccording to the explanations given to us:i. The Group has disclosed the impact of pending
litigations on its financial position in itsConsolidated Ind AS Financial Statements –Refer Note 34 relating to Contingent Liabilitiesand Commitments;
ii. The Group has made provision as requiredunder applicable law or accounting standard,for foreseeable losses, if any, on long termcontracts including derivative contracts.
iii. There has been no delay in transferring amounts,required to be transferred, to theInvestor Education and Protection Fund by theGroup.
iv. The Company has provided requisitedisclosures in the Consolidated Ind AS FinancialStatements as regards to its holdings anddealings in the Specified Bank Notes (as definedin the Notification S.O. 3407(E) datedNovember 8, 2016 of the Ministry of Finance)during the period from November 8, 2016 toDecember 30, 2016. Based on the auditprocedures performed and representations asprovided to us by the management, we reportthat the disclosures are in accordance with thebooks of accounts maintained by the Companyand as produced to us by the management. ReferNote 8(c)(b).
For P. D. Kunte& Co. (Regd.) Chartered Accountants
Firm’s Registration No. 105479W
D.P. SaprePlace : Mumbai (Partner) Date: May 30, 2017 Membership No. 40740
Ruchi Soya Industries Limited
140
“Annexure A” to the Independent Auditors’ Report of even date on the Consolidated Ind AS FinancialStatements of Ruchi Soya Industries Limited Report on the Internal Financial Controls under Clause(i) of Sub-section 3 of Section 143 of the Companies Act, 2013 (“the Act”)In conjunction with our audit of the consolidated Ind AS financialstatements of the Company as of and for the year ended March31, 2017, we have audited the internal financial controls overfinancial reporting of RUCHI SOYA INDUSTRIESLIMITED (hereinafter referred to as “the Holding Company”)and its subsidiary companies, its associate companies and jointventures, which are companies incorporated in India, as of thatdate.
MANAGEMENT’S RESPONSIBILITY FORINTERNAL FINANCIAL CONTROLS
The respective Board of Directors of the Holding Company, itssubsidiary companies, its associate companies and joint ventures,which are companies incorporated in India, are responsible forestablishing and maintaining internal financial controls based onthe internal control over financial reporting criteria establishedby the respective Companies considering the essential componentsof internal control stated in the Guidance Note on Audit ofInternal Financial Controls Over Financial Reporting issued bythe Institute of Chartered Accountants of India (ICAI).
These responsibilities include financial controls that wereoperating effectively for ensuring the orderly and efficient conductof its business, including adherence to the respective company’spolicies, the safeguarding of its assets, the prevention anddetection of frauds and errors, the accuracy and completenessof the accounting records, and the timely preparation ofreliable financial information, as required under the CompaniesAct, 2013.
AUDITOR’S RESPONSIBILITY
Our responsibility is to express an opinion on the internal financialcontrols over financial reporting of the Holding Company, itssubsidiary companies, its associate companies and its jointventures, which are companies incorporated in India, based onour audit. We conducted our audit in accordance with theGuidance Note on Audit of internal Financial Controls OverFinancial Reporting (the “Guidance Note”) issued by the instituteof Chartered Accountants of India and the Standards onAuditing, prescribed under Section 143(10) of the CompaniesAct, 2013, to the extent applicable to an audit of internal financialcontrols. Those Standards and the Guidance Note require thatwe comply with ethical requirements and plan and perform theaudit to obtain reasonable assurance about whether adequateinternal financial controls over financial reporting was establishedand maintained and if such controls operated effectively in allmaterial respects.
Our audit involves performing procedures to obtain auditevidence about the adequacy of the internal financial controlssystem over financial reporting and their operating effectiveness.Our audit of internal financial controls over over financialreporting included obtaining an understanding of internalfinancial controls over financial reporting, assessing the risk that
a material weakness exists, and testing and evaluating the designand operating effectiveness of internal control based on theassessed risk. The procedures selected depend on the auditor’sjudgment, including the assessment of the risks of materialmisstatement of the financial statements, whether due to fraudor error.
We believe that the audit evidence we have obtained and theaudit evidence obtained by other auditors of the subsidiarycompanies, associates companies and joint ventures, which arecompanies incorporated in India, in terms of their reports referredto in the Other Matters paragraph below, is sufficient andappropriate to provide a basis for our audit opinion on the internalfinancial controls system over financial reporting of theHolding Company, its subsidiary companies, its associatecompanies and its joint ventures, which are companiesincorporated in India.
MEANING OF INTERNAL FINANCIALCONTROLS OVER FINANCIALREPORTING
A Company’s internal financial control over financial reportingis a process designed to provide reasonable assurance regardingthe reliability of financial reporting and the preparation offinancial statements for external purposes in accordance withgenerally accepted accounting principles. A Company’s internalfinancial control over financial reporting includes those policiesand procedures that (1) pertain to the maintenance of recordsthat, in reasonable detail, accurately and fairly reflect thetransactions and dispositions of the assets of the Company;(2) provide reasonable assurance that transactions are recordedas necessary to permit preparation of financial statements inaccordance with generally accepted accounting principles, andthat receipts and expenditures of the Company are being madeonly in accordance with authorisations of management anddirectors of the Company; and (3) provide reasonable assuranceregarding prevention or timely detection of unauthorisedacquisition, use, or disposition of the Company’s assets that couldhave a material effect on the financial statements.
INHERENT LIMITATIONS OF INTERNALFINANCIAL CONTROLS OVERFINANCIAL REPORTINGBecause of the inherent limitations of internal financial controlsover financial reporting, including the possibility of collusion orimproper management override of controls, materialmisstatements due to error or fraud may occur and not bedetected. Also, projections of any evaluation of the internalfinancial controls over financial reporting to future periods aresubject to the risk that the internal financial control over financialreporting may become inadequate because of changes inconditions, or that the degree of compliance with the policies orprocedures may deteriorate.

Annual Report 2016-17
141
OPINION
According to the information and explanations given to us andbased on the audit of test of controls, except for strengtheningof documentation of policies regarding delegation of authority& access rights to financial records and process for archival ofrecords & periodic review, which we are informed is in processand expected to be put in place by accounting year ending March31, 2018, in our opinion, the Group has, in all material respects,an adequate internal financial controls system over financialreporting and such internal financial controls over financialreporting were operating effectively as at March 31, 2017, basedon the internal control over financial reporting criteria establishedby the Group considering the essential components of internalcontrol stated in the Guidance Note on Audit of InternalFinancial Controls Over Financial Reporting issued by theInstitute of Chartered Accountants of India.
OTHER MATTERS
Our aforesaid report under Section 143(3)(i) of the Act on theadequacy and operating effectiveness of the internal financialcontrols over financial reporting in so far as it relates to subsidiarycompanies and joint ventures, which are companies incorporatedin India, is based solely on the corresponding reports of theauditors of such companies incorporated in India.
Our opinion is not modified in respect of the above matters.
For P. D. Kunte& Co. (Regd.) Chartered Accountants
Firm’s Registration No. 105479W
D.P. Sapre Place: Mumbai (Partner) Date : May 30, 2017 Membership No. 40740
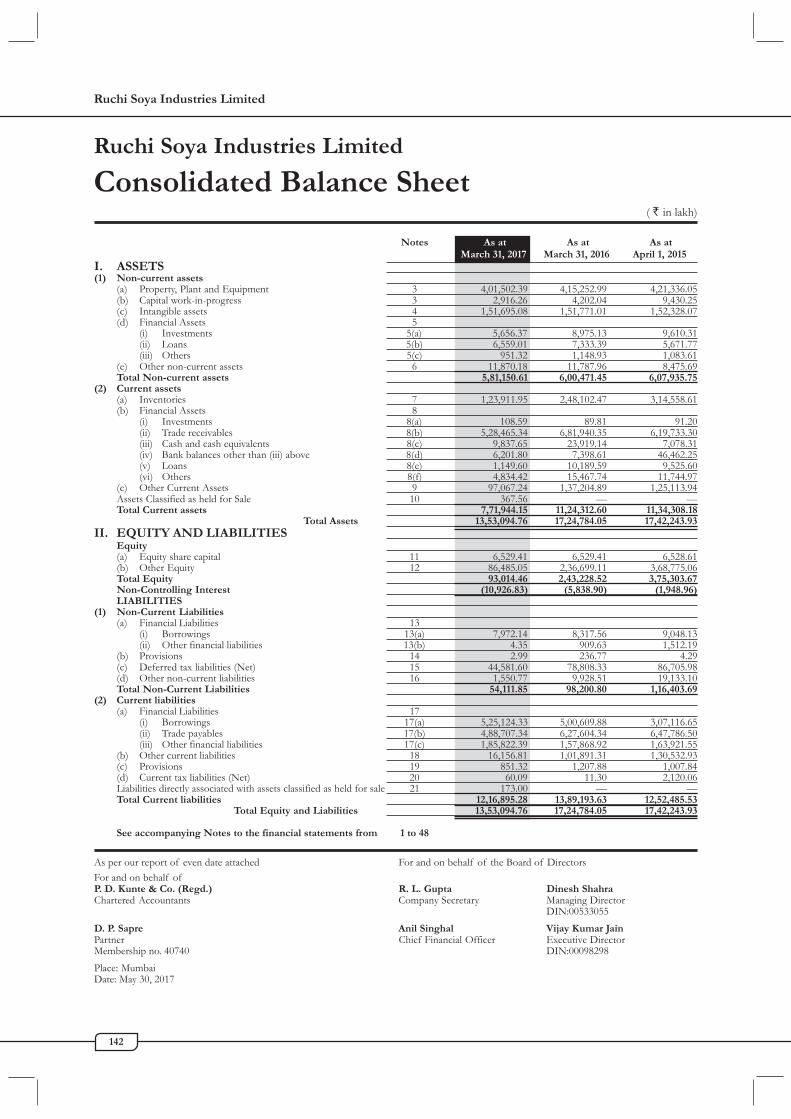
Ruchi Soya Industries Limited
142
Ruchi Soya Industries Limited
Consolidated Balance Sheet ( ` in lakh)
Notes As at As at As atMarch 31, 2017 March 31, 2016 April 1, 2015
I. ASSETS(1) Non-current assets
(a) Property, Plant and Equipment 3 4,01,502.39 4,15,252.99 4,21,336.05(b) Capital work-in-progress 3 2,916.26 4,202.04 9,430.25(c) Intangible assets 4 1,51,695.08 1,51,771.01 1,52,328.07(d) Financial Assets 5
(i) Investments 5(a) 5,656.37 8,975.13 9,610.31(ii) Loans 5(b) 6,559.01 7,333.39 5,671.77(iii) Others 5(c) 951.32 1,148.93 1,083.61
(e) Other non-current assets 6 11,870.18 11,787.96 8,475.69Total Non-current assets 5,81,150.61 6,00,471.45 6,07,935.75
(2) Current assets(a) Inventories 7 1,23,911.95 2,48,102.47 3,14,558.61(b) Financial Assets 8
(i) Investments 8(a) 108.59 89.81 91.20(ii) Trade receivables 8(b) 5,28,465.34 6,81,940.35 6,19,733.30(iii) Cash and cash equivalents 8(c) 9,837.65 23,919.14 7,078.31(iv) Bank balances other than (iii) above 8(d) 6,201.80 7,398.61 46,462.25(v) Loans 8(e) 1,149.60 10,189.59 9,525.60(vi) Others 8(f) 4,834.42 15,467.74 11,744.97
(c) Other Current Assets 9 97,067.24 1,37,204.89 1,25,113.94Assets Classified as held for Sale 10 367.56 — —Total Current assets 7,71,944.15 11,24,312.60 11,34,308.18
Total Assets 13,53,094.76 17,24,784.05 17,42,243.93II. EQUITY AND LIABILITIES
Equity(a) Equity share capital 11 6,529.41 6,529.41 6,528.61(b) Other Equity 12 86,485.05 2,36,699.11 3,68,775.06Total Equity 93,014.46 2,43,228.52 3,75,303.67Non-Controlling Interest (10,926.83) (5,838.90) (1,948.96)LIABILITIES
(1) Non-Current Liabilities(a) Financial Liabilities 13
(i) Borrowings 13(a) 7,972.14 8,317.56 9,048.13(ii) Other financial liabilities 13(b) 4.35 909.63 1,512.19
(b) Provisions 14 2.99 236.77 4.29(c) Deferred tax liabilities (Net) 15 44,581.60 78,808.33 86,705.98(d) Other non-current liabilities 16 1,550.77 9,928.51 19,133.10Total Non-Current Liabilities 54,111.85 98,200.80 1,16,403.69
(2) Current liabilities(a) Financial Liabilities 17
(i) Borrowings 17(a) 5,25,124.33 5,00,609.88 3,07,116.65(ii) Trade payables 17(b) 4,88,707.34 6,27,604.34 6,47,786.50(iii) Other financial liabilities 17(c) 1,85,822.39 1,57,868.92 1,63,921.55
(b) Other current liabilities 18 16,156.81 1,01,891.31 1,30,532.93(c) Provisions 19 851.32 1,207.88 1,007.84(d) Current tax liabilities (Net) 20 60.09 11.30 2,120.06Liabilities directly associated with assets classified as held for sale 21 173.00 — —Total Current liabilities 12,16,895.28 13,89,193.63 12,52,485.53
Total Equity and Liabilities 13,53,094.76 17,24,784.05 17,42,243.93
See accompanying Notes to the financial statements from 1 to 48
As per our report of even date attached For and on behalf of the Board of DirectorsFor and on behalf ofP. D. Kunte & Co. (Regd.) R. L. Gupta Dinesh ShahraChartered Accountants Company Secretary Managing Director
DIN:00533055D. P. Sapre Anil Singhal Vijay Kumar JainPartner Chief Financial Officer Executive DirectorMembership no. 40740 DIN:00098298Place: MumbaiDate: May 30, 2017

Annual Report 2016-17
143
Ruchi Soya Industries Limited
Statement of Consolidated Profit and Loss( ` in lakh)
Notes For the year ended For the year endedMarch 31, 2017 March 31, 2016
INCOMEI Revenue from Operations 22 19,17,288.85 30,24,048.82II Other Income 23 10,759.89 9,712.78III Total Income ( I+II ) 19,28,048.74 30,33,761.60IV EXPENSES
Cost of materials consumed 24 10,41,959.29 12,62,333.09Purchases of Stock-in-Trade 25 6,39,104.92 15,13,291.44Changes in inventories of finished goods,work-in-progress and stock in trade 26 33,667.82 29,512.12Employee Benefits Expense 27 19,320.59 22,445.35Finance Costs 28 93,290.62 1,36,116.84Depreciation, amortisation and impairment Expenses 29 15,887.40 16,668.20Provision for Doubtful Debts and advances[Including Bad Debts written off] 30 1,31,540.08 25,448.47Other Expenses 31 1,30,201.22 1,66,857.01Total Expenses 21,04,971.94 31,72,672.52
V Profit/(loss) before exceptional items and tax (III-IV) (1,76,923.20) (1,38,910.92)VI Share of Net Profit/(Loss) of Associates (77.60) (593.91)VII Minority Interest 5,087.93 3,889.95VIII Exceptional Items 32 3,328.19 238.98IX Profit/(loss) before tax (V+VI+VII+VIII) (1,68,584.68) (1,35,375.90)X Tax expense
Current Tax — (43.52)Deferred Tax 15 (34,226.73) (7,897.65)Tax for earlier years (3,190.32) (74.41)
XI Profit/(loss) after tax for the year (IX-X) (1,31,167.63) (1,27,360.32)XII (A) Other Comprehensive Income / (Loss) 33
(i) Items that will not be reclassified tostatement of profit or loss (648.22) (482.81)Tax relating to above items (28.26) 42.64
(ii)Items that will be reclassified to statementof profit or loss — —Tax relating to above items — —
(B) Hedge Reserves 33(i) Items that will not be reclassified to
statement of profit or loss — —(ii)Items that will be reclassified to
statement of profit or lossEffective portion of gain or loss on hedginginstruments in a cash flow hedge 200.30 344.26
XIII Total comprehensive income for the year (XI+XII) (1,31,643.81) (1,27,456.23)XIV Earnings per equity share of face value of `̀̀̀̀ 2 each 42
Basic and Diluted earnings per share beforeExceptional Itemsa Basic (in `) (47.10) (40.53)b Diluted (in `) (47.10) (40.53)Basic and Diluted earnings per share afterExceptional Itemsa Basic (in `) (46.08) (40.46)b Diluted (in `) (46.08) (40.46)
See accompanying Notes to the financial statements from 1 to 48
As per our report of even date attached For and on behalf of the Board of DirectorsFor and on behalf ofP. D. Kunte & Co. (Regd.) R. L. Gupta Dinesh ShahraChartered Accountants Company Secretary Managing Director
DIN:00533055D. P. Sapre Anil Singhal Vijay Kumar JainPartner Chief Financial Officer Executive DirectorMembership no. 40740 DIN:00098298Place: MumbaiDate: May 30, 2017

Ruchi Soya Industries Limited
144
Ruchi Soya Industries Limited
Consolidated Statement of Changes inEquity (SOCIE)
a.E
qu
ity
shar
e ca
pit
al(`
in L
akh)
Mar
ch 3
1, 2
017
Mar
ch 3
1, 2
016
No.
of
Shar
es A
mou
nt
No.
of
Shar
es A
mou
nt
Balan
ce a
t the
beg
inni
ng o
f th
e re
port
ing
perio
d 3
,341
.01
6,6
82.0
2 3
,340
.61
6,6
81.2
1Ch
ange
s in
Equ
ity sh
are
capi
tal d
urin
g th
e ye
ar–
Shar
es is
sued
und
er E
mpl
oyee
Sto
ck O
ptio
n du
ring
the
year
— —
0.4
0 0
.81
Balan
ce a
t the
end
of
the
repo
rtin
g pe
riod
3,3
41.0
1 6
,682
.02
3,3
41.0
1 6
,682
.02
Less
: 76
,30,
115
Trea
sury
Equ
ity S
hare
s [ R
efer
Not
e 11
(i)]
76.
30 1
52.6
0 7
6.30
152
.60
Balan
ce a
t the
end
of
the
repo
rtin
g pe
riod
3,2
64.7
1 6
,529
.41
3,2
64.7
1 6
,529
.41
b.O
ther
Eq
uit
y(i
)A
s at
Mar
ch 3
1, 2
017
[Ref
er N
ote
12]
(` in
Lak
h) P
artic
ular
sSh
are
Rese
rves
and
Surp
lus
Tota
lN
ote
appl
icatio
n C
apita
lSh
are
Secu
rities
Gene
ral
Busin
ess
Capi
talEf
fectiv
eFo
reig
nFo
reig
nEq
uity
Retai
ned
Refer
ence
mon
eyRe
dem
ptio
nO
ptio
nsPr
emiu
mRe
serv
ede
velop
men
tRe
serv
epo
rtion
ofCu
rrenc
yCu
rrenc
yIn
strum
ents
Earn
ings
pend
ing
Rese
rve
Out
stand
ing
Rese
rve
rese
rve
Cash
Flow
Mon
etary
Tran
slatio
nth
rouh
allot
men
tAc
coun
tH
edge
sIte
mre
serv
esot
her C
om-
Tran
slatio
npr
ehen
sive
Diffe
renc
eIn
com
eAc
coun
t
Balan
ce at
the b
egin
ning
of t
here
porti
ng pe
riod
——
8,77
0.98
98.76
45,18
6.45
41,80
0.94
19,32
5.44
3,32
8.75
(200
.30)
(605
.38)
1,20
1.60
(8,43
9.77)
1,26
,231.6
4 2,
36,69
9.11
Chang
es in
accou
nting
policy
or pr
ior pe
riod e
rrors
— —
— —
— —
— —
— —
— —
— —
Profit/
(Loss)
for th
e year
— —
— —
— —
— —
——
——
(1,31
,167.6
3) (1
,31,16
7.63)
Other
Comp
rehens
ive In
come f
or the
year
(net o
f tax)
33 —
— —
— —
— —
— —
—(73
0.19)
53.71
(676
.48)
Tota
l com
preh
ensiv
e inc
ome f
or th
e yea
r —
— —
— —
— —
— —
— —
(730.1
9) (1
,31,11
3.92)
(1,31
,844.1
1)
Defer
red he
dging
gains
/ (los
ses) a
nd co
st of h
edging
transf
erred
to P&
L duri
ng th
e year
33 —
— —
— —
— —
200.3
0 —
——
— 20
0.30
Tran
sact
ions
with
the o
wner
s in
their
capa
city
as th
e own
ers
–Em
ployee
Stock
optio
n exp
enses
12 B
——
11.49
— —
— —
— —
— —
— 11
.49
Oth
er ch
ange
s dur
ing
the y
ear
–Cu
rrent
Year
charge
to Bu
siness
devel
opme
nt Re
serve
12 E
——
——
—(19
,264.7
6) —
——
——
—(19
,264.7
6)
–Ch
arge d
uring
the y
ear12
H an
d I—
——
——
—-—
—47
9.56
(389
.68)
——
89.88
–Ad
justm
ent fo
r Reve
rsal o
f Depr
eciati
on 12
K —
— —
— —
— —
— —
——
593.1
4 59
3.14
Balan
ce at
the e
nd of
the r
epor
ting
perio
d —
—8,7
70.98
110.2
5 45
,186.4
5 41
,800.9
4 60
.68 3,
328.7
5 0.
00 (1
25.82
) 81
1.92
(9,16
9.96)
(4,28
9.14)
86,48
5.05

Annual Report 2016-17
145
Ruchi Soya Industries Limited
Consolidated Statement of Changes inEquity (SOCIE) (Contd.)
(ii)
As
at M
arch
31,
201
6 [R
efer
Not
e 12
] (`
in L
akh)
Par
ticul
ars
Shar
eRe
serv
es an
d Su
rplu
sTo
tal
Not
eap
plica
tion
Cap
ital
Shar
eSe
curit
iesGe
nera
lBu
sines
sCa
pital
Effec
tive
Fore
ign
Fore
ign
Equi
tyRe
taine
dRe
feren
cem
oney
Rede
mpt
ion
Opt
ions
Prem
ium
Rese
rve
deve
lopm
ent
Rese
rve
porti
on of
Curre
ncy
Curre
ncy
Instr
umen
tsEa
rnin
gspe
ndin
gRe
serv
eO
utsta
ndin
gRe
serv
ere
serv
eCa
sh F
low
Mon
etary
Tran
slatio
nth
rouh
allot
men
tAc
coun
tH
edge
sIte
mre
serv
esot
her C
om-
Tran
slatio
npr
ehen
sive
Diffe
renc
eIn
com
eAc
coun
t
Balan
ce at
the b
egin
ning
of th
e rep
ortin
g pe
riod
— —
8,770
.98 10
6.00
45,15
2.96
41,80
0.94
24,05
1.03
3,32
8.75
(544
.56)
(776
.45)
564.4
7 (8
,080.1
8) 2,
54,40
1.12
3,68
,775.0
6
Profit/
( Loss
) for th
e year
— —
— —
— —
— —
— —
——
(1,27
,360.3
2) (1
,27,36
0.32)
Transa
ction
Cost a
rising
on sh
are iss
ued du
ring t
he yea
r0.1
00.1
0( N
et of
tax `
0.05 L
akh)
Other
Comp
rehens
ive In
come f
or the
year
(net o
f tax)
33 —
— —
— —
— —
——
— (3
59.59
) (1
65.86
) (5
25.45
)To
tal c
ompr
ehen
sive i
ncom
e for
the y
ear
— —
— —
— —
— —
— —
— (3
59.59
) (1
,27,52
6.08)
(1,27
,885.6
7)
Defer
red he
dging
gains
/ (los
ses) a
nd co
st of h
edging
transf
erred
to P&
L duri
ng th
e year
33 —
——
——
——
344.2
6—
——
—34
4.26
Tran
sact
ions
with
the o
wner
s in
their
capa
city
as th
e own
ers
–Iss
ue of
Equit
y Shar
es 12
C —
——
33.59
——
——
——
——
33.59
–Eq
uity D
ividend
s Paid
durin
g the
year
( Inclu
ding D
DT) p
ertain
g to F
inanci
al year
2014
-15 12
J —
——
——
——
——
——
(643.4
0) (6
43.40
)–
Emplo
yee St
ock op
tion e
xpens
es 12
B—
— (7
.24)
——
——
——
——
— (7
.24)
Oth
er ch
ange
s dur
ing
the y
ear
–Tra
nsacti
on Co
st ari
sing o
n shar
e issue
(Net
of tax
` 0.0
5 Lakh
) 12
C—
——
(0.10
)—
——
——
——
— (0
.10)
–Cu
rrent
Year
charge
to Bu
siness
devel
opme
nt Re
serve
12 E
——
——
—(4,
725.5
9) —
——
——
—(4,
725.5
9)–
Charg
e duri
ng th
e year
12 H
and I
——
——
——
——
171.0
7 63
7.13
——
808.2
0 B
alanc
e at t
he en
d of
the r
epor
ting
perio
d —
— 8,
770.9
8 98
.76 45
,186.4
5 41
,800.9
4 19
,325.4
4 3,
328.7
5 (2
00.30
) (6
05.38
) 1,
201.6
0 (8
,439.7
7) 1,
26,23
1.64
2,36
,699.1
1

Ruchi Soya Industries Limited
146
Ruchi Soya Industries Limited
Consolidated Cash Flow Statement
Particulars For the year ended For the year endedMarch 31, 2017 March 31, 2016
A. CASH FLOW FROM OPERATING ACTIVITIESProfit/(Loss) before tax (1,68,584.68) (1,35,375.90)Adjustments for:Depreciation, amortisation and Impairment Expenses 15,887.40 16,668.20Net Gain on Sale/Discard of Fixed Assets (7.43) 33.28Amounts charged directly to Other Comprehensive Income (648.22) (482.81)Share-based payment expense 11.48 13.07Impairment on Investements and Fair Value adjustement (Net) 3,332.44 1,080.67Deemed Investment on account of corporate guarantee (352.20) (1,023.75)Interest Income (3,382.73) (6,213.01)Dividend Income — (28.60)Finance costs 93,290.62 1,36,116.84Provision for Doubtful Debts, Advances and Bad Debts 1,26,833.27 25,045.44Provision for Gratuity and compensated absences (356.56) 200.04Minority Interest in net assets (5,087.93) (3,889.95)Share of Net Profit/(Loss) of Associates 77.60 593.91Amount Debited to Business Development Reserve (19,264.76) (4,725.59)(Gain)/loss on sale of Investment [ Including classified underExceptional items] (4,490.40) (0.95)Adjustment for Reversal of Depreciation (593.14) —Provision from loss in LLP 18.31 —Net unrealised exchange loss/(gain) (13,145.07) (3,820.78)
23,538.00 24,190.11Working capital adjustments(Increase)/ Decrease in inventories 1,24,190.52 66,456.14(Increase)/ Decrease in trade and other receivables 20,592.64 (87,521.63)(Increase)/ Decrease in other assets 52,402.64 (16,153.61)(Increase)/ Decrease in Other Balance with Banks 1,196.81 39,063.64(Increase)/Decrease in Long-term loans & advances 774.38 (1,661.62)(Increase)/ Decrease in Short-term loans & advances 9,039.99 (663.99)Increase/ (Decrease) in trade and other payables (1,21,971.33) (16,274.95)Increase/ (Decrease) in other liabilities (67,064.05) (44,501.40)Cash generated from operations 42,699.61 (37,067.32)Income Tax paid 2,636.47 (4,116.48)Net Cash Flows from Operating Activities 45,336.08 (41,183.79)
B. CASH FLOW FROM INVESTING ACTIVITIESPayment for purchase and construction of property, plant andequipment (900.14) (6,035.93)Proceeds from sale of property, plant and equipment 495.64 932.97Proceeds from sale /(Purchase) of Investments 4,457.29 578.84Interest Income 3,382.73 6,213.01Dividend Income — 28.60
( ` in lakh)
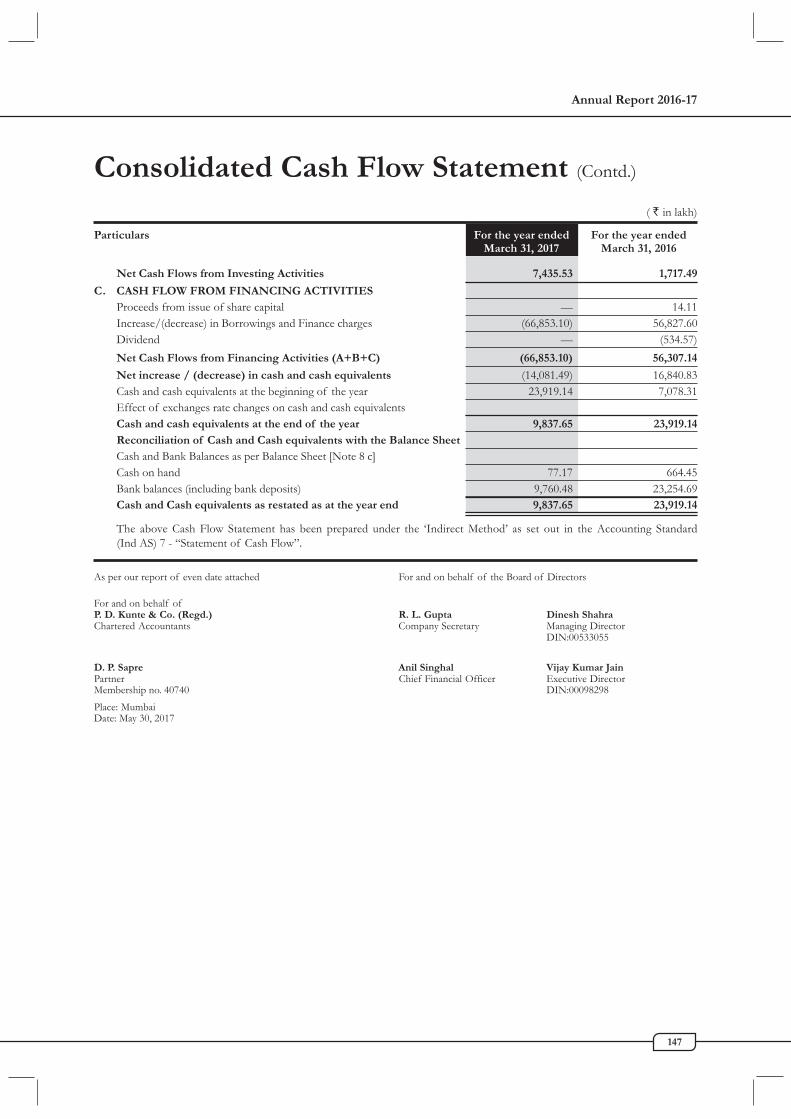
Annual Report 2016-17
147
Consolidated Cash Flow Statement (Contd.)
Particulars For the year ended For the year endedMarch 31, 2017 March 31, 2016
Net Cash Flows from Investing Activities 7,435.53 1,717.49
C. CASH FLOW FROM FINANCING ACTIVITIESProceeds from issue of share capital — 14.11Increase/(decrease) in Borrowings and Finance charges (66,853.10) 56,827.60Dividend — (534.57)Net Cash Flows from Financing Activities (A+B+C) (66,853.10) 56,307.14
Net increase / (decrease) in cash and cash equivalents (14,081.49) 16,840.83Cash and cash equivalents at the beginning of the year 23,919.14 7,078.31Effect of exchanges rate changes on cash and cash equivalentsCash and cash equivalents at the end of the year 9,837.65 23,919.14Reconciliation of Cash and Cash equivalents with the Balance SheetCash and Bank Balances as per Balance Sheet [Note 8 c]Cash on hand 77.17 664.45Bank balances (including bank deposits) 9,760.48 23,254.69Cash and Cash equivalents as restated as at the year end 9,837.65 23,919.14
The above Cash Flow Statement has been prepared under the ‘Indirect Method’ as set out in the Accounting Standard(Ind AS) 7 - “Statement of Cash Flow”.
( ` in lakh)
As per our report of even date attached For and on behalf of the Board of Directors
For and on behalf ofP. D. Kunte & Co. (Regd.) R. L. Gupta Dinesh ShahraChartered Accountants Company Secretary Managing Director
DIN:00533055
D. P. Sapre Anil Singhal Vijay Kumar JainPartner Chief Financial Officer Executive DirectorMembership no. 40740 DIN:00098298Place: MumbaiDate: May 30, 2017

Ruchi Soya Industries Limited
148
Notesto Consolidated Financial Statement for the Year Ended March 31, 2017
NOTE 1-2
1 CORPORATE INFORMATIONRuchi Soya Industries Limited (‘the Company’) is a PublicLimited Company. The Company and its subsidiariescollectively referred as “the Group” engaged primarily inthe business of processing of oil-seeds and refining of crudeoil for edible use. The consolidated financial statements asat March 31, 2017 presents the financial position of theGroup as well as its interest in associate companies and jointarrangements. The Group also produces oil meal, foodproducts from soya and value added products fromdownstream and upstream processing. The Group is alsoengaged in trading in various products and generation ofpower from wind energy. The Group has manufacturingplants across India and is listed on the Bombay StockExchange Limited (BSE) and National Stock Exchange ofIndia Limited (NSE).
2 BASIS OF PREPARATION ANDSIGNIFICANT ACCOUNTING POLICIES(A) BASIS OF PREPARATION
a Statement of Compliance
In accordance with the notification issued by theMinistry of Corporate Affairs, the Group hasadopted Ind AS notified under the Companies(Indian Accounting Standards) Rules, 2015 witheffect from April 1, 2016. The transition fromprevious GAAP to Ind AS has been accountedfor in accordance with the Ind AS 101 “First TimeAdoption of Indian Accounting Standards”, withApril 1, 2015 being the transition date.In accordance with the Ind AS 101 "First timeadoption of Indian Accounting Standard", theGroup has presented a reconciliation [ from thepresentation of consolidated financial statementsunder accounting standards notified under theCompanies (Accounting Standards) Rules, 2006("Previous GAAP") to Ind AS ] of total equity asat April 1, 2015, March 31, 2016 and Statementof Profit and Loss for the year ended March 31,2016. [ Refer Note 48 ]
b Functional and presentation currency
These Consolidated financial statements arepresented in Indian rupees (`), which is theGroup’s functional currency. All amounts havebeen rounded to the nearest lakh, unless otherwiseindicated. [10 Lakh=1Million]
c Basis of Measurement
These consolidated financial statements have beenprepared on a historical cost convention basis,except for the following:
(i) Certain financial assets and liabilities that aremeasured at Fair Value.
(ii) Assets held for sale- Measured at the lowerof (a) carrying amount and (b) Fair Valueless cost to sell.
(iii) Net defined benefit plans- Plan assetsmeasured at Fair Value less present value ofdefined benefit obligation.Determining the Fair Value
While measuring the Fair Value of an assetor a liability, the Group uses observablemarket data as far as possible. Fair Values arecategorised into different levels in a Fair Valuehierarchy based on the inputs used in thevaluation techniques as follows.Level 1: Quoted prices (unadjusted) in activemarkets for identical assets or liabilities.Level 2: inputs other than quoted pricesincluded in Level 1 that are observable forthe asset or liability, either directly (i.e. asprices) or indirectly (i.e. derived from prices).Level 3: inputs for the asset or liability thatare not based on observable market data(unobservable inputs).If the inputs used to measure the Fair Valueof an asset or a liability fall into different levelsof the Fair Value hierarchy, then the FairValue measurement is categorised in itsentirety in the same level of the Fair Valuehierarchy as the lowest level input that issignificant to the entire measurement.
d Basis of Consolidation
The consolidated financial statements incorporatethe financial statements of the Group. It alsoincludes the Group’s share of profits, net assetsand retained post acquisition reserves of jointarrangements and associates that are consolidatedusing the equity or proportionate method ofconsolidation , as applicable.Control over an entity in the Group is achievedwhen the Group is exposed to, or has rights tothe variable returns of the entity and ability toaffect those returns through its power over theentity.The results of subsidiaries, joint arrangements andassociates acquired or disposed off during the yearare included in the consolidated statement ofprofit and loss from the effective date ofacquisition or up to the effective date of disposal,as appropriate.Wherever necessary, adjustments are made to thefinancial statements of subsidiaries, joint

Annual Report 2016-17
149
Notesto Consolidated Financial Statement for the Year Ended March 31, 2017
arrangements and associates to bring theiraccounting policies in line with those used by othermembers of the Group.Intra-group transactions, balances, income andexpenses are eliminated on consolidation.Non-controlling interests in the net assets ofconsolidated subsidiaries are identified separatelyfrom the Group's equity.The interest of non-controlling shareholder's may be initially measuredeither at Fair Value or at the non-controllinginterests proportionate share of the Fair Value ofthe acquiree's identifiable net assets. The choiceof measurement basis is made on an acquisition-by-acquisition basis. Subsequently to acquisition,the carrying value of non-controlling interests isthe amount of those interests at initial recognitionplus the non-controlling interests' share ofsubsequent changes in equity. Total comprehensiveincome is attributed to non-controlling interestseven if it results in the non-controlling interestshaving deficit balance.
e Investment in associates
Associates are those enterprises in which the grouphas significant influence, but does not have control.Investment in associates are accounted for usingthe equity method and are initially recognised atcost, from the date significant inf luencecommences until the date that significant influenceceases. Subsequent changes in the carrying valuereflect the post-acquisition changes in the Group’sshare of net assets of the associate and impairmentcharges, if any.When the Group’s share of losses exceeds thecarrying value of the associate, the carrying valueis reduced to nil and recognition further losses isdiscounted, except to the extent that the Grouphas incurred obiligations in respect of theassociates.Unrealised gains on transactions between theGroup and its associates are eliminated to theextent of the Group’s interest in the associates,unrealised losses are also eliminated unless thetransaction provides evidence of an impairmentof the asset transferred and where material, theresults of associates are modified to confirm tothe Group’s accounting policies.
f Interest in joint arrangements
A joint arrangements is a contractual arrangementwhereby the Group and other parties undertakean economic activity where the strategic financialand operating policy decisions relating to theactivities of the joint arrangement require theunanimous consent of the parties sharing control.
Where Group entity undertakes its activities underjoint arrangements directly, the Group’s share ofjointly controlled assets and any liabilities incurredjointly with other parties are recognised in itsfinancial statements and classified according totheir nature. Liabilities and expenses incurreddirectly in respect of interests in jointly controlledassets are accounted for on the accrual basis.Income from the sale or use of the Group’s shareof the output of jointly controlled assets, and itsshare of joint arrangements expenses, arerecognised when it is probable that the economicbenefits associated with the transactions will flowto the Group and their amount can be measuredreliably.Joint arrangements that involve the establishmentof a separate entity in which each venturer has aninterest are referred to as joint ventures. TheGroup reports its interests in joint ventures usingthe equity method of accounting whereby aninterest in joint venture is initially recorded at costand adjusted thereafter for post-acquisitionchanges in the Group’s share of net assets of jointventure. The consolidated statement of profit andloss reflects the Group’s share of the results ofoperations of the joint venture.Unrealised gains on transactions between theCompany and its joint venture are eliminated tothe extent of the Group’s interest in the jointventure, unrealised losses are also eliminated unlessthe transactions provides evidence of animpairment of the asset transferred and wherematerial, the results of joint ventures are modifiedto confirm to the Group’s accounting policies.
g Use of Estimates and Judgement
The preparation of Consolidated financialstatements in accordance with Ind AS requiresmanagement to make judgements, estimates andassumptions that affect the application ofaccounting policies and the reported amount ofassets, liabilities, income and expenses. Actualresults may differ from these estimates.Estimates and underlying assumptions arereviewed on an ongoing basis. Revisions to theaccounting estimates are recognized in the periodin which the estimates are known or materialised.The most significant estimates and assumptionsare described below:(i) Judgements
Information about judgements made inapplying accounting policies that have thesignificant effect on amounts recognised inthe financial statement are as below:
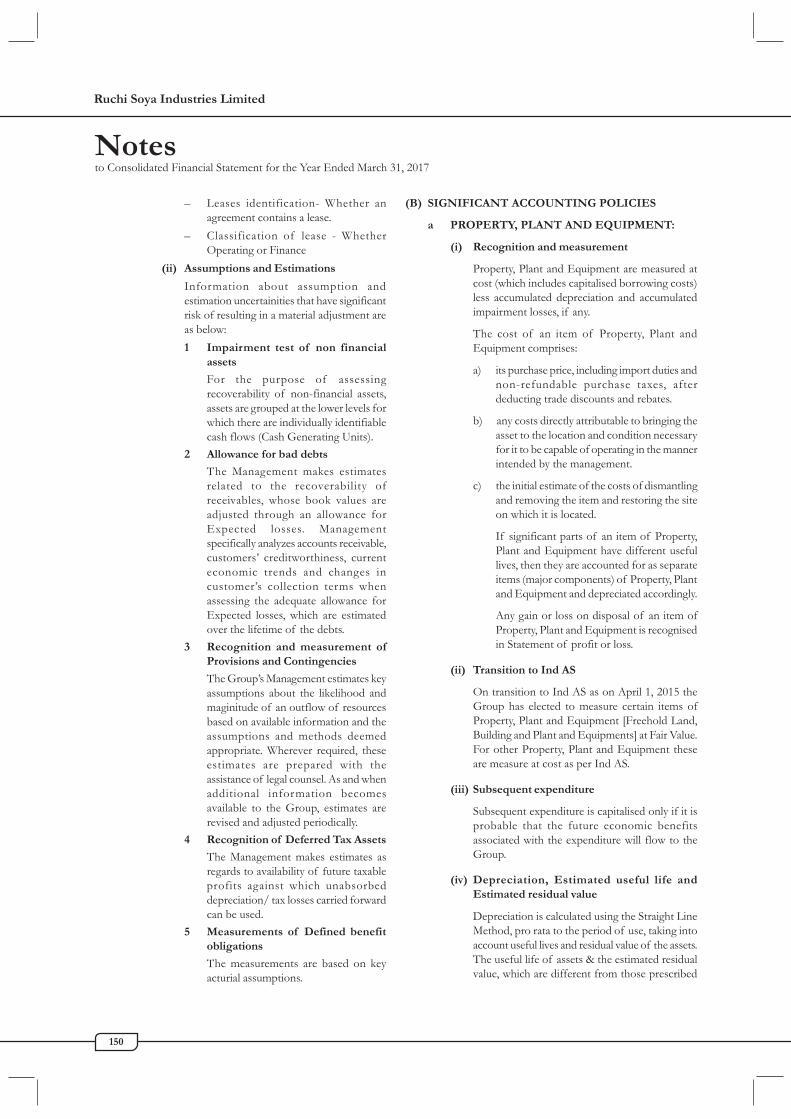
Ruchi Soya Industries Limited
150
Notesto Consolidated Financial Statement for the Year Ended March 31, 2017
– Leases identification- Whether anagreement contains a lease.
– Classification of lease - WhetherOperating or Finance
(ii) Assumptions and Estimations
Information about assumption andestimation uncertainities that have significantrisk of resulting in a material adjustment areas below:1 Impairment test of non financial
assets
For the purpose of assessingrecoverability of non-financial assets,assets are grouped at the lower levels forwhich there are individually identifiablecash flows (Cash Generating Units).
2 Allowance for bad debts
The Management makes estimatesrelated to the recoverability ofreceivables, whose book values areadjusted through an allowance forExpected losses. Managementspecifically analyzes accounts receivable,customers’ creditworthiness, currenteconomic trends and changes incustomer’s collection terms whenassessing the adequate allowance forExpected losses, which are estimatedover the lifetime of the debts.
3 Recognition and measurement ofProvisions and Contingencies
The Group’s Management estimates keyassumptions about the likelihood andmaginitude of an outflow of resourcesbased on available information and theassumptions and methods deemedappropriate. Wherever required, theseestimates are prepared with theassistance of legal counsel. As and whenadditional information becomesavailable to the Group, estimates arerevised and adjusted periodically.
4 Recognition of Deferred Tax Assets
The Management makes estimates asregards to availability of future taxableprofits against which unabsorbeddepreciation/ tax losses carried forwardcan be used.
5 Measurements of Defined benefitobligations
The measurements are based on keyacturial assumptions.
(B) SIGNIFICANT ACCOUNTING POLICIES
a PROPERTY, PLANT AND EQUIPMENT:
(i) Recognition and measurement
Property, Plant and Equipment are measured atcost (which includes capitalised borrowing costs)less accumulated depreciation and accumulatedimpairment losses, if any.
The cost of an item of Property, Plant andEquipment comprises:
a) its purchase price, including import duties andnon-refundable purchase taxes, afterdeducting trade discounts and rebates.
b) any costs directly attributable to bringing theasset to the location and condition necessaryfor it to be capable of operating in the mannerintended by the management.
c) the initial estimate of the costs of dismantlingand removing the item and restoring the siteon which it is located.
If significant parts of an item of Property,Plant and Equipment have different usefullives, then they are accounted for as separateitems (major components) of Property, Plantand Equipment and depreciated accordingly.
Any gain or loss on disposal of an item ofProperty, Plant and Equipment is recognisedin Statement of profit or loss.
(ii) Transition to Ind AS
On transition to Ind AS as on April 1, 2015 theGroup has elected to measure certain items ofProperty, Plant and Equipment [Freehold Land,Building and Plant and Equipments] at Fair Value.For other Property, Plant and Equipment theseare measure at cost as per Ind AS.
(iii) Subsequent expenditure
Subsequent expenditure is capitalised only if it isprobable that the future economic benefitsassociated with the expenditure will flow to theGroup.
(iv) Depreciation, Estimated useful life andEstimated residual value
Depreciation is calculated using the Straight LineMethod, pro rata to the period of use, taking intoaccount useful lives and residual value of the assets.The useful life of assets & the estimated residualvalue, which are different from those prescribed

Annual Report 2016-17
151
Notesto Consolidated Financial Statement for the Year Ended March 31, 2017
under Schedule II to the Companies Act, 2013,are based on technical advice as under:
Assets Estimated Estimateduseful lifes Residual Value
Building 3 to 84 years 5 PercentPlant & Equipments 6 to 46 years 5 to 27 percentWindmills 30 years 19 percentFurniture and 5 to 10 years As perFixtures Schedule IIMotor Vehicles 7 to 8 years As per
Schedule IIDepreciation is computed with reference to cost/ Fair Value.The assets residual value and useful life are reviewed andadjusted, if appropriate, at the end of each reporting period.Gains and losses on disposal are determined by comparingproceeds with carrying amounts. These are included in thestatement of Profit and Loss.
b INTANGIBLE ASSETS(i) Recognition and measurement
Computer softwares have finite useful lives andare measured at cost less accumulated amortisationand any accumulated impairment losses. As ontransition date i.e. April 1, 2015 the same aremeasured at cost as per Ind AS.Acquired brands / Trademarks have indefiniteuseful life and as on transition date April 1, 2015have been Fair Valued based on reports of Expertvaluer. The same are tested for impairment, ifany , at the end of each accounting period.
(ii) Subsequent expenditureSubsequent expenditure is capitalised only whenit increases the future economic benefits embodiedin the specific asset to which it relates. All otherexpenditure, including expenditure on internallygenerated goodwill and brands, when incurred isrecognised in statement of profit or loss.
(iii) AmortisationAmortisation is calculated to write off the costof intangible assets less their estimated residualvalues using the straight-line method over theirestimated useful lives and is generally recognisedin statement of profit or loss. Computer softwareare amortised over their estimated useful life or 5years, whichever is lower.Amortisation methods, useful lives and residualvalues are reviewed at each reporting date andadjusted, if required.
c FINANCIAL INSTRUMENTSA financial instrument is any contract that gives rise toa financial asset of one entity and a financial liability orequity instrument of another entity. Financial
instruments also include derivative contracts such asforeign currency foreign exchange forward contracts,interest rate swaps and currency options.(i) Financial assets
Classification
The Group classifies its financial assets in thefollowing measurement categories:– those to be measured subsequently at Fair
Value Through Other ComprehensiveIncome- [FVTOCI], or Fair Value ThroughProfit and Loss- [FVTPL] and
– those measured at Amortised Cost. [AC]In case of investments
In Equity instruments
For other than Subsidiary, Associate Joint VenturesInvestments are Measured at FVTOCI.In Mutual fund
Measured at Fair Value through Profit and Loss(FVTPL).Guarantee Commission
Guarantees extended to subsidiaries, associates andJoint ventures are Fair Valued.Debt instruments
The Group measures the debts instruments atAmortised Cost. Assets that are held for collectionof contractual cash flows where those cash flowsrepresent solely payment of principal and interest[SPPI] are measured at amortised cost. A gain orloss on a debt instrument that is subsequentlymeasured at amortised cost and is not part of thehedging relationship, is recognised in profit or losswhen the asset is derecognised or impaired.Interest income from these financial assets isincluded in finance income using the Effectiveinterest rate method.Derecognition of financial assets
A financial asset is derecognised only when:– The Group has transferred the rights to
receive cash flows from financial asset , or– Retains the contractual rights to receive the
cash flows of the financial assets, but assumesa contractual obligation to pay the cash flowsto one or more recepients.
Where the Group has transferred an asset and hastransferred substantially all risks and rewards ofownership of the financial asset, the financial assetis derecognised. Where the Group has nottransferred substantially all risks and rewards ofownership of the financial asset, the financial assetis not derecognised.

Ruchi Soya Industries Limited
152
Where the Group has neither transferred anfinancial asset nor retains substantially all risks andrewards of ownership of the financial asset, thefinancial asset is derecognised if the Group hasnot retained the control of the financial asset.Where the Group retains the control of thefinancial asset, the asset is continued to berecognised to the extent of continuinginvolvement in the financial asset.Impairment of financial assets
In accordance with Ind-AS 109, the Group appliesExpected Credit Loss (ECL) Model formeasurement and recognition of impairment losson the following financial assets and credit riskexposure:a) Financial assets that are debt instruments and
are measured at amortised cost e.g., loans,debt securities, deposits, and bank balance.
b) Trade receivables.The Group follows ‘simplified approach’ forrecognition of impairment loss allowance on:– Trade receivables which do not contain
a significant financing component.The application of simplified approachdoes not require the Group to trackchanges in credit risk. Rather, itrecognises impairment loss allowancebased on lifetime ECLs at each reportingdate, right from its initial recognition.
– For recognition of impairment loss onother financial assets and risk exposure,the Group determines whether there hasbeen a significant increase in the creditrisk since initial recognition. ExpectedCredit Loss Model is used to providefor impairment loss.
(ii) Financial liabilities
Classification
The Group classifies its financial liabilities in thefollowing measurement categories:– those to be measured subsequently at Fair
Value Through Profit and Loss-[FVTPL];and
– those measured at Amortised Cost. [AC]The classification depends on the entity’s businessmodel for managing the financial assets and thecontractual terms of the cash flows.Initial recognition and measurement
Financial liabilities are classified, at initialrecognition, as financial liabilities at FVTPLor at AC.
Notesto Consolidated Financial Statement for the Year Ended March 31, 2017
All financial liabilities are recognised initially at FairValue and, in the case of loans and borrowingsand payables, net of directly attributabletransaction costs.The Group’s financial liabilities include trade andother payables, loans and borrowings includingbank overdrafts, financial guarantee contracts andderivative financial instruments.Financial liabilities at FVTPL
Financial liabilities at FVTPL include financialliabilities designated upon initial recognition as atFair Value Through Profit or Loss. Financialliabilities are classified as held for trading if theyare incurred for the purpose of repurchasing inthe near term. This category also includesderivative financial instruments entered into by theGroup that are not designated as hedginginstruments in hedge relationships as defined byInd-AS 109. Separated embedded derivatives arealso classified as held for trading unless they aredesignated as effective hedging instruments.Gains or losses on liabilities held for trading arerecognised in the profit or loss.Financial liabilities designated upon initialrecognition at Fair Value Through Profit or Lossare designated at the initial date of recognition,only if the criteria in Ind-AS 109 are satisfied. Forliabilities designated as FVTPL, Fair Value gains/losses attributable to changes in own credit riskare recognized in OCI. These gains/loss are notsubsequently transferred to statement of profitor loss. However, the Group may transfer thecumulative gain or loss within equity. All otherchanges in Fair Value of such liability arerecognised in the statement of profit or loss.Loans and borrowings
After initial recognition, interest-bearing loans andborrowings are subsequently measured atamortised cost using the Effective Interest Rate(EIR) method. Gains and losses are recognised inprofit or loss when the liabilities are derecognisedas well as through the EIR amortisation process.Amortised cost is calculated by taking into accountany discount or premium on acquisition and feesor costs that are an integral part of the EIR. TheEIR amortisation is included as finance costs inthe statement of profit and loss.This category generally applies to interest-bearingloans and borrowings.Derecognition
A financial liability is derecognised when theobligation under the liability is discharged or

Annual Report 2016-17
153
Notesto Consolidated Financial Statement for the Year Ended March 31, 2017
cancelled or expires. When an existing financialliability is replaced by another from the same lenderon substantially different terms, or the terms ofan existing liability are substantially modified, suchan exchange or modification is treated as thederecognition of the original liability and therecognition of a new liability. The difference inthe respective carrying amounts is recognised inthe statement of profit or loss.Offsetting of financial instruments
Financial assets and financial liabilities are offsetand the net amount is reported in the balance sheetif there is a currently enforceable legal right tooffset the recognised amounts and there is anintention to settle on a net basis, to realise theassets and settle the liabilities simultaneously. Thelegally enforceable right must not be contingenton future events and must be enforceable in thenormal course of business and in the event ofdefault, insolvency or bankruptcy of the Groupor the counterparty.Derivative financial instruments
The Entity uses derivative financial instruments,such as forward currency contracts, interest rateswaps and forward commodity contracts to hedgeits foreign currency risks, interest rate risks andcommodity price risks respectively. Such derivativefinancial instruments are initially recognised at FairValue on the date on which a derivative contractis entered into and are subsequently re-measuredat Fair Value. Derivatives are carried as financialassets when the Fair Value is positive and asfinancial liabilities when the Fair Value is negative.
d INVENTORIES
Inventories are measured at the lower of cost andnet realisable value after providing for obsolence,if any, except for Stock-in-Trade which aremeasured at Fair Value and Realisable by-productswhich are measured at net realisable value. Thecost of inventories is determined using theweighted average method and includesexpenditure incurred in acquiring inventories,production or conversion and other costs incurredin bringing them to their respective presentlocation and condition. In the case ofmanufactured inventories and work in progress,cost includes an appropriate share of productionoverheads based on normal operating capacity.Thecomparision of cost and Net Realisable value ismade on an item by item basis.Net realisable value is estimated selling price inthe ordinary course of business, less estimated cost
of completion and the estimated costs necessaryto make the sale. The net realisable value of workin progress is determined with reference to sellingprices of finished products.
e TRADE RECEIVABLES
Trade receivable are recognised intially at FairValue and subsequently measured at AmortisedCost [AC] using the effective interest method lessprovision for impairment. As per Ind AS 109 theGroup has applied Expected Credit Loss Modelfor recognising the allowance for doubtful debts.
f CASH AND CASH EQUIVALENT
For the purpose of presentation in the statementof the cash flows, cash and cash equivalentincludes the cash on hand, deposits held at callwith financial institutions other short term, highlyliquid investments with original maturity of threemonths or less that are readily convertible toknown amounts of cash and which are subject toan insignificant risk of changes in value.
g CONTRIBUTED EQUITY
Equity shares are classified as equity. Incidentalcosts directly attributable to the issue of newshares or options are shown in equity as adeduction, net of tax, from the proceeds.
I Dividends
Provision is made for the amount of anydividend declared, in the year in which it isapproved by shareholders.
II Earnings per share
(i) Basic earnings per share
Basic earnings per shares is calculated bydividing Profit/(Loss) attributable to equityholders (adjusted for amounts directlycharged to Reserves) before/afterExceptional Items (net of tax) by Weightedaverage number of Equity shares, (excludingtreasury shares).
(ii) Diluted earnings per share
Diluted earnings per shares is calculated bydividing Profit/(Loss) attributable to equityholders (adjusted for amounts directlycharged to Reserves) before/afterExceptional Items (net of tax) by Weightedaverage number of Equity shares (excludingtreasury shares) considered for basic earningper shares including dilutive potential Equityshares.

Ruchi Soya Industries Limited
154
Notesto Consolidated Financial Statement for the Year Ended March 31, 2017
h BORROWINGS
Borrrowings are initially recognised at Fair Value,net of transaction costs incurred. Borrowings aresubsequently measured at amortised cost. Anydifference between the proceeds ( net oftransaction costs) and the redemption amount isrecognised in profit or loss over the period ofborrowings using the effective interest method.Processing/Upfront fee are treated as prepaid assetand netted off from borrowings. The same isamortised over the period of the facility to whichit relates.Preference shares are classified as liabilities. Thedividends on these preference shares, if approved,by shareholders in the forthcoming AnnualGeneral Meeting, are recognised in profit or lossas finance costs, in the year when approved.Borrowings are derecognised from the balancesheet when the obligation specified in the contractis discharged, cancelled or expired. The differencebetween the carrying amount of the financialliablity that has been extinguished or transferredto another party and the consideration paidincluding any non cash assets transferred or liabilityassumed, is recognised in Statement of profit orloss as other gains or (losses).Borrowings are classified as current liabilites unlessthe Company has an unconditional right to deferthe settlement of laiblities for aleast twelve monthsafter the reporting period.Where there is a breach of a material provision ofa long term loan arrangement on or before theend of the reporting period with the effect thatthe liablity becomes payable on demand on thereporting date, the same is classified as currentunless the lender agreed, after the reporting periodand before the approval of financial statementsfor issue, not to demand payment as a consequenceof the breach.
i TRADE AND OTHER PAYABLES
These amounts represent liabilities for goods andservices provided to the Group prior to the endof financial year which are unpaid at the periodend. Trade and other payables are presented ascurrent liabilities unless payment is not due within12 months after the reporting period. They arerecognised initially at their Fair Value andsubsequently measured at amortised cost using theeffective interest method.
j FOREIGN CURRENCY TRANSACTIONS
Transactions in foreign currencies are translatedinto the functional currencies of the Group at the
exchange rate prevailing at the date of thetransactions. Monetary assets (other theninvestments in companies registered outside India)and liabilities denominated in foreign currenciesare translated into the functional currency at theexchange rate at the reporting date.Investments in companies registered outside Indiaare converted at rate prevailing at the date ofaquisition. Non-monetary assets and liabilities thatare measured at Fair Value in a foreign currencyare translated into the functional currency at theexchange rate when the Fair Value was determined.Non-monetary items that are measured based onhistorical cost in a foreign currency are nottranslated.Difference on account of changes in foreigncurrency are generally charged to the statementof profit & loss except the following:The Holding Company and one of the subsidiaryCompany has availed the exemption availableunder Para D13AA of Ind AS - 101 of “Firsttime adoption of Indian Accounting Standards”.Accordingly, exchange gains and losses on foreigncurrency borrowings taken prior to April 1, 2016which are related to the acquisition or constructionof qualifying assets are adjusted in the carryingcost of such asset.The consolidated financial statements of theGroup are presented in (`), which is the functionalcurrency of the Company and the presentationcurrency for the consolidated financial statements.In preparing the consolidated financial statements,transactions in currencies other than the entity'sfunctional currency are recorded at the rates ofexchange prevailing on the date of the transaction.At the end of each reporting period, monetaryitems denominated in foreign currencies are re-transalted at the rates prevailing at the end of thereporting period. Non-monetary items carried atFair Value that are denominated in foreigncurrencies are re-translated at the rates prevailingon the date when the Fair Value was determined.Non-monetary items that are measured in termsof historical cost in a foreign currency are nottranslated.Exchange differences arising on translation of longterm foreign currency monetary items recognisedin the consolidated financial statements before thebeginning of the first Ind As financial reportingperiod in respect of which the Group has electedto recognise such exchange differences in equityor as part of cost of assets as allowed under Ind

Annual Report 2016-17
155
Notesto Consolidated Financial Statement for the Year Ended March 31, 2017
As 101- “First time adoption of IndianAccounting Standard” are recognised directly inequity or added/deducted to/ from the cost ofassets as the case may be, Such exchangedifferences recognised in equity or as part of costof assets is recognised in the consolidated financialstatement of profit and loss on a systematic basis.
Exchange differences arising on the retranslationor settlement of other monetary items are includedin the consolidated statement of profit and lossfor the period.
For the purpose of presenting financial statements,the assets and liabilities of the Group’s foreignoperations are expressed in ‘using exchange ratesprevailing at the end of reporting period.Exchange differences arising, if any, are recognisedin other comprehensive income and accumulatedin a separate component of equity. On the disposalof a foreign operation, all of the accumulatedexchange differences in respect of that operationattributable to the Group are reclassified to theconsolidated statement of profit and loss.
k REVENUE
(i) Sale of goods
Revenue is recognised when the significantrisk and rewards of the ownership have beentransferred to the buyer, recovery ofconsideration is probable, the associated costand possible return of goods can bemeasured reliably, there is no continuingeffective control/managerial involvement inrespect of the goods, and the amount ofrevenue can be measured reliably.
Revenue from sale of goods in the courseof ordinary activities is measured at the FairValue of the consideration received orreceivables net of returns, trade discount,volume rebates and taxes and duties onbehalf of government. This inter alia involvesdiscounting of the consideration due to thepresent value if the payment extends beyondnormal credit terms.
The timing of the transfer of control variesdepending on the individual terms of the sale.Income from sale of power is recognised onthe basis of units wheeled during the period.Income from carbon credits are recognisedon credit of Carbon Emission Reduction(CER) by the approving authority in themanner in which it is unconditionally availableto the generating Company.
(ii) Sale of Services
Revenue from services is recognised whenagreed contractual task has been completed.
(iii) Other Income
a) Dividend income is recognised whenright to receive dividend is established.
b) Interest and other income arerecognised on accrual basis on timeproportion basis and measured ateffective interest rate.
l GOVERNMENT GRANTS
(i) Grants from the Government arerecognised at their Fair Value wherethere is an reasonable assurance that thegrant will be received and the Companywill comply with all the attachedconditions.
(ii) Government grant relating to purchaseof Property, Plant and Equipment areincluded in ''Other current/ non-currentliabilities'' as Government Grant -Deferred Income and are credited toProfit or loss on a straight line basis overthe expected life of the related asset andpresented within ''Other Operatingrevenue''.
m EMPLOYEE BENEFITS
(i) During Employment benefits
(a) Short term employee benefits
Short-term employee benefits are expensedas the related service is provided. A liabilityis recognised for the amount expected to bepaid if the Group has a present legal orconstructive obligation to pay this amountas a result of past service provided by theemployee and the obligation can be estimatedreliably.
(b) Share-based payment transactions
Equity settled share based payments toemployees and others providing similarservices are measured at the Fair Value ofthe equity instruments at the grant date.Details regarding equity settled share basedtransactions are set out in Note 12 M(ii).The Fair Value determined at the grant dateof the equity-settled share based paymentsis expensed on a straight line basis over thevesting period, based on the Group's estimateof equity instruments that will eventually vest,with a corresponding increase in equity. At

Ruchi Soya Industries Limited
156
the end of each reporting period, thecompany revises its estimate of the numberof equity instruments expected to vest. Theimpact of the revision of the originalestimate, if any, is recognised in Statementof profit and loss such that the cumulativeexpenses reflects the revised estimate, with acorresponding adjustment to the Share BasedPayments Reserves.The dilutive effect of outstanding options isreflected as additional share dilution in thecomputation of diluted earnings per share.TRANSITION PROVISIONS
The Group has elected not to apply Ind AS102 to options that vested prior to April 1,2015.
(ii) Post Employment benefits
(a) Defined contribution plans
A defined contibution plan is a postemployment benefit plan under which aGroup pays fixed contribution into a separateentity and will have no legal or constructiveobligation to pay further amounts. TheGroup makes specified monthlycontributions towards governmentadministered Provident Fund scheme.Obligations for contributions to definedcontribution plans are expensed as the relatedservice is provided. Prepaid contributions arerecognised as an asset to the extent that acash refund or a reduction in future paymentsis available.
(b) Defined benefit plans
The Group pays gratuity to the employeeswho have has completed five years ofservice with the Group at the time whenemployee leaves the Group. The gratuityis paid as per the provisions of Paymentof Gratuity Act, 1972.The gratuity liability amount is contributedto the approved gratuity fund formedexclusively for gratuity payment to theemployees.The liability in respect of gratuity and otherpost-employment benefits is calculated usingthe Projected Unit Credit Method and spreadover the periods during which the benefit isexpected to be derived from employees'services.Re-measurement of defined benefit plans inrespect of post employment are charged to
Notesto Consolidated Financial Statement for the Year Ended March 31, 2017
Other Comprehensive Income.(c) Termination benefits
Termination benefits are payable whenemployment is terminated by the Groupbefore the normal retirement date or whenan employee accepts voluntary redundancyin exchange for these benefits. In case of anoffer made to encourage voluntaryredundancy, the termination benefits aremeasured based on the number of employeesexpected to accept the offer. Benefits fallingdue more than twelve months after the endof reporting period are discounted to thepresent value.
n INCOME TAX
Income tax expense comprises current and deferredtax. Tax is recognised in statement of profit and loss,except to the extent that it relates to items recognisedin the other comprehensive income or in equity. In suchcases, the tax is also recognised in the othercomprehensive income or in equity.(i) Current tax
Current tax assets and liabilities are measured atthe amount expected to be recovered from or paidto the taxation authorities, based on tax rates andlaws that are enacted or subsequently enacted atthe Balance sheet date.Current tax assets and liabilities are offset only if,the Group:a) has a legally enforceable right to set off the
recognised amounts; andb) intends either to settle on a net basis, or to
realise the asset and settle the liabilitysimultaneously.
(ii) Deferred tax
Deferred tax is recognised on temporarydifferences between the carrying amounts of assetsand liabilities in the consolidated financialstatements and the corresponding tax bases usedin the computation of taxable profit.Deferred tax liabilities and assets are measured atthe tax rates that are expected to apply in the periodin which the liability is settled or the asset realised,based on tax rates (and tax laws) that have enactedor subsequently enacted by the end of thereporting period. The carrying amount ofDeferred tax liabilities and assets are reviewed atthe end of each reporting period. Deferred tax isrecognised to the extent that it is probable thatfuture taxable profit will be available against whichthey can be used.

Annual Report 2016-17
157
Notesto Consolidated Financial Statement for the Year Ended March 31, 2017
The measurement of deferred tax reflects thetax consequences that would follow from themanner in which the Group expects, at thereporting date, to recover or settle thecarrying amount of its assets and liabilities.Deferred tax assets and liabilities are offsetonly if:
a) the entity has a legally enforceable right toset off current tax assets against current taxliabilities; and
b) the deferred tax assets and the deferred taxliabilities relate to income taxes levied by thesame taxation authority on the same taxableentity.
o BORROWING COSTS
General and specific Borrowing costs that are directlyattributable to the acquisition, construction orproduction of a qualifying asset that necessarily takes asubstantial period of time to get ready for its intendeduse are capitalised as part of the cost of that asset tillthe date it is ready for its intended use or sale. Otherborrowing costs are recognised as an expense in theperiod in which they are incurred.Investment income earned on the temporaryinvetsment of specific borrowings pending theirexpenditure on qualifying assets is deducted from theborrowing cost eligible for capitalisation. All otherborrowing costs are charged to the statement of profitand loss for the period for which they are incurred.
p LEASES
(i) Determining whether an arrangementcontains a lease
At inception of an arrangement, the Groupdetermines whether the arrangement is or containsa lease.As a lessee
Leases of Property, Plant and Equipment wherethe Group, as lessee, has substantially all the risksand rewards of the ownership are classified asfinance leases. Finance lease payments arecapitalised at the lower of lease's inception at theFair Value of the lease property and the presentvalue of minimum lease payments. Thecorresponding rental obligations, if any, net offinance charges are included in borrowings orother financial liabilities as appropiate. Each leasepayment is allocated between the liability and thefinance cost. The finance cost is charged to theprofit or loss over the lease period so as to produce
a constant periodic rate of; Interest on theremianing balance of liability for each period.Leases in which a significant portion of risk andrewards of ownership are not transferred to theGroup as a lessee are classified as operating lease.Payments made under operating leases are chargedto Profit and Loss on a straight line basis over theperiod of lease except where another systematicbasis is more representative of time pattern inwhich economic benefits from the leased assetsare consumed.As a lessor
Lease Income from operating leases where theGroup is a lessor is recognised as income on astraight line basis over the lease term unless thereceipts are structured to increase in line with theexpected general inflation to compensate for theexpected inflationary cost increases.
q Non-Current assets held for sale:
Non Current assets are classified as held for sale iftheir carrying amount will be recovered principallythrough a sale transaction rather than throughcontinuing use and sale is considered highly probable.They are measured at lower of their (a.) carrying amountand (b.) Fair Value less cost to sell. Non current assetsare not depreciated or amortised when they are classifiedas held for sale.
r Provisions and contingent liabilities
Provisions are recognised when the Group has a presentlegal or constructive obligation as a result of past events,it is probable that an outflow of resources will berequired to settle the obligation and the amount can bereliably estimated.Provisions are measured at the present value ofmanagement’s best estimate of the expenditure requiredto settle the present obligation at the end of thereporting period. The discount rate used to determinethe present value is a pre tax rate that reflects currentmarket assessments of the time value of money andthe risks specific to the liability. The increase in theprovision due to the passage of time is recognised asinterest expenses.Contingent liabilities are disclosed in respect of possibleobiligations that arise from past events but theirexistence will be confirmed by the occurrence or nonoccurrence of one or more uncertain future events notwholly within the control of Group or where anypresent obligation cannot be measured in terms offuture outflow of resources or where a reliable estimateof the obligation cannot be made.

Ruchi Soya Industries Limited
158
Notesto Consolidated Financial Statement for the Year Ended March 31, 2017
Parti
cular
s F
reeh
old
land
Leas
e Hol
d La
ndBu
ildin
gsPl
ant &
Win
dmill
s F
urni
ture
Vehi
cles
Offi
ceTo
tal
Cap
ital w
ork-
[Refe
r Not
e[R
efer N
ote
[Refe
r Not
eEq
uipm
ent
& F
ixtu
res
Equi
pmen
tsin
-pro
gres
s 3a
(v) b
elow]
3a (i
v) b
elow]
3a(i)
, (ii)
, (iii
),[R
efer N
ote
(iv) a
nd (v
)3a
(ii),
(iv)
and
belo
w](v
) belo
w]
A. Y
ear e
nded
Mar
ch 31
, 201
7
Gros
s car
ryin
g am
ount
Ope
ning
gro
ss ca
rryin
g am
ount
1,61
,834.7
2 1,
796.0
7 60
,239.7
8 1,
63,69
0.49
55,06
7.75
2,35
0.18
3,43
9.77
3,77
1.33
4,52
,190.0
9 4,
202.0
4Ad
d : A
dditio
ns [Re
fer N
ote 3a
(i)]
36.79
(84.3
3) 10
4.08
1,62
8.68
— 3.
83 29
.11 10
5.38
1,82
3.54
1,46
3.30
Less
: Asse
ts clas
sified
as hel
d for
sale [
Refer
Note
10 ]
277.5
6 —
— —
— —
— —
277.5
6 —
Less
: Disp
osals
— —
— 16
.91 —
9.79
359.9
1 82
.33 46
8.94
—Le
ss :Tr
ansfer
s —
— —
— —
— —
— —
2,74
9.08
Clos
ing
gros
s car
ryin
g am
ount
1,61
,593.9
5 1,
711.7
4 60
,343.8
6 1,
65,30
2.25
55,06
7.75
2,34
4.22
3,10
8.97
3,79
4.38
4,53
,267.1
2 2,
916.2
6Ac
cum
ulat
ed d
epre
ciatio
n an
d im
pairm
ent
Ope
ning
accu
mul
ated
dep
recia
tion
as at
Apr
il 1,
2016
— 38
6.53
2,45
2.96
12,01
0.13
15,38
4.44
1,49
3.20
2,05
5.48
3,15
4.36
36,93
7.10
—Ad
d : D
eprec
iation
charg
e duri
ng th
e year
— 9.
45 2,
446.4
9 10
,429.2
3 1,
854.0
6 17
4.43
287.0
9 26
4.20
15,46
4.95
—Ad
d :Im
pairm
ent lo
ss —
— 24
1.83
80.26
— —
— (2
.25)
319.8
4 —
Less
:Disp
osals/
Adju
stment
s —
125.6
2 (6
.65)
526.0
3 —
9.58
244.6
6 57
.92 95
7.16
—Le
ss :As
sets c
lassifi
ed as
held f
or sal
e [ Re
fer N
ote 10
] —
— —
— —
— —
— —
—Cl
osin
g ac
culat
ed d
epre
ciatio
n an
d im
pairm
ent
— 27
0.36
5,14
7.93
21,99
3.59
17,23
8.50
1,65
8.05
2,09
7.91
3,35
8.39
51,76
4.73
—N
et ca
rryin
g am
ount
1,61
,593.9
5 1,
441.3
8 55
,195.9
3 1,
43,30
8.66
37,82
9.25
686.1
7 1,
011.0
6 43
5.99
4,01
,502.3
9 2,
916.2
6
B. Y
ear e
nded
Mar
ch 31
, 201
6Gr
oss c
arry
ing
amou
ntD
eem
ed co
st as
at A
pril
1, 20
15 1,
61,82
5.60
1,78
7.58
58,44
4.98
1,56
,448.2
8 54
,358.0
1 2,
227.4
1 3,
488.4
8 3,
592.7
0 4,
42,16
5.02
9,43
0.25
Add :
Add
itions
[Refer
Note
3a (i)
] 59
.62 8.
49 1,
843.2
7 8,
047.1
7 70
9.74
122.8
1 17
2.69
244.4
8 11
,208.2
7 4,
166.6
0Le
ss : A
ssets c
lassifi
ed as
held f
or sal
e [ Re
fer N
ote 10
] —
— —
— —
— —
— —
—Le
ss : D
isposa
ls 50
.50 —
48.47
804.9
6 —
0.04
221.4
0 65
.85 1,
191.2
2 —
Less
:Trans
fers
— —
— —
— —
— —
— 9,
394.8
1Cl
osin
g gr
oss c
arry
ing
amou
nt 1,
61,83
4.72
1,79
6.07
60,23
9.78
1,63
,690.4
9 55
,067.7
5 2,
350.1
8 3,
439.7
7 3,
771.3
3 4,
52,19
0.19
4,20
2.04
Accu
mul
ated
depr
eciat
ion
Ope
ning
accu
mul
ated
dep
recia
tion
as at
Apr
il 1,
2015
— 30
8.32
39.26
1,05
3.79
13,53
0.38
1,30
6.39
1,78
1.16
2,81
7.69
20,82
8.97
—Ad
d : D
eprec
iation
charg
e duri
ng th
e year
— 78
.21 2,
417.1
4 11
,024.8
3 1,
854.0
6 18
6.85
371.6
3 39
2.36
16,32
5.08
—Le
ss : A
ssets c
lassifi
ed as
held f
or sal
e [Re
fer N
ote 10
] —
— —
— —
— —
— —
—Le
ss : D
isposa
ls/ A
djustm
ents
— —
3.44
68.49
— 0.
04 97
.31 55
.69 22
4.97
—Cl
osin
g acc
umul
ated
dep
recia
tion
— 38
6.53
2,45
2.96
12,01
0.13
15,38
4.44
1,49
3.20
2,05
5.48
3,15
4.36
36,93
7.10
—
Net
carry
ing
amou
nt 1,
61,83
4.72
1,40
9.54
57,78
6.82
1,51
,680.3
6 39
,683.3
1 85
6.98
1,38
4.29
616.9
7 4,
15,25
2.99
4,20
2.04
Not
e 3a:
(i)Ad
dition
durin
g the
year in
cludes
—(a)
Intere
st capi
talised
` Ni
l [FY
2015
-16 `
4.04
Lakh
] inclu
ding N
il [FY
2015
-16 `
2.72 L
akh] u
nder
capital
work
in pro
gress.
(b)Ad
justm
ent on
accou
nt of
excha
nge d
ifferen
ces lo
ss of
` 51
5.34 L
akh [F
Y 20
15-16
` 1,8
33.05
Lakh
] Refe
r Note
39.
(ii) Pr
opert
y, Plan
t and
Equip
ment
includ
es ass
ets ha
ving w
ritten
down
value
of ( `
580.5
9 La
kh ) [
FY 20
15-16
` 7,
594.4
3 La
kh] re
presen
ting p
lant &
equip
ments
and b
uildin
g whic
h are
not w
holly
used.
The C
ompan
y is in
the p
rocess
of fin
ding a
lterna
teuse
of su
ch ass
ets or
their
ultim
ate di
sposal
.(iii
)Buil
dings
includ
e ` 0.
02 La
kh [F
Y 201
5-16 `
0.02
Lakh
] bein
g cost
of Sh
ares in
Co-op
erativ
e Soci
eties.
Title
deeds
in re
spect
of sh
ares a
moun
ting t
o `.00
5 Lakh
are in
the p
rocess
of tra
nsfer.
NO
TE
-3P
RO
PE
RT
Y, P
LA
NT
AN
D E
QU
IPM
EN
T (`
in L
akh)

Annual Report 2016-17
159
Notesto Consolidated Financial Statement for the Year Ended March 31, 2017
(iv) Assets Given on lease [Included under Note 3 above]
Particulars Lease Hold Buildings Plant & TotalLand Equipment
A. Year ended March 31, 2017Gross carrying amountOpening gross carrying amount 12.73 151.01 11.57 175.30Additions — — — —Disposals — — — —Closing gross carrying amount 12.73 151.01 11.57 175.30Accumulated amortisation and impairmentOpening 2.11 8.02 0.24 10.37Amortisation charge for the year 0.26 8.02 0.30 8.57Disposals — — — —Closing accumulated amortisation and impairment 2.37 16.03 0.54 18.94Closing net carrying amount 10.36 134.97 11.03 156.37
B. Year ended March 31, 2016Gross carrying amountDeemed cost as at April 1, 2015 12.73 151.01 11.57 175.30Additions — — — —Less : Assets classified as held for sale [Refer Note 10] — — — —Disposals — — — —Closing gross carrying amount 12.73 151.01 11.57 175.30Accumulated depreciationOpening accumulated depreciation as at April 1, 2015 1.86 — — 1.86Depreciation charge during the year 0.26 8.02 0.24 8.51Less : Assets classified as held for sale [Refer Note 10] — — — —Disposals — — — —Closing accumulated depreciation 2.11 8.02 0.24 10.37Net carrying amount 10.62 142.99 11.33 164.93
(v) Valuation method & key assumptions used: [ Refer Note 12(L) ]
Independent Fair Valuation of certain Property, Plant and Equipment [ Freehold Land, Building & Plant & Equipment] hasbeen done as on April 1, 2015. The remaining assets have been valued based on Ind AS 16 - Property, Plant & Equipment. TheFair Valuation is based on physical inspection and verification conducted at the respective locations. The best evidence of fairvalue is current prices in an active market value for similar properties at such locations. Where such information is not available,we have considered information from a variety of sources including:• Current Price in an active market for properties of different nature or recent prices of similar properties in less active
markets, adjusted to reflect those differences• discounted cash flow projections based on reliable estimates of future cash flows• capitalised income projections based upon a property’s estimated net market income , and a capitalisation rate derived from
an analysis of market evidence.For determining the Fair Valuation the Main Inputs used are government prescribed guidelines, broker quotes, rental growthrates, expected vacancy rates, terminal yields and discount rates based on comparable transactions and industry data.Significant estimate: Fair Valuation, Estimated remaining useful Life and Estimated residual value of fixed assets have beentaken as determined by Expert valuer.
NOTE-3 PROPERTY, PLANT AND EQUIPMENT (Contd.) (` in Lakh)

Ruchi Soya Industries Limited
160
Notesto Consolidated Financial Statement for the Year Ended March 31, 2017
NOTE-4 INTANGIBLE ASSETS (` in Lakh)
Particulars Trade Marks/ Brands Computer Total[ Refer Note 4(i) below] Software
A. Year ended March 31, 2017Gross carrying amountOpening gross carrying amount 1,51,584.00 1,361.38 1,52,945.38Additions — 26.67 26.67Closing gross carrying amount 1,51,584.00 1,388.05 1,52,972.05Accumulated amortisation and impairmentOpening accumulated amortisation 36.00 1,138.36 1,174.36Amortisation charge for the year — 102.61 102.61Impairment charge — — —Closing accumulated amortisation and impairment 36.00 1,240.97 1,276.97Closing net carrying amount 1,51,548.00 147.08 1,51,695.08
B. Year ended March 31, 2016Gross carrying amountDeemed cost as at April 1, 2015 1,51,584.00 1,800.29 1,53,384.29Additions — 47.85 47.85Deletion — 486.76 486.76Closing gross carrying amount 1,51,584.00 1,361.38 1,52,945.38Accumulated amortisationOpening accumulated amortisation 36.00 1,020.22 1,056.22Amortisation charge for the year — 118.15 118.15Closing accumulated amortisation 36.00 1,138.37 1,174.37Closing net carrying amount 1,51,548.00 223.01 1,51,771.01
(i) Valuation method & key assumptions used:
Independent Fair Valuation of aquired brands has been done as on April 1, 2015. The valuation is based on report of ExpertValuer. Information from a variety of sources are considered including:• Current Price in an active market for assets of different nature or recent prices of similar properties in less active markets,
adjusted to reflect those differences.• discounted cash flow projections based on reliable estimates of future cash flows• capitalised income projections based upon a assets estimated net market income , and a capitalisation rate derived from an
analysis of market evidence.For determining the Fair Valuation the Main Inputs used are management certified data, Independent analysis and review andinformation available in the public domain.Significant estimate: Fair Valuation have been taken as determined by Expert valuer.

Annual Report 2016-17
161
Non -Current Financial InvestmentsA. Investments
a) Deemed Investments in Ruchi Industries Pte Limited 767.38 767.38 —b) In Associate companies and Joint Venture
i) 4,40,050 [FY 2015-2016 4,40,050 and April 1, 2015 4,40,050]Equity Shares of ` 10 each fully paid up in GHI EnergyPrivate Limited 1,359.48 683.59 684.36
ii) Nil [FY 2015-2016 1,76,000 and April 1, 2015 1,76,000]Equity Shares of ` 10 each fully paid up in Ruchi KagomeFoods India Private Limited [Refer Note E (ii) below] — 2,080.22 2,231.55
iii) 13,09,000 [FY 2015-2016 Nil and April 1, 2015 Nil]Equity Shares of ` 10 each fully paid inRuchi Hi-rich Seeds Private Limited 394.44 442.61 246.62
iv) 2,04,000 [FY 2015-2016 2,04,000 and April 1, 2015 2,04,000]Equity Shares of ` 10 each fully paid inRuchi J-Oil Private Limited 946.03 2,112.18 3,270.13
c) Investments in Other Entities Investment in Limited Liability Partnership (LLP)[Refer Note F(i) below] 1.77 20.08 10.09
Total 3,469.10 6,106.06 6,442.75B Investment in Equity Instruments - Other than in subsidiary,
associate and Joint Venture companies(Designated at FVOCI [Refer Note E(i) a below and 33 (A) I (ii)]a) Quoted
i) 8,83,500 [FY 2015-2016 8,83,500 and April 1, 2015 8,83,500]Equity Shares of ` 10 each fully paid up inNational Steel & Agro Industries Limited 226.62 110.44 125.46
ii) 4,00,000 [FY 2015-2016 4,00,000 and April 1, 2015 4,00,000]Equity Shares of ` 10 each fully paid up inAnik Industries Limited 109.80 126.40 90.60
iii) 2,73,24,239 [FY 2015-2016 2,73,24,239 and April 1, 20152,73,24,239] Equity Shares of ` 1 each fully paid up inRuchi Infrastructure Limited 972.74 1,776.08 2,136.74
iv) 17,71,700 [FY 2015-16 17,71,700 and April 1, 2015 17,71,700]Equity Shares of ` 10 each fully paid up inRuchi Strips & Alloys Limited 46.06 72.28 97.26
v) 1,19,300 [FY 2015-16 1,19,300 and April 1, 2015 1,19,300]Equity Shares of ` 10 each fully paid up inSarthak Global Limited 26.07 26.06 27.68
vi) 1,80,000 [FY 2015-2016 1,80,000 and April 1, 2015 1,80,000]Equity Shares of ` 2 each fully paid up inBlue Chip India Limited 0.59 1.12 0.40
vii) 35,000 [FY 2015-2016 35,000 and April 1, 2015 35000]Equity Shares of ` 10 each fully paid up inSharadraj Tradelink Limited 19.25 19.25 19.25
Notesto Consolidated Financial Statement for the Year Ended March 31, 2017
NOTE-5a FINANCIAL ASSETS (` in Lakh)
As at As at As atMarch 31, 2017 March 31, 2016 April 1, 2015

Ruchi Soya Industries Limited
162
b) Unquotedi) 25,000 [FY 2015-2016 25,000 and April 1, 2015 25000]
Equity shares of ` 10 each fully paid-up inRuchi Infotech Limited 2.50 2.50 2.50
ii) 6,00,000 [FY 2015-2016 6,00,000 and April 1, 2015 6,00,000]Equity shares of ` 10 each fully paid-up inRuchi Acroni Industries Limited 235.56 235.56 228.66
iii) 35,000 [FY 2015-2016 35,000 and April 1, 2015 35,000]Equity shares of ` 10 each fully paid-up inE-Ruchi Marketing (P) Limited 3.50 3.50 3.50
iv) 16,100 [FY 2015-16 16,100 and April 1, 2015 16,100]Equity Shares of ` 10 each fully paid up inNational Board of Trade Private Limited 0.01 0.01 0.01
v) 21,500 [FY 2015-2016 21,500 and April 1, 2015 21,500]Equity Shares of ` 10 each fully paid up inHerald Commerce Limited — — —
Total 1,642.70 2,373.20 2,732.06C Investment in Preference Shares measured at Amortised cost
Unquoted10,46,435 [FY 2015-2016 10,46,435 and April 1, 2015 10,46,435]6% Non Cumulative, Non Convertible Redeemable Preference Sharesof ` 100 each fully paid up in GHI Energy Private Limited 543.49 493.75 432.95
D Investment in Government or Trust Securities measured atAmortised costNational Saving Certificates/Kisan Vikas Patra(deposited with Government authorities) 1.08 2.12 2.55Total 544.57 495.87 435.50G R A N D T O T A L: 5,656.37 8,975.13 9,610.31
Aggregate amount of quoted investments - Cost 10,763.23 10,763.23 10,763.23Fair Market Value of quoted investments 1,401.13 2,131.63 2,497.39Aggregate amount of unquoted investments - Cost 7,320.61 7,975.35 7,854.18Aggregate amount of fair valuation-unquoted investments (11.38) (11.38) (11.38)Aggregate amount of Impairment (3,053.99) (1,120.46) (729.89)Category-wise Non-current investmentFinancial assets carried at AC 544.57 495.87 435.50Financial assets measured at cost 3,469.10 6,106.06 6,442.75Financial assets measured at FVOCI 1,642.70 2,373.20 2,732.06Financial assets measured at FVTPL — — —
E i) (a) Investments in Other than Subsidiaries, Associates and Joint ventures are measured at Fair Value of the Investmentand is charged/added to "Other Comprehensive Income". Fair Valuation of unlisted securities is determined based onthe valuation reports and in case of listed securities the same is determined based on the prevaling market prices.
(b) The Company has extended the guarantee to banks on behalf of Ruchi Agri Trading Private Limited a wholly ownedsubsidiary of Ruchi Industries Pte. Limited amounting to Nil [FY 2015-2016 USD 159.5 Million and April 1, 2015 isUSD 154 Million] for Guarantee commission charged amounting to ` Nil [ FY 2015-2016 Nil and April 1, 2015 Nil][Refer Note 34(A)(b)(iii)]
ii) During the year ended March 31, 2017, the Company has divested its entire holding of 1,76,000 shares in Ruchi KagomeFoods India Private Limited for consideration of ̀ 6,300.00 Lakh . The Surplus of ̀ 4,490.40 Lakh on divestment has beenshown in the statement of profit and loss as an Exceptional item.[ Refer Note 32]
Notesto Consolidated Financial Statement for the Year Ended March 31, 2017
NOTE-5a FINANCIAL ASSETS (Contd.) (` in Lakh)
As at As at As atMarch 31, 2017 March 31, 2016 April 1, 2015

Annual Report 2016-17
163
NOTE-5a FINANCIAL ASSETS (Contd.) (` in Lakh)
F (i) The Company is a partner in the Limited Liability Partnership (LLP). Details are as below:Name of the LLP Firm Indian Oil Ruchi
Biofuels LLPName of the Partners of the LLP Firm Ruchi Soya Indian Oil
Industries Limited Corporation LimitedTotal Capital ` 319.60Shares of each Partner 50% 50%
As at As at As atMarch 31, 2017 March 31, 2016 April 1, 2015
NOTE-5b LOANSUnsecured, considered good (Unless otherwise stated)Security and Other Deposits [Includes ` 2,111.00 Lakh(FY 2015-2016 ` 2,111.00 Lakh and April 1, 2015` 2,111.00 Lakh due to related parties)] 6,559.01 7,333.39 5,671.77
6,559.01 7,333.39 5,671.77
NOTE-5c OTHER FINANCIAL ASSETSInterest Accrued but not due
On Investments 0.32 1.29 0.41On Fixed Deposits With Bank 28.38 69.64 26.03
Amount due from erstwhile subsidiary [ Refer Note 34A(c)(v) ] 560.09 560.09 560.09Others 16.84 5.35 41.97Fixed deposit with banks more than 12 months maturity– Against Margin Money [ Under lien ] 277.64 184.22 157.12– Others 68.05 328.34 297.99
951.32 1,148.93 1,083.61
NOTE-6 OTHER NON-CURRENT ASSETS (` in Lakh)
As at As at As atMarch 31, 2017 March 31, 2016 April 1, 2015
Unsecured, considered good (unless otherwise stated)Capital Advances 278.67 469.95 611.69Other loans and Advances– Advance Income-Tax including tax deducted at source (Net) 6,744.82 5,908.40 3,385.44– Others 4,846.69 5,409.61 4,478.56
11,870.18 11,787.96 8,475.69
Notesto Consolidated Financial Statement for the Year Ended March 31, 2017

Ruchi Soya Industries Limited
164
Notesto Consolidated Financial Statement for the Year Ended March 31, 2017
NOTE-7 INVENTORIES (` in Lakh)
As at As at As atMarch 31, 2017 March 31, 2016 April 1, 2015
(As valued and certified by the Management)(At lower of cost and net realisable value except for stock-in-trade measured atFair Value and realisable by-products at net realisable value) [Refer Note (i) below]a) Raw Materials (including packing material)
Goods in transit 18,808.70 21,449.87 60,028.85Others 42,258.75 1,19,884.87 1,19,359.97
b) Work-in-progress 478.43 1,042.39 1,643.22c) Finished goods
Goods in transit 1,457.74 1,840.40 1,038.02Others 49,980.46 72,383.37 95,801.67
d) Stock in Trade ( in respect of goods acquired for trading)[Refer Note (i) below] 1,103.26 18,329.77 23,295.15
e) Realisable by-products 3,611.79 5,012.97 5,187.30f) Stores and Spares 3,948.67 4,766.12 4,355.50g) Consumables 2,264.15 3,392.71 3,848.93
1,23,911.95 2,48,102.47 3,14,558.61Note:(i) The following inventories are measured at Fair Value
Particulars Fair Value Fair Value Fair Value(`̀̀̀̀ In Lakh) (`̀̀̀̀ In Lakh) (`̀̀̀̀ In Lakh)
Stock-in-trade 1,103.26 18,329.77 23,295.15
Measurement of Fair Value : Classified as Level 2 [ Refer Note 45 B]Valuation Techniques : Stock-in-Trade measured at Fair Value are based on quotations of Commodity Exchange (NCDEX)quotations, as well as quotations from Solvent Extractor's Association of India (Non Government Organisation) recognised byMinistry of Agriculture, Government of India).
NOTE-8a CURRENT INVESTMENTS (` in Lakh)
As at As at As atMarch 31, 2017 March 31, 2016 April 1, 2015
QuotedA. INVESTMENTS IN MUTUAL FUNDS (Measured
at Fair Value Through Profit and Loss) [ FVTPL]i) 1,00,000 Units [FY 2015-2016 1,00,000 Units and April 1, 2015
1,00,000 Units] of SBI Magnum Multicap fund- Growth of `10 each. 40.51 32.59 32.14ii) 60,681.871 Units [FY 2015-2016 60,681.871 Units and April 1, 2015
60,681.871 Units] of SBI Magnum Equity Fund -Regular plan-Growth of ` 41.20 each. 52.19 44.16 45.76
iii) 50,000 Units [FY 2015-2016 50,000 Units and April 1, 201550,000 Units] of SBI Infrastructure Fund-Regular planGrowth of ` 10 each. 6.82 5.31 5.89
iv) 774.446 Units [FY 2015-2016 774.446 Units and April 1, 2015774.446 Units] of PNB Principal Emerging Blue Chip Fund -Regular plan Growth of ` 10 each. 0.70 0.50 0.53

Annual Report 2016-17
165
Notesto Consolidated Financial Statement for the Year Ended March 31, 2017
NOTE-8a CURRENT INVESTMENTS (Contd.) (` in Lakh)
As at As at As atMarch 31, 2017 March 31, 2016 April 1, 2015
B. INVESTMENT IN GOVERNMENT OR TRUSTSECURITIES MEASURED AT AMORTISED COST [AC]UnquotedNational Saving Certificates/Kisan Vikas Patra(deposited with Government authorities) 8.37 7.25 6.88TOTAL : 108.59 89.81 91.20
Aggregate amount of quoted investments - Cost 40.17 40.17 40.17Market Value of quoted investment 100.22 82.57 84.32Aggregate amount of unquoted investments 8.37 7.24 6.88Aggregate amount of fair valuation of investments 60.05 42.40 44.15
NOTE-8b TRADE RECEIVABLESTrade Receivables
Secured, considered good 8,038.79 7,374.51 3,902.28(Guaranteed by bank to the extent of ` 7,479.44 lakh [FY 2015-16
` 7,374.52 lakh and April 1, 2015 ` 3,902.28 lakh).Unsecured, considered good [Refer Note (ii) below] 7,48,743.31 7,70,007.14 6,85,635.20
Receivables from related parties [Refer Note 41] 382.28 238.57 238.57Less: Allowance for doubtful debts [Refer Note 46(ii)] 2,28,699.04 95,679.87 70,042.75Total Receivables 5,28,465.34 6,81,940.35 6,19,733.30
Note :(i) The above includes debts due from firms/private companies in which director is partner/director ` Nil [FY 2015-2016 ` Nil
and April 1, 2015 ` 6,628.62 Lakh ](ii) The above balances includes balance amounting to ` 606.61 Lakh [FY 2015-16 ` 32,405.48 Lakh and April 1, 2015 ` 55,905.65
Lakh ]of parties on whom bills have been drawn and have been discounted by Company with banks with recourse option. Thecorresponding liability to the banks is presented as secured borrowings. [Refer Note 17a (G)].
NOTE-8c CASH AND CASH EQUIVALENTSBalances with Banksi) In Current Accounts 9,755.39 23,249.60 5,210.52ii) In Deposit Accounts with less than or equal to 3 months maturity
– Against Buyers Credit [Refer Note 17(a) F] — — 1,140.00– Others 5.09 5.09 5.74Cheques, drafts on hand — — —Cash on hand 77.17 664.45 722.05
9,837.65 23,919.14 7,078.31

Ruchi Soya Industries Limited
166
Notesto Consolidated Financial Statement for the Year Ended March 31, 2017
(a) Confirmations from certain banks in respect of balances aggregating to ̀ 1,221.23 lakh have not been received by the Companyfrom the banks in response to the requests sent.
(b) Disclosure of Holdings as well as dealings in Specified Bank Notes during the period November 8, 2016 to December30, 2016
Particulars SBN’s Other Denomination Notes Total
Denomination `̀̀̀̀ in lakh Denomination `̀̀̀̀ in lakh `̀̀̀̀ in lakh
Closing Cash in hand as onNovember 8, 2016 500/1000 338.94 Other than 38.76 377.70
500 and 1000Add: Permitted receipts 500/1000 — 159.22 159.22Less: Permitted payments 500/1000 80.12 141.45 221.57Less: Amount deposited in banks 500/1000 258.82 14.74 273.56Closing Cash in hand as onDecember 30, 2016 — — 41.79 41.79
We have appropriately disclosed the details of Specified Bank Notes (SBN) held and transacted during the period from 8thNovember, 2016 to 30th December, 2016 pursuant to the requirements of Notification G.S.R 308 (E) dated 30th March, 2017of the Government of India. Further we confirm that we have complied with all relevant guidelines/ notifications issued byReserve Bank of India from time to time in respect of holding and dealing with Specified Bank Notes, and that the company hadproper controls, system and procedures in place for such compliances.
NOTE-8d BANK BALANCES OTHER THAN CASH AND CASH EQUIVALENTS ABOVE(` in Lakh)
As at As at As atMarch 31, 2017 March 31, 2016 April 1, 2015
Earmarked Unclaimed Dividend Accounts 31.98 38.50 41.55In Deposit AccountsOriginal Maturity less than or equal to 3 months– Against Margin Money [Under lien] 103.31 70.61 467.90More than 3 months but less than or equal to 12 months maturity.– Against Buyers Credit [Refer Note 17(a) F] — — 40,310.30– Against Margin Money [Under lien] 4,841.33 4,414.93 4,664.13– Others 1,225.18 2,874.57 978.37
6,201.80 7,398.61 46,462.25
NOTE-8e LOANSUnsecured, considered good (unless otherwise stated):Security and Other Deposits 899.97 969.65 738.69Loans to Related parties [Refer Note 38 and 41(ii)] 9.38 793.60 1,891.45Loans to Others 3.56 0.33 —Others:a) Loan to employees 236.69 794.96 1,892.14b) Intercorporate Deposits [Refer Note i and ii below]
To Related parties — — 158.28To Others [Refer Note 38(ii)] — 7,631.05 4,845.04
1,149.60 10,189.59 9,525.60

Annual Report 2016-17
167
Notesto Consolidated Financial Statement for the Year Ended March 31, 2017
(i) Intercorporate Deposits include ` Nil [FY 2015-2016 ` Nil and April 1, 2015 ` 158.28 lakh] kept with Related parties [ReferNote 41]
(ii) In respect of certain advances included under inter-corporate deposits, the Company has charged interest on advances given onnet daily products of balances due from/payable to these companies during the year. The Company has been advised that thisis in compliance with the provisions of section 186 of the Companies Act, 2013.
NOTE-8f OTHER FINANCIAL ASSETS (` in Lakh)
As at As at As atMarch 31, 2017 March 31, 2016 April 1, 2015
Unsecured considered goodInterest Accrued but not due
On Investments 5.89 5.41 7.18On Fixed Deposits with Banks 181.49 144.50 1,441.68On Other deposits 49.47 938.40 863.97
Derivative Assets– Forward exchange forward contract — 3,503.81 577.80– Foreign currency options — 593.18 66.97– Interest rate swaps — — —– Commodity Contracts 4,128.64 8,069.86 7,279.06Other Receivables 468.93 2,212.58 1,508.31
4,834.42 15,467.74 11,744.97
NOTE-9 OTHER CURRENT ASSETS (` in Lakh)
As at As at As atMarch 31, 2017 March 31, 2016 April 1, 2015
a) Advances recoverable in cash or in kind or for value to be receivedConsidered good 97,395.83 1,35,747.79 1,22,791.80Considered doubtful 4,695.01 2,314.11 1,930.81
1,02,090.84 1,38,061.90 1,24,722.61Less: Allowance for doubtful loans and advances 5,937.61 2,314.11 2,045.82
96,153.23 1,35,747.79 1,22,676.79b) Others 791.80 1,457.10 2,437.15c) Gratuity [ Excess of planned assets over obligations ] [Refer Note 19] 122.21 — —
97,067.24 1,37,204.89 1,25,113.94

Ruchi Soya Industries Limited
168
NOTE-10 ASSETS CLASSIFIED AS HELD FOR SALE (` in Lakh)
As at As at As atMarch 31, 2017 March 31, 2016 April 1, 2015
Property, Plant & Equipment [ Refer Note 3] 277.56 — —Other Advances 90.00 — —
367.56 — —
Note:
The Company has entered into an agreement on December 5, 2016 for sale of 18.1890 acres land situated at Taluka Alibag, DistrictRaigad for consideration of ` 345.77 Lakh. As per the terms of the agreement, the Company is required to bear the conversionexpenses upto ` 3.75 Lakh per acre and also carry out certain improvements over the said land which shall be reimbursed by thepurchaser . The Company has received part of the consideration by way of advance payment. The Company has also entered intocontract for the purpose of undertaking the improvements agreed upon and paid an advance to the contractor The land agreed to besold and the advances paid for improvement are classified as Assets Classified as held for sale [Refer Note 10] and the amount ofadvance of ̀ 173.00 lakh received from the buyer has been classified as Liabilities directly associated with assets classified as held forsale [Refer Note 21].
NOTE-11 EQUITY SHARE CAPITAL (` in Lakh)
As at As at As atMarch 31, 2017 March 31, 2016 April 1, 2015
(a) Authorisedi) Equity Shares
1,01,02,50,000 ( FY 2015-2016 1,01,02,50,000 and March 31, 2015:1,01,02,50,000) of face value of ` 2 each 20,205.00 20,205.00 20,205.00
20,205.00 20,205.00 20,205.00(b) Issued, Subscribed and paid-up
Equity Shares33,41,00,722 ( FY 2015-2016 33,41,00,722 and April 1,2015 33,40,60,422) of face value of ` 2 each fully paid-up[ Refer Note (a) of SOCIE ] 6,682.01 6,682.01 6,681.21Less : 76,30,115 Treasury Equity Shares [ FY 2015-201676,30,115 and April 1, 2015 76,30,115 ] [ Refer Note 11(i)] 152.60 152.60 152.60
6,529.41 6,529.41 6,528.61(c) Rights, Preferences and Restrictions attached to shares
Equity Shares: The Company has one class of equity shares having a par value of ̀ 2 per share. Each shareholder is eligiblefor one vote per share held. The dividend proposed by the Board of Directors is subject to the approval of the shareholdersin the ensuing Annual General Meeting. In the event of liquidation, the equity shareholders are eligible to receive theremaining assets of the Company after distribution of all preferential amounts, in proportion to their shareholding.
(d) Lock in Restrictions
None of the shares are subject to lock in restrictions.
Notesto Consolidated Financial Statement for the Year Ended March 31, 2017

Annual Report 2016-17
169
Notesto Consolidated Financial Statement for the Year Ended March 31, 2017
(e) Details of shares held by shareholders holding more than 5% shares in the Company.
Particulars March 31, 2017 % March 31, 2016 % April 1, 2015 %
EQUITY SHARES
Disha Foundation Trust 5,09,40,350 15.25 4,74,40,350 14.20 4,74,40,350 14.20Dinesh Shahra (HUF) — — 1,72,05,836 5.15 1,72,05,836 5.15Soyumm Marketing Private Limited 4,56,35,159 13.66 3,23,04,323 9.67 2,91,45,577 8.72Spectra Realities Private Limited 1,84,00,000 2.51 1,81,00,000 5.42 1,81,00,000 5.42Sawit Plantations Pte Limited 1,96,12,913 5.87 1,96,12,913 5.87 1,96,12,913 5.87
(f) For the period of five years immediately preceding the date as at which the Balance Sheet is prepared:(a) Aggregate number and class of shares alloted as fully paid- up pursuant to contract (s)
without payment being received in cash: Nil(b) Aggregate number and class of shares alloted as fully paid- up by way of bonus shares: Nil( c) Aggregate number and class of shares bought back: Nil
(g) For shares reserved for issue under options - Refer Note 12 B(h) For reconciliation of number of shares outstanding at the beginning and at the end of the year - Refer Note (a) of
Statement of Changes in Equity (SOCIE).(i) Pursuant to Schemes u/s. 391-394, of then applicable The Companies Act, 1956 approved by the Hon’ble High Court of
judicature at Mumbai and Delhi in an earlier year, 76.30 lakh Equity shares of the Company are held by a Trust for thebenefit of the Company and its successor. The Cost of acquition of these treasury shares have been netted of from theEquity Shares Capital and Securities premium reserve as per the provisions of Ind AS. The Dividend of earlier periodreceived by the Trust in respect of these shares is included under the head ‘Dividend’ under ‘Other Income’ inNote 23(B).
(j) Shares alloted under Employee Stock Option Plan Scheme, 2007 as modified from time to time. Refer Note 12 B.
NOTE-12 OTHER EQUITY (` in Lakh)
As at As at As atMarch 31, 2017 March 31, 2016 April 1, 2015
A Capital Redemption Reserve 8,770.98 8,770.98 8,770.98B Share Options Outstanding Account [ Refer Note 12 M(ii)] 110.25 98.76 106.00C Securities Premium Reserve 45,186.45 45,186.45 45,152.96D General Reserve 41,800.94 41,800.94 41,800.94E Business Development Reserve 60.68 19,325.44 24,051.03F Capital Reserve 3,328.75 3,328.75 3,328.75G Hedging Reserve — (200.30) (544.56)H Foreign Currency Monetary Item Translation Difference Account (125.82) (605.38) (776.45)I Foreign Currency Translation reserves 811.92 1,201.60 564.47J Equity Instruments through Other Comprehensive Income
[ Refer Note 33A I(ii)] (9,169.96) (8,439.77) (8,080.18)K Retained Earnings [ Refer Note 12 L] (4,289.14) 1,26,231.64 2,54,401.12
TOTAL 86,485.05 2,36,699.11 3,68,775.06

Ruchi Soya Industries Limited
170
A Capital Redemption ReserveBalance as at the beginning of the year 8,770.98 8,770.98 8,770.98Less: Utilised during the year — — —Balance as at the end of the year 8,770.98 8,770.98 8,770.98
B Share Options Outstanding Account [Refer Note 12 M(ii)] Employee stock Option Outstanding 120.90 122.39 125.87 Less: Deferred Employees Compensation Expenses 10.65 23.63 19.87Options outstanding as at the end of the year 110.25 98.76 106.00
C Securities Premium ReserveBalance as at the beginning of the year 45,186.45 45,152.96 45,937.33Add: On exercise of employee stock options - Proceeds received — 33.59 —Less: Treasury Equity Shares 76,30,115 [ Refer Note 11(i) ] — — 784.37Less: Transaction Cost arising on share issued during the year(Net of tax `.05 Lakh) — 0.10 —Balance as at the end of the year 45,186.45 45,186.45 45,152.96
D General ReserveBalance as at the beginning of the year 41,800.94 41,800.94 41,800.94Add: Transfer from Statement of Profit and Loss — — —Balance as at the end of the year 41,800.94 41,800.94 41,800.94
E Business Development ReserveBalance as at the beginning of the year 19,325.44 24,051.03 38,166.47Less:Additional Depreciation on account of revaluation of fixed assets — — 3,190.96Provision/( Reversal of provision) for doubtful debts and doubtfuladvances (net of deferred tax) [Refer Note 30 b] 16,074.41 514.84 (162.26) Additional Depreciation on account of Transition provisions ofSchedule II — — 7,068.88Bad debts and advances written off (net of current tax)[Refer Note 30 b] — 116.08 18.85Advertisement & sales promotion expenses (net of current tax)[Refer Note 31 (III)] 3,190.35 4,094.67 3,981.27Additional Charge on sale of Assets — — 17.74Balance as at the end of the year 60.68 19,325.44 24,051.03
F Capital ReserveBalance as at the beginning of the year 3,328.75 3,328.75 3,328.75Less: Utilised during the year — — —Balance as at the end of the year 3,328.75 3,328.75 3,328.75
G Hedging Reserve — (200.30) (544.56)H Foreign Currency Monetary Item Translation Difference Account (125.82) (605.38) (776.45)I Foreign Currency Translation reserves 811.92 1,201.60 564.47J Equity Instruments through Other Comprehensive Income
[Refer Note 33A I(ii)]Balance as at the beginning of the year (8,439.77) (8,080.18) —Addition/(deletion) during the year (730.19) (359.59) (8,080.18)Balance as at the end of the year (9,169.96) (8,439.77) (8,080.18)
NOTE-12 OTHER EQUITY (Contd.) (` in Lakh)
As at As at As atMarch 31, 2017 March 31, 2016 April 1, 2015
Notesto Consolidated Financial Statement for the Year Ended March 31, 2017
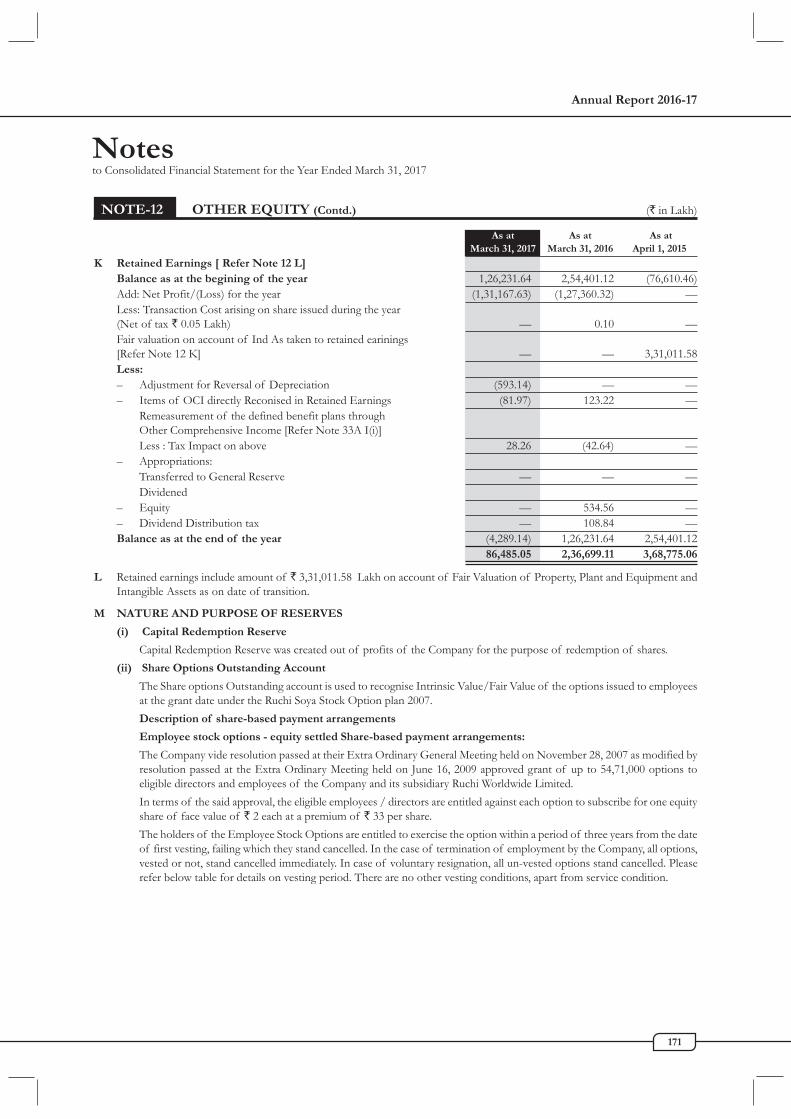
Annual Report 2016-17
171
K Retained Earnings [ Refer Note 12 L]Balance as at the begining of the year 1,26,231.64 2,54,401.12 (76,610.46)Add: Net Profit/(Loss) for the year (1,31,167.63) (1,27,360.32) —Less: Transaction Cost arising on share issued during the year(Net of tax ` 0.05 Lakh) — 0.10 —Fair valuation on account of Ind As taken to retained earinings[Refer Note 12 K] — — 3,31,011.58Less:– Adjustment for Reversal of Depreciation (593.14) — —– Items of OCI directly Reconised in Retained Earnings (81.97) 123.22 —
Remeasurement of the defined benefit plans throughOther Comprehensive Income [Refer Note 33A I(i)]Less : Tax Impact on above 28.26 (42.64) —
– Appropriations:Transferred to General Reserve — — —Dividened
– Equity — 534.56 —– Dividend Distribution tax — 108.84 —Balance as at the end of the year (4,289.14) 1,26,231.64 2,54,401.12
86,485.05 2,36,699.11 3,68,775.06
L Retained earnings include amount of ` 3,31,011.58 Lakh on account of Fair Valuation of Property, Plant and Equipment andIntangible Assets as on date of transition.
M NATURE AND PURPOSE OF RESERVES
(i) Capital Redemption Reserve
Capital Redemption Reserve was created out of profits of the Company for the purpose of redemption of shares.(ii) Share Options Outstanding Account
The Share options Outstanding account is used to recognise Intrinsic Value/Fair Value of the options issued to employeesat the grant date under the Ruchi Soya Stock Option plan 2007.Description of share-based payment arrangements
Employee stock options - equity settled Share-based payment arrangements:
The Company vide resolution passed at their Extra Ordinary General Meeting held on November 28, 2007 as modified byresolution passed at the Extra Ordinary Meeting held on June 16, 2009 approved grant of up to 54,71,000 options toeligible directors and employees of the Company and its subsidiary Ruchi Worldwide Limited.In terms of the said approval, the eligible employees / directors are entitled against each option to subscribe for one equityshare of face value of ` 2 each at a premium of ` 33 per share.The holders of the Employee Stock Options are entitled to exercise the option within a period of three years from the dateof first vesting, failing which they stand cancelled. In the case of termination of employment by the Company, all options,vested or not, stand cancelled immediately. In case of voluntary resignation, all un-vested options stand cancelled. Pleaserefer below table for details on vesting period. There are no other vesting conditions, apart from service condition.
Notesto Consolidated Financial Statement for the Year Ended March 31, 2017
NOTE-12 OTHER EQUITY (Contd.) (` in Lakh)
As at As at As atMarch 31, 2017 March 31, 2016 April 1, 2015

Ruchi Soya Industries Limited
172
As per the terms of the plan, the Company has granted stock options in following tranches to its eligible employees:Date of Grant Number of Exercise Price Particulars of vesting
Options ( in `̀̀̀̀)20% 30% 50%
April 1, 2008 12,37,000 35.00 April 1, 2009 April 1, 2010 April 1, 2011October 1, 2009 14,95,000 35.00 October 1, 2010 October 1, 2011 October 1, 2012April 1, 2010 2,53,500 35.00 April 1, 2011 April 1, 2012 April 1, 2013April 1, 2011 1,98,000 35.00 April 1, 2012 April 1, 2013 April 1, 2014April 1, 2012 15,000 35.00 April 1, 2013 April 1, 2014 April 1, 2015April 1, 2013 2,19,000 35.00 April 1, 2014 April 1, 2015 April 1, 2016*April 1, 2014 2,75,000 35.00 April 1, 2015 April 1, 2016 April 1, 2017April 1, 2015 4,37,500 35.00 April 1, 2016 April 1, 2017 April 1, 2018Total 41,30,000
The movement in the Employee Stock Options during the year ended March 31, 2017 is as follows:Date of Grant Opening Issued Cancelled Exercised Closing
Balance as on during during Balance as onApril 1, 2016 the year the year March 31, 2017
April 1, 2012 4,000 — 4,000 — —April 1, 2013 1,49,250 — 15,750 — 1,33,500April 1, 2014 2,57,700 — 51,200 — 2,06,500April 1, 2015 4,37,500 — 43,000 — 3,94,500Total 8,48,450 — 1,13,950 — 7,34,500Previous Year 5,31,000 4,37,500 79,750 40,300 8,48,450
Note : * Indicates as at March 31, 2017 the said option is yet to expire considering the grace period of one year.
Particulars For the year ended March 31, 2017Shares arising Exercise Prices Weightedout of options ( in `̀̀̀̀ ) average
exercise priceOptions outstanding at the beginningof the year 8,48,450 35.00 35.00Add: Options granted during the year — 35.00 35.00Less: Options lapsed during the year 1,13,950 35.00 35.00Less: Options exercised during the year — 35.00 35.00Options outstanding at the year end* 7,34,500 35.00 35.00Exercisable at the end of the period 7,34,500 35.00 35.00
Note: * Weighted average remaining contractual life is 1.36 yearsValuation of stock options
The fair value of stock options granted during the period has been measured using the Black–Scholes option pricing modelat the date of the grant. The Black-Scholes option pricing model considers assumptions regarding dividend yields, expectedvolatility, expected terms and risk free interest rates. The key inputs and assumptions used are as follows:Share price: The closing price on NSE as on the date of grant has been considered for valuing the options granted.Exercise Price: Exercise Price is the price as determined by the Remuneration and Compensation Committee.Expected Volatility: The historical volatility of the stock till the date of grant has been considered to calculate the fairvalue of the options.Expected Option Life: Expected Life of option is the period for which the Company expects the options to be live.
Notesto Consolidated Financial Statement for the Year Ended March 31, 2017
NOTE-12 OTHER EQUITY (Contd.) (` in Lakh)

Annual Report 2016-17
173
Expected dividends: Expected dividend assumed to be 8 % paid each yearRisk free interest rate: The risk free interest rate on the date of grant considered for the calculation is the interest rateapplicable for a maturity equal to the expected life of the options based on the yield curve for Government bonds.These assumptions reflect management’s best estimates, but these assumptions involve inherent market uncertainties basedon market conditions generally outside of the Company’s control. As a result, if other assumptions had been used in thecurrent period, stock-based compensation expense could have been materially impacted. Further, if management usesdifferent assumptions in future periods, stock based compensation expense could be materially impacted in future years.The estimated fair value of stock options is charged to income on a straight-line basis over the requisite service period foreach separately vesting portion of the award as if the award was, in-substance, multiple awards.The weighted average inputsused in computing the fair value of options granted were as follows:Grants made during the year
Grant date April 1, 2015
Fair Value ( in `) 21.79Share price as on date( in `) 45.85Exercise price ( in `) 35.00Expected volatility (weighted-average) 0.4215Expected life (weighted-average) [ 3 years + 1 year Grace period] 4 yearsExpected dividends 8%Risk-free interest rate (based on government bonds) 8%
(iii) Securities Premium Reserve
Securities Premium Reserve is created on recording of premium on issue of shares. The reserve is utilised in accordancewith the provisions of the Companies Act, 2013.
(iv) General Reserve
The same is created out of surplus profits transferred as per the provisions of the Act. It is utilised as per provisions of theAct.
(v) Business Development Reserve
(a) In an earlier year, the Hon’ble High Court of judicature of Mumbai, had approved u/s. 391-394 the Scheme ofAmalgamation and Arrangement of ‘Mac Oil Palm Limited’ with Ruchi Soya Industries Limited and its shareholders,which was effective from April 1, 2009.
(b) Pursuant to the Scheme referred to in (a) above, the Company had, in an earlier year, created Business DevelopmentReserve from the balance standing to the credit of General Reserve & Securities Premium Account.In terms of the Scheme, as and when deemed fit by the Board, the said Business Development Reserve is available foradjusting various expenses, including advertisement, sales promotion, development of brands, research and developmentactivities, provision / write off of doubtful debtors/current assets/loans and advances, additional depreciationnecessitated by revaluation of fixed assets and expenses of amalgamation including expenses of the Transferor Companyi.e. Mac Oil Palm Limited, incurred on or after 1st April 2009, after adjusting for any tax effects, both current anddeferred tax thereon.
(c) For amounts debited during the year to Business Development Reserve in accordance with the said Scheme. ReferNote 12(E).
(d) Had the Scheme, approved by the Hon’ble High Court, not prescribed the accounting treatment as described in (b)above,i) the Company would have been required to:
Credit an amount of ̀ 36,157.70 lakh to Revaluation Reserve instead of the Business Development Reserve andDebit the additional charges as mentioned above in Note 12E.
ii) As a cumulative impact of the treatment described in para (i) above, the accumulated balance in the GeneralReserve and Securities Premium account as at March 31, 2017 would have been higher by ` 5,193.54 lakh and
Notesto Consolidated Financial Statement for the Year Ended March 31, 2017
NOTE-12 OTHER EQUITY (Contd.) (` in Lakh)

Ruchi Soya Industries Limited
174
Notesto Consolidated Financial Statement for the Year Ended March 31, 2017
` 23,842.30 lakh respectively, loss for the year would have been higher by ̀ 19,264.77 lakh, the balance in retainedearnings as at March 31, 2017 would have been lower by ` 43,640.39 lakh the balance in Revaluation Reservewould have been higher by ̀ 14,665.23 lakh and the balance in Business Development Reserve would have been` Nil.However, the aggregate balance in Reserves and Surplus as at March 31, 2017 would have remained the same.
(vi) Capital Reserve
Capital Reserve amounting to ` 3,228.75 lakh was created on :a) amalgamation with Palm tech India Ltd by ` 1,087.07 lakh andb) On cancellation of share warrants issued in an earlier year to the promoter/promoter group on preferential basis by
` 2,241.69 lakh.(vii) Hedging Reserve
Hedge Reserve is created out of Interest Rate Swaps taken by the Company. For Hedge Reserve details refer Note 44Hedge Accounting.
(viii) Foreign Currency Monetary Item Transalation Difference Account
The Company has availed the exemption available under Para D13AA of Ind AS - 101 of “First time adoption of IndianAccounting Standards”. Accordingly, exchange gains and losses on foregin currency borrowings taken prior to April 1,2016 which are related to the acquisition or construction of qualifying assets are adjusted in the carrying cost of suchasset.
(ix) Equity Instruments through Other Comprehensive Income
The company has elected to recognise changes in fair value of certain class of investements in other comprehensiveincome. These faie value changes are accumulated within this reserve and shall be adjusted on derecogmition ofinvestment.
(x) Retained Earnings
The same is created out of profits over the years and shall be utilised as per the provisions of the Act [Refer Note 12 L].
.
NOTE-13 a BORROWINGS (` in Lakh)
As at As at As atMarch 31, 2017 March 31, 2016 April 1, 2015
A Term Loans from Banks [ Refer Note E(i), E(ii) and F below ] Secured – Rupee Loans — — — – Foreign Currency Loans 1,910.39 2,079.23 2,062.22
B Long Term Maturity of Finance Lease Obligation — 25.49 40.90 C Deferred payment liabilities
Unsecured– Deferred Sales Tax Liability [Refer Note G below] 5,861.75 6,012.84 6,745.01
D Cumulative Redeemable Preference Shares [Refer Note H below]Unsecured2,00,000 [FY 2015-2016 2,00,000 and April 1, 2015 2,00,000 ]of face value of ` 100 each fully paid-up 200.00 200.00 200.00
7,972.14 8,317.56 9,048.13
NOTE-12 OTHER EQUITY (Contd.) (` in Lakh)

Annual Report 2016-17
175
Notesto Consolidated Financial Statement for the Year Ended March 31, 2017
NOTE-13 a BORROWINGS (Contd.) (` in Lakh)
E(i)
Part
icul
ars
Inte
rest
Secu
rity
Year
of
Term
s of
Mar
ch 3
1, 20
17M
arch
31,
Mar
ch 3
1,R
ate
Mat
urity
inR
epay
men
t[R
efer
Not
e20
1620
15Fi
nanc
ial
17a
(H)
Year
Rupe
e Lo
ans
Term
Loan
from
BBR+
2017
-2018
168.2
6 84
1.83
1,51
6.12
Axis
Bank
Limi
ted2.5
% p.
a.
Term
Loan
from
Not A
pplic
able
2015
-2016
——
1,22
2.22
IDBI
Ban
k
Term
loan
from
MCL
R +
2018
-2019
2,605
.76 3,
827.5
2 4,
848.6
6Sta
te Ba
nk of
India
6.60%
p.a.
Corp
orate
Loan
III f
rom
Not a
pplic
able
2015
-2016
— 1,
263.6
8 5,
072.3
9Sta
te Ba
nk of
India
Corp
orate
Loan
IV fr
omM
CLR
+20
17-20
18 9,
171.5
2 13
,528.8
4 18
,210.6
4Sta
te Ba
nk of
India
6.60%
p.a.
Secu
red by
a fir
st pa
ri pass
u cha
rge o
ver t
he m
ovea
ble fix
edas
sets,
facto
ry la
nd a
nd ra
ilway
sidin
g, b
oth
pres
ent &
futur
e, loc
ated a
t Dur
gawa
ti in B
ihar a
nd pe
rsona
l gua
rantee
of M
anag
ing D
irecto
r of t
he C
ompa
ny.
Secu
red by
a fir
st pa
ri pa
ssu ch
arge o
ver a
ll the
fixed
asse
ts,bo
th p
resen
t and
futu
re, lo
cated
at H
aldia
(Wes
t Ben
gal),
Patal
gang
a and
Nag
pur
(Mah
arash
tra) t
ogeth
er wi
th fi
rstex
clusiv
e cha
rge o
n the
entir
e fixe
d asse
ts, bo
th pr
esen
t and
futu
re, lo
cated
at W
ashim
(M
ahara
shtra
) and
per
sona
lgu
arant
ee of
Man
aging
Dire
ctor o
f the
Com
pany
.a)
Secu
red
by fi
rst e
xclus
ive c
harg
e on
m
ovab
le an
dim
mova
ble fi
xed
assets
of
the C
ompa
ny’s
unit
locate
d at
Villa
ge B
huva
d,Te
hsil
Anjar
, Dist
rict K
utch
, Guj
arat.
b) C
ollate
ral S
econ
d ch
arge o
ver t
he en
tire c
urren
t asse
tsin
cludi
ng s
tock
s of
raw
mate
rial a
nd fi
nish
ed g
oods
,rec
eivab
les an
d oth
er cu
rrent
asset
s on p
ari pa
ssu ba
sis, w
ithot
her t
erm le
nders
and
pers
onal
guara
ntee
of
Man
aging
Direc
tor o
f the
Com
pany
.Se
cured
by
a fir
st ex
clusiv
e ch
arge
over
the
fixed
asse
ts,bo
th pr
esent
and f
uture,
at K
ota (
Rajas
than
), Che
nnai
(Tam
ilNa
du) a
nd Sh
rigan
gana
gar (
Rajas
than
) and
first
pari
passu
charg
e ove
r the
fixed
asset
s, bot
h pres
ent a
nd fu
ture,
locate
dat
Hald
ia (W
est
Beng
al),
Pata
lgan
ga &
Nag
pur
(Mah
aras
htra
), M
anga
lore
(K
arna
taka
) and
Man
glia
(Mad
hya P
radesh
) . Co
llater
al: Se
cond
charg
e ove
r the
entir
ecu
rrent
asse
ts inc
luding
stoc
ks o
f raw
mate
rial,
finish
edgo
ods a
nd o
ther
curre
nt a
ssets
on p
ari p
assu
basis
with
othe
r lend
ers an
d pers
onal
guara
ntee
of M
anag
ing D
irecto
rof
the C
ompa
ny.
a) Se
cured
by
an E
xtens
ion o
f ex
clusiv
e fir
st ch
arge
onm
ovab
le an
d im
mov
able
fixed
ass
ets
loc
ated
at
Shrig
anga
naga
r (Ra
jasth
an), K
ota (
Rajas
than
) and
Che
nnai
(Tam
il Nad
u) a
nd ex
tensio
n of
first
pari
passu
charg
e on
mova
ble an
d imm
ovab
le fix
ed as
sets l
ocate
d at H
aldia
(West
Beng
al), M
anga
lore
(Kar
natak
a) Pa
talga
nga
& N
agpu
r(M
ahara
shtra
), an
d M
angli
ya (M
adhy
a Pr
ades
h) a
nd b
)Co
llater
al Se
cond
cha
rge
over
the
entir
e cu
rrent
asse
tsin
cludi
ng s
tock
s of
raw
mate
rial a
nd fi
nish
ed g
oods
receiv
ables
and o
ther
curre
nt as
sets o
n pari
passu
basis
, with
othe
r term
lend
ers a
nd p
erson
al gu
arant
ee o
f M
anag
ingDi
recto
r of t
he C
ompa
ny.
Repa
yable
in 1
8 Eq
ual q
uarte
rlyins
tallm
ents
starti
ng at
the e
nd of
9 m
onth
s fr
om d
ate
of f
irst
disbu
rseme
nt (c
omme
nced
from
Febr
uary,
2013
) of t
he sa
nctio
ned
amou
nt o
f ` 3,
000 l
akh.
Repa
yable
in 1
8 eq
ual q
uarte
rlyin
stallm
ents
(com
men
ced
from
Sept
embe
r, 20
11)
of
the
sanc
tione
d am
ount
of `
10,0
00lak
h.
Repa
yable
in 2
0 eq
ual q
uarte
rlyin
stallm
ents
(com
men
ced
from
Mar
ch 2
014)
of
the
sanc
tione
dam
ount
of `
6,50
0 lak
h.
Repa
yable
in 2
0 eq
ual q
uarte
rlyin
stallm
ents
(com
men
ced
from
June
201
1) o
f th
e sa
nctio
ned
amou
nt o
f ` 25
,000 l
akh.
Repa
yable
in 2
0 eq
ual q
uarte
rlyin
stallm
ents
(com
men
ced
from
June
201
3) o
f th
e sa
nctio
ned
amou
nt o
f ` 30
,000 l
akh.

Ruchi Soya Industries Limited
176
Notesto Consolidated Financial Statement for the Year Ended March 31, 2017
NOTE-13 a BORROWINGS (Contd.) (` in Lakh)
E(i)
Parti
cula
rsIn
tere
stSe
curit
yYe
ar o
fTe
rms
ofM
arch
31,
2017
Mar
ch 3
1,M
arch
31,
Rat
eM
atur
ity in
Rep
aym
ent
[Ref
er N
ote
2016
2015
Fina
ncia
l17
a (H
)Ye
ar
Corp
orate
Loan
V fr
omM
CLR
+20
18-19
17,36
4.33
22,02
1.68
27,71
1.14
State
Bank
of In
dia6.6
0% p.
a.
Term
loan
from
MCL
R +
2025
-26 4,
800.0
0 5,
605.6
2 —
State
Bank
of In
dia6.6
0% p.
a.
Term
loan
from
8.5%
p.a
N.A.
1,910
.39 1,
910.3
9 1,
910.3
9De
velop
emnt
Ban
k of
Ethio
pia am
ount
ing to
` 1,91
0.39 L
akh
(Birr
674.7
9 Lak
h)(M
arch 3
1, 20
16 `
2,079
.22)
(Birr
674.7
9 Lak
h)Fo
reig
n Cu
rren
cy L
oans
ECB
I in fo
reign
curre
ncy
Not a
pplic
able
2015
-16—
— 3,
134.0
0fro
m DB
S Ban
k Ltd.
ECB
II in
forei
gn cu
rrenc
yLI
BOR
2016
-176,5
53.57
8,09
2.61
9,27
6.64
from
DBS B
ank L
td.6 m
onth
s +29
0 bps
p.a.
a) Se
cured
by fir
st ex
clusiv
e cha
rge/
exten
sion
of ex
clusiv
ech
arge
on m
ovab
le an
d im
mova
ble fi
xed
asse
ts of
the
Comp
any’s
unit l
ocate
d at S
hriga
ngan
gar A
69-7
0 & C
366-
367,
RIIC
O U
dyog
Viha
r, Ko
ta RI
ICO
Indu
strial
Area
Bund
i, Ch
enna
i Kan
niga
ipue
r Villa
ge,T
alalva
li Ch
anda
Man
gliya
villa
ge In
dore,
Man
gliya
b) S
ecur
ed by
Exte
nsion
of fi
rst pa
ri pa
ssu ch
arge o
n mov
able
and i
mmov
able
fixed
assets
of th
e Com
pany
’s unit
loca
ted at
Hald
ia , M
anga
lore
Bika
mpad
y Ind
utria
l Area
, Pata
lgang
a & N
agpu
r. Coll
ateral
Secu
rity
: Sec
ond
charg
e ov
er th
e en
tire
curre
nt a
ssets
inclu
ding
sto
cks
of ra
w m
ateria
l and
fini
shed
goo
ds,
receiv
ables
and o
ther
curre
nt as
sets o
n pari
passu
basis
, with
othe
r ter
m len
ders
and
perso
nal g
uaran
tee o
f M
anag
ingDi
recto
r of t
he C
ompa
ny.
Secu
red by
a hy
poth
ecati
on of
(a) W
ind po
wer r
eceiv
ables
of th
e Com
pany
again
st su
pply
of p
ower
from
the 2
2.50
MW
wind
powe
r pro
ject a
t Pals
odi, R
atlam
, Mad
hya P
radesh
to M
P Pow
er tra
ding C
o. Li
mited
and 2
.50 M
W W
ind po
wer
proje
ct at
Shinb
and,
Dhule
, Mah
arash
tra to
Mah
arash
trasta
te ele
ctrici
ty dis
tribu
tion C
ompa
ny L
imite
d and
(b) T
hemo
vable
fixed
asset
s of t
he co
mpan
y rela
ting a
nd pe
rtaini
ngto
the 2
2.50
MW
wind
pow
er pr
oject
at Pa
lsodi,
Ratl
am,
Mad
hya
Prad
esh
and
2.50
MW
win
dpow
er p
rojec
t at
Shind
bad,
Dhule
, Mah
arastr
a an
d pe
rsona
l gua
rantee
of
Man
aging
Dire
ctor o
f the
Com
pany
.Fi
rst d
egree
mor
tgage
upo
n th
e wh
ole e
ntire
asse
ts an
dpr
opert
y of t
he pr
oject
(inclu
ding a
ll veh
icles)
with
princ
ipal
Regis
tratio
n Ce
rtific
ate n
umbe
r EIA
-PC-
01/3
349/
09 a
tEt
hiopia
.
Secu
red by
a fir
st ch
arge o
ver t
he fix
ed as
sets,
both
pres
ent
and
futu
re, o
f m
anuf
actu
ring
units
at G
una
(Mad
hya
Prad
esh)
, Dalo
da (M
adhy
a Prad
esh)
, Bara
n (Ra
jasth
an) a
ndGa
darw
ara (M
adhy
a Prad
esh)
.
Secu
red by
a fir
st ch
arge o
ver t
he fix
ed as
sets,
both
pres
ent
and
futu
re, o
f ma
nufac
turin
g Re
finer
y un
it(s)
at Ka
ndla
(Guja
rat).
Repa
yabl
e in
20
qu
arte
rlyin
stallm
ents
(com
men
ced
from
June
2014
) of s
ancti
oned
amou
ntof
` 30
,000 l
akhs
out o
f tha
t firs
tfo
ur in
stallm
ent s
hall b
e of ̀
1,00
0lak
h eac
h, ne
xt tw
elve i
nstal
lmen
tssh
all be
of `
1,500
lakh
each
, and
last f
our i
nstal
lmen
t sha
ll be
of
` 2,00
0 lak
h eac
h.
Repa
yable
in 4
0 eq
ual q
uarte
rlyin
stallm
ents
(com
men
ced
from
June
2015
) of s
ancti
oned
amou
ntof
` 6,
000 l
akh
Repa
yabl
e in
Ins
tallm
ents
as
mutu
ally
agrre
d of
san
ctio
ned
amou
nt in
Birr
4,10
0.70 L
akh.
Repa
yabl
e in
5 s
emi
annu
alin
stallm
ents
(com
men
ced
from
April
, 201
3) of
15%
, 20%
, 20%
,20
% &
25%
of sa
nctio
ned a
moun
tof
USD
200.0
0 lak
hRe
paya
ble
in 6
sem
i an
nual
instal
lmen
ts ( c
omme
nced
from
Sept
embe
r, 20
14) o
f 13
%, 1
3%,
13%
, 13
% 2
4% &
24%
of
sanc
tione
d am
ount
of U
SD 2
00lak
h.

Annual Report 2016-17
177
Notesto Consolidated Financial Statement for the Year Ended March 31, 2017
E(i)
Part
icul
ars
Inte
rest
Secu
rity
Year
of
Term
s of
Mar
ch 3
1, 20
17M
arch
31,
Mar
ch 3
1,R
ate
Mat
urity
inR
epay
men
t[R
efer
Not
e20
1620
15Fi
nanc
ial
17a
(H)
Year
ECB
III in
forei
gnLI
BOR
2017
-18 16
,950.3
2 16
,583.2
3 18
,804.0
0cu
rrenc
y fro
m DB
S6 m
onth
s +Ba
nk L
td.37
0 bps
p.a.
ECB
I in fo
reign
curre
ncy
Not a
pplic
able
2015
-16—
994.9
9 3,
760.8
0fro
m Sta
ndard
Chart
ered B
ank
ECB
II in
forei
gn cu
rrenc
yNo
t app
licab
le20
15-16
——
4,17
8.67
from
Stand
ardCh
artere
d Ban
k
ECB
III in
forei
gn cu
rrenc
yLI
BOR
2016
-17 3,
364.7
0 4,
425.3
8 5,
007.5
8fro
m Sta
ndard
3 mon
ths +
Chart
ered B
ank
340 b
ps p.
a.
Long
Ter
m M
atur
ity O
fFi
nanc
e Le
ase
Obl
igat
ion
Vehic
le Lo
an fr
om 9.
51%
p.a.
2018
-1925
.49 42
.59 58
.14HD
FC B
ank
Amor
tisat
ion
Of
The
Upf
ront
Fee
s As P
er In
d As
(146
.53)
(306
.15)
(441
.05)
Tota
l Non
Cur
rent
Bor
row
ing
62,7
67.8
2 7
8,83
2.21
1,04
,270
.34
Less
: Cl
assi
fied
unde
r
Long
term
debt
s clas
sified
unde
r oth
er fin
ancia
l liab
ilities
[ Refe
r Not
e 17 (
c) ]
36,51
0.34
34,24
5.60
61,67
3.63
Curre
nt m
aturit
ies of
Lon
g term
debt
s [ R
efer N
ote 1
7 ( c)
]22
,495.7
0 40
,764.5
4 39
,046.3
0
Curre
nt m
aturit
ies of
finan
ce le
ase ob
ligati
ons [
Refer
Not
e 17 (
c)]25
.4944
.6517
.24
Inter
est ac
crued
[Refe
r Not
e 17 (
c)]3,7
36.29
3,751
.943,4
92.27
Non
-cur
rent
bor
row
ings
as p
er b
alan
ce sh
eet
—25
.4940
.90
BBR-
Ban
k Base
Rate
MCL
R-M
argina
l cos
t of f
unds
based
lend
ing R
ateLI
BOR-
Lond
on In
terba
nk O
ffered
Rate
Secu
red by
a fir
st ch
arge o
ver t
he fix
ed as
sets,
both
pres
ent
and
futu
re, o
f m
anuf
actu
ring
units
at G
una
(Mad
hya
Prad
esh)
, Dalo
da (M
adhy
a Pr
ades
h), B
aran
(Raja
sthan
),Ga
darw
ara (M
adhy
a Prad
esh) a
nd Re
finery
unit(
s) at
Kand
la(G
ujarat
).
Secu
red b
y a fi
rst ch
arge o
ver t
he w
indmi
lls, b
oth
pres
ent
& fu
ture,
at M
aliya
Miya
na (G
ujarat
), Pi
ploda
(Mad
hya
Prad
esh)
, Fa
tehgr
ah (R
ajasth
an),
Sherg
rah (R
ajasth
an),
&Os
iyan
(Raja
sthan
).
Secu
red by
a fir
st ch
arge o
ver t
he w
indmi
lls, b
oth
pres
ent
& fu
ture,
at Pi
ploda
(Mad
hya
Prad
esh)
, Pals
odi (
Mad
hya
Prad
esh)
& F
atehg
rah (R
ajath
an).
Secu
red b
y fir
st an
d ex
clusiv
e ch
arge
on m
ovab
le fix
edas
sets,
bot
h pr
esen
t and
futu
re, o
f ref
inery
at K
akina
da(A
ndhr
a Prad
esh)
.
Hypo
thec
ation
of ve
hicles
aquir
ed ou
t of t
he sa
id loa
n
Repa
yabl
e in
5 s
emi
annu
alin
stallm
ents
(com
men
ced
from
Mar
ch, 2
016)
of
16.66
%, 2
0%,
20%
, 20
%
&
23.3
4%
ofsa
nctio
ned
amou
nt o
f USD
300
lakh.
Repa
yabl
e in
16
qu
ater
lyin
stallm
ents
(com
men
ced
from
June
, 201
2) ou
t of t
hat f
irst e
ight
instal
lmen
ts sh
all b
e 5%
& n
ext
eight
insta
llmen
t sha
ll be 7
.5% o
fsa
nctio
ned
amou
nt o
f USD
200
lakh
Repa
yable
in 6
semi
annu
al eq
ual
insta
llmen
ts (co
mm
ence
d fro
mJu
ne, 2
013)
of sa
nctio
ned a
moun
tof
USD
200 l
akh.
Repa
yabl
e in
18
qua
rterly
insta
llmen
ts (co
mm
ence
d fro
mJu
ne, 2
012)
of sa
nctio
ned a
moun
tof
USD
158.9
5 lak
h.Re
paya
ble
in 6
0 eq
ual m
onth
lyin
stallm
ents
(com
men
ced
from
July
201
3) o
f th
e sa
nctio
ned
amou
nt o
f ` 81
lakh
.
NOTE-13 a BORROWINGS (Contd.) (` in Lakh)

Ruchi Soya Industries Limited
178
Notesto Consolidated Financial Statement for the Year Ended March 31, 2016
NOTE-13 a BORROWINGS (Contd.) (` in Lakh)
(ii) The Company has not satisfied debt covenants as prescribed in the bank agreements, hence the said borrowings are classifiedunder Other current financial liabilities under Note 17 c.F During the year, the Company has defaulted in repayment of the loans which remained outstanding, are as
follows:
Particulars of Loans Amount of continuing default as onMarch 31, 2017 ( `̀̀̀̀ in Lakh)
of Principal of Interest Due dateAmount accrued for payment
Corporate Loan IV from State Bank of India 3,000.00 171.51 December 31, 2016and March 31, 2017
Corporate Loan V from State Bank of India 3,000.00 364.32 December 31, 2016and March 31, 2017
Term loan from State Bank of India 353.66 27.10 March 31, 2017ECB III in foreign currency from DBS Bank Ltd. 7,780.63 740.67 September 6, 2016
and March 6, 2017ECB II in foreign currency from DBS Bank Ltd. 6,224.51 329.07 September 26, 2016
and March 27, 2017ECB III in foreign currency from 3,227.25 137.45 August 1, 2016 ;Standard Chartered Bank September 1, 2016
and February 1, 2017Total 23,586.05 1,770.13
G Deferred Payment Liability on account of Deferred Sales tax denotes interest free sales tax deferral under Schemes of StateGovernments of Andhra Pradesh & Tamil Nadu. The same are repayable in annual installments beginning from June 2014in case of Andhra Pradesh and from August 2015 in case of Tamil Nadu.
H Rights, Preferences and Restrictions attached to shares(i) Preference Shares: 6% Non-Convertible Redeemable Cumulative Preference Shares of ` 100 each were issued pursuant to
the Scheme of Amalgamation and Arrangement between Sunshine Oleochem Limited, Ruchi Soya Industries Limited andtheir respective shareholders sanctioned by the Hon’ble High Court of judicature of Mumbai in an earlier year on the sameterms and conditions as originally issued by Sunshine Oleochem Limited.These preference shares are redeemable as follows:a) First installment of ` 33 per preference share on completion of 144 months from March 31, 2009.b) Second installment of ` 33 per preference share on completion of 156 months from March 31, 2009.c) Third installment of ` 34 per preference share on completion of 168 months from March 31, 2009.
(ii) Reconciliation of number of shares As at As at As atMarch 31, 2017 March 31, 2016 April 1, 2015
Preference SharesBalance at the beginning of the year 2,00,000.00 2,00,000.00 2,00,000.00Add:Shares issued during the year — — —Balance at the end of the year 2,00,000.00 2,00,000.00 2,00,000.00
Details of shares held by shareholders holding more than 5% Preference shares in the Company.
Particulars March 31, % March 31, % April 1, %2017 2016 2015
PREFERENCE SHARESRuchi Infrastructure Limited 2,00,000 100 2,00,000 100 2,00,000 100

Annual Report 2016-17
179
Notesto Consolidated Financial Statement for the Year Ended March 31, 2016
NOTE-13 b OTHER FINANCIAL LIABILITIES (` in Lakh)
As at As at As atMarch 31, 2017 March 31, 2016 April 1, 2015
Derivative Liablity– Interest rate swaps [Refer Note 44] — 62.20 307.20Other liabilities 4.35 847.43 1,204.99
4.35 909.63 1,512.19
A Provision for employee benefits i) Gratuity — — — ii) Compensated absences 2.99 4.14 4.14
B Others Provisions Taxation (net) — 232.63 0.15
2.99 236.77 4.29
NOTE-15 DEFERRED TAX LIABILITIES (NET) (` in Lakh)For the year ended
March 31, 2017
Tax expense A. Amounts recognised in Statement of profit and loss
For the year ended March 31, 2017Current income tax (Changes in estimates related to prior period ) —Tax for earlier years (3,190.32)
(3,190.32)Deferred income tax liability /(asset), netOrigination and reversal of temporary differences (34,226.73)Others —Deferred tax expense (34,226.73)(A) Tax expense for the year charged to the statement of profit and loss (37,417.05)
B. Amounts recognised in Other Comprehensive Income (` in Lakh)For the year ended March 31, 2017
Amount Before tax Tax (expense) Net of taxbenefit
Items that will not be reclassified to profit or loss
Remeasurements of the defined benefit plans 81.97 (28.26) 53.71
Equity Instruments through Other Comprehensive Income (730.19) — (730.19)
Items that will be reclassified to profit or loss —Fair Value Changes in hedge reserve (net) [ Refer Note 12 G] 200.30 — 200.30
(B) Total (447.92) (28.26) (476.18)
(C) Total Tax expenses for the year (A+B) (37,445.31)
NOTE-14 PROVISIONS (` in Lakh)
As at As at As atMarch 31, 2017 March 31, 2016 April 1, 2015

Ruchi Soya Industries Limited
180
Notesto Consolidated Financial Statement for the Year Ended March 31, 2017
C. Reconciliation of effective tax rateFor the year ended March 31, 2017The income tax expenses for the year can be reconciled to the accounting profit as follows:Profit before tax (1,68,584.68)Applicable Tax Rate 34.61%Computed Tax Expense (58,343.79)Tax effect of :Expenses disallowed 14,837.56Additional allowances (30,060.11)Current Tax (73,566.34)Current Tax Provision (A) —Incremental Deferred Tax Liability on account of Tangible and Intangible Assets (129.34)Incremental Deferred Tax Asset on account of Financial Assets and Other Items 34,069.13Deferred tax Provision (B) (34,198.47)Tax Expenses recognised in Statement of Profit and Loss (A+B) (34,198.47)Effective Tax Rate 20.29%
NOTE-16 OTHERS NON CURRENT LIABILITIES (` in Lakh)
As at As at As atMarch 31, 2017 March 31, 2016 April 1, 2015
(a) Customers’ Advances [ Refer Note 34(B)(b)(i) and 34(A)( c)(iv)] — 9,275.82 18,551.64(b) Government Grant - Deferred Income [ Refer Note (i) below] 650.96 409.75 274.30(c) Other Liabilities [ Refer Note (ii) below] 695.34 242.94 307.16(d) Share application money pending allotment 204.47 — —
1,550.77 9,928.51 19,133.10Note:(i) Government Grant - Deferred Income
Opening Balance 440.29 293.23 293.23Grants during the year 300.00 165.98Less: Recognised in statement of profit and loss [ Refer Note 22(C)(iii)] 36.71 18.92Closing balance 703.58 440.29 293.23
Classified under Non-Current Liabilities [ Refer Note 16 (b)] 650.96 409.75 274.30Classified under Current Liabilities [ Refer Note 17 (c)] 52.62 30.54 18.93
703.58 440.29 293.23(ii) Other liabilities include ` 5.87 lakh [FY 2015-2016 ` 4.23 lakh and ` Nil]
due to related parties. [ Refer Note 41]
NOTE-15 DEFERRED TAX LIABILITIES (NET) (Contd.) (` in Lakh)

Annual Report 2016-17
181
Notesto Consolidated Financial Statement for the Year Ended March 31, 2017
Loans repayable on demandA Secured
From Banks Working Capital Loans 4,47,204.19 2,63,073.53 79,193.12 From Others Working Capital Loans 21,285.45 — —
B Unsecured (i) From Banks / Financial Institutions [ Refer Note F below ] 56,634.69 2,14,907.92 1,81,479.64 (ii) Loan from Share Holders and Others — 22,628.43 46,443.89
5,25,124.33 5,00,609.88 3,07,116.65
C Particulars Interest Rate Security Terms of Repayment
Working Capital Loans from Export Packing Credit Loans First pari passu charge within the Repayable on demandConsortium Bank (Ranging from 8.55% p.a to Working capital Consortium Member during the facility tenure
11.50% p.a.) and other banks over the current assets, both present of 12 months.working capital loans and future, of the Company and second(Ranging from 11.00% p.a. pari passu charge within the Workingto 14.60% p.a.) capital Consortium Member banks over
the movable and immovable fixed assets,both present and future. Personalguarantee of promoter director/s.
Working Capital Loans At mutually agreed rate on Specific charge on current assets financed Repayable on demandfrom DBS Bank each drawdown by DBS Bank’s facility. Personal guarantee during the facility tenure
of promoter director. of 12 months.Working Capital Loans from At mutually agreed rate on Exclusive charge on the current assets Repayable on demandEdelweiss Asset each drawdown created by IDFC Bank’s facility during the facility tenureReconstruction Company of 12 months.Limited [EARCL] (Availedfrom IDFC Bank Limited andassigned by them to EARCL)Working Capital Loans from At mutually agreed rate on Specific charge on stocks and book debts Repayable on demandHDFC Bank each drawdown for ` 2,000 Lakh. Personal Guarantee of during the facility tenure
Mr. Dinesh Shahra of 12 months.Working Capital Loans from At mutually agreed rate on Specific charge on stocks and book debts. Repayable on demandStandard Chartered Bank each drawdown Personal Guarantee of Mr. Dinesh Shahra during the facility tenure
of 12 months.
D Details of Loans Recalled
Particulars of Loans Faclity Recalled Amount as on Date of RecallMarch 31, 2017(`̀̀̀̀ in Lakh)
DBS Bank Working Capital Facilities under multiple 22,434.16 September 27, 2016banking arrangement
IDFC Bank Working Capital Facilities under multiple 21,285.45 May 19, 2016banking arrangement
NOTE-17a BORROWINGS (` in Lakh)
As at As at As atMarch 31, 2017 March 31, 2016 April 1, 2015

Ruchi Soya Industries Limited
182
Notesto Consolidated Financial Statement for the Year Ended March 31, 2017
E During the year, the Company has defaulted in repayment of the loan which remain outstanding are as follows:
Particulars of Loans Amount of continuing default as onMarch 31, 2017 (`̀̀̀̀ in Lakh)
of Principal of Interest accrued Due date Amount paid Date ofAmount [Refer Note M below] for payment (`̀̀̀̀ in Lakh) payment
Export Packing Credit 89,685.01 1,813.19 May 19, 2016 to 1,361.26 April 3, 2016 toFebruary 28, 2017 April 20, 2017
Inland Letter of Credit 38,707.95 445.69 June, 2016 to 2,676.22 April 15, 2016 toMarch 31, 2017 April 21, 2017
Foreign Bill Discounting 11,736.55 100.58 August 2, 2016 to — —September 19, 2016
Buyers Credit 82,175.38 4,073.19 August 8, 2016 to 5,580.03 April 7, 2017 to March 27, 2017 April 19, 2017
Foreign Letter of Credit 90,536.28 4,866.12 May 10, 2016 to 2,270.59 April 5, 2017 toMarch 27, 2017 April 10, 2017
Short Term Loan 25,135.43 1,200.72 May 7, 2016 to — —
November, 2016Cash Credit 4,499.63 372.01 Total 3,37,976.60 12,499.20
F During the year, the Group has availed buyer’s credit. The amount of ` 56,634.69 lakh [FY 2015-2016 ` 3,70,663.18 lakh andApril 1, 2015 ` 1,50,489.57 lakh) outstanding on account of buyer’s credit as at March,31 2017, is guaranteed by the banksagainst fixed deposits of ` Nil [FY 2015-2016 ` Nil, April 1, 2015 ` 41,450.30 lakh][Refer Note 8(a) and 8(c)] placed with themand earmarking against non fund based limit of ̀ 56,634.69 Lakh [FY 2015-2016 ̀ 1,47,723.89 lakh,April 1, 2015 ̀ 1,08,250.27lakh].
G The working capital loans includes Bills drawn on customers and discounted from bank amounting to ̀ 7,751.58 lakh [FY 2015-16 ` 39,021.68 lakh and April 1, 2015 ` 61,400.84 lakh] with recourse option. [ Refer Note 8(b)(ii) ]
H Confirmations from certain banks in respect of bank balances aggregating to credit balances of ̀ 61,421.93 lakh have not beenreceived from the banks in response to the requests sent. The Company has, however requsted for the confirmations andfollowed up with the banks. The account balances and the interest and other charges have been accounted on the basis ofinformation available with the Company and the provisions of various sanciton letters/ agreements avaliable.
I In case of one of the subsidiary Company working capital loan(s) from banks are secured by Pari passu charge in favour of AxisTrustee Services Ltd., acting for and on behalf of multiple lender banks, by way of mortgage on all present and future bookdebts, outstanding moneys receivable, claims, bills and stock in trade consisting of raw materials, semi finished goods, goods inprocess, finished goods etc, and property at village Marol Maroshi, Taluka Andheri, Mumbai, Maharastra.
J In case of one of the subsidiary Company loan amounting ` 978.33 lakh included in working capital loan due to Federal Bankhas been assigned by the Bank to Phoenix Asset Reconstruction company (PARC), Mumbai with effect from March 31, 2017.
K In case of one of the subsidiary Company working capital loans as per books includes amount ̀ 612.79 lakh due to federal Bankagainst Export realiazation whereas balance as per bank is NIL as the amount has been remitted by the debtors to Federal bankagainst the bill negotiated thorough the other Bank.
L (i) In case of one of the subsidiary Company overdraft from Bank represents LC overdue (including interest) from StandardChartered Bank ` 8,395.27 lakh from august 2016 [FY 2015-2016 ` 9,869.41 lakh].
(ii) In case of one of the subsidiary Company it is secured by pari passu charge by way of mortgage on all present and futurebook debts and stock in trade.
M. Includes amount of ` 6,072.31 lakh debited by bank in fund based facilities.
NOTE-17a BORROWINGS (Contd.) (` in Lakh)

Annual Report 2016-17
183
Notesto Consolidated Financial Statement for the Year Ended March 31, 2017
– Due to Micro, Small and Medium Enterprises [Refer Note i below] 678.81 870.21 439.06– Due to Related parties [ Refer Note 41] 217.80 48.21 160.75– Due to others [Refer Note ii below ] 4,87,810.73 6,26,685.92 6,47,186.69
4,88,707.34 6,27,604.34 6,47,786.50
Note:
(i) The Company has identified (based on information available) certain suppliers as those registered under Micro, Small andMedium Enterprises Development Act, 2006 (‘MSMED Act’). The disclosures pursuant to the MSMED Act are as follows:
(` in Lakh)As at As at As at
March 31, 2017 March 31, 2016 April 1, 2015
Principal amount due to suppliers registered under the MSMED Actand remaining unpaid as at year end 506.08 750.84 356.43Interest due to suppliers registered under the MSMED Act andremaining unpaid as at year end 172.73 119.38 82.63Principal amounts paid to suppliers registered under the MSMED Act,beyond the appointed day during the year 3,154.08 3,547.78 3,696.00Interest paid, under Section 16 of MSMED Act, to suppliers registeredunder the MSMED Act, beyond the appointed day during the year — — —Interest paid, other than under Section 16 of MSMED Act,to suppliersregistered under the MSMED Act, beyond the appointed dayduring the year — — —Interest due and payable towards suppliers registered under theMSMED Act, for payments already made 169.75 112.38 82.02Interest remaining due and payable for earlier years 119.38 82.63 55.60 Amount of Interest due and payable for the period (where theprincipal has been paid but interest under the MSMED Act,2006not paid) 50.37 29.75 26.42
(ii) Due to others includes Bills Payable amounting to ` 53,978.68 lakh [FY 2015-2016 ` 30,894.56 lakh and April 1, 2015` 54,249.89 lakh]. [Secured against first pari passu charge on current assets of the Company, second pari passu charge onmovable and immovable fixed assets and personal guarantee of promoter director/(s) among working capital consortiummember banks].
NOTE-17b TRADE PAYABLES (` in Lakh)
As at As at As atMarch 31, 2017 March 31, 2016 April 1, 2015

Ruchi Soya Industries Limited
184
Notesto Consolidated Financial Statement for the Year Ended March 31, 2017
Term Loans from Banks - Secured[Reclassified from non- current borrowings - Refer Note 13a E(ii)]– Rupee Loans 19,329.77 4,799.83 10,765.10– Foreign Currency Loans 17,180.57 31,049.64 52,010.07Current maturities of long-term debt– From Banks 22,495.70 40,764.54 39,046.30– From State Government 151.09 732.18 460.35Current Maturities of finance lease obligations 25.49 44.65 17.24Derivative Liablity– Commodity Future Contracts — — 479.90– Forward exchange forward contract — 3,649.04 1,042.65– Foreign curreny options — 411.22 49.22– Interest rate swaps — 138.10 237.36– Commodity Contracts 1,206.93 72,455.58 55,897.26Interest accrued 14,847.74 1,891.31 1,670.13Unclaimed Dividends [Refer Note i below] 31.98 38.50 41.55Agency & Other Deposits 1,078.74 1,500.91 1,206.48Customers’ Advances [ Refer Note (ii) below] 1,07,554.28 — —Unamortised Guarantee commission 139.30 — —Others 1,352.97 — — Non-Trade payables Creditors for capital expenditure 89.97 207.54 856.88 Others [Refer note (iii) below] 337.86 185.88 141.06
1,85,822.39 1,57,868.92 1,63,921.55Note:(i) There are no amounts due for payment to the Investor Education and Protection Fund under Section 125 of the Companies
Act, 2013 as at the year end.(ii) As the Company has not exported goods as per the agreement, these customer advances are now repayable and hence are
classified as financial liability. [ Refer Note 34 A(c)(iv) and 34 B(b)(i) ](iii) Non-Trade payables include ` 125.75 lakh [FY 2015-2016 ` 95.49 lakh and April 1, 2015 ` Nil] due to Related parties. [Refer
Note 41]
NOTE-18 OTHER CURRENT LIABILITIES (` in Lakh)
As at As at As atMarch 31, 2017 March 31, 2016 April 1, 2015
(a) Customers’ Advances 7,881.97 88,530.13 1,20,170.07(b) Other liabilities [ Refer Note (i) below] 8,222.22 13,330.64 10,343.93(c) Government Grant - Deferred Income [ Refer Note 16 (b)
and 22(C)(iii)) ] 52.62 30.54 18.93 16,156.81 1,01,891.31 1,30,532.93
Note:
(i) Other liabilities include ` 10.84 Lakh [FY 2015-2016 ` 4.13 lakh and April 1, 2015 ` Nil ] due to related parties.[Refer Note 41]
NOTE-17c OTHER FINANCIAL LIABILITIES (` in Lakh)
As at As at As atMarch 31, 2017 March 31, 2016 April 1, 2015

Annual Report 2016-17
185
Notesto Consolidated Financial Statement for the Year Ended March 31, 2017
NOTE-19 PROVISIONS (` in Lakh)
As at As at As atMarch 31, 2017 March 31, 2016 April 1, 2015
i) Provision for Gratuity — 249.53 222.14ii) Provision for Compensated absences 851.32 958.35 773.70 iii) Provision for Dividend payable — — 12.00
851.32 1,207.88 1,007.84
The Company contributes to the following post-employment defined benefit plans in India.A Defined Contribution Plans:
The Group has certain defined contribution plans. Contributions are made to provident fund in India for employees at thespecified rate as per regulations. The contributions are made to registered provident fund administered by the Government ofIndia. The obligation of the Group is limited to the amount contributed and the Group has no further contractual or anyconstructive obligation. The Group has recognised ̀ 785.47 lakh [FY 2015-2016 ̀ 933.95 lakh] towards contribution to ProvidentFund and ` 67.65 lakh [FY 2015-2016 ` 68.94 lakh] towards Employee State Insurance in Profit and Loss account.
B Defined Benefit Plan:
a) Gratuity
The Group provides for gratuity for employees in India as per the Payment of Gratuity Act, 1972. Employees who are incontinous service for a period of 5 years are eligible for gratuity. The amount of gratuity payable on retirement/termination/resignation is paid as per the provisions of the Payment of Gratuity Act, 1972. The gratuity plan is a funded plan andGroup makes annual contributions to the Group Gratuity cum Life Assurance Schemes administered by the LIC of India,a funded defined benefit plan for qualifying employees.The most recent actuarial valuation of plan assets and the present value of the defined benefit obligation for gratuity werecarried out as at March 31, 2017. The present value of the defined benefit obligations and the related current service costand past service cost, were measured using the Projected Unit Credit Method.
b) Leave Obligations
The leave obligations cover the Company’s liability for casual, sick & earned leave. The amount of the provision is presentedas current, since the Company does not have an unconditional right to defer settlement for any of these obligations.However, based on past experience, the Company does not expect all employees to take the full amount of accrued leaveor require payment within the next 12 months.Based on the actuarial valuation obtained in this respect, the following table sets out the status of the gratuity plan and theamounts recognised in the Company’s financial statements as at balance sheet date:
March 31, 2017 March 31, 2017 March 31, 2016 March 31, 2016 April 1,2015 April 1,2015
Gratuity Leave Gratuity Leave Gratuity LeaveEncashment Encashment Encashment
Defined benefit obligation 2,120.18 913.22 2,218.38 1,016.29 1,860.95 827.49Fair Value of plan assets 2,242.40 58.91 1,968.85 53.80 1,638.81 49.64Net defined benefit(obligation)/assets 122.21 (854.31) (249.53) (962.49) (222.14) (777.85)
Non-current — (2.99) — (4.14) — (4.15)Current [ Refer Note 9(c)& 19 (i) and (ii) ] 122.21 (851.32) (249.53) (958.35) (222.14) (773.70)

Ruchi Soya Industries Limited
186
Notesto Consolidated Financial Statement for the Year Ended March 31, 2017
B. Movement in net defined benefit (asset) liability
The following table shows a reconciliation from the opening balances to the closing balances for net defined benefit (asset)liability and its components.
March 31, 2017 March 31, 2017 March 31, 2016 March 31, 2016 April 1,2015 April 1,2015
Gratuity Leave Gratuity Leave Gratuity LeaveEncashment Encashment Encashment
Defined benefit obligationsOpening balance 2,218.38 1,016.29 1,860.32 827.49 1,322.53 675.85Included in profit or loss — — — — 20.71 13.27Current service cost 216.78 170.79 196.06 103.82 144.46 122.44Past service costInterest cost (income) 174.32 79.55 147.90 65.06 123.71 63.19
2,609.48 1,266.64 2,204.28 996.38 1,611.40 874.75
Included in OCIRemeasurement loss (gain):Actuarial loss (gain) due to :Demographic assumptions (31.77) 33.60 (5.13) 11.35 12.75 (46.04)Financial assumptions 103.24 29.95 17.13 7.22 207.87 89.47Experience adjustment (153.66) (410.79) 120.48 5.89 114.40 (85.62)Return on plan assets excludinginterest income 2,527.29 919.40 2,336.75 1,020.83 1,946.42 832.56
OtherContributions paid by the employer — — — — —Benefits paid (407.11) (6.18) (118.37) (4.54) (86.10) (5.07)Closing balance 2,120.18 913.22 2,218.38 1,016.29 1,860.32 827.49
Fair Value of plan assetOpening balance 1,968.85 53.80 1,638.81 49.64 1,361.26 46.32Included in profit or loss — — 27.01 —Interest income 154.71 4.23 130.29 3.95 118.43 4.03
2,123.56 58.03 1,769.10 53.59 1,506.69 50.35Included in OCIRemeasurement gain (loss):Actuarial gain (loss) due to :Demographic assumptionsFinancial assumptionsExperience adjustment (0.21) 0.35 9.15 0.51 6.84 (0.25)Return on plan assets excludinginterest income (0.00) 0.03 0.03
2,123.34 58.38 1,778.28 54.10 1,513.56 50.10OtherContributions paid by the employer 526.16 6.71 308.93 4.24 211.35 4.61Benefits paid (407.11) (6.18) (118.37) (4.54) (86.10) (5.07)Closing balance 2,242.40 58.91 1,968.85 53.80 1,638.81 49.64
NOTE-19 PROVISIONS (Contd.) (` in Lakh)

Annual Report 2016-17
187
Notesto Consolidated Financial Statement for the Year Ended March 31, 2017
Expense recognised in Statementof Profit and LossCurrent service cost 216.78 170.79 196.06 108.78 143.45 113.34Net Interest cost 19.61 75.33 17.61 61.12 5.33 59.16Actuarial (gain)/loss on obligationfor the period — (347.59) — 23.94 328.08 (41.94)Expense recognised in Statementof Profit and Loss 236.39 (101.48) 213.67 193.83 476.86 130.56
Expense recognised in OtherComprehensive Income (OCI)Actuarial (gain)/loss on obligationfor the period (82.18) — 132.40 — — —Return on plan assets excludinginterest income 0.21 — (9.18) — — —Net (Income) Expense for theperiod recognized in OCI[Refer Note 33 A (I) (i)] (81.97) — 123.22 — — —
C. Plan assets
Plan assets comprise the following:
March 31, 2017 March 31, 2017 March 31, 2016 March 31, 2016 April 1,2015 April 1,2015
Gratuity Leave Gratuity Leave Gratuity LeaveEncashment Encashment Encashment
Investment in LIC IndiaInsurer managed fund (100%) 2,242.40 58.91 1,968.85 53.80 1,638.81 49.64
2,242.40 58.91 1,968.85 53.80 1,638.81 49.64
D. Defined benefit obligations
i. Actuarial assumptions
The following were the principal actuarial assumptions at the reporting date (expressed as weighted averages).Particulars March 31, 2017 March 31, 2016 April 1,2015
Discount rate 7.26% to 6.57% 7.86% to 7.38% 7.95%Salary escalation rate 6.00% 6.00% 6.00%Rate of return on plan assets 7.26% to 6.57% 7.86% to 7.38% 7.95%Retirement Age 58 Years & 60 Years 58 Years & 60 Years 58 Years & 60 YearsAttrition Rate For service 4 years & below For service 4 years and below For service 4 years and below
27.56% p.a. and For service 10.50% p.a. and For service 9.03% p.a. and For service5 yrs and above 2% p.a. 5 yrs and above 2% p.a. 5 yrs and above 2% p.a.
Mortality Rate Indian Assured Lives Mortality Indian Assured Lives Mortality Indian Assured Lives Mortality(2006-08) Ultimate (2006-08) Ultimate (2006-08) Ultimate
Assumptions regarding future mortality are based on published statistics and mortality tables. The current longevitiesunderlying the values of the defined benefit obligation at the reporting date were as follows :
March 31, 2017 March 31, 2017 March 31, 2016 March 31, 2016 April 1,2015 April 1,2015
Gratuity Leave Gratuity Leave Gratuity LeaveEncashment Encashment Encashment
NOTE-19 PROVISIONS (Contd.) (` in Lakh)

Ruchi Soya Industries Limited
188
Notesto Consolidated Financial Statement for the Year Ended March 31, 2017
ii. Sensitivity analysis
Reasonably possible changes at the reporting date to one of the relevant actuarial assumptions, holding other assumptionsconstant, would have affected the defined benefit obligation by the amounts shown below.
March 31, 2017 March 31, 2016 April 1,2015
Increase Decrease Increase Decrease Increase DecreaseDiscount rate (1% movement) (167.29) 192.81 (177.28) 204.94 (152.58) 176.83Future salary growth (1% movement) 193.32 (170.64) 206.71 (181.76) 178.52 (156.56)Employee Turnover (1% movement) 16.01 (18.08) 25.29 (28.83) 22.52 (25.83)Average Future service 12 Years 12 Years 13 Years 13 Years 14 Years 14 Years
Although the analysis does not take account of the full distribution of cash flows expected under the plan, it does providean approximation of the sensitivity of the assumptions shown.
iii) Expected Contibutions in next year
March 31, 2017 March 31, 2016 April 1,2015(`̀̀̀̀ in Lakh) (`̀̀̀̀ in Lakh) (`̀̀̀̀ in Lakh)
Gratuity 47.39 464.86 417.19Provident Fund 741.90 1,024.87 1,073.35
NOTE-20 CURRENT TAX LIABILITIES (NET) (` in Lakh)
As at As at As atMarch 31, 2017 March 31, 2016 April 1, 2015
Taxation (Net) 60.09 11.30 2,120.0660.09 11.30 2,120.06
NOTE-21 LIABILITIES DIRECTLY ASSOCIATED WITH ASSETS CLASSIFIED ASHELD FOR SALE (` in Lakh)
As at As at As atMarch 31, 2017 March 31, 2016 April 1, 2015
Other Current Liabilities (Refer Note 10) 173.00 — —173.00 — —
NOTE-19 PROVISIONS (Contd.) (` in Lakh)

Annual Report 2016-17
189
Notesto Consolidated Financial Statement for the Year Ended March 31, 2017
NOTE-22 REVENUE FROM OPERATIONS (` in Lakh)
A For the year ended For the year endedMarch 31, 2017 March 31, 2016
A Sales of products ( including excise duty) 19,06,128.84 29,90,110.34B Sale of Services
Processing charges received 1,185.97 358.64C Other Operating revenue
(i) Export Incentive 3,893.14 4,629.00 (ii) Vat/CST/Entry tax Refund /Remission 1,215.02 4,772.93 (iii) Government grant [ Refer Note 16(i)] 36.71 18.92 (iv) Income from Power generation [Including Carbon Credits
VER/ CERs amounting to ` 15.08 lakh [FY 2015-2016 ` 12.96 lakh] 4,781.65 4,403.72 (v) Other operating income
– Contract Settlement-Purchase & Sales (net) 47.52 19,755.2719,17,288.85 30,24,048.82
NOTE-23 OTHER INCOME (` in Lakh)
A For the year ended For the year endedMarch 31, 2017 March 31, 2016
A Interest income (under the effective interest method)
– On Fixed Deposits 597.35 4,103.66– Unwinding of Extended Credit Period 1,998.76 1,071.60– Others 786.62 1,037.75
B Dividend Income:
– From Other than Subsidaries, associates and Joint Ventures entities — 28.60C Net Gain on sale of:-
– Current investments (Measured at Fair Value) — 0.95D Net Gain on Sale/Discard of Fixed Assets 7.43 0.26E Lease Rental income 14.01 65.41F Other Non-Operating Income
– Liabilities no longer required written back 59.02 756.04– Reversal of provision of Doubtful Debt 4,706.81 403.03– Other Receipts 2,131.82 2,130.91
G Financial assets (Measured at Fair Value)
– Investments 458.07 114.57 10,759.89 9,712.78

Ruchi Soya Industries Limited
190
Notesto Consolidated Financial Statement for the Year Ended March 31, 2017
NOTE-24 COST OF MATERIALS CONSUMED (` in Lakh)
A For the year ended For the year endedMarch 31, 2017 March 31, 2016
a) Raw Material 9,92,878.14 11,99,827.08b) Packing Material 49,081.15 62,506.01
10,41,959.29 12,62,333.09
NOTE-25 PURCHASES OF STOCK-IN-TRADE (` in Lakh)
A For the year ended For the year endedMarch 31, 2017 March 31, 2016
Purchases of Stock-in-Trade 6,39,104.92 15,13,291.44
NOTE-26 CHANGES IN INVENTORIES OF FINISHED GOODS,WORK-IN-PROGRESS AND STOCK IN TRADE (` in Lakh)
A For the year ended For the year endedMarch 31, 2017 March 31, 2016
Finished goods
Opening Stock 83,378.98 1,02,026.99 Closing Stock 55,050.00 79,236.74
28,328.98 22,790.25
Work-in-progress
Opening Stock 1,042.39 1,643.22 Closing Stock 478.43 1,042.39
563.96 600.83
Traded goods
Opening Stock 5,878.14 24,708.30 Closing Stock 1,103.26 18,587.26
4,774.88 6,121.04
33,667.82 29,512.12

Annual Report 2016-17
191
Notesto Consolidated Financial Statement for the Year Ended March 31, 2017
NOTE-27 EMPLOYEE BENEFITS EXPENSE (` in Lakh)
A For the year ended For the year endedMarch 31, 2017 March 31, 2016
Salary, Wages and Bonus 17,399.64 20,457.90Contribution to Provident and Other Funds 895.68 1,062.13Gratuity [Refer Note 19(i)] 252.25 230.55Leave Compensation Absences [ Refer Note 19(ii)] 222.30 -Employee Stock Option Scheme (ESOP) [ Refer Note 12 M(ii)] 11.48 13.07Staff Welfare expenses 539.24 681.70
19,320.59 22,445.35
NOTE-28 FINANCE COSTS (` in Lakh)
A For the year ended For the year endedMarch 31, 2017 March 31, 2016
Interest Expense [ Refer Note 3(a)(i)(a)] 88,970.54 54,655.32Other borrowing costs 482.76 1,239.70Exchange differences regarded as adjustment to borrowing costs 3,837.32 80,221.82
93,290.62 1,36,116.84
NOTE-29 DEPRECIATION, AMORTISATION AND IMPAIRMENT EXPENSE (` in Lakh)
A For the year ended For the year endedMarch 31, 2017 March 31, 2016
Depreciation and Impairment on Property, plant and Equipment 15,784.79 16,550.05Amortisation on Intangible assets 102.61 118.15
15,887.40 16,668.20
NOTE-30 PROVISION FOR DOUBTFUL DEBTS AND ADVANCES [INCLUDINGBAD DEBTS WRITTEN OFF] (` in Lakh)
For the year ended For the year endedMarch 31, 2017 March 31, 2016
Provision for Doubtful Debts 1,22,894.17 25,355.62Provision for Advances 2,422.06 92.85Bad Debts writen off 6,223.85 —
1,31,540.08 25,448.47
Note:(a) As per Ind AS -109 on Financial Instruments the Company has applied Expected Credit Loss Model for determining the
provision for trade receivable based on the weighted average of credit losses with respective risks of defaults occurring asweights.
(b) Excludes ` 16,074.41 lakh [FY 2015-2016 ` 514.84 lakh] on account of Provision/( Reversal of provision) for doubtful debtsand doubtful advances (net of deferred tax) and Excludes ` Nil [FY 2015-2016 ` 116.08 lakh ] on account of Bad debts andadvances written off (net of current tax) debited to Business Development Reserve.[Refer Note 12 E].

Ruchi Soya Industries Limited
192
Notesto Consolidated Financial Statement for the Year Ended March 31, 2017
NOTE-31 OTHER EXPENSES (` in Lakh)
A For the year ended For the year endedMarch 31, 2017 March 31, 2016
Manufacturing expenses
Manufacturing expenses 8,313.24 11,005.44Consumables 6,478.30 8,123.75Consumption of Stores & Spares parts 4,124.90 6,520.53Power & Fuel (net of recoveries) 14,658.94 21,741.41Lease Rental expenses (net of recoveries) 10,663.74 15,308.46Repairs and Maintainence– Plant & Machinery 1,878.63 2,148.06– Buildings 169.38 510.90– Others 581.21 790.29
46,868.34 66,148.84
Selling and distribution expenses
Freight & forwarding (net of recoveries) 37,329.12 51,652.23Export expenses 2,059.77 2,951.02Advertisement & sales promotion (Refer Note II below) 1,318.18 3,368.05
40,707.07 57,971.30
Establishment expenses
Rates & Taxes 5,663.67 8,465.98Insurance (net of recoveries) 1,258.86 1,576.34CSR Expenditure [ Refer Note I below] — 55.89Payment to Auditors 135.25 114.23Donations 37.49 4.90Provision for loss in Limited Liability Partnership 18.31 —Investment write down - Impairment 3,788.26 1,081.39Net Loss on Sale/Discard/ Fire of Fixed Assets 0.00 33.02Contract Settlement Purchase & Sales (net) 7,334.83 —Commission & rebate 3,858.61 4,827.80Travelling & conveyance 1,599.56 2,291.89Bank Commission & charges 7,733.36 7,779.65Loss on NCDEX, MCX and ACE — 5,240.99Other expenses (Net of recoveries) 11,197.61 11,264.79
42,625.81 42,736.87
1,30,201.22 1,66,857.01

Annual Report 2016-17
193
Notesto Consolidated Financial Statement for the Year Ended March 31, 2017
Note:
(I) Details of CSR Expenditure
The expenditure incurred on Corporate Social Reseponsibility (CSR) is as under: (` in Lakh)Particulars 2016-17 2015-16
Promoting gender equality and empowering women — 5.80Promoting of education — 15.88Reducing child mortality and improving maternal health — 8.08Ensuring environmental sustainability — 1.00Social business project — 3.21Others — 21.92Total — 55.89(i) Gross amount required to be spent by the Group during the year ` Nil [ FY 2015-2016 is ` 194.06 lakh] as per section 135
of the Act.(` in Lakh)
(ii) Amount spent during the year on: FY 2016-17 FY 2015-16
Amount Amount Amount Amountspent and Paid spent, Unpaid spent and Paid spent, Unpaid
– Construction/Acquistion of any asset — — — —– On purpose other than above — — 55.89 —
(II) Exclude ` 3,190.35 lakh [FY 2015-2016 ` 4,094.67 lakh] net of current tax thereon debited to Business Development Reserve.[Refer Note 11 E]
NOTE-32 EXCEPTIONAL ITEMS (` in Lakh)
A For the year ended For the year endedMarch 31, 2017 March 31, 2016
a) Reversal of excess Managerial Remunaration paid in earlier year — 74.92b) On Account of Divestment in Joint Venture [Refer Note 5a-E(ii)] 4,490.40 —c) Others- Recovery out of missappropriation at two brances pertaining
to earlier year — 164.06d) Reversal of claim & settlement debited by the company in earlier years
against settlement of sales contract [Refer Note below (i)] (1,162.21) —3,328.19 238.98
Note:(i) During the year, one of the subsidiary company has reversed the claim and settlement which was credited in earlier years against
settlement of sales contract, but not accepted by parties.

Ruchi Soya Industries Limited
194
Notesto Consolidated Financial Statement for the Year Ended March 31, 2017
NOTE-33 (` in Lakh)
A For the year ended For the year endedMarch 31, 2017 March 31, 2016
(A) Other Comprehensive Income
I Item that will not be reclassified to profit or loss
(i) Remeasurement of the defined benefit plans [ Refer Note 12K] 81.97 (123.22)(ii) Equity Instruments through Other Comprehensive Income
[ Refer Note 12 J] (730.19) (359.59)(648.22) (482.81)
Income tax relating to items that will not be reclassified toprofit or loss (28.26) 42.64
(676.48) (440.17)II Item that will be reclassified to profit or loss
— —— —
(B) Hedge Reserve
I Item that will not be reclassified to profit or loss - -II Item that will be reclassified to profit or loss
(i) Effective portion of gain or loss on hedging instruments in acash flow hedge [ Refer Note 12 G] 200.30 344.26
200.30 344.26Income tax relating to items that will not be reclassified toprofit or loss — —
200.30 344.26
NOTE-34 CONTINGENT LIABILITIES AND COMMITMENTS (` in Lakh)
A As at As atMarch 31, 2017 March 31, 2016
A Contingent liabilitiesa) Claims against the Company not acknowledged as debts
(to the extent quantified) 1,679.84 1,077.59b) Guarantees
(i) Outstanding bank Guarantees 3,666.60 7,323.21(ii) Outstanding letter of credit — —(iii) Outstanding corporate gurantees given on behalf of
– Indian Subsidiary (Share in sanctioned amount` 41,984.00 lakh( FY 2015-2016 ` 61,065.73 lakh) 38,968.80 37,849.97
– Indian Associate (Sanctioned amount ` 9,600.00 lakh(FY 2015-2016 ` 9,600.00 lakh) 5,346.00 6,106.00
– Foreign Subsidiary (Sanctioned amount ` Nil(FY 2015-2016 ` 1,05,800.98 lakh) — 22,628.43
c) Other Money for which Company is Contingently liable(i) EPCG Licences benefit in event of default of
Export Obligation [Refer Note 34 B (b) ii below] 106.95 358.90(ii) Income tax/Sales tax/Excise/Octroi/Custom duty/ESIC/
Electricity Duty/demand disputed 1,02,201.70 1,09,157.26

Annual Report 2016-17
195
Notesto Consolidated Financial Statement for the Year Ended March 31, 2017
(iii) During an earlier year , the Company had received claimsamounting to US$ 66.27 Million ( to the extent quantified) fromtwo overseas entities (claimants) in respect of performanceguarantees purportedly given by the Company as a secondguarantor on behalf of an overseas entity in respect of contractsentered into between the claimants and the overseas entity. TheCompany denies giving the guarantees and has disputed theclaims and has taken appropriate legal actions and makingsuitable representations in the matter. The Company does notexpect that any amount will become payable in respect of theclaims made. No provision is made in respect of the same in thebooks of account.
(iv) Interest liability , if any, in respect of advance from customers inthe event of default. [ Refer Note 16(a) and17c (ii) ] — 945.37
(v) On divestment of shares of Gemini Edibles and Oil Pvt. Ltd.in an earlier year, pursuant to the Share Purchase Agreement,the Company paid an amount of ` 2,836.52 lakh to the saidCompany by way of deposit which is refundable on receipt ofvarious incentives by the said Company from Governmentauthorities. Of the total amount paid, the Company has receivedrefund of ` 2,276.43 lakh till March 31, 2017. The Companyexpects to recover the balance amount of ` 560.09 lakh fully.Accordingly, no provision is considered necessary in this regards.
(vi) In relation to trading in Castor seed contracts on NationalCommodity and Derivative Exchange Limited ( NCDEX),pending investigation by Security Exchange Board of India [SEBI]amount of liability, if any, can not be assertained at this stage.
(vii) In case of one of the subsidiary Company is yet to receivebalance confirmation in respect of certain trade payables, tradereceivables, Advances from Customers and loans and advance.The Management does not expect any material differenceaffecting the current year’s financial statement due to the same,except detailed below:a) Advances received from foreign customers amounting
` 543.85 Lakh (shown under other current liabilities)outstanding for more than 1 year, further any regulatoryapprovals, permission from RBI or other related authoritieswas yet to be obtained.
b) Export Trade receivable amounting to ` 2,832.99 Lakh isoutstanding more than 1 year, permission from RBI or theother related authorities was yet to be obtained.
B Commitmentsa) Estimated amount of contracts remaining to be executed on capital
account and not provdied for (Net of advances) 155.36 480.14b) Other Commitments
i) Export Commitment in relation to advance received[Refer Note 16 (a) and 17 c(ii)] — 1,14,404.35
ii) Export Obligations in relation to EPCG Benefits[Refer Note 34 A (c) (i) above] 961.12 4,442.80
A As at As atMarch 31, 2017 March 31, 2016

Ruchi Soya Industries Limited
196
Notesto Consolidated Financial Statement for the Year Ended March 31, 2017
NOTE-35 SUBSEQUENT EVENTSThere are no significant subsequent events that would require adjustments or disclosures in the financial statements as on the balancesheet date.
NOTE-36The Group has made losses during the current year and the preceeding year. As a result of the losses, the liquidity position of theGroup has been substantainly affected resulting in default in payment of its debts and adversely affecting the operations of theGroup, indicating the existence of uncertainity about the ability of the Group to continue as a going concern.The management has initiated various steps such as cost rationalization, negotiations for debts restructing and disposal of non-coreassets. Considering the strengths of the Group's brand, future outlook as assessed by the management and the business plans, theGroup is confident of its ability to continue as a going concern. These consolidated financial statements have, accordingly beenprepared on going concern basis. The long term prospects of the Group, however, depend on the expeditious restructuring of thedebts by the lenders. The managment is hopeful of an early resolution of the matter.
NOTE-37 Disclosures pursuant to regulation 34(3) and 53(f) of schedule V of the SEBI ( Listing obligation anddisclosure requirments Reegulations, 2015
(a) Loans and advances in the nature of loans to Firms/Companies in which directors are interested NIL(b) Investment by the loanee in the shares of the company, when the Company has made a loan or advance in the nature of loan
NIL
NOTE-38 Details of Loans given, investment made and guarantee given under section 186(4) of the CompaniesAct, 2013
i. Investment made/Guarantees/Securities given
Investment made and guarantee’s/ securities given are given under respective heads.ii. Details of Loans and advances given to parties covered under section 186 of the Companies Act 2013
(` in Lakh)Particulars Loan and Advances Given Balance
2016-17 2015-16
Classifine Trading Company Private Limited — 99.99Comfort Point Export Private Limited — 63.71Suman Agritech Limited — 13.37Narayan Mercantile Private Limited — 1,304.25Sarthak Industries Limited — 98.65Swastik Worldwide Private Limited — 373.80Evershine Oleochem Limited — 5,677.29Ruchi Bio Fuel Private Limited — 758.97
— 8,390.03
The above loans and advances given are classified under respective heads and are charged interest at the rate of 13 % per annum.The loans and advances are given for purpose of their working capital requirements.
39 The Holding Company has availed the exemption available under Para D13AA of Ind AS - 101 of “First time adoption ofIndian Accounting Standards”. Accordingly, exchange gains and losses on foreign currency borrowings taken prior to April 1,2016 which are related to the acquisition or construction of qualifying assets are adjusted in the carrying cost of such asset.The exchange difference to the extent it relates to acquisition of depreciable asset is adjusted to the cost of the depreciable assetand depreciated over the balance life of the asset.

Annual Report 2016-17
197
Notesto Consolidated Financial Statement for the Year Ended March 31, 2017
In other cases, the exchange difference is accumulated in a Foreign Currency Monetary Item Translation Difference Accountand amortised over the balance period of such long term asset/ liability.Accordingly, during the year the Holding Company;(a) has adjusted exchange loss of ` 515.34 lakh [ 2015-16 ` 1,833.05 lakh] in respect of long term foreign currency monetary
items relating to acquisition of depreciable fixed assets to the cost of fixed assets [ Refer Note 3a(i)(b) ] and ;(b) amortised exchange loss relating to long term foreign currency monetary item in other cases over the life of the long term
liability and included ` 125.82 lakh [FY 2015-2016 ` 605.38 lakh)] being the unamortised portion in Foreign CurrencyMonetary Item Translation difference Account [ Refer Note 12 H ]
NOTE-40 SEGMENT REPORTING
A. General Information
(a) Factors used to identify the Group’s reportable segments, including the basis of organisation
Based on the criteriorn as mentioned in Ind-As-108-“Operating Segment”, the Company has identified its reportablesegments, as follows:• Segment-1 Extractions• Segment-2, Vanaspati• Segment-3, Oils• Segment-4, Food Products• Segment-5, Wind Power Generation• Segment-6, OthersUnallocable - All the segments other than segments identified above are collectively included in this segment. The ChiefOperating Decision Maker (“CODM”) of individual Companies evaluates the performance and allocates resources basedon an analysis of various performance indicators by operating segments. They reviews revenue and gross profit as theperformance indicator for all of the operating segments.
(b ) Following are reportable segments
Reportable segment Description
Extractions Various types of seed extractionsVanaspati Vanaspati, Bakery fats and Table spreadOils Crude oils, refined oilsFood Products Textured Soya protein and Soya flourWind Power Generation Electricity Generation from Wind Mills
(c ) Other Segement
Others Gram, Wheat, Rice, Maize, Corn, Seeds, Coffee, Marine Products, Tuar, Peas, Barley,Soap, Fresh Fruit Bunch, seedling Plant and Equipment , Cotton Bales, Toiletrypreparations and Cotton seed oil cake.
By products related to each segment have been included under the respective segment.Extraction is considered as the primary product resulting from the solvent extraction process and crude oil as the secondaryproduct. While computing segment results, all costs related to solvent extraction process are charged to the extractionsegment and recovery on account of crude oil is credited to the said segment. Credit for recovery of crude oil is taken onthe basis of average monthly market price.

Ruchi Soya Industries Limited
198
Notesto Consolidated Financial Statement for the Year Ended March 31, 2017
B.1. Information about reportable segments - Financial Year 2016-2017 (` in Lakh)Particulars Extractions Vanaspati Oils Food Wind Total All other Total
Products Turbine Reportable segmentPower Segment
Generation
SEGMENT REVENUE
External Revenue 1,28,396.03 73,990.43 14,23,982.15 56,333.33 4,781.65 16,87,483.59 2,29,805.27 19,17,288.85
Intersegment Sales 1,28,993.65 — 67,579.10 — 1,370.69 1,97,943.45 — 1,97,943.45Total Segment Revenue 2,57,389.68 73,990.43 14,91,561.26 56,333.33 6,152.33 18,85,427.03 2,29,805.27 21,15,232.30Segment Profit/ (Loss)before interest and taxes (1,916.29) 152.74 26,646.72 2,424.28 3,125.64 30,433.09 10,763.49 41,196.58Add: Interest income — — — — — — — 3,382.73Less: Finance cost — — — — — — — 93,290.62Add: Exceptional Items — — — — — — — 3,328.19Less: Unallocable expenses — — — — — — — 1,31,540.08Profit before tax (1,76,923.20)
SEGMENT ASSETS 1,79,999.77 29,228.84 5,01,387.88 17,495.53 40,679.21 7,68,791.23 1,80,578.01 9,49,369.24
SEGMENT LIABILITIES 11,633.02 30.02 4,21,208.67 842.67 — 4,33,714.38 27,443.50 4,61,157.89
B.2. Information about reportable segments-Financial Year 2015-2016 (` in Lakh)Particulars Extractions Vanaspati Oils Food Wind Total All other Total
Products Turbine Reportable segmentPower Segment
Generation
SEGMENT REVENUE
External Revenue 5,24,400.44 79,701.66 22,62,554.60 47,284.92 5,512.82 29,19,454.43 1,14,307.18 30,33,761.60
Intersegment Sales 1,69,191.39 — 64,482.47 — 1,162.84 2,34,836.70 — 2,34,836.70Total Segment Revenue 6,93,591.83 79,701.66 23,27,037.07 47,284.92 6,675.66 31,54,291.13 1,14,307.18 32,68,598.31Segment Profit/ (Loss)before interest and taxes (12,966.55) 205.37 94,763.84 3,163.65 2,671.93 87,838.24 (71,635.85) 16,202.39Add: Interest income — — — — — — — 6,213.01Less: Interest / Finance cost — — — — — — — 1,36,116.84Add: Exceptional Items — — — — — — — 238.98Less: Unallocable expenses — — — — — — — 25,448.46Profit before tax (1,38,910.92)
SEGMENT ASSETS 3,42,879.28 35,543.05 7,50,441.57 16,843.20 42,790.65 11,88,497.75 1,23,703.70 13,12,201.46
SEGMENT LIABILITIES 83,815.80 46.83 5,05,790.72 551.21 — 5,90,204.56 34,824.57 6,25,029.13
NOTE-40 SEGMENT REPORTING (Contd.)
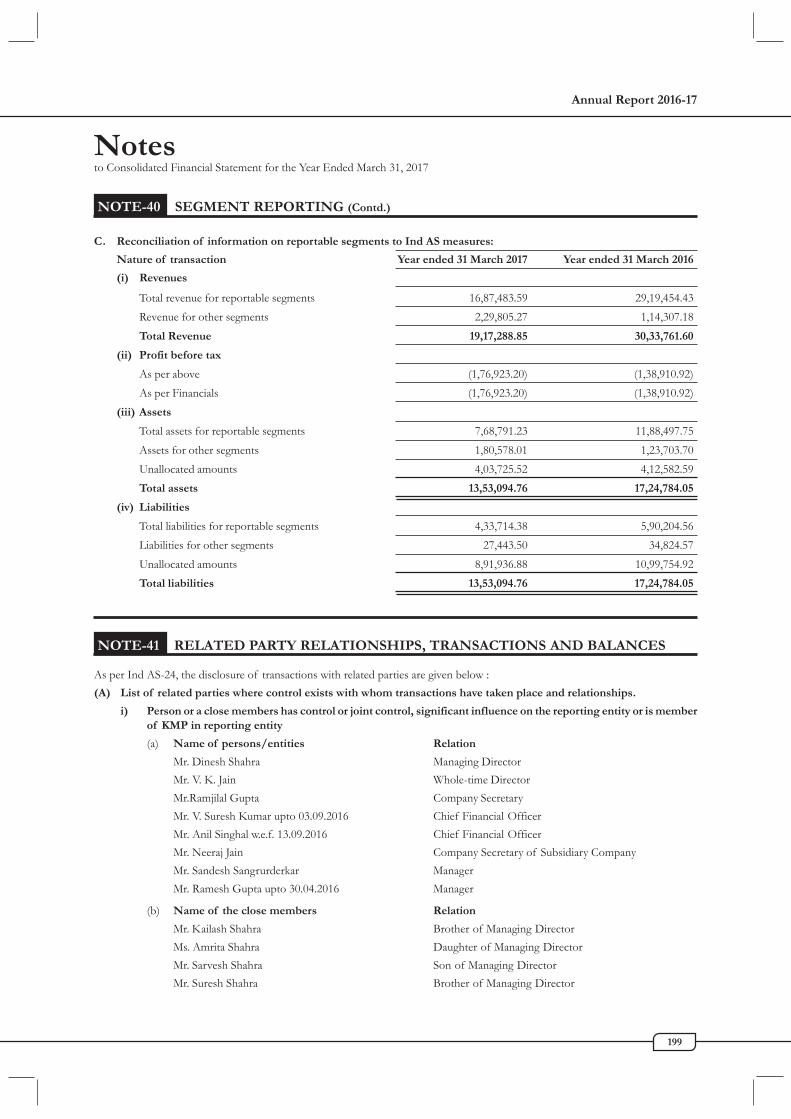
Annual Report 2016-17
199
Notesto Consolidated Financial Statement for the Year Ended March 31, 2017
C. Reconciliation of information on reportable segments to Ind AS measures:
Nature of transaction Year ended 31 March 2017 Year ended 31 March 2016
(i) Revenues
Total revenue for reportable segments 16,87,483.59 29,19,454.43Revenue for other segments 2,29,805.27 1,14,307.18Total Revenue 19,17,288.85 30,33,761.60
(ii) Profit before tax
As per above (1,76,923.20) (1,38,910.92)As per Financials (1,76,923.20) (1,38,910.92)
(iii) Assets
Total assets for reportable segments 7,68,791.23 11,88,497.75Assets for other segments 1,80,578.01 1,23,703.70Unallocated amounts 4,03,725.52 4,12,582.59Total assets 13,53,094.76 17,24,784.05
(iv) Liabilities
Total liabilities for reportable segments 4,33,714.38 5,90,204.56Liabilities for other segments 27,443.50 34,824.57Unallocated amounts 8,91,936.88 10,99,754.92Total liabilities 13,53,094.76 17,24,784.05
NOTE-40 SEGMENT REPORTING (Contd.)
As per Ind AS-24, the disclosure of transactions with related parties are given below :(A) List of related parties where control exists with whom transactions have taken place and relationships.
i) Person or a close members has control or joint control, significant influence on the reporting entity or is memberof KMP in reporting entity
(a) Name of persons/entities Relation
Mr. Dinesh Shahra Managing DirectorMr. V. K. Jain Whole-time DirectorMr.Ramjilal Gupta Company SecretaryMr. V. Suresh Kumar upto 03.09.2016 Chief Financial OfficerMr. Anil Singhal w.e.f. 13.09.2016 Chief Financial OfficerMr. Neeraj Jain Company Secretary of Subsidiary CompanyMr. Sandesh Sangrurderkar ManagerMr. Ramesh Gupta upto 30.04.2016 Manager
(b) Name of the close members Relation
Mr. Kailash Shahra Brother of Managing DirectorMs. Amrita Shahra Daughter of Managing DirectorMr. Sarvesh Shahra Son of Managing DirectorMr. Suresh Shahra Brother of Managing Director
NOTE-41 RELATED PARTY RELATIONSHIPS, TRANSACTIONS AND BALANCES

Ruchi Soya Industries Limited
200
Notesto Consolidated Financial Statement for the Year Ended March 31, 2017
Mrs. Abha Devi Shahra Wife of Managing DirectorMr. Ankesh Shahra Son of Managing DirectorMs. Amisha Shahra Daughter of Managing DirectorMrs. Vidhyadevi Khandelwal Sister of Managing Director
(ii) (a) One entity is an associate or joint venture of the other entity
Name of persons/entities Relation
Ruchi Hi-rich Seeds Pvt Ltd Associate of SubsidiaryRuchi J-Oil Private Limited Joint VentureGHI Energy Private Limited AssociateIndian Oil Ruchi Biofuels LLP Joint VentureRuchi Kagome Foods India Pvt. Ltd (upto 12.05.2016) Associate
(iii) The entity is controlled or jointly controlled by a person identified in (i)
Name of persons/entities
Shahra Brothers Private LimitedMahadeo Shahra & SonsHigh Tech Realty Pvt. Ltd.Disha Foundation TrustMahakosh Holdings Pvt. Ltd.Shahra Estate Private LimitedRuchi Biofuels Pvt. Ltd.Dinesh Shahra HUFKailash Shahra HUFSuresh Shahra HUFSantosh Shahra HUFRuchi Infrastructure Limited (upto 08.04.2016)Mahadeo Shahra Sukrat Trust
(iv) Others
Mr. Navin Khandelwal Independent DirectorMr. Prabhu Dayal Dwivedi Independent DirectorMr. N. Murugan Independent DirectorMrs. Meera Dinesh Rajda Independent DirectorMr. Sajeve Deora upto 21.04.2016 Independent Director

Annual Report 2016-17
201
Notesto Consolidated Financial Statement for the Year Ended March 31, 2017
Det
ails
of
Rel
ated
Par
ty T
rans
actio
ns :
(B)
(i)
Pers
on o
r a c
lose
mem
bers
has
con
trol
or j
oint
con
trol
, sig
nific
ant i
nflu
ence
on
the
repo
rtin
g en
tity
or is
mem
ber o
f K
MP
in r
epor
ting
entit
y(`
in L
akh)
Perso
nsCl
ose M
embe
rs
Parti
cular
s M
r. Dine
shMr
. V. K
.Mr
. Ram
jilal
Mr. V
. Sure
shMr
. Anil
Mr. N
eeraj
Mr. R
amesh
Mr. S
ande
shTo
talMr
. Kail
ashMs
. Amr
itaMr
. Sarv
eshMr
. Sur
eshMr
s. Ab
hade
viMr
. Ank
eshMi
ss Am
isha
Mrs.
Vidh
yaTo
talSh
ahra
Jain
Gup
ta K
umar
Sing
hal
Jain
Gupta
Sang
urdek
arSh
ahra
Shah
raSh
ahra
Shah
raSh
ahra
Shah
raSh
ahra
Devi
EXP
ENSE
S:
Remu
nerat
ion In
cludin
g Perk
s 15
8.71
44.85
58.25
41.60
39.51
6.72
5.66
15.92
371.2
2 -
- 23
.89 -
- -
- -
23.89
(251.7
0) (3
4.43)
(50.6
4) (1
13.97
) -
(6.53
) -
(3.93
) (4
61.19
) (-)
(-) (7
8.67)
(-) (-)
(-) (-)
(-) (7
8.67)
Sittin
g Fee
Paid
- -
- -
- -
- -
- 0.
25 -
- -
- -
- -
0.25
(-) (-)
(-) (-)
(-) (-)
(-) (-)
- (0
.30)
(-) (-)
(-) (-)
(-) (-)
(-) (0
.30)
Divid
end P
aid -
- -
- -
- -
- -
- -
- -
- -
- -
-
(3.38
) (-)
(0.05
) (0
.04)
(-) (-)
(-) (-)
(3.48
) (0
.32)
(4.19
) (8
.49)
(0.41
) (6
.13)
(5.38
) (4
.85)
(-) (2
9.77)
Rent
Paid
0.90
- -
- -
- -
- 0.
90 -
- 0.
53 -
4.50
0.53
- -
5.55
(0.90
) (-)
(-) (-)
(-) (-)
(-) (-)
(0.90
) (-)
(-) (0
.90)
(-) (2
7.00)
(0.90
) (-)
(-) (2
8.80)
AM
OUN
T RE
CEIV
ABLE
Advan
ces -
- 0.
50 -
8.88
- -
- 9.
38 -
- -
- -
- -
- -
(-) (-)
(0.34
) (-)
(-) (-)
(-) (-)
(0.34
) (-)
(-) (-)
(-) (-)
(-) (-)
(-) -
Othe
r Rece
ivable
(Den
otes e
xcess
remun
aratio
n reco
verabl
e) -
- -
- -
- -
- -
- -
- -
- -
- -
-
(74.9
1) (-)
(-) (-)
(-) (-)
(-) (-)
(74.9
1) (-)
(-) (-)
(-) (-)
(-) (-)
(-) -
AMO
UNT
PAYA
BLE
Sittin
g Fees
- -
- -
- -
- -
- 0.
15 -
- -
- -
- -
0.15
(-) (-)
(-) (-)
(-) (-)
(-) (-)
- (-)
(-) (-)
(-) (-)
(-) (-)
(-) -
Othe
r Liab
ilities
- 5.
75 4.
18 -
6.77
- -
- 16
.71 -
- -
- -
- -
- -
(-) (4
.23)
(4.13
) (-)
- (-)
(-) (-)
(8.37
) (-)
(-) (-)
(-) (-)
(-) (-)
(-) -
Non T
rade P
ayable
s 11
6.97
0.15
- -
- -
- 0.
05 11
7.17
3.50
- 5.
08 -
- -
- -
8.58
(89.58
) (0
.45)
(-) (1
.69)
(-) (-)
(-) (0
.01)
(91.7
2) (3
.77)
(-) (-)
(-) (-)
(-) (-)
(-) (3
.77)
Trade
Payab
les -
- -
- -
- -
- -
- -
- -
- -
- -
-
(-) (-)
(-) (-)
(-) (-)
(-) (-)
- (-)
(-) (-)
(-) (-)
(-) (-)
(-) -
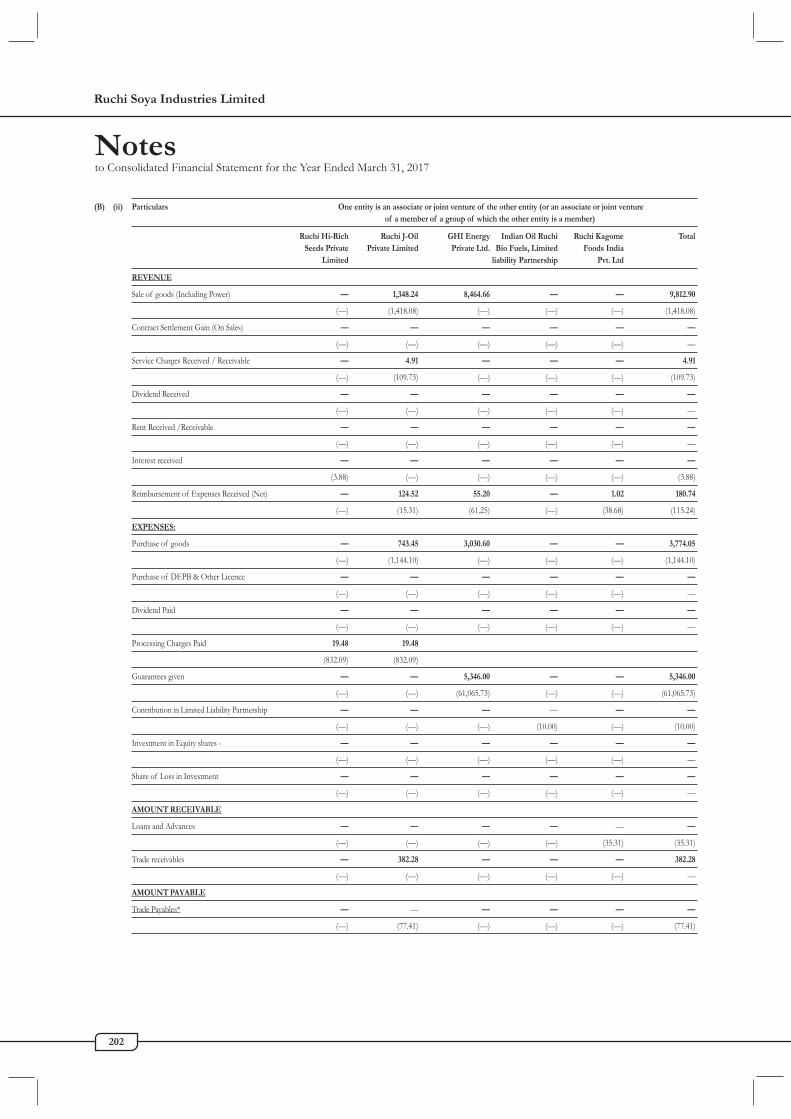
Ruchi Soya Industries Limited
202
(B) (ii) Particulars One entity is an associate or joint venture of the other entity (or an associate or joint ventureof a member of a group of which the other entity is a member)
Ruchi Hi-Rich Ruchi J-Oil GHI Energy Indian Oil Ruchi Ruchi Kagome TotalSeeds Private Private Limited Private Ltd. Bio Fuels, Limited Foods India
Limited liability Partnership Pvt. Ltd
REVENUE
Sale of goods (Including Power) — 1,348.24 8,464.66 — — 9,812.90
(—) (1,418.08) (—) (—) (—) (1,418.08)
Contract Settlement Gain (On Sales) — — — — — —
(—) (—) (—) (—) (—) —
Service Charges Received / Receivable — 4.91 — — — 4.91
(—) (109.73) (—) (—) (—) (109.73)
Dividend Received — — — — — —
(—) (—) (—) (—) (—) —
Rent Received /Receivable — — — — — —
(—) (—) (—) (—) (—) —
Interest received — — — — — —
(3.88) (—) (—) (—) (—) (3.88)
Reimbursement of Expenses Received (Net) — 124.52 55.20 — 1.02 180.74
(—) (15.31) (61.25) (—) (38.68) (115.24)
EXPENSES:
Purchase of goods — 743.45 3,030.60 — — 3,774.05
(—) (1,144.10) (—) (—) (—) (1,144.10)
Purchase of DEPB & Other Licence — — — — — —
(—) (—) (—) (—) (—) —
Dividend Paid — — — — — —
(—) (—) (—) (—) (—) —
Processing Charges Paid 19.48 19.48
(832.09) (832.09)
Guarantees given — — 5,346.00 — — 5,346.00
(—) (—) (61,065.73) (—) (—) (61,065.73)
Contribution in Limited Liability Partnership — — — — — —
(—) (—) (—) (10.00) (—) (10.00)
Investment in Equity shares - — — — — — —
(—) (—) (—) (—) (—) —
Share of Loss in Investment — — — — — —
(—) (—) (—) (—) (—) —
AMOUNT RECEIVABLE
Loans and Advances — — — — — —
(—) (—) (—) (—) (35.31) (35.31)
Trade receivables — 382.28 — — — 382.28
(—) (—) (—) (—) (—) —
AMOUNT PAYABLE
Trade Payables* — — — — — —
(—) (77.41) (—) (—) (—) (77.41)
Notesto Consolidated Financial Statement for the Year Ended March 31, 2017
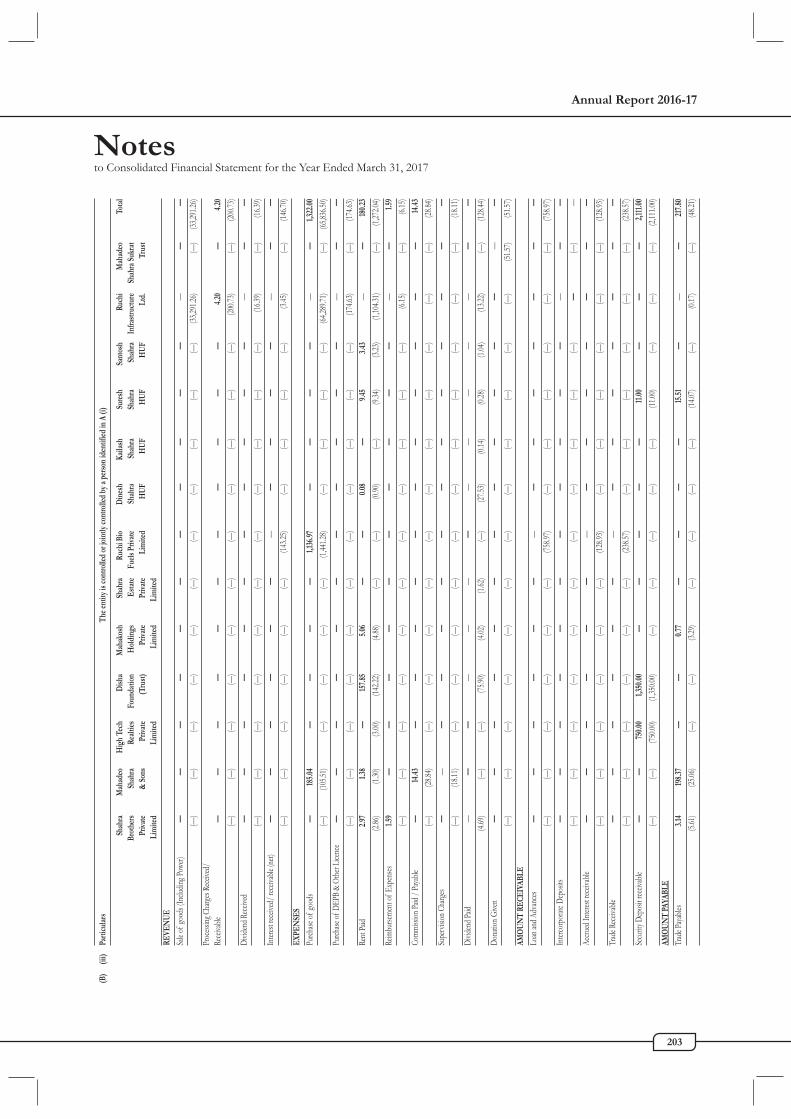
Annual Report 2016-17
203
Notesto Consolidated Financial Statement for the Year Ended March 31, 2017
(B)
(iii)
Parti
cula
rs T
he en
tity i
s con
trolle
d or
join
tly co
ntro
lled
by a
pers
on id
entif
ied
in A
(i)
Shah
raM
ahad
eoH
igh
Tech
Dish
aM
ahak
osh
Shah
raRu
chi B
ioD
ines
hKa
ilash
Sure
shSa
ntos
hRu
chi
Mah
adeo
Tota
lBr
othe
rs S
hahr
a R
ealti
esFo
unda
tion
Hol
ding
sEs
tate
Fuels
Priv
ate
Shah
raSh
ahra
Shah
raSh
ahra
Infra
struc
ture
Shah
ra S
ukra
tPr
ivate
& S
ons
Priva
te (T
rust)
Priva
tePr
ivate
Lim
ited
HU
FH
UF
HU
FH
UF
Ltd.
Trus
tLi
mite
dLi
mite
d L
imite
dLi
mite
d
REVE
NU
E
Sale
of go
ods (
Inclu
ding P
ower)
— —
— —
— —
— —
— —
— —
— —
(—)
(—)
(—)
(—)
(—)
(—)
(—)
(—)
(—)
(—)
(—)
(33,2
91.26
) (—
) (3
3,291
.26)
Proc
essing
Cha
rges R
eceive
d/Re
ceiva
ble —
— —
— —
— —
— —
— —
4.20
— 4.
20
(—)
(—)
(—)
(—)
(—)
(—)
(—)
(—)
(—)
(—)
(—)
(200
.73)
(—)
(200
.73)
Divid
end R
eceive
d —
— —
— —
— —
— —
— —
— —
—
(—)
(—)
(—)
(—)
(—)
(—)
(—)
(—)
(—)
(—)
(—)
(16.3
9) (—
) (1
6.39)
Inter
est re
ceive
d/ re
ceiva
ble (n
et) —
— —
— —
— —
— —
— —
— —
—
(—)
(—)
(—)
(—)
(—)
(—)
(143
.25)
(—)
(—)
(—)
(—)
(3.45
) (—
) (1
46.70
)EX
PEN
SES
Purch
ase of
good
s —
185.0
4 —
— —
— 1,
136.9
7 —
— —
— —
— 1,
322.0
0
(—)
(105
.51)
(—)
(—)
(—)
(—)
(1,44
1.28)
(—)
(—)
(—)
(—)
(64,2
89.71
) (—
) (6
5,836
.50)
Purch
ase of
DEP
B &
Othe
r Lice
nce
— —
— —
— —
— —
— —
— —
— —
(—)
(—)
(—)
(—)
(—)
(—)
(—)
(—)
(—)
(—)
(—)
(174
.63)
(—)
(174
.63)
Rent
Paid
2.97
1.38
— 15
7.85
5.06
— —
0.08
— 9.
45 3.
43 —
— 18
0.23
(2.86
) (1
.30)
(3.00
) (1
42.22
) (4
.88)
(—)
(—)
(0.90
) (—
) (9
.34)
(3.23
) (1
,104.3
1) (—
) (1
,272.0
4)Re
imbu
rseme
nt of
Exp
enses
1.59
— —
— —
— —
— —
— —
— —
1.59
(—)
(—)
(—)
(—)
(—)
(—)
(—)
(—)
(—)
(—)
(—)
(6.15
) (—
) (6
.15)
Comm
ission
Paid
/ Paya
ble —
14.43
— —
— —
— —
— —
— —
— 14
.43
(—)
(28.8
4) (—
) (—
) (—
) (—
) (—
) (—
) (—
) (—
) (—
) (—
) (—
) (2
8.84)
Supe
rvisio
n Cha
rges
— —
— —
— —
— —
— —
— —
— —
(—)
(18.1
1) (—
) (—
) (—
) (—
) (—
) (—
) (—
) (—
) (—
) (—
) (—
) (1
8.11)
Divid
end P
aid —
— —
— —
— —
— —
— —
— —
—
(4.69
) (—
) (—
) (7
5.90)
(4.02
) (1
.62)
(—)
(27.5
3) (0
.14)
(0.28
) (1
.04)
(13.2
2) (—
) (1
28.44
)Do
natio
n Give
n —
— —
— —
— —
— —
— —
— —
—
(—)
(—)
(—)
(—)
(—)
(—)
(—)
(—)
(—)
(—)
(—)
(—)
(51.5
7) (5
1.57)
AMO
UN
T RE
CEIV
ABLE
Loan
and A
dvan
ces —
— —
— —
— —
— —
— —
— —
—
(—)
(—)
(—)
(—)
(—)
(—)
(758
.97)
(—)
(—)
(—)
(—)
(—)
(—)
(758
.97)
Inter
corp
orate
Depo
sits
— —
— —
— —
— —
— —
— —
— —
(—)
(—)
(—)
(—)
(—)
(—)
(—)
(—)
(—)
(—)
(—)
— (—
) —
Accru
ed In
terest
recei
vable
— —
— —
— —
— —
— —
— —
— —
(—)
(—)
(—)
(—)
(—)
(—)
(128
.93)
(—)
(—)
(—)
(—)
(—)
(—)
(128
.93)
Trad
e Rece
ivable
— —
— —
— —
— —
— —
— —
— —
(—)
(—)
(—)
(—)
(—)
(—)
(238
.57)
(—)
(—)
(—)
(—)
(—)
(—)
(238
.57)
Secu
rity D
epos
it rece
ivable
— —
750.0
0 1,
350.0
0 —
— —
— —
11.00
— —
— 2,
111.0
0
(—)
(—)
(750
.00)
(1,35
0.00)
(—)
(—)
(—)
(—)
(—)
(11.0
0) (—
) (—
) (—
) (2
,111.0
0)AM
OU
NT
PAYA
BLE
Trad
e Paya
bles
3.14
198.3
7 —
— 0.
77 —
— —
— 15
.51 —
— —
217.8
0
(5.61
) (2
5.06)
(—)
(—)
(3.29
) (—
) (—
) (—
) (—
) (1
4.07)
(—)
(0.17
) (—
) (4
8.21)

Ruchi Soya Industries Limited
204
Notesto Consolidated Financial Statement for the Year Ended March 31, 2017
(B) (iv) Others : (` in Lakh)
Particulars OthersMr. Navin Mr. Prabhu Lal Mr. N. Mrs. Meera Mr. Sajeve Total
Khandelwal Dwivedi Murugan Dinesh Rajda DeoraEXPENSES:Remuneration Including Perks - - - - - -
(-) (-) (-) (-) (-) -Sitting Fee Paid 0.80 1.10 0.40 0.10 - 2.40
(0.60) (1.25) (0.65) (0.20) (0.55) (3.25)Dividend Paid - - - - - -
(-) (-) (-) (-) (-) -Rent Paid - - - - - -
(-) (-) (-) (-) (-) -AMOUNT RECEIVABLEAdvances - - - - - -
(-) (-) (-) (-) (0.05) (0.05)Other Receivable (Denotes excessremunaration recoverable) - - - - - -
(-) (-) (-) (-) (-) -AMOUNT PAYABLESitting Fees 0.05 0.35 - - - 0.40
(0.14) (0.14) (0.14) (-) (-) (0.41)Other Liabilities - - - - - -
(-) (-) (-) (-) (-) -Non Trade Payables - - 0.02 - - 0.02
(-) (-) (0.02) (-) (-) (0.02)Trade Payables - - - - - -
(-) (-) (-) (-) (-) -

Annual Report 2016-17
205
Notesto Consolidated Financial Statement for the Year Ended March 31, 2017
NOTE-42 EARNINGS PER SHARE (EPS)
Basic EPS is calculated by dividing the profit/loss for the year attributable to equity holders by the weighted average number ofEquity shares outstanding during the year.Diluted EPS is calculated by dividing the profit/loss for the year attributable to equity holders by the weighted average number ofEquity shares outstanding during the year plus the weighted average number of Equity shares that would be issued on conversion ofall the dilutive potential Equity shares into Equity shares.i. Profit attributable to Equity holders (` in Lakh)
March 31, 2017 March 31, 2016
Profit /(Loss) attributable to equity holders (1,31,167.63) (1,27,360.32)Profit/(Loss) attributable to equity holders of the for basic earnings (1,31,167.63) (1,27,360.32)
Expenses directly charged to Reserves (19,264.76) (4,725.59)Profit/(Loss) attributable to equity holders After Exceptional Items (1,50,432.39) (1,32,085.91)
– Less : Exceptional Items (net of tax) 3,328.19 238.98Profit/(Loss) attributable to equity holders before Exceptional Items (1,53,760.58) (1,32,324.89)
ii. Weighted average number of ordinary shares
March 31, 2017 March 31, 2016
Opening ordinary shares [Refer SOCIE] (in lakh) 3,264.71 3,264.30Weighted Average Effect of Shares issued under Employee Stockoption during the year — 0.34Weighted average number of shares for Basic EPS (in lakh) 3,264.71 3,264.64
Effect of dilution:
Share options — —Weighted average number of shares for Dilutive EPS (in lakh) 3,264.71 3,264.64
Basic and Diluted earnings per share before Exceptional Items
March 31, 2017 March 31, 2016
Basic ( in `̀̀̀̀) (47.10) (40.53)Diluted ( in `̀̀̀̀) (47.10) (40.53)
Basic and Diluted earnings per share After Exceptional Items
March 31, 2017 March 31, 2016
Basic ( in `̀̀̀̀) (46.08) (40.46)Diluted ( in `̀̀̀̀) (46.08) (40.46)
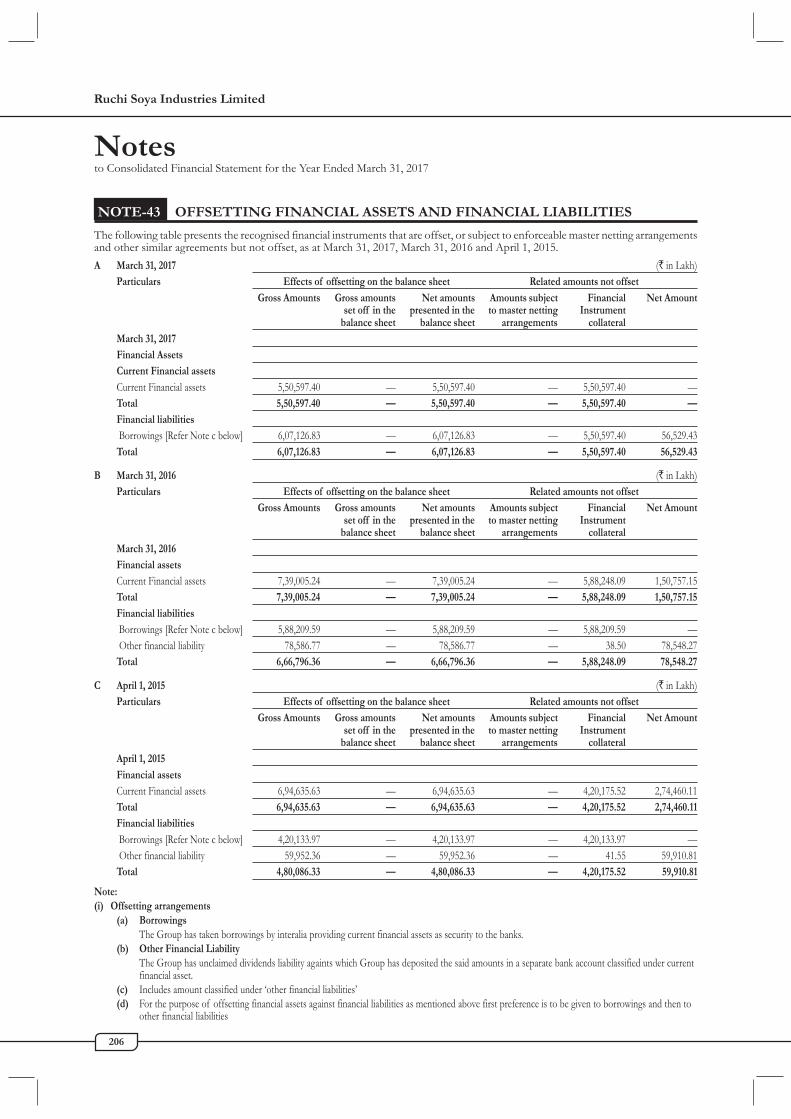
Ruchi Soya Industries Limited
206
Notesto Consolidated Financial Statement for the Year Ended March 31, 2017
NOTE-43 OFFSETTING FINANCIAL ASSETS AND FINANCIAL LIABILITIES
The following table presents the recognised financial instruments that are offset, or subject to enforceable master netting arrangementsand other similar agreements but not offset, as at March 31, 2017, March 31, 2016 and April 1, 2015.A March 31, 2017 (` in Lakh)
Particulars Effects of offsetting on the balance sheet Related amounts not offsetGross Amounts Gross amounts Net amounts Amounts subject Financial Net Amount
set off in the presented in the to master netting Instrumentbalance sheet balance sheet arrangements collateral
March 31, 2017Financial AssetsCurrent Financial assetsCurrent Financial assets 5,50,597.40 — 5,50,597.40 — 5,50,597.40 —Total 5,50,597.40 — 5,50,597.40 — 5,50,597.40 —Financial liabilities Borrowings [Refer Note c below] 6,07,126.83 — 6,07,126.83 — 5,50,597.40 56,529.43Total 6,07,126.83 — 6,07,126.83 — 5,50,597.40 56,529.43
B March 31, 2016 (` in Lakh)Particulars Effects of offsetting on the balance sheet Related amounts not offset
Gross Amounts Gross amounts Net amounts Amounts subject Financial Net Amountset off in the presented in the to master netting Instrument
balance sheet balance sheet arrangements collateralMarch 31, 2016Financial assetsCurrent Financial assets 7,39,005.24 — 7,39,005.24 — 5,88,248.09 1,50,757.15Total 7,39,005.24 — 7,39,005.24 — 5,88,248.09 1,50,757.15Financial liabilities Borrowings [Refer Note c below] 5,88,209.59 — 5,88,209.59 — 5,88,209.59 — Other financial liability 78,586.77 — 78,586.77 — 38.50 78,548.27Total 6,66,796.36 — 6,66,796.36 — 5,88,248.09 78,548.27
C April 1, 2015 (` in Lakh)Particulars Effects of offsetting on the balance sheet Related amounts not offset
Gross Amounts Gross amounts Net amounts Amounts subject Financial Net Amountset off in the presented in the to master netting Instrument
balance sheet balance sheet arrangements collateralApril 1, 2015Financial assetsCurrent Financial assets 6,94,635.63 — 6,94,635.63 — 4,20,175.52 2,74,460.11Total 6,94,635.63 — 6,94,635.63 — 4,20,175.52 2,74,460.11Financial liabilities Borrowings [Refer Note c below] 4,20,133.97 — 4,20,133.97 — 4,20,133.97 — Other financial liability 59,952.36 — 59,952.36 — 41.55 59,910.81Total 4,80,086.33 — 4,80,086.33 — 4,20,175.52 59,910.81
Note:(i) Offsetting arrangements
(a) BorrowingsThe Group has taken borrowings by interalia providing current financial assets as security to the banks.
(b) Other Financial LiabilityThe Group has unclaimed dividends liability againts which Group has deposited the said amounts in a separate bank account classified under currentfinancial asset.
(c) Includes amount classified under ‘other financial liabilities’(d) For the purpose of offsetting financial assets against financial liabilities as mentioned above first preference is to be given to borrowings and then to
other financial liabilities

Annual Report 2016-17
207
Notesto Consolidated Financial Statement for the Year Ended March 31, 2017
NOTE-44 HEDGE ACCOUNTING
Inte
rest
rate
risk
The G
roup
’s risk
man
agem
ent p
olicy
is to
ensu
re th
at ma
jority
of its
forei
gn cu
rrenc
y loa
ns re
lated
inter
est ra
te ex
posu
re is
at fix
ed ra
te. T
his is
achie
ved b
y usin
g int
erest
rate s
waps
to he
dge f
loatin
g rate
forei
gncu
rrenc
y bor
rowi
ngs. T
he G
roup
appli
es a h
edge
ratio
of 1:
1.A.
Dis
clos
ure
of e
ffect
s of
hedg
e ac
coun
ting
on fi
nanc
ial p
ositi
on(i)
Mar
ch 3
1, 20
17(`
in La
kh)
Type
of
hedg
e an
d ris
ksN
omin
al V
alue
Carr
ying
amou
nt o
fLi
ne it
em in
the
stat
emen
t of
Mat
urity
dat
eH
edge
ratio
Chan
ges i
n fa
ir(in
USD
)he
dgin
g in
stru
men
tfin
anci
al p
ositi
on w
here
the
hedg
ing
valu
ein
stru
men
t is i
nclu
ded
Cash
flow
hed
geAs
sets
Liab
ilitie
sAs
sets
Liab
ilitie
sIn
terest
rate
swap
sLi
abili
ties
N.A.
N.A
* 20
0.30
-Ot
her n
on-cu
rrent
finan
cial li
abilit
ies -
Othe
r curr
ent f
inanc
ial lia
bilitie
sTo
tal
-20
0.30
(ii)
Mar
ch 3
1, 20
16(`
in La
kh)
Type
of
hedg
e an
d ris
ksN
omin
al V
alue
Carr
ying
amou
nt o
fLi
ne it
em in
the
stat
emen
t of
Mat
urity
dat
eH
edge
ratio
Chan
ges i
n fa
ir(in
USD
)he
dgin
g in
stru
men
tfin
anci
al p
ositi
on w
here
the
hedg
ing
valu
ein
stru
men
t is i
nclu
ded
Cash
flow
hed
geAs
sets
Liab
ilitie
sAs
sets
Liab
ilitie
sIn
terest
rate
swap
sLi
abili
ties
2016
-2018
App
roxim
ately
344.2
6 -
62Ot
her n
on-cu
rrent
finan
cial li
abilit
ies1:1
138.1
0Ot
her c
urren
t fina
ncial
liabil
ities
Tota
l 2
00.3
034
4.26
(iii)
April
1, 2
015
(` in
Lakh
)Ty
pe o
f he
dge
and
risks
Nom
inal
Val
ueCa
rryi
ng am
ount
of
Line
item
in th
e st
atem
ent o
fM
atur
ity d
ate
Hed
ge ra
tioCh
ange
s in
fair
(in U
SD)
hedg
ing
inst
rum
ent
finan
cial
pos
ition
whe
re th
e he
dgin
gva
lue
inst
rum
ent i
s inc
lude
d
Cash
flow
hed
geAs
sets
Liab
ilitie
sAs
sets
Liab
ilitie
sIn
terest
rate
swap
sLi
abili
ties
2015
-2018
App
roxim
ately
16.58
1,19
2.60
307.2
0Ot
her n
on-cu
rrent
finan
cial li
abilit
ies1:1
237.3
6Ot
her c
urren
t fina
ncial
liabil
ities
Tota
l54
4.56
16.5
8

Ruchi Soya Industries Limited
208
Notesto Consolidated Financial Statement for the Year Ended March 31, 2017
b(i)
.D
iscl
osur
e of
effe
cts o
f he
dge
acco
untin
g on
fina
ncia
l per
form
ance
as o
n M
arch
31,
2017
Part
icul
ars
Chan
ge in
the
valu
e of
Hed
ge in
effe
ctiv
enes
sLi
ne it
em in
the
stat
emen
tAm
ount
recl
assi
fied
from
Line
item
affe
cted
in st
atem
ent
the
hedg
ing
inst
rum
ent
reco
gnis
ed in
pro
fitof
pro
fit o
r los
s tha
t inc
lude
sca
sh fl
ow h
edgi
ng re
serv
eof
pro
fit o
r los
s bec
ause
of
the
reco
gnis
ed in
OCI
or lo
ssth
e he
dge
inef
fect
iven
ess
to p
rofit
or l
oss
recl
assi
ficat
ion
Cash
flow
hedg
e 20
0.30
- N
A 20
0.30
Fina
nce c
ost
(ii).
Dis
clos
ure
of e
ffect
s of
hedg
e ac
coun
ting
on fi
nanc
ial p
erfo
rman
ce a
s on
Mar
ch 3
1, 20
16
Part
icul
ars
Chan
ge in
the
valu
e of
Hed
ge in
effe
ctiv
enes
sLi
ne it
em in
the
stat
emen
tAm
ount
recl
assi
fied
from
Line
item
affe
cted
in st
atem
ent
the
hedg
ing
inst
rum
ent
reco
gnis
ed in
pro
fitof
pro
fit o
r los
s tha
t inc
lude
sca
sh fl
ow h
edgi
ng re
serv
eof
pro
fit o
r los
s bec
ause
of
the
reco
gnis
ed in
OCI
or lo
ssth
e he
dge
inef
fect
iven
ess
to p
rofit
or l
oss
recl
assi
ficat
ion
Cash
flow
hedg
e 34
4.27
- N
A 34
4.26
Fina
nce c
ost
C.
The
follo
win
g ta
ble
prov
ides
a re
conc
iliat
ion
by ri
sk c
ateg
ory
of c
ompo
nent
s of
equi
ty a
nd a
naly
sis o
f O
CI it
ems,
net o
f ta
x, re
sulti
ng fr
om c
ash
flow
hed
ge a
ccou
ntin
g
Mov
emen
ts in
cas
h flo
w h
edgi
ng re
serv
eAs
at
As a
tM
arch
31,
2017
Mar
ch 3
1, 20
16O
peni
ng B
alan
ce (2
00.3
0) (5
44.5
6)Ad
d : C
hang
es in
the f
air va
lue of
effec
tive p
ortio
n of o
utstan
ding c
ash flo
w de
rivati
ve (n
et of
settl
emen
t)—
—Le
ss : A
moun
ts rec
lassif
ied to
Prof
it and
Los
s 20
0.30
344.2
6Le
ss: D
eferre
d tax
relat
ing to
the a
bove
— —
Clos
ing
Bala
nce
(0.0
0) (2
00.3
0)
D.Th
e cor
respo
nding
deriv
ative
liabil
ity ha
s bee
n disc
losed
unde
r Oth
er No
n Cur
rent f
inanc
ial lia
blity
in No
te 13
b and
Oth
er cu
rrent
finan
cial L
iabliti
es in
Note
17c.
Not
e: *
Since
term
inated
prior
to th
e matu
rity d
ate.
NOTE-44 HEDGE ACCOUNTING (Contd.)

Annual Report 2016-17
209
Notesto Consolidated Financial Statement for the Year Ended March 31, 2017
A. Accounting classification and fair valuesThe following table shows the carrying amounts and fair values of financial assets and financial liabilities, including their levelsin the fair value hierarchy.A substantial portion of the Group’s long-term debt has been contracted at floating rates of interest, which are reset at shortintervals. Accordingly, the carrying value of such long-term debt approximates fair value.
Carrying amount Fair Value(i) March 31, 2017 Notes FVTPL FVTOCI Total Amortised Total Level 1 Level 2 Level 3 Total
(` in Lakh) Fair Value CostNon-current assetsFinancial Assets(i) Investments 5(a) — 1,636.69 1,636.69 4,019.68 5,656.37 1,395.12 — 241.57 1,636.69(ii) Loans 5(b) — — — 6,559.01 6,559.01 — — — —(ii) Others 5(c) — — — 951.32 951.32 — — — —Current assetsFinancial Assets(i) Investments 8(a) 100.22 — 100.22 8.37 108.59 100.22 — — 100.22(ii) Trade receivables 8(b) — — — 5,28,465.34 5,28,465.34 — — — —(iii) Cash and cash equivalents 8(c) — — — 9,837.65 9,837.65 — — — —(iv) Bank balances
other than (iii) above 8(d) — — — 6,201.80 6,201.80 — — — —(v) Loans 8(e) — — — 1,149.60 1,149.60 — — — —(vi) Others 8(f) 4,128.64 — 4,128.64 705.78 4,834.42 4,128.64 — — 4,128.64
4,228.86 1,636.69 5,865.55 5,57,898.55 5,63,764.10 5,623.98 — 241.57 5,865.55Non-Current LiabilitiesFinancial Liabilities(i) Borrowings 13(a) — — — 7,972.14 7,972.14 — — — —(ii) Other financial liabilities 13(b) — — — 4.35 4.35 — — — —
Current liabilitiesFinancial Liabilities
(i) Borrowings 17(a) 5,25,124.33 — 5,25,124.33 — 5,25,124.33 — 5,25,124.33 — 5,25,124.33(ii) Trade payables 17(b) — — — 4,88,707.34 4,88,707.34 — — — —(iii) Other financial liabilities 17(c) 1,206.93 — 1,206.93 1,84,615.46 1,85,822.39 1,206.93 — — 1,206.93
5,26,331.26 — 5,26,331.26 6,81,299.29 12,07,630.55 1,206.93 5,25,124.33 — 5,26,331.26
Carrying amount Fair Value(i) March 31, 2016 Notes FVTPL FVTOCI Total Amortised Total Level 1 Level 2 Level 3 Total
(` in Lakh) Fair Value CostNon-current assetsFinancial Assets(i) Investments 5(a) — 2,367.19 2,367.19 6,607.94 8,975.13 2,125.62 — 241.57 2,367.19(ii) Loans 5(b) — — — 7,333.39 7,333.39 — — — —(ii) Others 5(c) — — — 1,148.93 1,148.93 — — — —Current assetsFinancial Assets(i) Investments 8(a) 82.56 — 82.56 7.25 89.81 82.56 — — 82.56(ii) Trade receivables 8(b) — — — 6,81,940.35 6,81,940.35 — — — —(iii) Cash and cash equivalents 8(c) — — — 23,919.14 23,919.14 — — — —(iv) Bank balances
other than (iii) above 8(d) — — — 7,398.61 7,398.61 — — — —(v) Loans 8(e) — — — 10,189.59 10,189.59 — — — —(vi) Others 8(f) 12,166.85 — 12,166.85 3,300.89 15,467.74 12,166.85 — — 12,166.85
12,249.41 2,367.19 14,616.60 7,41,846.09 7,56,462.69 14,375.03 — 241.57 14,616.60Non-Current LiabilitiesFinancial Liabilities(i) Borrowings 13(a) — — — 8,317.56 8,317.56 — — — —(ii) Other financial liabilities 13(b) — — — 847.43 847.43 — — — —
NOTE-45 FINANCIAL INSTRUMENTS – FAIR VALUES AND RISK MANAGEMENT

Ruchi Soya Industries Limited
210
Notesto Consolidated Financial Statement for the Year Ended March 31, 2017
Current liabilitiesFinancial Liabilities(i) Borrowings 17(a) 5,00,609.88 — 5,00,609.88 — 5,00,609.88 — 5,00,609.88 — 5,00,609.88(ii) Trade payables 17(b) — — — 6,27,604.34 6,27,604.34 — — — —(iii) Other financial liabilities 17(c) 76,716.14 — 76,716.14 81,214.98 1,57,931.12 76,716.14 — — 76,716.14
5,77,326.02 — 5,77,326.02 7,17,984.31 12,95,310.33 76,716.14 5,00,609.88 — 5,77,326.02
Carrying amount Fair Value
(iii) April 1, 2015 Notes FVTPL FVTOCI Total Amortised Total Level 1 Level 2 Level 3 Total(` in Lakh) Fair Value Cost
Non-current assetsFinancial Assets(i) Investments 5(a) — 2,726.05 2,726.05 6,884.26 9,610.31 2,491.38 — 234.67 2,726.05(ii) Loans 5(b) — — — 5,671.77 5,671.77 — — — —(ii) Others 5(c) — — — 1,083.61 1,083.61 — — — —Current assetsFinancial Assets(i) Investments 8(a) 84.32 — 84.32 6.88 91.20 84.32 — — 84.32(ii) Trade receivables 8(b) — — — 6,19,733.30 6,19,733.30 — — — —(iii) Cash and cash equivalents 8(c) — — — 7,078.31 7,078.31 — — — —(iv) Bank balances
other than (iii) above 8(d) — — — 46,462.25 46,462.25 — — — —(v) Loans 8(e) — — — 9,525.60 9,525.60 — — — —(vi) Others 8(f) 7,923.83 — 7,923.83 3,821.14 11,744.97 7,923.83 — — 7,923.83
8,008.15 2,726.05 10,734.20 7,00,267.12 7,11,001.32 10,499.53 — 234.67 10,734.20Non-Current LiabilitiesFinancial Liabilities(i) Borrowings 13(a) — — — 9,048.13 9,048.13 — — — —(ii) Other financial liabilities 13(b) — — — 1,204.99 1,204.99 — — — —Current liabilitiesFinancial Liabilities(i) Borrowings 17(a) 3,07,116.65 — 3,07,116.65 — 3,07,116.65 — 3,07,116.65 — 3,07,116.65(ii) Trade payables 17(b) — — — 6,47,786.50 6,47,786.50 — — — —(iii) Other financial liabilities 17(c) 58,013.59 — 58,013.59 1,06,215.16 1,64,228.75 479.90 57,533.69 — 58,013.59
3,65,130.24 — 3,65,130.24 7,64,254.78 11,29,385.02 479.90 3,64,650.34 — 3,65,130.24
NOTE-45 FINANCIAL INSTRUMENTS – FAIR VALUES AND RISK MANAGEMENT (Contd.)
B. Measurement of fair valuesValuation techniques and significant unobservable inputsFair values are categorised into different levels in a fair value hierarchy based on the inputs used in the valuation techniques as follows:Level 1: quoted prices (unadjusted) in active markets for identical assets or liabilities.Level 2: inputs other than quoted prices included in Level 1 that are observable for the asset or liability, either directly (i.e. as prices) or indirectly (i.e. derived from prices).Level 3: inputs for the asset or liability that are not based on observable market data (unobservable inputs).The following tables show the valuation techniques used in measuring Level 2 and Level 3 fair values, as well as the significant unobservable inputs used.Financial instruments measured at fair valueType Valuation techniqueCurrency Futures Based on exchange rates listed on NSE/MCX stock exchangeCommodity futures Based on commodity prices listed on MCX/NCDX/ACE stock exchangeForward contracts Based on FEDAI RatesInterest rate swaps Based on Closing Rates provided by BanksOpen purchase and sale contract Based on commodity prices listed on NCDEX stock exchange,and prices Available on Solvent Extractor’s association
(SEA) along with quotations from brokers and adjustments made for grade and location of commodityOptions Based on Closing Rates provided by Banks
Carrying amount Fair Value(i) March 31, 2016 Notes FVTPL FVTOCI Total Amortised Total Level 1 Level 2 Level 3 Total
(` in Lakh) Fair Value Cost

Annual Report 2016-17
211
Notesto Consolidated Financial Statement for the Year Ended March 31, 2017
NOTE-46 FINANCIAL INSTRUMENTS – FAIR VALUES AND RISK MANAGEMENT
Financial risk managementThe Group has exposure to the following risks arising from financial instruments:(i) Market risk
(a) Currency risk;(b) Interest rate risk;(c) Commodity Risk;(d) Equity Risk;
(ii) Credit risk; and(iii) Liquidity risk;
Risk management framework
The Group’s activities expose it to a variety of financial risks, including market risk, credit risk and liquidity risk. The Group’sprimary risk management focus is to minimize potential adverse effects of risks on its financial performance. The Group’s riskmanagement assessment and policies and processes are established to identify and analyze the risks faced by the Group, to setappropriate risk limits and controls, and to monitor such risks and compliance with the same. These policies and processes arereviewed regularly to reflect changes in market conditions and the Group’s activities.
Market risk
Market risk is the risk of changes the market prices on account of foreign exchange rates, interest rates and Commodity prices,which shall affect the Group’s income or the value of its holdings of its financial instruments . The objective of market riskmanagement is to manage and control market risk exposure within acceptable parameters, while optimising the returns.
Currency risk
The fluctuation in foreign currency exchange rates may have potential impact on the profit and loss account, where any transaction hasmore than one currency or where assets/liabilities are denominated in a currency other than the functional currency of the entity.
i (b) Interest rate riskInterest rate risk is the risk that the fair value or future cash flows of a financial instrument will fluctuate because ofchanges in market interest rates. The Group’s exposure to market risk for changes in interest rates relates to borrowingsfrom financial institutions. The Group manages its interest rate risk arising from foreign currency floating rate loans byusing interest rate swaps as hedges of variability in cash flows attributable to interest rate risk.For details of the Group’s short-term and long term loans and borrowings, Refer to Note 13(a), 17(a) and 17 (c) of thesefinancial statements.Interest rate sensitivity - fixed rate instrumentsThe Group’s fixed rate borrowings Preference Shares issued to Ruchi Infrastructure Limited @ 6% in the year 2010-11are carried at amortised cost. They are therefore not subject to interest rate risk as defined in Ind AS 107, since neitherthe carrying amount nor the future cash flow will fluctuate because of a change in market interest rates.Interest rate sensitivity - variable rate instrumentsA reasonably possible change of 100 basis points in interest rates at the reporting date would have increased/decreasedequity and profit or loss by amounts shown below. This analysis assumes that all other variables, in particular, foreigncurrency exchange rates, remain constant. This calculation also assumes that the change occurs at the balance sheet dateand has been calculated based on risk exposures outstanding as at that date. The period end balances are not necessarilyrepresentative of the average debt outstanding during the period.
A. March 31, 2017 (` in Lakh)
Impact on Profit/ Direct impact(loss) before tax on Equity
Particulars 100 bp 100 bp 100 bp 100 bpincrease decrease increase decrease
Variable-rate instrumentsOn account of Variable Rate Borrowings from Banks (6,008.89) 6,008.89 — —Sensitivity (6,008.89) 6,008.89 — —

Ruchi Soya Industries Limited
212
Notesto Consolidated Financial Statement for the Year Ended March 31, 2017
NOTE-46 FINANCIAL INSTRUMENTS – FAIR VALUES AND RISK MANAGEMENT (Contd.)
B. March 31, 2016 (` in Lakh)
Impact on Profit/ Direct impact(loss) before tax on Equity
Particulars 100 bp 100 bp 100 bp 100 bpincrease decrease increase decrease
Variable-rate instrumentsOn account of Variable Rate Borrowings from Banks (5,811.94) 5,811.94 — —Sensitivity (5,811.94) 5,811.94 — —
(Note: The impact is indicated on the profit/loss and equity before tax basis)i (c) Commodity risk
The prices of agricultural commodities are subject to wide fluctuations due to unpredictable factors such as weather,government policies, changes in global demand resulting from population growth and changes in standards of livingand global production of similar and competitive crops. During its ordinary course of business, the value of theGroup’s open sales and purchases commitments and inventory of raw material changes continuously in line withmovements in the prices of the underlying commodities. To the extent that its open sales and purchases commitmentsdo not match at the end of each business day, the Group is subjected to price fluctuations in the commodities market.While the Group is exposed to fluctuations in agricultural commodities prices, its policy is to minimise its risks arisingfrom such fluctuations by hedging its sales either through direct purchases of a similar commodity or through futurescontracts on the commodity exchanges. The prices on the commodity exchanges are generally quoted up to twelvemonths forward.In the course of hedging its sales either through direct purchases or through futures, the Group may also be exposedto the inherent risk associated with trading activities conducted by its personnel. The Group has in place a risk managementsystem to manage such risk exposure.At the balance sheet date, a 1% increase/decrease of the commodities price indices, with all other variables remainingconstant, would result in (decrease)/increase in profit before tax and equity by the amounts as shown below:
(` in Lakh)Profit/(loss)
March 31, 2017Increase Decrease
Effect of increase/(decrease) in pricesProfit before taxes 657.69 (657.69)Assumptions used for calculationInventory Commodity price * 1%Derivative contract Rate * 1%
(d) Equity risk
Equity Price Risk is related to the change in market reference price of the investments in equity securities. The fairvalue of some of the Company’s investments in Fair Value through Other Comprehensive Income securities exposesthe Company to equity price risks. In general, these securities are not held for trading purposes. These investments aresubject to changes in the market price of securities. The fair value of equity securities as of March 31, 2017, was` 1,636.70 lakh [FY 2015-2016 ` 2,367.19 lakh]. A sensex standard deviation of 5% [FY 2015-2016 is 6%] would resultin change in equity prices of securities held as of March 31, 2017 by ` 81.83 lakh [FY 2015-2016 ` 142.03 lakh]
(ii) Credit RiskCredit risk is the risk of financial loss to the Group if a customer or counterparty to a financial instrument fails to meet itscontractual obligations and arises principally from the Group’s receivables from customer. The Group establishes an allowancefor doubtful debts and impairment that represents its estimate on expected loss model.A. Trade and other receivables
The Group’s exposure to credit risk is influenced mainly by the individual characteristics of each customer.The demographics of the customer, including the default risk of the industry has an influence on credit risk assessment.
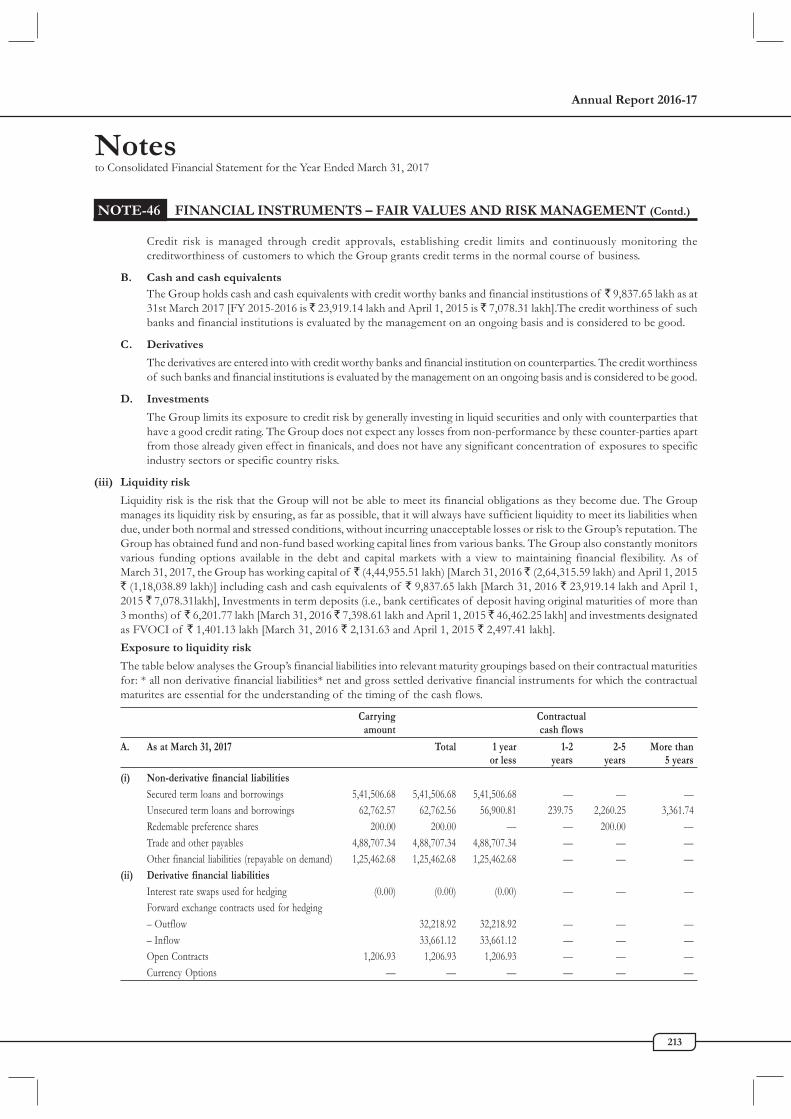
Annual Report 2016-17
213
Credit risk is managed through credit approvals, establishing credit limits and continuously monitoring thecreditworthiness of customers to which the Group grants credit terms in the normal course of business.
B. Cash and cash equivalentsThe Group holds cash and cash equivalents with credit worthy banks and financial institustions of ̀ 9,837.65 lakh as at31st March 2017 [FY 2015-2016 is ̀ 23,919.14 lakh and April 1, 2015 is ̀ 7,078.31 lakh].The credit worthiness of suchbanks and financial institutions is evaluated by the management on an ongoing basis and is considered to be good.
C. Derivatives
The derivatives are entered into with credit worthy banks and financial institution on counterparties. The credit worthinessof such banks and financial institutions is evaluated by the management on an ongoing basis and is considered to be good.
D. Investments
The Group limits its exposure to credit risk by generally investing in liquid securities and only with counterparties thathave a good credit rating. The Group does not expect any losses from non-performance by these counter-parties apartfrom those already given effect in finanicals, and does not have any significant concentration of exposures to specificindustry sectors or specific country risks.
(iii) Liquidity risk
Liquidity risk is the risk that the Group will not be able to meet its financial obligations as they become due. The Groupmanages its liquidity risk by ensuring, as far as possible, that it will always have sufficient liquidity to meet its liabilities whendue, under both normal and stressed conditions, without incurring unacceptable losses or risk to the Group’s reputation. TheGroup has obtained fund and non-fund based working capital lines from various banks. The Group also constantly monitorsvarious funding options available in the debt and capital markets with a view to maintaining financial flexibility. As ofMarch 31, 2017, the Group has working capital of ̀ (4,44,955.51 lakh) [March 31, 2016 ̀ (2,64,315.59 lakh) and April 1, 2015` (1,18,038.89 lakh)] including cash and cash equivalents of ` 9,837.65 lakh [March 31, 2016 ` 23,919.14 lakh and April 1,2015 ` 7,078.31lakh], Investments in term deposits (i.e., bank certificates of deposit having original maturities of more than3 months) of ̀ 6,201.77 lakh [March 31, 2016 ̀ 7,398.61 lakh and April 1, 2015 ̀ 46,462.25 lakh] and investments designatedas FVOCI of ` 1,401.13 lakh [March 31, 2016 ` 2,131.63 and April 1, 2015 ` 2,497.41 lakh].Exposure to liquidity risk
The table below analyses the Group’s financial liabilities into relevant maturity groupings based on their contractual maturitiesfor: * all non derivative financial liabilities* net and gross settled derivative financial instruments for which the contractualmaturites are essential for the understanding of the timing of the cash flows.
Carrying Contractualamount cash flows
A. As at March 31, 2017 Total 1 year 1-2 2-5 More thanor less years years 5 years
(i) Non-derivative financial liabilitiesSecured term loans and borrowings 5,41,506.68 5,41,506.68 5,41,506.68 — — —Unsecured term loans and borrowings 62,762.57 62,762.56 56,900.81 239.75 2,260.25 3,361.74Redemable preference shares 200.00 200.00 — — 200.00 —Trade and other payables 4,88,707.34 4,88,707.34 4,88,707.34 — — —Other financial liabilities (repayable on demand) 1,25,462.68 1,25,462.68 1,25,462.68 — — —
(ii) Derivative financial liabilitiesInterest rate swaps used for hedging (0.00) (0.00) (0.00) — — —Forward exchange contracts used for hedging– Outflow 32,218.92 32,218.92 — — —– Inflow 33,661.12 33,661.12 — — —Open Contracts 1,206.93 1,206.93 1,206.93 — — —Currency Options — — — — — —
Notesto Consolidated Financial Statement for the Year Ended March 31, 2017
NOTE-46 FINANCIAL INSTRUMENTS – FAIR VALUES AND RISK MANAGEMENT (Contd.)

Ruchi Soya Industries Limited
214
Carrying Contractualamount cash flows
B. As at March 31, 2016 Total 1 year 1-2 2-5 More thanor less years years 5 years
(i) Non-derivative financial liabilitiesSecured term loans and borrowings 3,41,792.26 3,41,792.26 3,41,792.26 — — —Unsecured term loans and borrowings 2,44,281.37 2,44,281.37 2,38,268.53 390.84 2,260.25 3,361.74Redemable preference shares 200.00 200.00 — — — 200.00Trade and other payables 6,27,604.34 6,27,604.34 627,604.34 — — —Other financial liabilities (repayable on demand) 4,716.22 4,716.22 4,716.22 — — —
(ii) Derivative financial liabilitiesInterest rate swaps used for hedging 200.30 200.30 200.30 — — —Forward exchange contracts used for hedging 3,649.04– Outflow — 1,72,495.25 1,72,495.25 — — —– Inflow — 1,68,241.38 1,68,241.38 — — —Open Contracts 72,455.58 72,455.58 72,455.58 — — —Currency Options 411.22 411.22 411.22 — — —
Carrying Contractualamount cash flows
C. As at April 1, 2015 Total 1 year 1-2 2-5 More thanor less years years 5 years
(i) Non-derivative financial liabilitiesSecured term loans and borrowings 1,83,117.71 1,83,117.71 1,83,117.71 — — —Unsecured term loans and borrowings 2,35,128.89 2,35,128.89 2,28,423.55 728.46 539.28 5,437.60Redemable preference shares 200.00 200.00 — — — 200.00Trade and other payables 6,47,786.50 6,47,786.50 6,47,786.50 — — —Other financial liabilities (repayable on demand) 5,138.33 5,138.33 5,138.33 — — —
(ii) Derivative financial liabilitiesInterest rate swaps used for hedging 544.57 544.57 344.27 200.30 — —Forward exchange contracts used for hedging 1,042.65 — — — — —– Outflow — 1,64,300.69 1,64,300.69 — — —– Inflow — 1,62,177.85 1,62,177.85 — — —Open Contracts 55,897.26 55,897.26 55,897.26 — — —Commodity future contracts 479.90 479.90 479.90 — — —Currency Options 49.22 49.22 49.22 — — —
Note:The inflows/(outflows) disclosed in the above table represent the contractual undiscounted cash flows relating to derivativefinancial liabilities held for risk management purposes and which are not usually closed out before contractual maturity.The disclosure shows net cash flow amounts for derivatives that are net cash-settled and gross cash inflow and outflowamounts for derivatives that have simultaneous gross cash settlement.
Notesto Consolidated Financial Statement for the Year Ended March 31, 2017
NOTE-46 FINANCIAL INSTRUMENTS – FAIR VALUES AND RISK MANAGEMENT (Contd.)

Annual Report 2016-17
215
Notesto Consolidated Financial Statement for the Year Ended March 31, 2017
NOTE-47 CAPITAL MANAGEMENT
The Group’s policy is to maintain a strong capital base so as to maintain investor, creditor and market confidence and to sustainfuture development of the business. Management monitors the return on capital as well as the level of dividends to ordinaryshareholders.The Group monitors capital using a ratio of ‘adjusted net debt’ to ‘equity’. For this purpose, adjusted net debt is defined as totalliabilities, comprising interest-bearing loans and borrowings and obligations under finance leases, less cash and cash equivalents.Equity comprises of Equity share capital and other equity.The Group’s policy is to keep the ratio below 2.00. The Group’s adjusted net debt to adjusted equity ratio was as follows.
(` in Lakh)A. Particulars As at As at As at
March 31, 2017 March 31, 2016 April 1, 2015
Total liabilities 6,07,126.83 5,88,209.59 4,20,133.97Less : Cash and cash equivalent 9,837.65 23,919.14 7,078.31Adjusted net debt 6,16,964.48 6,12,128.73 4,27,212.28
Total equity 93,014.46 2,43,228.52 3,75,303.67
Adjusted net debt to adjusted equity ratio 6.63 2.52 1.14B. Dividends
Amount of Dividends approved during the year by shareholders
Particulars March 31, 2017 March 31, 2016
No. of Shares (` in Lakh) No. of Shares (` in Lakh)- Equity Shares 32,64,70,607 - 32,64,70,607 -- Preference Shares 2,00,000 - 2,00,000 -
NOTE-48 TRANSITION TO IND AS:
For the purposes of reporting as set out in Note 1 and 2 , Group have transitioned our basis of accounting from Indian generallyaccepted accounting principles (“IGAAP”) to Ind AS. The accounting policies set out in Note 1 and 2 have been applied in preparingthe financial statements for the year ended March 31, 2017. The comparative information presented in these financial statements arefor the year ended March 31, 2016 and in the preparation of an opening Ind AS balance sheet at April 1, 2015 (the “transitiondate”).In preparing our opening Ind AS balance sheet, we have made certain adjustments to amounts reported in consolidatedfinancial statements prepared in accordance with IGAAP. An explanation of how the transition from IGAAP to Ind AS has affectedour financial position and performance is set out in the following tables. On transition, we did not revise estimates previously madeunder IGAAP except where required by Ind AS.A. EXEMPTIONS AND EXCEPTIONS AVAILED
Set out below are the applicable Ind AS 101 optional exemptions and mandatory exceptions applied in the transition fromIndian GAAP to Ind AS :Ind AS Exemptions :
(i) Fair valuation of government loans: The Group has applied the exemption available under Ind AS-101 for not measuringinterest free sales tax deferral loan, existing on the date of transition (April 1, 2015), at fair value and the correspondingbenefit as a government grant.
(ii) Business combination: The Group has applied the exemption as provided in Ind AS-101 for non-application of Ind AS103, “Business Combinations” to business combinations consummated prior to the date of transition(April 1, 2015).
(iii) Share-based payment: The Group has elected to apply the share based payment exemption available under Ind AS 101for application of Ind AS 102, “Share Based Payment”, to grants which remain unvested on April 1, 2015 and to grantsmade after April 1, 2015.

Ruchi Soya Industries Limited
216
(iv) Property, Plant and Equipment: On Transition to Ind AS as on April 1, 2015 the Group has elected to measure its a)Tangible assets Freehold Land, Building and Plant and Equipments b) Intangible assets acquired Trademarks/ Brands atFair value, for other assets elected to measure the same cost as per Ind AS, if any. The same are considered as Deemedcost of such Plant, property and Equipment.
(v) Long Term Foreign Currency Monetary Items: The Group has elected to avail the exemption available under Ind AS101, to continue to adjust the exchange differences arising on translation of long term foreign currency monetary itemsoutstanding as on the date of transition, to the cost of depreciable assets to the extent it relates to their acquisition and inother cases to charge the same to profit and loss account over the term of the long term foreign currency monetary itemsand to accumulate the unamortised portion in foreign currency monetary item difference account.
(vi) Derecognition of financial assets and financial liabilities: The Group has opted to apply the exemption availableunder Ind AS 101 to apply the derecognition criteria of Ind AS 109 prospectively for the transactions occurring on orafter the date of transition to Ind AS.
(vii) Business Development Reserve: In an earlier year, the Hon’ble High Court of judicature of Mumbai, had approved u/s. 391-394 of then applicable Companies Act the Scheme of Amalgamation and Arrangement of ‘Mac Oil Palm Limited’with Ruchi Soya Industries Limited and its shareholders, which was effective from April 1, 2009. Pursuant to the Scheme,the Holding Company had, in an earlier year, created Business Development Reserve from the balance standing to thecredit of General Reserve & Securities Premium Account.In terms of the Scheme, as and when deemed fit by the Board,the said Business Development Reserve is available for adjusting various expenses, including advertisement, sales promotion,development of brands, research and development activities, provision / write off of doubtful debtors/current assets/loans and advances, additional depreciation necessitated by revaluation of fixed assets and expenses of amalgamationincluding expenses of the Transferor Company i.e. Mac Oil Palm Limited, incurred on or after 1st April 2009, afteradjusting for any tax effects, both current and deferred tax thereon. As the law would continue to override accountingstandards, continution of accounting treatment as prescribed by court approved schemes before transition date exemptionshall continue under Ind AS.
II. Ind AS mandatory exceptions
Estimates : The Group estimates in accordance with Ind AS at the date of transition to Ind AS are consitent with estimatesmade for the same date in accordance with previous GAAP.
B. FINANCIAL RECONCILIATION (` in Lakh)
B (i) (a) RECONCILIATION OF EQUITY – Notes Amount as Effects of Amount asMARCH 31, 2016 per IGAAP transition to per Ind AS
Ind AS
ASSETS
Non-current assets
(a) Property, Plant and Equipment 3 2,39,084.53 1,76,168.46 4,15,252.99(b) Capital work-in-progress 3 4,205.32 (3.28) 4,202.04(c) Intangible assets 4 1,075.10 1,50,695.91 1,51,771.01(d) Financial Assets 5
(i) Investments 5(a) 13,386.18 (4,411.05) 8,975.13(ii) Loans 5(b) 18,785.45 (11,452.06) 7,333.39(iii) Others 5(c) - 1,148.93 1,148.93
(e) Other non-current assets 6 70.93 11,717.03 11,787.96
Total Non-current assets 2,76,607.51 3,23,863.94 6,00,471.45
Notesto Consolidated Financial Statement for the Year Ended March 31, 2017
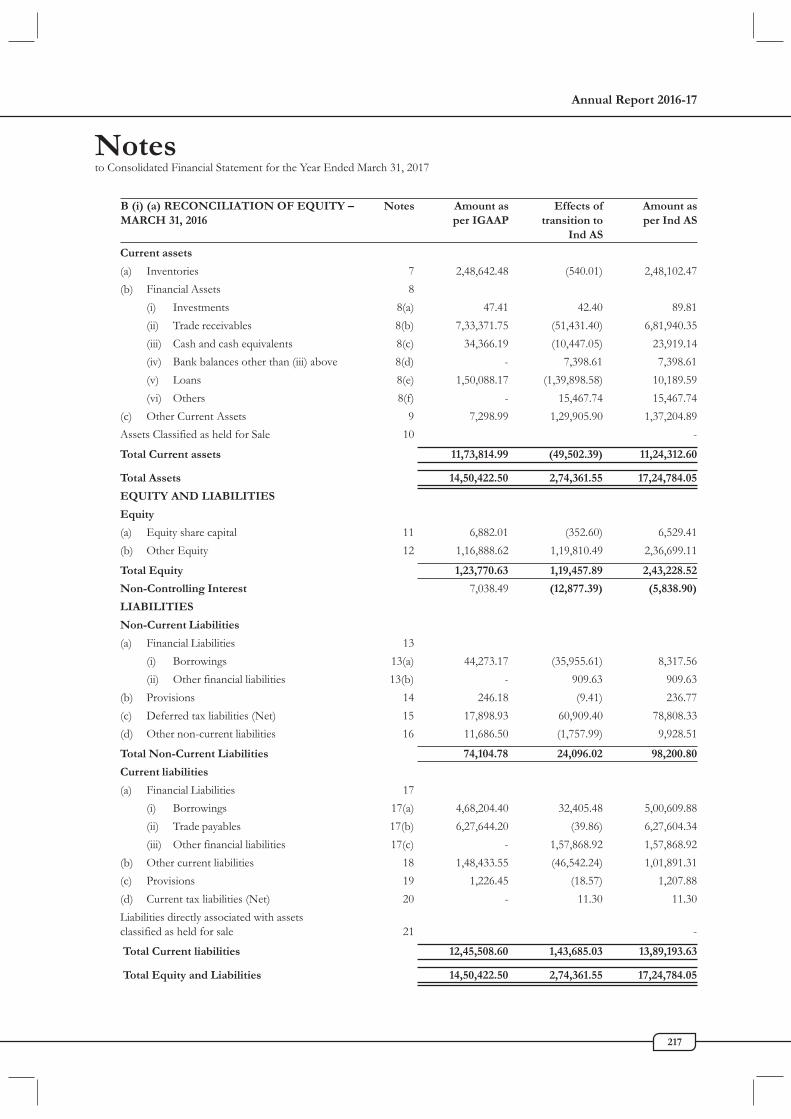
Annual Report 2016-17
217
Notesto Consolidated Financial Statement for the Year Ended March 31, 2017
Current assets
(a) Inventories 7 2,48,642.48 (540.01) 2,48,102.47(b) Financial Assets 8
(i) Investments 8(a) 47.41 42.40 89.81(ii) Trade receivables 8(b) 7,33,371.75 (51,431.40) 6,81,940.35(iii) Cash and cash equivalents 8(c) 34,366.19 (10,447.05) 23,919.14(iv) Bank balances other than (iii) above 8(d) - 7,398.61 7,398.61(v) Loans 8(e) 1,50,088.17 (1,39,898.58) 10,189.59(vi) Others 8(f) - 15,467.74 15,467.74
(c) Other Current Assets 9 7,298.99 1,29,905.90 1,37,204.89Assets Classified as held for Sale 10 -
Total Current assets 11,73,814.99 (49,502.39) 11,24,312.60
Total Assets 14,50,422.50 2,74,361.55 17,24,784.05
EQUITY AND LIABILITIES
Equity
(a) Equity share capital 11 6,882.01 (352.60) 6,529.41(b) Other Equity 12 1,16,888.62 1,19,810.49 2,36,699.11
Total Equity 1,23,770.63 1,19,457.89 2,43,228.52
Non-Controlling Interest 7,038.49 (12,877.39) (5,838.90)
LIABILITIES
Non-Current Liabilities
(a) Financial Liabilities 13(i) Borrowings 13(a) 44,273.17 (35,955.61) 8,317.56(ii) Other financial liabilities 13(b) - 909.63 909.63
(b) Provisions 14 246.18 (9.41) 236.77(c) Deferred tax liabilities (Net) 15 17,898.93 60,909.40 78,808.33(d) Other non-current liabilities 16 11,686.50 (1,757.99) 9,928.51
Total Non-Current Liabilities 74,104.78 24,096.02 98,200.80
Current liabilities
(a) Financial Liabilities 17(i) Borrowings 17(a) 4,68,204.40 32,405.48 5,00,609.88(ii) Trade payables 17(b) 6,27,644.20 (39.86) 6,27,604.34(iii) Other financial liabilities 17(c) - 1,57,868.92 1,57,868.92
(b) Other current liabilities 18 1,48,433.55 (46,542.24) 1,01,891.31(c) Provisions 19 1,226.45 (18.57) 1,207.88(d) Current tax liabilities (Net) 20 - 11.30 11.30Liabilities directly associated with assetsclassified as held for sale 21 -
Total Current liabilities 12,45,508.60 1,43,685.03 13,89,193.63
Total Equity and Liabilities 14,50,422.50 2,74,361.55 17,24,784.05
B (i) (a) RECONCILIATION OF EQUITY – Notes Amount as Effects of Amount asMARCH 31, 2016 per IGAAP transition to per Ind AS
Ind AS

Ruchi Soya Industries Limited
218
Notesto Consolidated Financial Statement for the Year Ended March 31, 2017
(` in Lakh)B (ii) (a) RECONCILIATION OF STATEMENT Notes Amount as Effects of Amount asOF PROFIT AND LOSS FOR THE YEAR per IGAAP transition to per Ind ASMARCH 31, 2016 Ind ASRevenueI. Revenue from Operations 22 30,28,357.29 (4,308.47) 30,24,048.82II. Other income 23 7,430.15 2,282.63 9,712.78
III. Total Income (I+II) 30,35,787.44 (2,025.84) 30,33,761.60
IV. ExpensesCost of materials consumed 24 12,63,771.62 (1,438.53) 12,62,333.09Purchase of Traded Goods 25 15,13,076.98 214.46 15,13,291.44Changes in inventories of finished goods,work-in-progress and stock-in-trade 26 28,947.55 564.57 29,512.12Employee Benefits Expenses 27 22,697.11 (251.76) 22,445.35Finance costs 28 68,849.13 67,267.71 1,36,116.84Depreciation ,amortization and impairment Expenses 29 15,573.55 1,094.65 16,668.20Provision for Doubtful Debts and advances[Including Bad Debts written off] 30 - 25,448.47 25,448.47Other Expenses 31 2,27,862.19 (61,005.18) 1,66,857.01
Total Expenses 31,40,778.13 31,894.39 31,72,672.52
V. Profit/(loss) before Exceptional Itemsand Tax (III-IV) (1,04,990.69) (33,920.23) (1,38,910.92)
VI. Share of Net Profit/(Loss) of Associates (227.66) (366.25) (593.91)VII. Minority Interest 3,006.21 883.74 3,889.95VIII.Exceptional Items 32 238.97 0.01 238.98
IX. Profit/(loss) before Tax (V+VI+VII+VIII) (1,01,973.17) (33,402.73) (1,35,375.90)
X. Tax expense:
1. Current Tax (29.34) (14.18) (43.52)2. Deferred Tax (7,944.23) 46.58 (7,897.65)3. Adjustment of tax for earlier years (43.54) (30.87) (74.41)Less: MAT credit entitlement - - -
XI. Profit/(Loss) after tax for the year (IX-X) (93,956.06) (33,404.26) (1,27,360.32)
XII. (A) Other Comprehensive Income(i) Items that will not be reclassified to statement
of profit or loss - (482.81) (482.81)Tax relating to above items - 42.64 42.64(ii) Items that will be reclassified to statement
of profit or loss - - -Tax relating to above items - - -(B) Hedge Reserves(i) Items that will not be reclassified to statement
of profit or loss - - -(ii) Items that will be reclassified to statement
of profit or lossEffective portion of gain or loss on hedging instrumentsin a cash flow hedge - 344.26 344.26
XIII.Total comprehensive income for the year (XI+XII) (93,956.06) (33,500.17) (1,27,456.23)

Annual Report 2016-17
219
Notesto Consolidated Financial Statement for the Year Ended March 31, 2017
(` in Lakh)B(ii). RECONCILIATION OF EQUITY – Notes Amount as Effects of Amount as
APRIL 1, 2015 per IGAAP transition to per Ind ASInd AS
ASSETS
Non-current assets
(a) Property, Plant and Equipment 3 2,45,158.84 1,76,177.21 4,21,336.05(b) Capital work-in-progress 3 11,249.09 (1,818.84) 9,430.25(c) Intangible assets 4 333.99 1,51,994.08 1,52,328.07(d) Financial Assets 5
(i) Investments 5(a) 15,252.53 (5,642.22) 9,610.31(ii) Loans 5(b) 14,115.85 (8,444.08) 5,671.77(iii) Others 5(c) - 1,083.61 1,083.61
(e) Other non-current assets 6 26.69 8,449.00 8,475.69
Total Non-current assets 2,86,136.99 3,21,798.76 6,07,935.75
Current assets
(a) Inventories 7 3,15,994.59 (1,435.98) 3,14,558.61(b) Financial Assets 8
(i) Investments 8(a) 47.05 44.15 91.20(ii) Trade receivables 8(b) 6,75,668.92 (55,935.62) 6,19,733.30(iii) Cash and cash equivalents 8(c) 57,818.17 (50,739.86) 7,078.31(iv) Bank balances other than (iii) above 8(d) - 46,462.25 46,462.25(v) Loans 8(e) 1,37,282.82 (1,27,757.22) 9,525.60(vi) Others 8(f) - 11,744.97 11,744.97
(c) Other Current Assets 9 13,169.69 1,11,944.25 1,25,113.94Assets Classified as held for Sale 10 -
Total Current assets 11,99,981.24 (65,673.06) 11,34,308.18
Total Assets 14,86,118.23 2,56,125.71 17,42,243.93
EQUITY AND LIABILITIES
Equity
(a) Equity share capital 11 6,881.21 (352.60) 6,528.61(b) Other Equity 12 2,18,748.89 1,50,026.17 3,68,775.06
Total Equity 2,25,630.10 1,49,673.57 3,75,303.67
Non-Controlling Interest 9,837.65 (11,786.61) (1,948.96)
LIABILITIES
Non-Current Liabilities
(a) Financial Liabilities 13(i) Borrowings 13(a) 72,064.35 (63,016.22) 9,048.13(ii) Other financial liabilities 13(b) - 1,512.19 1,512.19
(b) Provisions 14 323.87 (319.58) 4.29(c) Deferred tax liabilities (Net) 15 25,840.75 60,865.23 86,705.98(d) Other non-current liabilities 16 20,977.21 (1,844.11) 19,133.10
Total Non-Current Liabilities 1,19,206.18 (2,802.49) 1,16,403.69

Ruchi Soya Industries Limited
220
Notesto Consolidated Financial Statement for the Year Ended March 31, 2017
Current liabilities(a) Financial Liabilities 17
(i) Borrowings 17(a) 3,07,116.66 (0.01) 3,07,116.65(ii) Trade payables 17(b) 6,46,792.83 993.67 6,47,786.50(iii) Other financial liabilities 17(c) - 1,63,921.55 1,63,921.55
(b) Other current liabilities 18 1,74,077.56 (43,544.63) 1,30,532.93(c) Provisions 19 3,457.25 (2,449.41) 1,007.84(d) Current tax liabilities (Net) 20 - 2,120.06 2,120.06Liabilities directly associated with assets classified as held for sale - - -
Total Current liabilities 11,31,444.30 1,21,041.23 12,52,485.53
Total Equity and Liabilities 14,86,118.23 2,56,125.70 17,42,243.93
C. Notes on First time adoption:
1 Property, Plant & Equipment
As on the transition date to Ind AS i.e. April 1, 2015 the Group has elected to measure its Tangible assets - Freehold Land,Building and Plant and Equipments and Intangible assets - Aquired Trademarks/Brands at Fair Value, for other assets Groupelected to measure the same at cost as per Ind As. The same are considered as Deemed cost.
2 (a) Investment in Other than subsidiary, associates and Joint Venture – Refer Note 5 c E(i) a.(b) Investments in Mutual funds
The same are measured at FVTPL. As on transition date i.e April 1, 2015 the same are adjusted to retained earnings ,subsequent gain /loss are charged to profit and loss account.
3 Leasehold land
The Group has certain lease hold land with a tenure ranging between 10 to 30 years. Under Ind-AS land is treated as financelease if the lease term is over several decades or the present value of minimum lease payments is substantially equal to the fairvalue of land. Since the above condition is not satisfied, lease arrangements in the range of 10 to 30 years the date of investmentto the date of transition have been classified as operating leases as against the current practice of capitalizing them as leaseholdland. Consequently, leasehold land has been de-recognised and prepaid lease rental have been recognised.
4 Biological asset and Stock in trade
The Group has measured the biological assets and stock in trade at Fair Value.
5 Trade receivables
The Group measures recovery of debtors on Expected Credit Loss Model [ Refer Note 46(ii)].The Group has allowed somecustomers an extended credit period, the same are recognised at its present value, The corresponding difference between thepresent value and carrying amount is recognised in retained earnings. The unwinding of discount on account of above upto thedate of transition is also recognised in retained earnings. Subsequent unwinding is recognised in the Statement of Profit andLoss Account.
6 Reversal of premium amortised on forward contracts.
As per previous Indian GAAP, the premium paid on forward contract was amortised over the a period of the contract. The saidis not required under Ind AS. Hence, the same are now recorded as per requirements of Ind AS and the premium amortisedearlier under Indian GAAP are reversed with corresponding amount recognised in retained earnings.
7 (a) Open purchase and sale contracts
As per requirments of Ind AS, specified Open purchase and sales contract outstanding as on the balance sheet date areFair Valued.
(b) Currency Forward contracts
The Group has Fair Valued the Currency forward contracts on date of transition with a corresponding amount recognisedin retained earnings as on transition date i.e April 1, 2015.

Annual Report 2016-17
221
Notesto Consolidated Financial Statement for the Year Ended March 31, 2017
8 Share based payments
Under Indian GAAP, the Group recognised only the intrinsic value for the long-term incentive plan as an expense. Ind-AS requiresthe fair value of the share options to be determined using an appropriate pricing model recognised over the vesting period.Accordingly, the difference between the intrinsic value method and Fair Value method has been recognised in retained earnings.
9 Amortisation of loan processing fees
The Group has incurred trasaction/processing costs on its borrowings.The said transaction and processing cost is amortisedover the period of loan. The same has been reduced from the borrowing on the date of initial recognition and amortised usingeffective interest rate method. As a result the long term borrowing has been reduced with a corresponding gain being recognisedin retained earnings.
10 Deferred Tax
The Group has recognised deferred tax as per requirements of Ind AS -12 on “Income taxes” and recoginsed a deferred taxliability arising on account of the Ind AS adjustments as on April 1, 2015 to retained earnings.
11 Proposed Dividend
Under Indian GAAP, proposed dividends are recognised as a liability in the period to which they relate, irrespective of whenthey are declared. Under Ind-AS, a proposed dividend is recognised as a liability in the period in which it is declared by theGroup, usually when approved by shareholders in a general meeting.In the case of the Group, the declaration of dividendoccurs after period end. Therefore, the liability recorded for this dividend as on the date of transition as well as tax relating toit has been derecognised.
12 Excise Duty
Under Indian GAAP, the Group used to present Revenue net off excise duty. The incidence of excise duty is on manufactureand not on sales since manufacturer is the primary obligor for the payment of excise duty. Management collects excise dutyfrom its customers in the capacity as principal and not as an agent. As a result, excise duty recovered from customers wouldform part of revenue, with an corresponding equal amount charged to the statement of Profit and loss.
13 Employee benefits
Both under Indian GAAP and Ind-AS, the Group recognised costs related to its post-employment defined benefit plan on anactuarial basis. Under Indian GAAP, the entire cost, including actuarial gains and losses, are charged to profit and loss. UnderInd-AS, remeasurements of defined benefit plans are recognised immediately in the balance sheet with a corresponding debitor credit to retained earnings through OCI.
14 Bills of exchanges discounted with recourse terms
The Group had certain debtors which it discounts with the bank. The discounting of such debtors is done with recourseoption. As per Ind AS, the risks and rewards have not been completely transferred to the bank as a result of the discounting.Hence, the Group has recognised the debtor as well as a secured loan in the financial statements in this regards.
As per our report of even date attached For and on behalf of the Board of Directors
For and on behalf ofP. D. Kunte & Co. (Regd.) R. L. Gupta Dinesh ShahraChartered Accountants Company Secretary Managing Director
DIN:00533055
D. P. Sapre Anil Singhal Vijay Kumar JainPartner Chief Financial Officer Executive DirectorMembership no. 40740 DIN:00098298
Place: MumbaiDate: May 30, 2017

Ruchi Soya Industries Limited
222
Notesto Consolidated Financial Statement for the Year Ended March 31, 2017
An
nex
ure
-A:
(` in
lakh
)P
urs
uan
t to
req
uir
emen
ts o
f fi
rst p
rovi
sio
to s
ub
-sec
tion
(3)
of
sect
ion
129
rea
d w
ith
Ru
le 5
of
Com
pan
ies
(Acc
oun
ts)
Ru
les,
201
4. T
he
Com
pan
y h
as g
iven
the
dis
clou
sure
of
the
said
req
uir
emen
t in
FO
RM
AO
C -
1.
Stat
emen
t con
tain
ing
salie
nt f
eatu
res
of th
e fi
nan
cial
sta
tem
ent o
f su
bsi
dai
ries
/as
soci
ate
com
pan
ies/
join
t ven
ture
s
(a).
Det
ails
of
Sub
sid
iari
es(F
igu
res
in la
c)
Sl.
Sub
sid
iary
Sub
sid
iary
Sub
sid
iary
No.
12
3
1N
ame
of t
he
Sub
sid
iary
Ruch
i Wor
ldw
ide
Mrig
trad
ing
RSIL
Hol
ding
sLi
mite
dPr
ivat
e Li
mite
dPr
ivat
e lim
ited
2N
ame
of t
he
Sub
sid
iary
Ru
chi
Wor
ldw
ide
Lim
ited
Mri
g tr
adin
g P
riva
te L
imit
edR
SIL
Hol
din
gsP
riva
te L
imit
ed
3R
epor
tin
g P
erio
d f
or t
he
sub
sid
iary
con
cern
ed, i
f d
iffe
ren
t fr
om t
he
hol
din
g C
omp
any'
s re
por
tin
g p
erio
dn.
a.n.
a.n.
a.
4R
epor
tin
g C
urr
ency
an
d E
xch
ange
rat
e on
th
e la
st d
ate
of t
he
rele
van
tF
inan
cial
Yea
r in
th
e ca
se o
f fo
reig
n S
ub
sid
iary
n.a.
n.a.
n.a.
5Sh
are
Cap
ital
1,8
94.0
7 1
.00
606
.00
6R
eser
ves
& s
urp
lus
(24,
888.
12)
(2.7
5) (2
03.3
9)
7T
otal
Ass
ets
59,
663.
02 1
.56
402
.90
8T
otal
Lia
blit
ies
59,
663.
02 1
.56
402
.90
9In
vest
men
ts -
- 3
94.4
4
10T
urn
over
1,1
1,03
3.12
- -
11P
rofi
t b
efor
e ta
xati
on (1
0,71
0.54
) (1
.40)
(193
.66)
12P
rovi
sion
for
tax
atio
n 3
.61
- -
13P
rofi
t af
ter
taxa
tion
(10,
706.
93)
(1.4
0) (1
93.6
6)
14P
rop
osed
Div
iden
d -
- -
15%
of
shar
ehol
din
g52
.48%
100%
100%
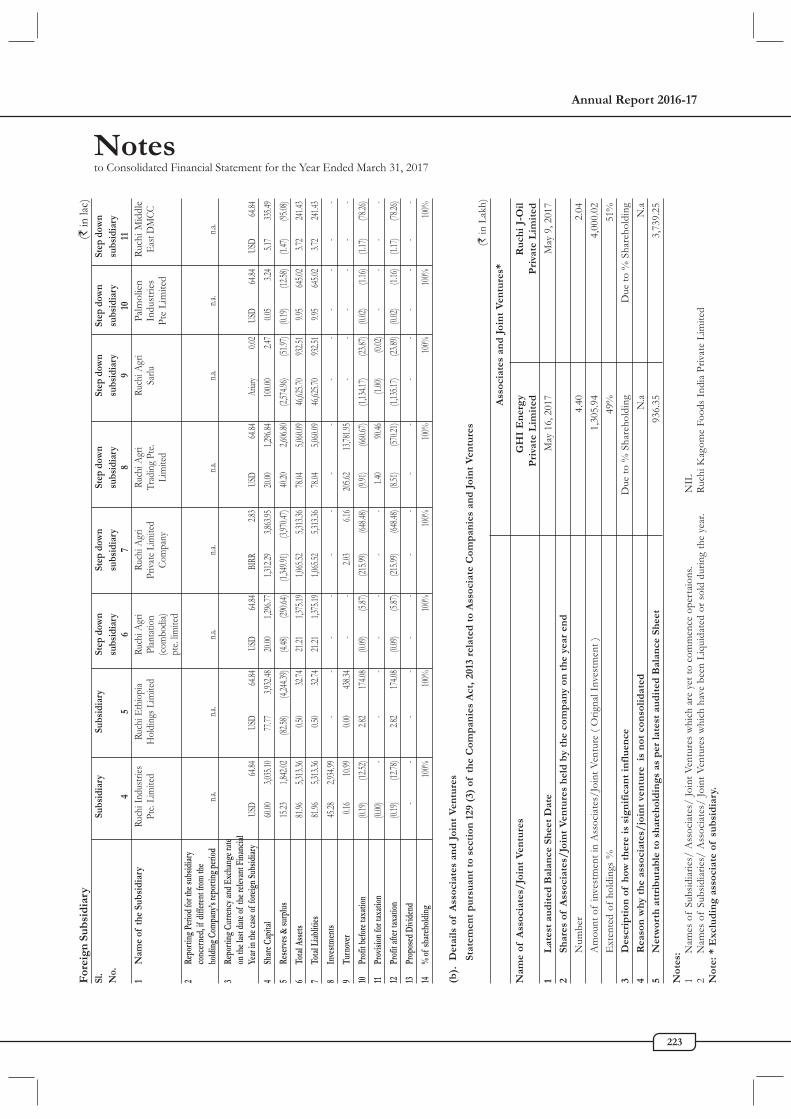
Annual Report 2016-17
223
Notesto Consolidated Financial Statement for the Year Ended March 31, 2017
(b).
Det
ails
of
Ass
ocia
tes
and
Joi
nt
Ven
ture
s
Stat
emen
t p
urs
uan
t to
sec
tion
129
(3)
of
the
Com
pan
ies
Act
, 20
13 r
elat
ed t
o A
ssoc
iate
Com
pan
ies
and
Joi
nt
Ven
ture
s(`
in L
akh)
Ass
ocia
tes
and
Joi
nt
Ven
ture
s*
Nam
e of
Ass
ocia
tes/
Join
t V
entu
res
GH
I E
ner
gy
Ru
chi
J-O
ilP
riva
te L
imit
edP
riva
te L
imit
ed
1L
ates
t au
dit
ed B
alan
ce S
hee
t D
ate
May
16,
201
7M
ay 9
, 201
72
Shar
es o
f A
ssoc
iate
s/Jo
int
Ven
ture
s h
eld
by
the
com
pan
y on
th
e ye
ar e
nd
Num
ber
4.4
0 2
.04
Am
ount
of
inve
stm
ent i
n A
ssoc
iate
s/Jo
int V
entu
re (
Orig
nal I
nves
tmen
t ) 1
,305
.94
4,0
00.0
2E
xten
ted
of h
oldi
ngs
%49
%51
%3
Des
crip
tion
of
how
th
ere
is s
ign
ific
ant
infl
uen
ce D
ue to
% S
hare
hold
ing
Due
to %
Sha
reho
ldin
g4
Rea
son
why
th
e as
soci
ates
/jo
int
ven
ture
is
not
con
soli
dat
ed N
.a N
.a5
Net
wor
th a
ttri
bu
tab
le t
o sh
areh
old
ing
s as
per
late
st a
ud
ited
Bal
ance
Sh
eet
936
.35
3,7
39.2
5
For
eign
Su
bsi
dia
ry(`
in la
c)Sl
.Su
bsid
iary
Subs
idia
rySt
ep d
own
Step
dow
nSt
ep d
own
Step
dow
nSt
ep d
own
Step
dow
nN
o.su
bsid
iary
subs
idia
rysu
bsid
iary
subs
idia
rysu
bsid
iary
subs
idia
ry4
56
78
910
111
Nam
e of
the
Subs
idia
ryRu
chi I
ndus
tries
Ruch
i Eth
iopi
aRu
chi A
gri
Ruch
i Agr
iRu
chi A
gri
Ruch
i Agr
iPa
lmol
ien
Ruch
i Mid
dle
Pte.
Lim
ited
Hol
ding
s Lim
ited
Plan
tatio
nPr
ivate
Lim
ited
Trad
ing P
te.Sa
rluIn
dust
ries
East
DM
CC(co
mbo
dia)
Com
pany
Lim
ited
Pte
Lim
ited
pte.
limite
d2
Repo
rting
Per
iod
for t
he su
bsid
iary
conc
erne
d, if
diff
eren
t fro
m th
eho
ldin
g Co
mpa
ny’s
repo
rting
per
iod
n.a.
n.a.
n.a.
n.a.
n.a.
n.a.
n.a.
n.a.
3Re
porti
ng C
urre
ncy a
nd E
xcha
nge r
ate
on th
e las
t dat
e of t
he re
levan
t Fin
ancia
lYe
ar in
the c
ase o
f for
eign
Subs
idiar
yUS
D 64
.84US
D 64
.84US
D 64
.84BI
RR 2.
83US
D 64
.84 A
riary
0.02
USD
64.84
USD
64.84
4Sh
are C
apita
l 60
.00 3,
035.1
0 77
.77 3,
932.4
8 20
.00 1,
296.7
7 1,
312.2
9 3,
863.9
5 20
.00 1,
296.8
4 10
0.00
2.47
0.05
3.24
5.17
335.4
95
Rese
rves
& su
rplu
s 15
.23 1,
842.0
2 (8
2.58)
(4,24
4.39)
(4.48
) (2
90.64
) (1
,349.9
1) (3
,970.4
7) 40
.20 2,
606.8
0 (2
,574.9
6) (5
1.97)
(0.19
) (1
2.58)
(1.47
) (9
5.08)
6To
tal A
sset
s81
.96 5,
313.3
6 0.
50 32
.74 21
.21 1,
375.1
9 1,
065.5
2 5,
313.3
6 78
.04 5,
060.0
9 46
,625.7
0 93
2.51
9.95
645.0
2 3.
72 24
1.43
7To
tal L
iablit
ies 81
.96 5,
313.3
6 0.
50 32
.74 21
.21 1,
375.1
9 1,
065.5
2 5,
313.3
6 78
.04 5,
060.0
9 46
,625.7
0 93
2.51
9.95
645.0
2 3.
72 24
1.43
8In
vestm
ents
45.28
2,93
4.99
- -
- -
- -
- -
- -
- -
- -
9Tu
rnov
er 0.
16 10
.99 0.
00 43
8.34
- -
2.03
6.16
205.6
2 13
,781.9
5 -
- -
- -
-10
Prof
it be
fore
taxa
tion
(0.19
) (1
2.52)
2.82
174.0
8 (0
.09)
(5.87
) (2
15.99
) (6
48.48
) (9
.91)
(660
.67)
(1,13
4.17)
(23.8
7) (0
.02)
(1.16
) (1
.17)
(78.2
6)11
Prov
ision
for t
axat
ion
(0.00
) -
- -
- -
- -
1.40
90.46
(1.00
) (0
.02)
- -
- -
12Pr
ofit
afte
r tax
atio
n (0
.19)
(12.7
8) 2.
82 17
4.08
(0.09
) (5
.87)
(215
.99)
(648
.48)
(8.51
) (5
70.21
) (1
,135.1
7) (2
3.89)
(0.02
) (1
.16)
(1.17
) (7
8.26)
13Pr
opos
ed D
ivide
nd -
- -
- -
- -
- -
- -
- -
- -
-14
% of
shar
ehol
ding
100%
100%
100%
100%
100%
100%
100%
100%
Not
es:
1N
ames
of
Subs
idia
ries/
Ass
ocia
tes/
Join
t Ven
ture
s w
hich
are
yet
to c
omm
ence
ope
rtai
ons.
NIL
2N
ames
of
Subs
idia
ries/
Ass
ociat
es/
Join
t Ven
ture
s w
hich
hav
e be
en L
iqui
date
d or
sol
d du
ring
the
year
.Ru
chi K
agom
e Fo
ods
Indi
a Pr
ivat
e Li
mite
dN
ote:
* E
xclu
din
g a
ssoc
iate
of
sub
sid
iary
.

Ruchi Soya Industries Limited
224
NOTICE
Notice is hereby given that the Thirty First Annual GeneralMeeting of the members of Ruchi Soya Industries Limitedwill be held on Wednesday, 27th September, 2017 at 11.30 A.M.at Rangswar Hall, Chavan Centre, Yashwantrao ChavanPratishthan, Gen. Jagannathrao Bhonsle Marg,Mumbai - 400021, to transact the following business:
ORDINARY BUSINESS:1. To consider and adopt the audited standalone financial
statements of the Company for the financial year ended31st March, 2017, the reports of Board of Directors andAuditors thereon; and the audited consolidated financialstatements of the Company for the financial year ended31st March, 2017 and the reports of Auditors thereon andin this regard to consider and if thought fit, to pass withor without modification(s), the following resolution as anOrdinary Resolution:
“RESOLVED THAT the audited standalone financialstatements of the Company for the financial year ended31st March, 2017 and the reports of the Board of Directorsand Auditors thereon, be and are hereby considered andadopted.
RESOLVED FURTHER THAT the audited consolidatedfinancial statements of the Company for the financial yearended 31st March, 2017 and the reports of Auditors thereon,be and are hereby considered and adopted.”
2. To appoint Auditors and to fix their remuneration and inthis regard to consider and if thought fit, to pass with orwithout modification(s), the following resolution as anOrdinary Resolution:
“RESOLVED THAT pursuant to provisions of Section139, 142 and other applicable provisions, if any, of theCompanies Act, 2013 read with the Companies (Auditand Auditors) Rules, 2014 (including any statutorymodification(s) or re-enactment thereof for the time beingin force) and pursuant to the recommendations of theAudit Committee of the Board and the Board of Directors,M/s. Chaturvedi & Shah, Chartered Accountants, (FirmRegistration No. 101720W) be and are hereby appointedas the Statutory Auditors of the Company in place ofretiring Auditors M/s. P. D. Kunte & Co., CharteredAccountants, to hold office for a term of 5 (five) consecutiveyears from the conclusion of 31st Annual General Meetingtill the conclusion of 36th Annual General Meeting of the
Company, subject to ratification of their appointment atevery Annual General Meeting held after 31st AnnualGeneral Meeting, at such remuneration as may berecommended by the Audit Committee and mutually agreed,between the Board of Directors and the Auditors plus outof pocket expenses as may be incurred.
RESOLVED FURTHER THAT the Board ofDirectors of the Company (including any committeethereof ) and /or Mr. R. L. Gupta, Company Secretary ofthe Company be and are hereby severally authorized todo all such acts and take all such steps as may be considerednecessary, proper and expedient to give effect to thisResolution .”
3. To ratify the appointment of Branch Auditors and to fixtheir remuneration and if thought fit, to pass with orwithout modification(s), the following resolution as anOrdinary Resolution:
“RESOLVED THAT pursuant to the provisions ofSection 139, 142 and other applicable provisions, if any,of the Companies Act, 2013 and the Companies (Auditand Auditors) Rules, 2014 as amended from time to time,and pursuant to the recommendations of the AuditCommittee and resolution passed by the members at the28th Annual General Meeting of the Company held on26th September, 2014, the appointment of M/s. K R &Co., Chartered Accountants (Firm Registration No.025217N), as the Branch Auditors of the Company to holdoffice till the conclusion of 33rd Annual General Meeting,be and is hereby ratified at such remuneration as may berecommended by the Audit Committee and mutually agreed,between the Board of Directors and the Branch Auditorsplus out of pocket expenses as may be incurred.
RESOLVED FURTHER THAT the Board ofDirectors of the Company (including any committeethereof ) and /or Mr. R. L. Gupta, Company Secretary ofthe Company be and are hereby severally authorized todo all such acts and take all such steps as may be considerednecessary, proper and expedient to give effect to thisResolution”
SPECIAL BUSINESS:4. To consider and approve the retirement by rotation of
Mr. Kailash Chandra Shahra, Chairman and not to fill upthe vacancy so caused and in this regard to consider and
RUCHI SOYA INDUSTRIES LIMITED(CIN – L15140MH1986PLC038536) Regd. Office : “Ruchi House”, Royal Palms, SurveyNo. 169, Aarey Milk Colony, Near Mayur Nagar, Goregaon (East), Mumbai – 400 065.

Annual Report 2016-17
225
if thought fit, to pass with or without modification(s), thefollowing resolution as an Ordinary Resolution :
“RESOLVED THAT pursuant to the provisions ofSection 152 and all other applicable provisions, if any, ofthe Companies Act, 2013, Mr. Kailash Chandra Shahra(DIN: 00062698), Chairman, liable to retire by rotation atthis annual general meeting who does not offer himselffor re-appointment, be not re-appointed as a Director ofthe Company and the vacancy caused due to his retirementbe not filled up.
RESOLVED FURTHER THAT Mr. Dinesh ChandraShahra (DIN:00533055), Managing Director, Mr. VijayKumar Jain (DIN: 00098298), Executive Director andMr. R.L. Gupta, Company Secretary of the Company beand are hereby severally authorized to do all such acts,deeds, matters and things as may be considered necessaryin this regard for and on behalf of the Company, includingbut not limiting to, filing of necessary forms, returns andsubmissions under the Companies Act, 2013.”
5. To ratify the remuneration of Cost Auditors for thefinancial year ending 31st March, 2018 and in this regardto consider and if thought fit, to pass with or withoutmodification(s), the following resolution as an OrdinaryResolution:
“RESOLVED THAT pursuant to the provisions ofSection 148 and all other applicable provisions, if any, ofthe Companies Act, 2013, and the Companies (Audit andAuditors) Rules, 2014 {including any statutorymodification(s) or re-enactment thereof, for the time beingin force}, the remuneration payable to M/s. K G Goyal &Co., Cost Accountants (Firm Registration No. 000017),appointed by the Board of Directors as Cost Auditors toconduct the audit of the cost records of the Companyfor the financial year ending 31st March, 2018, amountingto ̀ 4,40,000/- (Rupees Four Lacs Forty Thousand Only)subject to payment of applicable taxes thereon andre-imbursement of out of pocket expenses, be and ishereby ratified and confirmed.
RESOLVED FURTHER THAT Mr. Dinesh ChandraShahra (DIN: 00533055), Managing Director, Mr. VijayKumar Jain (DIN: 00098298), Executive Director and Mr.R.L. Gupta, Company Secretary of the Company be andare hereby severally authorized to do all such acts, deeds,matters and things as may be considered necessary in thisregard for and on behalf of the Company, including butnot limiting to, filing of necessary forms, returns andsubmissions under the Companies Act, 2013.”
6. To approve revision in remuneration payable to Mr. DineshChandra Shahra, Managing Director and in this regard toconsider and if thought fit, to pass with or withoutmodification(s), the following resolution as a SpecialResolution:
“RESOLVED THAT pursuant to the provisions ofSection 197, Schedule V and other applicable provisions,if any, of the Companies Act, 2013 read with the Rulesmade thereunder, pursuant to the approval accorded bymembers by way of Special Resolution dated 25th March,2016 for the reappointment of Mr. Dinesh Chandra Shahra(DIN:00533055), as Managing Director of the Companywith effect from 7th January, 2016 to 6th January, 2019, theapproval of members of the Company be and is herebyaccorded to pay the revised remuneration to Mr. DineshChandra Shahra, Managing Director of the Company forthe remaining period of his tenure i.e. from 1st April, 2017to 6th January, 2019 as set out in the explanatory statementannexed to this notice.
RESOLVED FURTHER THAT where in any financialyear during the currency of his tenure, the Company hasno profits or inadequate profits, Mr. Dinesh ChandraShahra, Managing Director shall be paid such revisedremuneration (as set out in the explanatory statement) asminimum remuneration subject to approval of the CentralGovernment, if required, in terms of Section 197 of theCompanies Act, 2013.
RESOLVED FURTHER THAT Mr. Vijay Kumar Jain,Executive Director (DIN: 00098298) and Mr. R.L. Gupta,Company Secretary of the Company be and are herebyseverally authorized to do all such acts, deeds, matters,things and execute all such documents, instruments andwritings as may be necessary, desirable or expedient forthe aforesaid purpose, including filing of relevant formswith the Office of the Registrar of Companies,Maharashtra in accordance with the provisions of theCompanies Act, 2013 and the Rules made thereunder.”
By order of the Board of Directors
Registered Office:Ruchi Soya Industries Ltd.“Ruchi House”, Royal Palms,Survey No. 169, Aarey Milk Colony, R. L. GuptaNear Mayur Nagar, Goregaon (East), Company SecretaryMumbai - 400 065
Date : August 19, 2017Place : Mumbai
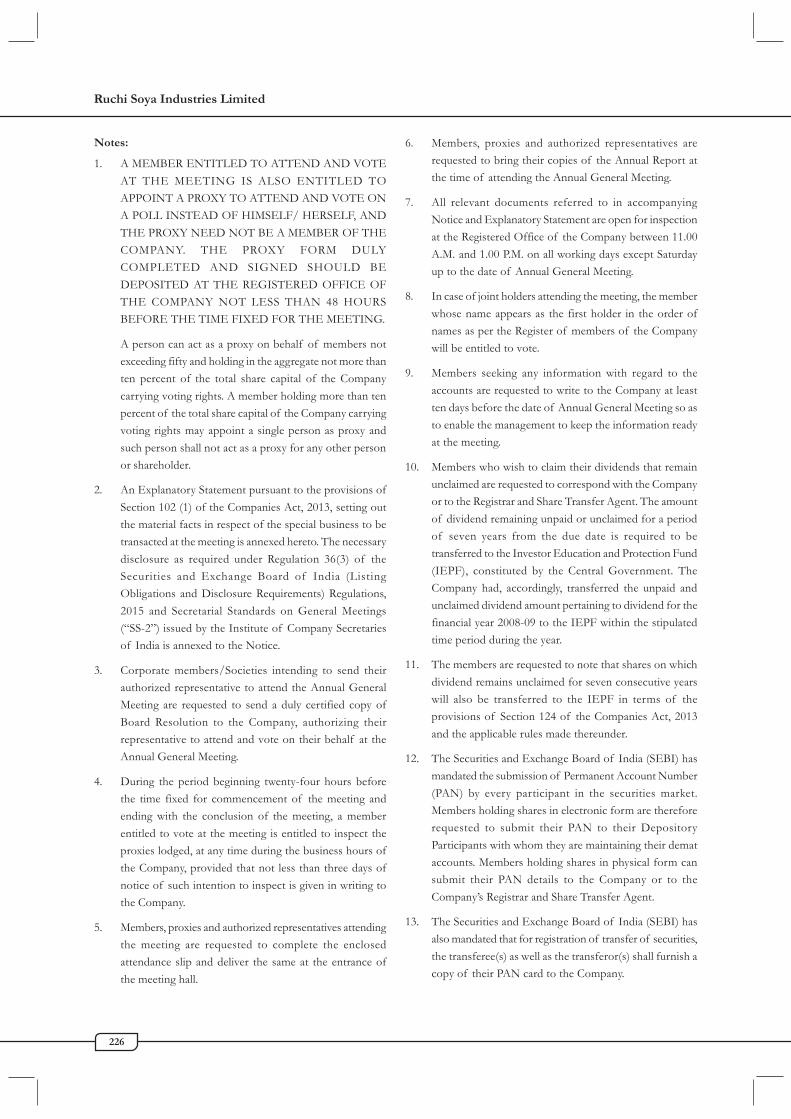
Ruchi Soya Industries Limited
226
Notes:
1. A MEMBER ENTITLED TO ATTEND AND VOTEAT THE MEETING IS ALSO ENTITLED TOAPPOINT A PROXY TO ATTEND AND VOTE ONA POLL INSTEAD OF HIMSELF/ HERSELF, ANDTHE PROXY NEED NOT BE A MEMBER OF THECOMPANY. THE PROXY FORM DULYCOMPLETED AND SIGNED SHOULD BEDEPOSITED AT THE REGISTERED OFFICE OFTHE COMPANY NOT LESS THAN 48 HOURSBEFORE THE TIME FIXED FOR THE MEETING.
A person can act as a proxy on behalf of members notexceeding fifty and holding in the aggregate not more thanten percent of the total share capital of the Companycarrying voting rights. A member holding more than tenpercent of the total share capital of the Company carryingvoting rights may appoint a single person as proxy andsuch person shall not act as a proxy for any other personor shareholder.
2. An Explanatory Statement pursuant to the provisions ofSection 102 (1) of the Companies Act, 2013, setting outthe material facts in respect of the special business to betransacted at the meeting is annexed hereto. The necessarydisclosure as required under Regulation 36(3) of theSecurities and Exchange Board of India (ListingObligations and Disclosure Requirements) Regulations,2015 and Secretarial Standards on General Meetings(“SS-2”) issued by the Institute of Company Secretariesof India is annexed to the Notice.
3. Corporate members/Societies intending to send theirauthorized representative to attend the Annual GeneralMeeting are requested to send a duly certified copy ofBoard Resolution to the Company, authorizing theirrepresentative to attend and vote on their behalf at theAnnual General Meeting.
4. During the period beginning twenty-four hours beforethe time fixed for commencement of the meeting andending with the conclusion of the meeting, a memberentitled to vote at the meeting is entitled to inspect theproxies lodged, at any time during the business hours ofthe Company, provided that not less than three days ofnotice of such intention to inspect is given in writing tothe Company.
5. Members, proxies and authorized representatives attendingthe meeting are requested to complete the enclosedattendance slip and deliver the same at the entrance ofthe meeting hall.
6. Members, proxies and authorized representatives arerequested to bring their copies of the Annual Report atthe time of attending the Annual General Meeting.
7. All relevant documents referred to in accompanyingNotice and Explanatory Statement are open for inspectionat the Registered Office of the Company between 11.00A.M. and 1.00 P.M. on all working days except Saturdayup to the date of Annual General Meeting.
8. In case of joint holders attending the meeting, the memberwhose name appears as the first holder in the order ofnames as per the Register of members of the Companywill be entitled to vote.
9. Members seeking any information with regard to theaccounts are requested to write to the Company at leastten days before the date of Annual General Meeting so asto enable the management to keep the information readyat the meeting.
10. Members who wish to claim their dividends that remainunclaimed are requested to correspond with the Companyor to the Registrar and Share Transfer Agent. The amountof dividend remaining unpaid or unclaimed for a periodof seven years from the due date is required to betransferred to the Investor Education and Protection Fund(IEPF), constituted by the Central Government. TheCompany had, accordingly, transferred the unpaid andunclaimed dividend amount pertaining to dividend for thefinancial year 2008-09 to the IEPF within the stipulatedtime period during the year.
11. The members are requested to note that shares on whichdividend remains unclaimed for seven consecutive yearswill also be transferred to the IEPF in terms of theprovisions of Section 124 of the Companies Act, 2013and the applicable rules made thereunder.
12. The Securities and Exchange Board of India (SEBI) hasmandated the submission of Permanent Account Number(PAN) by every participant in the securities market.Members holding shares in electronic form are thereforerequested to submit their PAN to their DepositoryParticipants with whom they are maintaining their demataccounts. Members holding shares in physical form cansubmit their PAN details to the Company or to theCompany’s Registrar and Share Transfer Agent.
13. The Securities and Exchange Board of India (SEBI) hasalso mandated that for registration of transfer of securities,the transferee(s) as well as the transferor(s) shall furnish acopy of their PAN card to the Company.

Annual Report 2016-17
227
14. The Annual Report 2016-17, the Notice of AGM alongwith the attendance slip/proxy form, are being sent byelectronic mode to those members whose e-mail addressesare registered with the Company/depositories, unless anymember has requested for a physical copy of the same.For members, who have not registered their e-mail addresses,physical copies are being sent by the permitted mode. Themembers may note that the Notice of the31st AGM and the Annual Report 2016-17 will also be availableon the Company’s website viz www.ruchisoya.com.
15. Members holding shares in physical form are requestedto intimate changes pertaining to their bank account details,mandates, nominations, change of address, e-mail addressetc., if any, to the Company or Company’s Registrar andShare Transfer Agent. Members holding shares inelectronic form must intimate the changes, if any, to theirrespective Depository Participants.
16. To support the “Green Initiative”, the members who havenot registered their e-mail addresses so far, are requestedto register their e-mail address for receiving allcommunication including Annual Report, Notices,Circulars etc. from the Company electronically.
17. The facility for making/varying/cancelling nomination isavailable for individual shareholders of the Company.Nominations can be made in Form SH-13 and anyvariation/cancellation thereof can be made by givingnotice in Form SH-14, prescribed under the Companies(Share Capital and Debentures) Rules, 2014 for thepurpose. The forms can be obtained from the Company/Registrar and Share Transfer Agent or from the websiteof the Ministry of Corporate Affairs at www.mca.gov.in.
18. The route map of the venue of the meeting is given atpage no. 234 of the Annual Report. The prominentlandmark for easy location of the venue of the Meeting isMantralaya, Nariman Point, Mumbai.
19. In compliance with the provisions of Section 108 of theCompanies Act, 2013, read with Rule 20 of the Companies(Management and Administration) Rules, 2014 as amendedfrom time to time and Regulation 44 of the SEBI (ListingObligations and Disclosure Requirements) Regulations,2015, the Company has provided the facility to its membersto exercise their right to vote electronically on the businessof the 31st Annual General Meeting through the electronicvoting (e-voting) service facilitated by the CentralDepository Services (India) Limited (CDSL). The facilityfor voting through ballot paper will also be made availableat the meeting and the members, who have not alreadycast their votes by remote e-voting shall be able to exercise
their right to vote at the meeting through ballot paper.The members who have cast their votes by remote e-votingprior to the meeting may attend the meeting but shall notbe entitled to cast their votes again.
A. The instructions for e-voting are as under:
(i) The e-voting period commences on Saturday,23rd September, 2017 at 10.00 AM and endson Tuesday, 26th September, 2017 at 5.00 PM.During this period, shareholders of theCompany, holding shares either in physicalform or in dematerialized form, as on the cut-off date i.e. 15th September, 2017, may cast theirvote electronically. The e-voting module shallbe disabled by CDSL for voting thereafter.Once the vote on a resolution is cast by themember, the member shall not be allowed tochange it subsequently.
(ii) The voting rights of the members shall be inproportion to the paid-up value of their sharesin the equity share capital of the Company ason the cut-off date. A person whose name isrecorded in the Register of members or in theRegister of Beneficial Owners maintained bythe Depositories as on the cut-off date onlyshall be entitled to avail the facility for remotee-voting as well as voting at the meeting.
(iii) The shareholders should log on to the e-votingwebsite www.evotingindia.com.
(iv) Click on Shareholders.
(v) Now Enter your User ID as under:-
a. For CDSL: 16 digits beneficiary ID,
b. For NSDL: 8 Character DP ID followedby 8 Digits Client ID,
c. Members holding shares in PhysicalForm should enter folio numberregistered with the Company.
(vi) Next enter the Image Verification as displayedand Click on Login.
(vii) If you are holding shares in demat form andhad logged on to www.evotingindia.com andvoted on an earlier voting of any Company,then your existing password is to be used.
(viii) If you are a first time user follow the stepsgiven below:

Ruchi Soya Industries Limited
228
For Members holding shares in Demat
Form and Physical Form
PAN Enter your 10 digit alpha-numeric PAN issuedby Income Tax Department (Applicable forboth demat shareholders as well as physicalshareholders)
Members who have not updated theirPAN with the Company/DepositoryParticipant are requested to use the firsttwo letters of their name and the 8 digitsof the sequence number in the PAN field.
In case the sequence number is less than8 digits enter the applicable number of0’s before the number after the first twocharacters of the name in CAPITALletters. e.g. If your name is Ramesh Kumarwith sequence number 1 then enterRA00000001 in the PAN field.
Dividend Enter the Dividend Bank Details or Date ofBank Details Birth (in dd/mm/yyyy format) as recordedor Date of in your demat account or in the CompanyBirth (DOB) records in order to login.
If both the details are not recorded withthe depository or Company, please enterthe member id/folio number in theDividend Bank details field as mentionedin instruction (iv).
(ix) After entering these details appropriately, clickon “SUBMIT” tab.
(x) Members holding shares in physical form willthen directly reach the Company selectionscreen. However, members holding shares indemat form will now reach ‘Password Creation’menu wherein they are required to mandatorilyenter their login password in the new passwordfield. Kindly note that this password is to bealso used by the demat holders for voting forresolutions of any other Company on whichthey are eligible to vote, provided that Companyopts for e-voting through CDSL platform. It isstrongly recommended not to share yourpassword with any other person and take utmostcare to keep your password confidential.
(xi) For Members holding shares in physical form,the details can be used only for e-voting onthe resolutions contained in this Notice.
(xii) Click on the EVSN for “RUCHI SOYA
INDUSTRIES LIMITED”.
(xiii) On the voting page, you will see“RESOLUTION DESCRIPTION” andagainst the same the option “YES/NO” forvoting. Select the option YES or NO as desired.The option YES implies that you assent to theResolution and option NO implies that youdissent to the Resolution.
(xiv) Click on the “RESOLUTIONS FILE LINK”if you wish to view the entire Resolutiondetails.
(xv) After selecting the resolution you have decidedto vote on, click on “SUBMIT”. Aconfirmation box will be displayed. If you wishto confirm your vote, click on “OK”, else tochange your vote, click on “CANCEL” andaccordingly modify your vote.
(xvi) Once you “CONFIRM” your vote on theresolution, you will not be allowed to modifyyour vote.
(xvii) You can also take a print of the votes cast byclicking on “Click here to print” option on theVoting page.
(xviii) If a demat account holder has forgotten thelogin password then Enter the User ID andthe image verification code and click on ForgotPassword & enter the details as prompted bythe system.
(xix) Shareholders can also cast their vote usingCDSL’s mobile app m-Voting available forandroid based mobiles. The m-Voting app canbe downloaded from Google Play Store.iPhone and Windows phone users candownload the app from the App Store and theWindows Phone Store respectively. Pleasefollow the instructions as prompted by themobile app while voting on your mobile.
(xx) Note for Non – Individual Shareholders andCustodians
Non-Individual shareholders (i.e. otherthan Individuals, HUF, NRI etc.) andCustodian are required to log on towww.evotingindia.com and registerthemselves as Corporates.

Annual Report 2016-17
229
A scanned copy of the RegistrationForm bearing the stamp and sign of theentity should be emailed [email protected].
After receiving the login details they haveto create a compliance user id using theadmin login and password. Thecompliance user would be able to linkthe account(s) for which they wish tovote on.
The list of accounts linked in the loginshould be emailed [email protected] andon approval of the accounts they wouldbe able to cast their vote.
A scanned copy of the Board Resolutionand Power of Attorney (POA) whichthey have issued in favour of theCustodian, if any, should be uploaded inPDF format in the system for thescrutinizer to verify the same.
(xxi) In case you have any queries or issues regardinge-voting, you may refer the Frequently AskedQuestions (“FAQs”) and e-voting manualavailable at www.evotingindia.com, under helpsection or write an email [email protected].
B. The Board of Directors of the Company hasappointed Mr. Prashant D. Diwan, PracticingCompany Secretary as the Scrutinizer to scrutinizethe remote e-voting/ballot process in a fair andtransparent manner.
C. The Scrutinizer shall not later than two days ofconclusion of 31st Annual General Meeting, submita consolidated scrutinizer’s report to the Chairman/Managing Director of the Company, who shalldeclare the results forthwith.
EXPLANATORY STATEMENT
[Pursuant to provisions of Section 102(1) of the CompaniesAct, 2013]
Item No. 2
This explanatory statement is provided though strictly notrequired as per Section 102 of the Companies Act, 2013.
M/s. P.D. Kunte & Co., Chartered Accountants (FirmRegistration No. 105479W) were appointed as Statutory Auditorsof the Company at the Twenty Eighth Annual General Meeting
of the Company held on 26th September, 2014 for a term ofthree years to hold office till the conclusion of 31st AnnualGeneral Meeting and accordingly, the term of the existingStatutory Auditors, M/s. P. D. Kunte & Co., CharteredAccountants is upto the conclusion of this Annual GeneralMeeting.
In terms of the provisions of Section 139 of the CompaniesAct, 2013, no listed Company can appoint or re-appoint an auditfirm as auditor for more than two terms of five consecutiveyears. However, the Companies existing on the commencementof the Companies Act, 2013 were allowed three years’ time tocomply with this provision. M/s. P. D. Kunte & Co., CharteredAccountants have already completed their terms and wouldcomplete the three years’ time as mentioned above at 31st AnnualGeneral Meeting.
The Board of Directors has, based on the recommendation ofthe Audit Committee, at its meeting held on 14th August, 2017proposed the appointment of M/s. Chaturvedi & Shah,Chartered Accountants (Firm Registration No. 101720W), asStatutory Auditors of the Company for a period of fiveconsecutive years, to hold office from the conclusion of thisAnnual General Meeting till the conclusion of the Thirty SixthAnnual General Meeting of the Company, subject to ratificationof their appointment by members at every Annual GeneralMeeting held after 31st Annual General Meeting.
M/s. Chaturvedi & Shah, Chartered Accountants have givenconsent to their appointment as Statutory Auditors and haveconfirmed that if appointed, their appointment will be inaccordance with the provisions of Companies Act, 2013. Theyhave also confirmed that their Firm has been subjected to peerreview process of the Institute of Chartered Accountants ofIndia (ICAI) and they hold a valid certificate issued by the PeerReview Board of the ICAI. The Board recommends theOrdinary Resolution set out at Item No. 2 of the Notice forapproval of the members.
None of the Directors or Key Managerial Personnel and theirrelatives is, in any way, concerned or interested, financially orotherwise, in the resolution as set out at Item No. 2 of the Notice.
Item No. 4
Pursuant to the provisions of Section 152 of the CompaniesAct, 2013 and in accordance with the Articles of Associationof the Company, Mr. Kailash Chandra Shahra, Chairman ofthe Company is liable to retire by rotation at the ensuing AnnualGeneral Meeting of the Company. Mr. Kailash Chandra Shahrahas expressed his desire to retire from the Board of Directorsat the ensuing Annual General Meeting and does not offerhimself for re-appointment as Director due to his advancedage and health reasons.

Ruchi Soya Industries Limited
230
Mr. Kailash Chandra Shahra has been serving on the Boardsince inception of the Company. During his tenure of office,he has made distinct and immense contribution for the growthof the Company. The Board places on record its sincereappreciation and recognition for the invaluable contributionmade by him during his tenure with the Company.
The members may note that post retirement of Mr. KailashChandra Shahra, the Board of Directors will comprise of fivedirectors i.e. three Independent Directors, Managing Directorand Executive Director. The Board of Directors is of theopinion that the vacancy caused due to retirement by rotationof Mr. Kailash Chandra Shahra is not required to be filled upand hence, the Board does not propose to fill the vacancy arisingfrom the retirement of Mr. Kailash Chandra Shahra. The Boardrecommends the Ordinary Resolution set out at Item No. 4 ofthe Notice for approval of the members.
Mr. Dinesh Chandra Shahra (DIN: 00533055), ManagingDirector and Mr. Kailash Chandra Shahra (DIN:00062698),Chairman of the Company, retiring by rotation at this AnnualGeneral Meeting, with their relatives, are interested in theresolution. None of the other directors/key managerialpersonnel of the Company and their relatives are in any wayconcerned or interested, financially or otherwise, in theresolution as set out at Item No. 4 of the Notice.
Item No. 5
The Board of Directors of the Company, on therecommendation of the Audit Committee, has approved theappointment of M/s. KG Goyal & Co., Cost Accountants, toconduct the audit of the cost records of the Company for thefinancial year ending 31st March, 2018 at a remuneration of` 4,40,000/- (Four Lacs Forty Thousand Only), subject topayment of applicable taxes thereon and re-imbursement ofout of pocket expenses.
In terms of the provisions of Section 148(3) of the CompaniesAct, 2013 read with Rule 14 of the Companies (Audit andAuditors) Rules, 2014, the remuneration payable to the CostAuditor is required to be ratified by the members of theCompany. Accordingly, consent of the members is sought toratify the remuneration payable to the Cost Auditors.
The Board recommends the Ordinary Resolution as set out atItem No. 5 of the Notice for approval of the members.
None of the Directors or Key Managerial Personnel and theirrelatives, is concerned or interested, financially or otherwise, inthe resolution as set out at Item No. 5 of the Notice.
Item No. 6
The members of the Company had re-appointed Mr. DineshChandra Shahra as Managing Director of the Company bymeans of passing a special resolution through postal ballot dated25th March, 2016 for a further period of three years from7th January, 2016 to 6th January, 2019 in accordance with theprovisions of Sections 196, 197, 203 read with Schedule V andother applicable provisions, if any, of the CompaniesAct, 2013. At the time of re-appointment, the Company hadadequate profits and the remuneration was well within the limitsprescribed under the Companies Act, 2013.
During the financial year 2016-17, the revenue of your Companydropped to an unforeseen level of ` 18,620 Crores. The profit/(loss) after tax of ` (1,257) Crores as against ` (1,062) Croresduring the previous year. The adverse business performance inthe last two years was primarily due to volatility in commodityand currency markets, lower domestic supply of oil seed,commercial disparity in core business operations and challengingbusiness environment. Also, stretched working capital cycleimpacted liquidity, capacity utilization of production facilities andoperational performance and consequently led to far higherprovisioning on debts under expected loss model as per theprovisions of Ind AS. Owing to the above factors, the financialperformance of the Company during the year 2016-17 did notmeet the expectations and is not likely to have adequate profitsfor the purpose of managerial remuneration in the financial year2017-18.
In terms of the provisions of the Section 197 of the CompaniesAct, 2013, if in any financial year, the Company has no profitsor its profits are inadequate, payment of remuneration to itsmanagerial personnel may be made only in accordance with theprovisions of Schedule V of the Companies Act, 2013.
The members at their 30th Annual General Meeting held on14th September, 2016 had approved revision/reduction inremuneration of Mr. Dinesh Chandra Shahra, ManagingDirector for the period from 1st June, 2016 to 31st March, 2017.The salary was revised from ` 17,50,000/- to ` 10,00,000/- permonth for the period from 1st June, 2016 to 31st March, 2017.
Keeping in view the above facts and in consultation withMr. Dinesh Chandra Shahra, Managing Director, theNomination and Remuneration Committee and the Board ofDirectors of the Company, at their respective meetings held on14th August, 2017, subject to approval of members of theCompany, have proposed and recommended the revised/reduced remuneration payable to Mr. Dinesh Chandra Shahrafor the remaining period of his tenure i.e. from 1st April, 2017to 6th January, 2019. The details of revised remuneration are asfollows:
Annual Report 2016-17
231
1. Salary: ` 10, 00,000/- per month.
2. Medical Reimbursement: Reimbursement of expensesincurred for self and family subject to a ceiling of sixmonths salary in a year.
3. Leave Travel Concession: Reimbursement of expensesincurred for self and family once in a year in accordancewith the Rules of the Company.
4. Club Fees: Reimbursement of fees of clubs subject tomaximum of 2 (two) clubs including admission and lifemembership fees.
5. Personal Accident Insurance: Reimbursement of premiumnot exceeding ` 1,00,000/- per annum.
6. Provident Fund: Company’s contribution towardsprovident fund as per the rules of the Company for thetime being in force.
7. Gratuity: As per rules of the Company but shall not exceedone half month’s salary for each completed year of service.
8. Telephone: Company’s telephone will be provided at theresidence for Company’s business and personal use.
9. Car: A car with driver will be provided to him forCompany’s business and personal use.
10. Rent free furnished accommodation and reimbursementof cost of electricity, water and maintenance charges inrespect thereof.
The information as required under Schedule V of theCompanies Act, 2013, is attached herewith. This explanatorystatement may also be read and treated as disclosure incompliance with the requirements of Section 190 of theCompanies Act, 2013.
The Board recommends the special resolution as set out at ItemNo. 6 of the Notice for approval of the members.
Mr. Dinesh Chandra Shahra (DIN: 00533055), ManagingDirector and Mr. Kailash Chandra Shahra (DIN: 00062698),Chairman of the Company, retiring by rotation at this AnnualGeneral Meeting, with their relatives, are interested in theresolution. None of the other directors/key managerialpersonnel of the Company and their relatives are in any wayconcerned or interested, financially or otherwise, in theresolution as set out at Item No. 6 of the Notice.
By order of the Board of DirectorsRegistered Office:
Ruchi Soya Industries Ltd.
“Ruchi House”, Royal Palms,Survey No. 169, Aarey Milk Colony,Near Mayur Nagar, Goregaon (East), R. L. Gupta
Mumbai - 400 065 Company Secretary
Date : August 19, 2017Place : Mumbai
ATTACHMENT TO THE EXPLANATORY
STATEMENT FOR ITEM NO. 6
The following information pertaining to Mr. Dinesh
Chandra Shahra is furnished pursuant to the provisions of
Schedule V to the Companies Act, 2013:
I. GENERAL INFORMATION:
(i) Nature of Industry
The Company is a leading manufacturer of healthier edibleoils, soya food, premium table spread, vanaspati and bakeryfats and is one of the highest exporters of soya meal,lecithin and other food ingredients from India. TheCompany is engaged in the business of manufacturingand trading of edible oils and allied activities.
(ii) Date of commencement of commercial production
December, 1986.
(iii) In case of new Companies, expected date of
commencement of activities as per project approved
by financial institutions appearing in the prospectus
Not Applicable.
(iv) Financial performance based on given indicators
Figures of revenue, sales and profit recorded during lastfive financial years are as follows:
(` in Crores)
Financial Revenue Branded Export Profit
Year Sales Sales (Loss)
after tax
2016-17 18,620 8,646 1,052 (1,257)
2015-16 27,805 9,094 1,754 (1,062)
2014-15 28,412 8,357 3,360 61
2013-14 24,601 6,965 3,599 13
2012-13 26,485 6,348 4,321 236
(v) Foreign investments or collaborators, if any
The Company has not entered into any foreigncollaboration. As per the shareholding pattern as on31st March, 2017, 11 FIIs hold 15,13,686 equity sharesrepresenting 0.45%, 5 Overseas Corporate Bodies hold1,24,95,110 equity shares representing 3.74% and 30Foreign Corporate Bodies hold 7,37,22,467 representing22.07% of the paid-up equity share capital of theCompany.

Ruchi Soya Industries Limited
232
II. INFORMATION ABOUT THE APPOINTEE:
S. No. Particulars Mr. Dinesh Chandra Shahra
(a) Background Details Mr. Dinesh Chandra Shahra, aged 65 years completed his graduation in engineeringfrom HBTI, Kanpur (UP) from the faculty of Chemical Engineering and has strongdomain knowledge and more than 40 years relevant experience in the industry and inthe field of Corporate Strategy and General Management & Administration. He isassociated with the Company since inception and under his visionary leadership, theCompany is one of the largest integrated oilseed solvent extraction and edible oilrefining Companies in terms of oilseed crushing and oil refining capacity.
(b) Past Remuneration ` 158.71 Lacs for the Financial Year 2016-17.
(c) Recognition or Awards Mr. Dinesh Chandra Shahra has received “Oilman of the year” award by Globoil inthe year 1999 and conferred with “Globoil Man of the Decade” award in the year2006 and also recipient of several awards including Dun & Bradstreet’s ‘The No-1Food Processing Company in India’; and Solvent Extractors Association Award forcontribution towards development of Indian Vegetable Oil Industry. He was honoredas the Best CEO by Business World Magazine in the year 2010. Mr. Dinesh ChandraShahra was also a member of Advisory Committee constituted by the Governmentof India for enhancing commodity futures and headed various national andinternational organizations including Soya Food Promotion & Welfare Association(SFPWA).
(d) Job profile and his suitability As Managing Director of the Company he is responsible for the management of theCompany, subject to the superintendence, guidance and control of the Board ofDirectors. Taking into account his vast experience, educational background, deepknowledge about the industry and the nature and size of operations of the Company,he is a fit and proper person as the Managing Director of the Company.
(e) Remuneration Proposed The proposed/revised remuneration details are provided in the respective explanatorystatement to the special business.
(f) Comparative Remuneration Taking into consideration the size of the Company, the profile of Mr. Shahra, theprofile with respect to responsibilities shouldered on him and the industry bench marks, the proposedindustry, size of the Company, revised remuneration is reasonable, justified and commensurate with the remunerationprofile of the position packages paid in the comparable Companies.and person
(g) Pecuniary relationship directly Mr. Dinesh Chandra Shahra has no pecuniary relationship directly or indirectly withor indirectly with the Company, the Company or its managerial personnel other than his remuneration in the capacityor relationship with managerial of a Managing Director. He holds 21,11,383 (0.63%) equity shares of the Company.personnel, if any
III. OTHER INFORMATION:
(a) Reasons for loss or inadequate profits
- Volatility in commodity and currency markets
- Lower domestic supply of oil seed and commercial disparity in core businesses
- Challenging business environment and stretched working capital cycle
- Lower level of liquidity impacting capacity utilization and business operations
- Higher provisioning on debts under expected loss model as per the provisions of Ind AS

Annual Report 2016-17
233
(b) Steps taken or proposed to be taken for improvement
- Actively rebalanced business portfolio
- Focused on core businesses with strong orientation towards branded products sales
- Cost rationalization across businesses
- Implementation of energy efficient and other value optimization activities at plant locations towards achieving higherproductivity
- Control over credit , improvement in operating cycle and cost effective use of resources
- Initiated the process of working with the stakeholders towards value maximisation and debt reduction/sustainability
(c) Expected increase in productivity and profit in measurable terms
With the support of stakeholders, the performance of the Company is expected to improve in the years ahead in terms ofhigher turnover, improved branded sales volumes, better productivity and operating performance and sustainable operationsas a result of above measures taken for improvement in Company’s performance.
PROFILE OF DIRECTOR SEEKING VARIATION IN THE TERMS AND CONDITIONS OF REMUNERATIONAT THE 31ST ANNUAL GENERAL MEETING PURSUANT TO SECRETARIAL STANDARD ON GENERALMEETING (SS-II) AND REGULATION 36(3) OF THE SEBI (LISTING OBLIGATIONS AND DISCLOSUREREQUIREMENTS) REGULATIONS, 2015
NAME OF DIRECTOR - MR. DINESH CHANDRA SHAHRA
Mr. Dinesh Chandra Shahra is 65 years old and is B.E. (Chemical Engineering) from HBTI, Kanpur, UP and has more than40 years experience in the field of corporate strategy and general management & administration. He was inducted on the Board ofDirectors on 7th January, 1986. He has been guiding the Company since three decades and has immensely contributed to thegrowth and diversification of the Company.
Mr. Dinesh Chandra Shahra is not related to any director or key managerial personnel, except Mr. Kailash Chandra Shahra(DIN: 00062698) Chairman of the Company. He holds in his individual capacity 21,11,383 equity shares (0.63%) of the Company.He has attended all the meetings of the Board of Directors held during the financial year 2016-17. During the financial year2016-17, he has drawn the total remuneration of ` 158.71 lacs and the details of revised remuneration payable to Mr. DineshChandra Shahra is provided in the explanatory statement of this Notice.
The details of his Directorships, Memberships/Chairmanships of Committees of their Boards as on 31st March, 2017 are as under:-
S. Name of the Company S. Name of the CompanyNo. No.
1. Ruchi Worldwide Ltd. 5. Delite Ventures Pvt. Ltd.
2. Evershine Oleochem Ltd. 6. RSIL Holdings Pvt. Ltd.
3. IFarm Venture Advisors Pvt. Ltd. 7. Indivar Beauty Pvt. Ltd.
4. IFarm Equity Advisors Pvt. Ltd. 8. Ruchi Ethiopia Holdings Ltd.
He is Chairman of Corporate Social Responsibility Committee of the Board of Ruchi Worldwide Ltd.

Ruchi Soya Industries Limited
234
Ruchi Soya Industries Limited
31st Annual General Meeting
on
Wednesday, 27th September, 2017at 11.30 AM
at Rangswar Hall, Chavan Centre, Yashwantrao Chavan Pratishthan,Gen. Jagannathrao Bhonsle Marg, Mumbai - 400021
ROUTE MAP TO AGM VENUE
Y. B. CHAVAN AUDITORIUM,Yashwantrao Chavan Pratishthan,Gen. Jagannathrao Bhonsale Marg,Mumbai-400 021.

235
FORM NO. MGT-11PROXY FORM
[Pursuant to section 105(6) of the Companies Act, 2013 and rule 19(3) of the Companies(Management and Administration) Rules, 2014]
Name of the member (s) : ......................................................................................................................................................................
Registered address : ......................................................................................................................................................................
E-mail id : ......................................................................................................................................................................
Folio No./Client Id* : .................................................................. DP ID* : ...........................................................................
*Applicable to shareholders holding shares in electronic form.
I/We ............................................................................................................... (name) of ..............................................................................
(place) being the holder(s) of ................................................ shares of the above named Company, hereby appoint :
1. Name: .......................................................................................................................................................................................................
Address: ....................................................................................................................................................................................................
E-mail Id: ....................................................................................................... Signature: ............................................., or failing him
2. Name: .......................................................................................................................................................................................................
Address: ....................................................................................................................................................................................................
E-mail Id: ....................................................................................................... Signature: ............................................., or failing him
3. Name: .......................................................................................................................................................................................................
Address: ....................................................................................................................................................................................................
E-mail Id: ....................................................................................................... Signature: .............................................
CU
T H
ERE
ATTENDANCE SLIP
DP.Id* Folio No.
Client Id* : No. of Shares
*Applicable to shareholders holding shares in electronic form
Name and Address of Shareholder : ..........................................................................................................................................
..........................................................................................................................................................................................................................
I hereby record my presence at the 31st Annual General Meeting of Ruchi Soya Industries Limited, which is scheduled to be heldon Wednesday, September 27, 2017 at 11.30 A.M. at Rangswar Hall, Chavan Centre, Yashwantrao Chavan Pratishthan,Gen. Jagannathrao Bhonsle Marg, Mumbai-400 021.
Signature of Shareholder
Continued overleaf
RUCHI SOYA INDUSTRIES LIMITED(CIN – L15140MH1986PLC038536)
Regd. Office : “Ruchi House”, Royal Palms, Survey, No.169, Aarey Milk Colony, Near Mayur Nagar,Goregaon (East), Mumbai – 400 065.
RUCHI SOYA INDUSTRIES LIMITED(CIN – L15140MH1986PLC038536)
Regd. Office : “Ruchi House”, Royal Palms, Survey, No.169, Aarey Milk Colony, Near Mayur Nagar,Goregaon (East), Mumbai – 400 065.

236
CU
T H
ERE
as my/our proxy to attend and vote (on a poll) for me/us and on my / our behalf at the 31st Annual General Meeting of theCompany to be held on 27th day of September, 2017 at 11.30 AM at Rangswar Hall, Chavan Centre, Yashwantrao ChavanPratishthan, Gen. Jagannathrao Bhonsle Marg, Mumbai - 400021 and at any adjournment thereof in respect of such resolutions asare indicated below :
Resolution Resolution For AgainstNo.
1 To consider and adopt the audited standalone financial statements of the Companyfor the financial year ended March 31, 2017, the reports of Board of Directors andAuditors thereon; and the audited consolidated financial statements of the Companyfor the financial year ended March 31, 2017.
2 To appoint Auditors in place of retiring auditors M/s P. D. Kunte & Co., CharteredAccountants and to fix their remuneration.
3 To ratify the appointment of Branch Auditors and to fix their remuneration.
4 To consider and approve the retirement by rotation of Mr. Kailash Chandra Shahra,Chairman and not to fill up the vacancy so caused.
5 To ratify the remuneration of the Cost Auditors for the financial year ended March 31,2018.
6 To approve revision in remuneration payable to Mr. Dinesh Chandra Shahra, ManagingDirector.
Signed this day of 2017
Signature of shareholder Signature of Proxy holder
Note : This form of proxy in order to be effective should be duly completed and deposited at the Registered Office of the Company, not lessthan 48 hours before the commencement of the Meeting
AffixRevenueStamp

CORPORATE INFORMATION
BOARD OF DIRECTORS Chairman Kailash Shahra
Managing Director Dinesh Shahra
Directors Vijay Kumar Jain Executive Director
Prabhu Dayal Dwivedi (upto April 28, 2017)
N. Murugan
Navin Khandelwal
Meera Dinesh Rajda
CHIEF FINANCIAL OFFICER Anil Singhal
COMPANY SECRETARY R. L. Gupta
AUDITORSP. D. Kunte & Co. (Regd.)
COST AUDITORSK. G. Goyal & Co.
BANKERSAxis Bank Limited Bank of Baroda Bank of India Bank of Maharashtra Central Bank of India Corporation Bank Dena Bank ICICI Bank Limited IDBI Bank Limited Oriental Bank of Commerce Punjab National Bank State Bank of India Syndicate Bank The Karur Vysya Bank Limited UCO Bank Union Bank of India
REGISTERED OFFICERuchi House Royal Palms, Survey No.169, Aarey Milk Colony, Near Mayur Nagar, Goregaon (East) Mumbai – 400 065 Maharashtra
Phone: (+91-22) 61090100 / 200 E-mail: [email protected] Website: www.ruchisoya.com
SHARE TRANSFER AGENTSarthak Global Limited 170/10, Film Colony, R.N.T. Marg, Indore – 452 001 Madhya Pradesh
Phone: (+91-731) 4279626 / 2523545 E-mail: [email protected]
ADMINISTRATIVE & HEAD OFFICE301, Mahakosh House, 7/5, South Tukoganj Nath Mandir Road, Indore – 452 001 Madhya Pradesh
Phone: (+91-731) 2513281 / 282 / 283 E-mail: [email protected] Website: www.ruchisoya.com
RUCHI SOYA INDUSTRIES LIMITED
CIN: L15140MH1986PLC038536
Registered Office: Ruchi House, Royal Palms, Survey No.169, Aarey Milk Colony, Near Mayur Nagar, Goregaon (East), Mumbai – 400 065, Maharashtra Phone: (+91-22) 61090100 / 200 E-mail: [email protected]
If undelivered, please return to: Sarthak Global Limited Registrars and Share Transfer Agents (Unit: Ruchi Soya Industries Limited)
170/10, R. N. T. Marg, Film Colony, Indore – 452 001, Madhya PradeshPhone: (+91-731) 4279626 / 2523545 E-mail: [email protected]