transcript of the october 1, 2013, iepr lead … 01, 2013 · california energy commission (cec) ......
TRANSCRIPT

1
CALIFORNIA REPORTING, LLC 52 Longwood Drive, San Rafael, California 94901 (415) 457-4417
BEFORE THE
CALIFORNIA ENERGY COMMISSION (CEC) In the matter of ) ) Docket No. 13-IEP-1C 2013 Integrated Energy ) Policy Report ) (2013 IEPR) )
IEPR LEAD COMMISSIONER WORKSHOP
REVISED ELECTRICITY AND NATURAL GAS DEMAND FORECASTS 2014-2024
Cal/EPA Headquarters Building Byron Sher Auditorium
1001 "I" Street, Second Floor Sacramento, California 95814
Tuesday, October 1, 2013 10:00 A.M.
Reported by: Kent Odell

2
CALIFORNIA REPORTING, LLC 52 Longwood Drive, San Rafael, California 94901 (415) 457-4417
APPEARANCES COMMISSIONERS PRESENT: Robert Weisenmiller Andrew McAllister STAFF PRESENT: Heather Raitt, CEC Chris Kavalec, CEC, Demand Analysis Office, Electricity Supply Analysis Division Malachi Weng-Gutierrez, CEC, Demand Analysis Office, Electricity Supply Analysis Division Asish Gautam, CEC, Demand Analysis Office, Electricity Supply Analysis Division Tim Olson, CEC, Transportation Energy Office, Fuels and Transportation Division Nick Fugate, CEC, Demand Analysis Office, Electricity Supply Analysis Division ALSO PRESENT: Dan Cayan, Scripps Institute of Oceanography Analisa Bevan, Air Resources Board Floyd Kneipe, Navigant Simon Baker, California Public Utilities Commission, Energy Division Sierra Martinez, Natural Resources Defense Council, California Energy Projects Sasha Cole, CA Public Utilities Commission, Energy Division Anna Wong, California Air Resources Board Tim Vonder, San Diego Gas & Electric Company Hongyan Sheng, Southern California Edison Ipek Connolly, Pacific Gas & Electric Company, Load Forecasting Group Nate Toyama, Sacramento Municipal Utilities District PUBLIC COMMENT Bill Monsen, MRW and Associates, representing IEP Lorenzo Kristov, Independent System Operator
3
CALIFORNIA REPORTING, LLC 52 Longwood Drive, San Rafael, California 94901 (415) 457-4417
INDEX
PAGE Introduction Heather Raitt, IEPR Lead 5 Opening Comments Commissioner Andrew McAllister, IEPR Lead 7 Commissioner Chair Robert B. Weisenmiller, IEPR Associate 10 Commissioner Statewide Forecast Results Chris Kavalec, Energy Commission 10 Climate Change Impacts Dan Cayan, Scripps Institute of Oceanography 38 Electricity and Natural Gas Rate Projections Malachi Weng Gutierrez, Energy Commission 60 Additional Achievable Energy Savings Chris Kavalec, Energy Commission 77 Public Comments 104 Distributed Generation Impacts Asish Gautam, Energy Commission 111 Electric Vehicle Forecast Tim Olson, Energy Commission 120 Anna Wong, Air Resources Board 136 San Diego Gas and Electric (SDG&E) Planning Area Forecast Nick Fugate, Energy Commission 139

4
CALIFORNIA REPORTING, LLC 52 Longwood Drive, San Rafael, California 94901 (415) 457-4417
INDEX (Continued)
PAGE
SDG&E Comments/Response Tim Vonder 143 Southern California Edison (SCE) Planning Area Forecast Nick Fugate, Energy Commission 144 SCE Comments/Response Hougyan Sheng 149 Pacific Gas and Electric (PG&E) Planning Area Forecast Nick Fugate, Energy Commission 160 PG&E Comments/Response Ipek Connolly, PG&E, Load Forecasting Group Lead 163 Los Angeles Department of Water and Power (LADWP) Planning Area Forecast Malachi Weng Gutierrez, Energy Commission 167 Sacramento Municipal Utility District (SMUD) Planning Area Forecast Malachi Weng Gutierrez, Energy Commission 173 SMUD Comments/Response Nate Toyama, SMUD 177 Public Comment 196 Adjournment 203 Reporter's Certificate 204 Transcriber's Certificate 205
1

5
CALIFORNIA REPORTING, LLC 52 Longwood Drive, San Rafael, California 94901 (415) 457-4417
P R O C E E D I N G S 1
OCTOBER 1, 2013 10:09 A.M. 2
MS. RAITT: Okay, good morning. Welcome 3
to today's IEPR workshop on the Revised 4
Electricity and Natural Gas Demand Forecasts. 5
I'm Heather Raitt, the Lead for the IEPR. 6
First, a few housekeeping items. 7
Restrooms are out the doors and to the left and 8
there's a snack room on the first floor. 9
Today's workshop is being broadcast through our 10
WebEx Conferencing System and parties are to be 11
aware that you're being recorded. We'll post 12
the audio recording on the Commission's website 13
in a couple of days with a transcript in about 14
three weeks. 15
Today's agenda is very full. The morning 16
will begin with a presentation by staff on the 17
forecast results, followed by a presentation 18
from Scripps Institute of Oceanography, and then 19
presentations from staff on electricity and 20
natural gas rate reductions, distributed 21
generation impacts, and additional and 22
achievable energy savings. 23
We will then provide a brief opportunity 24
for public comments before breaking lunch at 25

6
CALIFORNIA REPORTING, LLC 52 Longwood Drive, San Rafael, California 94901 (415) 457-4417
about 12:30. If possible, please hold your 1
comments until the end of the day, but if your 2
schedule does not allow for that, we will have, 3
as I said, a brief comment period before lunch. 4
After lunch, we will hear from staff of 5
the Energy Commission and the Air Resources 6
Board on an Electric Vehicle forecast, and then 7
we will hear from the Energy Commission staff on 8
forecasts for the largest utility Planning Areas 9
with responses from the utilities. We will then 10
take public comments; we are asking parties to 11
limit their comments to three minutes during the 12
public comment period. We'll take comments 13
first from those in the room, then followed by 14
those participating by WebEx, and finally from 15
those who are phone-in only. For those in the 16
room who would like to make comments, please 17
fill out a blue card and give it to me, or to 18
Lynette, and when it's your turn to speak, 19
please come to the podium and we have a 20
microphone there, or here, and speak into the 21
microphone. It's also helpful to give your 22
business card to the Court Reporter. For WebEx 23
participants, we'll use the chat function to 24
tell our WebEx coordinator that you want to ask 25

7
CALIFORNIA REPORTING, LLC 52 Longwood Drive, San Rafael, California 94901 (415) 457-4417
a question or make a comment during the public 1
comment period, and we'll either relay your 2
question or open your line at the appropriate 3
time. For phone-in participants, we'll open 4
lines after we've taken comments from in-person 5
and WebEx participants. And as a reminder, 6
please mute your phone. 7
Written comments on today's topics are 8
due at the close of business on October 15th. 9
Information about providing comments is provided 10
in the notice, which is on the table with the 11
handouts and also posted on our website. And 12
with that, I'll turn it over to the 13
Commissioners for opening comments. Thank you. 14
COMMISSIONER MCALLISTER: Great. Thank 15
you, Heather. I'm Andrew McAllister, the Lead 16
Commission on the 2013 IEPR. I really want to 17
thank EPA and the ARB for having us here today. 18
It turns out I think we could have done it over 19
at our building, but we really wanted to make 20
sure that we were going to have (indiscernible) 21
-- oh, oh, except for the AV, it's great here 22
(laughing). No, but this is a terrific space to 23
have this discussion. 24
Iterations of analysis and interaction 25
8
CALIFORNIA REPORTING, LLC 52 Longwood Drive, San Rafael, California 94901 (415) 457-4417
with stakeholders is really key for the 1
forecasting process, for getting to an end 2
result that we can hopefully have some great 3
consensus around, but also a lot of richness is 4
in the dialogue itself and I think our team at 5
the Energy Commission and the State, in general, 6
benefit from that process, and so we're going to 7
see the latest update here where we're really 8
getting ready for prime time, so I'm excited to 9
see the update. 10
I want to thank Heather and Lynette and 11
the rest of the IEPR team, all the individual 12
chapter authors on the forecast, many many 13
people involved on the electricity and 14
interacting with their colleagues across the 15
agency and with the Natural Gas section. 16
And so really what we're going to hear 17
today represents a very heavy lift, and 18
particular we're in a heavy lifting period for 19
the IEPR document itself and it's really 20
getting, I think, in good form to be released 21
here in the next few days, so you'll all get to 22
see that here in the very near future. 23
A lot of questions this year -- always -- 24
but in particular this year, you know, the role 25

9
CALIFORNIA REPORTING, LLC 52 Longwood Drive, San Rafael, California 94901 (415) 457-4417
of energy efficiency and continuing the dialogue 1
across agencies to figure out how much future 2
energy efficiency we build into the forecasts, 3
and that's really critical and is going to 4
continue to be so going forward. 5
We've had a downturn and economies 6
rebounding, and how that's going to play out 7
with electricity demand across the state in the 8
future -- big questions. How markets are going 9
to uptake all these new technologies that are 10
coming into the marketplace, big questions for 11
energy demand going forward. So the sort of 12
high, medium and low demand scenarios for the 13
forecasts, I think, capture that uncertainty 14
well and, as we track going forward, I think 15
it's going to be really interesting to see how 16
things unfold. 17
So again, I want to thank staff for the 18
huge amount of work that's gone into this, I 19
want to thank all of you who have been here 20
steadfastly throughout the process, and 21
appreciate your coming to this update, as well, 22
for those of you here in the room and on the 23
Web. So with that, I'll pass it over to Chair 24
Weisenmiller. 25

10
CALIFORNIA REPORTING, LLC 52 Longwood Drive, San Rafael, California 94901 (415) 457-4417
CHAIRMAN WEISENMILLER: Yeah, and 1
certainly want to thank folks for being here 2
today and, as Commissioner McAllister said, 3
we're sort of getting to that moment of the IEPR 4
where staff is on the one hand trying to push 5
out a report, and on the other hand we're trying 6
to deal with the last remaining issues. And 7
obviously the Demand Forecast is one of the last 8
remaining issues; it's a very important part of 9
the IEPR, particularly looking at the energy 10
efficiency part, certainly it's been a pretty 11
good effort so far this year, it's probably time 12
that people thought about what we need to be 13
thinking about doing next year, you know, that 14
obviously in this period of time we have not 15
managed to get everything nailed down, really 16
resolved all the things we want to resolve, so 17
it's time to start doing what we can here, 18
wrapping it up, move on, but at the same time 19
have a pretty aggressive agenda on making 20
progress next year. So with that, let's start 21
the presentations. 22
MS. RAITT: Our first speaker is Chris 23
Kavalec. 24
MR. KAVALEC: Good morning. I'm Chris 25

11
CALIFORNIA REPORTING, LLC 52 Longwood Drive, San Rafael, California 94901 (415) 457-4417
Kavalec from the Energy Commission's Demand 1
Analysis Office. We are presenting our revised 2
forecasts here today and we will obviously be 3
taking comments because there is some 4
opportunity to make adjustments to the forecasts 5
before it becomes a final version that is 6
submitted for adoption in December. 7
So this is our California Energy Demand 8
or CED 2013 Revised Baseline Forecast for 9
Electricity and Natural Gas. And a couple 10
things about terminology: the traditional 11
forecasts that we do that includes only 12
committed efficiency savings, that is, savings 13
from initiatives that are either already 14
implemented, or have firm funding, and have been 15
approved and finalized, that version of the 16
forecast we're referring to as the "baseline 17
forecast" as opposed to a forecast which 18
incorporates additional achievable energy 19
efficiency, that is, efficiency from initiatives 20
that don't have final approval for firm funding, 21
yet are likely to occur, for example, future 22
updates of the Title 24 standards. But the 23
version of the forecast with that adjustment 24
made we're referring to as the "adjusted 25
12
CALIFORNIA REPORTING, LLC 52 Longwood Drive, San Rafael, California 94901 (415) 457-4417
forecast." 1
This adjusted forecast will then be used 2
by the CPUC during their Long Term Procurement 3
Process and they will make additional 4
adjustments, for example, possibly for 5
distributed generation, or demand response. 6
That version of the forecast we refer to as the 7
"managed forecast," okay, so we have baseline 8
forecast and adjusted forecast we're talking 9
about today, and then managed forecast for 10
planning purposes. 11
Okay, today in addition to my 12
presentation, we're going to have Dan Cayan from 13
the Scripps Institute of Oceanography talk about 14
the possible impacts of climate change on the 15
relationship between extreme and average 16
temperatures, which has implications for 17
planning; we're going to present our revised 18
energy prices for electricity and natural gas; 19
we'll have a presentation on self-generation 20
featuring a model we've used for the first time 21
for commercial photovoltaics; then I'll be 22
making a presentation on the additional 23
achievable energy efficiency and how the 24
baseline forecasts look when adjusted for this 25
13
CALIFORNIA REPORTING, LLC 52 Longwood Drive, San Rafael, California 94901 (415) 457-4417
AAEE savings. 1
Our Transportation Energy Office is busy 2
working on a new Electric and Natural Gas 3
Vehicle Forecast, as well as some additional 4
impacts from electrification. That hasn't been 5
completed yet, but they'll be here to give us a 6
status update on how that work is going. 7
Hopefully, we'll be able to incorporate these 8
forecasts into the final version of our 9
forecasts for adoption in December. 10
And as usual, we will provide our 11
Planning Area forecasts. The additional 12
achievable energy efficiency is meant to be 13
applied at the service territory level. In the 14
case of Southern California Edison, PG&E, and 15
Socal Gas, the service territory is a subset of 16
the Planning Areas; therefore, for those three 17
Planning Areas, we'll be presenting in addition 18
to Planning Area results individual service 19
territory results, and those service territory 20
results adjusted by the additional achievable 21
energy efficiency. 22
Okay, in my presentation I'm going to be 23
talking a little bit about methodology. Most of 24
you are somewhat familiar with the way that we 25
14
CALIFORNIA REPORTING, LLC 52 Longwood Drive, San Rafael, California 94901 (415) 457-4417
forecast, but for those who aren't, just a 1
little bit of information. I'll be providing 2
some statewide results and comparing those 3
statewide results to our previous forecasts, the 4
last adopted forecasts in 2011, and our 5
preliminary forecasts that we released in May of 6
this year. The efficiency that is incorporated 7
in the baseline forecast, committed efficiency, 8
I'll be comparing this forecast with an 9
econometric forecast that we do separately, and 10
as a lead-in to our next presentation, I'll be 11
talking about how climate change is incorporated 12
into the forecast. 13
So when we forecast for electricity, we 14
forecast for eight different Planning Areas, 15
listed here. And as I mentioned, for PG&E and 16
Southern California Edison, we'll be presenting 17
both Planning Area and service territory 18
results. 19
Natural gas Planning Areas, Southern 20
California Gas, Planning Area and service 21
territory results. 22
And for our 2013 forecasts, both the 23
preliminary and the revised, which we're 24
presenting today, we also provide results at the 25
15
CALIFORNIA REPORTING, LLC 52 Longwood Drive, San Rafael, California 94901 (415) 457-4417
climate zone level. We have 16 forecasts in 1
climate zones in California, three of the 2
Planning Areas have multiple climate zones, PG&E 3
has five, Southern California Edison has four, 4
and LADWP has two. And we make this distinction 5
of climate zones, too, because weather sensitive 6
usage is very important when you're talking 7
about the coast versus inland, or north versus 8
south. 9
So our approach includes individual 10
sector models for the sectors listed here for 11
consumption, residential, commercial and 12
industrial, we have end use models, and "end 13
use" means we're starting at the level of 14
average usage per appliance by type of 15
appliance. We also have disaggregated 16
econometric and trend models for the 17
agricultural sector and for transportation 18
communications and utilities, or TCU and street 19
lighting. Consumption results from the 20
individual sector models are sent to our summary 21
model where weather adjustments are applied and 22
the model results are calibrated to actual 23
consumption. 24
Then the summary model provides input 25

16
CALIFORNIA REPORTING, LLC 52 Longwood Drive, San Rafael, California 94901 (415) 457-4417
into our peak model where load shapes are 1
applied and we develop an estimated peak for 2
each Planning Area, for each year. 3
And we also have predictive models for 4
self-generation, residential photovoltaic, 5
residential solar hot water, commercial PV, and 6
commercial CHP. 7
As I mentioned, we also do a separate 8
forecast using econometric models, more 9
aggregate models for each sector, so we have 10
econometric models for all sectors except for 11
TCU in the case of gas, where the data was a 12
little erratic and where we weren't able to fit 13
a reasonable regression into that data. 14
We also have an econometric model, a peak 15
model, and we use these models as a point of 16
comparison to our end use model results, and we 17
use some of the results from these econometric 18
models in our end use models; for example, price 19
elasticities estimated in the econometric models 20
are used in the end use models. 21
Okay, compared to our last adopted 22
forecast in 2011, here are some of the changes 23
and improvements we've made. We have a new 24
industrial model. We had been relying on what's 25

17
CALIFORNIA REPORTING, LLC 52 Longwood Drive, San Rafael, California 94901 (415) 457-4417
called the inform industrial model developed by 1
EPRI in the '90s, but that model is no longer 2
supported and we didn't have the executable code 3
for it, so we decided to build a new model from 4
the ground up with a similar methodology, and 5
that model is still under construction, but we 6
have made enough progress with a model to where 7
we felt we could use it for this forecast. 8
In 2011, we had some econometric models. 9
In 2013, we have more econometric models, all 10
the sectors covered except, as I mentioned, TCU 11
in the case of gas. 12
In 2011, we incorporated climate change 13
impacts for peak demand. In 2013, we're also 14
adding in climate change impacts on the 15
consumption side through changes in heating and 16
cooling degree days for both electricity and 17
natural gas. 18
As we go from forecast to forecast, we 19
typically include new efficiency programs and 20
standards that have become committed, that is, 21
have been finalized and funded. So in this case 22
we have 2013 and 2014 IOU programs that were not 23
in the 2011 forecasts included, 2013 POU 24
programs that were not included in the last 25

18
CALIFORNIA REPORTING, LLC 52 Longwood Drive, San Rafael, California 94901 (415) 457-4417
forecasts, and new standards, 2013 Title 24 and 1
2011 Title 20 Battery Charger Standards are 2
included. 3
A rough estimate, the new Standards 4
create savings by the end of the forecast period 5
statewide of almost 3,000 gigawatt hours, and 6
then the IOU programs create savings by 2024 of 7
around 2,000, a little bit less than 2,000 8
gigawatt hours. 9
As I mentioned, we do now do a climate 10
change/climate zone analysis and in the 2011 11
forecast we had a predictive model for 12
residential photovoltaics and solar hot water; 13
for the 2013 forecast, we've added a predictive 14
model for commercial CHP and PV. 15
And as usual, we do three scenarios, a 16
high demand, a low demand, and a mid demand. A 17
high demand, for example, is defined as higher 18
economic and demographic growth, lower program 19
savings, lower rates, and higher climate change 20
impacts. In other words, we kind of rigged this 21
so we get a nice spread on the three scenarios. 22
There's always a consistency issue when you 23
create scenarios like this. For example, in the 24
High Demand Case you could say, well, if the 25

19
CALIFORNIA REPORTING, LLC 52 Longwood Drive, San Rafael, California 94901 (415) 457-4417
economy is growing at a healthy rate, well, then 1
customers probably have more disposable income 2
and maybe are more likely to take part in an IOU 3
incentive program; therefore, in the High Demand 4
Case, you should have higher program savings. 5
However, a scenario like that would be covered 6
within the range that we've defined here between 7
the high and the low. 8
Key inputs that we use, fairly intuitive, 9
in this forecast versus our preliminary forecast 10
back in May, employment personal income and 11
manufacturing are all up a little bit, and that 12
comes from more optimism from our econ/demo 13
vendors regarding the housing market and the 14
tech industry. 15
On the other hand, population compared to 16
our preliminary forecast in May is down a little 17
bit and I'll show you that in a minute. 18
Commercial floor space is derived from the 19
economic demographic data, for example, retail 20
floor space is a function of personal income and 21
projected retail employment and, of course, 22
rates. 23
Okay, we have three scenarios for 24
population and the 2011 projection is where we 25
20
CALIFORNIA REPORTING, LLC 52 Longwood Drive, San Rafael, California 94901 (415) 457-4417
only had one scenario, it's shown in red there. 1
For a high population we're using the Moody's 2
projection; in the mid case we're using Global 3
Insight, and in the low case we're using the 4
California DOF projections. So what's happened 5
since May is that Global Insight and Moody's 6
have dropped their population forecast down, and 7
I think it's to match more closely with the DOF. 8
So we don't have much spread remaining between 9
our population scenarios. You can see that the 10
low and the mid are almost exactly the same now. 11
Okay, on to some results and, again, a 12
reminder, this is a baseline forecast meaning it 13
includes no adjustments for additional 14
achievable energy efficiency. And also, this is 15
using our old EV forecast; we'll be talking 16
about developing a new one a little bit later on 17
today. So compared to our 2011 forecasts there 18
in red, you can see we're starting out at a 19
lower point, and I'll talk about that in a 20
minute, but after that lower point in 2013, our 21
high demand scenario for consumption statewide 22
grows at a faster rate than the 2011 mid 23
forecast. The new mid forecast grows at about 24
the same rate as the 2011 mid forecast. And the 25

21
CALIFORNIA REPORTING, LLC 52 Longwood Drive, San Rafael, California 94901 (415) 457-4417
low demand forecast grows at a slightly lower 1
rate. 2
Statewide peak demand, this is a non-3
coincident peak demand that is basically the sum 4
of the individual Planning Area peaks. A 5
similar story, we're at a lower point in 2013, 6
but after that point the high demand scenario 7
grows at a faster rate than the 2011 forecast, 8
mid about the same, and the low demand at a 9
lower rate. 10
You can see the little dot there for the 11
2012 weather normalized peak; when we're 12
projecting peak into the future, aside from 13
adjustments for climate change, we're using 14
historically normal weather, so with the weather 15
normalized peak there in 2012, as you can see, 16
it likes right on the historical peak line, 17
actual peak line. And that means in terms of 18
the high temperatures that drive peak demand, 19
2012 was a relatively average year. 20
As I mentioned, especially in the case of 21
consumption, we have flat growth from 2012 to 22
2013, and that happens because we're introducing 23
new IOU programs in 2013, and new POU programs. 24
Also, in the case of consumption, 2012, although 25

22
CALIFORNIA REPORTING, LLC 52 Longwood Drive, San Rafael, California 94901 (415) 457-4417
it wasn't a very hot year in terms of the 1
hottest temperatures, it was a fairly warm year 2
on average, so compared to historical average, 3
cooling degree days were higher in 2012 than the 4
historical average. 5
So then when you go to 2013 and you're 6
back, to historical average weather, there's a 7
little bump down to consumption. 8
And there was relatively little growth 9
between 2012 an 2013 in Gross State Product and 10
Personal Income. That picks up again after 11
2013, especially at 2014 and 2015, but it's 12
fairly flat in 2012 and 2013. 13
Our consumption per capita we're all 14
proud of for California because it's relatively 15
flat, and we project that trend to continue in 16
our mid case, the dark blue there, until the end 17
of the forecast period where it begins to 18
increase a little bit with increased sales and 19
usage of Electric Vehicles. 20
Now again, this does not include the 21
additional achievable energy efficiency savings. 22
If that were incorporated here, that would make 23
a difference that you could see in this graph. 24
For example, in the mid case, if we combined our 25

23
CALIFORNIA REPORTING, LLC 52 Longwood Drive, San Rafael, California 94901 (415) 457-4417
mid demand scenario with our mid additional 1
achievable energy efficiency scenario, which 2
we'll show a little bit later on, electricity 3
consumption per capita by 2024 would drop below 4
that 7,000 gigawatt hours. So in other words, 5
with AAEE savings incorporated, we would show a 6
declining consumption per capita series in the 7
new case. 8
End user natural gas consumption -- and 9
that's typically flatter than electricity 10
consumption, and one of the reasons for that is 11
that Appliance and Building Standards have more 12
of a relative impact on the natural gas side 13
than the electricity side because there are much 14
fewer end uses, therefore less end uses that 15
need to be targeted to reduce consumption. 16
And compared to our 2011 forecast, we're 17
flatter and we start out at a lower point. And 18
the reason for that is, during the forecast 19
period we have natural gas rates that increase 20
between 2012 and 2024; a reduced need for 21
heating because of climate change impacts, in 22
other words, less heating degree days. And also 23
on the natural gas side we're introducing Title 24
24 standards, and those standards also affect 25
24
CALIFORNIA REPORTING, LLC 52 Longwood Drive, San Rafael, California 94901 (415) 457-4417
natural gas. So that was versus 2011. Our 1
preliminary forecast -- here are the changes, 2
adjustments we've made. We've updated our 3
economic and demographic drivers, and I talked 4
about that a little bit previously. We have 5
lower rates for electricity than we had in the 6
preliminary forecasts, and we'll show that in a 7
minute. We've added impacts for Port 8
electrification and High Speed Rail. Hopefully 9
a new EV and natural gas forecast and additional 10
electrification that we can add to the forecast 11
that include that by the final version for 12
adoption. 13
And for the first time, as I mentioned, 14
in this revised forecast we're using a 15
predictive model for commercial PV adoption. 16
And at the behest of CPUC and ISO, we've 17
included demand response impacts from critical 18
peak pricing and peak time rebate programs; 19
typically, we only include impacts from non-20
event based demand response. But the feeling is 21
with these two programs, on the ISO side, on the 22
supply side, they want to only include programs 23
which they can count on; in other words, 24
programs which give them direct control and can 25

25
CALIFORNIA REPORTING, LLC 52 Longwood Drive, San Rafael, California 94901 (415) 457-4417
reduce megawatts. Whereas, these two programs, 1
although they are event-based, depend on 2
customers' price response or a response to 3
financial incentives, which is not always 4
certain. So the feeling was that it would be 5
better to include this on the demand side 6
instead of on the supply side. 7
So we have factors pushing us up relative 8
to the preliminary forecast, and factors 9
bringing us down, and the upshot is that we're a 10
little bit higher than the preliminary forecast. 11
This graph shows statewide electricity 12
consumption for the mid case, the preliminary, 13
and the revised. So, by 2024 we're around two 14
percent higher than in the preliminary forecast. 15
For electricity peak demand, same story, 16
our revised forecast is a little bit higher than 17
the preliminary, around 1.2 percent higher. The 18
reason the difference is smaller compared to 19
consumption in comparing the revised versus the 20
preliminary forecast is that we're adding in 21
impacts like Port electrification and High Speed 22
Rail that don't have much of an impact on peak, 23
but do have an impact on consumption. 24
Okay, so here's a look at these new 25
26
CALIFORNIA REPORTING, LLC 52 Longwood Drive, San Rafael, California 94901 (415) 457-4417
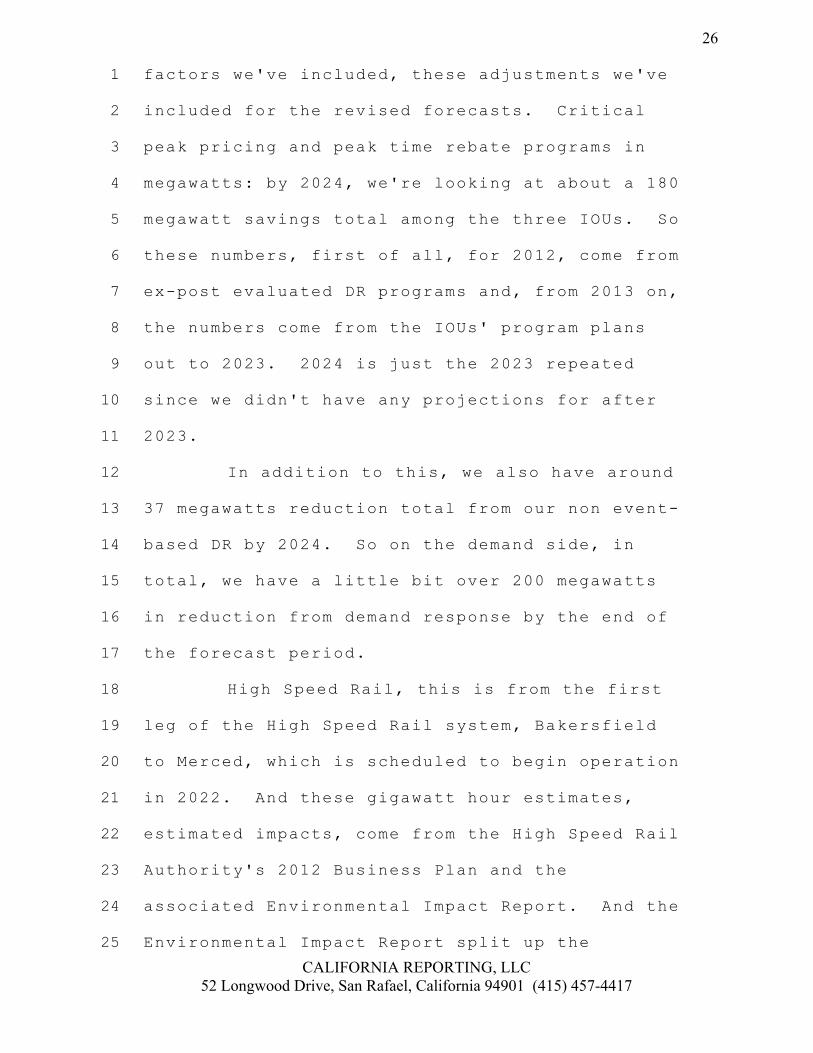
factors we've included, these adjustments we've 1
included for the revised forecasts. Critical 2
peak pricing and peak time rebate programs in 3
megawatts: by 2024, we're looking at about a 180 4
megawatt savings total among the three IOUs. So 5
these numbers, first of all, for 2012, come from 6
ex-post evaluated DR programs and, from 2013 on, 7
the numbers come from the IOUs' program plans 8
out to 2023. 2024 is just the 2023 repeated 9
since we didn't have any projections for after 10
2023. 11
In addition to this, we also have around 12
37 megawatts reduction total from our non event-13
based DR by 2024. So on the demand side, in 14
total, we have a little bit over 200 megawatts 15
in reduction from demand response by the end of 16
the forecast period. 17
High Speed Rail, this is from the first 18
leg of the High Speed Rail system, Bakersfield 19
to Merced, which is scheduled to begin operation 20
in 2022. And these gigawatt hour estimates, 21
estimated impacts, come from the High Speed Rail 22
Authority's 2012 Business Plan and the 23
associated Environmental Impact Report. And the 24
Environmental Impact Report split up the 25
27
CALIFORNIA REPORTING, LLC 52 Longwood Drive, San Rafael, California 94901 (415) 457-4417
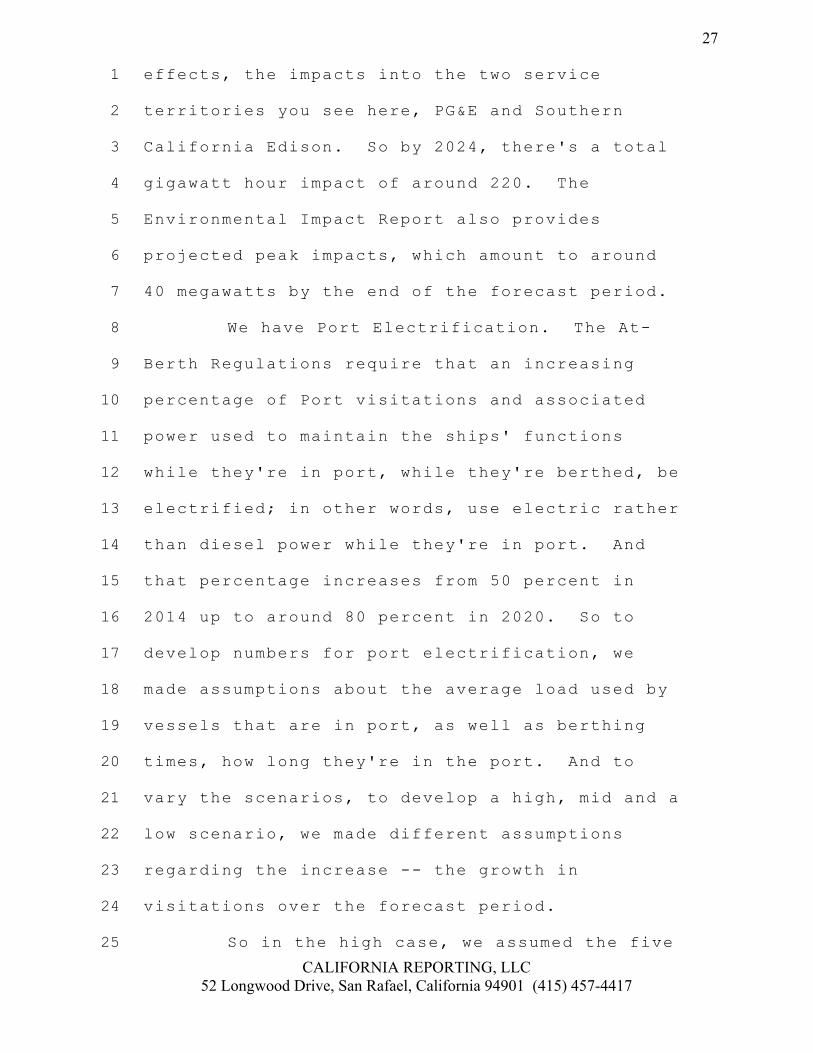
effects, the impacts into the two service 1
territories you see here, PG&E and Southern 2
California Edison. So by 2024, there's a total 3
gigawatt hour impact of around 220. The 4
Environmental Impact Report also provides 5
projected peak impacts, which amount to around 6
40 megawatts by the end of the forecast period. 7
We have Port Electrification. The At-8
Berth Regulations require that an increasing 9
percentage of Port visitations and associated 10
power used to maintain the ships' functions 11
while they're in port, while they're berthed, be 12
electrified; in other words, use electric rather 13
than diesel power while they're in port. And 14
that percentage increases from 50 percent in 15
2014 up to around 80 percent in 2020. So to 16
develop numbers for port electrification, we 17
made assumptions about the average load used by 18
vessels that are in port, as well as berthing 19
times, how long they're in the port. And to 20
vary the scenarios, to develop a high, mid and a 21
low scenario, we made different assumptions 22
regarding the increase -- the growth in 23
visitations over the forecast period. 24
So in the high case, we assumed the five 25

28
CALIFORNIA REPORTING, LLC 52 Longwood Drive, San Rafael, California 94901 (415) 457-4417
percent increase, annual increase in port 1
visitations; in the low case, we assumed no 2
increase in visitations, and mid was in between 3
the two. So by 2024, over all the ports 4
affected by this regulation, so for LA of course 5
that's the Port of Los Angeles, for PG&E that's 6
Oakland and San Francisco, Edison is the Port of 7
Long Beach, and San Diego is the Port of San 8
Diego. Over all these different ports, by 2024 9
in the high case, we have about 320 gigawatt 10
hour increase in electricity use, and in the low 11
case we're at 210 gigawatt hours. 12
We always like to show the impact of our 13
committed efficiency savings in the baseline 14
forecast broken down into three categories: 15
funded and approved utility programs, finalized 16
and/or implemented standards, and price effects, 17
meaning customer savings in the face of rate 18
hikes by electricity use. 19
So this graph shows the consumption 20
savings or gigawatt hour savings out to 2024, 21
and this is relative to a benchmark of 1975. So 22
this is saying basically, if since 1975 we had 23
had no programs, no standards, and no increases 24
in rates, in 2012 our consumption would be a 25

29
CALIFORNIA REPORTING, LLC 52 Longwood Drive, San Rafael, California 94901 (415) 457-4417
little bit over 60,000 gigawatt hours higher. 1
And the savings are highest in the low demand 2
scenario, mainly because rates are higher, 3
therefore you have more price effects. And I 4
always like to give the caveat that this is 5
making a strong assumption here, and that is 6
basically nothing else would have changed 7
significantly since 1975 if we hadn't had 8
standards programs and rate hikes when we know 9
in reality there would have been some natural 10
changes that occurred in the market. So if some 11
of this efficiency would have occurred anyway 12
without any efficiency initiatives, this 13
overstates the amount of savings, however, we 14
could have gone the other way, we could have 15
become less efficient, in which case this 16
probably understates the total amount of 17
savings. 18
Okay, we like to compare our forecasts to 19
a peer econometric forecast done with the more 20
aggregate econometric equations for each sector. 21
And this first graph shows a total statewide 22
consumption in the mid case for the econometric 23
forecast and for the end use baseline forecast, 24
with the econometric a little bit higher, and I 25

30
CALIFORNIA REPORTING, LLC 52 Longwood Drive, San Rafael, California 94901 (415) 457-4417
would submit this is what you should expect 1
because of the way the two different approaches 2
handle efficiency. In the end use modeling, 3
you're accounting for efficiency explicitly, 4
whereas with an econometric model, you're 5
capturing the trend of efficiency during the 6
historical period and projecting that forward. 7
So because I think we all would agree our 8
efficiency efforts have intensified in recent 9
years, if you look at a 30-year average for 10
efficiency and you project that forward as the 11
econometric model does, you're going to 12
understate the total amount of efficiency in the 13
future, and therefore overstate consumption. 14
Same story with peak: around two percent 15
higher by the end of the forecast period in the 16
econometric model for the mid case. 17
For natural gas, the difference is a 18
little bit bigger, around six percent by 2024, 19
again with the econometric results being higher. 20
And I think this is also consistent with my 21
theory about the way that efficiency is handled 22
because, as a percentage of consumption, 23
efficiency savings from standards are much 24
higher for natural gas because more of the end 25

31
CALIFORNIA REPORTING, LLC 52 Longwood Drive, San Rafael, California 94901 (415) 457-4417
uses have been captured by standards. 1
Therefore, if you have an approach that doesn't 2
quite capture all the efficiency impacts like 3
the econometric model does, then that difference 4
is going to be larger compared to electricity. 5
Okay, as a lead-in to our next 6
presentation, a little bit about how we 7
incorporate climate change in our forecast. We 8
use scenarios developed for us by the Scripps 9
Institute of Oceanography using 10 climate 10
change models, so we have a total of around 20 11
scenarios. And for our High Demand Case, we 12
pick a temperature scenario at the high end in 13
terms of increases in temperature. For our mid 14
case, our Mid Demand Case, we use a scenario 15
that's right in the middle among the 20 or so 16
scenarios in terms of temperature increase. And 17
in our Low Demand Case, we don't include any 18
climate change impacts. For electricity 19
consumption, what we do is use these scenarios 20
to project out changes in heating degree days 21
and cooling degree days. 22
For natural gas consumption, we only need 23
to worry about heating degree days because we're 24
worried about heating. And for peak impacts, 25
32
CALIFORNIA REPORTING, LLC 52 Longwood Drive, San Rafael, California 94901 (415) 457-4417
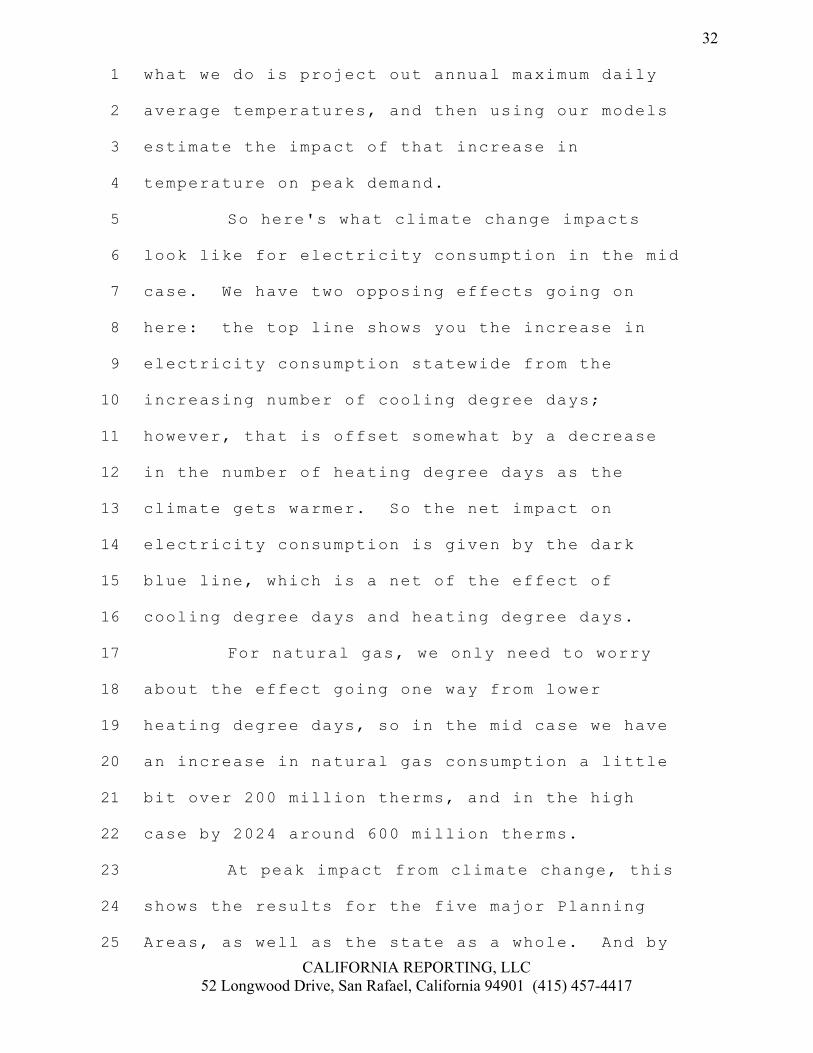
what we do is project out annual maximum daily 1
average temperatures, and then using our models 2
estimate the impact of that increase in 3
temperature on peak demand. 4
So here's what climate change impacts 5
look like for electricity consumption in the mid 6
case. We have two opposing effects going on 7
here: the top line shows you the increase in 8
electricity consumption statewide from the 9
increasing number of cooling degree days; 10
however, that is offset somewhat by a decrease 11
in the number of heating degree days as the 12
climate gets warmer. So the net impact on 13
electricity consumption is given by the dark 14
blue line, which is a net of the effect of 15
cooling degree days and heating degree days. 16
For natural gas, we only need to worry 17
about the effect going one way from lower 18
heating degree days, so in the mid case we have 19
an increase in natural gas consumption a little 20
bit over 200 million therms, and in the high 21
case by 2024 around 600 million therms. 22
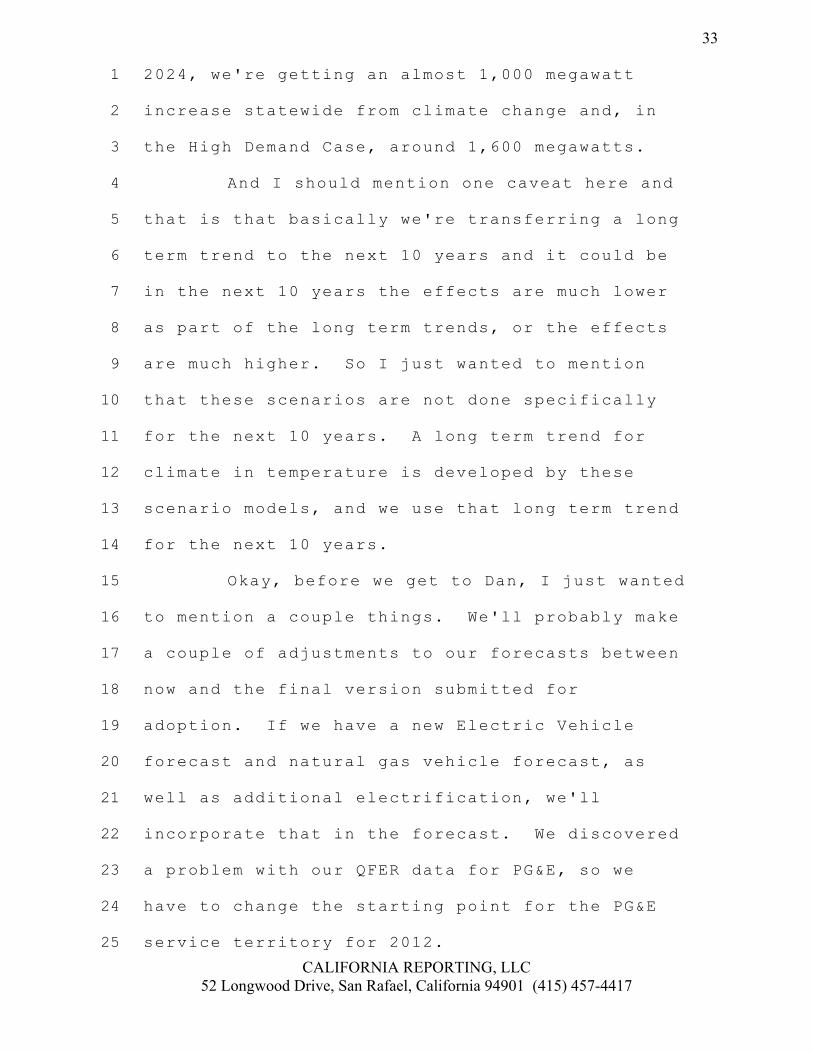
At peak impact from climate change, this 23
shows the results for the five major Planning 24
Areas, as well as the state as a whole. And by 25
33
CALIFORNIA REPORTING, LLC 52 Longwood Drive, San Rafael, California 94901 (415) 457-4417
2024, we're getting an almost 1,000 megawatt 1
increase statewide from climate change and, in 2
the High Demand Case, around 1,600 megawatts. 3
And I should mention one caveat here and 4
that is that basically we're transferring a long 5
term trend to the next 10 years and it could be 6
in the next 10 years the effects are much lower 7
as part of the long term trends, or the effects 8
are much higher. So I just wanted to mention 9
that these scenarios are not done specifically 10
for the next 10 years. A long term trend for 11
climate in temperature is developed by these 12
scenario models, and we use that long term trend 13
for the next 10 years. 14
Okay, before we get to Dan, I just wanted 15
to mention a couple things. We'll probably make 16
a couple of adjustments to our forecasts between 17
now and the final version submitted for 18
adoption. If we have a new Electric Vehicle 19
forecast and natural gas vehicle forecast, as 20
well as additional electrification, we'll 21
incorporate that in the forecast. We discovered 22
a problem with our QFER data for PG&E, so we 23
have to change the starting point for the PG&E 24
service territory for 2012. 25

34
CALIFORNIA REPORTING, LLC 52 Longwood Drive, San Rafael, California 94901 (415) 457-4417
In terms of what we're looking at after 1
this forecast cycle, we want to start really 2
working on new forecasting models that combine 3
econometric and end use elements. The 4
advantages of having end use elements is 5
obvious, but we want to tie those end use 6
elements to actual consumption using econometric 7
equations. We want to move toward a level of 8
granularity that best meets the needs of the 9
users of our forecasts, so we'll begin talking 10
about that after this forecast cycle. 11
I mentioned climate change; one of the 12
other issues that we're concerned with for 13
climate change is that warming may actually 14
change the relationship between average 15
temperatures and extreme temperatures, in 16
addition to just increasing overall average 17
temperatures. Well, this would change the 18
relationship between what we call a one in 10 19
peak, a peak in a very warm year, and a one in 20
two peak in a peak and an average year, and that 21
has obvious planning implications. So that's 22
what Dan is going to talk about, the impact of 23
climate change on temperature distributions and 24
on extreme temperatures versus average 25

35
CALIFORNIA REPORTING, LLC 52 Longwood Drive, San Rafael, California 94901 (415) 457-4417
temperatures. 1
I also think it's time we start looking 2
at the impact on load shapes of demand side 3
policy, especially DG. I think we all expect 4
that utility peaks are going to start shifting 5
to later in the day because of the demand side 6
policy, so we're going to incorporate that in 7
our forecasts. I know a couple of the utilities 8
have already done that in their forecasts. So 9
these are things we're working on for our next 10
forecast cycle. 11
And with that, I'll ask the Commissioners 12
for comments or questions. 13
COMMISSIONER MCALLISTER: Yeah. Thanks, 14
Chris. Good stuff and I guess on that last 15
point I wanted to point out that, for our 16
Standards work, you know, the Energy Commission 17
develops the Time Dependent Valuation Metric and 18
it's kind of an interesting interplay between 19
the overall demand shape statewide and as that 20
actually becomes more variable across the state, 21
depending on how much DG and climate impacts, 22
and all that, as we update the TDV for the 2016 23
round of Title 24, we're going to have to really 24
dig in to, I think, your work to see if any 25
36
CALIFORNIA REPORTING, LLC 52 Longwood Drive, San Rafael, California 94901 (415) 457-4417
changes are needed, or at least that after the 1
mid afternoon hour may have a different 2
weighting over time going forward, and we need 3
to anticipate that as, say, the net peak moves 4
later in the evening, or whatever happens with 5
given demand side policies. 6
I also wanted to acknowledge the presence 7
of some of our sister agencies. I see Simon 8
from the PUC is here, so thanks for coming, I 9
know it's a long trek for you to get over here 10
and you've been here a lot lately; and then I 11
don't see any familiar faces from the ARB, but 12
I'm wondering if somebody from the Air Resources 13
Board is actually here in the room. Great. 14
Thank you for coming as well. I didn't have any 15
specific questions, I'm pretty familiar with the 16
process. 17
CHAIRMAN WEISENMILLER: A couple 18
questions, or maybe more observations than 19
questions. First, on your Committed Efficiency 20
Savings slide, on 25, certainly one of the 21
things that Commissioner McAllister and I are 22
dealing with is a recent paper that deals with 23
some of the structural changes, and I'm assuming 24
here this is not dealing with changes in the 25

37
CALIFORNIA REPORTING, LLC 52 Longwood Drive, San Rafael, California 94901 (415) 457-4417
industrial mix in California, or any of the 1
other types of things that people have alleged, 2
you know, or at least part of the energy savings 3
that have occurred, you know, just sort of 4
counter factual types of cases? 5
MR. KAVALEC: No, that's true; that is 6
simply adding up the direct impacts from 7
Standards programs and price effects. 8
CHAIRMAN WEISENMILLER: Yeah. Another 9
question or observation probably sets a context 10
for the climate change, is that the Governor 11
last year had an event on extreme climate 12
events, which really hit the notion that one of 13
the things we're seeing now is basically the 14
climate change on stairways, you know, that 15
we'll always have hurricanes, we always have 16
heat waves, but the magnitude, the amplitude of 17
those events are much more significant than what 18
we've seen historically, the volatility. So at 19
least one of the things which I've always 20
worried about is that, is our -- you know, we do 21
an average planning one in two, and we do it one 22
in 10, and so whether that one in 10 now is sort 23
of shifting in a way relative to history, that 24
we could have a much more extreme peak than 25

38
CALIFORNIA REPORTING, LLC 52 Longwood Drive, San Rafael, California 94901 (415) 457-4417
we're contemplating, so that's one of the things 1
I think we have to be on our guard for and, 2
again, certainly encourage everyone to look at 3
the website that went through the extreme 4
climate event presentations from the Governor's 5
Office. 6
MR. KAVALEC: Perfect lead-in for Dan 7
Cayan. 8
CHAIRMAN WEISENMILLER: Okay. And I 9
think that pretty much hits the major points. I 10
think, again, great job on pushing this forward, 11
certainly we're not done yet, and as you 12
indicate in the last slide, this is something 13
that's never quite done, but you always make 14
progress. Thanks again. 15
MR. KAVALEC: Okay, so I'll introduce Dan 16
Cayan from the Scripps Institute of 17
Oceanography, a world recognized expert on 18
climate change and climate change modeling. And 19
he's going to talk to us today about the 20
relationship between extreme and average 21
temperatures and how that relationship may be 22
affected by climate change. So, Dan, are you 23
there? 24
MR. CAYAN: Yes, I am. Can you hear me? 25

39
CALIFORNIA REPORTING, LLC 52 Longwood Drive, San Rafael, California 94901 (415) 457-4417
MR. KAVALEC: Yes. We hear you very 1
well. 2
MR. CAYAN: Very good. Thanks. I 3
appreciate the opportunity to present here and 4
good morning, Commissioners and audience. 5
So this is a progress report on a study 6
that has been funded by the Energy Commission. 7
We're looking at the potential for climate 8
change impacts on the weather conditions that 9
influence demand, and we're also looking at some 10
shorter period factors which I'm going to show 11
directly here. 12
Involved with this is a development of a 13
so-called downscaling scheme in order to make 14
use of the larger scale climate global 15
simulations in the context of the textured 16
environment, topography and so forth in 17
California, we use techniques to translate these 18
larger, very granular fields to the finer detail 19
over the terrain. So we're working on that, and 20
I'm not going to show results from that this 21
morning, but we're making progress there. 22
Instead, I'm going to focus on some early 23
results in looking at some actual weather 24
influences, and also some longer term climate 25

40
CALIFORNIA REPORTING, LLC 52 Longwood Drive, San Rafael, California 94901 (415) 457-4417
simulation implications. 1
I'm assuming you can see my slides. I 2
think that is going to be the keys to the card 3
here. 4
MS. RAITT: Dan, can you hear me? 5
Actually, this is Heather Raitt. It turns out 6
we're having trouble seeing your slides, so 7
Lynette is trying to get them up right now. 8
MR. CAYAN: Oh, okay. Well, I'll just 9
give you cues, then. We're going from my titled 10
slide now to the next slide, which is entitled 11
"Load Forecasting." 12
CHAIRMAN WEISENMILLER: Okay, Dan, just 13
hold on one second while we sync things up. 14
Lynette, it seemed like you had it up on the 15
screen, but that's this one, yeah, so if you 16
could advance this one? Good. 17
MS. RAITT: We're getting there. 18
CHAIRMAN WEISENMILLER: Okay, we're ready 19
now to roll. 20
MR. CAYAN: Okay. I just have to sync 21
myself up now. So we should be on the second 22
slide which is entitled "Load Forecasting?" 23
MS. RAITT: Yes, we're there. 24
CHAIRMAN WEISENMILLER: Yes, we're there. 25

41
CALIFORNIA REPORTING, LLC 52 Longwood Drive, San Rafael, California 94901 (415) 457-4417
MR. CAYAN: Okay. And in this case, if 1
you focus on the plot that is at the upper left, 2
which shows in the PG&E jurisdiction the change 3
in daily peak load as a function of daily 4
afternoon temperature, so-called Tmax, what we 5
see there is we've arrayed several years of data 6
here and -- by the way, my colleague David 7
Pierce and also Mary Tyree have been really 8
essential components of putting this 9
presentation together, so it's a group effort. 10
What we see here is that essentially in the 11
summertime when maximum temperatures are 12
relatively warm, we're on the steeper part of 13
the demand versus temperature relationship, and 14
in that case we actually can construct models 15
that are functions of temperature to predict the 16
daily load. And of course those models have 17
errors, and we've been looking at how you might 18
reduce those errors, and if we go to the next 19
slide, number 3, what we notice is that one of 20
the sources of errors seems to be that the 21
presence or absence of stratus clouds along the 22
coast, this is actually a composite that is 23
drawn from positive and negative errs, that is, 24
cases where the load was actually higher than 25

42
CALIFORNIA REPORTING, LLC 52 Longwood Drive, San Rafael, California 94901 (415) 457-4417
predicted, positive errs, and less than 1
predicted negative errs in the Southern 2
California Edison territory, and it turns out 3
that when we composite the cloud cover over 4
those events, we see that a source of err is the 5
presence of clouds in actually reducing the 6
load, or the absence of clouds in increasing the 7
load. So it's a factor that isn't accounted for 8
in the present methodology for predicting daily 9
load, but it might be and it might naturally be 10
quite valuable in doing a bit better than what's 11
done today. 12
So if we go to the next slide which is 13
actually a climate simulation, this happens to 14
be one of the newer climate models you probably 15
all have heard the roll out of the Working Group 16
1 IPCC Climate Change Assessment, and this is 17
one of the models that's involved there. This 18
is an NCAR Earthsystem model with bio 19
geochemistry and we're looking at a simulation 20
that actually has been run from 1850 so that the 21
models are run both retrospectively and 22
prospectively, so this simulation goes back from 23
1850 through 2100, and roughly if you sort of 24
follow the cloud of maximum temperature here 25

43
CALIFORNIA REPORTING, LLC 52 Longwood Drive, San Rafael, California 94901 (415) 457-4417
drawn for a cell that lies over Sacramento, we 1
see something like an eight degree Fahrenheit 2
increase over the 21st Century. Just to give 3
you an idea of how this compares to the 4
observations in Sacramento, if we just click 5
once here, we should see -- I'm not able to see 6
what you're seeing -- but on my screen, I'm 7
seeing a cloud of observations that overlies the 8
period from the 1940's through the, well, near 9
present period here. And you can see that the 10
model essentially untouched, no bias adjustment 11
and so forth, has done a pretty good job of 12
replicating the envelope of variability in the 13
Sacramento region. So this is the model that 14
I'm choosing to show here for an example of what 15
we're looking at as far as climate change 16
impacts on temperature extremes that, of course, 17
impact the load in the summertime in California. 18
So now I'm moving on to the next slide, 19
which from this model shows the projected 20
increase in two year return period daily maximum 21
temperature, of course, these would be summer 22
maximum temperatures, and 10 year return period, 23
and Chris alluded to that, to those periods in 24
his talk. And again, this is Sacramento, and 25

44
CALIFORNIA REPORTING, LLC 52 Longwood Drive, San Rafael, California 94901 (415) 457-4417
this is from the climate simulation which, by 1
the way, has been driven by the assumption of 2
relatively high greenhouse gas emissions. This 3
is the so-called RCP8.5 scenario. So this would 4
be one of the higher of Chris's scenarios, or 5
that would fall into the category of the high 6
scenarios that Chris showed in this slides. 7
So on the left here, we see the two-year 8
return Tmax, and these are laid out according to 9
essentially a time series, a decadal time 10
series, so 1963, '73, '83, and so forth, through 11
2033 here in this slide. So what you notice is 12
the increase in two-year return period extreme 13
maximum temperatures of approximately five 14
degrees Fahrenheit over the modern period to the 15
2020's, 2030's. By the way, one important 16
factor here is fact that these models include 17
not only a low frequency multi-decadal trend 18
which is driven by greenhouse gas accumulations 19
in the atmosphere, but also they include 20
essentially the whole suite of natural 21
variations. So just as in observations, the 22
models have variability from one year and one 23
decade to the next. 24
On the right-hand side of this, I'm 25
45
CALIFORNIA REPORTING, LLC 52 Longwood Drive, San Rafael, California 94901 (415) 457-4417
showing the 10-year return maximum temperature 1
values and showing how they increase over time 2
and, of course, these are higher values because 3
they're more extreme and, again, over the period 4
of time from the '60s and '70s through the 5
2020's, according to the model simulation, we 6
are seeing something on the order of a five 7
degree increase in the extreme temperatures at 8
essentially on the outer edge of the temperature 9
distribution. Again, there's variation from one 10
decade to the next and the other thing I guess 11
to point out is the changes from the current 12
period of 2013 in this model rendition, to the 13
2020's are very modest, at least for the 10-year 14
return period. Now, this is only one model 15
simulation and, of course, in order to do this 16
justice, we need to look at several and probably 17
different emission scenarios. So this is just 18
an illustration. 19
Let's go to the next slide, which 20
actually is a very similar picture, but now in 21
this case I've carried this out to the middle 22
part of the Century, this is 50 years 23
essentially from present day, and you can see 24
the increasing rise in both the two-year and the 25

46
CALIFORNIA REPORTING, LLC 52 Longwood Drive, San Rafael, California 94901 (415) 457-4417
10-year return values here. So we're seeing by 1
mid-Century, this will become, I think, a very 2
important factor that we'll have to contend with 3
in projecting energy demand and so forth. In 4
the nearer term, this is very incremental, but 5
as time goes on, it climbs probably to levels 6
that are quite substantial. 7
Going to the next slide, Chris had 8
mentioned we're interested in the distribution 9
of temperature extremes, so in this case for the 10
2003 period, I'm showing the temperature 11
threshold that lies along the various return 12
periods from one year to 30 years, from this 13
model simulation, and you can see that the range 14
from one year to 30 years is over 10 degrees 15
Fahrenheit, so the extremes at the edges of the 16
distribution actually get to be quite intense 17
and, of course, we're interested to know if the 18
shape of this distribution changes as climate 19
change takes hold, and we've taken an initial 20
stab at that with this particular model, again, 21
just one simulation and one scenario. So if we 22
click forward here, we see the distribution for 23
the year 2023, and now you can see that the 24
upper part of the distribution has jumped a fair 25

47
CALIFORNIA REPORTING, LLC 52 Longwood Drive, San Rafael, California 94901 (415) 457-4417
bit across these decades. 1
Now, some of this change is probably what 2
we might call sampling kinds of variability, 3
that is, it's kind of the luck of the draw as to 4
whether an intense extreme happens. So, again, 5
the importance of looking at several models and 6
so forth in order to get a fix on this, but I 7
just wanted to give you an example. 8
And then finally, if we go one more 9
click, you can see the shape of the distribution 10
actually seems to retain its form that we saw in 11
2003, although it's been shifted up by several 12
degrees as we get into the 50-year forward 13
timeframe. 14
So following that, let's go to the next 15
slide, this is actually observations from 16
Sacramento, and this is my last slide, and I 17
just wanted to show this to remind us of the 18
really impressive amount of variation there is 19
from one year to the next. In this case, what 20
we're seeing is the highest daily maximum 21
temperature for each year in Sacramento, going 22
back to the 1930's, and it turns out that while 23
there may be a subtle trend upwards in this 24
record, it looks like the highest maximum 25

48
CALIFORNIA REPORTING, LLC 52 Longwood Drive, San Rafael, California 94901 (415) 457-4417
temperature that has been observed at this 1
particular station is actually in the early 2
1970's, and there's been lots of ups and downs 3
and so forth. There's no reason in the future 4
why we won't see similar year to year, and even 5
decade to decade variation. And of course, 6
that's going to challenge us in making the kinds 7
of projections that Chris was talking about; he 8
alluded to this phenomena in his remarks. It's 9
as we get farther forward along the curves that 10
I think we're going to run into really quite 11
reliable climate change impacts. 12
The other thing I'd like to mention is 13
amplifying a note that one of the Commissioners 14
made in the interlude just before this talk, was 15
the fact that there may be spatial variability 16
that's imposed on electrical load demand 17
phenomena, and one thing we've noticed from many 18
of the climate simulations is the fact that 19
warming appears to be more intense over the 20
interior areas of California than the coastal 21
areas as we go forward, so that's something that 22
we'll have to look at, as well, in going 23
forward. 24
So my final slide is simply a summary and 25

49
CALIFORNIA REPORTING, LLC 52 Longwood Drive, San Rafael, California 94901 (415) 457-4417
what we've shown is that the marine layer cloud 1
cover appears to be an important factor in 2
implementing electrical load and it may help to 3
reduce load forecast errs in making shorter 4
period forecasts. We're looking into this 5
phenomena of the temperature extremes at various 6
return periods and there's more work to do there 7
involving more models. What I showed in this 8
talk did not actually include this downscaling 9
methodology and that work is ongoing to produce 10
an improve downscaling that's more appropriate 11
for temperature extremes. And of course there's 12
many diagnostics involving both the simulations 13
and observations that need to be conducted. 14
So thank you very much and I'm glad to 15
take questions if there's time. 16
COMMISSIONER MCALLISTER: Thanks for 17
that, Dan. This is Andrew McAllister. Let's 18
see, I guess I was just kind of curious, I've 19
seen you talk in San Diego where I until pretty 20
recently lived with my family and did quite a 21
bit of work over there in climate discussions, 22
participated in some sense, and really 23
appreciate all of your work on that. I guess it 24
seems like in some ways we have kind of what 25

50
CALIFORNIA REPORTING, LLC 52 Longwood Drive, San Rafael, California 94901 (415) 457-4417
used to be maybe a clash of cultures that now 1
are kind of learning to get along a little bit, 2
you know, you have the kind of utility engineer 3
culture and you have the academic climate 4
science culture, which are both I think real. 5
And I guess as we think about how to make your 6
work as applicable as possible to electric 7
system planning, and we're making some really -- 8
this is great, I mean, I've really enjoyed your 9
presentation and it's happening, clearly -- do 10
you see any kind of challenges to focus your 11
work on particular areas, you know, you mention 12
here LA Basin, that get the kind of granularity, 13
or get the kind of focus on where the people 14
are, say, and where the actual electric 15
infrastructure is, is going to be impacted, and 16
translating this work over into how to 17
prioritize electric system planning and 18
investment. You know, do you have any 19
observations on sort of that process and the 20
learning curves on both sides of this 21
discussion? 22
MR. CAYAN: We've been, I guess, having 23
these -- it's kind of like a blind date where we 24
have a sponsor, actually Guido Franco of the 25

51
CALIFORNIA REPORTING, LLC 52 Longwood Drive, San Rafael, California 94901 (415) 457-4417
Energy Commission, who most of you know, has 1
been orchestrating this discussion, and clearly 2
there's a lot of learning that has to go on, on 3
both sides and we learn a lot from talking with 4
the people in the industry and in the 5
Commission, for example, in sort of designing 6
this work so it is more applicable because we 7
naturally don't know all of the thresholds and 8
all of the issues that confront electrical power 9
management and that side of things. So I think 10
the continued conversation across the two 11
communities, and certainly the culture that you 12
mention, the cultural divide is real, but I 13
think the discussions have been productive and I 14
believe that this is something that can be 15
exploited as we run into the future, especially 16
in this environment where we're seeing really 17
unprecedented change that's coming down the 18
track. I think this is going to be essential. 19
COMMISSIONER MCALLISTER: Thanks and, you 20
know, in a way we have kind of the biggest 21
challenges in both worlds, I mean, we have lots 22
of uncertainty, as you mentioned, near term 23
variability and uncertainty sort of on the 24
margins even though we know what's going on in 25

52
CALIFORNIA REPORTING, LLC 52 Longwood Drive, San Rafael, California 94901 (415) 457-4417
general terms on the climate side. But we also 1
-- you know, the public awareness of both 2
climate and just electricity planning and sector 3
issues in general are both abysmally low. And 4
so here we are sort of taking both of them and 5
we're combining them in a way that sort of 6
multiplies that. And so I think the challenge 7
on our front, well, really just broadly, is to 8
communicate to the public, you know, a lot of 9
the message can get lost in the near term noise 10
and particularly in the immediate environment 11
that we live in, that we really have to be 12
disciplined to make sure that we're keeping our 13
eyes on the prize. We can do that in California 14
because our populace is really supportive of 15
these issues and understands them to some 16
extent, to a great extent, really. And our 17
Governor obviously is very supportive of dealing 18
with climate change, and so we're in a good 19
situation in some ways, but, boy, the messaging 20
challenge is really front and center on all 21
fronts, I think. 22
MR. CAYAN: Yeah, I agree with that. I 23
would say that -- trying to define positives in 24
sort of bad situations -- I think that these 25
53
CALIFORNIA REPORTING, LLC 52 Longwood Drive, San Rafael, California 94901 (415) 457-4417
extreme events offer opportunities for education 1
and learning and I think we just have to be 2
prepared with, you know, sort of a message that 3
is getting some of these lessons across when 4
these times arise, which they will in the 5
future, and I think that we'll sort of ratchet 6
ourselves forward. I think a good analog of 7
this is the Sandy event in New York and how 8
that's really been taken seriously into future 9
planning concerning climate extremes and climate 10
change. And I think that's one way to get 11
beyond politics which, of course, really has 12
been intertwined with these issues for many 13
years, but it's hard to argue that these extreme 14
events don't require planning and forward 15
thinking. 16
CHAIRMAN WEISENMILLER: Yeah, this is 17
Chair Weisenmiller. I want to take three 18
things, the first one is in terms of the 19
variability part, Not for this summer, but the 20
prior summer I had the opportunity to brief the 21
Governor on what we were doing in Southern 22
California without San Onofre, and at least in 23
that context it looked like we had like a 15 24
megawatt cushion in San Diego. So he asked me 25
54
CALIFORNIA REPORTING, LLC 52 Longwood Drive, San Rafael, California 94901 (415) 457-4417
what was the temperature associated with that 15 1
megawatt cushion -- and this is on peak -- 2
anyway, it got back to Chris and it was like a 3
tenth of a degree, so again, that's on your peak 4
side. So a lot of sensitivity, I guess. And 5
moving on from that, you know, you had your plot 6
of peak days, peak temperatures, and pointed out 7
that early '70s really hot day, and the thing 8
that we're really most concerned about is the 9
heat storms, so it's not just that one really 10
blast day as much as the third, or fourth, or 11
fifth day -- 12
MR. CAYAN: Right. 13
CHAIRMAN WEISENMILLER: -- and I don't 14
know from your information here how much we can 15
untangle that sort of heat storm phenomena; 16
again, when we're trying to look at peak, it's 17
not just that day, but it is that build-up that 18
really we worry about. 19
MR. CAYAN: Yeah, that's a good point, 20
Chairman Weisenmiller. Usually these extreme 21
days don't happen in isolation and so there's 22
often a persistent event. We saw that in the 23
2006 heat waves which, of course, are legendary. 24
And in the models, of course, we can untangle 25

55
CALIFORNIA REPORTING, LLC 52 Longwood Drive, San Rafael, California 94901 (415) 457-4417
that. For this presentation, we sort of 1
simplify things and just looked at individual 2
days, but we can cut this in a number of 3
different ways and we can look at temperature 4
excess over a number of hours and so forth. But 5
one thing that we do notice over time is that 6
not only does the intensity of each storm 7
increase over the decades, but also the duration 8
increases. And within any given day, the number 9
of hours over a particular threshold -- 90 10
degrees or whatever the relevant threshold might 11
be -- becomes longer. So I think we have to 12
look at that sort of thing, as well, and the 13
models now are equipped to at least take a stab 14
at that. The models, of course, are not 15
perfect, but they are an important device in 16
looking forward. 17
CHAIRMAN WEISENMILLER: Yeah, certainly 18
what I remember from the third assessment is 19
that in the summertime, things were shifted up 20
generally and, again, the peaks were worse. I 21
guess the flip side of that question is, for 22
Sacramento you've looked a lot at the hottest 23
day, and part of our phenomena here that 24
affects, again, our loads, in fact the whole 25

56
CALIFORNIA REPORTING, LLC 52 Longwood Drive, San Rafael, California 94901 (415) 457-4417
operation of our systems, is we tend to have 1
Delta breezes at night, so even though we might 2
have a miserable day, that nights cool off. So 3
one question going forward is do we expect those 4
Delta breezes to be more or less? 5
MR. CAYAN: That's a great question and 6
it's one that comes in many different forms to 7
different communities. The Vintners in Napa 8
Valley are also interested in that question. My 9
instinct says that Delta breeze phenomena will 10
be at least as strong as present day, if not a 11
bit stronger, because of the temperature 12
gradient that is setting up in these models 13
where it looks like, as I mentioned, the 14
interior warming is going to be greater than 15
that along the coast. So it's essentially 16
reinforcing the sea breeze phenomena that we 17
have. But one thing that needs to be done there 18
is we need better dynamical models that have 19
essentially the full-on weather effects in order 20
to explore that. And we haven't had many 21
simulations in order to look at that with any 22
confidence yet, but that's an item that is kind 23
of on our plates and we're looking in order to 24
understand that. 25
57
CALIFORNIA REPORTING, LLC 52 Longwood Drive, San Rafael, California 94901 (415) 457-4417
I will say this, that if you just look at 1
the GCMs, they don't have evidence of that 2
Physics going on, that is, the nighttime 3
temperatures in the coastal domain and beyond 4
the coast don't seem to warm any less than do 5
the daytime temperatures. And, in fact, if you 6
look globally at warming over the last several 7
decades, it's actually the nighttime 8
temperatures that have increased more than 9
daytime temperatures. And furthermore, in 10
looking at heat waves in California over the 11
last few decades, what we've noticed is actually 12
a bit alarming, is the fact that the nighttime 13
periods in these strong heat waves such as 2006 14
are rather moist events, and nighttime 15
temperatures did not cool as they have in 16
previous heat waves, so we're actually seeing 17
something in recent trends that runs counter to 18
the Delta breeze phenomena. So we'll have to 19
see how that plays out as we look forward into 20
the models. But there's some evidence that 21
during these events that Delta breeze phenomenon 22
may be shut off. 23
CHAIRMAN WEISENMILLER: Yeah, that would 24
be very important. I know SMUD has an 25

58
CALIFORNIA REPORTING, LLC 52 Longwood Drive, San Rafael, California 94901 (415) 457-4417
adaptation plan in place and one of the things 1
they have to deal with obviously is whether or 2
not their distribution system can cool off at 3
night, and has real implications for how they go 4
forward. 5
I guess two other -- it would seem like 6
if the Delta breezes are strong, we may actually 7
have more wind at night, but the cloud cover may 8
reduce the solar along the coastal areas from 9
the rooftops, would be sort of another longer 10
term phenomena, it's part of what I'm just 11
struggling with in the Scoping Plan context with 12
thinking more and more about what California 13
looks like in 2030, where obviously the climate 14
impacts are going to be much more pronounced 15
than the time looking out where we're trying to 16
do in the IEPR, and so particularly looking at 17
what our systems look like in terms of loads and 18
resources both, even more impacts there. 19
COMMISSIONER MCALLISTER: So much 20
countervailing things, I mean, because if you 21
have less solar, or if you have less sort of 22
renewables being pumped into the distribution 23
system, you might have less over-heating of the 24
distribution grid itself, so you might need less 25
59
CALIFORNIA REPORTING, LLC 52 Longwood Drive, San Rafael, California 94901 (415) 457-4417
cooling. It's really so many different 1
tendencies here and picking them apart is very 2
challenging. You know, I think we have no 3
choice, we've got to move forward with doing 4
this work and figuring it out. I guess, you 5
know, if cloud cover in the Delta -- when you 6
were talking about cloud cover being a factor, 7
you know, I'm wondering if you have any 8
understanding of how along a coast the cloud 9
cover and the marine layer might actually change 10
over time in LA or someplace where you have 11
large populations? 12
MR. CAYAN: I wish. Again, that's a 13
phenomena we're looking at. We recently 14
completed a study looking at historical 15
variation of cloud cover -- by the way, largely 16
supported by the Energy Commission -- and find 17
that cloud cover variation is not surprisingly a 18
real important factor in mitigating high 19
temperatures really along the length of the 20
California Coast. We're looking at large scale 21
factors that drive cloudiness and we're looking 22
towards using those large scale factors as a 23
guide in projecting how cloud cover may change 24
in the future. I don't have an answer to that 25

60
CALIFORNIA REPORTING, LLC 52 Longwood Drive, San Rafael, California 94901 (415) 457-4417
at this point in time, but preliminarily anyway 1
it looks like the thermal inversions along the 2
California coast, which are caused by the 3
subsidence of air from a loft and, of course, 4
they're a very large factor in both weather and 5
air quality here, show signs of strengthening 6
somewhat. Those inversions are also involved in 7
the conditions that allow these stratus clouds 8
to penetrate inland. And so my guess is that 9
cloudiness is not going to decline in the 10
future, I guess the question is whether it's 11
going to increase, but that's going to take more 12
study. 13
COMMISSIONER MCALLISTER: Great. Thanks 14
very much. We're going to move on, but really 15
appreciate your chiming in and a really good 16
presentation. Thank you. 17
MS. RAITT: Thank you -- 18
MR. CAYAN: I appreciate being able to do 19
this from down here, saving the trip up. Thank 20
you. 21
CHAIRMAN WEISENMILLER: Again, thank you. 22
MS. RAITT: Great, thanks. Our next 23
speaker is Malachi Weng-Gutierrez. Thank you. 24
MR. WENG-GUTIERREZ: Good morning, 25

61
CALIFORNIA REPORTING, LLC 52 Longwood Drive, San Rafael, California 94901 (415) 457-4417
Commissioners. My name is Malachi Weng-1
Gutierrez. I work in the Demand Analysis 2
Office. And I'm going to briefly review some of 3
the revisions that were performed on the rates, 4
the Electricity and Natural Gas Rates that feed 5
into the Demand Models. 6
So we ended up using the same 7
methodology. We used the E3 GHG Calculator as 8
the basis of the developing Electricity Rate 9
Scenarios. As with the preliminary, we looked 10
at a number of the input assumptions that we 11
could vary and we selected a few of those to 12
kind of focus in on and look at how we might 13
modify them in the context of comments we 14
received in the preliminary forecast. So I'm 15
only going to talk about those elements which I 16
spent some time looking at, and which we 17
modified for the revised forecast. 18
Trying to get to the punch line, the 19
rates did decline significantly across many of 20
the utilities. In general, it was about a 20 21
percent drop in rates across all of the 22
different utilities for the different demand 23
cases. And I'll go into the specific details as 24
to why the declines occurred, but it was pretty 25

62
CALIFORNIA REPORTING, LLC 52 Longwood Drive, San Rafael, California 94901 (415) 457-4417
significant. So for example, if you look at the 1
Low Demand Case all the way to the right here, 2
we were showing nearly a 20 cent per kilowatt 3
hour average price in 2024, that is now an 4
average of 18 cents per kilowatt hour, so a 5
pretty significant drop. 6
So for the revised forecast, things that 7
I focused in on were the 2013 rates, those were 8
updated. Natural gas hub prices, the Natural 9
Gas Unit and Office had a number of workshops on 10
their forecasts and have had numerous 11
iterations, so I was able to incorporate one of 12
those iterations into the updated revised 13
forecast. Also, since the preliminary, there 14
were some auction events, the carbon auction 15
prices that were updated to reflect recent 16
events. And then one of the comments received 17
was how we were applying the revenue 18
requirements that were part of the auction to 19
the general rates, and that was something that I 20
spent some time on and looked at how we might 21
apply them to the specific sectors which we 22
forecast rates for. 23
And then obviously, as our demand 24
forecast changes and alters, the amount of 25

63
CALIFORNIA REPORTING, LLC 52 Longwood Drive, San Rafael, California 94901 (415) 457-4417
renewables also alters, and so we updated those 1
to reflect a more recent estimate by our office. 2
And then finally, one of the things in 3
the GHG Calculator which was dealt with in kind 4
of a simplified manner was sort of non-5
generation components of revenue requirements, 6
and so I spent some time looking at transmission 7
and distribution costs and how those might be 8
varying over the forecast period and tried to 9
modify those to create a better representation 10
of what I think will be those costs over the 11
forecast period. 12
So the first thing that was updated, or 13
that I referenced being updated was the 2013 14
electricity rates, and obviously for the 15
preliminary forecast that work was done early on 16
in the year and we didn't have all the 17
information necessarily, or as the year 18
progressed, obviously had more information as to 19
what was happening, more filing, rate filings, 20
more information coming out as to what the 21
utilities were doing. And so I used a bunch of 22
that information in addition to some 23
conversations with the PUC to adjust the 2013 24
rates to reflect what was actually occurring as 25
64
CALIFORNIA REPORTING, LLC 52 Longwood Drive, San Rafael, California 94901 (415) 457-4417
opposed to what was done in the preliminary, 1
which was primarily to use the outputs of the 2
model to generate the 2013 estimate. So because 3
there was a significant increase from 2012 to 4
2013 due to primarily natural gas increases in 5
the model, by doing this revision or this 6
estimate of 2013 rates outside of the model, it 7
brought down those 2013 rates pretty 8
significantly. 9
And this is just the California-wide 10
natural gas price that's used in the Natural Gas 11
Model, the NAMGas Model they use. And you'll 12
notice that the dashed lines there are what were 13
used in the preliminary forecast. It's a very 14
narrow band. And I think as part of one of 15
their workshops, there were some comments to 16
that effect, that it was a little too narrow, 17
and so in the proceeding iterations of the 18
forecast that they produced, they widened that 19
pretty substantially. So you can see that the 20
2020 values are substantially wider than they 21
had early on in the year, and so this is 22
reflective in the rates that we have. 23
So in general, the high natural gas price 24
here is going to lead to a higher price in our 25

65
CALIFORNIA REPORTING, LLC 52 Longwood Drive, San Rafael, California 94901 (415) 457-4417
case, but it's offset by other changes, which 1
then lower the rates significantly. 2
Again, I had mentioned that there were 3
some adjustments to the carbon auction prices 4
that we're using in the scenarios, this is just 5
an update of those rates. You can see in the 6
dashed lines again that's what was used in the 7
preliminary, and then the solid lines are what 8
are currently being used in the revised. So 9
there was a slight decrease in those rates for 10
most of the cases and then a substantial 11
decrease in the mid case, again, reflecting I 12
think some recent work and some other accounts. 13
There was a Severin Borenstein paper on what the 14
projected impacts would be to carbon prices, and 15
in that paper he basically stated that it's 16
going to be fairly flat over the forecast period 17
to 2020, and then as you get closer to 2020, you 18
might have an increase because of maybe 19
constrained allowances and other things. But 20
for the most part we envision that the rates 21
will be fairly low over the forecast period. In 22
our high case, obviously, we'll be looking at 23
something that's on the order of magnitude of, I 24
think, three times the floor level that we're 25
66
CALIFORNIA REPORTING, LLC 52 Longwood Drive, San Rafael, California 94901 (415) 457-4417
estimating. 1
And then although the High Demand Case 2
did not have a significant variation in the 3
amount of renewables being incorporated into 4
this estimate, the Low Demand Case did and that 5
obviously changes the cost of generation 6
significantly if the amount of renewables needed 7
are lower than the amount of generation cost or 8
if the revenue requirements associated with that 9
are going to be substantially lower, as well. 10
So in allocating the revenue requirements 11
for the carbon auctions under cap and trade, I 12
looked at the three sectors that we forecast 13
rates for, residential, commercial, and 14
industrial. And I believe the way that it's 15
structured now is that the residential sector 16
will not really be impacted by carbon pricing in 17
the auction, and that the revenues from the 18
auction will actually be used to offset any 19
costs that will be incorporated into the 20
residential sector. So for our work, I 21
basically removed all the influences of any 22
carbon revenue requirements from the estimates 23
and that lowered our residential rates a small 24
amount. 25
67
CALIFORNIA REPORTING, LLC 52 Longwood Drive, San Rafael, California 94901 (415) 457-4417
The commercial sector, there are small 1
commercial sector buildings which are also going 2
to have allowance revenues allocated to them to 3
offset any potential impact to their rates. It 4
represents a small portion of the total 5
commercial, but I've weighted the commercial 6
revenue requirements by the amount of 7
consumption associated with those small 8
commercial entities. So that one also decreased 9
slightly because of this, but it didn't really 10
necessarily decrease it significantly, it was a 11
small decline for the commercial sector rates. 12
For the industrial sector, their energy 13
intensive trade exposed industries which are 14
identified as being important to be sensitive to 15
the impacts to those. Because they're such a 16
small fraction of all industrial consumption, I 17
ended up not trying to weight the industrial 18
sector rates by that. I basically have not 19
included any type of revenue being passed back 20
to industrial sector activities, again, because 21
I thought it was fairly small. 22
Then, as I mentioned, transmission and 23
distribution, the way that the model had been -- 24
there's a documentation for the GHG model which 25

68
CALIFORNIA REPORTING, LLC 52 Longwood Drive, San Rafael, California 94901 (415) 457-4417
specified how non-generation revenue 1
requirements would be handled, and then there 2
was the model itself and they had some 3
inconsistencies in how it was being implemented. 4
And in general, it was using about a two percent 5
growth rate over the forecast period. So I 6
wanted to take a look and see whether or not 7
that two percent was reasonable over all of our 8
scenarios and what other factors might come into 9
play in changing the transmission and 10
distribution costs or revenue requirements. And 11
so I looked at a couple of sources, one of the 12
big ones obviously that I looked at was the LTPP 13
for 2010, there was an Evaluation Metric 14
Calculator, and in the Metric Calculator they 15
have three scenarios that they look at, both 16
distribution and transmission cost growth rates. 17
And I looked to that to basically estimate some 18
potential growth rates for the model. And this 19
is basically what I came up with: the High 20
Demand Case where you have a fairly low 21
transmission cost growth, almost three percent, 22
really is looking at a five-year period, and I 23
think it's the last five years. So most of the 24
transmission and distribution costs in the 25

69
CALIFORNIA REPORTING, LLC 52 Longwood Drive, San Rafael, California 94901 (415) 457-4417
calculator and the LTPP for 2010 are sort of 1
front loaded. So I used those low growth years 2
as the basis of that estimate. Also, partly the 3
reason behind it is that after 2020, 4
transmission and distribution costs may decline 5
significantly if there are no new requirements 6
for expanding RPS. So arguably, the costs after 7
2020 may be lower than they have been over the 8
next eight-year period, and so it seemed 9
reasonably on the low end to go with something 10
that was lower than the two percent that was the 11
default case, default value in the GHG 12
Calculator. 13
So all the way to the right, you'll 14
notice that the weighted average annual case for 15
the High Demand Case is lower than that which 16
was the default input for the GHG Calculator, so 17
we're having about a 1.5 percent growth rate. 18
And in the Low Demand Case, or the high price 19
case, it's about twice that, so it's about three 20
percent. 21
This is just a summary sheet that I had 22
this as a slide in the preliminary presentation, 23
as well, and it showed all of the inputs and 24
their associated values. So these are the 25
70
CALIFORNIA REPORTING, LLC 52 Longwood Drive, San Rafael, California 94901 (415) 457-4417
updated values that we have for the revised 1
forecast. The primary changes are the natural 2
gas prices there are, again, a little wider. 3
The renewable generation amounts there are 4
reflective of what I just presented. And then 5
the carbon prices are also modified slightly. 6
So in the end, this is sort of the set of 7
the utility-based rates that comprise those 8
averages that I showed in the first slides. 9
These are all in 2012 dollars per kilowatt hour, 10
so for the most part, even in the high cases, 11
most of them are fairly low. There are 12
obviously some cases where they're a little 13
higher, so in the case of SDG&E, there's a 14
higher rate there for their high case, but in 15
general the rates are fairly low, they don't 16
show that much growth over the forecast period. 17
These are 2024 rates. 18
So I just wanted to quickly talk about 19
the natural gas forecast, as well. As I 20
mentioned, there were some comments about the 21
natural gas forecast early on in the year, they 22
worked on expanding the range of values that 23
they used, so that actually played out in both 24
the electricity rate forecasts that we have 25

71
CALIFORNIA REPORTING, LLC 52 Longwood Drive, San Rafael, California 94901 (415) 457-4417
generated here, as well as our natural gas rates 1
that we use in the models. And the changes 2
primarily came about because of a closer look or 3
refinement of the amount of coal fired 4
generation that was being retired or converted 5
to natural gas generation, and then they also 6
developed a set of cost environments. So they 7
looked at historic trends of costs associated 8
with different components of natural gas and 9
selected a set of conditions under which there 10
would be high costs, and selected conditions 11
that would also be low to create a larger or 12
wider band of values that they used. And so 13
that's what contributed to the widening of the 14
forecasts that they had. And then obviously 15
they took a closer look at infrastructure 16
additions and exports to Mexico, and they did 17
some work on the LNG sector, as well. 18
So this is the revised set of natural gas 19
rates that we're using in the forecast. Again, 20
if you were to compare this with what was in the 21
preliminary, you'd see that the highs and lows 22
are substantially wider, the mid cases are going 23
to be a little bit higher than in the 24
preliminary, but for the most part they're 25
72
CALIFORNIA REPORTING, LLC 52 Longwood Drive, San Rafael, California 94901 (415) 457-4417
pretty comparable. 1
And then just in general, there are quite 2
a few uncertainties associated with what rates 3
will look like in the future, and I think 4
they're pretty significant. So I wanted to 5
highlight some of these uncertainties and just 6
talk through a couple of them. This is my last 7
slide. 8
So how San Bruno and SONGs, the revenue 9
requirements, and the replacement costs, and 10
what is allowed and disallowed in those 11
proceedings will have, I think, a profound 12
effect on rates in the future. 13
Obviously, in the model itself there are 14
some cost assumptions about renewable 15
generation; they don't necessarily have a time 16
series of costs, there's a single cost that's 17
attributed to that renewable generation. So 18
arguably in the future, if costs of renewable 19
generation decline, then that would have an 20
impact on the retail rates in the future, and so 21
I think how renewable generation costs progress 22
over the forecast period would influence the 23
rates pretty significantly. 24
The other on here -- distributed 25

73
CALIFORNIA REPORTING, LLC 52 Longwood Drive, San Rafael, California 94901 (415) 457-4417
generation is pretty significant, as well. I 1
think how distributed generation is rolled out 2
and what the potential impacts to distribution 3
cost upgrades will be can be pretty significant. 4
Obviously, those aren't incorporated into our 5
rates, so that's something maybe we can look at 6
in the future, or look at how we might want to 7
create a scenario where we have maybe a high set 8
of DG, and then look at how we might estimate 9
those, how those revenue requirements would play 10
out in the rates. 11
And then I just put here the Energy 12
Resource Recovery Account. This is kind of part 13
of -- there are GRC proceedings and then there's 14
this Energy Resource Recovery Account 15
proceedings, and in this proceeding they include 16
things like natural gas prices, fuel costs, 17
there's also I think the SONGs replacement cost, 18
and things would fall under that proceeding. 19
And so how all of those elements play out in the 20
future, I think, and actually that there are in 21
some cases delays to the ERRA proceedings and 22
the decisions, so if those are put off, if the 23
approval of the proceedings are not done in a 24
quick fashion, or I guess what I'm trying to say 25

74
CALIFORNIA REPORTING, LLC 52 Longwood Drive, San Rafael, California 94901 (415) 457-4417
is, if there are delays in the ERRA proceedings, 1
then what you're doing is you're pushing the 2
costs off potentially to future years, and so if 3
we -- we haven't taken into account numerous 4
kind of current ERRA account decisions because 5
they have been delayed. So I think in 2014 or 6
even later this year, there could be some 7
proceeding decisions that would be made that 8
could affect rates pretty significantly. And so 9
I wanted to highlight that. 10
Obviously, I talked about transmission 11
and distribution costs. That's in the context 12
of renewable generation, I think those are 13
fairly uncertain. Wholesale prices, obviously 14
there could be market volatility that could lead 15
to some additional uncertainties. And the coal 16
fired generation and the natural gas exports, 17
and even the natural gas plays, all kind of deal 18
with natural gas demand. How those play out in 19
the future, how many coal fired generation 20
facilities are converted versus retired, I mean, 21
all of that plays a role in adding to the 22
uncertainty of these rates. But I think what we 23
have right now is a fairly reasonable set of 24
rates. And I would be open to any questions 25

75
CALIFORNIA REPORTING, LLC 52 Longwood Drive, San Rafael, California 94901 (415) 457-4417
that the Commissioners might have on what was 1
done to develop the revised set of electricity 2
and natural gas rates. 3
CHAIRMAN WEISENMILLER: Thanks again. I 4
think you've done a good job on stuff. I guess 5
a couple -- at a high level -- first 6
observation, I would say, is that I don't think 7
anyone in this room expects disallowances for 8
San Bruno and SONGs to be zero, so that would 9
tend to suggest our numbers are high; I don't 10
think anyone in the room would probably brave to 11
come up with an estimate, although certainly 12
when you do written comments, we would sort of 13
welcome any suggestions there. But at the same 14
time, as you said, that tends to bump things up. 15
On the other hand, ERRA, I mean, like my 16
impression was the Edison numbers are like a 17
penny in the recent draft decision, so that sort 18
of could count the other way. 19
Another observation is that, in terms of 20
carbon auction, I think that the general 21
expectation is with SONGs out the next auction 22
will have higher numbers than we've seen before. 23
But again, we'll find out when the auction 24
occurs. 25
76
CALIFORNIA REPORTING, LLC 52 Longwood Drive, San Rafael, California 94901 (415) 457-4417
MR. WENG-GUTIERREZ: Yeah, and so for the 1
auction rates, we've only incorporated those 2
that actually occurred, the actual auctions. So 3
we haven't really tried to project what future 4
auctions will look like, other than to kind of 5
develop our scenarios. 6
CHAIRMAN WEISENMILLER: Yeah. And you 7
know, obviously the other thing which we never 8
would want to dive into is you're looking at 9
average rates and not rate structural effects, 10
which again, looking at recent legislation, 11
could have significant impacts going forward. 12
COMMISSIONER MCALLISTER: Yeah, just to 13
reiterate that last point about behavior in the 14
demand forecasts generally, not just the average 15
rates, or not just your presentation, but also 16
Chris's presentation and the forecast 17
marginality that might be impacted by rate 18
structures and how those motivate demand in the 19
different sectors, so that's a very rich area 20
for investigation going forward in the next 21
year, next five years or so. But thanks for 22
your presentation, Malachi, it was good. 23
I think we're going to slightly reorder 24
the presentations going forward here so we can 25

77
CALIFORNIA REPORTING, LLC 52 Longwood Drive, San Rafael, California 94901 (415) 457-4417
get in Chris Kavalec's presentation before 1
lunch. 2
MS. RAITT: Right. Thanks. So next 3
we'll hear from Chris Kavalec and then we'll 4
hear Asish Gautam after lunch to talk about 5
distributed generation. Thanks. 6
MR. KAVALEC: Okay. We reordered these 7
two presentations because Floyd from Navigant is 8
here and I understand he has to leave right 9
after lunch, so in case there were technical 10
questions related to the potential study, and 11
additional achievable efficiency savings, we 12
have Floyd here. 13
Okay, so as I said, an important step in 14
going from our baseline to a managed forecast is 15
the incorporation of additional achievable 16
energy efficiency savings, AAEE. And we define 17
these as likely to occur savings, or initiatives 18
that have not yet been finalized, or funded, or 19
approved, incremental to the committed 20
efficiency savings that are already in the 21
baseline forecast. 22
And these savings were developed using 23
Navigant's Potential Goals and Targets Model, or 24
PGT Model, which was used for the CPUC's 25
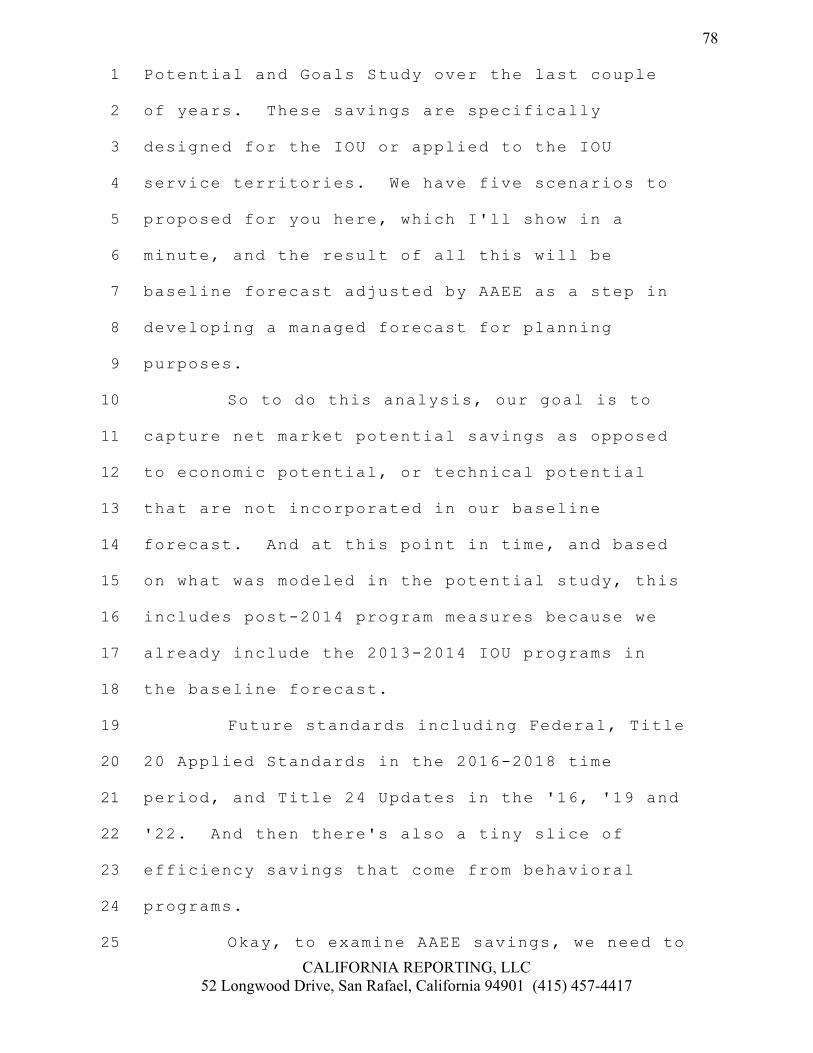
78
CALIFORNIA REPORTING, LLC 52 Longwood Drive, San Rafael, California 94901 (415) 457-4417
Potential and Goals Study over the last couple 1
of years. These savings are specifically 2
designed for the IOU or applied to the IOU 3
service territories. We have five scenarios to 4
proposed for you here, which I'll show in a 5
minute, and the result of all this will be 6
baseline forecast adjusted by AAEE as a step in 7
developing a managed forecast for planning 8
purposes. 9
So to do this analysis, our goal is to 10
capture net market potential savings as opposed 11
to economic potential, or technical potential 12
that are not incorporated in our baseline 13
forecast. And at this point in time, and based 14
on what was modeled in the potential study, this 15
includes post-2014 program measures because we 16
already include the 2013-2014 IOU programs in 17
the baseline forecast. 18
Future standards including Federal, Title 19
20 Applied Standards in the 2016-2018 time 20
period, and Title 24 Updates in the '16, '19 and 21
'22. And then there's also a tiny slice of 22
efficiency savings that come from behavioral 23
programs. 24
Okay, to examine AAEE savings, we need to 25

79
CALIFORNIA REPORTING, LLC 52 Longwood Drive, San Rafael, California 94901 (415) 457-4417
develop scenarios and the PGT Model has a host 1
of input assumptions that are used in defining a 2
scenario. 3
The building stock, energy prices and 4
avoided costs are based on the last adopted 5
forecast, CED 2011. Incremental costs, meaning 6
the costs versus the conventional or base 7
technology, incentive level is the percentage of 8
the incremental cost that's covered by the 9
incentive. Unit energy savings are savings per 10
unit per year. Total resource costs, those in 11
the efficiency world are familiar with this 12
measurement. The model requires that you define 13
a threshold, and that threshold basically 14
defines what the benefits have to be relative to 15
the costs for the technology to be considered in 16
the model. Measured density, which measures the 17
penetration of a given technology or measure, 18
the higher the penetration level of a given 19
measure, the more familiar customers are with 20
it and therefore, all else equal, the more 21
likely there are to be additional adoptions. 22
Discount rates measure the value of costs 23
today versus savings tomorrow. Word of mouth 24
and marketing effects measure the willingness 25

80
CALIFORNIA REPORTING, LLC 52 Longwood Drive, San Rafael, California 94901 (415) 457-4417
and awareness of customers under these 1
technologies. And you have to make assumptions 2
for the Standards, what type of standards are 3
introduced and when, and what compliance rates 4
you're going to assume for the different 5
standards. 6
To come up with our five proposed 7
scenarios, we started out with three initial 8
scenarios developed in the potential study by 9
Navigant and CPUC staff, a high, a mid and a 10
low. We and CPUC staff then developed four 11
additional scenarios as variations around the 12
existing mid case from Navigant. The results 13
and definitions of these scenarios were 14
submitted to our Demand Analysis Working Group 15
for comment. These comments were provided to 16
our Joint Agency Steering Committee, or JASC, 17
made up of management from the three agencies, 18
CPUC, CEC, and ISO. And what came out of all 19
that was five proposed scenarios for AAEE that 20
look like this. 21
The three cases in the middle there, two, 22
three and four, are all what we would call mid 23
cases, Low Mid, Mid, and High Mid. The general 24
consensus in the JASC discussions was that we 25

81
CALIFORNIA REPORTING, LLC 52 Longwood Drive, San Rafael, California 94901 (415) 457-4417
wanted more than one version of a mid case as 1
alternatives for planning, and that these mid 2
cases should have the same assumptions regarding 3
building stock and retail prices, so they should 4
be consistent in that way. And it was felt that 5
the alternatives to the mid case that we and 6
CPUC staff developed, that I mentioned in the 7
previous slide, didn't have enough variation 8
around the original mid case, so they wanted 9
alternatives that had more of a difference from 10
the mid case. 11
The cases 1 and 5, those are cases that 12
we, the Energy Commission, are using to pair 13
with our high demand and low demand scenarios, 14
respectively. So the way that we've paired this 15
is we have our High Demand Case paired with the 16
low savings, or Scenario 1, and the low demand 17
paired with high savings, or Scenario 5. The 18
building stock and prices in those two cases are 19
consistent with the demand case to which they 20
correspond, so in the low savings case, we have 21
high building stock and low retail prices 22
consistent with the High Demand Case, and vice 23
versa for the Low Demand Case and high savings. 24
The way it turned out was that cases 1 25

82
CALIFORNIA REPORTING, LLC 52 Longwood Drive, San Rafael, California 94901 (415) 457-4417
and 2 and cases 4 and 5 are very close together, 1
not surprising since their definitions are 2
pretty similar. The key differences are that 3
first, between Scenarios 1 and 2, is you have a 4
little bit less emerging technologies. That 25 5
percent there, the first line for low savings 6
that means that we allowed the PGT Model to 7
predict adoption of emerging technologies given 8
a certain threshold, and then we reduced that 9
amount by 75 percent. And the reason we're 10
doing this is because, as we know, there's a lot 11
of uncertainties around emerging technologies. 12
In the load savings case, we reduced the 13
percentage that came out of the model. And 14
really, the only other difference is the 15
building stock and prices. In the Low savings 16
case, it's consistent with our High Demand Case, 17
as I mentioned, and the case to Low Mid, it's 18
consistent with the Mid Demand Case. 19
Cases 4 and 5 again are very similar. 20
The difference there is, again, the assumptions 21
for building stock and prices, consistent with 22
the Low Demand Case in Savings Scenario 5, and 23
consistent with the Mid Demand Case in Scenario 24
4. One other difference is that we allowed -- 25

83
CALIFORNIA REPORTING, LLC 52 Longwood Drive, San Rafael, California 94901 (415) 457-4417
we assumed compliance enhancements would occur 1
in Scenario 5, meaning the rate of compliance 2
for these different standards would increase 3
over the forecast period to a maximum of 100 4
percent. 5
One other source of overlap to account 6
for is lighting savings assumptions that we make 7
based on the Huffman legislation. In our end 8
use models, we modify the lighting we see as 9
meeting unit energy consumption from lighting, 10
and we modify the UECs in our end use models to 11
be consistent with the Huffman requirements. In 12
other words, by 2017, we've reduced the lighting 13
you receive by 50 percent in the residential 14
sector, and by 25 percent in the commercial 15
sector. 16
This is just a step we took a few years 17
ago to improve what we thought the accuracy of 18
the forecast, given the Huffman legislation has 19
teeth and people expect that these lighting 20
savings are going to occur. However, they're 21
not associated with any specific program or 22
standard. And during the forecast period, you 23
would expect that these lighting savings would 24
overlap with lighting savings in the potential 25

84
CALIFORNIA REPORTING, LLC 52 Longwood Drive, San Rafael, California 94901 (415) 457-4417
study. So by 2024, said overlap reaches a 1
little bit over 3,000 gigawatt hours and 450 2
megawatts. 3
And in the results that I show you from 4
this point on for AAEE, this is the potential 5
study results using the efficiency initiatives 6
that I defined earlier with this overlap 7
subtracted out. 8
So here are the five scenarios for the 9
combined IOU service territories in gigawatt 10
hours and, as I mentioned, the cases 1 and 2 and 11
4 and 5 are very close together, as it turned 12
out. And by 2024, in the Mid case, the blue 13
line there, we have 21,000 gigawatt hours of 14
savings in addition to the committed savings 15
that are already in our forecast. 16
In the High cases, they were looking 17
around 35,000 and in the Low Mid cases 12,000 to 18
13,000 gigawatt hours. A similar pattern for 19
the megawatts. In the Mid case, we reach around 20
5,000 megawatts of additional savings for the 21
combined IOUs. And for natural gas, around in 22
the Mid case a little bit over 400 million 23
therms by the end of the forecast period. And 24
you will notice on the left-hand side of this 25
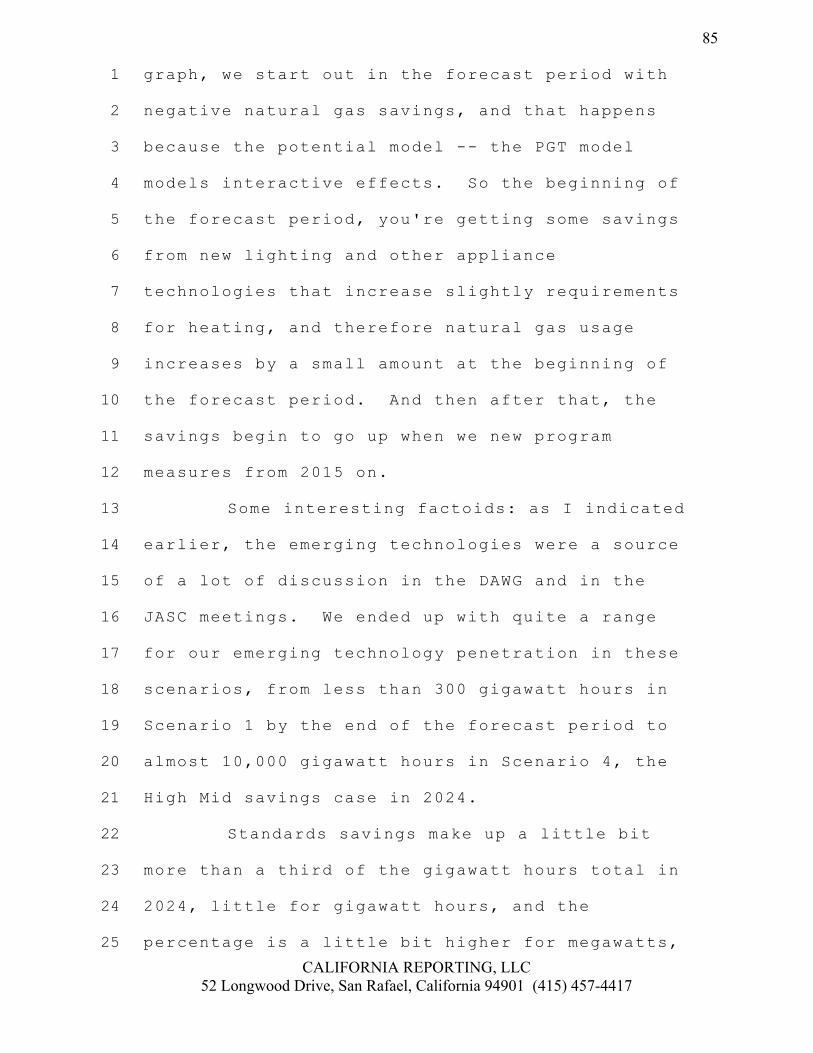
85
CALIFORNIA REPORTING, LLC 52 Longwood Drive, San Rafael, California 94901 (415) 457-4417
graph, we start out in the forecast period with 1
negative natural gas savings, and that happens 2
because the potential model -- the PGT model 3
models interactive effects. So the beginning of 4
the forecast period, you're getting some savings 5
from new lighting and other appliance 6
technologies that increase slightly requirements 7
for heating, and therefore natural gas usage 8
increases by a small amount at the beginning of 9
the forecast period. And then after that, the 10
savings begin to go up when we new program 11
measures from 2015 on. 12
Some interesting factoids: as I indicated 13
earlier, the emerging technologies were a source 14
of a lot of discussion in the DAWG and in the 15
JASC meetings. We ended up with quite a range 16
for our emerging technology penetration in these 17
scenarios, from less than 300 gigawatt hours in 18
Scenario 1 by the end of the forecast period to 19
almost 10,000 gigawatt hours in Scenario 4, the 20
High Mid savings case in 2024. 21
Standards savings make up a little bit 22
more than a third of the gigawatt hours total in 23
2024, little for gigawatt hours, and the 24
percentage is a little bit higher for megawatts, 25

86
CALIFORNIA REPORTING, LLC 52 Longwood Drive, San Rafael, California 94901 (415) 457-4417
almost 50 percent. And the reason the megawatt 1
percentage is higher is because we have Title 24 2
Standards that have a lot of impact on peak. 3
And natural gas, because of the interactive 4
effects, among other things, natural gas 5
standards percentage is much less than 6
electricity. 7
And one of the key findings reflected in 8
these numbers is that the commercial sector has 9
the most potential in electricity in terms of 10
future efficiency savings, although it remains 11
the residential in the case of natural gas 12
because residential is a much larger user of 13
natural gas than commercial. 14
This table shows the total savings by IOU 15
for each of the scenarios. The amounts, the 16
magnitudes are mainly a function of the size of 17
the IOU, the amount of sales by the IOU, 18
although I think San Diego's totals are a little 19
bit proportionately less because they don't have 20
as much in relative terms, potential on the 21
industrial side. 22
Okay, now if we take our mid baseline 23
case and some over the three electricity IOU 24
service territories, and then make adjustments 25

87
CALIFORNIA REPORTING, LLC 52 Longwood Drive, San Rafael, California 94901 (415) 457-4417
for each of the AAEE Mid cases, this is what we 1
get. The top line shows the baseline total for 2
IOU sales summed over the three IOUs. The red 3
line below that shows what happens if you 4
incorporate Low Mid AAEE savings, or Scenario 2. 5
The green line below that is after incorporating 6
Mid AAEE savings, or Scenario 3. And the black 7
line at the bottom shows the forecast if you 8
incorporate the High Mid savings. And basically 9
what you get is, in the Low Mid savings case is 10
slightly increasing forecast for combined IOU 11
sales, and almost a flat forecast if you apply 12
the Mid case, and a declining forecast if you 13
apply the High Mid case. 14
Same basic picture for the megawatts. 15
And for natural gas where the forecast is fairly 16
flat to begin with, so what you end up with when 17
applying the three mid-savings scenarios to the 18
IOU baseline Mid Scenario for natural gas, is 19
three declining forecasts. The erratic pattern 20
that you see there at the beginning of the 21
forecast period comes from the swings in natural 22
gas prices at the beginning of the forecast 23
period. 24
Now, combining our Demand Scenarios with 25
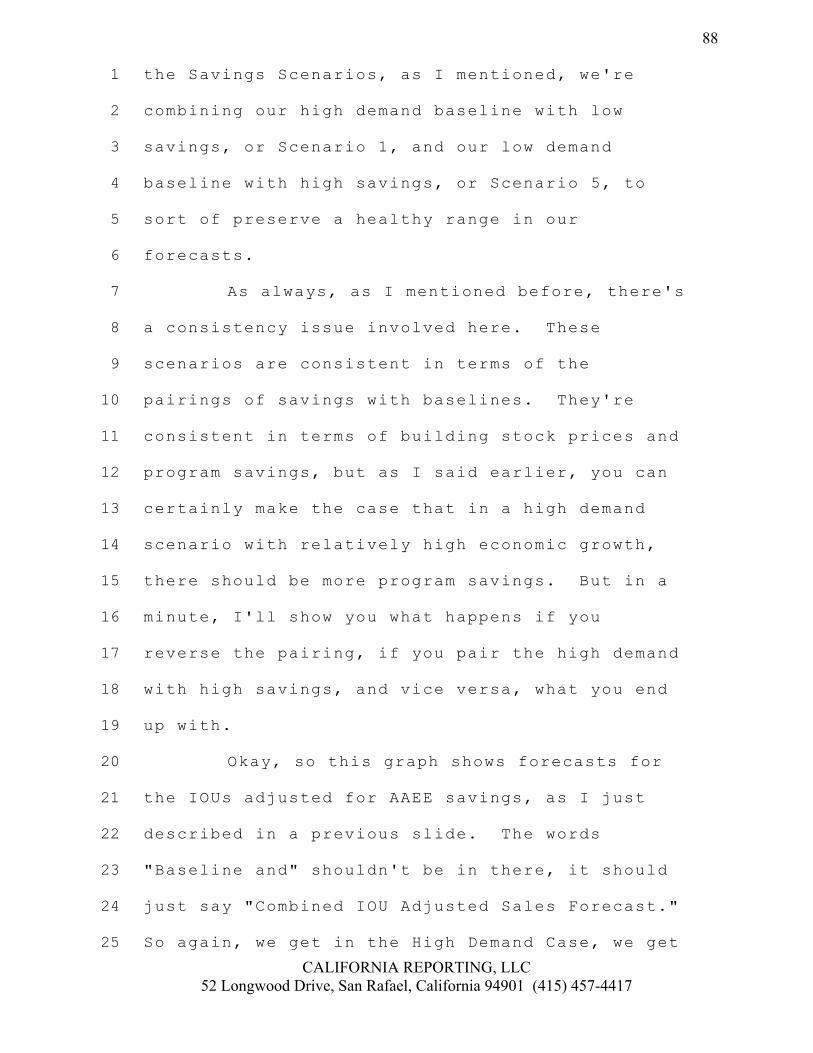
88
CALIFORNIA REPORTING, LLC 52 Longwood Drive, San Rafael, California 94901 (415) 457-4417
the Savings Scenarios, as I mentioned, we're 1
combining our high demand baseline with low 2
savings, or Scenario 1, and our low demand 3
baseline with high savings, or Scenario 5, to 4
sort of preserve a healthy range in our 5
forecasts. 6
As always, as I mentioned before, there's 7
a consistency issue involved here. These 8
scenarios are consistent in terms of the 9
pairings of savings with baselines. They're 10
consistent in terms of building stock prices and 11
program savings, but as I said earlier, you can 12
certainly make the case that in a high demand 13
scenario with relatively high economic growth, 14
there should be more program savings. But in a 15
minute, I'll show you what happens if you 16
reverse the pairing, if you pair the high demand 17
with high savings, and vice versa, what you end 18
up with. 19
Okay, so this graph shows forecasts for 20
the IOUs adjusted for AAEE savings, as I just 21
described in a previous slide. The words 22
"Baseline and" shouldn't be in there, it should 23
just say "Combined IOU Adjusted Sales Forecast." 24
So again, we get in the High Demand Case, we get 25

89
CALIFORNIA REPORTING, LLC 52 Longwood Drive, San Rafael, California 94901 (415) 457-4417
a slightly increasing forecast. The Mid demand 1
paired with the Mid savings scenario for the 2
IOUs, you get a relatively flat forecast and 3
then a declining forecast in the Low Demand 4
Case. 5
Now if we reverse that order, you can see 6
what happens to the range there. We basically 7
end up at the same point by the end of the 8
forecast period. This is pairing high demand 9
with high savings, or Scenario 5, and low demand 10
with low savings. 11
A similar pattern for megawatts using the 12
scenarios pairings as described. For natural 13
gas, again, we start out with a relatively flat 14
forecast, so when we apply these in all three 15
demand scenarios, so when we apply the AAEE 16
savings, the result is three declining forecasts 17
for natural gas. 18
So I'll just close with some 19
uncertainties related to this analysis that we 20
should always keep in mind. At the end of the 21
day, what we're really interested in is 22
estimating the cumulative net impact of all 23
these savings on our consumption or peak demand. 24
And that depends on the amount of decay, the 25
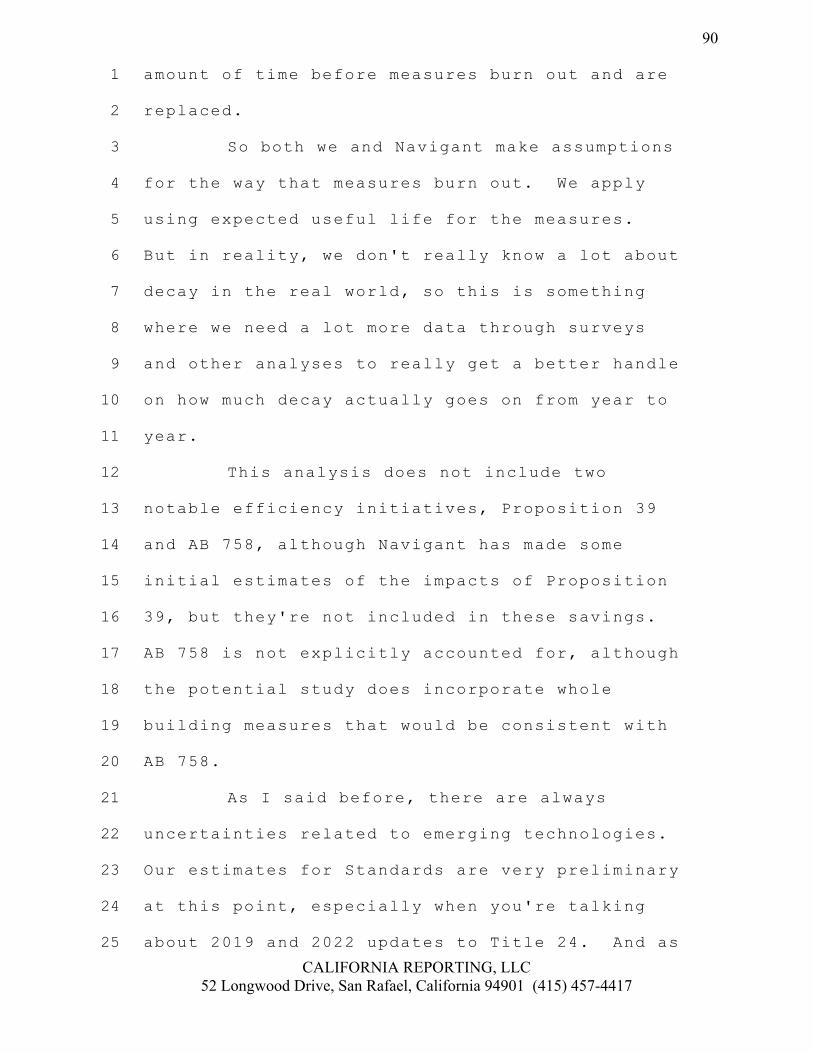
90
CALIFORNIA REPORTING, LLC 52 Longwood Drive, San Rafael, California 94901 (415) 457-4417
amount of time before measures burn out and are 1
replaced. 2
So both we and Navigant make assumptions 3
for the way that measures burn out. We apply 4
using expected useful life for the measures. 5
But in reality, we don't really know a lot about 6
decay in the real world, so this is something 7
where we need a lot more data through surveys 8
and other analyses to really get a better handle 9
on how much decay actually goes on from year to 10
year. 11
This analysis does not include two 12
notable efficiency initiatives, Proposition 39 13
and AB 758, although Navigant has made some 14
initial estimates of the impacts of Proposition 15
39, but they're not included in these savings. 16
AB 758 is not explicitly accounted for, although 17
the potential study does incorporate whole 18
building measures that would be consistent with 19
AB 758. 20
As I said before, there are always 21
uncertainties related to emerging technologies. 22
Our estimates for Standards are very preliminary 23
at this point, especially when you're talking 24
about 2019 and 2022 updates to Title 24. And as 25
91
CALIFORNIA REPORTING, LLC 52 Longwood Drive, San Rafael, California 94901 (415) 457-4417
always, there's a great need for updated data. 1
The baseline on which these savings are based in 2
the potential study come from the 2004 3
commercial survey and the 2009 residential 4
survey, badly in need of update for the next 5
potential study. 6
So with that, questions, comments? 7
COMMISSIONER MCALLISTER: Yeah, thanks 8
very much, Chris. So I wanted to take advantage 9
of the fact that Floyd is here and ask a 10
question about sort of what levers -- well, I 11
guess we had the discussion about sort of how 12
could we model some of these initiatives like 13
758, less so Prop. 39, but you know, it being 14
more recent, but how could we reflect those 15
initiatives in some way in the forecast. And I 16
wanted a little bit more explanation from Floyd 17
about sort of what sorts of levers do you have 18
to pull that sort of can map over onto 19
initiatives like those. You know, you can't 20
sort of put a box in there that says "check the 21
Prop. 39 box" and see that you get, right? 22
You've got to sort of assemble the kinds of 23
measures that you think are going to happen 24
under that initiative. Maybe you could talk a 25

92
CALIFORNIA REPORTING, LLC 52 Longwood Drive, San Rafael, California 94901 (415) 457-4417
little bit about that process and what levers 1
you do and don't have in the model to be able to 2
mimic an initiative like Prop. 39 or 758. That 3
would be great so people online can hear. 4
MR. KNEIPE: This on? Okay, great. I 5
think that, you know, we look at the model now 6
and it kind of divided the world into two camps, 7
or two types of efficiency; one is stock 8
turnover where you're changing out equipment for 9
a more efficient piece of equipment, and I think 10
that this model did a very good job of 11
accounting for that, and that's primarily what 12
Chris is showing. 13
The other part of the efficiency world, 14
though, is changes in operation of energy 15
management and how people use that equipment 16
once it's installed. And I think that there is 17
some significant room to improve those estimates 18
in this model. So operational changes account 19
for about 10 percent of the potential that we 20
built into the model, and I think that that's 21
likely understated. And when I look at things 22
like Prop. 39, it's conceivable that that could 23
be used to improve, you know, the management 24
capacity at K through 12s and the community 25

93
CALIFORNIA REPORTING, LLC 52 Longwood Drive, San Rafael, California 94901 (415) 457-4417
colleges, to actually use their equipment more 1
efficiently. And there was a study that was 2
done and it was one that I did looking at 3
institutional programs, and I suspect that 4
there's upwards of 30 percent additional yield 5
in terms of additional efficiency that can be 6
achieved through just better management 7
practices. And I suspect that's where Prop. 39 8
and AB 73 -- or SB 73, I guess -- are going to 9
have an impact, and that's what we've kind of 10
taken a preliminary look at, but it's one of 11
those things that's going to need additional 12
research. 13
So I think because operational savings 14
are underrepresented in this model, I've always 15
considered that the Mid case is a fairly 16
conservative look going forward. 17
COMMISSIONER MCALLISTER: Thanks. So 18
that makes sense. I guess to the extent that 19
Prop. 39 and 758, though, are going to stimulate 20
turnover, you know, actual installation of 21
equipment, for example, turn over existing stock 22
than they are represented in the model, right, 23
and then we're talking about penetration rates 24
and uptake and things like that, that you do 25

94
CALIFORNIA REPORTING, LLC 52 Longwood Drive, San Rafael, California 94901 (415) 457-4417
actually have leverage for in a model. Is that 1
right? 2
MR. KNEIPE: We do. And AB 758 is 3
represented, as Chris said, in the model as a 4
whole building initiative. And we did have some 5
additional yield from commercial whole building 6
activities, but it was fairly muted for 7
residential, and that we just haven't been able 8
to identify what are the market dynamics that 9
are causing people to participate. It's 10
probably not, you know, financial self interest 11
as -- the whole building retrofits that we saw 12
in reviewing program records didn't necessarily 13
pencil from either a cost-effectiveness 14
standpoint for a utility, or make sense from a 15
payback standpoint for the customer perspective. 16
COMMISSIONER MCALLISTER: Interesting. 17
MR. KNEIPE: So if we can identify why 18
people are doing that and if there's a way to 19
increase that uptake, we can certainly have a 20
more robust impact from whole building activity 21
on the residential side. 22
Other aspects that I understand are 23
potential under AB 758 such as, you know, 24
mandatory upgrades at time of sale, we didn't 25

95
CALIFORNIA REPORTING, LLC 52 Longwood Drive, San Rafael, California 94901 (415) 457-4417
consider those, but we have the infrastructure 1
to do that. 2
COMMISSIONER MCALLISTER: In terms of 3
like disclosure, if we were to push a disclosure 4
program and said, okay, at sale, or you know, 5
even voluntary or mandatory, but assuming some 6
coverage, some significant coverage in the 7
marketplace of disclosure, for example, whether 8
in a public building at all, public buildings or 9
commercial, residential, whatever it is, you 10
could express that, the impact of that in terms 11
of equipment already; like if we were to just 12
sort of make a logic model and said, okay, if we 13
do this disclosure, then we anticipate 14
penetration of X measure would go from 10 15
percent to 40 percent, something like that, that 16
is expressible in the model today, right? 17
MR. KNEIPE: It is. That's built in. 18
COMMISSIONER MCALLISTER: Okay, so I 19
guess, you know, I would just make the 20
observation that I think this is a rich field 21
for research and certainly in 758 where we're 22
looking at how to make -- how to get better 23
data, make it more available to more folks, and 24
sort of get the community more broadly, whether 25

96
CALIFORNIA REPORTING, LLC 52 Longwood Drive, San Rafael, California 94901 (415) 457-4417
energy efficiency, environment, local 1
government, whatever it is, kind of engage in 2
figuring out those market dynamics that you 3
referred to, and then hopefully bringing that 4
back into the tools that we have at our disposal 5
to actually do the forecasts and the efficiency 6
forecasts in the future, I just think that the 7
time is completely ripe for doing that. And 8
that we sort of -- if we limit ourselves in 9
terms of what we can express in the model, then 10
we sort of -- you know, the tail ends up kind of 11
wagging the dog in terms of what we think is 12
going to happen in the marketplace, it sort of 13
limits our options and maybe our creativity, 14
even, our program design. 15
So I think -- well, so I just want to 16
kind of get that on the table and say, you know, 17
in a way it's a challenge to Chris's team, you 18
know, it's make your models more detailed, but 19
really it's a challenge to all of us to kind of 20
get on the -- put our thinking caps on and sort 21
of figure out how we can better understand the 22
marketplace because, as you said, people are 23
doing things that don't seem purely economically 24
rational -- I think that's wonderful, I think 25

97
CALIFORNIA REPORTING, LLC 52 Longwood Drive, San Rafael, California 94901 (415) 457-4417
that people -- we want everybody to retrofit 1
their homes and go out there and buy the LEDs 2
whether or not -- for whatever reason they have, 3
you know, and certainly with cost-effectiveness 4
being a strong driver, but not for everybody, 5
and it's not the whole equation for almost 6
anybody, I would say. So I really am excited 7
about the opportunity, the possibilities here 8
going forward, and I think in fact we have to 9
make this happen much more broadly if we're 10
going to meet the aggressive goals that we have, 11
you know, in 2030, 2035, 2050. 12
So, anyway, I know we will be having a 13
lot of conversations along these lines, 14
certainly with 758, you know, your input with 15
you launching a model to kind of come up with a 16
bottom up estimate of what the potential is for 17
different initiatives within 758, matching that 18
up with the goals and sort of seeing what the 19
gap is, the market transformation, or the market 20
acceleration kind of activities, or what's going 21
to fill that gap. And so I think really we need 22
to look at this from all perspectives and figure 23
out where we can do better. So thanks for all 24
your work on this. 25

98
CALIFORNIA REPORTING, LLC 52 Longwood Drive, San Rafael, California 94901 (415) 457-4417
MR. KNEIPE: Thank you. I should mention 1
that in 2014 we'll be updating the model to 2
account for the MMV findings from the '10-'12 3
programs, and there's a lot of data in there on 4
financing and on whole building activity, and on 5
a range of emerging technologies that are going 6
to, I think, change the Mid case probably by the 7
end of 2014. 8
CHAIRMAN WEISENMILLER: So I have some 9
questions, too, while you're there. One is, 10
when you look at existing buildings, and I would 11
note the Scoping Plan which is coming out today 12
as a pretty high priority on existing buildings, 13
do you have statistics on rented gross space in 14
residential and commercial, what the split is? 15
MR. KNEIPE: We do have that data, though 16
we didn't look at it from a split incentive 17
standpoint exactly -- 18
CHAIRMAN WEISENMILLER: Yeah, because my 19
presumption is that that's a very very tough 20
market to hit, is rented space, both in 21
residential and commercial. And I keep hoping 22
in multi-family, I keep hoping this part of 758 23
we find a silver bullet, although again I'd be 24
concerned somewhat if we were ignoring that, the 25
99
CALIFORNIA REPORTING, LLC 52 Longwood Drive, San Rafael, California 94901 (415) 457-4417
split incentives in these studies. 1
MR. KNEIPE: You're concerned that we may 2
be overstating it because we're not discounting 3
the rental -- the mixed market for that? 4
CHAIRMAN WEISENMILLER: Yeah. 5
MR. KNEIPE: Yeah, that's a valid 6
concern. 7
COMMISSIONER MCALLISTER: Well, and also, 8
you know, if we determine that, say, in 9
multifamily rented space, certainly the lower 10
income sort of certain communities in the state 11
that really it's not going to happen unless it 12
gets paid for by somebody else, and so if we 13
think achieving the policy goals requires us to 14
scale up direct install programs, and we can 15
parse that out by income, geography, whatever, 16
but if we do the calculation and we say, okay, 17
we've got a direct install on X number of 18
millions of units, that's going to be a fair 19
amount of money it's going to require -- 20
CHAIRMAN WEISENMILLER: Yeah, I mean, 21
again, I think looking at the low income, the 22
EJ, you know, there's a bunch of reasons why 23
even if it costs a lot of money, I'm saying we 24
just do it -- 25
100
CALIFORNIA REPORTING, LLC 52 Longwood Drive, San Rafael, California 94901 (415) 457-4417
COMMISSIONER MCALLISTER: Oh, absolutely. 1
CHAIRMAN WEISENMILLER: -- but I want to 2
make sure that we have a pretty good idea of 3
what we may have to do there. So again, it 4
would be good to understand how much going 5
forward, where we need to have special programs 6
to deal with the special needs of rental space 7
and that's going to be very important. 8
The other sort of challenge from my 9
perspective, do either of you have a sense of 10
how much uncertainty is introduced by the 11
antiquated load surveys? Or do we want to 12
describe the fact that we're sort of running 13
more and more on older and older data? 14
MR. KNEIPE: Well, I think it varies by 15
sector. The residential sort of baseline data 16
we have from those most recent saturation 17
surveys is 2009, so it's not that bad because 18
the market doesn't change that quick. We've 19
been able to account for changes by looking at 20
program records and set time. The commercial 21
market, which is much more complex, as you know, 22
is much older, and I think that there's 23
significant uncertainty in that. I think the 24
most uncertain sector is probably the industrial 25

101
CALIFORNIA REPORTING, LLC 52 Longwood Drive, San Rafael, California 94901 (415) 457-4417
sector where there hasn't been a solid look at, 1
say, just standard motor efficiencies in that 2
sector for 15 years, I believe. So that sector, 3
in particular, is lacking from any sort of 4
primary research that is anything less than 10 5
years old. 6
CHAIRMAN WEISENMILLER: I know, that's 7
very hard. I do notice that the commercial is 8
where a lot of this potential savings are, so, 9
again, I think certainly we believe that's a 10
very high priority on getting that survey 11
updated. 12
COMMISSIONER MCALLISTER: Yeah, we're 13
putting in definitely a recommendation in the 14
IEPR to update the CEUS and that needs 15
resources, but just to be clear, I think if we 16
think that the direct installs are necessary, 17
we've got to go out there and make the case, and 18
we've got to call a spade a spade and go out 19
there and shake the resources out so we can -- 20
if we're going to take our goals seriously, 21
we've got to get that done. 22
CHAIRMAN WEISENMILLER: Yeah. Again, to 23
the extent we're trying to make the policy case 24
for direct install, is the more we can have that 25
102
CALIFORNIA REPORTING, LLC 52 Longwood Drive, San Rafael, California 94901 (415) 457-4417
very explicit and not just swept under the rug, 1
is it's going to happen the better. 2
I guess the other question I'm trying to 3
understand is that there's a sort of 4
progression; when we do research, we come up 5
with new technologies, they move out through the 6
utility incentive programs into the field, and 7
then eventually they're moved into our 8
standards. And so the question is, as we go 9
forward longer and longer, I mean, God, you're 10
talking 2022 Standards, how are we dealing with 11
potential double-counting? 12
MR. KNEIPE: Well, that's a difficult 13
question. I think what happens is we use -- it 14
depends sort of on the timing of when the stock 15
is turning over what's the existing baseline and 16
what's the new code, so you may have a current 17
code turning over in five or 10 years that's 18
going to be subject to some speculative code or 19
aspirational code that we're uncertain about. 20
But I mean, we're accounting for that. 21
Projecting code past what's currently on the 22
books, or a forecast in the next update, is -- 23
CHAIRMAN WEISENMILLER: No, it's hard, I 24
mean, I know we've struggled back and forth, we 25

103
CALIFORNIA REPORTING, LLC 52 Longwood Drive, San Rafael, California 94901 (415) 457-4417
have a target for Zero Net Energy, and so once 1
we hit that for residential, do we do anymore 2
codes, you know, you can certainly talk about 3
optimizing, but again, the further out you go, 4
you know, we have enough trouble trying to fit 5
what's going to be in the 2016, you know, 6
anyway, and how much of that is somehow embedded 7
in some of the other programs. 8
MR. KNEIPE: We are plagued by how to 9
treat the interplay between distributed 10
generation and energy efficiency, such as the 11
residential market. How do you value energy 12
efficiency in a home, or a home that has 13
significant DG installation? 14
CHAIRMAN WEISENMILLER: Yeah. No, and 15
certainly we're struggling with debates on how 16
much we push energy efficiency in the new 17
construction, or what's the interplay between 18
energy efficiency and DG in those facilities, 19
those structures. 20
COMMISSIONER MCALLISTER: I think I'll 21
have plenty of opportunities to talk to Floyd 22
going forward, so I don't need to ask all my 23
questions right now. And so we've hit the 24
Chair, so that's good. Thanks a lot. I guess, 25

104
CALIFORNIA REPORTING, LLC 52 Longwood Drive, San Rafael, California 94901 (415) 457-4417
thanks, Chris, for lots of good meaty stuff for 1
the next round of updates, and certainly in 758, 2
and to some expect Prop. 39. We're going to be 3
leaning on your resources, as well, so that's 4
good. 5
MR. KAVALEC: And thanks a lot to Floyd 6
and Navigant for helping us put these numbers 7
together. 8
MR. KNEIPE: Thank you. 9
COMMISSIONER MCALLISTER: So we're going 10
to go to public comment. 11
MS. RAITT: Right. So we'll go to public 12
comment for folks who need to leave before the 13
end of the day. 14
COMMISSIONER MCALLISTER: Do we have 15
anyone on the web that has raised their hand at 16
all? Just to sort of get a throughput check 17
here. Okay, so we only have one blue card right 18
now which -- oh, I think Sierra also wants to 19
make a comment, but I'll call Simon Baker from 20
the PUC. Go ahead. 21
MR. BAKER: Noon, Commissioner 22
McAllister, Chair Weisenmiller. Really pleased 23
to be here today and thanks to all of you and 24
your staffs for the hard work to prepare these 25

105
CALIFORNIA REPORTING, LLC 52 Longwood Drive, San Rafael, California 94901 (415) 457-4417
forecasts. I know it's a great amount of 1
effort. 2
My name is Simon Baker. I'm the Manager 3
of Demand Side Programs for the PUC's Energy 4
Division, and I'm here representing the Energy 5
Division today. 6
Our team has been collaborating really 7
closely through the Demand Analysis Working 8
Group and the Joint Agency Steering Committee to 9
develop these additional achievable energy 10
efficiency scenarios that have been presented 11
here today. And together with the ISO, we've 12
been working with the Energy Commission to 13
improve coordination related to the energy 14
efficiency in the Demand Forecast and its use in 15
procurement and transmission planning. This is 16
a part of our overall efforts to implement joint 17
commitments made in response to Senators Padilla 18
and Fuller's January 30th hearing on energy 19
efficiency. 20
And today we'd like to register a 21
request, and that request is that the CEC adopt 22
in the context of the IEPR proceeding a single 23
forecast that includes all reasonably expected 24
to occur additional achievable energy efficiency 25

106
CALIFORNIA REPORTING, LLC 52 Longwood Drive, San Rafael, California 94901 (415) 457-4417
to be used for procurement and transmission 1
planning purposes; and using the new lexicon 2
that was introduced here today, we're 3
essentially requesting that the CEC adopt an 4
adjusted forecast for procurement and 5
transmission planning purposes. 6
I also want to thank the Energy 7
Commission staff for working with us to include 8
certain demand response effects that had not 9
historically been included in the forecast as 10
committed effects, specifically we're talking 11
about the critical peak pricing program and the 12
peak time rebate program. And we're pleased 13
that the staff were willing to work with us on 14
that. So thank you very much for this 15
opportunity to be here today. 16
COMMISSIONER MCALLISTER: Thanks very 17
much, Simon. So any part of that you can put in 18
written comments and submit, that would be 19
great. And let's see, on the demand response, 20
the latter part of your comment, I totally agree 21
and actually feel like, you know, demand 22
response is one of these things whose time has 23
come and we need to characterize it more 24
carefully so that we can understand, again, the 25

107
CALIFORNIA REPORTING, LLC 52 Longwood Drive, San Rafael, California 94901 (415) 457-4417
market dynamics and sort of carry that forward 1
and get it into the forecast in ways that 2
reflect its long term potential, you know, as 3
understand it. So it's certainly another thing 4
for next year to implement the next step or two 5
further. 6
I guess I'll defer to the Chair on 7
process, but I certainly want to acknowledge 8
that the agencies are working together 9
incredibly tightly on a number of different 10
fronts and that's really critical that we 11
continue to do that. There's a lot of great 12
comments and reasons why we should be doing that 13
all around and also obviously sort of some 14
current reasons why we need to do that with 15
SONGs and other issues. Most notably is 16
Southern California kind of efforts that are 17
going forward. So I think certainly the 18
agencies need to come together and indicate what 19
forecast or what scenario is going to drive 20
them, but I don't necessarily think that the 21
IEPR itself, adoption, is the place for that, 22
but I'll defer to the Chair on that point. 23
CHAIRMAN WEISENMILLER: Yeah, well again, 24
certainly want to thank people for their 25
108
CALIFORNIA REPORTING, LLC 52 Longwood Drive, San Rafael, California 94901 (415) 457-4417
technical assistance. Certainly going forward, 1
we'll struggle with these issues and make a 2
decision. So thanks and certainly looking 3
forward to next year doing better. 4
MR. BAKER: Okay, thank you. 5
COMMISSIONER MCALLISTER: So, Sierra, go 6
ahead. 7
MS. MARTINEZ: Is this on? Hi, my name 8
is Sierra Martinez. I'm the Legal Director at 9
California Energy Projects at NRDC. I want to 10
first of all thank the staff and the Commission 11
today for all the work that's gone into this 12
forecast; I know it's a tremendous amount of 13
effort. 14
Two comments today, one on process and 15
one on content. The first on process: NRDC 16
appreciates all the work that the joint energy 17
agencies are conducting to try and come up with 18
a joint forecast, however, today we have not 19
seen the results of a single agreed upon joint 20
forecast that includes all future energy 21
efficiency. 22
At the January hearing that Simon Baker 23
mentioned, the joint agencies committed to 24
coming up with a single forecast to include all 25

109
CALIFORNIA REPORTING, LLC 52 Longwood Drive, San Rafael, California 94901 (415) 457-4417
that future efficiency. Today, we saw a 1
baseline forecast presented, an adjusted 2
forecast presented, as well as discussions of a 3
managed forecast. We would strongly recommend 4
that all the energy agencies come together to 5
decide upon a single forecast. 6
My concern here is that, by the time the 7
joint agencies do come to agreement, there will 8
be limited time for meaningful stakeholder 9
feedback on that particular forecast. There 10
were five scenarios presented today, previously 11
there were informal comments on seven scenarios, 12
but a single forecast is essential for 13
meaningful stakeholder contribution. 14
On the content of energy efficiency, NRDC 15
recommends that the Mid case, additional 16
achievable energy efficiency, gets adopted in 17
the IEPR process. As we heard from Navigant 18
today, this is a conservative estimate of future 19
energy efficiency. Within a potential study 20
process, emerging technologies were de-rated due 21
to a risk adjustment factor, only a subset of 22
all emerging technologies were studied. These 23
emerging technologies include far off in the 24
horizon technologies such as LED technology. It 25

110
CALIFORNIA REPORTING, LLC 52 Longwood Drive, San Rafael, California 94901 (415) 457-4417
is overall a conservative approach to what 1
future efficiency includes. 2
A second point on the content is that, on 3
POU energy efficiency, it's critical that this 4
Commission include the work that the POUs have 5
done to forecast their efficiency over the next 6
10 years. The Energy Commission does great work 7
with the POUs to develop this process, and the 8
POUs have worked hard. It's essential to 9
include those additional 10 years of energy 10
efficiency. Thank you for considering our 11
comments. 12
COMMISSIONER MCALLISTER: Thanks, Sierra. 13
CHAIRMAN WEISENMILLER: Yeah, thanks. 14
COMMISSIONER MCALLISTER: I'm assuming 15
you'll file written comments, as well, on these 16
points, yeah, they'll be useful. Thanks. 17
MS. RAITT: And that's it. I this we can 18
break for lunch, coming back at 1:45? 19
CHAIRMAN WEISENMILLER: Yes. We'll be 20
back in an hour. 21
(Break at 12:45 p.m.) 22
(Reconvene at 1:51 p.m.) 23
CHAIRMAN WEISENMILLER: Commissioner 24
McAllister has pulled away, so hopefully he'll 25

111
CALIFORNIA REPORTING, LLC 52 Longwood Drive, San Rafael, California 94901 (415) 457-4417
be back before the end of the day, but let's 1
start. 2
MS. RAITT: Great. Our first speaker is 3
Asish Gautam. 4
MR. GAUTAM: Good afternoon, everyone. 5
My name is Asish Gautam and I'll be going over 6
the Customer-side Distributed Generation Impacts 7
for this revised forecast. 8
First, I want to go over the different 9
sources of data we use to track DG activity in 10
the state. The first is our CEC 1304 Power 11
Plant Data. Here, we're capturing data from 12
large cogen plants and Industrial/Mining 13
sectors. 14
The next source is the Emerging 15
Renewables Program. This program is being 16
managed by the CEC, but it's phased out now, but 17
there was quite a bit of PV installations under 18
this program, so we're still tracking that. 19
The next program is the SGIP Program 20
here, it used to fund PV for the non-residential 21
sectors, and also cogen, so we're still tracking 22
that. And this program has undergone a lot of 23
changes and it used to be that for a couple 24
years the cogen was not really funded, but now 25
112
CALIFORNIA REPORTING, LLC 52 Longwood Drive, San Rafael, California 94901 (415) 457-4417
cogen is back into play. 1
The next source is the California Solar 2
Initiative here, this is a the big PV program 3
that funds retrofit for residential and retrofit 4
on new construction in the nonresidential. 5
The next source is the New Solar Homes 6
Partnership managed by the CEC. We also get a 7
lot of PV data from POUs that report annually to 8
us, so we also take that into account. 9
The new program that we just started 10
tracking a few years back was the Solar Thermal 11
Program for the PUC, this is for the solar hot 12
water installations. 13
We also rely a lot on the CSI, and that's 14
should be in the PV reports, basically the 15
program database gives us installation by county 16
and we use the evaluation reports to translate 17
capacity into energy and peak impacts. Other 18
sources include PV cost projections from EIA. 19
We also have taken some analysis on CHP, which 20
was done by ICF about a year or two ago. 21
Some of the updates for the revised 22
forecasts, we've updated our Program Data. We 23
have revised electric and gas prices, revised 24
housing stock and floor space. We also took 25

113
CALIFORNIA REPORTING, LLC 52 Longwood Drive, San Rafael, California 94901 (415) 457-4417
comments from the preliminary forecasts to limit 1
residential PV adoption to owner occupied 2
dwellings, and we used our RAS server data to 3
estimate how many homes were owner occupied 4
versus rentals. 5
One thing for this revised forecast is 6
using a predictive model for the commercial site 7
to PV instead of a trend analysis like we did in 8
the preliminary forecast. 9
The structure for the residential and 10
commercial sector PV and solar hot water is 11
based on payback periods, so we use payback as 12
an input into a logistic diffusion model to 13
estimate market penetration and apply that to 14
housing stock, or commercial floor space to 15
estimate new adoption. Results for the forecast 16
differs by demand scenario because it differs in 17
fuel prices, housing stock. We use a CSI 18
dataset and EIA's forecast for estimating PV 19
prices, solar hot water cost comes from a PUC 20
study. We use our residential sector models to 21
estimate PV sizing and use that to estimate 22
what's used onsite versus exported to the grid. 23
And exports are valid at the net surplus 24
compensation that was published a few years 25
114
CALIFORNIA REPORTING, LLC 52 Longwood Drive, San Rafael, California 94901 (415) 457-4417
back. 1
For the commercial sector, we look at 2
meeting onsite demand for power and for CHP do 3
thermal end uses as hot water and space heating 4
to facilitate the analysis for the commercial 5
sector relying on CEUS server data. Here we 6
have profiles from 2,900 sites representing 12 7
building types and about four usage sites 8
categories. 9
We take our CEUS profiles and benchmark 10
it to our QFER sales data and also calibrate it 11
through our commercial sector end use model 12
efforts, and also grow these profiles to make an 13
adjustment for the floor space growth. One of 14
the tools we receive from the CEUS surveys is 15
our DrCEUS energy modeling tool, and this is 16
used to create the load shapes to facilitate the 17
CHP thermal assessment. 18
One of the neat things that we did 19
differently in the commercial that is different 20
from the residential is that we tried to use 21
natural retail electric and gas tariffs because 22
of the need to account for energy and demand 23
charges separately. 24
CHP technology details come from the SGIP 25

115
CALIFORNIA REPORTING, LLC 52 Longwood Drive, San Rafael, California 94901 (415) 457-4417
incentive program data, and also an earlier 1
study that was done by ICF for the CEC. For the 2
commercial model, we also rely -- we use the 3
same data for residential sector model where we 4
use the CSI data and the EIA projections for PV 5
cost. 6
Next, we use the DrCEUS generator load 7
shapes. These have impacts such as generation 8
on onsite use, export, and grid purchase. 9
We account for any existing CSI in SGIP 10
incentives and tax credits for installing PV and 11
CHP, and at least in the commercial model the 12
payback assessment and adoption modeling happens 13
the same as in the residential model. 14
I'm going to go over the statewide 15
results, the results for the individual Planning 16
Area will be given in the Planning Area results 17
presentation later this afternoon. 18
First is the non-PV Energy Impact. Our 19
starting point for 2012 was 12,500 gigawatts of 20
generation onsite use, growing to between 14,400 21
and 14,500 gigawatt hours by 2024, implying a 22
growth rate of about 1.2 to 1.3 percent. The 23
scenario results are very close to one another 24
because of offsetting effects. In the high 25

116
CALIFORNIA REPORTING, LLC 52 Longwood Drive, San Rafael, California 94901 (415) 457-4417
demand scenario, we have low electricity prices 1
and low gas prices for the cogen, but the floor 2
space is higher, so we have more buildings, but 3
in the Low Demand Case we have high electric 4
rates and high cogen, natural gas price for the 5
cogen unit, but the floor space is lower, so 6
they kind of tend to balance each other out, so 7
the scenario is sort of much more closer 8
together. 9
Next is the non-PV peak impact. Our 10
estimate for 2012 was just under 1,900 megawatts 11
and we estimated that by 2024 we would get just 12
under 2,100 megawatts and 2,144 megawatts, 13
implying a 1.1 to 1.2 growth rate. Most of the 14
growth happens in the commercial sector. 15
Next is the PV energy impact. Here, all 16
three scenarios are above the 2011 forecast. 17
The 2012 impact was estimated at 2,200 gigawatt 18
hours and we estimated that, by 2024, the impact 19
would be about 7,200 to just under 10,000 20
gigawatt hours, implying a growth rate of 10.5 21
to 13.5 percent. Here, unlike the CHP, the bill 22
savings effect dominates, so there's more 23
separation between the scenarios. 24
Next, we have the PV Peak Impact. Our 25

117
CALIFORNIA REPORTING, LLC 52 Longwood Drive, San Rafael, California 94901 (415) 457-4417
2012 impact was just under 700 megawatts and 1
growing to between 2,026 megawatts, again, 2
pretty high growth rate of between nine and 11.5 3
percent. For the PV, we estimated that by 2024, 4
there's still capacity to be about 4,400 5
megawatts in the high demand, to about 5,700 6
megawatts in the low energy demand scenario, and 7
we see that all three scenarios will meet the 8
CSI 3,000 megawatt goal by 2017. 9
Some of the key uncertainties in the 10
forecast. I think just within the last two 11
weeks with the passage of AB 327 and the just 12
released E3 study on the net engineering, these 13
are some key uncertainties because they can 14
really change project economics and that would 15
have an influence on future adoption. There's 16
also some retaking of retail electric design, 17
which would have an impact depending on how 18
residential tariffs are redesigned, or there's 19
flattening of the tiers, or in the commercial 20
sector a shift from, say, energy only to energy 21
and demand charges. There's also the impact of 22
the Federal Tax Credit dropping from 30 percent 23
to 10 percent. 24
For CHP, some of the uncertainties are 25

118
CALIFORNIA REPORTING, LLC 52 Longwood Drive, San Rafael, California 94901 (415) 457-4417
around the interconnection procedures and 1
standby and departing load charges, so these are 2
still around. 3
As far as our next steps, we still have 4
our ongoing data updates and one of the things 5
that we're happy to see is that the PUC is 6
considering collecting the CSI data from the 7
utility interconnection procedure, so we rely a 8
lot on that database and it's good to see that, 9
at least the PUC is looking into continuing 10
collecting this data. 11
One of the things we would like to do is 12
revise our residential sector model to 13
incorporate the retail electric rates. We were 14
hoping to do that in time for the revised 15
forecast, but we were unable to because of the 16
time constraints. 17
One of the other things we would like to 18
do is to focus on CHP in the Industrial/Mining 19
category sectors. That's it for me, so I'll 20
take any questions. 21
CHAIRMAN WEISENMILLER: Do you have any 22
sense of the uncertainty associated with the -- 23
in terms of translating it back into megawatts 24
or gigawatt hours, the net energy metering 25

119
CALIFORNIA REPORTING, LLC 52 Longwood Drive, San Rafael, California 94901 (415) 457-4417
redesign, or the rate redesign? 1
MR. GAUTAM: In terms of how it would 2
influence project economics? 3
CHAIRMAN WEISENMILLER: Yeah. 4
MR. GAUTAM: We were able to account for 5
that in the commercial sector because we are 6
using actual retail rates and we have load 7
shapes to estimate the monthly carryover. 8
CHAIRMAN WEISENMILLER: Right. 9
MR. GAUTAM: But one of the things from 10
our CEUS data is it was noticed that the net 11
benefits are not as significant, and so we want 12
to look at why that is the case. We think it's 13
mainly to do with how the CEUS was conducted and 14
the type of sites that may have participated in 15
there. 16
CHAIRMAN WEISENMILLER: Uh-huh. 17
MR. GAUTAM: As far as the residential 18
sector, one of the things that we have talked 19
with -- E3 was hired by PUC to do the CSI 20
evaluation, so they have a lot of production 21
profiles that we would like to incorporate and 22
account for the net metering impacts. But right 23
now our residential model is on an annual basis, 24
so we can't really account for any kind of 25

120
CALIFORNIA REPORTING, LLC 52 Longwood Drive, San Rafael, California 94901 (415) 457-4417
changes to the net metering. 1
CHAIRMAN WEISENMILLER: Right. Okay, 2
thank you. 3
MS. RAITT: Okay, thanks. Our next 4
speaker is going to be Tim Olson to discuss the 5
Electric Vehicle Forecast. 6
MR. OLSON: Okay, thank you, Mr. Chairman 7
and staff and attendees at this meeting. I'm 8
going to go through quickly what we're 9
projecting in our Electric Vehicle -- 10
Preliminary Electric Vehicle Demand Forecast, 11
and I'm going to walk through some comparisons 12
to the ZEV Mandate and ZEV Executive Order. And 13
what we're not covering today is anything on 14
natural gas vehicles or any of the other 15
alternatives. A lot of that was covered in 16
previous workshops. I'm going to touch on a 17
some baseline information, information that was 18
presented previously, just for a little bit of 19
context to refresh our memory. 20
So this information presented today has 21
been conducted in a kind of broader framework 22
with other demand -- transportation demand 23
analysis. And because we're focusing on 24
Electric Vehicles, we're going to kind of focus 25
121
CALIFORNIA REPORTING, LLC 52 Longwood Drive, San Rafael, California 94901 (415) 457-4417
our discussion around Electric Vehicles are 1
primarily a light-duty, light truck type of 2
technology, we're going to focus on the forecast 3
efforts, the process we went through on the 4
forecast related to light-duty vehicles, or 5
passenger vehicles and light trucks. 6
And that process was a consumer choice 7
survey, 3,500 households responded and several 8
hundred commercial businesses, to address things 9
on kind of how their behavior -- what their 10
expected kind of key things that would convince 11
them to buy a vehicle, or to change out a 12
vehicle. And we took that information which was 13
a snapshot in time for 2013, and we also kind of 14
took another -- added another analytical element 15
to that, and that's what we call the Vehicle 16
Attributes Analysis. So in this case, we have 17
information and hired consultants, Sierra 18
Research and the group of consultants who 19
basically tried to explain what the changes in 20
vehicle technology are going to be over time. 21
In our case, we were looking at the 2050 22
horizon, the further you get to 2050, the less 23
accurate that projection may be in terms of 24
technology change and other attributes that 25

122
CALIFORNIA REPORTING, LLC 52 Longwood Drive, San Rafael, California 94901 (415) 457-4417
we're expecting to kind of measure in this 1
process. 2
And this slide here kind of indicates the 3
key factors that go into that vehicle attribute, 4
that last bullet. Passenger vehicle dominated 5
by fuel cost purchase, the vehicle price. And 6
these other items listed here are also factors 7
and they were considered in this kind of how do 8
we project changes over time. 9
I want to also highlight the part of the 10
vehicle survey, these kind of attributes over 11
time, because we need to factor in the incentive 12
needed to offset the differential cost. But 13
right now -- I'll show you some more information 14
later that shows vehicle fuel cost, in this case 15
electricity on a cost per mile basis, cheaper 16
than for internal combustion engine counterpart. 17
But the vehicle costs are more expensive today; 18
we think that's going to change over time. 19
We add in previous testimony, information 20
from David Greene, Oak Ridge National Labs, 21
National Research Council, National Academy of 22
Sciences, present information showing that the 23
cost of these vehicles, particularly electric 24
and hydrogen, look like they're going to drop 25
123
CALIFORNIA REPORTING, LLC 52 Longwood Drive, San Rafael, California 94901 (415) 457-4417
over time and, in fact, the first time I've 1
heard this and after 2030 Electric Vehicles and 2
hydrogen fuel cell vehicles will be cheaper than 3
their counterpart ICE engine vehicles. After 4
2030, based on analysis, kind of projected 5
analysis, from light weighting of material and 6
components of all vehicles, but much more a 7
greater light weighting in the electric and 8
hydrogen. So that's a factor that we need more 9
information on, and you'll see why I'm referring 10
to this as preliminary, we need to go through 11
some other steps. 12
So just a little bit of context. We're 13
projecting that, overall, passenger vehicle 14
light trucks will grow from where we are today, 15
around 27 million, in a range of 41 to 49 16
million in 2050. A key factor there is 17
population growth. We're still in this growth 18
mode of net new people in California, I think 19
it's around 350,000 new people per year, net new 20
people, and that will taper off over time from 21
what demographers are saying. And then also 22
Gross State Product growth, these are key 23
factors in the likelihood of additional 24
passenger vehicles coming on to the marketplace. 25

124
CALIFORNIA REPORTING, LLC 52 Longwood Drive, San Rafael, California 94901 (415) 457-4417
I'm just going to touch on this, see if 1
you can read that. Baseline stock in 2012, as 2
you can see, these are the different categories 3
we look at and you can see that, for a couple of 4
these, particularly for mid-size and compact, 5
they dominate the total. But you can see kind 6
of a spattering of things throughout the 7
different vehicle classes. 8
This information was presented in a 9
previous workshop, and I just want to refresh 10
your memory about some of the other information 11
we have. 12
This slide here also kind of indicates 13
the technology introduction timeframes showing 14
gasoline, electric, and you can see from this 15
one here, I don't know if you can read that, but 16
multiple models noted here that PHEVs and EVs 17
show expansion in the next few years and there's 18
-- maybe you can project from this there are 19
certain timeframes for vehicles to get into the 20
marketplace in a mass market way. Just to give 21
you some background. 22
Other factor for the background here is 23
projected gasoline prices. This is based on 24
U.S. DOE and AEO in 2013 crude oil and refining 25
125
CALIFORNIA REPORTING, LLC 52 Longwood Drive, San Rafael, California 94901 (415) 457-4417
petroleum product forecast. We modified it for 1
California wholesale retain margins and what 2
we're showing here is both nominal and inflation 3
adjusted prices. These are on a dollars per 4
gallon basis, they reflect crude oil price as 5
the high, is in 2014 $120 a barrel, rising to 6
$286 a barrel, this is in inflation-adjusted 7
prices. Reference case here, $985 a barrel in 8
the 2014, $197 in 2050, and then the low case is 9
a decrease, $83 a barrel in 2014, dropping to 10
$74 in 2050. This is a factor also in how 11
Electric Vehicles are going to perform in terms 12
of market growth, not as significant as the cost 13
of the vehicle, but it's a factor of operational 14
cost and I'll show you another slide here 15
basically showing that it's a factor for 16
Electric Vehicles because they are 3.4 times 17
more efficient than gasoline ICE engine vehicles 18
and operating costs will become one of those 19
things to consider. 20
So Electric Vehicle Growth -- at least 21
for the near term, between now and 2025, 22
stimulated by some government policy, government 23
intervention, a very key factor and I've kind of 24
identified the two California efforts and one at 25
126
CALIFORNIA REPORTING, LLC 52 Longwood Drive, San Rafael, California 94901 (415) 457-4417
the Federal level. 1
The ZEV Mandate -- we'll have a speaker 2
after me, Anna Wong, who may make more comments 3
about the ZEV Mandate, but in essence you've got 4
two things here that show a growth rate. The 5
ZEV Mandate requires OEMs to offer vehicles for 6
sale in California by 2020 and 2025. We've 7
projected some growth rates with those 8
agreements or expected agreements to meet those 9
goals. 10
CAFE Standard Vehicle fuel economy, you 11
know, we're at a point where we're very soon to 12
be at 35.5 miles per gallon. That law also 13
requires automakers to meet a fleet average of 14
54.5 in 2025. And we're not sure that this was 15
completely factored in on our analysis, and this 16
is one area we're going to go back and look at. 17
Some of the information we were borrowing for 18
this kind of projection nationwide was the 19
National Academy of Science, and I'm not sure 20
that they've really covered that 54.5 mpg by 21
2025, completely. But why is that a factor? 22
Well, Electric Vehicles are 3.4 times more 23
efficient, it's a way of contributing to that 24
CAFE Standard, and we think that there will be 25

127
CALIFORNIA REPORTING, LLC 52 Longwood Drive, San Rafael, California 94901 (415) 457-4417
growth from CAFE in Electric Vehicles. 1
The Governor's Executive Order calls for 2
the State of California to make the 3
infrastructure ready for a million vehicles in 4
2020 and 1.5 million in 2025, reflecting 5
expected full implementation of the ZEV mandate, 6
and maybe a little more expansion from that. 7
What I don't have on here is the other 8
government support in the form of grants and 9
rebates, grants for infrastructure in the early 10
years, and rebates for Electric Vehicles that 11
Energy Commission and ARB jointly implement. So 12
that's another factor in the kind of what's on 13
the record. 14
This slide reflects the ARB's future 15
vision to achieve greenhouse gas emission 16
reductions of 80 percent below 1990 levels in 17
2050, and actually there were several scenarios 18
developed for this, this is one that indicates 19
maybe the optimum way to meet that greenhouse 20
gas goal in 2050 is a mix of several zero 21
emission vehicle options. And so you can't 22
ignore this kind of directive from the AB 32 and 23
our expectation that transportation contributes 24
38 percent of its fair share, percent of the 25

128
CALIFORNIA REPORTING, LLC 52 Longwood Drive, San Rafael, California 94901 (415) 457-4417
emissions and greenhouse gas emissions are from 1
transportation, so we're expecting that to be 2
the contributor for the transportation sector, 3
and we think that the way to do that in the long 4
term is really the Zero Emission Vehicles, of 5
which Electric Vehicles are a significant part 6
of it. 7
This information listed here also, this 8
graph also, reflects some work done by David 9
Greene of Oak Ridge National Lab, I mentioned 10
earlier, in conjunction with the National 11
Academy of Science and National Research 12
Council, where they were basically saying that 13
to reach that 2050 goal outlined here, some 14
changes would -- some technology changes would 15
occur and that's primarily a light weighting of 16
the vehicle and components that are more 17
extensive than with internal combustion engine 18
vehicles. 19
And the ZEV expectation, I'm going to 20
kind of defer to the ARB staff on this coming up 21
after the meeting. In essence, it's showing 22
that in 2025, over 15 percent of the new 23
vehicles sold in that year will be the ZEVs, a 24
mixture of things, and as some of you may know, 25

129
CALIFORNIA REPORTING, LLC 52 Longwood Drive, San Rafael, California 94901 (415) 457-4417
with the Zero Emission Vehicle Mandate, it's 1
kind of a flexible thing where automakers can 2
have a different mix of fuel cell vehicles, 3
plug-in electric, and battery electric to meet 4
that goal. And so I'm going to let ARB staff 5
kind of elaborate on this. 6
Now, some of our initial projections on 7
this case, compact vehicle prices, show a 8
downward trend. This is something that we would 9
like to revisit in our discussions with our 10
contractor, and also with ARB staff because, 11
just within the last week, a new survey of 12
automakers has been completed and we're not 13
reflecting that in this analysis. We think that 14
a key topic in that survey was the cost of the 15
vehicle, and we may have some new information 16
we'd like to factor in. But also, I'm not sure 17
-- what I'd really like to do is compare this to 18
David Greene's study showing the pretty 19
significant drop in vehicle price by 2030 for 20
the Fuel Cell Vehicles and Electric Vehicles, 21
and probably revisit this kind of conclusion 22
here. 23
One of the factors I mentioned earlier 24
was the fuel price as a reflecting operating 25

130
CALIFORNIA REPORTING, LLC 52 Longwood Drive, San Rafael, California 94901 (415) 457-4417
cost for electric, in this case Electric 1
Vehicles. And we've got this displayed two 2
ways, retail basis comparing all these options 3
in a common unit, gasoline gallons equivalent. 4
You can see that, in this case, electricity is 5
fairly high on this, it's the highest source 6
here. But when you factor in the efficiency of 7
the vehicle on the right-hand side, cost per 8
mile basis, electricity is the cheapest option 9
compared to these other -- and this is for the 10
reference case, it's very similar in other 11
cases, the high and low -- actually, not so much 12
on low, it's also similar on the high. So we're 13
looking at this factor as a contributor to 14
Electric Vehicle market penetration, too. 15
Some of our initial results on forecast 16
show that these are projected sales at each 17
year, that the results here were very close to 18
the ZEV Mandate projection at the high petroleum 19
price scenario, not so much on the reference 20
case here, and this is another factor we'd like 21
to revisit primarily because of information we 22
didn't reflect in these automaker surveys that 23
were just completed. But this is still in the 24
ballpark of the ZEV Mandate projection. 25

131
CALIFORNIA REPORTING, LLC 52 Longwood Drive, San Rafael, California 94901 (415) 457-4417
And this is a cumulative total for on-1
road Electric Vehicles and you can see it's also 2
-- the high case here, high scenario which would 3
be high petroleum cost, to achieve the -- I 4
think we end up achieving the 1.5 million one 5
year later than the Governor's Executive Order, 6
so 2026 is the date that that occurs in the high 7
case, much later in the medium and the low case. 8
So just to kind of sum up here, we are -- 9
these are our preliminary findings: we want to 10
revisit the vehicle costs, but we think that 11
getting more information, more data from 12
automakers, would be very helpful in this 13
process and we're expecting planning a 14
consulting meeting with ARB staff and probably 15
one-on-one interviews with automakers this fall. 16
So that's my presentation; any questions, 17
Mr. Chairman or anybody in the audience? 18
CHAIRMAN WEISENMILLER: Yeah. I guess, 19
Tim, just to make sure we're clear on the 20
record. So going from here, what do you see as 21
the major steps and the timing? 22
MR. OLSON: From here, the major steps 23
are some additional consultations with ARB staff 24
within the next couple weeks, followed by some 25

132
CALIFORNIA REPORTING, LLC 52 Longwood Drive, San Rafael, California 94901 (415) 457-4417
interviews that may take about six to 10 weeks 1
with not every automaker, but as many as we can 2
do. And then we will reflect that in some 3
additional analysis with our consultant. We'll 4
include our consultants in those meetings and, 5
of course, this means we're going to be getting 6
some confidential information, which we then 7
have to aggregate, and that's going to take some 8
time just to put that together. So I'd say 9
probably within 10 weeks we will have another 10
version of this. 11
CHAIRMAN WEISENMILLER: Okay, and in 12
terms of the major information you're trying to 13
pin down -- 14
MR. OLSON: Mostly vehicle cost and the 15
change of vehicle cost over time. 16
CHAIRMAN WEISENMILLER: Okay, and at this 17
stage how different is your forecast from what 18
we adopted last year? 19
MR. OLSON: From where we are now, I 20
think we're slightly under the ZEV Mandate case. 21
We had a high case that was almost four times 22
what everybody else was saying in 2011, so we 23
think that needs to be revisited. 24
CHAIRMAN WEISENMILLER: Obviously, part 25
133
CALIFORNIA REPORTING, LLC 52 Longwood Drive, San Rafael, California 94901 (415) 457-4417
of your challenge is splitting between fuel 1
cells and battery electric. 2
MR. OLSON: Right, and that -- the 3
preliminary discussions with ARB staff indicate 4
that there are going to be some changes with 5
hydrogen vehicles from those surveys, and we 6
need to know more about that in terms of numbers 7
on the road. 8
CHAIRMAN WEISENMILLER: Okay, and I guess 9
I'm just trying to understand relative to last 10
time whether you see fuel cells higher or lower 11
in terms of the split? 12
MR. OLSON: Well -- 13
CHAIRMAN WEISENMILLER: Realizing it's 14
all preliminary at this stage. 15
MR. OLSON: -- it looks like it may be 16
very close to what was proposed before, or 17
forecasted before, just a slower growth at the 18
front end on hydrogen, but it will pick up 19
later. And remember, let me go back to this one 20
slide, the real growth occurs after 2030, so we 21
want to make sure these programs and these 22
regulations are working in the early years to 23
get to the point between 2025-2030, when we see 24
the significant market launch and mass numbers, 25

134
CALIFORNIA REPORTING, LLC 52 Longwood Drive, San Rafael, California 94901 (415) 457-4417
particularly for the passenger vehicle. 1
CHAIRMAN WEISENMILLER: You know, as you 2
know, a lot of people are trying to compare the 3
hybrids, you know, where they were in their 4
trajectory versus where the battery electric is 5
at comparable times. 6
MR. OLSON: Right, yeah. So the Prius 7
business model is one that we look at, but there 8
are some others that are similar that could be 9
like a 10-year timeframe to get into the 10
significant mass production. And one other 11
factor I didn't put on here is turnover rates; 12
we've been looking at like 7.7 years, some are 13
saying maybe with the recession gone, that might 14
change, it might be a shorter timeframe on 15
turnover, and so those are things that we need 16
to revisit, too. 17
CHAIRMAN WEISENMILLER: Okay. But at 18
this point, you have the Academy study, you have 19
the ARB, and you have your analysis and somehow 20
we're trying to take the best of all worlds. 21
MR. OLSON: We like to take the best of 22
all worlds and show that those studies and the 23
kind of transparency of those projections side-24
by-side in some cases. 25

135
CALIFORNIA REPORTING, LLC 52 Longwood Drive, San Rafael, California 94901 (415) 457-4417
CHAIRMAN WEISENMILLER: Okay. 1
MR. OLSON: Any other questions? 2
MR. COLE: If you back up the slides when 3
you talked about the adoption -- 4
MS. RAITT: Could you state your name and 5
affiliation for the record? 6
MR. COLE: Oh, yeah, Sasha Cole, CPUC, 7
Energy Division. 8
MS. RAITT: Thank you. 9
MR. OLSON: Which slide? 10
MR. COLE: What you had is an earlier 11
slide where you tell the adoption you got 40 to 12
50 million -- keep going back -- okay. I'm 13
wondering why those lines are so linear. It 14
seems like you're either going to get a very 15
very low amount, in other words, the whole 16
system will crash out, or there will be some 17
kind of nonlinearity when you start to get 18
charging stations and all the externality -- I 19
mean, we see all these technology systems and 20
they just don't get adopted in this linear way 21
like this over time. 22
MR. OLSON: Well, remember, this is total 23
vehicles, all vehicles -- 24
CHAIRMAN WEISENMILLER: Yeah, this is 25
136
CALIFORNIA REPORTING, LLC 52 Longwood Drive, San Rafael, California 94901 (415) 457-4417
total vehicles, so that doesn't follow that 1
logistical curve. 2
MR. COLE: Okay, great. 3
CHAIRMAN WEISENMILLER: But you should -- 4
we're running behind, so I would encourage you 5
to follow-up with Tim afterwards and let's go on 6
to the ARB. 7
MR. OLSON: Okay, Anna Wong from the ARB 8
will join us and has comments. 9
MS. WONG: Okay. Well, I think Tim 10
covered it pretty much. And I can answer any 11
questions, but just to explain the regulation 12
compliance scenario a little bit more, it is 13
just a compliance scenario. Manufacturers have 14
a wide range of flexibility in meeting the 15
requirement, so we took our best guess as to 16
what we thought the vehicle mix would be, and 17
everybody took most of the flexibilities allowed 18
in meeting the requirement, and ran a scenario. 19
And that's how we came up with that 50.4 20
percent, but it's highly dependent dependant on 21
the number of vehicles sold in California every 22
year, and we base that on our MFAC numbers for 23
new vehicle sales, and that gets revised every 24
time we revise MFAC, so we are sure that they 25

137
CALIFORNIA REPORTING, LLC 52 Longwood Drive, San Rafael, California 94901 (415) 457-4417
will be complying, and so we came up with a 1
scenario in which they all comply in a way that 2
makes sense to us from what we've seen them 3
comply in the past. 4
So that would be my only note on the 5
compliance scenario, and I'm happy to take any 6
questions that you might have about anything 7
related to the regulation. 8
CHAIRMAN WEISENMILLER: Yeah, well again, 9
I think the major thing that would help us is, 10
to the extent the Air Board has forecasts, you 11
know, however you want to caveat those, if we 12
could have those in our record so that we can 13
sort of compare and contrast them -- 14
MS. WONG: Yeah. 15
CHAIRMAN WEISENMILLER: -- with what the 16
staff is doing at this stage that will help. 17
MS. WONG: Yeah. So again, what we have 18
adopted we have not changed, and so our 19
compliance scenario, we don't have better data 20
now that they're going to comply in a different 21
way. 22
CHAIRMAN WEISENMILLER: Okay -- 23
MS. WONG: So that's -- but you know, we 24
definitely could look more into the assumptions 25

138
CALIFORNIA REPORTING, LLC 52 Longwood Drive, San Rafael, California 94901 (415) 457-4417
with your staff and try to figure out of there 1
is maybe a way that makes more sense, but none 2
of our regulation numbers or requirements have 3
changed since we've adopted them in 2012. So it 4
hasn't -- we don't have a better forecast at 5
this point, and so we agree with the numbers 6
that they're using. 7
CHAIRMAN WEISENMILLER: Okay, and 8
certainly any insight you can give the staff on 9
sort of this -- obviously we try for a low, base 10
and high, so trying to figure out what the low 11
and high are would be good. 12
MS. WONG: Well, we would always like to 13
say that the regulation is the low case because 14
any over-compliance, as we've seen over many 15
years, manufacturers tend to over-comply because 16
they're always padding their future, they're 17
always making sure that they have enough to 18
comply in future years in case there's something 19
that goes wrong; most of these companies are 20
very conservative. 21
So we would say that the regulation sets 22
a lower bound and anything above it is expected, 23
but we don't know how much above it, it sort of 24
depends on how the market takes up the 25
139
CALIFORNIA REPORTING, LLC 52 Longwood Drive, San Rafael, California 94901 (415) 457-4417
technology. 1
CHAIRMAN WEISENMILLER: Okay. Thank you. 2
Yeah, as I said, I think the theory was we were 3
supposed to be where we are now at 1:45, it's 4
now 2:30, so I need to move folks along, but 5
certainly encourage you and Tim and everyone to 6
talk, but just to try to bring us a little bit 7
closer on schedule. 8
MS. RAITT: The next speaker is Nick 9
Fugate. Thanks. 10
MR. FUGATE: Good afternoon. My name is 11
Nick Fugate and I'm going to present the IOU 12
Planning Area forecast results. And I think the 13
way these presentations are set, I'm going to 14
cover the Planning Area results first, followed 15
by climate zone results if that's applicable to 16
that IOU, and then finish up with sort of what 17
we saw in Chris's presentation, the service 18
territory forecast adjusted with the additional 19
achievable energy efficiency scenarios. 20
So I'm going to start here with the SDG&E 21
Planning Area forecast, and after my 22
presentation, after each presentation I'll 23
invite the utility representatives to come up 24
and provide comments, as well. 25

140
CALIFORNIA REPORTING, LLC 52 Longwood Drive, San Rafael, California 94901 (415) 457-4417
Okay, we have our Baseline Consumption 1
Forecast for the SDG&E Planning Area. These 2
scenarios are higher than what we presented in 3
May, about 300 gigawatt hours in the Mid case. 4
And the case grows faster than the preliminary 5
forecast by about a tenth a percent, and that's 6
due in part to the drop in revised rate 7
projections, so the result is that the Mid 8
scenario growth rate is 1.52 percent annually, 9
reaching about 25,000 gigawatt hours by 2024. 10
Embedded in this forecast, we have 11
Electric Vehicles impacts which are increasing 12
consumption by roughly 1,200 gigawatt hours by 13
the end of the forecast period, and this revised 14
forecast features 12-19 gigawatt hours of 15
consumption due to anticipated Port 16
electrification which, as Chris mentioned, is 17
new to this forecast. Climate change also 18
accounts for an additional 190 to 300 gigawatt 19
hours in the Mid and High cases, respectively. 20
So peak demand growth is about 1.4 21
percent annually to reach just over 5,400 22
megawatt hours in the Mid case. Self-generation 23
is expected to contribute about 400 megawatts of 24
peak reduction in the Mid case, 250 megawatts of 25
141
CALIFORNIA REPORTING, LLC 52 Longwood Drive, San Rafael, California 94901 (415) 457-4417
that is due to PV systems. Electric Vehicles 1
contribute little to peak, only about 29 2
megawatts in the Low case and 73 in the High. 3
The combined impact from event-based 4
pricing programs and non-event-based demand 5
response programs reaches about 50 megawatts and 6
that, again, as Chris mentioned earlier, is a 7
new feature in this forecast, the price demand 8
response programs; and climate change impacts at 9
72-131 megawatts in the Mid and High scenarios. 10
Okay, so SDG&E only has the one climate 11
zone and so I'm moving straight into the 12
adjustments for the additional achievable energy 13
efficiency. And so this first slide shows our 14
Mid baseline scenario adjusted with the three 15
different levels of mid additional EE, the Low 16
Mid, the Mid, and the High Mid. So the 17
reference of the Mid baseline here grows at 18
about 1.2 percent a year over the forecast 19
period, and then when we add in the additional 20
achievable efficiency, which ranges from 1,389 21
gigawatt hours to 3,442 gigawatt hours, this 22
brings an annual growth rate down in these other 23
scenarios to .7 percent, .4 percent, and then 24
this low one here is actually negative at -.1 25
142
CALIFORNIA REPORTING, LLC 52 Longwood Drive, San Rafael, California 94901 (415) 457-4417
percent. 1
Okay, so here again we're looking at 2
service territory sales, but in this case rather 3
than adjusting the Mid by the three Mid 4
scenarios, we're adjusting each of our Low, Mid 5
and High baseline scenarios by -- or the Low, 6
Mid and High demand scenarios will be adjusted 7
by the High, Mid and Low additional achievable 8
efficiency. 9
So this Mid case, we actually saw that on 10
a previous slide, and that's the Mid paired with 11
the Mid, which grows at .4 percent annually, and 12
then the higher case here grows at 1.4 percent, 13
which is actually higher than our unadjusted Mid 14
baseline forecast, and the lower case declines 15
at a rate of -.9 percent. 16
Here's our adjusted service territory 17
peak. Again, this is the Mid scenario adjusted 18
by the three Mid efficiency scenarios. The 19
unadjusted Baseline growth here for reference is 20
1.36 percent annual growth and, after the 21
adjustments, the growth rates are .75 percent, 22
.43 percent, and -.16 in the lowest case. 23
And here again our low paired with the 24
high EE and high demand paired with the low EE. 25

143
CALIFORNIA REPORTING, LLC 52 Longwood Drive, San Rafael, California 94901 (415) 457-4417
The high case here is growing at 1.4 percent and 1
the low case is -1.0 percent. And that's 2
actually all the slides I have for San Diego. 3
So I'll defer to the Chair if you have any 4
comments before we invite San Diego up. 5
CHAIRMAN WEISENMILLER: Let's invite San 6
Diego up. 7
MR. VONDER: Tim Vonder, SDG&E. We will 8
probably file written comments. We have a lot 9
to review yet, there's a lot of detail and staff 10
has done quite a bit of work in revising their 11
forecast, so I'd like to commend staff and their 12
effort. You can see the presentations so far 13
today by Chris and company that quite a lot has 14
been looked into in revising the forecast, and 15
Chris has turned over quite a few little rocks 16
and made a lot of improvements. And so we think 17
he's done a very good job in doing that. 18
Bottom line-wise, we're pretty much in 19
agreement with their revisions. We are looking 20
forward to seeing a change in Electric Vehicles, 21
I think everyone is looking forward to that, so 22
if it's quite possible to include another 23
revision before the December adoption date, that 24
would help a lot. Other than that, I'd like to 25

144
CALIFORNIA REPORTING, LLC 52 Longwood Drive, San Rafael, California 94901 (415) 457-4417
congratulate them on a job we believe is well 1
done and hopefully we can prepare some 2
constructive written comments. Thank you. 3
CHAIRMAN WEISENMILLER: Okay, thank you. 4
The one question I have is, do you have an EV 5
forecast for San Diego that you could also 6
submit in the record? 7
MR. VONDER: We don't have a new one yet. 8
CHAIRMAN WEISENMILLER: Okay. 9
MR. VONDER: We're working toward there 10
also. 11
CHAIRMAN WEISENMILLER: Okay. Will you 12
be before or after Tim? 13
MR. VONDER: I don't know. We'll see. 14
CHAIRMAN WEISENMILLER: Thank you. 15
MR. FUGATE: Thanks, Tim. Okay, moving 16
on to Southern California Edison. Here are our 17
Baseline Consumption Forecasts for the SCE 18
Planning Area. These scenarios are, again, 19
higher than what we presented in May by about 20
1,100 gigawatt hours in the Mid case. This 21
amounts to almost a tenth of a percent increase 22
in the growth rate over the preliminary and 23
again goes back to lower rates, but part of it 24
is also due to the new adder such as Port 25

145
CALIFORNIA REPORTING, LLC 52 Longwood Drive, San Rafael, California 94901 (415) 457-4417
electrification, which represents 60 to 92 1
gigawatt hours in the Edison territory, and also 2
the addition of high speed rail considerations, 3
which are expected to contribute another 61 4
gigawatt hours by the end of the forecast 5
period. 6
So all that combined gives us a Mid 7
baseline scenario that grows at 1.05 percent 8
annually to reach 113,802 gigawatt hours by 9
2024. Embedded in the consumption forecast are 10
impacts from electric vehicles which are 11
expected to increase consumption by nearly 2,000 12
gigawatt hours. And also, climate change 13
accounts for another 365 to 497 gigawatt hours 14
in the Mid and High cases. 15
So for peak demand, peak demand grows at 16
a rate of 1.4 percent annually, reaching 25,450 17
megawatts in the Mid case. Self-generation is 18
expected to contribute 1,500 megawatts of peak 19
reduction in the Mid case and about 700 of that 20
is due to PV. Electric Vehicles, again, don't 21
contribute very much relative to consumption, 22
about 48 megawatts in the Low case and 118 in 23
the High. And combined impacts from event-based 24
pricing programs and non-event-based programs 25

146
CALIFORNIA REPORTING, LLC 52 Longwood Drive, San Rafael, California 94901 (415) 457-4417
reach almost 50 megawatts. And climate change 1
impacts at 355 and 570 megawatts to the Mid and 2
High scenarios. 3
So for the Edison territory, we do 4
forecast by climate zone. And here's a map of 5
our climate zones colored by Planning Area; 6
Edison's is the yellow section and it's made up 7
of climate zones 7 and 10, those are the inland 8
zones, that's the Southern San Joaquin Valley 9
plus Riverside and San Bernardino Counties, and 10
then Climate Zones 8 and 9, which include Long 11
Beach, Orange County, Ventura County, and the 12
Inland LA Basin. 13
So the fastest growth in both consumption 14
and peak demand over the forecast period is 15
projected to be Inland, that's due to the 16
expectation that migration will continue from 17
coastal to inland areas. Growth in population 18
from 2013 to 2024 in the Mid case is projected 19
to be 28 and 19 percent, respectively, for 20
Climate Zones 7 and 10. And that's compared to 21
just five and nine percent for Climate Zones 8 22
and 9. 23
Inland climate zones also see higher peak 24
growth due in part to climate change 25
147
CALIFORNIA REPORTING, LLC 52 Longwood Drive, San Rafael, California 94901 (415) 457-4417
considerations, particularly potential climate 1
change impacts contribute to faster peak demand 2
growth in Climate Zone 7 in the Mid demand 3
scenario. In the Mid demand scenario, increases 4
in annual maximum temperature are highest in 5
this zone, in Zone 7. 6
Okay, so on to impacts from additional 7
achievable energy efficiency. And here we're 8
starting with the service territory sales 9
forecast for SCE, rather than a Planning Area. 10
Our adjusted Mid baseline scenario grows at 11
about .9 percent a year over the forecast 12
period, and then adding in the additional 13
achievable energy efficiency, which ranges from 14
5,750 gigawatt hours to 15,200 gigawatt hours, 15
this brings the annual growth rate down to .4 16
percent, .05 percent, and -.5 percent. 17
Okay, again, pairing low demand with high 18
energy efficiency and vice versa, we have the 19
High baseline scenario with the low EE growing 20
at .93 percent, which is about the same rate as 21
the unadjusted Mid baseline scenario, and then 22
the low baseline paired with the high energy 23
efficiency declines at a rate of -1.13 percent. 24
Okay, moving on to adjusted peak 25
148
CALIFORNIA REPORTING, LLC 52 Longwood Drive, San Rafael, California 94901 (415) 457-4417
scenarios, the unadjusted baseline here grows at 1
a rate of 1.23 percent, unadjusted Mid, and the 2
Additional Achievable Energy Efficiency (AAEE) 3
Mid adjustments then bring the growth down to 4
.67, .34, or -.27 percent. 5
And then combining Low with High, the 6
High case paired with Low EE grows at 1.2 7
percent annually, and the low case paired with 8
high energy efficiency grows at =1.06 percent. 9
And I've included in this presentation 10
just a couple of slides for Southern California 11
Gas. So just looking at the service territory 12
sales forecast adjusted with the Additional 13
Energy Efficiency, the result is that our 14
relatively flat baseline forecast becomes a 15
declining managed forecast growth in the 16
adjusted scenarios here are -.25, -.35, and -.42 17
percent. And then pairing the Low demand with 18
High Energy Efficiency gives us a growth of -.56 19
percent, whereas the higher case is actually not 20
going up much higher than the Mid at -.31 21
percent. 22
And so I would ask if -- well, maybe I'll 23
just invite Edison first to come up and give 24
comments. 25

149
CALIFORNIA REPORTING, LLC 52 Longwood Drive, San Rafael, California 94901 (415) 457-4417
COMMISSIONER MCALLISTER: Maybe we can go 1
ahead and kind of get going while they load 2
those up; we're a little bit short on time. 3
MS. SHENG: Sure. Hougyan Sheng from 4
Southern California Edison. I'd like to thank 5
the Commission for providing this opportunity 6
for us to comment. It's been a nice journey 7
working with Chris Kavalec and his forecasting 8
team to look into the forecasting issues. We 9
also had the opportunity to work with CAISO this 10
time, so it was quite a learning experience for 11
us, so we appreciate that. 12
I'd like to compliment the CEC 13
forecasting team in terms of being able to 14
incorporate the earlier feedback we expressed 15
with the earlier workshop. One great example 16
is, you know, the updated rate forecast that 17
gets incorporated in the revised forecast. I 18
think that's very encouraging to us that CEC is 19
looking more closely at the rate impact and 20
taking more consideration of the changes. 21
I'd also like to compliment the fact that 22
with the energy efficiency savings estimating 23
development, we were allowed to engage in the 24
process in terms of commenting on these 25
150
CALIFORNIA REPORTING, LLC 52 Longwood Drive, San Rafael, California 94901 (415) 457-4417
scenarios. I think SCE would like to see more 1
engagement from the stakeholders in the future 2
in terms of working with CEC to develop the 3
initial scenarios for later selection purposes. 4
And I think there are two areas we would 5
like to address hopefully before the final 6
forecast is generated. One other area is 7
electric load forecast updates, and we heard 8
from the team earlier that they're still working 9
diligently on updating the electrification load 10
forecast; we think that's a very important area, 11
as well as a significant source for the future 12
load growth. So SCE would certainly encourage 13
CEC to prioritize that and hopefully be able to 14
incorporate that in their final demand forecast. 15
But we would also like to point out that 16
SCE has commented earlier after the 17
Transportation Workshop that, from SCE's 18
perspective, there is quite some uncertainty in 19
terms of the future EV load growth. SCE would 20
like to see the CEC utilize a range forecast 21
potentially including CARB's ZEV forecast as a 22
Low bound forecast, and at the same time looking 23
at incorporating a higher case forecast, as we 24
think that would give us a more comprehensive 25

151
CALIFORNIA REPORTING, LLC 52 Longwood Drive, San Rafael, California 94901 (415) 457-4417
picture for the future. 1
And so the second area I would like to 2
highlight is we identified some issues in the 3
area of weather normalization after historical 4
load, which affects the forecasting period, 5
especially with the starting point for 2013 6
peak. We conducted some investigation with 7
support from Chris Kavalec and CAISO planners. 8
We had, you know, interesting findings I'll 9
share with everybody on the Web, but one thing 10
we recognize is, if you can go to the next 11
slide? As time elapsed, we realized that our 12
forecast period which starts from 2013 in the 13
initial forecast, because the weather 14
normalization impact, CEC's forecast for SCE 15
Planning Area peaked for 2013, actually shows 16
some slight decrease from 2012 peak to 2013; 17
now, because time elapsed, we actually observed 18
hopefully a summer peak for 2013 and the dashed 19
line shows that if we were to utilize the 20
updated 2013 peak number, the CEC's peak demand 21
baseline projection would actually come a lot 22
closer to SCE's view. So we definitely would 23
encourage CEC to make that into their final 24
forecast consideration by utilizing the latest 25

152
CALIFORNIA REPORTING, LLC 52 Longwood Drive, San Rafael, California 94901 (415) 457-4417
data observation. If you could go to the next? 1
So as I mentioned, CEC and CAISO actually 2
worked very collectively with SCE to investigate 3
the weather normalization issue. Through our 4
findings so far, I think we were able to see in 5
common that our use of weather stations, and 6
weights, and the way we calculate the peak 7
factor temperatures, it all may matter for how 8
we assess our peak day temperature conditions 9
and, as a result, our forecast could be impacted 10
as well. So SCE would like to recommend that 11
the CEC look in the future initiative to include 12
this initiative about getting all the 13
stakeholders engaging in the weather 14
normalization discussion and address the common 15
forecasting issues around it to create more 16
commonality among the different forecasting 17
practices. And I think SCE views that the 18
existing DAWG forum would be a great platform 19
for that to happen. That's SCE's comments. 20
COMMISSIONER MCALLISTER: Could I just 21
ask, how would that interact with the idea of 22
sort of one in 10 and if we're weather 23
normalizing, because I'm not quite clear on the 24
benefit that you see it, if we're already coming 25

153
CALIFORNIA REPORTING, LLC 52 Longwood Drive, San Rafael, California 94901 (415) 457-4417
at it from a one in 10 kind of perspective, you 1
know, sort of risk mitigation and that way, you 2
do get a better answer in some sense with 3
weather normalization, but I guess I'm wondering 4
what sort of practical impact you think that 5
might have on your planning, your investment, 6
things like that. 7
MS. SHENG: Yeah, as Chris mentioned in 8
part of his presentation, when we look at the 9
historical peaks, you know, we try to understand 10
under what weather conditions those peaks occur. 11
And depending on how we view the peak 12
temperature conditions, we may view the history 13
differently, and that will impact how we 14
forecast the future, whether we assume the 15
future is normal weather condition or is under 16
some extreme weather condition. 17
COMMISSIONER MCALLISTER: So I think I 18
understand what you're saying, but the weather 19
normalization -- like if you had a peak that was 20
a true peak, but was not driven by weather, then 21
that would tell you something; and vice versa, 22
if the weather drives it, then that also helps 23
you make decisions. 24
MS. SHENG: Yeah. If we had a really 25

154
CALIFORNIA REPORTING, LLC 52 Longwood Drive, San Rafael, California 94901 (415) 457-4417
mild day, however, we still reached a very high 1
system peak, that would be really affecting how 2
we would project the future peak load growth. 3
So in our view it's a common foundation for the 4
forecasting practice, how we reconcile the 5
history. 6
CHAIRMAN WEISENMILLER: Okay. I had a 7
couple of questions, one just following up on 8
that, what sort of weather year was this year, 9
assuming we had the October peak or something 10
dramatic? 11
MS. SHENG: We haven't done the complete 12
preliminary assessment. I think this year our 13
peak day condition was still below normal. 14
CHAIRMAN WEISENMILLER: Okay, so less 15
than one or two. 16
MS. SHENG: Right. 17
CHAIRMAN WEISENMILLER: Okay. Now, Nick, 18
could you go to slide 5 for a second? I'll ask 19
the same question of both of you. Slide 5 is 20
the one that shows consumption growth by climate 21
zone. 22
MR. FUGATE: Which forecast? 23
CHAIRMAN WEISENMILLER: For Edison. 24
MR. FUGATE: I'm looking at the wrong 25
155
CALIFORNIA REPORTING, LLC 52 Longwood Drive, San Rafael, California 94901 (415) 457-4417
territory here. 1
CHAIRMAN WEISENMILLER: Okay, so you're 2
seeing the highest growth occurs inland and from 3
time to time, I visit different chambers in the 4
Los Angeles area, and normally when I go inland, 5
the chambers are pretty devastated, so I'm 6
trying to understand in terms of where Edison's 7
projections of growth are, is it really still 8
inland? I mean, as I said, the economy seemed 9
to have been hammered inland, so do you see that 10
springing back? Or what is your projections of 11
where the growth is going to occur? 12
MS. SHENG: At this point, SCE is not 13
able to give a full assessment of the climate 14
zone level impact because we have not developed 15
a climate zone level analysis. We are seeing 16
some shift in terms of economic growth between 17
inland areas and closer areas, accounting to the 18
most recent UCLA Edison School Forecast Update. 19
There's, you know, the phenomena of east and 20
west division, so until we can do a full 21
assessment like CEC did in looking at climate 22
zone level forecast, it would be difficult for 23
us to come up with a complete assessment in 24
terms of whether we will see the energy 25
156
CALIFORNIA REPORTING, LLC 52 Longwood Drive, San Rafael, California 94901 (415) 457-4417
consumption pattern change due to the economic 1
growth pattern change in the future. 2
CHAIRMAN WEISENMILLER: Okay, well 3
certainly if you have anything on that, your 4
written comments would be good because, 5
obviously, to the extent we're seeing much more 6
of the growth inland, then that tends to be the 7
higher consumption areas, and as I say, 8
conversely, when you just drive around there and 9
meet with people, it seems like that inland is 10
where the economic recession has had the highest 11
impacts. 12
MS. SHENG: Right, right, definitely 13
economically-wise, yeah. 14
CHAIRMAN WEISENMILLER: Another question 15
I have is in terms of trying to understand, you 16
know, it's back to the weather normalization 17
issue, and one of the things we're trying to do 18
going forward is to really monitor what's going 19
on in the areas in the San Onofre footprint so 20
we could see how the preferred resources are 21
coming along and deal with contingency plans. 22
And so, as we do that, it's going to be very 23
important for us to figure out a way to 24
disaggregate that part of your service 25
157
CALIFORNIA REPORTING, LLC 52 Longwood Drive, San Rafael, California 94901 (415) 457-4417
territory, track what's going on, which could be 1
weather, so we're going to need to make sure 2
that we are weather normalizing; it could be the 3
economy; it could be more or less development 4
than expected of the preferred resources. So 5
it's going to be very important going forward 6
that we have a way of really tracking what's 7
going on in that disaggregated part, and it's 8
going to be a challenge to our staff, the ISO, 9
PUC, and certainly for Edison to help us on 10
that. 11
MS. SHENG: Yeah, I definitely agree. I 12
think looking at an even more granular level 13
like that, you know, one of the areas we need to 14
establish a more common perspective is the 15
weather, normalize the weather in the local 16
area. 17
CHAIRMAN WEISENMILLER: Right, because 18
we're certainly at least going to have to deal 19
with the weather, but we may also have to worry 20
about some of the economic growth, but frankly 21
if the economic growth is more or less than we 22
anticipate, you know, we'll still have to 23
respond to that in the supply and demand 24
balance, you know, one way or another. 25

158
CALIFORNIA REPORTING, LLC 52 Longwood Drive, San Rafael, California 94901 (415) 457-4417
I guess the last thing is just, obviously 1
we've looked at the Port electrification and the 2
other thing is sort of obviously to look on the 3
goods movement side, particularly in the Port 4
area to try to deal with electrifying the 5
transportation system. So, again, anything you 6
can do to help us on the EV forecast would be 7
terrific. 8
MS. SHENG: Sure. I think SCE had 9
already worked some effort in working closely 10
with the Transportation Study Group at CEC, so 11
we'd like to see that collaboration continue to 12
go on and hopefully be able to push the updated 13
forecasting to the final forecast that Chris is 14
going to put out later. 15
CHAIRMAN WEISENMILLER: Yeah. I'm 16
assuming Edison is really, well, we've heard 17
different things. I think a while back the 18
theory was SDG&E was really exposed to growth 19
happening in EV, but my impression is it's much 20
more Edison at this stage. 21
MS. SHENG: Yeah, definitely in the 22
recent years. 23
CHAIRMAN WEISENMILLER: Okay, thanks. 24
MS. SHENG: Thank you. 25
159
CALIFORNIA REPORTING, LLC 52 Longwood Drive, San Rafael, California 94901 (415) 457-4417
COMMISSIONER MCALLISTER: I wanted to 1
just follow-up quickly on a point, this 2
information and disaggregation point that Chair 3
Weisenmiller made. So I guess there are a 4
number of efforts going on to utilize various 5
types of data and at various levels of 6
aggregation, and I wanted to know whether sort 7
of there's one at UCLA, there's some work going 8
on at different places in UCLA with different 9
kinds of perspectives on this. There are lots 10
of people who want to do that kind of work, 11
including the County and the City of L.A., I 12
think UCLA has been collaborating well with 13
LADWP on getting some other data within the City 14
for Zip Plus Four, the Zip Code level data for 15
energy consumption. I'm wondering, well, I 16
think it's actually really important and I'm 17
wondering how much of that Edison is sort of 18
doing, whether it's on your own, whether it's 19
shared with local governments, whether it's sort 20
of a partnership with the other entities, or 21
pretty much in-house. And the reason I ask is 22
because, exactly, the question that Chair 23
Weisenmiller was pushing on is, we have to know 24
what's happening over time and be able to look 25

160
CALIFORNIA REPORTING, LLC 52 Longwood Drive, San Rafael, California 94901 (415) 457-4417
at other factors, weather and many many others, 1
that we may not even anticipate today, but that 2
we're going to want to consider in the future. 3
And I think it's important to have a pretty 4
broad discussion about this and not hold it too 5
close. 6
MS. SHENG: I think this is a very good 7
point. SCE would definitely like to collaborate 8
with all the state agencies as much as we can. 9
I think we believe, you know, transparent 10
forecasting process would give us more 11
reasonable basis to look at for the future, so 12
be happy to work with Chris' team more closely 13
in terms of bringing the different perspective 14
together in the future. 15
COMMISSIONER MCALLISTER: Okay, thank 16
you. 17
MR. FUGATE: Okay, and so my last 18
presentation today will cover the PG&E Planning 19
Area. Here, our Baseline Consumption Forecast 20
for the PG&E Planning Area, these scenarios are 21
higher than what we presented in May by about 22
3,300 gigawatt hours in the Mid case, which 23
means that the revised Mid case is growing 24
faster by a couple tenths of a percent. 25
161
CALIFORNIA REPORTING, LLC 52 Longwood Drive, San Rafael, California 94901 (415) 457-4417
High Speed Rail is expected to contribute 1
162 gigawatt hours, and Port electrification 2
will add another 7,108 gigawatt hours. Electric 3
Vehicles are in the neighborhood of 2,000 4
gigawatt hours in the Mid case, and climate 5
change accounts for an additional 457 to 574 6
gigawatt hours in the Mid and High cases. 7
All of this amounts to a Mid scenario 8
that grows at 1.2 percent annually to reach 9
123,460 gigawatt hours by the end of the 10
forecast period. And one adjustment that is 11
unique to PG&E territory and that we'll have to 12
correct for the final forecast is that we found 13
an error in our QFER history for PG&E, so 14
correcting this will raise the consumption in 15
the base year by 2,200 gigawatt hours. 16
So peak demand grows at a rate of 1.4 17
percent annually to reach 25,450 megawatts in 18
the Mid case; self-generation is expected to 19
contribute 2,000 megawatts, 1,000 of which is 20
PV; Electric Vehicles only 50, and 120 21
megawatts. The combined impact from demand 22
response programs reaches 125 megawatts. And 23
climate change represents 377 and 569 megawatts 24
for Mid and High. 25

162
CALIFORNIA REPORTING, LLC 52 Longwood Drive, San Rafael, California 94901 (415) 457-4417
So PG&E has five climate zones, it's the 1
purple section shown here. Climate Zones 2 and 2
3 are the inland areas covering Sacramento and 3
San Joaquin Valleys. Climate Zone 5 represents 4
most of the Bay Area, San Francisco, Oakland, 5
and Marin. And the rest of the coast is covered 6
by Climate Zones 1 and 4. 7
And so we see a similar story here, the 8
fastest growth in consumption and peak is inland 9
in Climate Zones 2 and 3, and it's, again, that 10
expectation that migration from coastal to 11
inland areas will pick up again, growth and 12
population from 2013 to 2024, and then Mid in 13
that case is projected to be 21 and 23 percent 14
in Climate Zones 2 and 3, compared to eight and 15
four for Climate Zones 4 and 5. 16
And the same could be said about peak 17
growth, particularly in the Mid case, growth is 18
greatest in the inland areas, and potential 19
climate change impacts again contribute to peak 20
demand growth in Climate Zone 3. 21
Back to looking at the impact of 22
Additional Achievable Energy Efficiency; on our 23
forecast of sales for the PG&E service 24
territory, our unadjusted Mid scenario grows at 25
163
CALIFORNIA REPORTING, LLC 52 Longwood Drive, San Rafael, California 94901 (415) 457-4417
1.07 percent annually over the forecast period, 1
adding in the Mid AAEE scenarios which range 2
from 5,500, 62 gigawatt hours to 14,646 gigawatt 3
hours, brings the annual growth rate down to .56 4
percent, .21 percent, and then on the low case, 5
.33 percent. 6
So pairing low baseline sales with high 7
energy efficiency gives us a growth rate of just 8
over one percent a year, which is close to our 9
unadjusted baseline forecast, and in the lower 10
case declines at a rate of -.9 percent. 11
So here are the results for adjusted peak 12
and adjusted Mid baseline forecast grows at 1.56 13
percent, and then the mid adjustments bring the 14
growth down to 1.0 percent, .64 percent, and 15
then in the low case here it's actually flat. 16
And then here the High demand paired with 17
the Low Efficiency gives the growth of 1.48 18
percent annually, and the Low demand paired with 19
High Energy Efficiency gives -.68 percent annual 20
growth. 21
And so that's all I have. If PG&E wanted 22
to come up? 23
MS. CONNOLLY: Well, I'd like to thank 24
the Commission for the opportunity to provide 25
164
CALIFORNIA REPORTING, LLC 52 Longwood Drive, San Rafael, California 94901 (415) 457-4417
verbal comments. My name is Ipek Connolly and I 1
lead the Load Forecasting Group at PG&E. 2
I want to start by commending the staff 3
for producing such a comprehensive and well 4
thought out California Energy Demand Report with 5
revised results taking into account the comments 6
that were provided by various stakeholders 7
earlier. I want to commend the staff for also 8
making major significant improvements to the 9
Demand Forecasts, including but not limited to 10
the expanded portfolio of both econometric 11
models, as well as the new industrial model, 12
incorporating climate change scenarios on 13
energy, as well as peak demand, updating the 14
Electric Rate Forecast, which were pointed out 15
earlier, and incorporating energy efficiency 16
forecasts beyond the first two years of the 17
forecast horizon. In that regard, I would like 18
to reiterate the desire to end up with one 19
planning forecast that can be used as the 20
California Energy Demand Forecast, recognizing 21
that having the scenarios is extremely useful 22
because it recognizes the uncertainty associated 23
with these forecasts; but at the end of the day, 24
we're all striving to work towards, you know, 25

165
CALIFORNIA REPORTING, LLC 52 Longwood Drive, San Rafael, California 94901 (415) 457-4417
most likely expected energy demand forecast. 1
In terms of what we see in the report and 2
the presentations today, we're in agreement with 3
the baseline results. We're still reviewing the 4
other elements of this forecast. There is a lot 5
of detail, a lot of in-depth analysis, and 6
there's a lot of updates based on good research, 7
so we would like to take a little time to review 8
them thorough, and then get back to you with our 9
written comments. I also want to add that it 10
would be great if we could see the Electric 11
Vehicle forecast incorporated into the overall 12
projections. 13
So with that, if you have any questions I 14
would like to answer your questions, these are 15
my comments for today. 16
CHAIRMAN WEISENMILLER: Yeah, I was 17
trying to understand if -- we've talked about 18
the electric forecast -- I don't know if PG&E 19
and the staff have any comments on the natural 20
gas forecast? 21
MS. CONNOLLY: Again, we didn't review 22
the natural gas forecast. It's in general very 23
consistent with our overall view of the natural 24
gas demand forecast. Again, we're looking at 25

166
CALIFORNIA REPORTING, LLC 52 Longwood Drive, San Rafael, California 94901 (415) 457-4417
some of the details, but I haven't spotted 1
anything that required mentioning at this point. 2
CHAIRMAN WEISENMILLER: Okay, and in 3
terms of -- do you have anything that you could 4
submit to us on what PG&E's Electric Vehicle 5
forecast is? 6
MS. CONNOLLY: I can certainly look and 7
get back to you on that. Our forecasting cycle 8
is a little behind, so we completed our 9
forecasts, we're looking to get into our new 10
forecasting cycle, so I'm sure there's a lot of 11
information that's kind of being looked at, it's 12
just not something that I have right in front of 13
me today, but I can certainly look into that 14
because we do realize there's an interest among 15
all parties involved to see what the views are, 16
so I'll definitely see if we can present 17
something to you. 18
CHAIRMAN WEISENMILLER: Okay, thank you. 19
COMMISSIONER MCALLISTER: Just a quick 20
question. Do you have an opinion about which of 21
the efficiency scenarios you would like to see 22
adopted, or tweaked, or any feedback on any of 23
those? You sort of made the pitch for having 24
one forecast, and I'm wondering which forecast, 25

167
CALIFORNIA REPORTING, LLC 52 Longwood Drive, San Rafael, California 94901 (415) 457-4417
you know, within that, which of the efficiency 1
scenarios do you think PG&E is either most 2
likely to get, or at least would like in a 3
forecast? 4
MS. CONNOLLY: Again, the Navigant study 5
just came out, so we're looking into it and I'm 6
not aware of a position or an assessment of 7
results at this point. 8
CHAIRMAN WEISENMILLER: Well, I was going 9
to say, having worked at PG&E, or with PG&E, I 10
assume there's a difference between the 11
technical forecasting position and Management's 12
policy position, and your original statement was 13
on the technical forecasting part, as opposed to 14
a Management perspective. 15
MS. CONNOLLY: You probably have more 16
experience than I. 17
CHAIRMAN WEISENMILLER: Yeah, I've been 18
on the 32nd floor. My current key may still 19
work there. 20
COMMISSIONER MCALLISTER: We can help, 21
right? I mean, you know. Thanks very much. 22
MS. RAITT: Our next speaker is Malachi 23
Weng-Gutierrez. 24
MR. WENG-GUTIERREZ: Good afternoon. My 25

168
CALIFORNIA REPORTING, LLC 52 Longwood Drive, San Rafael, California 94901 (415) 457-4417
name is Malachi Weng-Gutierrez. I'm going to be 1
quickly going through a brief set of slides on 2
LADWP's Planning Area. 3
First off, I just wanted to show a 4
comparison between the Revised and the 5
Preliminary Demand Forecasts. You'll note that 6
the Electricity Demand increased in all three of 7
the scenarios, partially due to the change and 8
revision to the electricity rates, but also 9
because we did add additional demand growth that 10
has been mentioned for Ports. So you can see 11
that it's increased over a percent in each of 12
the cases. And that increase is also seen in 13
the peak demands, as well. 14
So overall electricity consumption for 15
LADWP again increased pretty significantly from 16
.6 percent to 1.4 percent in the Low and the 17
High cases. Obviously, the Low and the Mid are 18
lower than the CED 2011 values and the High case 19
increases above the CED 2011 value after about 20
2015. Part of that growth again is different 21
Port electrification, as well as the EV demand 22
numbers. 23
For the self-gen, this includes about 295 24
gigawatt hours in the Mid case; of that, PV 25

169
CALIFORNIA REPORTING, LLC 52 Longwood Drive, San Rafael, California 94901 (415) 457-4417
represents 122 gigawatt hours, again in the Mid 1
case, and then there are about 4,500 gigawatt 2
hours of initial savings projected from 2012 to 3
2024 there included in the Mid case. 4
The self-gen contributes about 41 5
megawatt hours in the Mid case and about 24 6
megawatt hours of that is PV in the Mid case; 7
growth rates here are fairly wide ranging, about 8
one percent difference between the High and the 9
Low, and all of which are below the CED 2011 Mid 10
case. 11
LADWP is comprised of two climate zones, 12
climate zones 11 and 12, and much like the CED 13
2011 forecast, the climate zone 12 demand growth 14
is higher than the climate zone 11, which again, 15
since it's an inland and it's in a different 16
climate zone, obviously it's going to be 17
influenced by temperature a little bit more 18
extensively. And so I think that plays in the 19
amount of both peak and total consumption growth 20
that is observed in all of the three different 21
cases that we have. 22
Then I just wanted to quickly show a 23
breakout of the load growth that is attributed 24
to the plug-in electric vehicle forecast. On 25
170
CALIFORNIA REPORTING, LLC 52 Longwood Drive, San Rafael, California 94901 (415) 457-4417
average, each of these three cases grow in 1
exceedance of 40 percent per year, that's pretty 2
substantial growth for EVs. These again are the 3
CED 2011 values that we're using in here, so the 4
Low case here represents a ZEV compliant case; 5
the High case here has a significant amount of 6
PHEV growth in exceedance of the ZEV mandate, 7
and then the Mid case is just the average of the 8
two. And obviously you can see that in the High 9
case, you have an addition of over 1,000 10
gigawatt hours in 2024. 11
Likewise, I wanted to show the Port 12
electrification and how much consumption is 13
attributed to that, not nearly as extensive as 14
the EV load, but there are a variety of 15
potential load growths associated with the 16
Ports. You notice the tiered aspects of this 17
and, as Chris mentioned in his presentation for 18
the state, the regulations that ARB has in place 19
have three compliance phases, the last of which 20
is in 80 percent of all visits, as well as 80 21
percent of all on board consumption have to be 22
electrified, and so even the highest -- or after 23
2020 you see the highest amount of electricity 24
load from Port electrification. And again, 25

171
CALIFORNIA REPORTING, LLC 52 Longwood Drive, San Rafael, California 94901 (415) 457-4417
Chris had mentioned that in the Low case, we 1
pretty much kept the load growth flat, and then 2
there are additional visits that are attributed 3
to both commodity growth and other growth with 4
-- container ships basically have load growths 5
that are tied to commodity growth, and then we 6
have cruise liners which have load growth tied 7
to passenger growth rates. And so that's where 8
we get the variation between the three different 9
cases. And again, in the high case, we see a 10
load growth addition of about 100 gigawatt 11
hours. And I think that's it for my slides for 12
LADWP. So I'm not sure if we're going to have 13
anyone speak from LADWP, commenting on this -- 14
maybe online? So again, I don't think -- they 15
weren't going to come, but I didn't know if they 16
were going to be online to make comments, so 17
with that, if you have any questions? 18
CHAIRMAN WEISENMILLER: Well, I certainly 19
would encourage your written comments so we have 20
the benefit of that and certainly, again, their 21
EV stuff as we're trying to pull that together, 22
it would be good to get any forecasts they have 23
on that and the basis for it. 24
MR. WENG-GUTIERREZ: Okay, well, I can 25

172
CALIFORNIA REPORTING, LLC 52 Longwood Drive, San Rafael, California 94901 (415) 457-4417
certainly touch base with them and see what EV 1
forecasts they might have and either provide 2
that to Fuels and Transportation or work with 3
staff in figuring out how to incorporate that. 4
CHAIRMAN WEISENMILLER: That's great. 5
COMMISSIONER MCALLISTER: And Malachi, 6
one question. So it looks like based on the 7
2011 final Mid, the load factors were actually 8
better in DWP than anticipated in that the 9
capacities -- all of our scenarios for this time 10
around are lower on the capacity side, but not 11
as much on the energy side? Any particular 12
effort that resulted in that? Or is it just 13
sort of the way things played out, or what? 14
MR. WENG-GUTIERREZ: I would say that 15
that's just the way things played out. But we 16
could certainly check into that, the specifics 17
as to why that happened, and get back to you on 18
that. 19
COMMISSIONER MCALLISTER: That would be 20
great, a little bit of insight because the 21
capacity in your slide 5, you know, the 2011 22
final Mid capacity is above all the other, all 23
the current assessments that we've got, all 24
three scenarios. The same is not the case on 25
173
CALIFORNIA REPORTING, LLC 52 Longwood Drive, San Rafael, California 94901 (415) 457-4417
energy, so at some point you've got a better 1
utilization of that then what was projected two 2
years ago. 3
MR. WENG-GUTIERREZ: Yeah, we'll look 4
into it and see why that -- 5
COMMISSIONER MCALLISTER: Great, thanks. 6
Let's move on to SMUD. 7
MR. WENG-GUTIERREZ: So if there are no 8
further questions -- so Nate said he would be 9
here at 3:30, so I may speak a little slowly. 10
For my few slides that I have for SMUD -- 11
COMMISSIONER MCALLISTER: We do have a 12
SMUD representative here -- 13
MR. WENG-GUTIERREZ: Okay, well maybe 14
they could come and speak up here to comment, 15
but I'll just go through the slides and maybe he 16
will show up in time. So again, I'm just going 17
to go through SMUD's planning area and, again, 18
I'm going to start out with just showing the 19
Revised and Preliminary Demand Forecasts and the 20
difference between the two. 21
As you would imagine, again, the revised 22
numbers are higher partially due to the rates 23
and also, well, primarily due to the rates that 24
we're showing for them. And again, here almost 25
174
CALIFORNIA REPORTING, LLC 52 Longwood Drive, San Rafael, California 94901 (415) 457-4417
all of the growths are about two percent overall 1
and the difference between the preliminary and 2
the revised are above two percent in almost all 3
the cases. 4
Likewise, the peak forecast is higher, as 5
well and, again, I think primarily because of 6
the change in the rates. So for the Demand 7
numbers in all three cases we're starting out 8
slightly lower than the CD 2011 values. The 9
high case obviously grows to be above the CD 10
2011 values. And in general, you know, we have 11
energy savings incorporated into this, about 12
1,800 gigawatt hours from 2012 to 2024. Self-13
gen, we have a total number of gigawatt hours of 14
219, 218 of which are from PV, and I think 15
that's it for consumption. 16
The planning area peak, again, is only 17
exceeded in the High case for the CED 2013, and 18
the Low, I believe that nearly half a percent of 19
the growth in peak -- the minted case is about 20
half a percent over the preliminary forecast. 21
And the peak here reaches a level of about 70 -- 22
or, sorry, 3,700 megawatt hours in 2024 for the 23
high case. 24
Again, breaking out the EV loads from all 25

175
CALIFORNIA REPORTING, LLC 52 Longwood Drive, San Rafael, California 94901 (415) 457-4417
the others, again, we have the three cases, the 1
Low case again being the ZEV mandated value, the 2
share of which we're attributing to SMUD in the 3
ZEV compliance scenario. The High obviously is 4
again the case where we have a substantial 5
amount of PHEVs entering the marketplace, and 6
the MID is between the two. For SMUD, we show a 7
total growth of over 160 in the High case. And 8
SMUD doesn't have any Ports that we've included 9
as far as the adverse (ph) regulations. So 10
that's the end of my slides. So if you have any 11
questions, I'd be happy to answer them. 12
COMMISSIONER MCALLISTER: Okay, so 13
Malachi, could you discuss a little bit, you 14
know, sort of knowing the difference between the 15
Preliminary and the current has most to do with 16
rates, and I guess is that the same kind of 17
dynamic that happened with the investor-owned 18
utility projections, sort of the preliminary to 19
now? Is that the same underlying dynamic? I 20
guess I'm wondering how you sort of did that 21
analysis for the POUs versus the IOUs, if there 22
was a difference there. 23
MR. WENG-GUTIERREZ: Yeah, so the 24
increase should be partially due to the rates, 25
176
CALIFORNIA REPORTING, LLC 52 Longwood Drive, San Rafael, California 94901 (415) 457-4417
but these are just the total of all the elements 1
that are added, it's just that in some of the 2
other cases we had things that were added like 3
Port electrification, which were not in 4
Preliminary, so you could attribute part of that 5
growth to those. 6
For SMUD, we didn't have Port 7
electrification. The EVs were already included, 8
so the primary thing that was driving the change 9
in my mind were the rate changes. 10
COMMISSIONER MCALLISTER: So they're the 11
same underlying dynamics with natural gas 12
projections and all that kind of stuff. 13
MR. WENG-GUTIERREZ: Yes. But again, 14
because of the differences between the 15
difference utilities and what we've included, I 16
mean, there might be some balances to that. 17
COMMISSIONER MCALLISTER: Yeah, okay. So 18
is SMUD going to electrify their Port? 19
MR. WENG-GUTIERREZ: Well, they may be 20
electrifying, but they're not required under the 21
At-Berth Regulation for ARB to electrify their 22
Ports. 23
COMMISSIONER MCALLISTER: Okay, great. 24
Do you have any questions? 25

177
CALIFORNIA REPORTING, LLC 52 Longwood Drive, San Rafael, California 94901 (415) 457-4417
CHAIRMAN WEISENMILLER: And I guess the 1
other thing they're electrifying is light rail. 2
MR. WENG-GUTIERREZ: Right. 3
CHAIRMAN WEISENMILLER: I think we're 4
good. 5
MR. WENG-GUTIERREZ: So I don't see Nate, 6
so I'm guessing -- 7
CHAIRMAN WEISENMILLER: He may come into 8
the public comment. 9
MR. WENG-GUTIERREZ: Okay. 10
MS. RAITT: So I don't know if anyone is 11
interested in making public comments? 12
CHAIRMAN WEISENMILLER: There he is. All 13
right. 14
COMMISSIONER MCALLISTER: Do you want to 15
know what Malachi said about you? 16
MR. WENG-GUTIERREZ: Okay, so I will hand 17
the mic over to Nate Toyama from SMUD to go 18
through his presentation, commenting on the 19
items. 20
MR. TOYAMA: Nate Toyama from SMUD. 21
Okay, three things on the agenda for me, one is 22
an update of our forecasts, some other issues 23
that SMUD has been working on, the second are 24
actually the comparisons of the forecasts that 25

178
CALIFORNIA REPORTING, LLC 52 Longwood Drive, San Rafael, California 94901 (415) 457-4417
we received I guess yesterday afternoon, so 1
let's go to the updates. 2
In the initial filing, we didn't have a 3
rate forecast to present to the CEC and that was 4
because SMUD was going through a rate process or 5
what we call a General Manager's Report and 6
Recommendations on Rates and Services, very 7
similar to a base case or a GRC that the IOUs go 8
through. Since then, it's been adopted by the 9
Board on August 15th, a couple months ago. The 10
main part of the rate case, well, there are two 11
parts to the rate case, one of course was the 12
general rate increase of 2.5 percent in 2014, 13
and again in 2015. The main component of this 14
particular rate case, however, was the 15
restructuring of the rates, and in this 16
particular rate case there was a focus on both 17
residential and small commercial. And what 18
happened was, in the restructuring what was 19
adopted was a plan in which SMUD would shift 20
revenues from the energy or the volumetric 21
charges to the fixe charges, and so you see 22
fixed charges going up, or what they call the 23
infrastructure charge will be going up in the 24
next couple years. Rates themselves will go up, 25

179
CALIFORNIA REPORTING, LLC 52 Longwood Drive, San Rafael, California 94901 (415) 457-4417
as well, but not as much as they would have been 1
under a 2.5 percent rate increase. 2
The second component, or the second issue 3
I'd like to talk about, is the 2014 -- our 4
forecast update. Every winter before the 5
budget, SMUD produces a new forecast. What I'm 6
going to present today is the forecast that was 7
actually presented in the April 15th filing. 8
Just so that everyone knows what's going on, if 9
you happen to see another SMUD forecast which 10
should be released either in November or 11
December, it will be somewhat different from the 12
forecast that you see that was submitted April 13
15th. These are the forecasts that will be 14
presented to the WECC and to FERC for various 15
regulatory filings, and so you'll see that next 16
year. 17
And so what we have this year, of course, 18
is actually a combination of different forecasts 19
just because of the timing that was involved in 20
presenting the April 15th forecast, it has some 21
of our December 2012 forecasts and some updates, 22
and the updates are primarily with EE and EV and 23
with PV, and so you'll see that in the filing 24
that was submitted on April 15th. 25

180
CALIFORNIA REPORTING, LLC 52 Longwood Drive, San Rafael, California 94901 (415) 457-4417
The comments I have on the forecast -- 1
let me just give you a preview of what we're 2
actually going to talk about -- I tried to find 3
a common ground on which to discuss the 4
different forecasts, and this particular 5
presentation will be reviewing the sales 6
forecasts from the Form 1.1b Mid case from the 7
update that was given to us yesterday. The Peak 8
forecast will be the Net Peak Demand Forecast, 9
which was Form 1.4 Mid Case. I'm going to 10
compare those to SMUD's forecast, which were 11
given in the 4/15/2013 submittal. I had to make 12
some modifications to extend the forecast to 13
2024, but initially they're all fairly 14
consistent with what was presented earlier. 15
And now for the comparisons. From this 16
chart you can tell that our forecast, which has 17
been adjusted for both PV and EVs, which should 18
be similar to the CEC total sales forecast, are 19
basically the same. There's very little 20
difference, there's about a one percent 21
difference going forward, and so given that we 22
have really two separate models coming up with 23
very similar results is to some degree very 24
encouraging, very satisfying. 25
181
CALIFORNIA REPORTING, LLC 52 Longwood Drive, San Rafael, California 94901 (415) 457-4417
The bottom line, however, is what we 1
would refer to as our managed case, and in that 2
managed case we include SMUD's energy efficiency 3
program. As many of you probably know, our 4
energy efficiency annual goals are about 1.5 5
percent of our sales, or our unmanaged sales; 6
it's a fairly aggressive goal, but if we keep to 7
it and achieve it, then you'll see that we have 8
the bottom line for our forecasted sales, which 9
is essentially flat. 10
Now, I don't know if you presented the 11
potential forecast for SMUD like you were doing 12
for the other IOUs -- okay -- there was a 13
potential study done for SMUD by Navigant, I 14
believe, and so we have that data, we just 15
haven't been able to really evaluate the data 16
yet, so maybe we can work with you to see how 17
you came up with those nifty crafts that you 18
showed. 19
And so on the sales side, you know, we're 20
pretty okay, we're cool. The next forecast, 21
however, is different, and that's the Peak 22
Forecast. And this is where we see really a 23
fairly high difference between the CEC forecast 24
and what SMUD is using for its planning 25

182
CALIFORNIA REPORTING, LLC 52 Longwood Drive, San Rafael, California 94901 (415) 457-4417
purposes. The blue line which is much higher, 1
roughly about four to five percent above the red 2
line, which is our forecast with no EE, the 3
green line, or whatever that lower line is, our 4
forecast with EE, and that's roughly about 10 5
percent on the average difference between our 6
forecast and the net demand forecast that was 7
given to the CEC. 8
And so why do we think it's different? 9
Or why do we think that our forecast is perhaps 10
more plausible? We didn't go through some heavy 11
duty statistical analysis, we're just going to 12
present some basic metrics on how we evaluate 13
our loads in the present versus what we would 14
see in the future. This is a graph and what we 15
did is I took the forecast that was presented by 16
the CEC in their revised form, our forecast that 17
was presented in the April 15th submittal; 18
however, I used the CEC's projection of 19
population, coming up with some sort of a 20
numeral measure that we had in common. I 21
couldn't find your accounts -- we typically use 22
accounts, but I couldn't find accounts in any of 23
your forecasts, so I used population which, you 24
know, is fairly consistent with at least 25

183
CALIFORNIA REPORTING, LLC 52 Longwood Drive, San Rafael, California 94901 (415) 457-4417
accounts. 1
And what I want to show on this 2
particular forecast is where we were back in the 3
height of the boom, where we are now during the 4
recession, and as we slowly crawl out of the 5
recession where we are. On the bottom line is 6
temperature. When we forecast peaks, we 7
typically have a weather normal year. And for 8
our peak forecast, we used a degree of -- we 9
used 106 degrees of the daily high, and that's 10
what the bottom illustrates, the historical part 11
as well as going forward, so it's 106 degrees 12
following that three-day heat storm of 100, 104, 13
106, roughly about average temperature of about 14
87 degrees, which basically means that it's a 67 15
degree evening or early morning. And you can 16
tell that, on the per person basis, that during 17
the height of the boom and of course some very 18
hot temperatures that we experienced between 19
2004 and 2008, that peak per person is very 20
high. Coming out of the boom into the 21
recession, we see that going down roughly to 22
about 2.1 kW per person, and experiencing the 23
same type of weather, not as high as what we 24
experienced in the past, but still 106 degrees, 25
184
CALIFORNIA REPORTING, LLC 52 Longwood Drive, San Rafael, California 94901 (415) 457-4417
which is what our normal temperature is, or 1
where our planning temperature is. I don't know 2
if that's normal, but it's what we used to plan. 3
The next slide basically tries to confirm 4
what we established in our metrics, and that is 5
to illustrate the most recent heat storm we 6
experienced late June, early July. And during 7
this heat storm, you can tell the loads -- in 8
this load we never really got above 3,000 at the 9
maximum, which was observed on July 3rd, we hit 10
3,014 megawatts. Now, to compare that with the 11
CEC's forecast, I believe it's 3,140 megawatts, 12
much higher than what we would ever expect to 13
see given current conditions; now, it could 14
change, we could go into another expansion like 15
we saw during the 2004-2008 period, but given 16
current conditions, we just don't see that 17
happening and it was a good example of the late 18
June, early July heat storm that tells us that 19
our loads are still going to be pretty low. We 20
look at it as a per account basis, which would 21
mean it's about five kilowatts per account. 22
Now, the other thing about this heat 23
storm is that this was an extremely rare heat 24
storm. If you have to look at the heat storms 25

185
CALIFORNIA REPORTING, LLC 52 Longwood Drive, San Rafael, California 94901 (415) 457-4417
over the last 130 years, we've never experienced 1
a heat storm in this style. It was six days of 2
over 105 degrees for each day. On the sixth 3
day, of course, is when we hit our peak. On the 4
seventh day, which would have been another 5
record, an all time high for heat storms in 6
Sacramento of above 105 degrees, we probably 7
would have seen something much higher, maybe 8
3,100 megawatts, but of course that was the 4th 9
of July, so we didn't see that. We typically 10
look at holidays and sometimes on weekends as 11
being about 200 megawatts lower than a weekday. 12
And so, given these conditions in which 13
we still see a somewhat depressed economy, 14
vacancy rates for retail and office space 15
roughly still about 18-20 percent high. The 16
vacancy rates for residential homes was still 17
about seven percent, pretty constant over the 18
last several years. The number of persons per 19
household still relatively stable at about 2.7, 20
I think, is what the CEC has, we have about 2.6, 21
so still relatively stable numbers. We haven't 22
seen much changes except that in the CEC's 23
forecast, you predicted it to go a little bit 24
higher next year, whereas ours is relatively 25

186
CALIFORNIA REPORTING, LLC 52 Longwood Drive, San Rafael, California 94901 (415) 457-4417
stable, we expect more kids, if we're lucky to 1
leave the home, leave their parents, rent their 2
own apartment hopefully in mid-town, so -- 3
anyway, the whole idea or the whole rationale 4
for our forecast is that we still see a 5
relatively depressed load. 6
Now, during the 2004-2008 period, we were 7
sort of wondering what was going on with those, 8
why was it so high, seeing about 5.15 kilowatts 9
per account, 5.2 kilowatts in some cases, but 10
now if we get five kilowatts per customer on a 11
hot day, that's a pretty good peak. 12
And so what we see here is that 3,000 to 13
us is pretty stable, pretty manageable peak, 14
something that we're going to be planning for, 15
for the next couple years. 16
Anyway, I think that's it. Any 17
questions, I'll be glad to answer them. 18
COMMISSIONER MCALLISTER: Yeah. Thanks 19
very much, that was super interesting. So I 20
guess probably for both Commission staff and for 21
you, I guess, you know, you have two curves on 22
your presentation, one is the adjusted and one 23
sort of includes the EE. What do you use those 24
two curves for? You sort of imply that the 25
187
CALIFORNIA REPORTING, LLC 52 Longwood Drive, San Rafael, California 94901 (415) 457-4417
higher of the two was for planning, and the 1
lower was sort of maybe aspirational or 2
something? I'm putting words in your mouth. 3
MR. TOYAMA: The high forecast that we 4
present versus the lower forecast? 5
COMMISSIONER MCALLISTER: Well, for 6
example, the energy side, the one that matches 7
the CEC versus the one that includes aggressive 8
energy efficiency, what do you use those two 9
for? 10
MR. TOYAMA: Well, we use the -- for both 11
the peak and sales, we use the managed forecast, 12
or the one that includes EE, to determine our 13
resource mix. If you look at our WECC filings 14
or our FERC filings, we typically will use -- 15
you'll always see energy efficiency as our 16
resource just like PV is a resource, or PV and 17
EE are both considered resources, and so on our 18
planning we'll plan to meet with other 19
resources, both lower lines, and that's how we 20
manage our portfolio, that's how we measure our 21
budget, that's how we calculate sales, and so -- 22
COMMISSIONER MCALLISTER: What about 23
investments in your grid infrastructure? 24
MR. TOYAMA: I'm sorry? 25
188
CALIFORNIA REPORTING, LLC 52 Longwood Drive, San Rafael, California 94901 (415) 457-4417
COMMISSIONER MCALLISTER: What about 1
investments in grid infrastructure? 2
MR. TOYAMA: I can't hear you with all 3
the cackle going. 4
COMMISSIONER MCALLISTER: Sorry. Which 5
of those curves do you use for sort of 6
distribution planning and things like that? 7
MR. TOYAMA: For what type of planning? 8
COMMISSIONER MCALLISTER: Distribution 9
system planning in investment. 10
MR. TOYAMA: Distribution planning is 11
sort of a different type of forecast. We 12
typically -- for distribution planning, we don't 13
typically look at loads -- well, we do look at 14
loads, obviously, but we're more concerned about 15
looking at the number of customers because, for 16
distribution planning, at least at the secondary 17
level, that's what we're going to basically have 18
to serve. 19
COMMISSIONER MCALLISTER: Okay. 20
MR. TOYAMA: Now, going at the higher 21
level of distribution either at the primary or 22
at the 115, or at the 169 kV, we will look at 23
the load impact because we're looking at 24
diversified loads and when we plan for those 25
189
CALIFORNIA REPORTING, LLC 52 Longwood Drive, San Rafael, California 94901 (415) 457-4417
higher levels of distribution, we're typically 1
looking at a very diversified load. But at the 2
lower level, at the secondary level, we're 3
typically looking at the customer load and, 4
given the number of customers which we're 5
projecting for next year, which is roughly about 6
5,000 customers, we're going to plan accordingly 7
with our distribution criteria, which is looking 8
at the load per count or at the transformer 9
level. And so that's how we would do 10
distribution. 11
COMMISSIONER MCALLISTER: Okay. So I 12
guess, have you had a dialogue with our staff 13
about the difference in the sort of peaks and 14
explaining that and picking it apart, or are we 15
just kind of hearing the first of that from you? 16
MR. TOYOMA: Not that -- 17
COMMISSIONER MCALLISTER: Okay, so we're 18
just hearing the first of it now and it needs to 19
be kind of -- 20
MR. TOYAMA: I mentioned it last time, so 21
I knew it was high last time too. But if I had 22
to err, of course, I'd rather err on the high 23
side than the low side, but it is for our 24
purposes relatively high. It may be it's 25

190
CALIFORNIA REPORTING, LLC 52 Longwood Drive, San Rafael, California 94901 (415) 457-4417
looking at two different eras, you know, it's 1
really more consistent with the growth expansion 2
that we saw in the 2004 to 2008 period. 3
COMMISSIONER MCALLISTER: Okay. 4
MR. TOYAMA: And that's when we saw very 5
high loads on a per customer basis. But 6
recently it's fairly low, so I think overall on 7
the forecasts or on the methodologies, what 8
you're planning for, what type of world are you 9
planning for, and when we're doing our resource 10
acquisition, which is really short term 11
acquisition in terms of resource reliability or 12
for reserves, we're looking at a short term 13
acquisition, not building, we're looking at 14
purchasing out the market -- 15
COMMISSIONER MCALLISTER: So I guess, I 16
appreciate that, I guess the question is, you 17
know, do you think this is a temporary thing due 18
to the economy, or do you think it's going to 19
bounce back along the lines of what the 20
Commission -- you know, back into the realm that 21
the Commission has projected for demand, for 22
peaks? 23
MR. TOYAMA: I would say for the near 24
future it's a pretty good view of the world, our 25

191
CALIFORNIA REPORTING, LLC 52 Longwood Drive, San Rafael, California 94901 (415) 457-4417
lower forecast. Of course, going forward, it's 1
so hard to predict, but we're typically looking 2
at -- for our forecast, we typically look at 3
about five years at the maximum for at least 4
resource acquisition. Now, for building other 5
resources, we're going to go 20 years out. But 6
typically what we do for other resources, we 7
looked at different scenarios like the CEC has, 8
we look at the one and two, which is primarily 9
energy and capacity, but we look at the one in 10
10, which is going to give us another couple 11
hundred megawatts to look at other types of 12
distribution, or other types of resources which 13
we refer to as our load serving capability. So 14
it's really looking at under extreme conditions, 15
and under various scenarios such as the 16
contingency analysis, we have to know what we 17
could build assuming that something is going to 18
go out. And so we always have some room to sort 19
of wiggle when we're looking at the load serving 20
capability forecast, which is used for looking 21
at transmission, is used for looking at bulk 22
transmission, or we're looking at it for 23
building capacity -- 24
COMMISSIONER MCALLISTER: Okay. 25

192
CALIFORNIA REPORTING, LLC 52 Longwood Drive, San Rafael, California 94901 (415) 457-4417
MR. TOYAMA: -- for voltage and so forth. 1
COMMISSIONER MCALLISTER: Okay, got it. 2
MR. TOYAMA: It depends on the type of 3
forecast that we're using. This particular 4
forecast is basically our resource acquisition 5
forecast. 6
COMMISSIONER MCALLISTER: Great. Thanks 7
very much. So, Chris, did you want to make a 8
comment? 9
MR. KAVALEC: Yeah, I just wanted to say 10
that we sat down with Nate a couple months ago 11
and compared peak forecast and what it basically 12
came down to was our assumptions about what 13
happens in the next couple years. We have for 14
SMUD a relatively cool weather year in 2012, so 15
our peak goes up from 2012, and then the 16
recovery pushes the peak up farther. From that 17
point on, the growth rates are very similar. 18
Ours is a little higher because we include 19
climate change impacts and SMUD doesn't. But 20
aside from that, no one knows more about the 21
SMUD service territory than Nate, so we're happy 22
to sit down again and talk about the peak. 23
CHAIRMAN WEISENMILLER: That's great. I 24
was going to note, I'm trying to remember what 25

193
CALIFORNIA REPORTING, LLC 52 Longwood Drive, San Rafael, California 94901 (415) 457-4417
SMUD official I met with, but after your sales 1
actually dropped one year, you know, and the 2
question was where things were going in the 3
future. One situation you're in is obviously a 4
lot of people had permitted projects in 2008 5
which they just parked, and so if the economy 6
comes back, they can sort of move on those fast, 7
but there does seem to be more construction 8
going on at this stage around town, as opposed 9
to a more typical year where you have to go 10
through the permitting process to actually start 11
moving things forward. 12
MR. TOYAMA: In terms of that question, 13
you know, we don't see much of an increase in 14
the new homes, we do see about -- I think this 15
year we'll -- let me step back a bit -- we tend 16
to look at permits, you know, permits are 17
obviously the sort of milestone that we look at 18
where builders are actually going to build 19
something. And up until now we still see a 20
relatively low level for mixed being pulled for 21
building new units, whether they're single-22
family or multi-family homes. We do see an 23
increase, however, from last year and the year 24
before, but it's nowhere near the 12,000, 10,000 25

194
CALIFORNIA REPORTING, LLC 52 Longwood Drive, San Rafael, California 94901 (415) 457-4417
units that we were seeing built back in 2006. 1
This year, we're lucky to see 2,000. And so, 2
given that, we still think that the housing 3
market is, at least for 2014, will be somewhat 4
depressed. Actually, we're looking at about 5
4,000 new units in 2014. In '15, we see an 6
expansion of about 6,000 to 8,000 going forward 7
in 2015 to 2018. So we do see a recovery and we 8
use the similar data that the CEC uses for their 9
housing starts and their economics. But I think 10
on the load part, the issue that we have is not 11
residential has been fairly strong, it's really 12
the commercial sector that we see most of the 13
lag in. And from just looking at our data, we 14
know that commercial units tend to lag about one 15
year, both in terms of starts and both in terms 16
of declines. And so we saw that the small 17
commercial sector declined slowly after the 18
residential sectors were declining back in '07, 19
and then the commercial sector now has been 20
relatively stagnant, and we expect to see that 21
growth in 2015. But in terms of our planning, 22
because we do this every single year, and in 23
extreme cases we'll do it twice a year, that if 24
things begin to turn around, we'll be able to 25

195
CALIFORNIA REPORTING, LLC 52 Longwood Drive, San Rafael, California 94901 (415) 457-4417
see it and incorporate it into our forecast. 1
So, once again, our forecast really is a short 2
term forecast; we extend it to a long term, but 3
it really is meant to look at a short term 4
resource acquisitions and short term portfolio 5
issues. And then it's carried out to the long 6
term to look at other issues such as renewable 7
portfolios, other goals that we have for energy 8
efficiency and perhaps building either 9
transmission, or generation, or some type of 10
generation within SMUD service territory to 11
provide both support, or peakers, or perhaps 12
ancillary services. But because this exercise 13
is done every year, it gives us a chance to look 14
at the current trends and then extrapolate on 15
the current trends. 16
CHAIRMAN WEISENMILLER: That's good, that 17
helps. Actually one of our earliest first 18
workshops in this whole effort, I don't know if 19
it was the first, or one of the first, was on 20
econ-demo, and we had Mike Rossi in, and in that 21
meeting some of the builders were saying, you 22
know, can California get back to the glory days 23
of 250,000 new housing starts a year, and Mike 24
saying, God Bless, I hope not, you know, we 25
196
CALIFORNIA REPORTING, LLC 52 Longwood Drive, San Rafael, California 94901 (415) 457-4417
really have to build our economy on something 1
that's more sustainable than subdivisions 2
dotting the areas, building houses we don't need 3
and can't afford. But, yeah, hopefully we've 4
gone from our floor, whatever, 40,000 or 50,000, 5
but it's hard to imagine going back to the boom 6
days of 2008 with the housing bubble. 7
COMMISSIONER MCALLISTER: All right. 8
Thanks. So we have another session of public 9
comments? 10
MS. RAITT: So now we can open it up to 11
public comments and start with the cards. 12
COMMISSIONER MCALLISTER: We have one. 13
Bill Monsen. There he is. 14
MR. MONSEN: Chair Weisenmiller and 15
Commissioner McAllister, I'm Bill Monsen, I'm 16
representing IEP and I'm with MRW and 17
Associates. And I appreciate the opportunity to 18
give some comments on the really good work that 19
I think the staff has done on the Additional 20
Available Energy Efficiency, or whatever the 21
thing is called these days. 22
I have a couple of -- first off, I agree 23
that it makes good sense to present multiple Mid 24
case scenarios that provides, I think, the 25

197
CALIFORNIA REPORTING, LLC 52 Longwood Drive, San Rafael, California 94901 (415) 457-4417
decision makers and various parties good 1
information about what the range is in sort of a 2
Mid case, so I think that was a very good 3
approach by the staff. 4
I have a couple of comments about the 5
AAEE forecasts. The first is with regard to the 6
impact of rate design on energy efficiency 7
impacts. Given that it appears that residential 8
rate design is going to be moving more toward 9
having a fixed charge, as well as an energy 10
charge, that could very well reduce the costs 11
that are avoidable by energy efficiency, and 12
that might tend to push downward the types of 13
impacts that we've been seeing, and I don't 14
believe that that two-part rate was included or 15
modeled into that work, so that's something that 16
I think your staff is going to want to look at 17
maybe in the next go-round. 18
With regard to the emerging technologies, 19
again, I think it's an important point to 20
recognize the impacts associated with those 21
emerging technologies, they're really one of the 22
drivers in the range of the uncertainty in the 23
Mid case forecast. And I guess IEP's position 24
has been that it's going to be important to be 25

198
CALIFORNIA REPORTING, LLC 52 Longwood Drive, San Rafael, California 94901 (415) 457-4417
conservative with regard to your forecasts, 1
particularly since those forecasts may well be 2
used for determining local levels of demand that 3
will be used in determining local reliability 4
and procurement. 5
The last point on the AAEE is that it's 6
good to see that the Low Mid case was assuming a 7
1.0 total resource cost test threshold. Given 8
that it appears that, at least with regard to 9
Southern California Edison current request for 10
offers, which is an all source solicitation, 11
that providing -- essentially allowing non-cost-12
effective or energy efficiency programs that 13
might not meet a 1.0 total resource cost test, I 14
think that's going to be a real challenge or 15
test as you move toward more of an all source 16
solicitation program. So those are my AAEE 17
comments. 18
With regard to the solar estimates, the 19
behind-the-meter solar estimates, I think you're 20
going to run into the same kind of issues that I 21
talked about with regard to energy efficiency 22
and rate design. To the degree that, again, 23
residential customers are going to be facing a 24
two-part rate, that's going to reduce the cost-25

199
CALIFORNIA REPORTING, LLC 52 Longwood Drive, San Rafael, California 94901 (415) 457-4417
effectiveness of behind-the-meter solar, so 1
that's going to be something that's going to 2
have to get picked up at some point down the 3
road. And IEP will be happy to provide some 4
comments on this. 5
COMMISSIONER MCALLISTER: Great. Thanks 6
very much. That's all the blue cards. Do we 7
have anyone on the phones or WebEx that wants to 8
speak? 9
MS. RAITT: So we don't have anybody on 10
WebEx, and so we'll open it up, we have a few 11
phone lines we'll open up and I'll ask the folks 12
on the phone to put their phones on mute unless 13
they have a comment they'd like to make, or a 14
question? So the phone lines are now open if 15
you have a question. 16
MR. KRISTOV: Hello. This is Lorenzo 17
Kristov with the ISO. Can you hear me? 18
MS. RAITT: Yes, we can. Thank you. 19
COMMISSIONER MCALLISTER: Yes, go ahead. 20
MR. KRISTOV: Okay, thank you. Good 21
afternoon, Commissioners and my friends at the 22
CEC. I just wanted to, for the ISO, chime in 23
and concur with the comments made by Simon Baker 24
of the PUC earlier today referring back to the 25
200
CALIFORNIA REPORTING, LLC 52 Longwood Drive, San Rafael, California 94901 (415) 457-4417
work that staff at all three agencies have been 1
doing over the last many weeks to follow through 2
on the commitments made by the three agencies in 3
response to Senator Padilla's hearing, 4
particularly the point on interagency agreement 5
on the forecast numbers that we want to use for 6
planning and procurement processes coming up 7
and, again, within that the specific focus he 8
had on the Additional Achievable Energy 9
Efficiency. As Simon pointed out, and we agree, 10
we see the IEPR proceeding providing a record 11
for -- and perhaps being the best vehicle to 12
identify what those appropriate forecast numbers 13
would be, and we plan to attend in person on the 14
15th at the next workshop, and we can discuss 15
this in more detail; but I wanted to at least 16
make that point for your consideration today. 17
CHAIRMAN WEISENMILLER: Okay. We want to 18
make sure that you're speaking for Management. 19
MR. KRISTOV: Yes. 20
CHAIRMAN WEISENMILLER: We know staff 21
speak on technical issues and we encourage that, 22
but you better have Management position. 23
Thanks. 24
MR. KRISTOV: Okay. And we will 25
201
CALIFORNIA REPORTING, LLC 52 Longwood Drive, San Rafael, California 94901 (415) 457-4417
certainly be ready to present that on the 15th. 1
COMMISSIONER MCALLISTER: Okay, thanks 2
for that comment. Anybody else wanting to from 3
the phones? 4
MS. RAITT: It doesn't sound like it. 5
COMMISSIONER MCALLISTER: All right, 6
great. Well, except for an hour or so, I was 7
waylaid and managed to get some relief and my 8
newly stitched up son appreciates your 9
forbearance, family emergency notwithstanding. 10
And I really enjoyed today and, really, I think 11
at the end, you know, the appreciation to staff 12
and all the stakeholders that you have been able 13
to engage with consistently over the last few 14
months is really appreciated and I think 15
extremely valuable to get the forecasts and the 16
various utility territories sort of iterated and 17
basically to a pretty close level of consensus, 18
at least as far as we can reasonably expect to 19
get, and that's quite an accomplishment, and I 20
think it's really going to serve the state well 21
regardless of the forum in which we might adopt 22
or refuse. So I want to thank Chris and the 23
team, Nick, Malachi, and all your counterparts 24
for working on that so diligently. And I 25
202
CALIFORNIA REPORTING, LLC 52 Longwood Drive, San Rafael, California 94901 (415) 457-4417
believe this is the last workshop we have 1
explicitly about this topic, but there's still a 2
little bit of work that will come out of today 3
that will be incorporated into the final 4
document, and go from there. So I want to thank 5
everybody for coming and, you know, you're the 6
stalwarts here at the end of the day on the last 7
Forecast Workshop. So thanks again. I really 8
appreciate it. I know the document is going to 9
be a strong document this year, it's really 10
shaping up nicely on the various topics that 11
we've targeted. But every year, or every IEPR, 12
the forecast is really a cornerstone of the 13
document and I know the value of it for the 14
state for the next couple years, and having that 15
long term record every two years, you know, 16
really does help build the foundation that not 17
only the Energy Commission, but the other energy 18
agencies build on year in and year out. So 19
thanks again and I'll pass it over to the Chair. 20
CHAIRMAN WEISENMILLER: Yeah, I certainly 21
want to thank people and certainly the staff for 22
their hard work on the forecasting area and the 23
contribution of the other agencies. Again, 24
there's been a lot of very solid technical 25
203
CALIFORNIA REPORTING, LLC 52 Longwood Drive, San Rafael, California 94901 (415) 457-4417
analysis done and giving us a strong record to 1
move forward. So, thanks, and certainly looking 2
forward -- again, certainly still time to do 3
written comments and we're certainly looking 4
forward to the written comments on the 5
forecasting and certainly I'm sure Chris will be 6
happy to work with people to try to help them 7
digest what's been done and changed over time. 8
COMMISSIONER MCALLISTER: Great. Thanks 9
very much and we're adjourned. 10
MS. RAITT: Thanks. 11
(Thereupon, the Workshop was adjourned at 12
4:08 p.m.) 13
--oOo-- 14
15
16
17
18
19
20
21
22
23
24
25