transbay corridor core capacity program train control
TRANSCRIPT

TRANSBAY CORRIDOR CORE CAPACITY PROGRAM
Train Control Modernization Project
California State Solutions for Congested Corridors Program California Transportation Commission
February 16, 2018
Applicant Agency: Metropolitan Transportation Commission
Implementing Agency:
San Francisco Bay Area Rapid Transit District


0
Contents 1 Project Overview ................................................................................................................................... 1
2 Project Description ................................................................................................................................ 2
3 Project Scope ........................................................................................................................................ 3
4 Purpose and Need ................................................................................................................................. 4
5 Project Benefits ..................................................................................................................................... 6
Travel Options ............................................................................................................................... 6
Environment.................................................................................................................................. 7
Local Community .......................................................................................................................... 8
Neighborhood Enhancement ........................................................................................................ 8
Co-Benefits .................................................................................................................................... 8
Public Health ......................................................................................................................... 8
Safety .................................................................................................................................... 8
Economy ................................................................................................................................ 9
Efficient Land Use................................................................................................................ 10
6 Current Congestion and Associated Impacts ...................................................................................... 10
Delay ........................................................................................................................................... 10
Person Throughput ..................................................................................................................... 13
Mode Choice ............................................................................................................................... 14
Reliability ..................................................................................................................................... 14
Vehicle Miles Traveled ................................................................................................................ 15
7 Project Cost Estimate .......................................................................................................................... 15
Leveraged Funds ......................................................................................................................... 16
8 Project Delivery Plan ........................................................................................................................... 16
9 Community Engagement .................................................................................................................... 17
10 Disadvantaged Communities .......................................................................................................... 18
11 Regional Plan ................................................................................................................................... 20
12 Corridor Plan ................................................................................................................................... 22
13 Cost Benefit Analysis ....................................................................................................................... 23
14 Conclusion ....................................................................................................................................... 24


1
1 Project Overview The Metropolitan Transportation Commission (MTC) is submitting this application to the Solutions for Congested Corridors Program in cooperation with the San Francisco Bay Area Rapid Transit District (BART) for BART’s Transbay Corridor Core Capacity Program – Train Control Modernization Project. This competitive grant proposal is for $100 million to fill a funding gap in BART’s train control modernization project. This project is located in the San Francisco Bay Area and will serve the entire BART system including new extensions to Santa Clara County and eastern Contra Costa County. The project will add much needed capacity and congestion relief to the Transbay Corridor, which includes the highly congested Bay Bridge (Interstate 80) and the Transbay Tube which carries BART trains. In addition to the Interstate 80 corridor, the BART system also provides a capacity relief alternative to the U.S. Route 101, State Route 24 and Interstate 880 corridors.
Figure 1: BART System Map
The estimated cost for BART’s Train Control Modernization Project (TCMP) is approximately $1.151 billion. Matching funds will be provided by a variety of sources, many of which are already committed, including BART’s Measure RR (a $3.5 billion general obligation measure passed by the voters in

2
November 2016), BART’s capital allocations (operating funds transferred to support BART’s capital program), federal formula and competitive funds, other state grant funds, and funds provided by the Santa Clara Valley Transportation Authority (VTA).
2 Project Description BART’s Transbay Corridor Core Capacity Program (TCCCP) is a comprehensive program of projects that will increase capacity, relieve congestion and crowding, increase transit ridership, and decrease greenhouse gas (GHG) emissions and vehicle miles traveled (VMT) by increasing the frequency and capacity of trains operating on the BART heavy rail system. The TCCCP will allow the number of trains operating through the Transbay Tube to increase from 23 to 30 per hour, and peak hour train lengths to be increased from an average of 8.9 cars to 10, maximizing throughput capacity in the most heavily used and most congested travel corridor in the San Francisco Bay Area. BART’s Transbay Corridor Core Capacity Program has four major project components: 1) the Train Control Modernization Project (TCMP); 2) an additional 306 new rail cars; 3) additional vehicle storage at BART’s Hayward Maintenance Complex (HMC); and 4) five new traction power substations. With this application, BART is requesting $100 million to close the funding gap for the train control modernization project. This application is for partial, but critical, funding to implement the most important component of the TCMP - a new communications-based train control system (CBTC). Currently in design, the CBTC is the linchpin of BART’s Transbay Corridor Core Capacity Program and is key to expanding capacity as well as enhancing system reliability and safety. In 2017, between 15 and 25 percent of all delayed trains were caused by problems with the existing train control system, which is over 40 years old. BART is proposing to completely replace its aging and obsolete equipment with a communications-based system (CBTC) which will allow trains to run closer together safely, thereby increasing system capacity. This new system, CBTC, is a fully-tested and operational system and is used all over the world including New York, London, Paris, Hong Kong and Denmark.
The four program elements of the Transbay Corridor Core Capacity Program will allow BART to decrease headways on each of the five BART lines from 15 to 12 minutes, thus increasing frequency by 25 percent. Expansion of the rail car fleet will allow for BART to put into operation additional trains of 10 cars, creating additional capacity in the system. The overall increase in peak hour capacity will be approximately 45 percent. BART estimates that these system-wide improvements through the TCCCP overall will result in an increased average weekday ridership of 203,000 riders beyond current levels and will decrease greenhouse gas emissions by at least 4,749,000 metric tons of carbon dioxide equivalent (MTCO2e) over a 50-year period.
Figure 2: Transbay Corridor

3
3 Project Scope BART’s Train Control Modernization Project (TCMP) will replace the existing train control systems with a new communications-based train control (CBTC) system, allowing BART to achieve the shorter headways needed to operate 30 regularly scheduled trains per hour on the trunk line, through the Transbay Tube, between Daly City and the Oakland Wye. The Oakland Wye is the segment of the BART network between the West Oakland Station, the 12th Street/City Center Station and the Lake Merritt Station, where trains coming from the Richmond, Pittsburg/Bay Point, Dublin/Pleasanton and Warm Springs lines converge before traveling in the westbound direction through the Transbay Tube to San Francisco and Daly City. The new CBTC system will be based on a moving-block signaling approach throughout the existing 112-mile system plus the Berryessa extension south of Warm Springs now under construction. The new CBTC system will be installed within or adjacent to the existing BART trackway and wayside facilities. Existing signaling equipment will be overlaid with the most current electronics, software, computer systems, and cabling. New zone controllers, interlocking controllers and wayside radio transponder tags will be installed throughout the trackside alignment, train control rooms and central control facilities. Cars and maintenance vehicles will be outfitted with processor-based controllers, transponders, communication equipment and location sensors.
Figure 3: Comparison of Existing vs. Modern Train Control Systems
Installation activities will include trenching for new cabling, concrete pads for electronic equipment along the trackway, as well as new racks, servers, computers, communication equipment and cable trays within the wayside train control rooms and central control facilities. These activities will take place within existing BART right-of-way.

4
4 Purpose and Need Ranked by population, the Bay Area is the fourth largest metropolitan area in the United States.1 In 2010, the nine-county region was home to more than 7.6 million people and 3.7 million jobs. Some 300,000 jobs are located in San Francisco’s central business district alone, the fourth largest central business district in the country.2 The Bay Area’s economy is healthy and growing, driven in part by the technology sector that is vital to growing the nation’s overall economy. Downtown San Francisco is undergoing large construction projects that will increase office space and enable the city to add more jobs. By 2040, the region expects 9.5 million residents and 4.7 million jobs to be located here.3
This rapid growth is reflected in the increased levels of congestion on Bay Area freeways. In September 2017, the Metropolitan Transportation Commission (MTC) released its yearly analysis of Bay Area freeway congestion. The analysis showed that congestion-related delays during weekday commute periods climbed 9 percent, from 3.2 minutes per commuter in 2015 to a record average of 3.5 minutes in 2016. MTC defines “congested delay” as the time spent in traffic moving at speeds of less than 35mph. The top two most congested freeway segments in the Bay Area both feed into the highly congested Transbay Corridor across the Bay Bridge (see Figure 6). Topping the list for the second year in a row is afternoon peak period travel northbound and eastbound on US Highway 101 and Interstate 80 from the Interstate 280 interchange in San Francisco to the Bay Bridge’s Yerba Buena Island Tunnel. Number two on the list is westbound Interstate 80 from State Route 4 in Hercules to Fremont Street in San Francisco. Congested conditions on this segment span the majority of the day from 5:25am to 6:55pm.
As the Bay Area’s second largest transit network, BART currently operates and maintains 46 stations and 112 miles of revenue track, serving over 440,000 passengers every weekday in the counties of Alameda, Contra Costa, San Francisco, and San Mateo.4 The Transbay Corridor is the only connection between many East Bay residential areas and jobs in San Francisco. It is the region’s most heavily used transportation link, carrying more than 40,000 trips per hour in the peak, two-thirds of which are made on BART’s two tracks crossing under the Bay (see Figure 4). Virtually all the remaining trips are in cars and buses that utilize the heavily congested San Francisco-Oakland Bay Bridge (Interstate 80).
On the main trunk of the BART system, from the Oakland Wye (junction in downtown Oakland where trains of all routes merge) through the Transbay Tube to Daly City, BART currently operates a maximum of 23 trains per hour in each direction. Train lengths vary, but currently average 8.9 cars per train in the peak. Between the East Bay and San Francisco, peak hour trains are crowded and ridership has been growing. As the system expands – extensions into Santa Clara County and eastern Contra Costa will open in 2018 – and as the core continues to attract development, tens of thousands of new riders are expected.
1 http://www.vitalsigns.mtc.ca.gov/population 2 As of 2010, American Community Survey 2006-2010 3 Plan Bay Area 2040, http://2040.planbayarea.org/sites/default/files/2017-07/Regional%20Forecast%20Supplemental%20%20Report_Final_7-2017_0.pdf 4 https://www.bart.gov/sites/default/files/docs/Role%20of%20BART%20in%20Region%20-%20Final%20Web%20Oct%202016_1.pdf

5
Figure 4: BART Share of Transbay Corridor Peak Travel Market
BART’s existing Transbay Corridor ridership exceeds capacity in the peak between the Embarcadero station in San Francisco and the Downtown Berkeley, Rockridge, and Bay Fair stations in the East Bay. Within this corridor, riders in the peak hour currently have an average of 5.2 square feet of space each, which is an uncomfortable level for passengers. The Transit Capacity and Quality of Service Manual published through the Transit Cooperative Research Program (TCRP) establishes 5.4 square feet of space per passenger as a comfortable loading level on U.S. rail transit systems. 5 The Federal Transit Administration (FTA) has adopted this as the threshold level of crowding for funding Core Capacity projects with Capital Investment Grant funds.
The most crowded part of the BART corridor is the five-mile-long Transbay Tube between the Embarcadero and West Oakland stations, where the average rider has just 4.7 square feet of space during the morning peak (see Figure 5), far less than the FTA threshold. Current BART riders endure uncomfortably crowded conditions, while some commuters choose other modes to avoid the crush-load conditions on some BART trains. BART’s ability to increase ridership – and the region’s ability to steer growth to places served by transit – depend upon additional BART capacity in the Transbay Corridor.
5 TCRP Report 165

6
Figure 5: Space per Passenger – AM Westbound Peak
5 Project Benefits BART’s TCCCP furthers the following five objectives of the Congested Corridors Program as described in the following sections:
• Travel Options: providing more transportation choices for residents, commuters and visitors • Environment: advancing the State’s air quality and climate goals • Local Community: preserving the character of the local community • Neighborhood Enhancement: creating opportunities for neighborhood enhancement projects • Co-Benefits: advancing program co-benefits of safety, economy and efficient land use
Travel Options The TCCCP furthers the objectives of the Congested Corridors Program by providing more transportation choices for residents, commuters and visitors. The Transbay Corridor is the only connection between many East Bay residential areas and jobs in San Francisco. It is the region’s most heavily used transportation corridor, carrying more than 40,000 trips per hour in the peak, two-thirds of which are made on BART’s two tracks crossing under the Bay. Virtually all of the remaining trips are in cars and buses that utilize the heavily congested San Francisco-Oakland Bay Bridge (Interstate 80). Bridge traffic is at capacity during peak periods, as is BART’s service on the current headways. Adding capacity through the Transbay Tube will allow more residents, commuters and visitors to shift from driving to

7
taking transit, providing more choices in the Interstate 80, U.S. 101, California State Route 24, Interstate 580 and Interstate 880 corridors.
Environment Consistent with the California Air Resources Board’s (ARB) Greenhouse Gas Quantification Methodology, CO2e emissions reductions for the first operational year (Yr1 - 2027) and the final operational year (YrF - 2076) of portions of the Transbay Corridor Core Capacity Program were estimated based on program operating data. GHG emissions reductions rely on the increased ridership estimates, which can be submitted upon request.
The table below summarizes the lifetime CO2e reductions, which were quantified assuming a 50-year program life. The Transbay Corridor Core Capacity Program life of 50 years is based on the expected service life of all elements of the program, with the main element being the CBTC system. The ARB GHG model included benefits from both the CBTC project, as well as 306 new vehicles which are part of the overall TCCCP. If requested, BART will complete a separate analysis estimating the GHG emissions reductions from the CBTC system alone.
Table 1: GHG Model Results
Pollutant Reductions Total GHG Reductions 4,748,900 MTCO2e Average Passenger VMT Reductions (miles/year) 525,263,200 VMT Reactive Organic Gases (ROG) 162,200 ROG Oxides of Nitrogen (NOX) 891,700 NOX Fine Particulate Matter (PM2.5) 27,500 PM2.5 Diesel Particulate Matter (DPM) 55,700 DPM
Based on the total GHG reductions over the lifetime of the Transbay Corridor Core Capacity Program (4,748,900 MTCO2e), the following equivalencies are expected6:
• Over 500 million gallons of gasoline consumed • Over 5 billion pounds of coal burned • Over 500 thousand homes’ energy use for 1 year • Nearly 11 million barrels of oil consumed
Additionally, GHG reductions from the program is equivalent to carbon sequestered by:
• Nearly 125 million seedlings grown for 10 years • Over 5 million acres of US forests in one year
If requested, the original GHG emissions model is available, as well as detailed methodology regarding the GHG model and ridership input estimates.
6 These equivalencies were calculated based on the EPA Greenhouse gas equivalencies calculator: https://www.epa.gov/energy/greenhouse-gas-equivalencies-calculator

8
Local Community The TCCCP also helps to further the Congested Corridors program objective of preserving the character of the local community. The Bay Area is becoming increasingly unaffordable and suffers from a severe housing shortage. In 2016, the BART Board of Directors adopted an affordable housing policy and performance targets setting a goal of 35 percent affordable housing on its station sites which could result in an additional 7,000 affordable units over the next ten years. In addition, the BART Board also adopted TOD land use strategies, which ensure that TOD opportunities are explicitly accounted for in the acquisition of new properties, the location of new station sites, and the design and construction of station facilities. It is estimated that the TOD Policy will offset GHG emissions by 24 percent versus conventional development. This means that if BART produces 20,000 units on its property versus elsewhere in Alameda and Contra Costa counties, households will drive approximately 24 percent less. Additionally, by supporting TOD in these areas, BART is contributing to the region’s Sustainable Communities Strategy goal of reducing per capita GHG emissions in 2035 by 16 percent. In order to support the increased number of residents living near BART stations, increased capacity will be needed on the BART system for those traveling on BART through the Transbay Tube.
Neighborhood Enhancement The project also helps to create opportunities for neighborhood enhancement projects. In addition to new housing units, the 22 TOD projects in which BART is currently engaged will bring 292,100 square feet of retail and 467,000 square feet of commercial space within walking distance of BART stations in the Bay Area. These developments will support local job growth that is transit-accessible, reducing VMT for commuting purposes. They will also enhance neighborhoods near BART stations by adding amenities.
Co-Benefits The TCCCP helps to further the Congested Corridors program objective of advancing program co-benefits of public health, safety, economy and efficient land use.
Public Health The project will improve public health by increasing ridership and improving regional air quality. By making BART service more comfortable, reliable, and convenient, the program will support ridership growth that displaces automobile travel. Reducing the number of miles driven by vehicles in the Bay Area improves air quality by reducing criteria pollutant emissions, which will improve respiratory health and other impacts throughout the region. Reductions in criteria pollutants is particularly important for communities located along high-traffic roadways. As 30 percent of BART stations are located within a disadvantaged community, and many more stations serve disadvantaged communities (are within a half mile), the public health benefits of the program are largely concentrated in these areas. The project also increases active transportation as transit riders are more likely to walk or bike to their station, thus increasing their activity levels and improving their health outcomes. For BART access, the fastest growing access modes are walking and biking.
Safety In 2016, over 33,000 traffic crashes resulting in fatalities, major injuries or minor injuries were reported on Bay Area roadways. Fortunately, over 90 percent of those crashes resulted in only minor injuries.7 However, every year, hundreds of lives are tragically lost on our region’s highways, arterials and local 7 http://www.vitalsigns.mtc.ca.gov/fatalities-crashes

9
streets. Compared to these roadway conditions, BART is a drastically safer travel option. In 2016, BART experienced only 4.5 station incidents per million patrons and 0.9 vehicle incidents per million patrons.8 Station incidents and vehicle incidents are all incidents that meet the FTA criteria as “reportable” (mostly injuries and illnesses) and occur either in BART station areas or on BART train cars.
It is estimated that the entire Transbay Corridor Core Capacity Program will lead to over 30 billion VMT reduced over 50 years, from 2027 to 2076 (31,633,289,073 VMT). This reduction in VMT will also reduce the amount of vehicle crashes, as fewer miles will be traveled on Bay Area roadways. Table 2 shows the immense safety and economic effects that the Transbay Corridor Core Capacity Program will have on the surrounding roadways over 50 years.
Table 2: Vehicle Crash Reduction and Vehicle Crash Reduction Cost Savings of TCCCP
Avoided Crashes Savings (2016$) Fatal Crashes 190 $2,049,837,000 Injury Crashes 9,174 $1,365,040,000 Property Damage Only Crashes 17,398 $168,764,000 TOTAL 26,762 $3,583,641,000
In total, the TCCCP is estimated to reduce VMTs by over 30 billion, avoid 26,700 crashes and save over $3.5 billion in vehicle crash cost savings per year. The estimates for avoided crashes and savings are based on numbers provided by the Cal-B/C v 6.2 Model. The Benefit Cost Model for this work can be provided upon request.
Beyond the safety benefits on roadways from reduced VMT, the TCCCP will further improve safety within the BART system. BART’s existing train control system, originally built over 40 years ago, is reaching the end of its useful life. The new CBTC system will use proven technology, ensuring that BART can operate more trains closer together, while maintaining the highest level of safety in train operation. Many systems worldwide have now converted to CBTC, such as the London Underground, the Paris Metro, portions of the New York City subway, and others, and BART will be following this path using fully tested and certified technology.
The TCCCP will also improve safety on BART platforms. Currently, during evening peak periods, the platforms at the Embarcadero and Montgomery stations in downtown San Francisco often become extremely crowded, particularly when there is a service disruption. Extreme crowding on the platforms can lead to unsafe conditions when people are too close to the platform edge. The new CBTC system will enable more frequent and longer trains, which will help to relieve crowding and improve safety on BART platforms.
Economy BART supports the Bay Area’s growing economy. Hundreds of thousands of commute trips are made on BART every weekday, saving commuters time and money, and connecting business with a larger pool of workers. Commuters traveling into San Francisco save on average 30 minutes each direction compared to driving. Commuters traveling to downtown Oakland save 7 minutes on average compared to driving
8 BART Fiscal Year 2017 Short Range Transit Plan and Capital Improvement Program

10
and those traveling to Pleasant Hill save 30 minutes on average.9 These travel time benefits help support the region’s major economic centers by connecting businesses with the workers they need. About a quarter of all workers in downtown San Francisco and Oakland use BART for their daily commute. BART makes 12 percent more workers available within an hour commute of Downtown San Francisco and 28 percent more within an hour commute of the West Dublin/Pleasanton station.10 Without investments in BART capacity to serve these important travel markets, the Bay Area’s economic competitiveness would suffer. Many new jobs would go to regions that enjoy shorter travel times and less crowding.
Because of the value BART provides, the land around BART stations sells and leases at a substantial premium, increasing property tax revenue to local government. At the same time, the money that the region invests in building and maintaining BART is reinvested in the Bay Area economy, further contributing to growth. Over the next 25 years, BART is expected to take on an even larger role in the Bay Area’s economy by helping to accommodate the region’s growth.
Efficient Land Use Sustaining high quality transit service is essential to supporting the regional plan for concentrating housing in places best served by transit. BART proactively supports Transit Oriented Development (TOD) on its property and around its stations. Twenty-two TOD projects are currently underway on BART-owned property near stations, representing over $3 billion in private investment. These projects will add 6,917 new housing units within walking distance of BART stations. In general, BART’s TOD Policy encourages and supports high quality TOD, including new housing within walking distance of BART stations.
6 Current Congestion and Associated Impacts The TCCCP will address the issue of congestion in the highly traveled, highly congested Transbay Corridor, and multiple state highway corridors that feed into the Transbay Corridor. The project meets the Congested Corridors objectives of reducing delay in the corridor, increasing person throughput, expanding mode choices, improving reliability, and reducing vehicle miles traveled by offering expanded transit capacity as an alternative to congested roadways.
Delay The Transbay Corridor is the most congested freeway corridor in the Bay Area (see Figure 6). The Metropolitan Transportation Commission (MTC) defines “congested delay” as the time spent in traffic moving at speeds of less than 35mph. According to this metric, the freeway segment with the most delay in the entire Bay Area is afternoon peak period traffic on northbound and eastbound U.S. 101 and Interstate 80 (I-80), leaving San Francisco across the Bay Bridge. The freeway segment with the second highest amount of delay is travel along westbound I-80 across the Bay Bridge into San Francisco. Congested conditions along this segment span from 5:25am to 6:55pm. It is the only segment among the region’s 10 most congested corridors to include a morning commute and is also the only segment to not have a mid-day break in congested conditions.11
9 2014 BART Customer Satisfaction Study, https://www.bart.gov/sites/default/files/docs/CustSat2014Report_Final.pdf 10 Economic Impacts of BART Operations, ALH Urban & Regional Economics, September 2015 11 https://mtc.ca.gov/whats-happening/news/bay-area-vital-signs-freeway-congestion-hits-new-record-0

11
Figure 6: Bay Area Freeway Corridors with Highest Levels of Congestion

12
As seen in Figure 6, BART parallels many freeway corridors throughout the Bay Area including I-80, U.S. 101, I-580, I-680, I-880, and SR-24. Without BART, freeway congestion would be even worse. An analysis was conducted to evaluate the impact of BART on freeway travel time and congestion using the MTC travel demand model. Figure 7 shows the results of this analysis. The chart shows typical commute times for various travel corridors throughout the Bay Area under conditions both with and without BART. Without BART travel times per segment would increase between 25 and 500 percent and between 20 minutes to three and a half hours. This analysis demonstrates that BART is a vital component to the Bay Area transportation network and is critical to addressing issues of delay and congestion throughout the region.
Figure 7: Comparison of Freeway Travel Times with and without BART
The Transbay Corridor is also the most congested segment of the BART system (see Figure 5). Train crowding conditions during peak periods on this corridor are extreme. Errors in BART’s aging train control system are a major cause of train delay. BART’s existing train control system was not built to handle BART’s current ridership demands. The current system can safely accommodate no more than one train every 2.5 minutes. The new CBTC system would allow trains to safely run closer together, which will decrease delays and is needed in order to run more frequent service between Oakland and San Francisco. Overall, the new CBTC will reduce the risk of severe or recurrent delays for the system’s growing number of riders. According to BART operations data, there were 647 delay events in 2017 that were caused by issues with the train control – accounting for a total of 41,050 minutes (684 hours) of delay (see Table 3). Considering the average train load for each one of these delayed trains, the person minutes of delay in 2017 related to train control issues was nearly 8.7 million minutes, or 144,700 total person hours of

13
delay. The new CBTC would drastically reduce the amount of delays related to train control, thus saving thousands of hours of person delay per year.
Table 3: Train Control Delay Events and Person Hours of Delay Calculation, 2017
Month Events Minutes of Delay Average Train Load (riders)
Person Minutes of Delay
January 2017 51 2,949 200 592,296 February 2017 48 5,261 218 1,149,969
March 2017 51 2,383 215 512,796 April 2017 57 2,717 211 573,660 May 2017 56 2,340 214 502,038 June 2017 63 2,190 214 470,456 July 2017 48 2,027 211 427,946
August 2017 48 6,197 214 1,330,199 September 2017 68 3,571 217 776,219
October 2017 67 3,050 216 660,999 November 2017 36 3,147 209 660,725 December 2017 54 5,218 196 1,023,292
2017 Total 647 Events
41,050 Total Minutes of Delay
8,680,600 Person Minutes of Delay
Person Throughput In 2015, overall peak-hour demand across the Transbay Corridor was 38,800 morning peak-hour trips, of which nearly 29,000 trips (75 percent) were on transit, an increase of 42 percent since 2010. According to transit schedules and operators stated policies for system capacities, the corridor had a capacity for 37,000 peak hour trips of which 27,000 could be carried on transit. This demonstrates that the corridor is currently over capacity and has an occupancy rate of 105 percent. BART carried 2/3 of the corridor capacity and operated at 110 percent of its policy standard for capacity.12 Growing at a medium rate from 2015, peak hour demand in the Transbay Corridor is forecast to increase by more than 14,000 trips by 2040. Planned projects during this period would increase capacity by 12,000 trips. Combined with the current shortfall in capacity (a shortfall of 2,000 trips), would lead to a future capacity shortfall of 4,000 trips.13 Future growth in demand will need to be met by transit due to capacity constraints on the bridge. Without new system capacity, BART will be unable to accommodate its share of growth in the region’s travel demand, pushing more commuters onto the roads, reducing access to jobs, and hindering regional economic growth. The situation is most acute in the Transbay Corridor, where the system is already at capacity for cars. To help meet growing regional demand, BART’s planned capacity 12 Bay Area Core Capacity Transit Study, https://mtc.ca.gov/sites/default/files/CCTS_Final_Report.pdf 13 Bay Area Core Capacity Transit Study, https://mtc.ca.gov/sites/default/files/CCTS_Final_Report.pdf

14
enhancements would add space for an additional 8,500 riders into San Francisco during the morning peak commute hour, an increase of 36 percent. Without BART investment, the system has no capacity to absorb these same riders in cars: to do so would require an additional 4,900 parking spaces in San Francisco and three new traffic lanes on the Bay Bridge in each direction.
Mode Choice The transit mode share on the Transbay Corridor is the highest in the Bay Area, particularly during peak periods. Seventy-five percent of morning peak hour trips in the corridor are on transit, which includes BART, AC Transit buses, and WETA ferries. BART carries the majority of these trips. Two-thirds of all peak hour trips in the corridor are on BART (see Figure 4), demonstrating the sheer advantage in carrying capacity of BART over the capacity of the Bay Bridge. The TCCCP will further increase BART capacity, shifting an even larger share of peak period travel to transit.
Reliability Many of the freeway corridors that parallel BART lines suffer from unreliability. A commonly used metric to describe reliability is the buffer time index (BTI). BTI is a multiplier for the extra time required beyond normal traffic. For example, if normal travel time on a freeway segment were 20 minutes, a BTI of 0.5 would mean that the traveler would need to budget 10 extra minutes per day (beyond the 20 minute normal travel time) to be confident of on-time arrival. The higher the BTI, the more unreliable the segment. MTC evaluated the BTI for all freeway segments in the Bay Area, by time of day.14 At 7am, the following freeway segments have a BTI greater than 0.5: westbound I-80 across the Bay Bridge, westbound I-580 towards the Bay Bridge, eastbound and northbound I-280 towards the Bay Bridge, northbound and southbound I-880 both to and from the Bay Bridge. The following freeway segments have a BTI greater than 0.5 at 5pm: both eastbound and westbound I-80 across the Bay Bridge, eastbound and northbound I-280 toward the Bay Bridge, both northbound and southbound U.S. 101 to and from the Bay Bridge, both westbound and eastbound I-580 to and from the Bay Bridge, eastbound California State Route 24 from the Bay Bridge. BART customer satisfaction surveys have consistently shown that reliability is an extremely important factor for BART riders. This is not surprising given the growing unreliability of other parts of the transportation system in the Bay Area. A major appeal for BART riders is knowing they can get to their destination on time. One advantage of BART is that it has its own segregated right-of-way and therefore does not have to compete with traffic congestion. However, reduced system reliability can quickly reduce rider satisfaction and impact ridership. Research has shown that travelers are more sensitive to travel time reliability than they are to travel time itself. BART measures reliability through an on-time performance metric. To be “on time” a train/customer must arrive at the destination station less than five minutes late compared to published schedules. BART is extremely proud of its on-time performance record. Between 2007 and 2015, BART maintained an average daily on time performance above 91 percent for trains and above 94 percent for customers. However, in 2015 this number dropped to 88 percent for trains and 92 percent for customers and
14 http://www.vitalsigns.mtc.ca.gov/travel-time-reliability

15
remained at those levels in 2016.15 A major reason for the drop in on time performance is the aging train control system, which is responsible for an estimated 25 percent of delayed trains. The TCMP will greatly improve system reliability by reducing delay incidents, thus enhancing confidence in the system which leads to further increased ridership.
Vehicle Miles Traveled The project will reduce vehicle miles traveled (VMT) on Bay Area roadways by making transit more attractive to existing and new riders. The increased capacity from the TCMP will increase BART peak period ridership by approximately 45 percent. Based on this ridership increase, an average trip length of 13.5 miles, and an adjustment factor for transit dependency of 291.516, this increased transit ridership will reduce VMT by an average of 525 million miles per year. Increased frequency and improved reliability will assist in retaining existing and attracting new riders to the system. Over the 50 year life of the project, this equates to approximately 30 billion vehicle miles reduced as a result of the project. Detailed models and methodology regarding ridership and VMT estimates are available upon request.
7 Project Cost Estimate The total estimated project cost for the Train Control Modernization Project is approximately $1.151 billion. Of that amount, $554.4 million is committed, and includes BART fare revenues and General Obligation bond funds. Uncommitted funds in the amount of $596.1 million include federal New Starts Capital Investment Grant Funds, funds from the Santa Clara Valley Transportation Authority (VTA) funds, and other Senate Bill 1 grant funds. Please see the chart in Appendix A, which shows the financial plan for the entire Transbay Corridor Core Capacity Program, including the TCMP portion of the project.
As stated previously the overall Transbay Corridor Core Capacity Program includes four elements – a new communication-based train control system, 306 additional rail vehicles, an additional rail vehicle storage and maintenance facility, and five additional traction power substations. BART is seeking Solutions for Congested Corridors Program funding for only one of these elements, the communications-based train control system (CBTC). The Program is currently at the 30% design stage, and cost estimates reflect this level of design, including appropriate level of contingency.
The CBTC system represents a usable segment of the Program, separate from the other Transbay Corridor Core Capacity Program components, and can be fully completed with funding through State of California SB1 and Cap-and-Trade grant programs in 2018. As can be seen in the chart in Appendix A, all funding elements have been secured (with the exception of Santa Clara VTA and FTA Capital Investment Grant (CIG) and GANs) other than the State of California funding sources. These state sources include:
• SB1 Local Partnership Program (submitted January 30, 2018) - $50 million • TIRCP Usable Segment Request (submitted January 12, 2018) - $318.6 million • SB1 Congested Corridor Program (current request) - $100 million
15 BART Fiscal Year 2017 Short Range Transit Plan and Capital Improvement Program 16 The factor of 291.5 is based on average ratio of systemwide annual trips to systemwide average weekday trips included in the BART ridership forecast (2018-2040).
16
The Santa Clara VTA portion of funding ($101.6 million) is not going to the Transbay Corridor portion of the Core Capacity Program, and only will be applied to the Santa Clara VTA extension of the BART system. Hence, the CBTC system can be implemented fully in the existing system (where ridership, GHG emissions, and other benefits are realized) without Santa Clara VTA funds. Additionally, the FTA CIG amount of $25.9 million that is allocated to the CBTC system can be fully shifted to be funded by BART Capital Allocation funds or Measure RR funds if CIG funding is not approved by the FTA. With the usable segment request of $318.6 million in TIRCP funds and $150 million in additional state program funding, the entire CBTC system is funded completely and can move forward without delay.
Leveraged Funds The proposed $100 million investment in Solutions for Congested Corridor Program funds in the communication-based train control project represents approximately 8.6% of the total cost of $1.151 billion. Every dollar of Solutions for Congested Corridor Program funds spent on the CBTC project leverages more than $11 million in other funds.
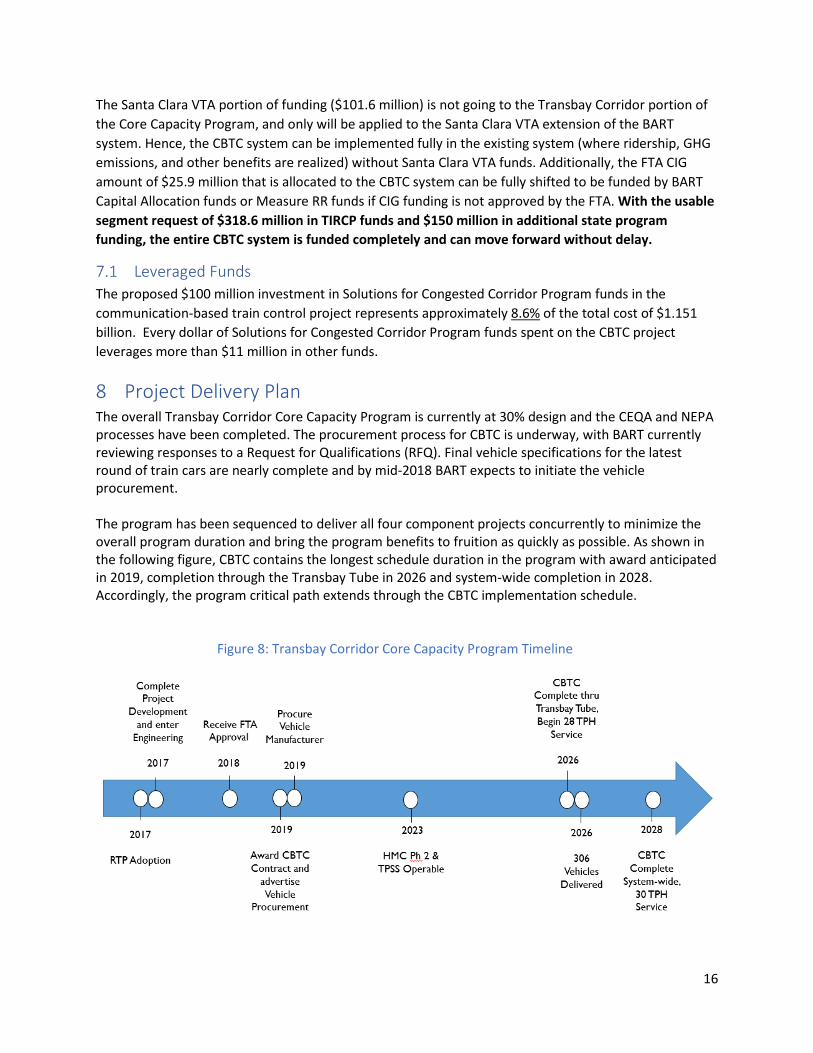
8 Project Delivery Plan The overall Transbay Corridor Core Capacity Program is currently at 30% design and the CEQA and NEPA processes have been completed. The procurement process for CBTC is underway, with BART currently reviewing responses to a Request for Qualifications (RFQ). Final vehicle specifications for the latest round of train cars are nearly complete and by mid-2018 BART expects to initiate the vehicle procurement. The program has been sequenced to deliver all four component projects concurrently to minimize the overall program duration and bring the program benefits to fruition as quickly as possible. As shown in the following figure, CBTC contains the longest schedule duration in the program with award anticipated in 2019, completion through the Transbay Tube in 2026 and system-wide completion in 2028. Accordingly, the program critical path extends through the CBTC implementation schedule.
Figure 8: Transbay Corridor Core Capacity Program Timeline

17
The Transbay Corridor Core Capacity Program is expected to be operational in 2026 for an initial frequency increase to 28 trains per hour, and then fully operational by 2028, with the deployment of CBTC system-wide, followed by a 2-year closeout period. BART is just over one year away from giving notice to proceed (NTP) to a CBTC supplier. The actual delivery schedule will be negotiated as part of that contract negotiation. The CBTC schedule anticipates that the CBTC system will be ready to demonstrate 28 train per hour capacity through the Transbay Tube by 2026 and begin 30 train per hour peak service by 2028. By the time 30 train per hour Transbay service is achieved, the new order of 306 additional vehicles will be delivered, HMC Phase 2 will be completed, and the new traction power substations will be operational.
Figure 9: Train Control Modernization Project Schedule
As part of the CBTC design process currently underway, BART has conducted a thorough analysis of the risks in fully delivering the CBTC project and has outlined specific mitigation strategies to minimalize the risk. The potential risks include: unforeseen site conditions, inadequate survey data, Oakland maintenance shop availability, unforeseen HAZMAT, proposer protests and BART staffing levels. By identifying these issues early in the design process, BART is prepared to implement the identified strategies including the performance of additional site and conditions surveys, organizational team management to ensure appropriate staffing and organizational readiness, and other tasks. A more complete summary of the potential delivery risks can be provided upon request.
BART has the project management skills, professional expertise and financial means to deliver this project, assuming funding is secured. Any cost overruns would be born solely by BART, paid for with BART fare revenues or additional funding through its Measure RR program.
9 Community Engagement BART has a long and successful history of interacting and working with social justice, environmental, community-based, faith-based, disability rights and other groups in the BART service area. BART has solicited input and sought ideas on a wide variety of both programs and projects – from the design of new rail cars, to station area improvements or development, to changes in fares and their potential impact. BART has successfully implemented a number of community-based grants such as Caltrans’ Environmental Justice grants, MTC’s Community-based Transportation Planning grants, as well as the successful Better BART outreach campaign in 2016.

18
BART’s outreach efforts are designed to ensure meaningful access and participation by minority, low income, and Limited English Proficient (LEP) populations and the Transbay Corridor Core Capacity Program provides benefits to these groups. BART’s Public Participation Plan (PPP) was developed in 2011 and followed extensive outreach throughout the BART service area and guides the organizations ongoing public participation endeavors. The PPP ensures that BART utilizes effective means of providing information and receiving public input on transportation decisions from low income, minority and limited English proficient (LEP) populations. As recommended in the PPP, BART has implemented a variety of outreach techniques for projects related to the Transbay Corridor Core Capacity Program. In 2014, BART launched its “Fleet of the Future” outreach campaign to obtain public feedback on the design of BART’s new vehicles. A series of ten events were held at BART stations and in local communities throughout the San Francisco Bay Area. Approximately 17,500 people attended the events and a total of 7,666 surveys were collected. BART staff consulted regularly with members of the disability community including the BART Accessibility Task Force (BATF), on the design and functionality of the new BART trains. The BATF provided hands-on feedback on all aspects of the car design. Outreach related to the 2014 BART Vision Plan engaged over 2,000 people in exploring the tradeoffs involved in considering how BART can meet its future needs. The public helped BART staff narrow down future projects and investments BART should focus on by determining which ones are most important to the public and fit best into BART’s goals of serving the Bay Area for years to come. A total of ten in-station events were held and a total of 2,551 surveys were collected. BART’s Title VI/Environmental Justice Advisory and Limited English Proficiency Advisory committees meet regularly to assist BART on all issues of policy with a focus on meeting the needs of minority and disadvantaged communities and riders. In November 2017, both committees received a presentation on the Transbay Corridor Core Capacity Program. In 2017, BART also partnered with MTC to conduct outreach on its Core Capacity Transit Study, a collaborative effort to improve public transportation to and from the San Francisco core. Outreach activities consisted of two public meetings to identify investments and improvements to increase transit capacity to the San Francisco Core. Approximately 80 people participated in the public meetings.
10 Disadvantaged Communities The many disadvantaged communities (DACs), low income communities, and other minority or at-risk communities located along the BART system will benefit from the increased frequency, greater capacity and reduced crowding gained from the Transbay Corridor Core Capacity Program.
Specifically, designated disadvantaged communities located along/within a half mile the BART line can be seen in the figure on the next page. In particular, the West Oakland Station, the last station before entering the Transbay Tube, is located in a disadvantaged community. In total, at least 15 of the over 50 existing and planned BART stations are located in disadvantaged communities. This is equal to 30 percent of all stations.

19
Figure 10: Disadvantaged Communities located within a Half Mile of the BART System

20
BART riders come from across the income spectrum and from the full diversity of the region’s racial and ethnic groups in rough proportion to their representation in the population of the BART district as a whole. Additionally, BART offers an essential travel option for people with disabilities, for youth and seniors, for those living in households without access to a car, and for whom daily driving would be an unaffordable expense. As the spine of the regional transit system, BART helps to make the Bay Area more affordable for lower-income households and is accessible to all.
Likewise, riders are as racially and ethnically diverse as the Bay Area’s population. By serving diverse populations, BART helps to knit the region together as one community. The racial/ethnicity composition of BART riders is very similar to that of the region, as evaluated based on Census data and BART Customer Satisfaction Survey results.
11 Regional Plan In July 2017, MTC adopted an update to its Regional Transportation Plan, called Plan Bay Area 2040.17 Drawing on the priorities of the previous regional plan, Plan Bay Area 2040’s investment priorities for the next 24 years are to operate and maintain the existing transportation system, modernize transit and roadways, and expand the system in strategic locations to accommodate growing job centers and Priority Development Areas. In the Bay Area, Plan Bay Area 2040 serves as the region’s Sustainable Communities Strategy (SCS), as required by Senate Bill 375, and integrates transportation, land use and housing to meet greenhouse gas reduction targets set by the California Air Resources Board (CARB).
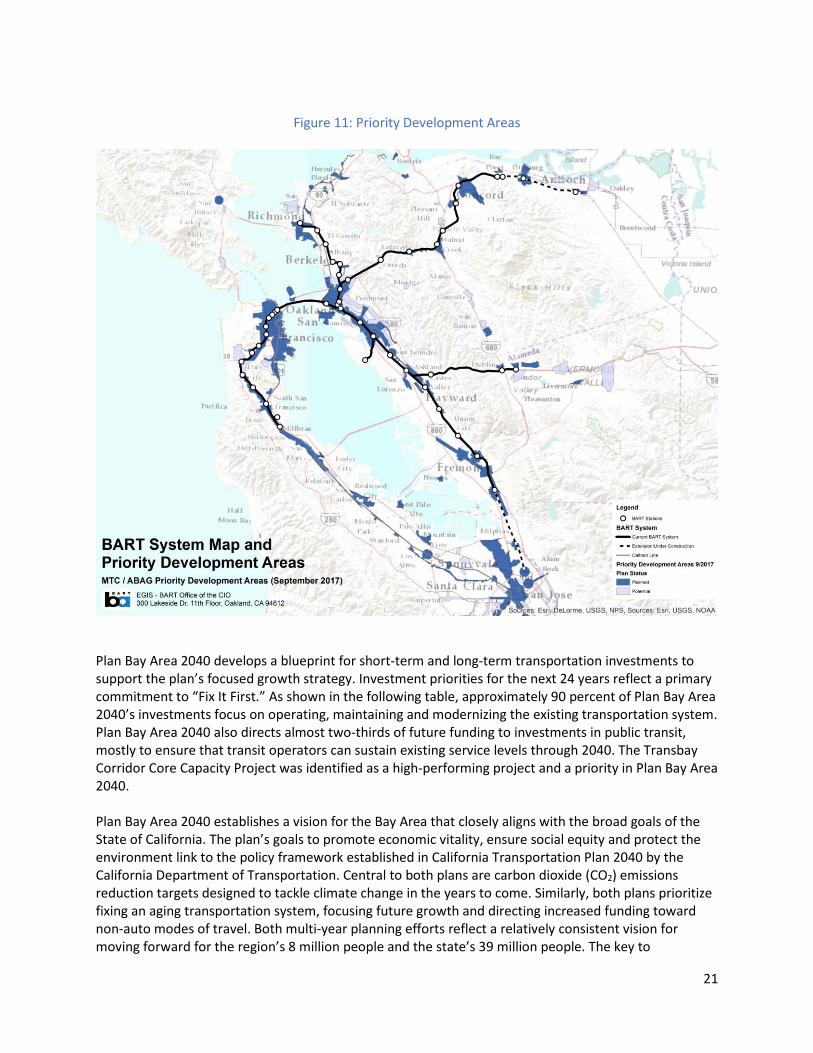
A key aspect of Plan Bay Area, which contains the Bay Area’s strategy for reducing GHG emissions, is to concentrate new housing and jobs in designated Priority Development Areas (PDAs) that are served by BART and other transit operators (see Figure 11). Plan Bay Area 2040 is both a transportation plan and a housing plan, and makes the case that the Bay Area currently has a housing crisis, with a need for a tremendous amount of additional affordable and other housing to support a growing population. Additionally, Plan Bay Area’s Sustainable Communities Strategy calls for a 33 percent increase in the share of housing units located in PDAs that are well served by transit, many of which are centered around BART stations. Sustaining high quality transit service is essential to supporting the regional plan for concentrating housing in places best served by transit. BART proactively supports Transit Oriented Development (TOD) on its property and around its stations. Twenty-two TOD projects are currently underway on BART-owned property near stations, representing over $3 billion in private investment. These projects will add 6,917 new housing units within walking distance of BART stations. In general, BART’s TOD Policy encourages and supports high quality TOD, including new housing within walking distance of BART stations. 17 Plan Bay Area 2040: http://2040.planbayarea.org/what-is-plan-bay-area-2040/
21
Figure 11: Priority Development Areas
Plan Bay Area 2040 develops a blueprint for short-term and long-term transportation investments to support the plan’s focused growth strategy. Investment priorities for the next 24 years reflect a primary commitment to “Fix It First.” As shown in the following table, approximately 90 percent of Plan Bay Area 2040’s investments focus on operating, maintaining and modernizing the existing transportation system. Plan Bay Area 2040 also directs almost two-thirds of future funding to investments in public transit, mostly to ensure that transit operators can sustain existing service levels through 2040. The Transbay Corridor Core Capacity Project was identified as a high-performing project and a priority in Plan Bay Area 2040. Plan Bay Area 2040 establishes a vision for the Bay Area that closely aligns with the broad goals of the State of California. The plan’s goals to promote economic vitality, ensure social equity and protect the environment link to the policy framework established in California Transportation Plan 2040 by the California Department of Transportation. Central to both plans are carbon dioxide (CO2) emissions reduction targets designed to tackle climate change in the years to come. Similarly, both plans prioritize fixing an aging transportation system, focusing future growth and directing increased funding toward non-auto modes of travel. Both multi-year planning efforts reflect a relatively consistent vision for moving forward for the region’s 8 million people and the state’s 39 million people. The key to

22
implementation will be working together across local, regional, state, and federal levels to achieve these shared goals.
Figure 12: Plan Bay Area 2040 Top Performing Projects
12 Corridor Plan BART’s Transbay Corridor Core Capacity Program is included in the Bay Area Core Capacity Transit Study (CCTS), released by MTC in September 2017.18 The study is a partnership between AC Transit, BART, Caltrain, WETA, SFCTA and SFMTA. It is a collaborative multiagency effort to examine the transit systems’ capacity limitations and to identify and prioritize the major investments needed to address these limitations today and in the future.
The CCTS focuses on improving transit capacity and connectivity to jobs in downtown San Francisco, the largest employment center in the region and the focus of regional transit ridership. San Francisco’s Core area draws workers from all parts of the region. The CCTS examines travel to the Core using two travel corridors: The Transbay Corridor, and the San Francisco Metro Corridor. The Transbay Corridor represents travel from the East Bay to San Francisco and is served by a variety of transit service options including BART trains in the Transbay Tube (which carry the majority of transit ridership and two-thirds of all travel through the corridor during the morning peak commute hour), AC Transit buses on the Bay Bridge, and WETA ferry service. The San Francisco Metro Corridor represents travel from within San
18 https://mtc.ca.gov/sites/default/files/CCTS_Final_Report.pdf

23
Francisco on BART trains; SFMTA buses, light rail and streetcars; and Caltrain trains on the city’s eastern edge.
The CCTS highlights the BART system as critical to the Transbay Corridor and that the full funding of the following projects are essential as a basis for moving forward:
• New and replacement BART cars • New train control and power system • New and expanded maintenance facility
Therefore this application for the TCCCP is critical to addressing congestion and providing transportation service along the Transbay Corridor.
13 Cost Benefit Analysis An economic benefit-cost analysis (BCA) of the entire Transbay Corridor Core Capacity Program was conducted using a model developed by WSP that incorporates the parameters outlined in Caltrans’ Life-Cycle Benefit-Cost Analysis Model 6.2 (Cal-B/C v.6.2). Because the different components of the TCCCP work together to generate the capacity improvements, the BCA evaluates the costs and benefits of the entire TCCCP. The analysis shows that the TCCCP will generate an estimated $5.6 billion in present-value benefits (2016$) over its expected useful life of 50 years, exceeding the expected TCCCP costs (capital and O&M) of $3.0 billion (discounted 2016$). With a benefit-cost ratio (BCR) of 1.86, the total TCCCP is expected to generate economic benefits that outweigh its costs. Table 4 outlines the results of the BCA over the full life of the TCCCP and in its first 20 years of operation. An Excel spreadsheet of the BCA model and supporting documentation are available upon request.
Table 4: Benefit Cost Analysis Summary Results
Benefit / Cost Total Value over Program Life (2016$, discounted at 4%)
Value over first 20 years (2016$, discounted at 4%)
Vehicle Operating Cost Savings $3,922 $2,336 Crash Reduction Cost Savings $944 $558 Emission Cost Savings $75 $43 Travel Time Savings $681 $431 Total Benefits $5,622 $3,368 Capital Costs $2,268 $2,268 Operation and Maintenance Costs $747 $479 Total Costs $3,015 $2,747 Benefit/Cost Ratio (BCR) 1.86 1.23 Net Present Value (NPV) $2,607 $621
*Results are shown in $ millions
The increase in ridership and the corresponding decrease in VMT described in previous sections will result in fewer greenhouse gas emissions, fewer automobile crashes, and lower vehicle operating costs, which have been estimated and monetized using the parameters laid out in Cal-B/C v. 6.2. The travel time savings calculation assumes that the change in headway from 15 minutes to 12 minutes will result

24
in the average current rider waiting 90 seconds fewer per trip (half of the decrease in headway). This figure does not account for additional time savings from reduced delays and reduced passenger queuing. Travel time changes for new riders were not included in the analysis.
14 Conclusion BART’s Train Control Modernization Project, as part of the larger Transbay Corridor Core Capacity Program, is a cost-effective project that provides important congestion relief, air quality, economic, and quality of life benefits for the San Francisco Bay Area, its residents and businesses, as well as for the State of California. The proposed project is a key component of the region’s Sustainable Communities Strategy for both reducing greenhouse gas emissions as well as providing intra- and inter-regional access, and mobility for millions of residents to jobs, social activities, medical care, school and university, shopping and other destinations. The BART system has served the Bay Area for over 40 years, and this project is critically needed to allow BART to continue its mission of providing the Bay Area with quality rail service for many years to come.