transaction based indices global real estate strategies ares 2015
TRANSCRIPT

ESTABLISHING A BLENDED GLOBAL REAL ESTATE INVESTMENT STRATEGY USING TRANSACTION
BASED INDICES
Alex Moss Consilia Capital
Nigel Almond DTZ [email protected]
American Real Estate Society Florida
April 2015

CONTENTS
• Background
• Purpose of the Study
• Data
• Methodology
• Results
• Summary
• References
2

BACKGROUND
• This latest study relates to, and follows on from, four previous studies.
• Performance implications of combining listed and unlisted real estate • Published: January 2014
• Purpose: to understand the performance of blending (global) listed and (UK) unlisted for a DC scheme.
• Returning to the core: rediscovering a role for real estate in defined contribution pension schemes. • Published: October 2013
• Purpose: to understand the role that real estate can play in a DC rather than DB scheme.
• Are listed real estate stocks managed as part of the real estate allocation • Published : August 2013
• Purpose: to understand how listed real estate is treated in the asset allocation process by practitioners.
• The use of listed real estate securities in asset management • Published: March 2013
• Purpose: to provide a comprehensive literature review of the impact of using listed real estate in asset management and summary of current practical applications.
3

BACKGROUND
• This paper seeks to provide a better understanding of the performance implications for investors who choose to combine listed real estate with an unlisted real estate allocation
• The catalyst for this paper was the recent report by the Pensions Institute which highlighted both the rationale for real estate in DC funds, and specifically, the use of a blended product by NEST, which combined a 70% (UK) unlisted allocation with a 30% global listed allocation, to provide this exposure. We call this 70/30 mix a DC Real Estate Fund.
4

BACKGROUND – WHY BLENDING ?
• Liquidity
• Cost
• Ease of implementation
• One of the key challenges for both asset allocators and product developers is how to provide real estate exposure in a mixed asset portfolio with acceptably high levels of liquidity and low levels of cost.
• Clearly, a 100% exposure to unlisted funds or direct real estate would not be expected to meet this demanding criteria.
5
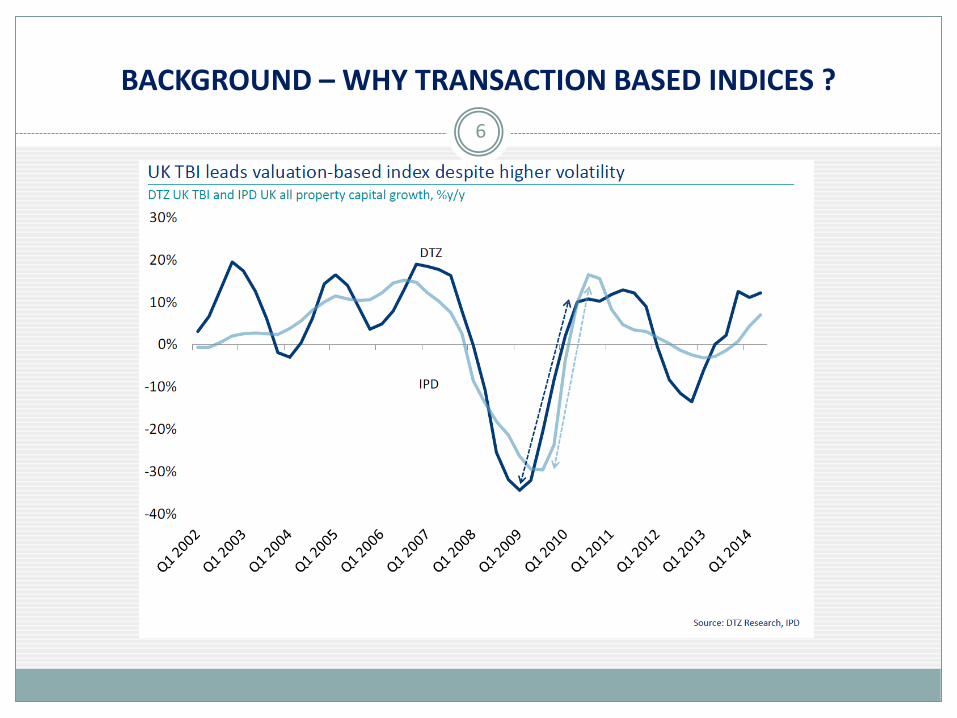
BACKGROUND – WHY TRANSACTION BASED INDICES ?
6

BACKGROUND – WHY TRANSACTION BASED INDICES ?
7

PURPOSE OF THE STUDY
The aim of the study is to answer the following questions: • Is the benefit to returns shown for incorporating global listed real estate
securities with a UK direct property fund also apparent if the direct property element comprises European, or Asian holdings?
• How does the performance impact change over the cycle?
• Is there a benefit to using transaction rather than appraisal based indices
8

DATA
• Listed real estate • Global Listed Real Estate – EPRA Global Developed Index • UK Listed Real Estate - FTSE EPRA/NAREIT UK Index • European Listed Real Estate - FTSE EPRA/NAREIT Developed Europe Index • Asian Listed Real Estate -FTSE EPRA/NAREIT Developed Asia Index
• Direct Real Estate • UK – DTZ TBI UK All Property Index • Europe – DTZ TBI Europe ex UK Index • Asia – DTZ TBI APAC Index
• Blended Portfolio = 70% Direct , 30% Listed
• Frequency: Monthly • Currency: LOCAL • Return: PRICE • Period: 2004-2014
9

FINDINGS UK DIRECT + GLOBAL LISTED (GBP)
0
50
100
150
200
250
UK direct Global listed 70/30
10

FINDINGS UK DIRECT + GLOBAL LISTED (GBP) ROLLING 12M
-60
-40
-20
0
20
40
60
80
UK direct Global listed 70/30
11

FINDINGS – EUROPE (x UK) DIRECT + GLOBAL LISTED (EUR)
0
20
40
60
80
100
120
140
160
180
200
Europe x UK direct Global Listed 70/30
12

FINDINGS – EUROPE (x UK) DIRECT + GLOBAL LISTED (EUR) ROLLING 12M
-60
-40
-20
0
20
40
60
80
Europe x UK direct Global listed 70/30
13

FINDINGS -ASIA PAC DIRECT + GLOBAL LISTED
0.00
20.00
40.00
60.00
80.00
100.00
120.00
140.00
160.00
180.00
200.00
Asia Direct Global Listed 70/30
14

FINDINGS -ASIA PAC DIRECT + GLOBAL LISTED ROLLING 12M
-80
-60
-40
-20
0
20
40
60
80
100
Asia Direct Global Listed 70/30
15

FINDINGS - QUARTERLY, ROLLING 12M and ANNUAL ENHANCEMENTS
UK Europe Asia
Q2 2002 0.11% 4.56%
Q3 2002 -2.31% -0.27%
Q4 2002 -4.48% -2.36%
Q1 2003 -0.29% -0.61%
Q2 2003 -0.16% -3.32%
Q3 2003 2.93% -0.05%
Q4 2003 2.75% 1.93%
Q1 2004 -0.24% 0.74%
Q2 2004 1.57% 5.70%
Q3 2004 -2.65% 0.55%
Q4 2004 1.35% 1.97%
Q1 2005 2.57% 1.50%
Q2 2005 -1.36% -2.44% 2.18%
Q3 2005 3.97% 2.21% 1.01%
Q4 2005 0.89% -0.64% -1.32%
Q1 2006 0.81% 0.17% 1.52%
Q2 2006 2.36% 2.69% -3.87%
Q3 2006 -3.74% -3.22% -0.23%
Q4 2006 1.40% 3.33% 4.01%
Q1 2007 1.29% 3.31% 1.88%
Q2 2007 0.50% 0.61% -1.41%
Q3 2007 -1.89% -1.25% 0.21%
Q4 2007 1.77% -0.23% -4.46%
Q1 2008 -0.27% -4.18% -2.65%
Q2 2008 2.26% -2.71% -3.94%
Q3 2008 0.29% -2.63% -2.37%
Q4 2008 2.17% 2.03% -5.46%
Q1 2009 -3.87% -6.91% -1.79%
Q2 2009 -7.21% -4.63% 7.42%
Q3 2009 4.11% 9.04% 6.75%
Q4 2009 7.09% 3.15% -0.29%
Q1 2010 -0.33% 0.98% -1.61%
Q2 2010 1.97% 0.94% -4.72%
Q3 2010 -1.56% -1.38% 2.59%
Q4 2010 0.91% 0.95% 0.91%
Q1 2011 0.91% 1.09% 0.13%
Q2 2011 -0.02% -0.89% 0.09%
Q3 2011 0.91% 0.85% -5.03%
Q4 2011 -3.54% -1.50% 0.56%
Q1 2012 2.80% 4.40% 1.22%
Q2 2012 2.80% 3.55% -1.18%
Q3 2012 0.89% 1.58% -0.12%
Q4 2012 -0.37% -1.19% 0.33%
Q1 2013 0.58% 0.93% 0.63%
Q2 2013 4.61% 2.03% -1.25%
Q3 2013 -1.85% -2.22% 0.55%
Q4 2013 -1.91% 0.09% 0.01%
Q1 2014 -1.36% -0.74% 0.81%
Q2 2014 -2.07% 0.17% 1.32%
Q3 2014 -2.43% 1.09% -2.12%
16 UK Europe Asia
Q1 2003 -7.18 -2.31
Q2 2003 -7.05 -2.13
Q3 2003 -2.14 -0.49
Q4 2003 4.53 -0.21
Q1 2004 4.70 6.48
Q2 2004 6.69 4.84
Q3 2004 1.25 7.25
Q4 2004 -0.13 9.92
Q1 2005 2.86 4.75
Q2 2005 -0.33 8.79
Q3 2005 6.47 4.57
Q4 2005 6.21 0.36
Q1 2006 4.60 4.06 4.00
Q2 2006 9.40 -3.60 -3.13
Q3 2006 0.01 0.13 -5.01
Q4 2006 0.62 4.75 2.08
Q1 2007 1.22 5.53 2.50
Q2 2007 -1.03 4.17 4.50
Q3 2007 1.19 2.48 4.61
Q4 2007 1.68 -5.21 -3.85
Q1 2008 -0.02 -12.28 -8.36
Q2 2008 1.75 -9.20 -11.38
Q3 2008 3.42 -10.08 -13.45
Q4 2008 3.83 -12.64 -13.30
Q1 2009 0.58 -9.73 -10.89
Q2 2009 -7.92 -3.60 -1.87
Q3 2009 -6.35 1.22 4.45
Q4 2009 -3.23 9.04 10.16
Q1 2010 1.87 15.83 13.42
Q2 2010 15.09 7.49 0.81
Q3 2010 8.01 -1.32 -4.92
Q4 2010 1.14 2.40 -3.33
Q1 2011 2.78 -2.65 -1.23
Q2 2011 0.22 -1.41 3.98
Q3 2011 3.41 -2.59 -4.15
Q4 2011 -2.45 0.10 -4.60
Q1 2012 -0.31 6.19 -3.71
Q2 2012 2.86 8.89 -5.26
Q3 2012 2.92 12.82 0.55
Q4 2012 7.57 7.23 0.27
Q1 2013 5.15 6.07 -0.37
Q2 2013 7.97 -0.32 -0.49
Q3 2013 3.91 -3.00 0.25
Q4 2013 1.56 -1.14 -0.08
Q1 2014 -1.06 -3.07 0.12
Q2 2014 -10.45 1.47 2.66
Q3 2014 -11.63 2.73 0.05
UK Europe Asia
2003 4.53 -0.21
2004 -0.13 9.92
2005 6.21 0.36
2006 0.62 4.75 2.08
2007 1.68 -5.21 -3.85
2008 3.83 -12.64 -13.30
2009 -3.23 9.04 10.16
2010 1.14 2.40 -3.33
2011 -2.45 0.10 -4.60
2012 7.57 7.23 0.27
2013 1.56 -1.14 -0.08

CONCLUSIONS AND NEXT STEPS
• The findings of this study are consistent with our previous work in the UK , showing
that combining global listed real estate exposure with a regional direct allocation to
Europe or Asia can enhance performance in absolute terms.
• The impact for Asian portfolios is less consistent, illustrating the different performance
dynamics and cycles relative to US, and UK/Europe.
• The benefit is noticeable at different stages of the cycle from the UK.
• By using transaction based indices we have significantly reduced the lag effect , which
potentially reduces the observed benefits of blending in nominal rather than actual
terms
• We believe that the next steps in the evolution of this integrated approach will be to
perform a more detailed analysis of the resultant risk metrics to provide risk adjusted
returns for the blended portfolio, as well as comparing results with those using an
appraisal based index.
17

Disclaimer
The information contained in this report was obtained from various sources. No representation or warranty, express or implied, is made, given or intended by or on behalf of Consilia Capital Limited or any of its directors, officers or employees and no responsibility or liability is accepted by Consilia Capital Limited or any of its directors, officers or employees as to the accuracy, completeness or fairness of any information, opinions (if any) or analysis (if any) contained in this report. Consilia Capital Limited undertakes no obligation to update or correct any information contained in this report or revise any opinions (if any) or analysis (if any) in the light of any new information. Notwithstanding the foregoing, nothing in this paragraph shall exclude liability for any representation or warranty made fraudulently. This report (including its contents) is confidential and is for distribution in the United Kingdom only to persons who are authorised persons or exempt persons within the meaning of the Financial Services and Markets Act 2000, or any Order made thereunder, or to persons of a kind described in Article 19(5) (Investment Professionals) of the Financial Services and Markets Act 2000 (Financial Promotion) Order 2005 (as amended) and, if permitted by applicable law, for distribution outside the United Kingdom to professionals or institutions whose ordinary business involves them in engaging in investment activities. It is not intended to be distributed or passed on, directly, indirectly, to any other class of persons. This report may not be copied, reproduced, further distributed to any other person or published, in whole or in part, for any purpose other than with the prior consent of Consilia Capital Limited. Whilst Consilia Capital Limited may at its sole and absolute discretion consent to the copying or reproduction of this report (whether in whole or in part) for your usual business purposes no representation or warranty, express or implied, is made, given or intended by or on behalf of Consilia Capital Limited or any of its directors, officers or employees as to the suitability or fitness of the report for the purpose to which you intend to put the report. The information, opinions (if any) and analysis (if any) contained in this report do not constitute, or form part of, any offer to sell or issue, or any solicitation of an offer to purchase or subscribe for, any securities or options, futures or other derivatives ("securities") nor shall this report, or any part of it, or the fact of its distribution, form the basis of, or be relied on, in connection with any contract. This report is intended to provide general information only. This document may not cover the issues which recipients may regard as important to their consideration, evaluation or assessment of the any of the securities mentioned herein, and where such issues have been covered herein no assurance can be given that they have been considered in sufficient detail for recipients’ purposes. This report does not have regard to any specific investment objectives, the financial situation or the particular requirements of any recipient. To the extent that this report contains any forward-looking statements, estimates, forecasts, projections and analyses with respect to future events and the anticipated future performance of the securities referred to herein, such forward-looking statements, estimates, forecasts, projections and analyses were prepared based upon certain assumptions and an analysis of the information available at the time this report was prepared and may or may not prove to be correct. No representation or warranty, express or implied, is made, given or intended by or on behalf of Consilia Capital Limited or any of its directors, officers or employees that any estimates, forecasts, projections or analyses that are used in this report will be realised. These statements, estimates, forecasts, projections and analyses are subject to changes in economic and other circumstances and such changes may be material. Potential investors should seek financial advice from a person authorised under the Financial Services and Markets Act 2000 who specialises in advising on the acquisition of securities. Investors should be aware that the value of and income in respect of any securities may be volatile and may go down as well as up and investors may therefore be unable to recover their original investment.
18