trait emotional intelligence: protecting health from the - core
TRANSCRIPT

Trait Emotional Intelligence: Protecting
Health from the Negative Impact of
Stress
Susan Jane Ould BSc (Hons)
A thesis submitted in fulfilment for the requirements
for the degree of Doctor of Philosophy
Sponsoring establishment
University of Central Lancashire
Preston
PR1 2HE
Submission date: July 2010

- ii -
DECLARATION
I declare that while registered for the research degree, I was with the University's
specific permission, an enrolled student for the following awards: The Teaching Toolkit
at the University of Central Lancashire; The PgC LTHE at the University of Cumbria. I
declare that no material contained in the thesis has been used in any other submission
for an academic award and is solely my own work.

- iii -
We can easily manage if we will only take, each day, the burden appointed to it. But
the load will be too heavy for us if we carry yesterday's burden over again today, and
then add the burden of the morrow before we are required to bear it.
John Newton
~~~~ ~~~~~~~~~~~~
Anyone can become angry, that is easy. But to be angry with the right person, to the
right degree, at the right time, for the right purpose, and in the right way- this is not
easy.
Aristotle
~~~~ ~~~~~~~~~~~~
Nerves and butterflies are fine - they're a physical sign that you're mentally ready and
eager. You have to get the butterflies to fly in formation, that's the trick.
Steve Bull

- iv -
This thesis explored the ability of two trait EI subscales [Emotional recognition and
expression (ERE), and Emotional control (EC)] to explain significant amounts of
unique variance in health variables. It asked first, whether the relationship between
trait EI and health was mediated by coping, social support or unhealthy behaviours;
and second, whether the harmful effect of stressor exposure on health was moderated by
trait EI subscales. The thesis focussed on two specific components of EI to aid
understanding of how specific elements of trait EI influence health, cross sectional and
longitudinal designs were used; both objective (salivary cortisol) and subjective (life
event inventory) measures of stress were used; personality, gender and age were
considered as control variables wherever the predictive power of EI was explored, and
health was explored as a multidimensional construct. Additionally, the selected trait EI
measure [the Swinburne University Emotional Intelligence Test (SUEIT; Palmer &
Stough, 2001)],was well matched to the ability EI model proposed by Mayer & Salovey
(1997) and did not include correlates of trait EI such as facets personality. Original
contribution to knowledge are; first, the longitudinal investigation of trait EI subscales
and health; and second, the exploration in a naturalistic setting of the capacity of trait
EI subscales to explain significant variance in cortisol reactivity, when personality,
gender and age were controlled.
Results revealed neither ERE nor EC could explain significant amounts of variance in
health variables (cross-sectionally or longitudinally), or in cortisol reactivity. However
both ERE and EC were found to moderate the relationship between life event stressor
exposure and health status. Moderational analyses revealed that, under a high
frequency of stressful events, health was worse when EI subscales were low. In
combination the results of these studies suggest that trait EI subscales ERE and EC are
predictive of health only under high stress conditions. This finding is contradictory to
the findings of recent meta analysis (Martins, Ramalho & Morin, in press), and
discussion suggests that the discrepancy may be because past studies have used trait EI
measures with content wider than the ability EI model (such as personality and
happiness), which increased predictive power but reduced theoretical understanding.

- v -
Table of Contents
Chapter One ..................................................................................................................................... 1
Chapter Two..................................................................................................................................... 6
2.1 Background of Emotional Intelligence.................................................................................. 6
2.1.1 Ability EI ................................................................................................................... 7
2.1.3 Comparing Trait and Ability EI ............................................................................... 12
2.1.4 Decision to explore Trait but not Ability EI ............................................................ 14
2.1.5 Explaining unique variance...................................................................................... 14
2.2 Negative impact of Stress on health: Environment, biology and psychology. .................... 14
2.2.1 The Stress process.................................................................................................... 15
2.2.2 Environmental factors: Methodological issues with measurement of stressors...... 16
2.2.3 Biology of stress responses ...................................................................................... 19
2.2.4 Psychology of stress responses: ............................................................................... 20
2.3 Evidence that EI protects health from the effects of stress.................................................. 24
2.3.1 EI: Protecting health from the negative impact of stressors .................................... 24
2.3.2 Evidence that EI influences physiological stress responses..................................... 27
2.3.3 Evidence that EI predicts coping influences on health ............................................ 30
2.3.4 Evidence that EI predicts behavioural influences on health .................................... 31
2.3.5 Evidence that EI predicts social support influences on health ................................. 32
2.3.6 Controlling for personality....................................................................................... 32
2.4 Summary.............................................................................................................................. 34
Chapter Three: Cross Sectional Investigation of Trait Emotional Intelligence, Life Stressors,
Coping and Health Outcomes ........................................................................................................ 36
3.1 Method................................................................................................................................. 36
3.1.1 Design ...................................................................................................................... 36
3.1.2 Participants and Procedure....................................................................................... 36
3.1.3 Materials .................................................................................................................. 37
3.2 Results ................................................................................................................................. 40
3.2.1 Missing data ............................................................................................................. 40
3.2.2 Data screening.......................................................................................................... 41
3.2.3 Background characteristics of the population.......................................................... 42
3.2.4 Intercorrelations between variables ......................................................................... 44
3.2.5 Analyses of variance and Regressions ..................................................................... 49
3.3 Discussion............................................................................................................................ 54
Chapter Four: EI and Health, Mediation by unhealthy behaviours, and moderation by EI of the
impact of life stress on Health........................................................................................................ 57
4.1 Method................................................................................................................................. 58

- vi -
4.1.1 Design ...................................................................................................................... 58
4.1.2 Participants and Procedure....................................................................................... 58
4.1.3 Materials .................................................................................................................. 59
4.2 Results ................................................................................................................................. 61
4.2.1 Missing data ............................................................................................................. 61
4.2.2 Data screening.......................................................................................................... 61
4.2.3 Background characteristics of the population.......................................................... 63
4.2.4 Intercorrelations between variables ......................................................................... 65
4.2.5 Regressional Analyses ............................................................................................. 69
4.3 Discussion............................................................................................................................ 73
Chapter Five: The Longitudinal Relationship Between Trait Emotional Intelligence and
Physical Health. ............................................................................................................................. 75
5.1. Method................................................................................................................................ 76
5.1.1 Design ...................................................................................................................... 76
5.1.2 Participants and Procedure....................................................................................... 76
5.1.3 Materials .................................................................................................................. 78
5.2 Results ................................................................................................................................. 79
5.2.1 Missing data ............................................................................................................. 79
5.2.2 Data screening.......................................................................................................... 80
5.2.3 Background characteristics of the final sample ....................................................... 80
5.2.4 Intercorrelations between variables ......................................................................... 85
5.2.5. Regressional analyses ............................................................................................. 91
5.2.6. Interpretation of significant interactions predicting Health T2............................... 96
5.2.7 Interpretation of significant interactions predicting Health T3................................ 96
5.2.8 Summary of all regressional findings ...................................................................... 97
5.3 Discussion............................................................................................................................ 98
Chapter Six: The relationship between Trait Emotional Intelligence and physiological responses
to stressors.................................................................................................................................... 100
6.1. Method.............................................................................................................................. 101
6.1.1 Design .................................................................................................................... 101
6.1.2 Participants............................................................................................................. 101
6.1.3 Procedure ............................................................................................................... 101
6.1.4 Materials ................................................................................................................ 102
6.2 Results ............................................................................................................................... 104
6.2.1 Data screening study 5 ........................................................................................... 104
6.2.2 Background characteristics of the population........................................................ 105
6.2.3 Interpretation of significant interactions predicting Energetic baseline mood. ..... 114
6.2.4. Summary of analyses ............................................................................................ 114
- vii -
6.3 Discussion.......................................................................................................................... 115
Chapter 7: Conclusions, limitations and directions for future research ....................................... 117
7.1 Overview of thesis ............................................................................................................. 117
7.2 Summary of research ......................................................................................................... 117
7.2.1 EI explaining unique variance in health................................................................. 117
7.2.2 Coping and social support as mediators of the relationship between EI and health118
7.2.3 Unhealthy behaviours as a mediator of the relationship between EI and health.... 119
7.2.4. EI moderating the relationship between trait EI and self reported health............. 119
7.2.5 EI as a predictor of cortisol reactivity.................................................................... 120
7.3 Emotional recognition and Expression, and Emotional control. ....................................... 121
7.4 Theoretical and practical implications of this research ..................................................... 122
7.4.1 Implications of Trait EI failing to explain significant variance in health. ............. 122
7.4.2 Implications of Trait EI moderating the stress health relationship ........................ 123
7.5 Limitations......................................................................................................................... 124
7.6 Conclusions ....................................................................................................................... 125
References.................................................................................................................................... 127
Appendix A – Justification of choice of Trait EI measure................................................................ i
Appendix B – Convergent Validity of the SUEIT........................................................................... x
Appendix C- Factor analysis of Brief Cope questionnaire ...........................................................xiii
Appendix D – A-priori calculations for power and sample size .................................................... xv

- viii -
List of Tables
Chapter 3
Table 3.1. Characteristics of sample for study one ....................................................................... 42
Table 3.2. Means and SD for SUEIT in study one sample & from technical manuals................ 43
Table 3.3. Correlations between Health subscales........................................................................ 44
Table 3.4 Correlations between Stressors and the coping and health subscales ........................... 44
Table 3.5. Relationships between trait EI (SUIET) subscales and personality............................. 45
Table 3.6 Correlations between Trait EI, social support, coping and health ................................. 47
Table 3.7 Identifying control variables for Path A: correlations between potential control
variables, EI subscales and related health variables....................................................................... 48
Table 3.8. Multiple regression models with EI subscales as predictors of health variables .......... 51
Table 3.9 Moderational analysis of the stress health relationship by EI subscales........................ 52
Table 4.1 Characteristics of sample ............................................................................................... 63
Table 4.2. Means and SD for SUEIT in study two sample & from technical manuals................. 64
Table 4.3. Relationships between trait EI (SUIET) subscales and personality............................. 65
Table 4.4 Correlations between Trait EI, unhealthy behaviours & health related quality of life . 67
Table 4.5 Correlations between Trait EI, unhealthy behaviours & social support. ...................... 67
Table 4.6 Identifying control variables for Path A: correlations between potential control
variables, EI subscales & related health variables ......................................................................... 68
Table 4.7 PATH A: Multiple regression models with EI subscales as predictors of health related70
QOL variables................................................................................................................................ 70
Table 4.8 Moderational analysis for Study 2 health variables. ...................................................... 72
Table 5.1 Cross time comparison for ERE and EC........................................................................ 77
Table 5.2 Characteristics of cohort ................................................................................................ 81
Table 5.3 [Continued] Characteristics of cohort ............................................................................ 82
Table 5.4 Means and SD for SUEIT in study four at the three time points & from technical
manuals. ......................................................................................................................................... 84
Table 5.5 Relationships between trait EI (SUIET) subscales and personality............................... 85
Table 5.6 PATH A: Correlations between Trait EI, Personality and health related quality of life
T2 ................................................................................................................................................... 88
Table 5.7 PATH A: Correlations between Trait EI, Personality and health related quality of life
T3 ................................................................................................................................................... 88
Table 5.8 Identifying control variables for Path A: correlations between potential control
variables, EI subscales and health variables T2 ............................................................................. 89
Table 5.9 Identifying control variables for Path A: correlations between potential control
variables, EI subscales and related health variables T3 ................................................................. 90
Table 5.10. PATH A: Multiple regression models with EI subscales as predictors of health
related............................................................................................................................................. 91
- ix -
QOL variables Time 2 ................................................................................................................... 91
Table 5.11 PATH A: Multiple regression models EI predicting health related QOL variables T392
Table 5.12 PATH B: Correlations between Trait EI, social support, and coping (at T1) ............. 92
Table 5.13. Moderational analysis for T2 health variables. ........................................................... 94
Table 5.14. Moderational analysis for T3 health variables. ........................................................... 95
Table 6.1 Characteristics of cohort in study 4 ............................................................................. 105
Table 6.2. Means and SD for SUEIT in study four cohort 1 & from technical manuals ............ 106
Table 6.3 Means and standard deviations for cortisol samples by stress condition..................... 106
Table 6.4 Means and standard deviations for mood samples by stress condition........................ 107
Table 6.5 Relationships between EI cortisol and mood for the high stress condition ................. 109
Table 6.6 Identifying control variables: correlations between potential control variables, EI
subscales, Cortisol reactions and Mood....................................................................................... 111
Table 6.7 Multiple regression models with Emotional Control as a predictor of Mood T2 ........ 112
Table 6.8 Moderational analyses for Study 4 cortisol and mood variables. ................................ 113
Table A1 Summary of Trait EI measures: coverage of EI domain, focus of content and
availability of psychometric data .................................................................................................... iv
Table A2 Mapping SUIET on to the ability model of EI................................................................ ix
Table B1 correlations between SUEIT TEIQue-SF and SSRI scale totals ....................................xii
Table C1 Brief Cope Factors ........................................................................................................ xiv
Table D1. A- Priori calculations of required sample size .............................................................. xv
- x -
List of Figures
Chapter 2
Figure 2.1 An heuristic model of the stress process designed to illustrate the potential
integration of the environmental psychological and biological approaches to stress .................... 16
Figure 2.2 the place of EI within a heuristic model of the stress process ...................................... 28
Chapter 3
Figure 3.1 Mediation of the relationship between EI and health status ......................................... 49
Figure 3.2 Interaction between Stress and Emotional Control predicting Perceived General
Health............................................................................................................................................. 53
Figure 3.3 Interaction between Stress and Emotional Recognition & Expression predicting
Frequency of GP Check ups .......................................................................................................... 53
Chapter 4
Figure 4.1 Mediation of the relationship between EI and health status ......................................... 69
Chapter 5
Figure 5.1 Mediation of the relationship between EI and health status ......................................... 86
Figure 5.2 Interaction between Stress and Emotional Recognition & Expression predicting Low
Activity T2..................................................................................................................................... 96
Figure 5.3 Interaction between Stress and Emotional Recognition & Expression predicting
Days Healthy.................................................................................................................................. 96
Figure 5.4 Interaction between Stress and Emotional Recognition & Expression predicting days
T3 Exercise .................................................................................................................................... 97
Figure 5.5 Interaction between Stress and Emotional control predicting days T3 Exercise....... 97
Chapter 6
Figure 6.1 Interaction between Stress condition and Emotional control predicting Energetic
Mood at baseline (T1).................................................................................................................. 114
- xi -
ACKNOWLEDGEMENTS
I would like to thank everyone who has helped and supported me during the completion
of my PhD. Particular thanks go to my supervisors Dr. Pamela Qualter and Dr Mark
Roy for their help and advice over the past few years. Thanks also to my friends for
their laughter and understanding, my family for keeping me motivated and to my
partner Richard for his love, encouragement and wisdom.

- 1 -
Chapter One
Emotional Intelligence (EI) comprises inter and intra-personal skills which relate to
perceiving, regulating, understanding and using emotions (Mayer & Salovey, 1997).
Since its formal proposal (Salovey & Mayer, 1990), the construct has been the subject
of controversy as protagonists disagree over both definition and measurement.
However, this has not prevented EI from being the subject of much investigation, or
reduced claims of its importance as a factor which impacts positively on important life
outcomes. For example, research findings have revealed that high EI can protect
individuals from the physiological impact of stressors (Mikolajczak, Roy, Luminet,
Fillee, & De Timary, 2007), reduce avoidant coping (Parker, Taylor & Bagby, 1998),
promote social support quality (Austin, Saklofske & Egan, 2005), and aid positive
health (Mikolajczak, Luminet & Menil, 2006).
This thesis investigated the relationship between trait EI, stressor exposure and health,
with the aim of refining and expanding past research. The current research expands
understanding of the association between EI and health in the following ways: first, it
investigates whether the relationship between stressor exposure and health was
moderated by trait EI; second, it explores whether the relationship between EI and
health was mediated by coping, unhealthy behaviours, or social support; and third, it
focuses on two specific components of EI [Emotional recognition and expression (ERE)
and Emotional control (EC)] rather than using global scores, this aids understanding of
how specific elements of trait EI influence health. Both objective (salivary cortisol) and
subjective (life event inventory) measures of stress were used; personality, gender and
age were considered as control variables wherever the predictive power of EI was
explored, and health was explored as a multidimensional construct.
Study 1 aimed to explore whether ERE or EC subscales of trait Emotional Intelligence,
as measured with the Swinburne University Emotional Intelligence Test (SUEIT:
Palmer & Stough, 2001), could explain unique variance in health outcomes. Further, it
investigated the mechanisms behind the positive association between EI and health.
Previous literature proposed three possibilities: (1) that ERE and EC influence coping
styles, which in turn impact on health; (2) that ERE and EC are predictive of social
support, which in turn influences health; or (3) that ERE and EC moderate the effect of
stress on health. Analyses sought evidence of an association between the EI subscales

- 2 -
and health and tested whether ERE and/or EC moderated the impact of stressor
exposure on health. Results revealed that neither ERE nor EC could explain significant
amounts of variance in health; therefore no further mediational analyses were
conducted. Moderational analyses revealed that ERE and EC moderated the
relationship between stress and health; interaction plots showed that under high stress,
health was better when trait EI subscales were high (perceived health was better when
EC was high, and health as measured by GP visit frequency was better when ERE was
high). The discussion considers whether the lack of cross sectional findings are the
result of the health measure used and this leads to a more comprehensive measure being
used in studies two and three. Additionally, it is noted that longitudinal investigation is
required to strengthen and further explore findings.
The aims of study 2 were to extend study 1 by improving the health measure used, and
by investigating whether the relationship between EI and health was mediated by
unhealthy behaviours such as drinking, smoking, and drug taking. This is an extension
of study 1 as unhealthy behaviours can be considered aspects of disengaged coping if
the purpose of them is to reduce feelings of anxiety. Additionally, if ERE or EC were
predictive of unhealthy behaviours, this could provide evidence of a mechanism
between EI and health, so even if EI subscales could not explain variance in health cross
sectionally it would provide information about longitudinal processes. The investigation
explored whether the relationship between trait EI and health could be explained either
by the mediating presence of unhealthy behaviours and social support, or by EI
moderating the relationship between stressor exposure and health. The health measure
from study 1 was replaced by a more comprehensive health measure, the health related
quality of life questionnaire (HRQOL; Hennessy, Moriarty, Zack, Scherr, & Brackbill,
1994). In addition to unhealthy behaviours (smoking, alcohol consumption and drug
taking), social support subscales were investigated as mediators of the relationship
between EI and health. Results revealed that trait EI could not explain a significant
amount of unique variance in health variables. Furthermore, correlational analyses
revealed only one significant relationship between EI and unhealthy behaviours,
something which suggests that unhealthy behaviours do not explain the relationship
between EI and health. This finding is contrary to recent review findings that Low EI is
associated with more intensive smoking, alcohol use and illicit drug use, moreover
reporting that subscales relating to ‘emotion regulation’ and ‘decoding and
differentiating emotions’ were the most important factors (Kun & Demetrovics, 2010).

- 3 -
Potentially this discrepancy is an artefact of the current study using a focussed trait EI
measure which does not include correlates of EI such as happiness, optimism and social
skills. Moderation analyses did not reveal any significant interactions between EI and
stress when predicting health, and therefore study 2 finds that EI does not moderate the
relationship between stress and health.
The aim of study 3 (chapter five) was to extend studies 1 and 2 by investigating the
longitudinal relationship between Emotional intelligence and health. The study asked if
ERE and/or EC moderated the relationship between stressful life events and health, and
whether the relationship between ERE or EC and health was mediated by coping or
social support. Results revealed that ERE explained a significant amount of variance in
health at time two (T2) as measured by illness reducing daily activity but was not
predictive of health time three (T3). As ERE was not significantly related to social
support or coping, no further mediational analyses were undertaken. Moderational
analyses revealed that EI subscales significantly moderated the relationship between
stressor exposure and health. Interaction plots reveal that under high stress conditions,
health was best for those with high trait EI, such that participants under high stress at T1
but with higher ERE had the higher number of healthy days and illness impacted on
their daily activities least at; further, participants under high stress at T1 undertook most
exercise at T3 when they had high ERE and EC. Discussion suggests that EI subscales
may only be beneficial to health under high stress conditions. Therefore, study four
explores whether EI can moderate the relationship between EI and cortisol reactivity
under the influence of a stressful task.
The aims of study 4 were to extend studies 1 to 3 by investigating whether EI
moderated the relationship between the acute stress of a public speaking task and related
cortisol and mood reactions. Two experimental groups (1-high stress, 2- control group)
completed mood questionnaires and gave saliva samples. The first group (high stress)
were students giving assessed presentations for course assessment in front of their
peers; the second group (controls) were non-presenting members of the class.
Participants gave saliva samples and completed mood questionnaires once before and
twice after the stressor. Saliva samples were later assayed to establish their cortisol
concentrations. Analyses revealed that neither ERE nor EC could explain significant
amounts of unique variance in cortisol levels, and that neither subscale moderated the
relationship between stress condition and cortisol. However, EC was found to moderate
- 4 -
the relationship between stress condition and mood: under high stress those with high
EC report less energetic mood at stressor onset (baseline), suggesting that EC is helpful
in maintaining composure. Discussion suggests that incongruence with previous
research investigating trait EI and cortisol (Mikolajczak et al., 2007; Salovey et al.,
2002), can be explained by the current studies use of a naturalistic setting, considering
age gender and personality as controls, and using a narrower measure of trait EI.
This thesis provides an original contribution to knowledge by exploring the relationship
between trait EI and health in several unique ways: First, this thesis examines the
longitudinal relationship between EI and health, investigating coping and social support
and mediators, and asking if EI can moderate the relationship between stressor exposure
and health. No previous research has examined the relationship between EI and health
longitudinally. Second, the experimental cortisol study presented in chapter 5 explores
whether EI can explain unique variance in cortisol reactivity. This study is conducted
using a measure of EI which is a good match to the ability EI model, and instead of
using global scores focuses on two theoretically interesting subscales ERE and EC.
Furthermore it considers personality as control variables and uses a naturalistic rather
than a lab based setting for the experiment. Of the two previous studies to have
investigated the relationship between trait EI and cortisol, both used inferior measures,
one failed to control for personality, and both used experimental lab based protocols.
Overall, this thesis has found that trait EI subscales of Emotional Recognition and
Expression (ERE) and Emotional Control (EC) are unable to explain significant
amounts of unique variance in health variables or cortisol reactivity. This thesis
concludes that research using trait EI measures with focussed content (that is content
limited to the ability model as proposed by Mayer & Salovey, 1997), controlling for
personality, gender, and age where appropriate, and exploring cortisol in naturalistic
settings are unable to predict health variables. Whether tests of EI should contain
elements wider than the EI model is an issue distinct from predictive power. Future
research should aim to provide evidence that focussed measures of trait EI have
predictive power and incremental validity, and further, aim to consider individual
subscales or branches of EI to provide greater theoretical understanding of how EI
influences other constructs. Further, it should be noted that measurement of cortisol
change is only one physiological measure of health and others, (i.e., heart rate, blood
pressure, and measures of immunity such as SiGA) should be investigated to provide

- 5 -
support for the findings here. Moreover, although EI may show effects in cortisol
response to stress in the laboratory, results of study 4 suggest that trait EI does not have
the same significant relationship when people are exposed to real life stressors; future
research should aim to further understand the impact of trait EI on stress reactions in
naturalistic settings. It is important to understand these nuances to understand how EI
may impact on physical health. Stress is ubiquitous in work and educational settings, so
it is worthwhile investigating how EI might protect from its negative effect on health.

- 6 -
Chapter Two.
2.1 Background of Emotional Intelligence
Although a relatively new construct, emotional intelligence (EI) has its roots in a
century of research on intelligence. Early precursors of EI can be credited to Thorndike
(1920, cited Burns, Bastian & Nettlebeck, 2007) for his work on social intelligence;
Gardner (1983, 1993) for considering both interpersonal and intrapersonal intelligence;
and to both Leuner (1966, cited Bar-On, 2004) and Payne (1986, cited Mayer, 2001) for
first using the term Emotional Intelligence. EI was formally proposed in the seminal
paper by Salovey and Mayer (1990), as the ability to accurately appraise, express, utilise
and manage emotions in oneself and others. This definition was later refined (Mayer &
Salovey, 1997) as “ the ability to perceive emotions, to access and generate emotions so
as to assist thought, to understand emotions and emotional knowledge and to
reflectively regulate emotions so as to promote emotional and intellectual growth”
(p.10). In this way, EI is defined as a skill, and is referred to as ‘ability EI’ (Petrides,
Pita & Kokkinaki, 2007). This 1997 model was proposed as having four key
interrelated abilities: perceiving, using, understanding and managing emotions.
EI attracted most interest after the 1995 publication of a book by Daniel Goleman,
where it was treated as a range of characteristics including personality and motivation.
This publication made unsubstantiated claims that EI mattered more than intelligence in
predicting a range of life outcomes, including career success, happiness and social
standing (Matthews, Zeidner and Roberts, 2002). As academics sought greater scientific
rigour and evidence to support Goleman’s claims, EI soon became the focus of
academic research seeking to refine and shape the construct. During this wave of
enquiry, a second proposed definition of EI was put forward; this interpretation
considered EI to be a constellation of emotion related self perceived abilities and
dispositions, located at the lower levels of personality hierarchies (Petrides & Furnham,
2001). In this way, EI was defined as a facet of personality. This second ‘type’ of EI is
now referred to as ‘trait EI’.
This divergence in definition of EI continues, with proponents of EI as a traditional
intelligence (‘ability EI’) advising that the construct should be assessed with an
objective test similar in style to an intelligence test. Meanwhile, supporters of EI as a

- 7 -
personality trait (‘trait EI’) suggest that a self report methodology is more suitable. At
present, neither the ‘ability’ nor ‘trait’ conceptualisation of EI have prevailed as most
dominant in research publications; indeed, both propositions of EI require confirmation
that they have predictive power. Therefore, both ‘types’ of EI are acceptable in current
use provided that researchers understand the technical differences between ability and
trait EI. These are discussed in more detail below.
2.1.1 Ability EI
The ‘Ability’ model
In developing a model of EI (now considered to be ‘Ability EI’ model), Mayer and
Salovey (1997) sought to identify the abilities which link cognitive processes with
emotion, and emotion with thinking. This review lead to the proposition of the four
component model of EI described above, containing four branches: branch one,
perception appraisal and expression of emotion; branch two, understanding and
analysing emotion and employing emotional knowledge; branch three, reflective
regulation of emotions to promote emotional and intellectual growth; and branch four,
emotional facilitation of thinking.
The overlap of Ability EI with Intelligence
As the original conceptualisation of EI emerged from the literature on intelligence,
ability EI is considered by it’s protagonists as a cognitive ability and a correlate of
intelligence (Mayer & Salovey, 1997). For this reason, in seeking convergent validity,
ability EI measures have been correlated with intelligence tests and assessments of other
aspects of cognitive ability. Such research has found that ability EI significantly
overlaps with cognitive ability (O’Connor & Little, 2003); and while some authors
consider this to be evidence of construct validity (Roberts, Zeidner & Matthews, 2001),
others have concluded that ability EI has little unique predictive power (Schulte, Ree &
Caretta, 2004). In replying to an article which summarized evidence for the validity of
the MSCEIT, Brody (2004) argued that there was no single reported study, which had
controlled for personality and intelligence, that found nontrivial incremental validity for
a socially important outcome. This statement is supported by meta-analysis (Van Rooy
& Viswesvaran, 2004) finding that ability EI did not evidence incremental validity
(explain unique variance) over general mental ability (GMA). More recent evidence
has subsequently reported that the MSCEIT can explain a significant and moderate to

- 8 -
large amount of unique variance in alcohol use with personality and intelligence
controlled (Rossen & Kranzler, 2009).
Measurement of Ability EI
Proponents of ability EI consider EI to be a skill based on cognitive processes; objective
measurement is thus appropriate. In assessment akin to an IQ test, each test item has
‘correct’ answers; these answers are deemed correct either by a panel of expert judges,
or by seeking population consensus. Proponents for ability measures of EI posit that
these tests measure actual emotional ability while trait measures assess an individual’s
own perceived ability, so ability EI measures have better construct validity (O’Connor
& Little, 2003). That said, as construct validity is about divergence between the latent
construct and the measured construct, and as definition of the construct is not agreed
upon, this argument is a duplication of dispute over conceptualisation. A further
criticism of ability EI is that tests assess knowledge of emotion, but do not test the
ability to perform tasks based upon that knowledge, (Brody, 2004).
Giving ‘correct’ answers to ability EI tests creates problems which stem from the
consensus and expert scoring. Consensus scoring is problematic, as a test cannot be
both normally distributed and reliable (MacCann, Roberts, Matthews & Zeidner, 2004)
because it is not feasible for consensus tests to discriminate above average ability. It
should be possible for someone of high EI ability to have a correct but non consensual
answer, yet this is not possible. Moreover, it is problematic in the interpretation of
scores. For example, if a population shows evidence of gender or ethic differences in
their typical answers, it is equivocal as to which group should be considered ‘correct’
and therefore have the highest score (Roberts, Zeidner & Matthews, 2001). Also, as
results reflect the social appropriateness of responses, some authors consider that
consensus scoring is merely measuring a form of conformity (Roberts, Zeidner &
Matthews, 2001).
Expert scoring of ability EI tests is also problematic: first, because it makes supposition
of the most adaptive emotional response to any given situation (Petrides & Furnham,
2000); and second, because it is not possible to operationalise a test of ability EI which
comprehensively assesses the EI domain. For example, the aspects of EI such as
intrapersonal understanding of emotion cannot be tested (Petrides, Furnham &
Mavroveli, 2007).
- 9 -
It should be noted that some proponents of ability EI assert that ability EI can be
measured through self-report testing (Mayer, Salovey & Caruso, 2000c). For example
Schutte’s Self-Report Emotional Intelligence Test (SREIT; 1998) is based on the ability
model proposed by Mayer and Salovey (1997), and attempts to measure four EI
subscales (emotion perception; managing self relevant emotions; managing others
emotions; and utilizing emotions). Although this measure is based on an ability model,
other authors refer to this measure as an operationalised example of EI as a personality
trait (Matthews, Zeidner & Roberts, 2002). Such critique is based on the SREIT having
large overlap with personality traits (r= .31 to r= .62; Bastian, Burns & Nettlebeck,
2005), significant correlation with other self report measures (r=.43, Bracket & Mayer,
2003), significant correlation with self efficacy (Kirk, Schutte & Hine, 2008), and low
correlations with ability measure the MSCEIT (Goldenberg, Mathesson, Mantler, 2006;
Bracket & Mayer, 2003).
Difficulty with categorising the SREIT is an example of the confusion between
theoretical and methodological aspects of the field of EI. Petrides and Furnham (2000)
make the distinction between ‘ability’ and ‘trait’ EI based upon method of
measurement; they consider a self report questionnaire ‘trait EI’ and a maximal
performance test an ‘ability EI’ test. This categorisation is unrelated to the distinction
of ‘ability’ and ‘mixed’ models, made by Mayer et al (2000) who state that a ‘mixed
model’ is one which mixes cognitive ability with other characteristics. In agreement
with the distinction made by Petrides and Furnham, the position of the current research
programme is that self report assessments measure trait EI, while objective assessments
attempt to measure ability EI. However, contrary to Petrides and Furnham (2000), the
position of this thesis is that trait EI measures should still seek to include content which
matches the Mayer & Salovey 1997 ability model.
The reliability of the MSCEIT, a measure of Ability EI has found the test to have
acceptable internal reliability of above .75 (Mayer, Salovey, Caruso & Sitarenios,
2003), although this is lower than the reliability of cognitive tests, which range from
.85, (Kaplin & Saccuzzo, 2004) to .95 (Murphy & Davidshofer, 2005).
Given the extensive issues listed above, it is debateable whether the predictive power of
an ability EI test could outweigh theoretical and methodological problems. In addition
- 10 -
to the issues raised above, ability EI overlaps with measures of intelligence, and the
issues relating to this are considered below.
Measurement of Ability EI using the MSCEIT
There are a number of issues with the only comprehensive measurement of ability EI,
the Mayor Salovey Caruso Emotional Intelligence Test (MSCEIT) which makes its use
problematic: (1) there is no other comprehensive measure of ability EI; (2) it takes too
long to administer.
The MSCEIT is the only comprehensive measure of ability EI which assesses skills
across the four theoretically described dimensions proposed by Mayer and Salovey
(1997), and this has been commented on by a number of researchers as problematic (e.g.
Rivers, Bracket, Salovey & Mayer, 2007). It is desirable to compare comprehensive
measures to investigate the extent to which variances in participant responses are a true
reflection of variance in their emotional intelligence. While there is no other
comprehensive ability EI tests, there are tests which measure individual aspects of
ability EI, such as either perception or understanding of emotion (these are reviewed
both by MacCann, Matthews, Zeidner & Roberts, 2004; and Rivers et al, 2007).
Branches one, two and three of the Ability model (Mayer & Salovey, 1997) could be
assessed in this way, although there is limited evidence for the convergent validity of
conceptually related ability measures with the MSCEIT (Rivers et al., 2007). However,
at present no alternative to the MSCEIT has been identified as an effective way to
measure branch four ‘emotional facilitation of thinking’. Currently, then, it is not
possible to test the MSCEIT for convergent validity with other ability EI tests, across all
the dimensions proposed by Mayer and Salovey (1997).
Research exploring the value of ability EI as a predictor variable will find it problematic
that the ability measure MSCEIT takes a long time to administer. Participants with
lower concentration skills might be expected to obtain lower scores both on the
MSCEIT and other outcomes, because results were confounded by attentional deficits
rather than because of a real relationship between ability EI and academic achievement
(Matthews, Zeidner & Roberts, 2002).

- 11 -
2.1.2 Trait EI
The ‘Trait’ model
In opposition to the ability model, a trait model has been put forward (Petrides, 2001),
which considers trait EI to be a group of affect-related traits (Petrides & Furnham,
2003). Petrides’ trait model claims to encompass variance of two kinds: one portion
drawn from higher order dimensions of established personality taxonomies (e.g., Big
Five, Giant Three) and one portion of variance that lies outside these dimensions. In
operationalising trait EI (using the trait EI questionnaire; TEIQue) Petrides & Furnham
include subscales measuring happiness, self esteem, optimism and social competence.
However, not all authors are in agreement of how appropriate this is, and consider such
breadth inconsistent with what measures of EI should attempt to assess. For example
self esteem (included in the TEIQue; Petrides, 2001; Petrides & Furnham, 2003) does
not directly measure emotion or intelligence or their intersection (Matthews et al., 2004,
p. 185, cited Mayer Salovey & Caruso, 2008). Further, it seems illogical to decide to
include optimism in a measure (i.e. the TEIQue, 2001) and then control for personality
when using it (E.g. Petrides, Perez-Gonzalez, & Furnham, 2007; Mikolajczak, Luminet,
Leroy & Roy, 2007).
The overlap of Trait EI with Personality
Trait EI is a range of non cognitive traits and theoretically should correlate with
personality measures (Bar-On, 1997; Petrides & Furnham, 2001). Empirical evidence
shows that self report measures of EI tend to have a significant overlap with personality
measures (O’Connor & Little, 2003; Davies, Stankov & Roberts, 1998; Dawda & Hart,
2000), which has lead to critique that trait EI lacks divergent validity from the construct
of personality (Davies, Stankov, & Roberts, 1998). For this reason authors have argued
that when testing EI for predictive power, personality should be controlled; it
establishes whether EI makes a distinct contribution in predicting outcomes (Brody,
2004). In line with this movement, the current programme of research will measure the
big five personality factors to establish the extent to which measures of trait can explain
unique variance in outcome variables.
Measurement of Trait EI
Proponents of trait EI consider the construct to a set of behavioural dispositions and
self-perceived abilities (Petrides and Furnham, 2001). As such, it is a low order
personality trait, in other words, trait EI is viewed to be a facet of personality, distinct

- 12 -
but with less predictive power than the big five or Eysenckian three (Petrides, Pita &
Kokkinaki, 2007). For this reason, several authors (E.g. Bar-On & Parker, 2000) assert
that trait EI should be assessed using self report measures, where measures ask
participants to confirm the extent to which they are able to perceive, understand,
regulate and use emotional information.
Trait EI is criticised for the following reasons: (1) for measuring perceived rather than
actual emotional intelligence, and requiring self insight on the part of the participant
(Ciarrochi, Forgas & Mayer, 2001); (2) for allowing answers to be distorted by
participants who wish to appear more emotionally skilled (Ciarrochi, Chan, Caputi &
Roberts, 2001); (3) for lacking utility on the grounds that the large overlap of trait EI
with personality means the development of the construct has little practical advantage
(Roberts, Zeidner & Matthews, 2007); (4) given that trait EI demonstrates low
correlation with cognitive ability and high correlation with personality, it lacks
convergent and construct validities (Van Rooy, Viswesvaran & Pluta, 2005); and (5) on
psychometric grounds, since trait EI is not sufficiently distinct from personality to
demonstrate discriminant validity (Daus & Ashkanasy, 2005).
Further, it seems paradoxical to expect people low in EI to have sufficient emotional
insight to be able to rate their own ability (Matthews, Emo, Roberts & Zeider, 2006).
Research findings support this criticism, as studies comparing self-reported versus
objectively measured emotion perception have found no significant relationship
(Ciarrochi, Deane & Anderson, 2002).
Despite these criticisms, self report measures of EI are widely used in current EI
research. Therefore, further psychometric information about them should still be
sought. Data for predictive power of competing trait EI tests is still desirable as such
data will provide evidence of the extent to which individual tests provide idiosyncratic
results.
2.1.3 Comparing Trait and Ability EI
In summary of the above, trait EI measures perceived emotional intelligence, while
ability EI measures claim to assess actual emotional skill. Both may be important, but
independent, predictors of life outcomes; perceived skill may be just as important as
actual skill. However the two divergent conceptualisations are not suited to being
- 13 -
compared to assess convergent validity of emotional intelligence for three reasons: (1)
the measures are not significantly associated; (2) different control variables are required
for each type of EI; and (3) measures do not predict the same outcomes.
Due to their theoretical differences it is not appropriate to compare trait and ability
measures to seek convergent validity. The divergence in conceptualising EI is reflected
in research findings that only low correlations exist between measures of trait and
ability EI (O’Connor & Little, 2003; Warwick & Nettelbeck, 2004). While trait EI is
expected to have convergence with personality, ability EI should converge with
cognitive skills. Indeed, a meta analysis found that the relationship between EI and
General Mental Ability (GMA) is considerably stronger when using an ability measure
of EI (.33) rather than a trait measure (.09), a difference so substantial that the authors
posit that it is likely that different constructs are being measured (Van Rooy &
Viswevaran, 2004). This finding also supports the conclusion of a previous comparative
study (O’Connor & Little, 2003). Additionally, this meta-analysis revealed that ability
EI evidenced incremental validity over personality but not over GMA, although GMA
did evidence incremental validity over ability EI. This may suggest that trait measures
of EI have greater ability to explain unique variance in outcomes.
A further reason not to compare trait and ability measures of EI is the empirical finding
that they do not converge to predict the same outcomes. For example, ability but not
trait EI was found to predict social competency when personality was controlled for
(Brackett, Rivers, Shiffman, Lerner & Salovey, 2006), while Goldenberg, Matheson and
Mantler, (2006), found that trait but not ability EI predicted coping style and depressive
affect. Furthermore, ability but not trait EI has been found to be predictive of education
and receiving psychotherapy (Goldenberg et al. 2006). In combination, this evidence
suggests that trait and ability EI are discrete constructs. Therefore, it is not appropriate
to compare them to seek evidence of the convergent validity.
In conclusion, when reviewing Emotional Intelligence research, care should be taken to
note which type of EI has been assessed, and which measure used. It cannot be
assumed that findings from ability EI can be replicated with trait EI.

- 14 -
2.1.4 Decision to explore Trait but not Ability EI
The current study explores trait but not ability emotional intelligence for a number of
theoretical reasons: (1) it is not possible to operationalise a test of ability EI which
comprehensively assesses the EI domain; (2) it is impossible to compare the results of
the MSCEIT with other ability measures, due to there being no other comprehensive
measure of ability EI, or if looking at branches separately, no measure which can assess
branch 4. Therefore, comparison of ability EI measures to assess comparative
predictive power is not possible, and neither is seeking evidence of convergent validity.
This means that ability EI does not have the same theoretical appeal as trait EI; and (3)
it is useful for future research to have comparative data on competing measures of trait
EI. A substantial proportion of published EI research uses trait EI, presumably for
reasons of time, cost and ease of implementation. Testing measures of trait EI is
therefore desirable because there is a lack of data exploring the predictive power of the
extant range of trait EI measures (Gardner & Qualter, 2010).
2.1.5 Explaining unique variance
Since the publication of Goleman’s (1995) book, there has been a litany of studies
investigating the power of EI to explain variance in a range of different outcomes.
Initially these studies regularly failed to use sufficient scientific rigour; i.e. failing to
control for intelligence (therefore not establishing incremental validity), and were
therefore criticised on the grounds that this failed to confirm the utility of EI (Matthews,
Zeidner and Roberts, 2002). For this reason a large proportion of new studies in the
field responded, measuring and controlling for personality when investigating trait EI.
2.2 Negative impact of Stress on health: Environment, biology
and psychology.
The studies presented in this thesis are designed to investigate the extent to which trait
emotional intelligence (EI) is associated with health. The rational for this is as follows:
exposure to stressors is negatively associated with health (Turyk et al., 2008), although
there are individual differences in susceptibility to the health damaging effects of stress
(Kessler et al., 1985). It is therefore desirable to understand protective factors; EI is
posited to be such a factor protecting against either the behavioural or physiological
affects of stress. To introduce these concepts fully, first stress and its influence on
- 15 -
health is discussed. This is followed by discussion considering the empirical evidence
linking EI and health.
2.2.1 The Stress process
The study of stress investigates the process of an individual dealing with environmental
demand. Confusingly, researchers tend to use the word ‘stress’ to mean either the
stressor, or the stress response experienced by an individual (Cohen, Kessler & Gordon,
1997). In the current research programme, to avoid confusion, the environmental
demands will be referred to as the stressor, and the outcome will be referred to as the
stress response.
The transactional model of stress developed by Lazarus and Folkman (1987) introduced
the idea that psychological appraisals of both the environmental demand and of
individual resources to deal with stressors are key antecedents of stress responses.
Contemporary models of stress build on this transactional model and comprise three
components of the stress process: (1) Environmental factors; (2) Biological factors; and
(3) Psychological factors (Cohen et al, 1997). The environmental perspective looks at
how the characteristics of stressors or major life events impact upon an individual’s
health and well being; biological perspectives consider individual differences in patterns
of physiological activation; and psychological perspectives consider how individual
differences in perception and evaluation of the environmental demands. These three
aspects of the stress process are integrated in models of stress as represented in figure
2.1, as illustrated by Cohen et al, 1997 (p.10).
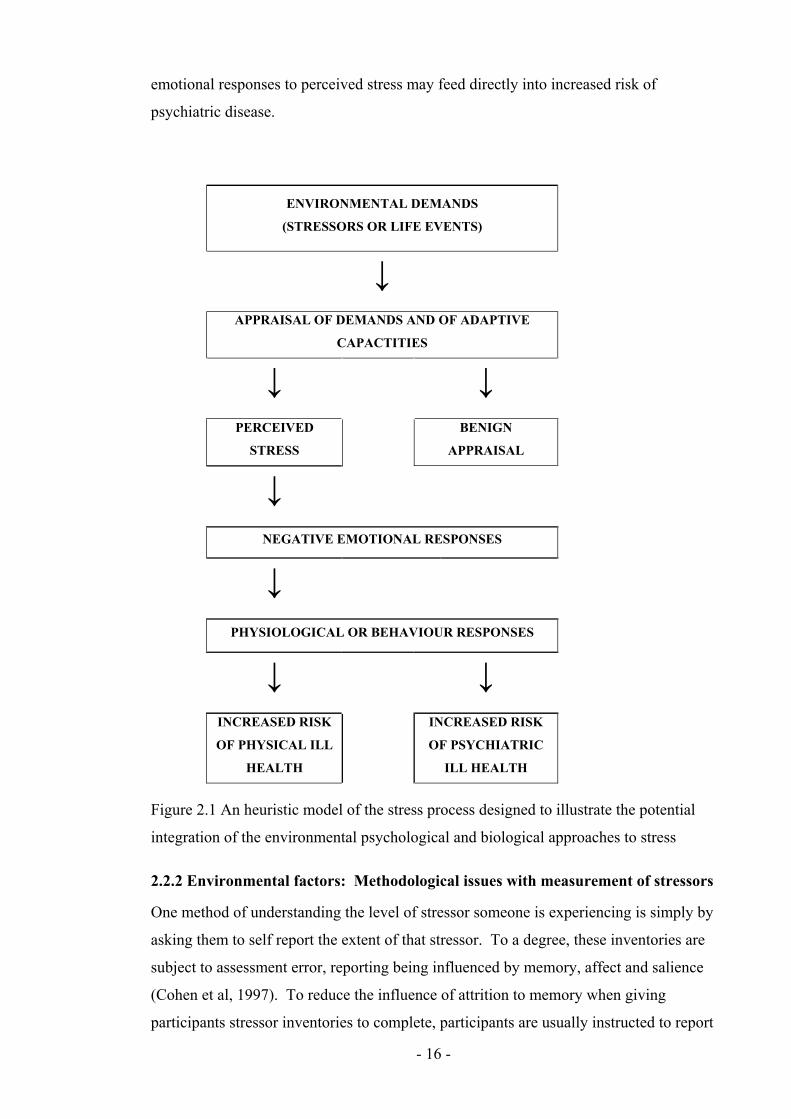
This model is transactional in nature as it splits the stress process into causal
antecedents, mediating factors, and outcome effects. Antecedents include
environmental demands (including situational demands, resources, and ambiguity of
harm); appraisal includes the assessment both for stressor to impact upon the
individual, and for the individual to meet the demands this creates; physiological
responses can include increased heart rate, blood pressure or elevated cortisol levels;
finally, behavioural responses to stress may included any coping thoughts or behaviours
employed by the individual. While this heuristic model is presented as unidirectional,
there may be feedback loops or short cuts; for example, environmental demand may
directly illicit a physiological or behavioural responses. Additionally, negative
- 16 -
emotional responses to perceived stress may feed directly into increased risk of
psychiatric disease.
ENVIRONMENTAL DEMANDS
(STRESSORS OR LIFE EVENTS)
↓ APPRAISAL OF DEMANDS AND OF ADAPTIVE
CAPACTITIES
↓ ↓ PERCEIVED
STRESS
BENIGN
APPRAISAL
↓
NEGATIVE EMOTIONAL RESPONSES
↓
PHYSIOLOGICAL OR BEHAVIOUR RESPONSES
↓ ↓ INCREASED RISK
OF PHYSICAL ILL
HEALTH
INCREASED RISK
OF PSYCHIATRIC
ILL HEALTH
Figure 2.1 An heuristic model of the stress process designed to illustrate the potential
integration of the environmental psychological and biological approaches to stress
2.2.2 Environmental factors: Methodological issues with measurement of stressors
One method of understanding the level of stressor someone is experiencing is simply by
asking them to self report the extent of that stressor. To a degree, these inventories are
subject to assessment error, reporting being influenced by memory, affect and salience
(Cohen et al, 1997). To reduce the influence of attrition to memory when giving
participants stressor inventories to complete, participants are usually instructed to report

- 17 -
major life events that have occurred within a recent time span, usually the past year (e.g.
the life events questionnaire; Paykel, 1983). Scales are often used rather than
interviews to keep biases to a minimum. Such scales ask respondents to indicate the
extent of the stress they have felt in various areas of their lives. Such measurements are
less susceptible to underreporting of stress than open ended questionnaires or
interviews.
Whether one uses inventories or scales, researchers have the option to ask either about
event frequency (i.e. to indicate which events have occurred, e.g. Holmes and Rahe,
1967), or severity (i.e. to report on a likert scale the extent of anxiety of panic the
stressor caused; e.g., Rand, Hoon, Massey, Johnson, 1990). The latter can be
problematic as asking participants to report perceived stress can confound the objective
assessment of the stressor with subjective experience of stress, making it difficult to
separate stimulus and response (Ogden, 2007). For this reason it is often preferable to
measure frequency rather than severity of stressor events (Cohen et al, 1997).
An alternative traditional approach was for researchers rather than participants to weight
particular events as more or less stressful (Marks, Murray, Evans, Willig, Woodall &
Sykes, 2005) Weighting means that some events are considered to be more or less
important, serious, or imposing of change. However, this becomes problematic as the
salience of the items to the individual cannot be presumed by the researchers (Cohen et
al, 1997). Additionally, there is no evidence that weighted indices produce greater
correlations with outcome (Zimmerman, 1983). For these reasons the current study will
not use event weightings.
Life events stressors
The main type of inventories used in assessing self reported stress, and used by the
current studies, are life event inventories. Pioneering research on the stressful life events
that people experience was undertaken by Holmes and Rahe (1967), the results of their
work led to the construction of a life events inventory which aims to capture the
frequency of events experienced. Life events scales ask participants to indicate which
events from a list have happened within a set time frame (typically within the past year).
These events may relate to the following areas: work (unemployment, retirement, job
change); financial matters (financial difficulties); health (illness of self or family
members); legal matters (victim of crime, bringing or facing legal action); or domestic

- 18 -
arrangements (marriage, divorce, becoming a parent, moving home). A high event score
is seen as signifying a high demand on them for adaptation (Marks, Murray, Evans,
Willig, Woodall & Sykes, 2005). Event stressors may include positively toned events
such as marriage and holidays; although positive in tone, some events still evoke
significant demand. While negative events may play a greater role in stress related
illness (Lazarus, 1999), those creating a scale or inventory cannot presume to know
which life events the individual will find to be positive or negative experiences, hence
scales contain both aspects.
An alternative to the life events scale, the daily hassle scale was later put forward
(Kanner, Coyne, Schaefer & Lazarus, 1981) to capture the day to day stresses that
people are exposed to. Both daily hassles and life events scales are criticised equally for
the reporting biases that they are prone to, however these biases (particularly mood) are
consider to impact more significantly on reporting of daily hassles than on life events
(Ogden, 2007).
Life event stressors as an influence on health
Exposure to stressful life events has been found to be predictive of illness (e.g. Theorell
&Rahe, 1975; Turyk, Hernandez, Wright, Freels, Slezak, Contraras, Piorkowskie, &
Persky, 2008). Also, there are individual differences in susceptibility to the health
damaging effects caused by environmental stressors (Kessler, Price & Wortman, 1985).
Studies investigating the time course between stressor exposure and health status have
produced mixed findings: while some studies suggest that the influence of life events
stressor upon health will manifest within a year (Holmes, 1979), studies using longer
time intervals have found higher levels of correlation between life events and health
(Eaton, 1978, cited Cohen et al, 1997).
Research findings support the utility of measuring life event stressors, and explaining
the current drive to explain differential vulnerability. The resilience of individuals has
been previously explored in terms of physiological (Clements & Turpin, 2000),
psychological characteristics and resources (Clarke & Singh, 2005), including social
support (Major, Zubek, Cooper, Cozzarelli & Richards, 1997) and coping (Schroevers,
Kraaij & Garenefski, 2007). The current study seeks to extend this by considering
Emotional Intelligence as a potential moderator of the harmful effects of stressors.
- 19 -
2.2.3 Biology of stress responses
Self report measures of stressors can be considered problematic because they provide
subjective assessment; the scores produced are significantly impacted upon by memory
and reporting biases (Marks et al., 2005). In contrast, physiological measures can
provide and objective assessment of an individual’s response to a stressor, provided
measures are reliable and valid in the way they operationalise stress responses.
The psychobiological perspective looks at physiological activation of the body in
response to (perceived or real) environmental demand, and a common way to do this is
to assess activation of the Hypothalamic-Pituitary-Adrenocortical Axis (HPA axis),
through measurement of salivary cortisol levels (Dom, Lucke, Loucks & Berga, 2007;
Porter & Gallagher, 2006). Cortisol has a role in both normal and stress states; under
normal conditions, cortisol is needed for metabolic and autonomic functioning, and has
pronounced diurnal rhythm peaking before waking at around 6am, with a second
smaller peak around noon (Lovallo, 2005). Under stress states, cortisol is required for
the synthesis and function of both alpha- and beta-adrenoreceptors aiding the
effectiveness of adrenaline, and aiding the release of stored glucose and fat
(Dziewulska-Szwajkowska Magorzata; Adamowicz, Wojtaszek, Dzugaj, 2003). Stress
states can be aroused by both psychological (e.g. excitement, fear, danger) and physical
(e.g. infection, exercise) stimuli (Ogden, 2007).
Measurement of salivary cortisol is seen as a reliable and convenient method of
assessing an individual’s physiological response to stressors (Kirschbaum &
Hellhammer, 1989). Salivary cortisol levels have been found to have a strong positive
correlation with blood cortisol levels (Gallagher et al. 2006), and therefore provide a
reliable measure of cortisol levels. Additionally, salivary cortisol avoids issues specific
to blood cortisol collection, these include confounding resuts by stressing participants
with use of needles, or confining research to laboratory settings (Jessop & Turner-Cobb,
2008). Therefore, non invasive salivary cortisol collection aids recruitment and retention
of participants. Ethically the choice of physiological reactivity measure was important
for study four as participants were being assessed during a presentation as part of their
undergraduate coursework; intrusive, uncomfortable or distracting methods of
assessment may have impacted upon their academic performance and affected results.

- 20 -
Within the current research programme, Study 4 investigates physiological responses to
acute stressors in this way. In order to experimentally test the relationship between
personal variables and cortisol, participants are exposed to the same stimulus, and their
cortisol levels are measured before and after. Meta analysis has found that there are
critical factors which impact upon the effect size of cortisol responses (Dickerson &
Kemeny, 2004): Studies with the greatest cortisol responses had stress tasks with an
aspect of evaluation by peers, participants lacked control, and were conducted in the
afternoon. Other factors which impact upon cortisol responses include smoking status
(Wurst, Kirschbaum & Hellhammer, 1993), and food intake by participants (Gonzalez-
Bono, Rohleder, Hellhammer, Salvador & Kirschbaum, 2002).
Stress Physiology as an influence on health
In several empirical studies, individual differences in measures of stress exposure were
found to be associated with differences in markers of health, including immunity
(Kiecolt-Glaser, Ricker, George, Messick, Speicher, Garner, Glaser, 1984b), and
susceptibility to illness (Cohen, Frank, Doyle, Skoner, Rabin & Gwaltney, 1998).
Research also connects these studies, finding that alterations in immunological and
endocrinological functioning (physiological indicators or immunity), predicts health
outcomes (Volkmann & Weekes, 2006). Additionally, research suggests that individual
differences in stress reactivity have long-term consistency (Burleson, Poehlmann,
Hawkley, Ernst, Berntson, Malarkey, Kiecolt-Glaser, Glaser & Cacioppo, 2003). Study
4 of this thesis will investigate the extent to which EI can explain variance in
physiological stress responses (salivary cortisol) to an acute stress task.
2.2.4 Psychology of stress responses:
Psychological perspectives consider individual differences in both perception and
evaluation of environmental demands, and resources to respond to the demand. Two
factors explored by the stress literature as explanations for the individual differences in
the process of appraisal are coping and social support. Coping refers to the process of
managing stressors appraised as taxing (Lazarus & Launier, 1978), while social support
refers to either perceived or actual support provided by a social network.
Coping with stress
The current studies consider coping to be part of the process of dealing with a stressor,
defining coping as “a person’s constantly changing cognitive and behavioural efforts to
- 21 -
manage specific external and/or internal demands that are appraised as taxing or
exceeding the person’s resources” (Lazarus & Folkman, 1984 p. 141). Most studies
propose that coping styles are behavioural or cognitive strategies, either avoidant or
engaging in attention and approach to the stressor (Moos & Scharfer, 1993; Holahan &
Moos, 1987). Indeed, researchers frequently group coping responses according to the
supposed function of the thought or behaviour, typically ‘problem focussed coping’
which refers to an individuals attempt to reduce the stressor by managing the problem
rationally; or ‘emotion focussed coping’ which refers to an individual’s attempt to
reduce emotional distress. It is generally considered that individuals engaged in
problem focussed coping when they perceive that they can take constructive action, and
emotion focussed coping when they feel that the stressor must be endured (Folkman &
Lazarus, 1980).
As the field of stress and coping has developed, the above distinction has increasing
been considered too simplistic, and authors proposed instruments with many more
subscales. An example of this is the COPE scale (Carver, Scheier & Weintraub, 1989),
which includes thirteen conceptually different scales which the authors developed
theoretically. The subscales are Active Coping, Planning, Suppression of competing
activities, Restraint coping, Seeking social support for instrumental reasons; Seeking
social support for emotional reasons, Positive reinterpretation and growth, Acceptance,
Turning to religion, Focus on and venting of emotions, Denial, Behavioural
disengagement, Mental disengagement, Alcohol- drug disengagement. This range of
subscales demonstrates the wide array of coping styles suggested in the literature.
While scales with a large number of subscales may be of interest, the time demands they
place on participants can be problematic and for this reason shorter measures such as the
brief cope (Carver, 1997) have been developed.
Studies investigating the impact of coping styles have found them to be predictive of a
range of outcomes. For example, active coping has been found to negatively correlate
with academic adjustment (Pritchard & McIntosh, 2003), detrimental coping has been
found to be negatively associated with health outcomes (Shen, McCreary & Myers,
2004), and negative coping styles have been found to positively correlate with higher
cortisol concentrations (Walter, Gerhard, Gerlach, Weijers, Boening & Wisbeck, 2006).
- 22 -
It should be noted that no coping behaviour in itself can be considered more or less
adaptive (Lazarus, 1999). For example, if an individual has power to control a situation
then action focussed coping may be most appropriate; if not, emotion focussed may be
more adaptive. For this reason when investigating the impact of coping, not only stress
responses, but also the outcomes of stress the stress process such as health or goal
attainment should be considered. Additionally, the individual’s adaptability or
flexibility in choice of coping style should be considered advantageous, as a diverse
range of skills means that an appropriate coping response can be executed to meet the
needs of a specific situation.
Building on findings that coping styles can predict adaptive outcomes, researchers have
investigated coping as a mediator of the relationship between stressor and stress
responses. Such research has found that stressors can predict coping styles, and that
coping styles in turn can predict stress responses (Bolger, 1990; Pruchno & Resch,
1989). Such research has supported the position of transactional models (e.g. Lazarus,
1999), that coping arises from the dynamics between the individual and their
environment.
Cognitive and Emotional coping responses as an influence on health
Research suggests that coping styles can moderate the relationship between stressor
exposure and illness. Avoidant coping styles (which may include cognitive and
emotional strategies such as self distraction; denial, disengagement and self blame) have
been found to be negatively associated with health (Holahan & Moos, 1986; Shen,
McCreary & Myers, 2004), and positively correlated with higher cortisol concentrations
(Walter, Gerhard, Gerlach, Weijers, Boening & Wisbeck, 2006). Meanwhile engaged
coping strategies have been found by meta-analysis to be associated with better health
longitudinally (Suls & Fletcher, 1985).
Behavioural coping responses to stress as an influence on health
Some individuals may respond to perceptions of threat by engaging in behaviours
whose functions are to reduce feelings of anxiety, but which are detrimental to health.
Research evidence suggests that exposure to stressors or life events is related to a range
of unhealthy behaviours, which include the following: smoking status and intensity
(Kouvonen, Kivimaki, Virtanen, Pentti & Vahtera, 2005); alcohol use and misuse
(Aseltine & Gore, 2000; Hoffman & Su, 1998); drug abuse (Harrison, Fulkerson &

- 23 -
Beebe, 1997; Najavits, 1997); and deliberate self harm (McLaughlin, Miller &
Warwick, 1996). The current study seeks to investigate EI as a potential moderator of
the relationship between stress and both positive and negative health behaviours.
Existing research evidence in support of this proposition is discussed in more detail
below.
Social support as a moderator of the stressor- response relationship
The construct of social support can be defined as assistance provided to individuals who
are coping with stressful events (Thoits, 1986, cited Hyman, Gold & Cott, 2003).
However, this can be broken down further to consider social support as a resource, as
behaviours, or as an appraisal (Vaux, 1992, cited Hutchinson, 1999). In this way the
subjective (perceived) and objective (actually received or offered) support can be
separated. This distinction is important in terms for measurement as an individual may
have a large social network but not perceive it as supportive (Hyman, et al, 2003).
Additionally social support is often seen as multidimensional, and measures of social
support often look at aspects such as availability of support, practical support,
reciprocity, emotional support, and event support (e.g. the social support network
inventory; SSNI; Flaherty, Gaviria, Pathak, 1983).
Social support is said to buffer an individual from the effects of stress in four ways: (1)
by providing emotional support, acceptance and self worth; (2) by providing social
companionship, affiliation and contact; (3) by providing practical, concrete aid,
including money or other resources; (4) and by providing information to help the
individual understand and cope with the stressor (Haslam, O’Brien, Jetten, Vormedal &
Penna, 2005). Conversely, some research findings suggest that social networks may be
unhelpful at stressful times, for example when the network is perceived as demanding
or critical (Lincoln, Chatters & Taylor, 2003); failing to provide the above positive
functions; by providing poor advice (Ogden, 2007); or by the social learning of
maladaptive coping strategies such as alcohol abuse (Cooper, Russell & George, 1988).
Research evidence supports the notion that perception of social support can moderate
the relationship between stressor and stress response; for example between a critical
incident and PTSD (Declercq & Palmans, 2006), victimisation in school and distress
from bullying (Davidson & Demaray, 2007), race-related stress and quality of life in
black Americans (Utsey, Lanier, Williams, Bolden & Lee, 2006), daily hassles and

- 24 -
psychological well being (Nezlek & Allen, 2006). Additionally, there is evidence that
social support has a positive effect on the HPA axis (Rosal, King, Ma & Reed, 2004),
and that this attenuation of neuroendocrine stress responses is through neural pathways
(Eisenberger, Taylor, Gable, Hilmert & Lieberman, 2007).
Social Support as an influence on health
Research suggests that social support influences health indirectly and directly.
Evidence of indirect relationship includes reports that social support influences the
relationship between stressor and stress response (Declercq & Palmans, 2006; Davidson
& Demaray, 2007; Utsey, Lanier, Williams, Bolden & Lee, 2006; Nezlek & Allen,
2006), and in turn that health is impacted upon by stress responses (Kiecolt-Glaser et
al., 1984b; Cohen et al., 1998; Volkmann & Weekes, 2006). Direct evidence reports
that social support is predictive of both attenuated stress responses (Rosal, King,
Yunsheng, & Reed, 2004), and general health (Syme, 1986). Further, research reports
that increased levels of social support are associated with better health and well being
(Bowling, 1991), that sociability is predictive of decreased probability of developing a
cold (Cohen, Doyle, Turner, Apler, Skoner, 2003a), that social support is associated
with positive health outcomes as assessed longitudinally with a health index (Goode,
Haley, Roth & Ford, 1998) and cross sectionally assaying blood samples for
physiological immunity (Kiecolt-Glaser, Dura & Speicher, 1991).
Cohen, Gottlieb and Underwood, (2000) suggest two pathways linking social support
with health. First that the direct effect of positive affect and self esteem result in
improved immune and endocrine function, and greater impetus to engage in healthy
behaviours. Second, it is proposed that social support moderates the negative effects of
stress on health.
2.3 Evidence that EI protects health from the effects of stress
2.3.1 EI: Protecting health from the negative impact of stressors
Previous research has found that emotional skills are predictive of a range of physical
health outcomes, including cardiovascular consequences (Karmack & Jenning, 1991;
Smith, 1992), general health (Ioannis & Ioannis, 2005), and susceptibility to the
common cold (Cohen, Doyle, Turner, Cuneyt, Alper & Skoner, 2003b). Moreover, trait

- 25 -
emotional intelligence has been found to be predictive of self reported health (Dawda &
Hart, 2000; Mikolajczak, Luminet & Menil, 2006).
However, while these studies provide evidence of an association between EI and health,
other researchers have sought to understand the paths by which EI might impact upon
health (Lumley, Stettner & Wehmer, 1996). One posited mechanism through which EI
promotes better health is that EI reduces the negative influence of stress on health
(Cohen, Frank, Doyle, Skoner, Rabin & Gwaltney, 1998). Research evidence suggests
that EI can mediate the relationship between stressor exposure and health (Mikolajczak
et al., 2007), that high EI is predictive of lower self reported feelings of stress (Landa,
López-Zafra, Martos & Aguilar-Luzón, 2008; Oginska-Bulik, 2005), and feelings of
inability to control life events (Gohm Corser & Dalsky, 2005).
Two of the four branches of the Mayer and Salovey (1997) ability model have particular
appeal in research on stress and health: Branch 1, which refers to effective regulation of
emotion, and branch 4, perception appraisal and expression of emotion. A systematic
process was undertaken to select a Trait EI measure which mapped well on to the Mayer
and Salovey (1997) ability model (See Appendix A), and this process resulted in the
section of the Swinburne University Emotional Intelligence Test (SUEIT; Palmer &
Stough, 2001). The SUEIT maps well onto the Mayer and Salovey (1997) ability model
(see table A2), and two of its subscales Emotional Control and Emotional recognition
and expression suitably cover the two ability EI branches of interest.
Extensive literature on regulation of emotion exists suggesting that skills in emotion
regulation are related to better health (John & Gross, 2004). Two SUEIT subscales
(Emotional Management and Emotional Control) relate to emotion regulation.
However of these two subscales Emotional Control has particular interest for two
reasons. First, because past research suggests that emotion control may be a predictor or
worse not better health (Ioannis & Ioannis, 2005) – a finding which is incongruent with
research on emotional intelligence and health. Second, emotional control is more
distinct from coping than emotion management; emotional control relates to inhibiting
strong emotions, while emotional management refers to dealing with emotions after
they have arisen. As the aims of this research include investigating coping as a
mediator of the relationship between emotional intelligence and health, it would be
undesirable for coping and emotional intelligence measures to be too similar as

- 26 -
significant relationships would not reveal anything meaningful. Therefore, the SUEIT
subscale Emotional Control was selected for use in analyses.
Emotional control relates to the ability to effectively control strong emotional states
such as anger, anxiety and frustration. Individuals who score highly on emotional
control subscales are able to inhibit strong emotions from affecting their thoughts
actions and behaviours, while those with low scores find this more difficult (Palmer &
Stough, 2001). Past research has found that that Emotional Control has a consistent
negative relationship with physical health (Ioannis & Ioannis, 2005; Gardner & Stough,
2003). Further, past studies have reported that Emotional control moderates the
relationship between stress and health, where high stress and high emotional control
predict a greater likelihood of reporting symptoms of illness (Goldman, Krammer &
Salovey, 1996).
In addition to branch 1, previous research has revealed that components of branch 4 of
the Mayer and Salovey (1997) ability model (perception appraisal and expression of
emotion), are related to positive health (Taylor, Bagby & Parker, 1999; Pennebaker,
1997). As branch 4 of the ability model is captured in the SUEIT subscale emotional
recognition and expression, this subscale would therefore be expected to predict health
in the presence of stress. The SUEIT subscale Emotional recognition and expression
was therefore selected for use in analyses
Emotional recognition and expression refers to the ability to identify feelings and
emotional state in oneself, and to express inner feelings to others (Palmer & Stough,
2001). Emotional expression has been found by past research to be an important
predictor of health (Taylor, Bagby & Parker, 1999), and an extensive body of work
supports the notion that emotional expression as a coping response to stress is beneficial
to health (e.g. Pennebaker, 1997; Smyth, 1998).
Mechanisms for the relationship between emotional recognition and expression, and
emotional control and health are thought to be both behavioural and physiological.
Negative emotional mood has been found to have an effect on behaviours such as
smoking (Brandon, 1994) and drinking alcohol (Cooper, Frone, Russell, & Mudar,
1995); those with high emotional control are likely to seek coping mechanisms, which
cause them health difficulties (Ioannis & Ioannis, 2005). Those individuals naturally

- 27 -
high on emotional expression are more likely to cope in an expressive way, making
them likely to feel the health benefits associated with emotional expression. Indeed,
suppression and denial of feelings have been associated with poorer health outcomes
(Gross & Levenson, 1997). Interestingly some authors consider emotional control to be
indicative of a reluctance to explore or express feelings (Helgeson & Lepore, 2004),
therefore considering emotional control and emotional recognition and expression
together is appealing theoretically.
Most studies exploring the relationship between trait EI and health have used total EI
scores (E.g. Slaski & Cartwright, 2002; Oginska-Bulik, 2005), and have reported that
global EI scores are predictive of good health. However, as past research has reported
that emotional control is negatively related to positive health (Burns & Mahalik, 2008),
and emotional expression positively related to health (Broderick, Junghaenel &
Schwartz, 2005), an aggregated global emotional intelligence score could be less
informative than individual subscales.
The current programme of research will test three main pathways between subscales
Emotional recognition and expression (ERE), Emotional Control (EC) and health: (1)
testing a physiological pathway, where ERE and EC influence physiological stress
responses; (2) a coping pathway where ERE and EC influence coping responses that are
harmful to health; and (3) a social support pathway where ERE and EC influence social
support which in turn has a positive influence on health.
2.3.2 Evidence that EI influences physiological stress responses
If physiological stress responses are moderated by EI, then EI should have differential
impacts upon people’s health. Previous research provides some evidence that EI
predicts physiological responses to stress, for example expressive writing attenuates
cortisol responses to trauma related memories in PTSD patients (Smyth, Hockemeyer &
Tulloch, 2008), and more specifically that EI is predictive of cortisol secretion
(Mikolajczak et al., 2007). Elsewhere, emotional expression has been found to be
related to enhanced physical health in breast cancer patients (Stanton, Danoff, Cameron
et al, 2000); and to enhance physical health but not health behaviours (Smyth, 1998).
Overall, the low number of studies to date linking physiological outcomes to EI
promote the furthering of research in this field to ensure generalisability across
measures.
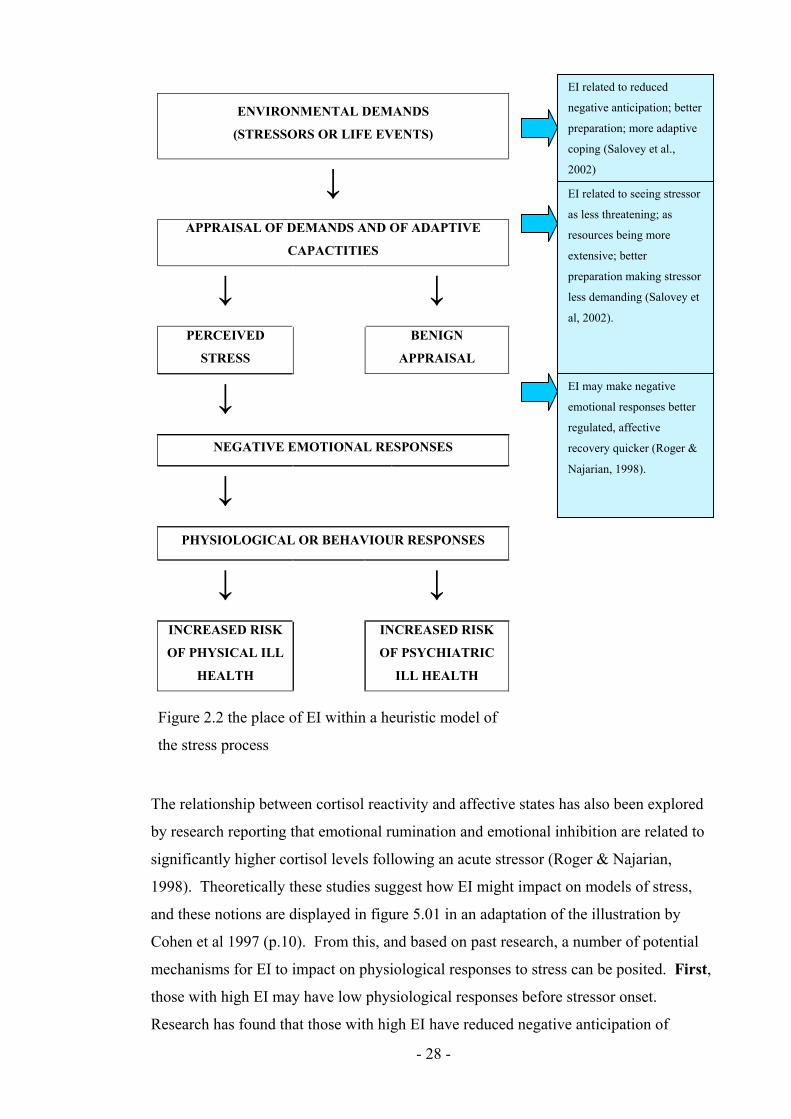
- 28 -
Figure 2.2 the place of EI within a heuristic model of
the stress process
ENVIRONMENTAL DEMANDS
(STRESSORS OR LIFE EVENTS)
↓ APPRAISAL OF DEMANDS AND OF ADAPTIVE
CAPACTITIES
↓ ↓ PERCEIVED
STRESS
BENIGN
APPRAISAL
↓
NEGATIVE EMOTIONAL RESPONSES
↓
PHYSIOLOGICAL OR BEHAVIOUR RESPONSES
↓ ↓ INCREASED RISK
OF PHYSICAL ILL
HEALTH
INCREASED RISK
OF PSYCHIATRIC
ILL HEALTH
The relationship between cortisol reactivity and affective states has also been explored
by research reporting that emotional rumination and emotional inhibition are related to
significantly higher cortisol levels following an acute stressor (Roger & Najarian,
1998). Theoretically these studies suggest how EI might impact on models of stress,
and these notions are displayed in figure 5.01 in an adaptation of the illustration by
Cohen et al 1997 (p.10). From this, and based on past research, a number of potential
mechanisms for EI to impact on physiological responses to stress can be posited. First,
those with high EI may have low physiological responses before stressor onset.
Research has found that those with high EI have reduced negative anticipation of
EI related to reduced
negative anticipation; better
preparation; more adaptive
coping (Salovey et al.,
2002)
EI related to seeing stressor
as less threatening; as
resources being more
extensive; better
preparation making stressor
less demanding (Salovey et
al, 2002).
EI may make negative
emotional responses better
regulated, affective
recovery quicker (Roger &
Najarian, 1998).

- 29 -
stressors better preparation for expected stressors; more adaptive or effective coping
strategies (Salovey, Stroud Woolery & Epel, 2002; Parker, Taylor & Bagby, 1998).
Second, those with high EI may have a reduced peak in their physiological response
following the stressor; potentially because they experience stressors as less threatening;
or because successful preparation means that they have better resources to deal with the
stressor (Mikolajczak, Roy, Luminet, Fillee & De Timary, 2007; Salovey et al., 2002)
Third, those with high EI experience a quicker fall in cortisol levels following a
stressor (Mikolajczak et al. 2007); this may be the result of better affective recovery
after experiencing stressors. Fourth, it may be that those with High EI have a generally
lowered physiological response to stressors at all time points (Mikolajczak et al.,2007);
this could be the case if EI is associated with more effective social support networks
(social support has been found to be associated with reduced cortisol reactivity, and EI
has been found to be predictive of social support).
Few studies have looked experimentally at the relationship between emotional
intelligence and stress, objectively measuring stress through salivary cortisol reactivity.
The first study to do this (Salovey et al., 2002) found evidence that higher EI predicted
lower cortisol secretion under stress conditions (r=-.30, p<.05). However, the EI
measure used did not cover the whole EI domain (the trait meta mood scale).
Additionally, the authors failed to control for personality. Thus, results could
demonstrate the predictive power of personality, rather than trait EI.
A second experimental study used a measure (The TEIQue) which is broader than the
EI domain (as defined by Salovey and Mayer, 1997). They found that EI had
incremental validity in predicting cortisol reactivity over the big five personality factors
(Mikolajczak et al., 2007), again finding that higher trait EI predicted lowered cortisol
in the stress condition (r=-.54, p<.005). The highlighted methodological issues
associated with these studies make interpretation of their results difficult; it is equivocal
as to whether their findings are in fact due to correlates of EI (personality, self esteem,
happiness) rather than EI itself being predictive of lowered cortisol concentrations.
Both previous studies reported that EI was associated with smaller increases in cortisol
levels following lab stress tasks and concluded that indeed psycho-physiological
responses to stress may be the mechanism that underlies the relationship between EI and
health. However, as both studies used either over-inclusive or narrow EI measures, and

- 30 -
in one case failed to control for personality (Salovey et al, 2002), these findings requires
replication.
An additional methodological problem with the previous studies to look at stress
responses and EI is that they were conducted under laboratory conditions using
experimental stress procedures. While conducting research in this way allows for
tighter control of environmental stimulus, it does not divulge as much information about
real world behaviour in stressful situations. For this reason the current study sought to
investigate cortisol reactivity in a group of students who were giving a public speaking
performance in front of their peers as part of course assessment. Meta analysis has
found that motivated performance tasks with an element of socio evaluative threat (in
other words that those performing the task could be seen negatively by others) are
reliably associated with large cortisol responses (Dickerson & Kemeny, 2004).
Therefore assessed presentations given by students were considered to provide both a
suitably stressful stimulus and ecological validity of results.
2.3.3 Evidence that EI predicts coping influences on health
Research suggests that EI influences appraisal of demand, and resources to cope.
Specific findings are that low EI is related to avoidant coping (Parker, Taylor & Bagby,
1998); and that alexithymia (an overlapping but narrower construct than EI) is related
cross sectionally to both binge drinking and long term alcohol use (Taylor, Bagby, &
Parker, 1997). Additionally, panic disorders have a high cross sectional occurrence in
Alexithymic patients (67% according to research by Parker, Taylor, Bagby, & Acklin,
1993) suggesting that an inability to regulate emotions means susceptibility to high
anxiety and avoidant coping under stress. Other authors have taken this further,
suggesting that EI is a moderating factor between stressor and coping (Jordan,
Ashkanasy & Hartel, 2002), although they did not test this proposition.
Research evidence testing the relationship between EI and coping is rather inconclusive.
For example, in a series of studies, Salovey et al. (2002) found that EI was correlated in
one study with active coping, whilst in another it was related to less trait and state
passive coping. However, Salovey et al. (2002) failed to control for personality or
cognitive ability, and in a contrasting study including both ability- and self reported- EI,
Bastian, Burns and Nettlebeck (2005) found after controlling for personality and

- 31 -
cognitive ability, that both self report, and ability-EI, contributed only a maximum of
6% of the variance in coping scores.
2.3.4 Evidence that EI predicts behavioural influences on health
A high percentage of mortality in industrialised countries is due to behaviour which is
modifiable (Strobe & Strobe, 1995). For this reason it is desirable to explain and
predict behaviours which impact either positively or negatively upon health. Such
behaviours may include smoking, drinking alcohol, or taking illegal recreational drugs.
Some individuals may respond to perceptions of threat by engaging in behaviours
whose functions are to reduce feelings of anxiety. While some such behaviours might
be considered healthy, such as taking exercise, other behaviours impact adversely upon
health. Research evidence has found that higher EI is predictive of less health damaging
behaviours for those suffering high stressor exposure (Pau, Croucher, Sohanpal,
Muirhead, & Seymour, 2004) lower rates of smoking initiation (Trinidad & Johnson,
2002); that alexithymia is related to both alcohol (Ioannis & Ioannis, 2005; Haviland,
Shaw, Cummings & MacMurray, 1988) substance use (Taylor, Parker & Bagby, 1990;
Pinard, Negrete, Annable & Audet, 1996), and taking longer to seek medical care
(Kenyon, Ketterer, Gheorghiade & Goldstein, 1991).
Behaviours adverse to health such as smoking, drinking alcohol, or drug taking may be
seen as dysfunctional ways of coping. Research evidence suggests that EI is predictive
of coping (Bastian et al., 2005), and that coping is also predictive of health (Shen et al.,
2004): this suggests that there is a behavioural pathway linking EI to health. Further,
this suggests that coping mediates the relationship between EI and health. Evidence
that coping is related to health outcomes is widespread in research literature. Findings
support the notion that distraction is related to poorer health quality of life in cystic
fibrosis patients (Abbott, Hart, Morton, Gee & Conway, 2008); that affective coping is
associated with impaired quality of life, and passive coping to pain intensity (Anie,
Steptoe & Bevan, 2002); and that in diabetic adolescents active coping is related to
improved health (better metabolic control, decreased HbA-1c), and disengaged coping
worsens health outcomes (Graue, Wentzel-Larsen, Bru, Hanestad & Sdegreesvik, 2004).

- 32 -
2.3.5 Evidence that EI predicts social support influences on health
Research evidence suggests that social support can predict health outcomes (as
discussed above). Therefore, if EI is predictive of social support this would explain why
EI has differential impact upon health. Indeed, evidence suggests that Ability EI is
predictive of quality of social interactions (Lopes, Brackett, Nezlek, Schutz, Sellin &
Salovey, 2004), perceived quality of social relationships (Lopes, Salovey, & Straus,
2003), and better social support (Ciarrichi, Chan & Bajgar, 2001). While trait EI
research has found EI to be positively related to peer-rated social competence
(Mavrovelo, Petrides, Rieffe & Bakker, 2007), and social network size and quality
(Austin, Saklofske & Egan, 2005). Additionally, Austin et al (2005) found that social
network size was more strongly associated with trait EI than with personality.
2.3.6 Controlling for personality
To provide evidence of incremental validity, researchers suggest that when exploring
the predictive power of trait EI, personality should be controlled for (Brody, 2004).
This is especially the case if personality has previously been found to have significant
associations with the outcome variables under investigation.
Research evidence finds that personality is related to both health status (Kenney &
Bhattacharjee, 2000), disease progression (Matthews, Raikkonen, Stutton-Tyrrell, &
Kuller, 2004), and health behaviour (Booth-Kewley & Vickers, 1994). Therefore, it is
important to control for personality when investigating the relationship between EI and
health. Specific findings are that neuroticism is related to greater symptomology and
worse health (Schiffer, Denollet, Pederson, Broers, & Widdershoven, 2008), and that
this is especially the case in combination with introversion (Denollet, 2005).
Neuroticism also seems to be related to risky behaviour; while conscientiousness and
agreeableness relate to healthy behaviours (Bermudez, 2006).
Given research has found that EI is negatively related to neuroticism and positively to
conscientiousness, EI would therefore be expected to predict healthy behaviour and
protect against risky behaviour. Mechanisms for the relationship between personality
and health include the seeking of social support or choice of coping strategy (Bermudez,
2006), the same behavioural mechanisms which are hypothesised to link EI to better
health.

- 33 -
Controlling for personality when investigating cortisol responses to stress
Research has found that personality can account for variance in cortisol secretion under
stress conditions, although findings appear not to be consistent. Some research has
found that higher cortisol levels are related to higher neuroticism (Roger & Najarian,
1998; Houtman & Bakker, 1991), and some to lower neuroticism (LeBlanc &
Ducharme, 2005); some studies have found that higher cortisol is related to higher
extroversion (LeBlanc & Ducharme, 2005), and lower extroversion (Dettling, Gunnar &
Donzella, 1999); elsewhere, no significant relationship has been found between
personality and cortisol levels (Schommer, Kudielka, Hellhammer, & Kirchbaum,
1999). Despite the inconsistencies, the evidence that personality can explain
significant variance in cortisol within regression models, along with the relationship
between trait EI and personality, underline the need to control for personality when
exploring the relationship between EI and cortisol reactivity.
Controlling for personality when investigating coping
Past research reports that facets of personality are predictive of different dimensions of
coping; research has found extroversion to be positively related to problem focussed
coping (McCrae & Costa, 1986), and low extraversion to be related to avoidance of
social support, (Gallagher, 1996); neuroticism has been found to be positively related to
avoidant coping (Gomez, Holmberg, Bounds, Fullarton & Gomez, 1999) irrational
coping (Gallagher, 1996), and emotion focussed coping while inversely to problem
focussed coping (Endler & Parker, 1990). Research specifically using the Brief Cope
and the big five personality variables, has found neuroticism to be positively related to
emotional support and avoidant behaviours (substance abuse, behavioural
disengagement, self blame, venting); extroversion, conscientiousness, openness to be
positively related to both problem focussed (active coping, planning) and emotion
focussed coping (reframing, humour, acceptance); while agreeableness was positively
related to active coping and humour (Roesch, Wee & Vaughn, 2006). In a prospective
study, neuroticism was found to predict coping efforts (wishful thinking and self blame)
which accounted for half the relationship between neuroticism and pre-exam anxiety
(Bolger, 1990). In summary, as personality has been found to be related to coping, it is
important to control for personality when investigating the relationship between EI and
coping.
Controlling for personality when investigating social support

- 34 -
Past research has revealed that personality is predictive of the availability and
effectiveness of social support (Cukrowicz, Franzese, Thorp, Cheavens, & Lynch,
2008). Specifically, neuroticism, openness to experience and agreeableness have been
found to be negatively related to social support (Nicolas, 2009; Cutrona & Russell,
1987), while conscientiousness and extraversion are significant positive predictors of
perceived social support (Kitamura et al., 2002). For this reason personality will be
controlled for when investigating the relationship between EI and social support.
2.4 Summary
The overall aims of this thesis were to investigate the relationship between EI, stressor
exposure and health, while refining and expanding past research. The relationship
between Trait EI and health was explored, first by investigating whether the relationship
between stressor exposure and health was moderated by EI, and second by exploring
whether the relationship between EI and health was mediated by coping, unhealthy
behaviours, or social support. Personality was controlled for wherever the predictive
power of EI was explored to provide evidence of incremental validity. Finally, both
subjective (self report) and objective (physiological measure using salivary cortisol)
assessments of stress were used, conducting the latter in a naturalistic setting to provide
greater ecological validity.
The aims of study one were:
1. To explore whether trait Emotional Intelligence (EI) subscales Emotional
recognition and Expression (ERE) and Emotional Control (EC) could explain
unique variance in health outcomes.
2. To investigate whether ERE or EC influence coping style, which in turn impacts
on health.
3. To investigate whether ERE or EC influence social support which in turn
influences health.
4. To investigate whether ERE or EC moderate the physiological effect of stress on
health.
The aims of study two were:
1. To extend study one by focussing on mediating unhealthy behaviours, rather
than general coping (with includes cognitive and affective components).

- 35 -
2. Exploring whether the relationship between ERE or EC and health could be
explained by the mediating presence of either unhealthy behaviours or social
support.
3. Exploring whether ERE or EC moderate the relationship between stressor
exposure and health.
The aims of the study three were:
1. To provide an original contribution to knowledge by investigating the
longitudinal relationship between Emotional intelligence subscales and health.
2. To explore longitudinally whether ERE or EC moderate the relationship
between stressful life events and health.
3. To explore longitudinally whether the relationship between ERE or EC and
health was mediated by coping or social support.
The aim of study four were:
1. To extend studies one to four by investigating whether ERE or EC moderate the
relationship between the acute stress of a public speaking task and related
cortisol and mood reactions.
2. To provide an original contribution to knowledge by investigating EI subscales
and cortisol in a naturalistic setting, thus extending previous research though
methodology with greater ecologically validity.

- 36 -
Chapter Three: Cross Sectional Investigation of Trait
Emotional Intelligence, Life Stressors, Coping and Health
Outcomes
The resilient response of individuals to the negative effects of stressors on health has
been previously explored in terms of physiology (Clements & Turpin, 2000),
psychological characteristics & resources (Clarke & Singh, 2005), social support
(Major, Zubek, Cooper, Cozzarelli & Richards, 1997), and coping styles (Schroevers,
Kraaij & Garenefski, 2007). The current study seeks to extend this by considering
Emotional Intelligence (EI) subscales emotional recognition and expression (ERE) and
emotional control (EC) as potential moderators of the harmful effects of stressors on
health. Second, social support and coping are considered as mediators of the
relationship between EI subscales and health.
The aims of study one are as follows: (1) to explore whether trait Emotional Intelligence
(EI) subscales ERE or EC can explain unique variance in health outcomes; (2) to
investigate whether ERE or EC influence coping styles which in turn impact on health;
(3) to investigate whether ERE or EC influence social support which in turn influences
health; and (4) to investigate whether ERE or EC moderate the physiological effect of
stress on health.
3.1 Method
3.1.1 Design
The relationships between ERE and EC, coping, and general health were investigated
through correlational and regressional analysis. Personality was measured as a control
variable.
3.1.2 Participants and Procedure
First year undergraduate students at the University of Central Lancashire during the
2006-2007 academic year were recruited through verbal requests in lectures and
workshops, and additionally through poster advertisements. As an incentive to
participate, participants were entered into a prize draw for a £50 book voucher and

- 37 -
university participation pool points were offered. Due to the high number of study
variables already taken, ethnicity information was not requested from participants.
Participants were given a booklet of questionnaires which contained the Swinburne
University Emotional Intelligence Test (SUEIT); life events questionnaires, the health
status questionnaire; the Social Support Network Inventory (SSNI; Flaherty, Gaviria &
Pathak, 1983); and the International Personality Item Pool (IPIP; Goldberg, 1999). A
week after completion participants were given a second questionnaire booklet, this
contained the social support network inventory and the brief cope questionnaire.
167 students completed booklet one, and of these 118 completed booklet two. For the
students involved in the study, ages ranging from 18 to 55 (mean age 20.76). 41
participants (24.6 %) were male, and 126 (75.4%) were female. Although some
previous research has found no significant effect of gender on emotional intelligence
(Van Rooy, Alonsa & Viswesvaran, 2005), others have found females to have higher EI
scores (Ciarrochi, Caputi & Mayer, 2003; Mayer, Salovey & Caruso, 2000). For this
reason sample means and standard deviations for the current study are compared against
technical manual data for the SUEIT below.
3.1.3 Materials
Measures for Study 1
EI Measure
(See appendix A for justification of choice of trait EI measure).
The Swinburne University Emotional Intelligence Test (SUEIT; Palmer & Stough,
2001) demonstrates good content validity as the measure’s five factors represent good
coverage of the EI domain mapping well on to the (1997) Mayer & Salovey model. The
SUEIT also demonstrates good focus on the EI domain, and items do not refer to
constructs other than EI (See table A2). Moreover, the SUEIT has demonstrated utility
by explaining unique variance in a number of published studies predicting outcomes
such as life satisfaction (Gannon & Ranzijin, 2005), leadership (Downey, Papageorgiou
& Stough, 2006), and critical and detached behaviour (Moss, Ritossa & Nga, 2006).
The SUEIT has also been shown to have good internal reliability (Rajendran, Downey
& Stough, 2007) and test re-test reliability (Palmer & Stough, 2001). For the current
- 38 -
study cronbach alpha coefficients were as follows: Emotional Recognition &
expression (α=.80) and Emotional Control (α=.71).
A pilot study was conducted to establish convergent validity of the SUEIT with other
trait EI measures (see appendix B). This revealed highly significant intercorrelations
between SUEIT total and score totals for TEIQue-SF and Schutte SSRI (r=.57 and
r=.64); all SUEIT subscales with Schutte Total (r=.18 to r= .50). All but one SUEIT
subscales (‘emotions direct cognition’) demonstrated highly significant positive
correlations with the TEIQue-SF total (r= .39 to r=.60); SUEIT subscales reveal small to
significant correlations (r=.14 to r=.55) with the three main Schutte subscales but not
with the final Schutte factor Utilisation of Emotion which had small and mostly non
significant correlations. In summary the SUEIT displays significant evidence of
convergence with other measures of EI.
Past research has suggested that the SUEIT may not be accurately described as a five
factor model. For example Gignac (2005) reported that a seven factor solution may be
more appropriate than the existing five factor; this research suggested that ‘emotional
recognition and expression’ was better represented by two separate factors – ‘emotional
recognition in the self’ and ‘emotional expression’, while emotional management was
more accurately represented as two factors ‘emotional management of self’ and
‘emotional management of others’. However, the current studies did not have access to
the subscale scoring key and therefore could not explore how the factor structure in the
current study related to findings of previous research. Subscale scores and internal
reliabilities were however provided by the scale providers which revealed that internal
reliabilities were of an acceptable level (over .70), and therefore factor structure was not
considered problematic.
Personality Measure
The International Personality Item Pool (IPIP; Goldberg, 1999) has been developed as a
free measure of personality, has good reliability and validity, e.g. Austin, Dore, and
O’Donovan (2008) report cronbach alpha coefficients as follows: Neuroticism α=.87,
Extroversion: α=.89, Openness: α=.81, Agreeableness: α=.78; Conscientiousness:
α=.81. In the current study reliability was found to be: Neuroticism: α=.86,
Extroversion: α=.89, Openness: α=.79, Agreeableness: α=.70; Conscientiousness:
α=.78. The IPIP correlates well to the NEO-FFI (Gow, Whiteman & Pattie, 2005). It

- 39 -
was developed to provide a public domain measure of personality. It has 50 statements
scored on a scale of 1 (Very inaccurate for me) to 5 (Very accurate for me). The scale
yields 5 subscale scores: Neuroticism; Extroversion; Agreeableness; Openness; and
Conscientiousness. For each subscale the possible scores range from 0 to 50.
Stressor Measure
The Life Events Questionnaire is an inventory of 34 stressful life events which
participants have to indicate if they have experienced in the last year, and if so how
upsetting they found the event on a scale of 1 (not upsetting at all) to 4 (very upsetting).
The questionnaire was derived from Paykel’s (1983) interview for recent life events. In
analysis only the frequency of life events was used, not the total score, as this cannot be
argued to be impacted upon by mood or affective disorder (Roy, Steptoe, &
Kirschbaum, 1998). This measure is an inventory and as such does not have reliability
or validity information.
Coping Measure
The Brief COPE (Carver, 1997), was derived from the Ways of Coping questionnaire
(Carver, Scheier & Wientraub, 1989), a longer measure which was originally based
upon both the Lazarus model of stress (1966), and a model of behavioural self
regulation (Carver & Scherier, 1981) The Brief Cope is a frequently used measure of
coping style, has 28 items, assessed using a four point scale where one is low (I haven’t
been doing this at all) and four is high (I’ve been doing this a lot). In line with
suggestion by the scale’s authors Carver et al., (1989) a factor analysis of the brief cope
was performed, finding a three factor solution: Engaged coping (α=.82); Social coping
(α=.88) and Disengaged coping (α=.81);. A three factor solution is in line with previous
research (e.g. Ng & Leung, 2006). See Appendix C for factor analysis. Cronbach
alpha coefficients were found to be good; Disengaged Coping (α=.81); Engaged Coping
(α=.82); Social Coping (α=.88). The brief cope has acceptable concurrent validity and
test re-test reliability (Carver, 1997).
Health Measures
The Health Status Questionnaire (Roy, 1994) provides basic demographic information
such as GP visits and participants perceived general health. It aims to provide further
evidence of stress correlates. Three items from this measure were of interest in the
current study; (1) how would you describe your health generally? (rated on a scale of a-

- 40 -
excellent, to e-very bad); (2) When did you last consult your GP about your own health,
other than for a check-up required for work or insurance, or for a vaccination? (rated on
a scale of a-in the last week, to g-so long ago I can’t remember); (3) If you had a
consultation with your GP or with a specialist within the last year, how many
consultations did you have? (rated on a scale of a-more than 4 per month, to d-less that
4 per year). General health was reverse scored on all items so that a larger number
indicated better health. The possible range of scores were; general health (1-5); last GP
visit (1-7); and frequency of GP visits (1-4). Although there is no published data on the
reliability and validity of this particular measure, it is common practice in health
research to use GP visits as an indication of ill health (E.g. Gortner & Pennebaker,
2003; Graybeal, Sexton, & Pennebaker, 2002), as is assessing general health by asking
participants to self report using a single question (E.g. Axelsson & Ejlertsson, 2002;
Idler, & Angel, 1990).
Social Support Measure
The Social Support Network Inventory (SSNI; Flaherty, Gaviria & Pathak, 1983) asks
participants to consider the five most important people in their lives. They are then
asked to rate them on a number of statements using a scale of 1 (not true at all) to 5
(Very true). The scale assesses five subscales (with internal reliabilities for current
study): Availability of support (α=.72); practical help (α=.78); reciprocity (α=.85);
emotional support (α=.70); and event related support (α=.87). Inventory authors
(Flaherty, Gaviria & Pathak, 1983) report cronbach alpha coefficients as follows;
Availability (α=.76); practical help (α=.84); reciprocity (α=.81); emotional support
(α=.91); and Event related support (α=.85). Test re-test reliability was found to be high
(r=.87). Convergent validity with clinicians ratings was acceptable (r= .68, p<.01).
3.2 Results
3.2.1 Missing data
Following data collection, and after as much missing data was recouped from students
as possible, missing data routines were run. Only random missingness was recovered in
this way. EM missing data routines were used to overcome such missing data in
questionnaires at item level, before subscales were calculated. Normal distribution of
data was assumed, a maximum of 25 iterations were used, and no nominal data was
included in the MDR. Analyses revealed that only a maximum of 3% missingness was
- 41 -
found in the variables therefore and the extent of substitution performed was acceptable.
Tabachnick and Fidell (2001) recommend a general guideline of more than 5% missing
data as being potentially problematic.
3.2.2 Data screening
Assumptions of multivariate analysis (Tabachnick & Fidell, 2001) were investigated
prior to analyses. Before conducting the multiple regressions, basic data screening was
completed to test dependent variables for normality and outliers, and to identify
multicollinearity. Screening began with checks for errors within the data file, then the
missing data routine were applied. Checks for multicollinearity (r > .8) revealed no
evidence of multicollinearity within variables, except between social support total score
and its subscales. As multiple regression is sensitive to singularity (Pallant, 2006),
either total scores or subscales scores were used in analyses, but not both at the same
time.
Outliers, both univariate and multivariate, were identified using procedures outlined in
Tabachnick and Fidell (2001), and it was intended that univariate outliers (extreme
scores on one variable only) would be retained while cases with multivariate outliers
(those with unusual combinations of scores on more than one variable) would be
deleted. Extreme cases were identified using box plots, defined as more than three box-
lengths from the edge of the box. No multivariate outliers were found in this way, so
assumptions of normality of distribution of the variables were then explored.
In checking for normality of distribution, some variables (Life events stress, EI subscale
Emotional Recognition and Expression, all three coping subscales, social support
subscale emotional support, all health measures, plus personality subscales extroversion
and agreeableness) presented evidence of non normal distribution (Kolmogorov-
Smirnov values p<0.05). However as the 5% trimmed means and inspection of
histograms (and skewness and kurtosis values) revealed that the assumptions of
univariate normality were not severely violated, this was not considered problematic.
Additionally, positively skewed distributions would be expected in health, stress and
coping, as while the majority of participants would be expected to be in good health and
experiencing a low level of life event stress, some individuals will be experiencing
major health issues or stressors and their scores will affect tests of normality. It would

- 42 -
not be desirable to remove such scores as they provide necessary variance in both
independent and dependent variables.
3.2.3 Background characteristics of the population
The characteristics of the sample for study one are shown in Table 3.1
Table 3.1. Characteristics of sample for study one
MEANS AND STANDARD
DEVIATIONS FOR EACH MEASURE
(n=118)
CHARACTERISTIC
Mean S. D.
Age 20.77 5.89
Emotional Recognition & Expression 35.78 5.81
SUE
IT
Emotional Control 26.14 5.73
Neuroticism 31.19 7.14
Extroversion 32.61 7.48
Openness 32.01 4.80
Agreeableness 39.44 4.65
Per
sona
lity
Conscientiousness 32.28 5.91
Disengaged 19.69 5.51
Engaged 21.77 4.47
Cop
ing
Social 9.70 3.22
General Health 3.88 .78
Last GP Visit 3.53 1.61
Hea
lth
Frequency of GP visits 3.57 .74
Availability 11.47 1.53
Practical support 7.91 1.17
Reciprocity 8.11 1.11
Emotional support 12.12 1.65
Event support 7.20 1.50
Soc
ial S
uppo
rt
TOTAL support 46.66 5.47
Life events stress frequency 6.69 3.49
Mean age of this sample was 20.77 years (standard deviation of 5.89). This is a young
sample and some previous research has found trait EI to increase significantly with age,
therefore age will be entered as a covariate into analyses.
Normative data
Means and standard deviations for both the current sample and published normative
data (using large samples sizes) for the SUEIT are given in Table 3.2. Significant
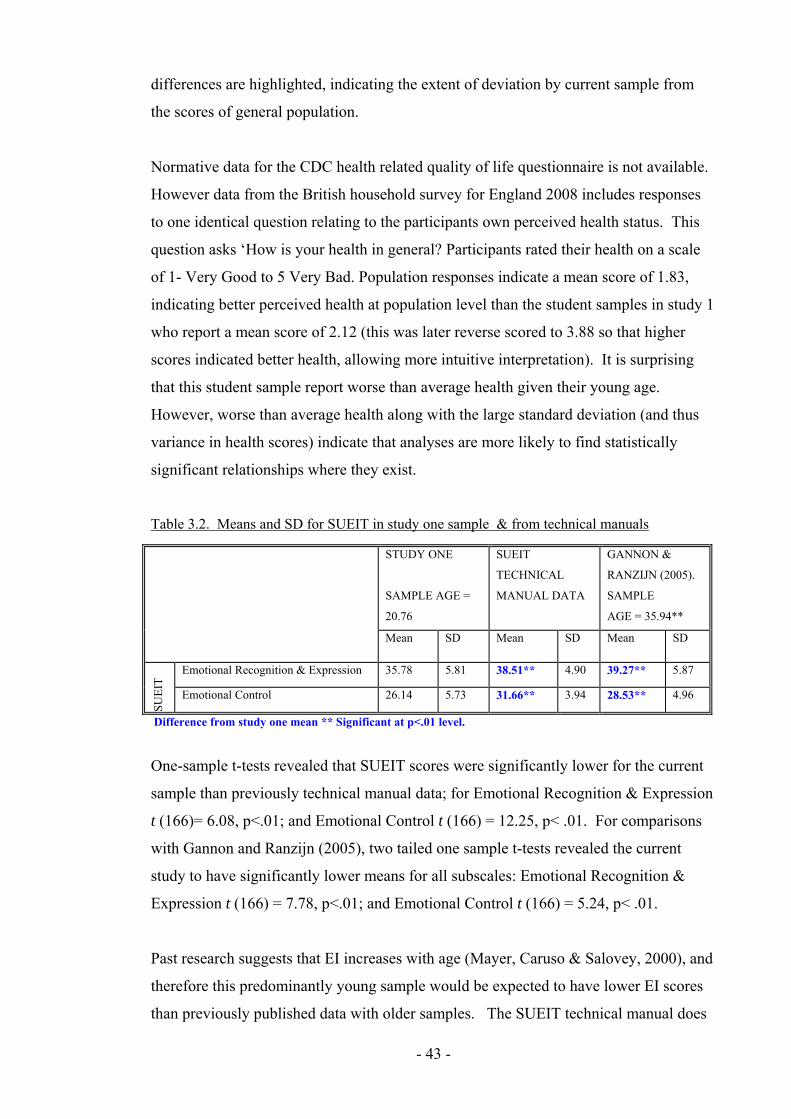
- 43 -
differences are highlighted, indicating the extent of deviation by current sample from
the scores of general population.
Normative data for the CDC health related quality of life questionnaire is not available.
However data from the British household survey for England 2008 includes responses
to one identical question relating to the participants own perceived health status. This
question asks ‘How is your health in general? Participants rated their health on a scale
of 1- Very Good to 5 Very Bad. Population responses indicate a mean score of 1.83,
indicating better perceived health at population level than the student samples in study 1
who report a mean score of 2.12 (this was later reverse scored to 3.88 so that higher
scores indicated better health, allowing more intuitive interpretation). It is surprising
that this student sample report worse than average health given their young age.
However, worse than average health along with the large standard deviation (and thus
variance in health scores) indicate that analyses are more likely to find statistically
significant relationships where they exist.
Table 3.2. Means and SD for SUEIT in study one sample & from technical manuals
STUDY ONE
SAMPLE AGE =
20.76
SUEIT
TECHNICAL
MANUAL DATA
GANNON &
RANZIJN (2005).
SAMPLE
AGE = 35.94**
Mean SD Mean SD Mean SD
Emotional Recognition & Expression 35.78 5.81 38.51** 4.90 39.27** 5.87
SUE
IT
Emotional Control 26.14 5.73 31.66** 3.94 28.53** 4.96
Difference from study one mean ** Significant at p<.01 level.
One-sample t-tests revealed that SUEIT scores were significantly lower for the current
sample than previously technical manual data; for Emotional Recognition & Expression
t (166)= 6.08, p<.01; and Emotional Control t (166) = 12.25, p< .01. For comparisons
with Gannon and Ranzijn (2005), two tailed one sample t-tests revealed the current
study to have significantly lower means for all subscales: Emotional Recognition &
Expression t (166) = 7.78, p<.01; and Emotional Control t (166) = 5.24, p< .01.
Past research suggests that EI increases with age (Mayer, Caruso & Salovey, 2000), and
therefore this predominantly young sample would be expected to have lower EI scores
than previously published data with older samples. The SUEIT technical manual does

- 44 -
not provide means ages of their sample. However, support of this notion comes from
Gannon and Ranzijn (2005) who showed higher means for all SUEIT subscales with an
older sample.
3.2.4 Intercorrelations between variables
Relationships between Perceived general health, GP visit frequency and GP last
visit
Table 3.3 presents intercorrelations between general health (higher scores indicate better
perceived health), GP visit frequency (higher scores indicate less frequent visits), and
GP last visit (higher scores indicates less recent visits) for study one. Intercorrelations
reveal that as perceived general health (participants’ ratings of their health) increase, GP
visits decrease, frequency of visits to GP decrease, and depression scores decrease. In
line with previous research (e.g. Pennebaker & Beall, 1986) this suggests that GP visits
do reflect ill health, rather than health seeking behaviour.
Table 3.3. Correlations between Health subscales
LAST GP VISIT FREQUENCY OF GP
VISITS
Health Perceived general health .29** .33**
Last GP visit 1 .42**
Frequency of GP visits in past year 1
* Significant at p< .05 level; ** Significant at p<.01 level.
Relationship between stressors, coping and health
To examine the extent of relationship between frequency of stressors and related coping
and health subscales, analyses are presented in Table 3.4.
Table 3.4 Correlations between Stressors and the coping and health subscales
LIFE EVENTS STRESS
Coping Disengaged Coping .29**
Engaged Coping .06
Social Coping .22**
Health General health -.24**
Last GP visit -.25**
Frequency of GP visits in past year -.31**
* Significant at p< .05 level; ** Significant at p<.01 level.
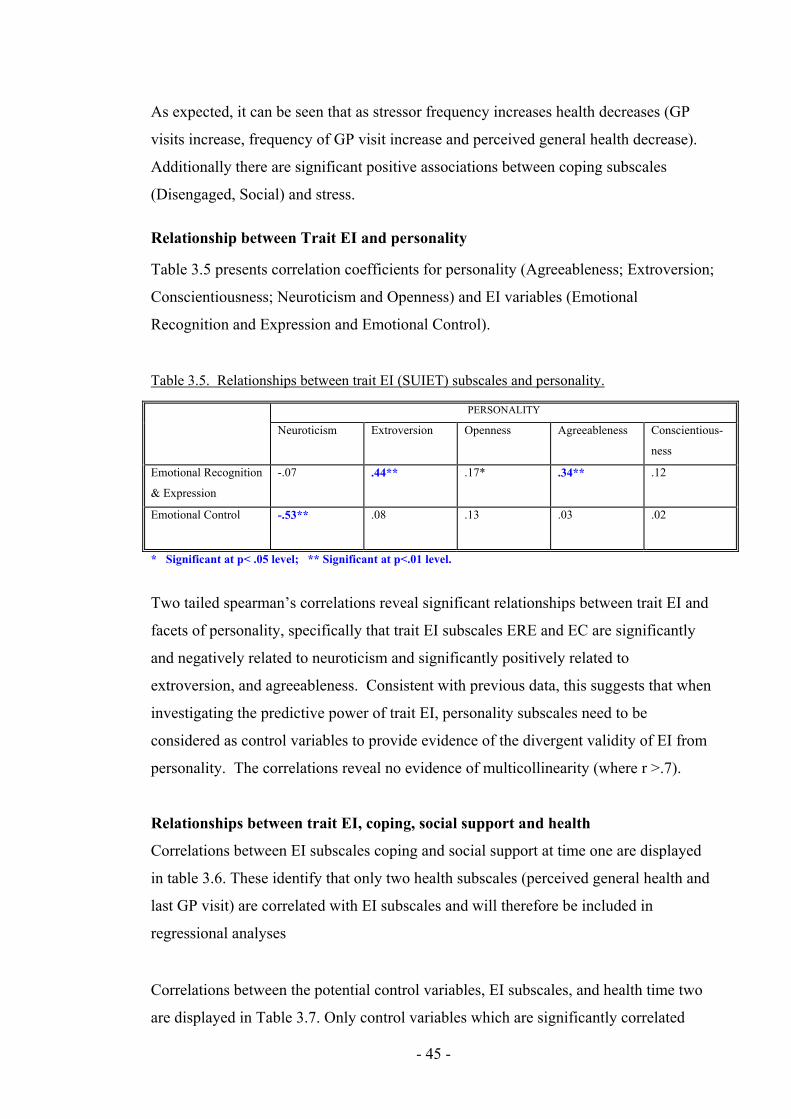
- 45 -
As expected, it can be seen that as stressor frequency increases health decreases (GP
visits increase, frequency of GP visit increase and perceived general health decrease).
Additionally there are significant positive associations between coping subscales
(Disengaged, Social) and stress.
Relationship between Trait EI and personality
Table 3.5 presents correlation coefficients for personality (Agreeableness; Extroversion;
Conscientiousness; Neuroticism and Openness) and EI variables (Emotional
Recognition and Expression and Emotional Control).
Table 3.5. Relationships between trait EI (SUIET) subscales and personality.
PERSONALITY
Neuroticism Extroversion Openness Agreeableness Conscientious-
ness
Emotional Recognition
& Expression
-.07 .44** .17* .34** .12
Emotional Control
-.53** .08 .13 .03 .02
* Significant at p< .05 level; ** Significant at p<.01 level.
Two tailed spearman’s correlations reveal significant relationships between trait EI and
facets of personality, specifically that trait EI subscales ERE and EC are significantly
and negatively related to neuroticism and significantly positively related to
extroversion, and agreeableness. Consistent with previous data, this suggests that when
investigating the predictive power of trait EI, personality subscales need to be
considered as control variables to provide evidence of the divergent validity of EI from
personality. The correlations reveal no evidence of multicollinearity (where r >.7).
Relationships between trait EI, coping, social support and health
Correlations between EI subscales coping and social support at time one are displayed
in table 3.6. These identify that only two health subscales (perceived general health and
last GP visit) are correlated with EI subscales and will therefore be included in
regressional analyses
Correlations between the potential control variables, EI subscales, and health time two
are displayed in Table 3.7. Only control variables which are significantly correlated

- 46 -
with both EI subscales and dependent variables will be included in step one of
regressional analyses. Potential control variables were identified as being personality
subscales, age and gender. Results reveal that the only control variable for perceived
health will be Gender, for GP visit frequency no control variables have been identified,
while last GP visit is not correlated with EI subscales and therefore is not explored in
regressional analyses.

- 47 -
Table 3.6 Correlations between Trait EI, social support, coping and health
SOCIAL SUPPORT COPING HEALTH
Available
Practical Reciprocity Emotion Event Dis-
engaged
Engaged Social General-
Self
reported
Last GP
visit
GP visit
Freq
Emotional Recognition & Expression .38** .20* .30** .17 .35** -.36** .08 .22** .02 .05 .13*
SUE
IT
Emotional Control .03 .04 .12 .32** .08 -.28** .16* -.10 .27** .01 -.09*
Availability 1 .65** .64** .35** .70** .01 .13 .35** -.05 -.19* -.11
Practical Support 1 .57** .29** .43** -.03 -.08 .19* .08 -.06 -.09
Reciprocity 1 .57** .67** -.15 .02 .19* .07 -.09 -.04
Emotional Support 1 .37** -.30** .03 .06 .21* -.01 .04
Soc
ial S
uppo
rt
Event support 1 -.03 .12 .38** -.09 -.21* -.08
Disengaged Coping 1 .15* .22** -.20** -.13 -.14*
Engaged Coping 1 .34** .00 -.09 -.07
Cop
ing
Social Coping 1 -.12 -.09 -.03
* Significant at p< .05 level; ** Significant at p<.01 level.

- 48 -
Table 3.7 Identifying control variables for Path A: correlations between potential control variables, EI subscales and related health variables
* Significant at p< .05 level; ** Significant at p<.01 level.
All control variables along with EI subscales, life events stress and health dependent variables are included within table to allow identification of
control variables in later moderation analyses (table 3.9).
ERE EC LIFE EVENTS
STRESSORS
PERCEIVED
HEALTH 07
LAST GP 07 GP FREQ 07
Neuroticism -.03 -.02 .24** -.29** -.13 .-.16
Extroversion .38** -.02 .10 -.00 -.03 -.11
Openness .12 .09 .01 -.01 -.14 -.15
Agreeableness .32** -.04 .07 -.09 -.09 -.04
Conscientiousness .12 -.09 -.13 .17* .02 .10
Age -.09 .18* -.06 -.13 -.13 -.14
Gender -.03 -.22** .23** -.21** -.27** -.16

- 49 -
3.2.5 Analyses of variance and Regressions
Mediation of the EI health relationship
Baron and Kenny (1986) state that a variable is a mediator of a relationship if the
following conditions are met: (i) variations in the levels of the independent variable
significantly account for variations in the presumed mediator; (ii) variations in the
mediator significantly account for variations in the dependent variable; (iii) when paths
(i) and (ii) are controlled for a previously significant relationship between independent
and dependent variables is no longer significant, or is significantly decreased (Baron &
Kenny, 1986).
Therefore, for the current study, if health behaviours or social support mediate the
relationship between EI and health, EI will explain variance in health status (Path A); EI
will explain variance in mediating variables (Path B); mediating variables will explain
variance in health (Path C); significant amounts of variance of health explained by EI
will reduce or become non significant when mediating variables are added into
regressional analyses on a previous step (Baron & Kenny, 1986).
Figure 3.1 Mediation of the relationship between EI and health status
Inferential analyses tested whether the relationship between EI and health was mediated
by coping: Regressional analyses examined (path A) where EI explained variance in
health, (path B) where EI explained variance in coping and social support, and (path C)
where coping and social support explain variance in health.
A
C B
Health Status EI
Social Support OR
Coping

- 50 -
In analyses an alpha level of .05 was applied. Although it was desirable to reduce this
level to .01 or apply the Bonferroni procedure to account for multiple testing, the small
sample made such a procedure too conservative potentially resulting in type two errors
(Shaffer, 1995). Where regressional analysis was required, hierarchical multiple
regressions were used to enter control variables in the first regression step. This method
was selected to evaluate each independent variable in terms of its predictive power
(over and above that offered by the other IVs), but more importantly because this is
appropriate when the order of entry is determined theoretically (Tabachnick & Fidell,
2001), as is the case here with the EI literature suggesting personality be considered as
control variables.
Mediation Path A: EI explaining variance in health
Regressions were performed to investigate how EI reduces the harm to health that
stressor exposure creates. Hierarchical multiple regressions for the measures of health
were conducted with control variables entered in step one, and trait EI subscales entered
at step two. These analyses assessed the extent to which trait EI explained unique
variance in health. This is the first step in understanding whether either coping or social
support mediate the relationship between EI and health.
For each of the three health variables (perceived general health; last GP visit; frequency
of GP visits in the past year) collinearity diagnostics revealed no tolerance value less
than .10 or VIF value above 10, suggesting no evidence of multicollinearity (Pallant,
2000). Visual inspection of each of the normal probability plots suggests no major
deviation from normality, except in the case of perceived general health for which the
standardised residual scatterplot had a distinctive pattern, likely to be a result of the
rating scale which participants used to rate their health. Results of the two hierarchical
multiple regressions are presented in Table 3.8.

- 51 -
Table 3.8. Multiple regression models with EI subscales as predictors of health variables
PREDICTED
HEALTH
VARIABLES
STEP 1
R²
STEP 1
CONTROL
VARIABLES
ß STEP 2
R²
CHANGE
STEP 2
EI
SUBSCALES
ß OVER-
ALL F
VALUE
Perceived
general health
.05 Gender -.21** .02 EC -.13 5.40**
Freq of GP
check ups
. None . .02
ERE
EC
.11
-.04
1.21
* Significant at p< .05 level; ** Significant at p<.01 level.
Regressional analyses reveal that neither ERE nor EC are significant predictors of
health as measured by the current study. There will therefore be no further mediational
analyses.
EI as a moderator of the relationship between life event stress and health
Baron and Kenny (1986) state that if a variable is a moderator of a relationship there
may be significant main effects (although these are not required to evidence to the
moderator hypothesis), however, the interaction effect between predictor variables must
be significant. Therefore, the current study seeks evidence of a significant interaction
between exposure to life event stress and emotional intelligence in predicting health.
If either ERE or EC are moderators of the relationship between stress and health, it is
expected that: (1) there may be a significant main effect for the subscale; however (2)
there must be a significant interaction effect (so the product of the EI subscale and life
events stress must be a significant predictor).
To investigate moderation effects between EI subscales and life events stress,
interaction terms (EI subscale x stress) were entered in a third step of the multiple
regression predicting health variables. To do this, the independent variables were
centred (as advised by Aiken & West, 1991) by calculating raw scores minus mean
scores. Then interaction terms were calculated by multiplying centre scored life events
stress and centre scored EI subscales.
Results of moderation analyses (presented in Table 3.9) reveal evidence of significant
interactions between Trait EI subscales (‘emotional recognition and expression’, ‘and
‘emotional control’) and life events stress when predicting frequency of GP visits.

- 52 -
Table 3.9 Moderational analysis of the stress health relationship by EI subscales.
PREDICTED HEALTH
VARIABLES
STEP 1 R²
CHANGE
STEP 1
CONTROL
VARIABLES
ß STEP 2 R²
CHANGE
STEP 2 EI
SUBSCALES
ß STEP3
R²
CHAN
GE
STEP 3 INTER-
ACTIONS
ß OVER-ALL F
Perceived general health (Higher number = better health)
.10* Neuroticism Gender
-.25** -.314
.04 ERE
EC
Life events
stress
.05
-.11
-.15
.04* ERE x Stress
EC x Stress
-.05
.19*
4.59**
Last GP check up. .07* Gender -.27** .04 ERE
EC
Life events
stress
.03
.05
-.20**
.00 ERE x Stress
EC x Stress
.04
.04
3.43*
Freq of GP check ups . None
. .12**
ERE
EC
Life events
stress
.13
-.03
-.32**
.04* ERE x Stress
EC x Stress
.20**
.04
5.79***
* Significant at p< .05 level; ** Significant at p<.01 level.
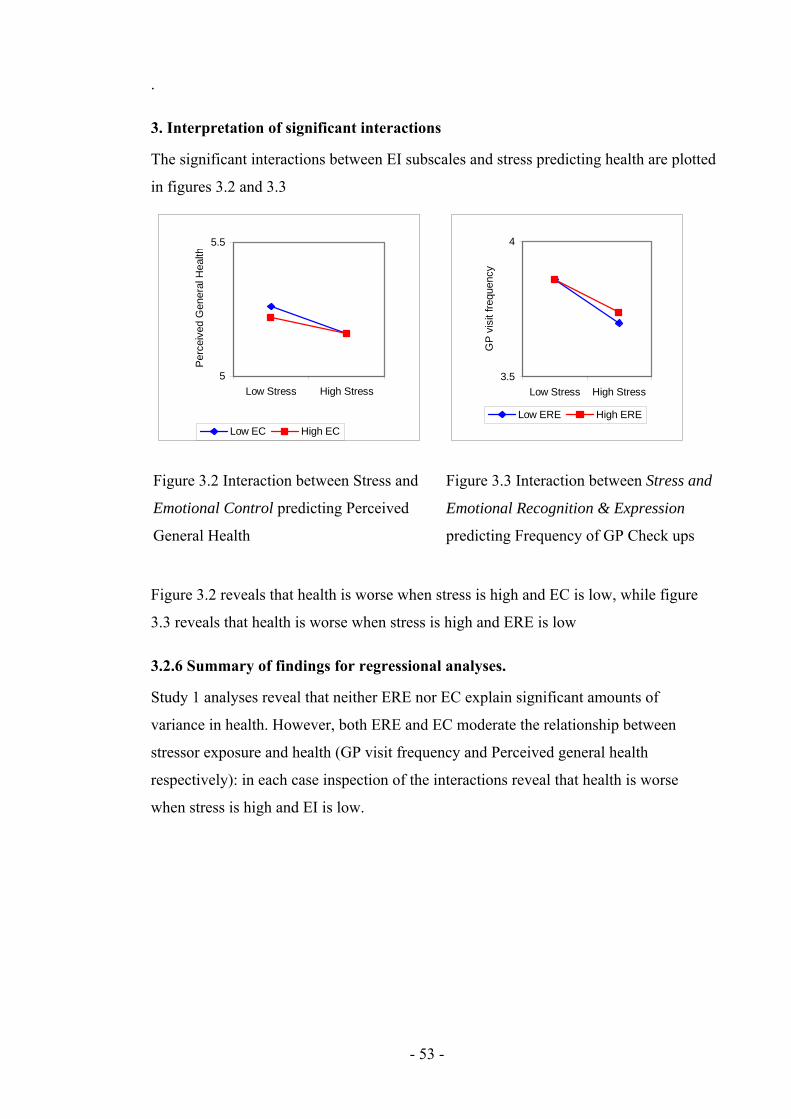
- 53 -
.
3. Interpretation of significant interactions
The significant interactions between EI subscales and stress predicting health are plotted
in figures 3.2 and 3.3
Figure 3.2 reveals that health is worse when stress is high and EC is low, while figure
3.3 reveals that health is worse when stress is high and ERE is low
3.2.6 Summary of findings for regressional analyses.
Study 1 analyses reveal that neither ERE nor EC explain significant amounts of
variance in health. However, both ERE and EC moderate the relationship between
stressor exposure and health (GP visit frequency and Perceived general health
respectively): in each case inspection of the interactions reveal that health is worse
when stress is high and EI is low.
5
5.5
Low Stress High Stress
Per
ceiv
ed G
ener
al H
ealth
Low EC High EC
Figure 3.2 Interaction between Stress and
Emotional Control predicting Perceived
General Health
3.5
4
Low Stress High Stress
GP
vis
it fr
eque
ncy
Low ERE High ERE
Figure 3.3 Interaction between Stress and
Emotional Recognition & Expression
predicting Frequency of GP Check ups

- 54 -
3.3 Discussion
This study investigated the relationship between trait EI, stressor exposure, health,
coping and social support. It sought to understand whether the relationship between EI
and health was mediated by coping style or social support; and second, whether the
relationship between stressor exposure and health was moderated by trait EI. Contrary
to predictions, analyses did not reveal either ERE or EC to explain significant amounts
of variance in health, a finding contrary to previous meta analytic findings (Martins,
Ramalho & Morin, in press). However, moderational analyses found significant
interactions between EI and stress were found when predicting health, specifically that
under high stress conditions low EI is related to worse health.
That the current study fails to find that either ERE or EC explain significant amounts of
variance in health is surprising given previous research for global EI, emotional
expression and emotional control. Incongruence of findings with previous research
leads to several possible explanations: (1) that there is a relationship between EI and
health which is mediated by social support and/or coping, but that these relationships
emerge over a longer trajectory than the current study investigated; (2) that there is a
relationship between stressors, EI, social support, coping and health but the measures
used by the current study do not reveal it; (3) that there is a relationship between EI,
health, social support and coping, but characteristics of the current sample prevent this
from being revealed; (4) that there is a real relationship between EI and health, however
effect sizes are small and the current study did not have sufficient power to reveal them;
(5) the null hypothesis- the relationship between EI and health is not mediated by either
coping or social support.
First, although there is an assumption that the influence of life events stressor upon
health will manifest within a year (Holmes, 1979), studies using longer time intervals
have found higher correlations between life events and health (Eaton, 1978, cited Cohen
et al, 1997). This may indicate that longer time frames may be more appropriate,
especially since stressful life events reported by participants within the last year, will
generally have occurred less than a year ago. For this reason, study 3 employs a
longitudinal design tracking health 18 months from the time participants report their life
event stress.

- 55 -
Second, non-significant results may indicate that the measures used in the current study
did not accurately assess the underlying constructs. The current study assessed health
using only three items on a health questionnaire, which provides a limited range of
variance in the outcome measure problematic (Clark-Carter, 2004). To overcome this
issue, longitudinal study 2 uses a more comprehensive measure of health with more
questions, including other aspects of health including physical health, sleep and pain.
Third, it is possible that characteristics of this sample mean that a relationship between
EI health and coping was not revealed, for example, because this sample was
predominantly young and female. For this reason, age and gender will continue to be
considered as control variables in future studies. Additionally, it may be that the young
sample creates a ceiling effect of good health, and this further emphasises the need to
improve the sensitivity of the health measure used in future studies. It is possible that
other factors relating to a student sample have also impacted on results (such as social
economic status), however due to the large amount of information requested of
participants further demographics were not sought to be controlled for.
Fourth, it is possible that the failure of the current study to find ERE or EC as a
significant predictor of health is a type II error. However, sample sizes were calculated
a-priori for regressional analyses (see appendix D) and based on reported meta-analytic
effect sizes for trait EI predicting health (Martins, Ramalho & Morin, in press) the
current study should have sufficient power to detect the expected moderate effect size.
Mediational analyses were not conducted because of the lack of significant relationships
between EI and health. However, it is interesting to note that both ERE and EC have
significant negative correlations with disengaged coping. These correlations lend
support to the idea that EI may support health by reducing engagement in unhealthy
coping behaviours when coping with stressful events. Unhealthy behaviours could be
considered aspects of disengaged coping if purpose is to reduce feelings of anxiety.
This notion is consistent with previous research which has found that EI predicts coping
(Bastian, Burns & Nettlebeck, 2005), and that coping predicts health (Shen, McCreary
& Myers, 2004). Study 2 will investigate this proposal by exploring whether EI is
predictive of unhealthy behaviours such as drinking, smoking, and drug taking. If ERE
or EC are predictive of unhealthy behaviours then this may provide evidence of a

- 56 -
mechanism between EI and health, even if EI subscales cannot explain variance in
health cross sectionally.
Results of the current study also reveal that ERE and EC have significant positive
correlations with social support subscales. These correlations lend support to the notion
that EI may support health by increasing social support, a resource which in turn assists
in coping with stressful events. This is consistent with previous research indicating that
EI is predictive of social network size (Austin et al., 2005), that social support is
predictive of attenuated stress responses (Rosal, King, Yunsheng, & Reed, 2004), and
that social support is related to health (Syme, 1986). Therefore social support will
again be investigated in study two, more comprehensive measures of health may help to
reveal whether social support does indeed mediate the relationship between EI and
health.
In conclusion, the current study does not find trait EI to be a significant predictor of
physical health, but does find that trait EI moderates the relationship between stressor
exposure and health. However, measures and methods need to be refined to provide
support to these findings.

- 57 -
Chapter Four: EI and Health, Mediation by unhealthy
behaviours, and moderation by EI of the impact of life stress
on Health.
Following from study 1, the current study aims to investigate the relationship between
trait EI (ERE and EC) and health. First, it seeks to further investigate findings from
study 1 that trait EI subscales could not explain variance in health, this time using a
more comprehensive measure of health. Second, if a relationship between trait EI and
health is discovered, unhealthy behaviours will be explored as mediators. If ERE or EC
are predictive of unhealthy behaviours then this may provide evidence of a mechanism
between EI and health, even if trait EI subscales cannot explain variance in health cross
sectionally.
Unhealthy behaviour can be considered a facet of coping whose purpose is to reduce
feelings of anxiety in an individual exposed to stressors (Moos & Scharfer, 1993;
Holahan & Moos, 1987). Engagement in unhealthy behaviour has been found to be
preceded and exacerbated by stress, with past research suggesting that the purpose of
some unhealthy behaviours may be to reduce feelings of anxiety: For example as
stressor exposure increases so does smoking status and intensity (Kouvonen, Kivimaki,
Virtanen, Pentti & Vahtera, 2005); alcohol use and misuse (Aseltine & Gore, 2000;
Hoffman & Su, 1998); drug abuse (Harrison, Fulkerson & Beebe, 1997; Najavits, 1997)
and deliberate self harm (McLaughlin, Miller & Warwick, 1996). Moreover, research
evidence has found that higher trait EI is negatively related to smoking initiation
(Trinidad, Unger, Chih-Ping, & Johnson, 2005; Trinidad, Unger, Chih-Ping, Azen &
Johnson, 2004; Trinidad & Johnson, 2002); and alcohol consumption (Austin, Saklofske
& Egan, 2005), while the related construct of alexithymia (narrower in concept than
trait EI, characterised by difficulty identifying and describing subjective feelings) is
predictive of alcohol consumption (Ioannis & Ioannis, 2005; Haviland, Shaw,
Cummings & MacMurray, 1988) substance use (Taylor, Parker & Bagby, 1990; Pinard,
Negrete, Annable & Audet, 1996), and taking longer to seek medical care (Kenyon,
Ketterer, Gheorghiade & Goldstein, 1991).

- 58 -
Social support will again be investigated as a mediator of the relationship between trait
EI and health. Study one reveal a large number of significant positive correlations
between trait EI and social support subscales, therefore with an improved health
measure analyses may reveal these relationships to be a mechanism by which trait EI
can impact positively upon health status.
The current study sought to first, replicate findings from studies 1 that trait EI
moderates the relationship between stressor exposure and health, and second to
investigate whether the relationship between trait EI and health is mediated by either
unhealthy behaviours or social support. Based on previous research, it was predicted
that (1) ERE and EC moderates the relationship between exposure to stressors and
health; (2) that social support mediates the relationship between ERE and EC and health
status; and (3) unhealthy behaviour mediates the relationship between ERE and EC and
health.
4.1 Method
4.1.1 Design
The relationships between trait EI subscales ERE and EC, health behaviours and health
quality of life, were investigated through correlational and regressional analysis.
Personality age and gender were controlled.
4.1.2 Participants and Procedure
Participants were 109 first and second year students at the University of Central
Lancashire in the academic year 2007-2008, who had been contacted through verbal
requests in lectures and workshops and asked to take part in an emotional intelligence
study. Participants were also given an incentive to take part. Participants were given
the Swinburne University Emotional Intelligence Test (SUEIT); the International
Personality Item Pool (IPIP; Goldberg, 1999); the healthy days Health Related Quality
of Life questionnaire (HRQOL; CDC); the health behaviour questionnaire;
the health care access questionnaire, the Social Support Network Inventory (SSNI;
Flaherty, Gaviria & Pathak, 1983); and the life events questionnaire (Paykel, 1983).
The ages of participants ranged from 18 to 39, (mean age 19.69 years, standard
deviation 4.43). As this is a young sample age will be considered as a control variable

- 59 -
4.1.3 Materials
EI Measures
Swinburne University Emotional Intelligence Test (SUEIT; Palmer & Stough, 2001)
The SUIET demonstrates good content validity as the measure’s five factors represent
good coverage of the EI domain mapping well on to the (1997) Mayer & Salovey
model. They also demonstrate good focus on the EI domain, and items do not refer to
constructs other than EI; for example in addition to EI the TEIQue includes optimism,
while the Schutte assesses social skills. The SUEIT has demonstrated utility by
explaining unique variance in a number of published studies predicting outcomes such
as life satisfaction (Gannon & Ranzijin, 2005), leadership (Downey, Papageorgiou &
Stough, 2006), and critical and detached behaviour (Moss, Ritossa & Nga, 2006). The
SUEIT has also been shown to have good internal reliability (Rajendran, Downey &
Stough, 2007) and test re-test reliability (Palmer & Stough, 2001). For the current study
cronbach alpha coefficients were as follows: Emotional Recognition and expression
α=.80; Emotional Control α=.71.
Personality Measure
International Personality Item Pool (IPIP)
The IPIP has been developed as a free measure of personality, has good reliability and
validity, and correlates well to the NEO-FFI (Gow, Whiteman & Pattie, 2005). It was
developed to provide a public domain measure of personality. It has 50 statements
scored on a scale of 1 (Very inaccurate for me) to 5 (Very accurate for me). The scale
yields 5 subscale scores: Neuroticism; Extroversion; Agreeableness; Openness; and
Conscientiousness. For each subscale the possible scores range from 0 to 50. For
participants from cohort one their personality scores from study one were used. For
cohort two participants reliability was found to be: Neuroticism: α=.85, Extroversion:
α=.90, Openness: α=.68, Agreeableness: α=.84; Conscientiousness: α=.79. For
Openness removal of any item would decrease internal reliability.
Stressor Measure
The Life Events Questionnaire
This is an inventory of 34 stressful life events which participants have to indicate if they
have experienced in the last year, and if so how upsetting they found the event on a
scale of 1 (not upsetting at all) to 4 (very upsetting). The questionnaire was derived
from Paykel’s (1983) interview for recent life events. In analysis only the frequency of

- 60 -
life events was used, not the total score, as frequency cannot be argued to be impacted
upon by mood or affective disorder (Roy, Steptoe, & Kirschbaum, 1998). This
measure is an inventory and as such does not have reliability or validity information.
Social Support Measure
The Social Support Network Inventory (SSNI; Flaherty, Gaviria & Pathak, 1983)
This measure asks participants to consider the five most important people in their lives.
They are then asked to rate them on a number of statements using a scale of 1 (not true
at all) to 5 (Very true). The scale assesses five subscales: Availability of support;
practical help; reciprocity; emotional support and event related support. In the current
study reliability was found to be: Availability of support α=.68; practical help α=.75;
reciprocity α=.82; emotional support α=.54; event related support α=. 84; and overall
total score α=.89. For the subscales with poor internal reliability removing items would
not have increased reliability to an acceptable level (of above α=.70).
Health Measures
The Behavioral Risk Factor Surveillance System (BRFSS; Center for Disease Control
and Prevention [CDC], 2006).
Questions from this measure were used to assess health impacting behaviours carried
out by participants. As an inventory without subscales or total scores this questionnaire
does not have reliability or validity information. Responses to each question are treated
as a separate measure.
Smoking information is measured with three questions: ‘have you smoked at least 100
cigarettes in your entire life?’ (a= yes, b=no); ‘do you now smoke cigarettes everyday,
some days or not at all?’ (a= everyday, b= some days, c= not at all); ‘during the past 12
months have you stopped smoking for one day or longer because you were trying to
quite smoking?’ (a= yes, b= no);
Alcohol intake is assessed with four questions: ‘during the past 30 days on
approximately how many days did you have at least one alcoholic drink’; ‘on the days
you drank about how many units did you drink?’ (units are explained and examples
given); ‘How many times during the past 30 days did you have 5 units or more on one
occasion?’; ‘During the past 30 days, what is the largest number of units of alcohol you
had on any occasion?’.

- 61 -
Drug taking is assessed with two questions: ‘have you taken non prescribed drugs or
used substances in your entire life?’ (a=yes, b=no); ‘During the past 30 days on
approximately how many days have you taken non prescribed drugs or used
substances?’.
Health Related Quality of Life questionnaire (HRQOL; CDC);
The HRQOL asks about how many of the past 30 days the participant has experienced
several health related problem, including the following: had poor physical health; had
been prevented from normal activities by poor physical health; found it hard to
complete normal activities due to Pain; not had enough rest or sleep; been very health
and full of life. The questionnaire also asks about the participants perceived general
health (from a=excellent, to e= poor). As an inventory without subscales or total scores
this questionnaire does not have reliability or validity information. Responses to each
question are treated as a separate outcome measure.
4.2 Results
4.2.1 Missing data
After data collection as much missing data was recovered as possible. Then missing
data routines were run to recover random missingness. EM missing data routines were
used to overcome such missing data in questionnaires at item level, before subscales
were calculated. Normal distribution of data was assumed, a maximum of 25 iterations
were used, and no nominal data was included in the MDR. Analyses revealed that only
a maximum of 1.6% missingness was found in the variables therefore and the extent of
substitution performed was acceptable. Tabachnick and Fidell (2001) recommend a
general guideline of more than 5% missing data as being potentially problematic.
4.2.2 Data screening
Assumptions of multivariate analysis (Tabachnick & Fidell, 2001) were investigated
prior to analyses. Before conducting the multiple regression, basic data screening was
completed to test dependent variables for normality and outliers, and to identify
multicollinearity. Screening began with checks for errors within the data file, then the
missing data routine were applied. Checks for multicollinearity (r > .8) revealed no
evidence of multicollinearity within variables. As multiple regression is sensitive to
- 62 -
singularity (Pallant, 2006), either total scores or subscales scores were used in analyses,
but not both at the same time.
Outliers, both univariate and multivariate, were identified using procedures outlined in
Tabachnick and Fidell (2001), and it was intended that univariate outliers (extreme
scores on one variable only) would be retained while cases with multivariate outliers
(those with unusual combinations of scores on more than one variable) would be
deleted. Extreme cases were identified as extreme outliers using box plots, defined as
more than three box-lengths from the edge of the box. As with study one, no
multivariate outliers were found in this way, so assumptions of normality of distribution
of the variables were then explored.
In checking for normality of distribution, some variables (Stressful life events,
Emotional control, all health and depression measures, all social support variables, plus
personality subscales neuroticism, extroversion, openness, and agreeableness) presented
evidence of non normal distribution (Kolmogorov-Smirnov values p<.05). However as
the 5% trimmed means and inspection of histograms (and skewness and kurtosis values)
revealed that the assumptions of univariate normality were not severely violated, this
was not considered problematic. Additionally positively skewed distributions would be
expected in health, stress and coping, as while the majority of participants would be
expected to be in good health and experiencing a low level of life event stress, some
individuals will be experiencing major health issues or stressors and their scores will
effect tests of normality. It would not be desirable to remove such scores as they
provide necessary variance in both independent and dependent variables.
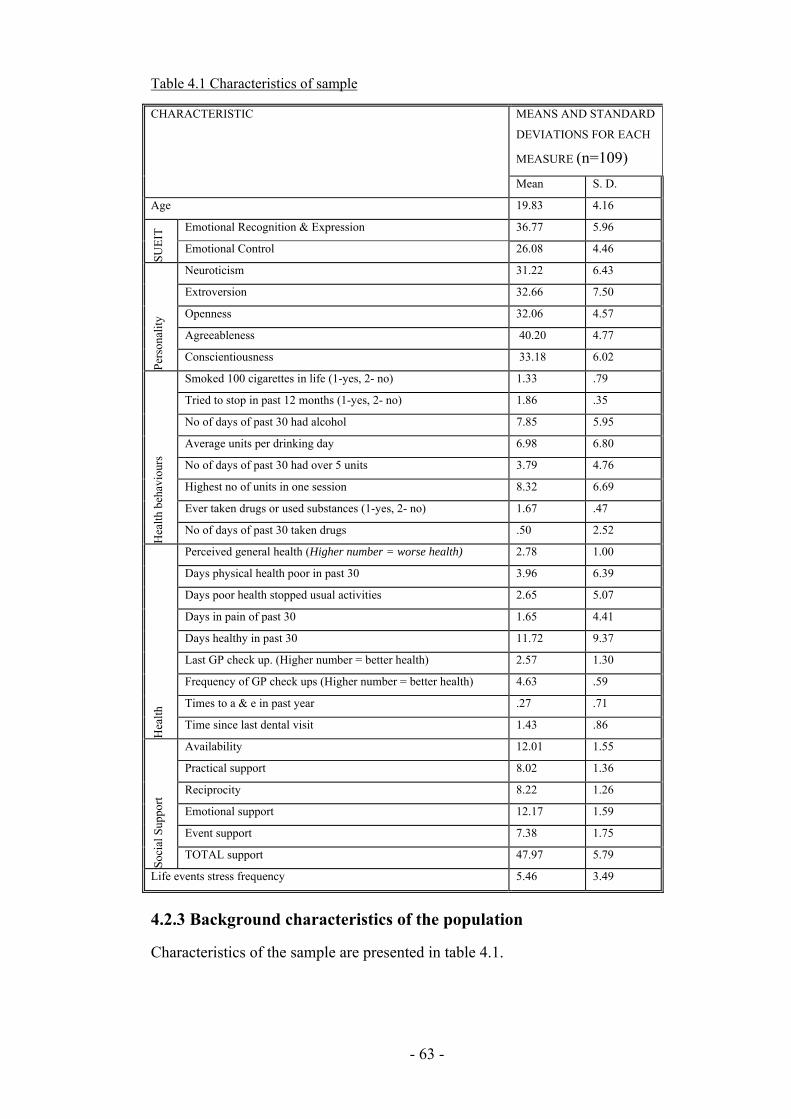
- 63 -
Table 4.1 Characteristics of sample
MEANS AND STANDARD
DEVIATIONS FOR EACH
MEASURE (n=109)
CHARACTERISTIC
Mean S. D.
Age 19.83 4.16
Emotional Recognition & Expression 36.77 5.96
SUE
IT
Emotional Control 26.08 4.46
Neuroticism 31.22 6.43
Extroversion 32.66 7.50
Openness 32.06 4.57
Agreeableness 40.20 4.77
Per
sona
lity
Conscientiousness 33.18 6.02
Smoked 100 cigarettes in life (1-yes, 2- no) 1.33 .79
Tried to stop in past 12 months (1-yes, 2- no) 1.86 .35
No of days of past 30 had alcohol 7.85 5.95
Average units per drinking day 6.98 6.80
No of days of past 30 had over 5 units 3.79 4.76
Highest no of units in one session 8.32 6.69
Ever taken drugs or used substances (1-yes, 2- no) 1.67 .47
Hea
lth
beha
viou
rs
No of days of past 30 taken drugs .50 2.52
Perceived general health (Higher number = worse health) 2.78 1.00
Days physical health poor in past 30 3.96 6.39
Days poor health stopped usual activities 2.65 5.07
Days in pain of past 30 1.65 4.41
Days healthy in past 30 11.72 9.37
Last GP check up. (Higher number = better health) 2.57 1.30
Frequency of GP check ups (Higher number = better health) 4.63 .59
Times to a & e in past year .27 .71
Hea
lth
Time since last dental visit 1.43 .86
Availability 12.01 1.55
Practical support 8.02 1.36
Reciprocity 8.22 1.26
Emotional support 12.17 1.59
Event support 7.38 1.75
Soc
ial S
uppo
rt
TOTAL support 47.97 5.79
Life events stress frequency 5.46 3.49
4.2.3 Background characteristics of the population
Characteristics of the sample are presented in table 4.1.

- 64 -
Normative Data
Means and standard deviations for both the current sample and published normative
data (using large samples sizes) for the SUEIT are given in table 4.2. Significant
differences are highlighted, indicating the extent of deviation by current sample from
the scores of general population.
Normative data for the CDC health related quality of life questionnaire is not available.
However data from the British household survey for England 2008 includes responses
to one identical question relating to the participants own perceived health status. This
question asks ‘How is your health in general? Participants rated their health on a scale
of 1- Very Good to 5 Very Bad and responses indicate a mean score of 1.83, indicating
better perceived health at population level than the student samples in study 2 who
report a mean score of 2.78 (this was later reverse scored to 3.22 so that higher scores
indicated better health, allowing more intuitive interpretation). It is unexpected that
this student sample report worse than average health given their young age, although
findings are consistent with study 1. However, worse than average health along with the
large standard deviation (and thus variance in health scores) indicate that analyses are
more likely to find statistically significant relationships where they exist.
Table 4.2. Means and SD for SUEIT in study two sample & from technical manuals
STUDY THREE
SUEIT
TECHNICAL
MANUAL DATA
GANNON &
RANZIJN (2005).
Mean SD Mean SD Mean SD
ERE 36.77 5.96 38.51** 4.90 39.27** 5.87
SUE
IT
EC 26.08 4.46 31.66** 3.94 28.53** 4.96
Difference from study one mean ** Significant at p<.01 level.
One-sample t-tests revealed that for Study two SUEIT scores were all significantly
lower than previously reported results and technical manual data.
For technical manual comparisons, two tailed one sample t-test revealed the cohort of
the current study to have significantly lower means for both subscales: Emotional
Recognition & Expression t (108) = 3.05, p<.01; Emotional Control t (108) = 13.05, p<
.01. For comparisons with Gannon and Ranzijn (2005), two tailed one sample t-tests

- 65 -
revealed the current study to have significantly lower means for both subscales:
Emotional Recognition & Expression t (108)= 4.38, p<.01, and Emotional Control t
(108) = 5.73, p< .01. Past research suggests that EI increases with age (Mayer, Caruso
& Salovey, 2000), and therefore this predominantly young sample would be expected to
have lower EI scores than previously published data with older samples. The SUEIT
technical manual does not provide means ages of their sample, however, in support of
this notion Gannon and Ranzijn (2005) showed higher means for all SUEIT subscales
with an older sample.
4.2.4 Intercorrelations between variables
Relationship between Trait EI and personality
Table 4.3 presents correlation coefficients for personality (Agreeableness; Extroversion;
Conscientiousness; Neuroticism and Openness) and EI variables (Emotional
Recognition and Expression; Understanding the Emotions of Others; Emotions Direct
Cognition; Emotional Management; Emotional Control; Total EI).
Table 4.3. Relationships between trait EI (SUIET) subscales and personality.
PERSONALITY
Neuroticism Extroversion Openness Agreeableness Conscientiousness
ERE .01 .21* .28** .50** .13
EC -.47** .01 .13 .09 .08
* Significant at p< .05 level; ** Significant at p<.01 level.
Two tailed Spearman’s correlations revealed significant positive correlations between
ERE and personality subscales Extroversion, Openness and Agreeableness; and between
EC and Neuroticism.
Relationship between EI and health variables
Two tailed Pearson’s correlations (see Table 4.4) were conducted to identify significant
relationships between EI subscales and health variables. Correlations revealed that EC
was significantly related to health; positively with perceived general health and
negatively with days healthy. ERE was not significantly correlated with health,
therefore only EC was explored in regressional analyses as a predictor of health, and
only perceived general health and days health explored as dependent variables. For
potential mediational analyses correlations between EI, social support and unhealthy
- 66 -
behaviours are displayed in table 4.5. These reveal only one significant relationship
between EI and unhealthy behaviours; EC is significantly and negatively correlated with
days taken drugs.
To establish which control variables should be included in regressional analyses
correlations between potential control variables, health and EC are displayed in table
4.6. Only control variables which correlate significantly with both EC and the
dependent variable will be included in regressional analyses. Correlations between
control variables health and EC are displayed for later moderation analyses.

- 67 -
Table 4.4 Correlations between Trait EI, unhealthy behaviours & health related quality of life
* Significant at p< .05 level; ** Significant at p<.01 level.
Table 4.5 Correlations between Trait EI, unhealthy behaviours & social support.
UNHEALTHY BEHAVIOURS SOCIAL SUPPORT
Sm
oked
100
ci
gare
ttes
in li
fe
Sm
okin
g ha
bit
now
Tri
ed to
sto
p in
pa
st 1
2 m
onth
s
No
of d
ays
of p
ast
30 h
ad a
lcoh
ol
Ave
rage
uni
ts p
er
drin
king
day
No
of d
ays
of p
ast
30 h
ad o
ver
5 un
its
Hig
hest
no
of
unit
s in
one
se
ssio
n
Eve
r ta
ken
drug
s or
use
d su
b-
stan
ces
No
of d
ays
of p
ast
30 ta
ken
drug
s
Ava
ilab
ilit
y
Pra
ctic
al S
uppo
rt
Rec
ipro
city
Em
otio
nal S
uppo
rt
Eve
nt s
uppo
rt
Mea
n su
ppor
t
ERE .15 -.00 -.02 .02 .11 .08 .06 -.05 -.16 .31** .06 .33** .25** .30** .31**
SUE
IT EC -.00 .01 -.03 .01 -.05 .11 .04 -.02 -.19* -.06 -.18 .06 .04 -.04 -.08
* Significant at p< .05 level; ** Significant at p<.01 level.
HEALTH RELATED QUALITY OF LIFE
Per
ceiv
ed
gene
ral h
ealt
h D
ays
phys
ical
he
alth
poo
r in
in
pas
t 30
Day
s po
or
heal
th s
topp
ed
usua
l lif
e
Day
s in
pai
n of
pa
st 3
0
Day
s he
alth
y in
pa
st 3
0
Las
t GP
che
ck
up.
Fre
quen
cy o
f G
P c
heck
ups
fo
r il
lnes
s in
jury
or
othe
r co
ndit
ion
Tim
es to
a
& e
in p
ast
year
Tim
e si
nce
last
de
ntal
vis
it
ERE .04 -.50 .00 -.05 -.02 .13 .04 .02 -.18
.SU
EIT
EC .26** -.09 -.15 -.18 .31** -.01 .18 .00 .02

- 68 -
Table 4.6 Identifying control variables for Path A: correlations between potential control variables, EI subscales & related health variables
* Significant at p< .05 level; ** Significant at p<.01 level.
NB. Only the two health variables in bold are significantly correlated with the EI subscales, therefore only these are considered in regressional
analyses. The additional variables are included to inform selection of control variables included in later moderation analyses.
ERE EC
LIF
E E
VE
NT
S 0
7
PE
RC
EIV
ED
HE
AL
TH
08
DA
YS
PH
YS
ICA
L
HE
AL
TH
PO
OR
DA
YS
NO
T
AC
TIV
E 0
8
DA
YS
IN
PA
IN
OF
PA
ST
30
DA
YS
WIT
H
PO
OR
SL
EE
P
DA
YS
HE
AL
TH
Y
IN P
AS
T 3
0
LA
ST
GP
CH
EC
K
UP
. G
P V
ISIT
FR
EQ
.
TIM
ES
TO
A
& E
IN
PA
ST
Y
EA
R
TIM
E S
INC
E
LA
ST
DE
NT
AL
V
ISIT
Neuroticism -.02 -.48** .15 -.30 .17 .36** .16 .22* -.45** .07 -.31** .09 -.19*
Extroversion .25* -.01 .12 .07 -.03 -.08 -.09 -.01 .23* .03 .09 -.02 -.05
Openness .26** .17 .09 -.03 -.01 .15 .05 .22* -.01 .26** -.07 .15 -.04
Agreeableness .52** .04 .00 -.06 .11 .03 .07 .06 -.08 .15 .18 .00 -.13
Conscientiousness .12 .02 -.07 .02 -.20* .02 -.12 -.04 -.06 .11 .11 .08 -.19
Age .21* .08 .11 .03 -.10 -.02 .00 .01 .03 .07 -.15 .01 .03
Gender .13 -.32** -.08 -.31** .13 .11 .07 .09 -.41** .06 .09 -.30** -.13
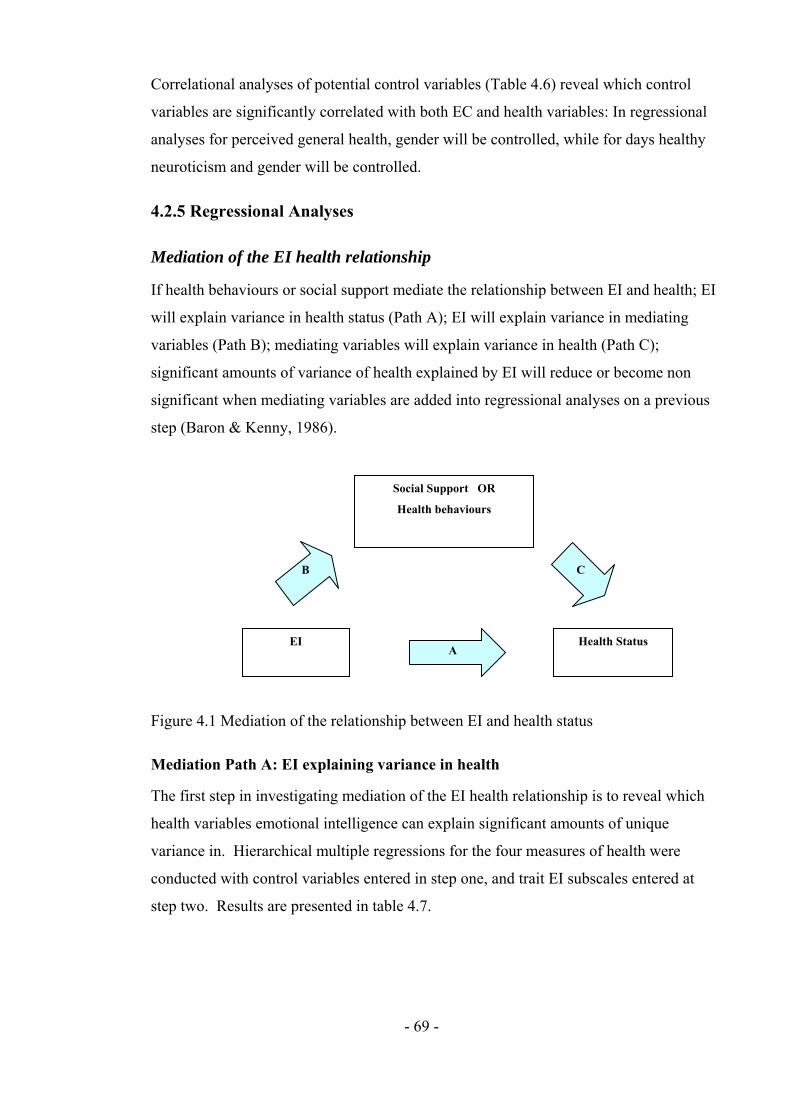
- 69 -
Correlational analyses of potential control variables (Table 4.6) reveal which control
variables are significantly correlated with both EC and health variables: In regressional
analyses for perceived general health, gender will be controlled, while for days healthy
neuroticism and gender will be controlled.
4.2.5 Regressional Analyses
Mediation of the EI health relationship
If health behaviours or social support mediate the relationship between EI and health; EI
will explain variance in health status (Path A); EI will explain variance in mediating
variables (Path B); mediating variables will explain variance in health (Path C);
significant amounts of variance of health explained by EI will reduce or become non
significant when mediating variables are added into regressional analyses on a previous
step (Baron & Kenny, 1986).
Figure 4.1 Mediation of the relationship between EI and health status
Mediation Path A: EI explaining variance in health
The first step in investigating mediation of the EI health relationship is to reveal which
health variables emotional intelligence can explain significant amounts of unique
variance in. Hierarchical multiple regressions for the four measures of health were
conducted with control variables entered in step one, and trait EI subscales entered at
step two. Results are presented in table 4.7.
A
C B
Health Status EI
Social Support OR
Health behaviours
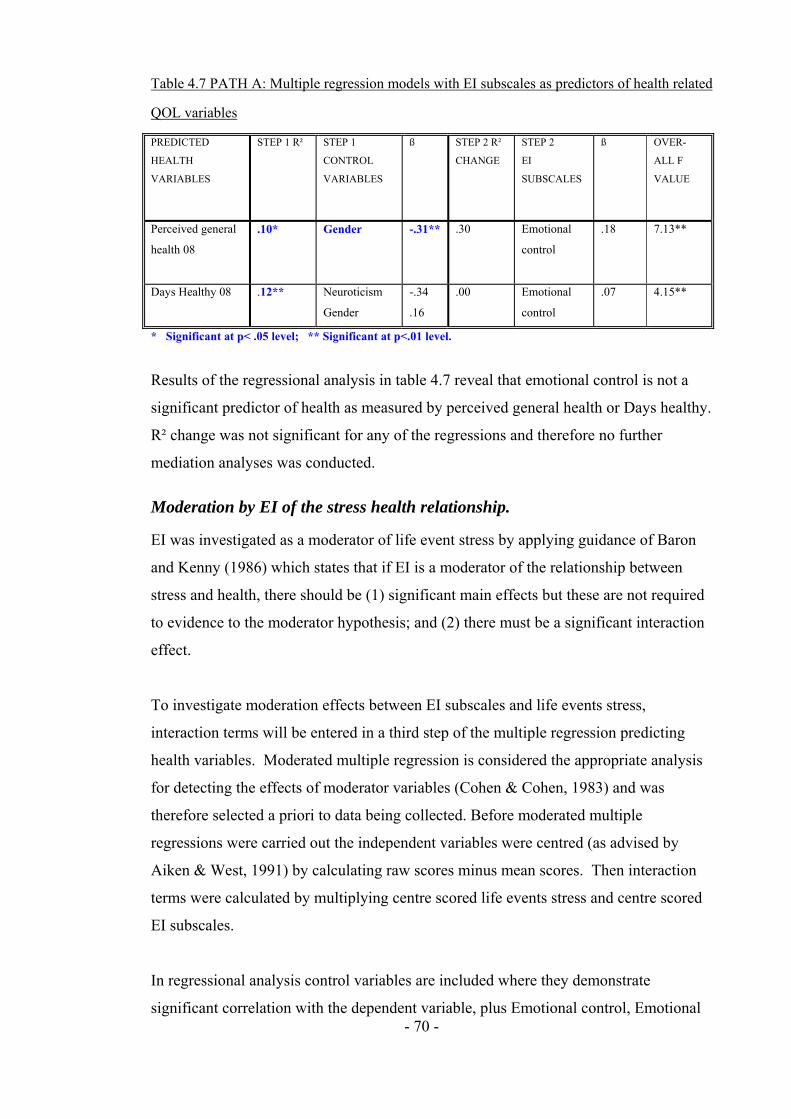
- 70 -
Table 4.7 PATH A: Multiple regression models with EI subscales as predictors of health related
QOL variables
PREDICTED
HEALTH
VARIABLES
STEP 1 R² STEP 1
CONTROL
VARIABLES
ß STEP 2 R²
CHANGE
STEP 2
EI
SUBSCALES
ß OVER-
ALL F
VALUE
Perceived general
health 08
.10* Gender -.31** .30 Emotional
control
.18 7.13**
Days Healthy 08
.12** Neuroticism
Gender
-.34
.16
.00 Emotional
control
.07 4.15**
* Significant at p< .05 level; ** Significant at p<.01 level.
Results of the regressional analysis in table 4.7 reveal that emotional control is not a
significant predictor of health as measured by perceived general health or Days healthy.
R² change was not significant for any of the regressions and therefore no further
mediation analyses was conducted.
Moderation by EI of the stress health relationship.
EI was investigated as a moderator of life event stress by applying guidance of Baron
and Kenny (1986) which states that if EI is a moderator of the relationship between
stress and health, there should be (1) significant main effects but these are not required
to evidence to the moderator hypothesis; and (2) there must be a significant interaction
effect.
To investigate moderation effects between EI subscales and life events stress,
interaction terms will be entered in a third step of the multiple regression predicting
health variables. Moderated multiple regression is considered the appropriate analysis
for detecting the effects of moderator variables (Cohen & Cohen, 1983) and was
therefore selected a priori to data being collected. Before moderated multiple
regressions were carried out the independent variables were centred (as advised by
Aiken & West, 1991) by calculating raw scores minus mean scores. Then interaction
terms were calculated by multiplying centre scored life events stress and centre scored
EI subscales.
In regressional analysis control variables are included where they demonstrate
significant correlation with the dependent variable, plus Emotional control, Emotional

- 71 -
recognition and expression, or stressful life events. These correlations are displayed in
table 4.6.
Results of regressional analyses are displayed in table 4.8. These regressions reveal no
significant interactions (where R² for the step was significant) between EI and life
events stress. Therefore, the current study finds that EI does not moderate the cross
sectional relationship between Life events stress and health.
Summary of findings.
Analyses reveal that trait EI subscales do not explain unique variance in health for the
current sample. Therefore, no further mediational analyses were conducted. Moderation
analyses also revealed no significant interactions between EI subscales and life events
stress when predicting health. Therefore, the current study concludes that neither
emotional control nor emotional recognition and expression are significant moderators
of the relationship between Stressor exposure and physical health.

- 72 -
Table 4.8 Moderational analysis for Study 2 health variables.
PREDICTED HEALTH
VARIABLES
STEP 1 R²
CHANGE
STEP 1 CONTROL
VARIABLES
ß STEP 2 R²
CHANGE
STEP 2 EI
SUBSCALES
ß STEP3 R²
CHANGE
STEP 3 INTER-
ACTIONS
ß OVER-ALL
F
Perceived general health (Higher number = better health)
.01 Gender .09 .14** ERE EC LE Stress
.69
.06
.00
.03 ERE x Stress EC x Stress
.19
.01 3.03*
Days physical health poor in in past 30
- None - .01 ERE EC LE Stress
-.05 -.04 .09
.03 ERE x Stress EC x Stress
.01
.16 .75
Days poor health stopped usual activities
- None - .09* ERE EC LE Stress
-.08 -.22* .16
.03 ERE x Stress EC x Stress
-.19 .03
2.55*
Days in pain of past 30 - None - .03 ERE EC LE Stress
-.05 -.07 .13
.04 ERE x Stress EC x Stress
.20
.07 .61
Days with poor sleep
.10 Neuroticism Openness
.24*
.23* .02 ERE
EC LE Stress
-.09 -.05 .07
.00 ERE x Stress EC x Stress
.05
.01 1.90
Days healthy in past 30 .34 Neuroticism Extroversion Gender
-.36** .18* -.33**
.03 ERE EC LE Stress
-.04 .09 -.16
.04 ERE x Stress EC x Stress
.21*
.01 7.53
Last GP check up.
.07** Openness .26** .06 ERE EC LE Stress
.02 -.05 -.23*
.02 ERE x Stress EC x Stress
-.07 .11
2.72*
Freq of GP check ups for illness injury or other condition
.10* Neuroticism -.31** .08* ERE EC LE Stress
.09 04 -.28**
.05 ERE x Stress EC x Stress
.24*
.03 4.17**
Times to a & e in past year
.09 Gender -.30 .02 ERE EC LE Stress
.05 -.12 .06
.00 ERE x Stress EC x Stress
.04
.00 2.00
Time since last dental visit
.04 Neuroticism -.19 .02 ERE EC LE Stress
-.13 -.02 .02
.02 ERE x Stress EC x Stress
-.14 .11
1.41
* Significant at p< .05 level; ** Significant at p<.01 level.
- 73 -
4.3 Discussion
Regressional analyses revealed that trait EI subscales did not explain unique variance in
health for the current sample. Therefore, no further mediation analyses were conducted.
The finding that neither ERE nor EC could explain significant unique variance in health
measures replicates findings from study one. These findings could indicate that the
relationship between EI and health is not visible cross sectionally but is seen
longitudinally. This notion fits with previous research suggesting that the impact of
stressor exposure on health may take months or years to manifest (Eaton, 1978, cited
Cohen et al, 1997). Study 1 reported significant correlations between trait EI and both
social support and coping, and also reported significant correlations between social
support and health. In combination, results could indicate that at onset of a stressor, EI
may impact upon social support or coping, but that the benefits for health may not be
seen for several months. This implies that when investigating the relationship between
EI, coping, and health, longitudinal exploration of the relationship between EI and
health may be more revealing than cross sectional investigation. Furthermore, although
there is an assumption that the influence of life events stressor upon health will manifest
within a year (Holmes, 1979), studies using longer time intervals have found higher
levels of correlation between life events and health (Eaton, 1978, cited Cohen et al,
1997). This may indicate that longer time frames may be more appropriate, especially
since stressful life events reported by participants within the last year, will generally
have occurred less than a year ago. For this reason, study three employs a longitudinal
design tracking health 15 months from the time participants report their life event stress.
Contrary to previous research, of the nine unhealthy behaviours investigated, the current
study found only one significant relationship between EI and unhealthy behaviours,
specifically ‘days taken drugs’. This finding is unexpected as a recent systematic review
of EI and addiction (Kun & Demetrovics, 2010) concluded that low EI was associated
with more intensive smoking, alcohol use and illicit drug use, moreover reporting that
subscales relating to ‘emotion regulation’ and ‘decoding and differentiating emotions’
were the most important predictors; subscales which mirror the EI subscales used in the
current study. Such incongruence suggests that the results of the current study are due
to the EI measures used; low statistical power is deemed unlikely given that a-priori
- 74 -
sample size calculations (Appendix D) base on effect sizes reported in meta analyses
indicate that sufficient sample sizes were obtained.
Also contrary to study 1, findings from study 2 reveal that EI subscales do not
significantly moderate the relationship between exposure to life event stressors and
health status. These interactions will be further investigated, using a longitudinal design
in study 3.

- 75 -
Chapter Five: The Longitudinal Relationship Between Trait
Emotional Intelligence and Physical Health.
The aim of study 3 was to extend studies 1 and 2 by investigating the longitudinal
relationship between Emotional intelligence (EI) and health, asking if ERE or EC
moderated the relationship between stressful life events and health, and whether the
relationship between these EI subscales and health was mediated by coping or social
support.
While studies 1 and 2 found that ERE and EC moderate the relationship between
stressor exposure and health, they provided no evidence that EI subscales can explain
variance in health scores cross-sectionally. Previous research suggests that the impact
of stressor exposure on health may take months or years to manifest (Eaton, 1978, cited
Cohen et al, 1997). Therefore if, as moderation results suggest, EI does protect health
from the effects of stress, main effects between trait EI and health may not be visible
cross sectionally. Interestingly, study 1 also reported significant correlations between
social support and health suggesting that at onset of a stressor, EI may impact upon
social support or coping, but that the benefits for health may not be seen for several
months. This implies that when investigating the relationship between EI, coping, and
health, longitudinal exploration of the relationship between EI and health may be more
revealing than cross sectional investigation.
The benefits of mediating variables may not be visible cross sectionally if the negative
impact of stress on health takes a longitudinal time course. Indeed, research
investigating the effects of coping on health has found that passive coping predicts ill
health symptomology in AIDs patients longitudinally but not cross sectionally (Stein &
Rotheram-Borus, 2004). The current study will investigate the proposition that ERE or
EC are associated with better health longitudinally, and that this relationship is mediated
by coping styles and social support. Previous research reports that EI is predictive of
social support and coping styles; further, both coping styles and social support may
buffer individuals from the impact of stressful life events. It is, therefore, reasonable to
propose that following stressful life events, those with higher EI will be found to have

- 76 -
better health longitudinally, while those with lower EI will have worse health when the
effects of stressor exposure manifest.
The current study investigates the ability of Trait EI subscales ERE and EC to predict
health longitudinally over 12 and 15 months. Based on previous research, it was
predicted that (1) ERE and EC would explain unique variance in health over
personality; (2) That social support would mediate the longitudinal relationship between
EI subscales and health status; (3) that coping responses would mediate the longitudinal
relationship between EI subscales and health; and (4) that Trait EI subscales would
moderate the longitudinal relationship between exposure to stressors and health.
5.1. Method
5.1.1 Design
The relationships between Trait EI subscales ERE and EC, health behaviours and health
quality of life were investigated longitudinally through correlational and regressional
analysis. Hierarchical regressions were used to test whether Trait EI could predict health
at time two (T2) or three (T3), controlling for health at time one (T1). In all regressions,
personality was measured and assessed for inclusion as a control variable as is the best
practice when investigating trait EI; this is required if ERE and EC are to provide
evidence of incremental validity as previous studies have found that trait EI shares
variance with personality (O’Connor & Little, 2003; Davies, Stankov & Roberts, 1998;
Dawda & Hart, 2000). Age and gender were also controlled as the sample was
predominantly female and under the age of 21.
5.1.2 Participants and Procedure
At time one (T1) 169 participants were recruited. A year later at time two (T2) these
participants were contacted, 83 of whom participated. A further three months later at
time three (T3) all time one participants were contacted again, 45 of whom participated.
Participants were students at the University of Central Lancashire who were contacted
through verbal requests in lectures and workshops and asked to take part in a 15-month
longitudinal study looking at the relationship between emotional intelligence and health.

- 77 -
In April 07, participants were recruited and were followed up in April 2008 and July
2008.
These participants completed a number of questionnaires. In April 2007 they were given
the Swinburne University Emotional Intelligence Test (SUEIT); the brief cope
questionnaire, the life events questionnaire, the Social Support Network Inventory
(SSNI; Flaherty, Gaviria & Pathak, 1983), and the International Personality Item Pool
(IPIP; Goldberg, 1999). In July 2008, participants were given the healthy days Health
Related Quality of Life questionnaire (HRQOL; CDC); the health behaviour
questionnaire; the health care access questionnaire, the life events questionnaire
(Paykel, 1983); and the social support network inventory (SSNI; Flaherty, Gaviria &
Pathak, 1983). 169 participants were recruited, 83 of whom completed longitudinal
follow up at either time two or three (or both). Of the 83 participants, 70 completed
follow up at T2 (12 months later), and 45 completed follow up at T3 (15 months later).
Some of the participants who completed time three had not completed time two
measures.
Table 5.1 Cross time comparison for ERE and EC
TIME 1 (N=165) TIME 2 (N=83) TIME 3 (N=45)
Mean S.D. Mean S.D.
T2 DIFF
FROM
T1 T-
TEST
Mean S.D.
T3 DIFF
FROM
T1 T-
TEST
Emotional Recognition
& Expression
35.78 5.81 37.37 5.45 2.45* 38.11 5.54 1.57
SU
EIT
(T
rait
EI)
Emotional Control 26.14 5.73 27.62 5.71 .08 28.98 6.15 .76
Difference from norm data ** Significant at p<.01 level.
The loss of participants from T1 to T2 was 59%, and from T1 to T3 was 74%.
Inspection of the sample across time points (table 5. 1) reveals that of the trait EI scores
in the smaller samples at T2 and T3, only the T2 ERE score is significantly different to
T1. This suggests that the retained longitudinal sample is not substantially different on
EI scores to the full T1 cohort.

- 78 -
5.1.3 Materials
EI Measures
Swinburne University Emotional Intelligence Test (SUEIT; Palmer & Stough, 2001)
The SUIET demonstrates good content validity as the measure’s five factors represent
good coverage of the EI domain mapping well on to the (1997) Mayer and Salovey
model. The SUEIT has demonstrated utility by explaining unique variance in a number
of published studies predicting outcomes such as life satisfaction (Gannon & Ranzijin,
2005), leadership (Downey, Papageorgiou & Stough, 2006), and critical and detached
behaviour (Moss, Ritossa & Nga, 2006). The SUEIT has also been shown to have good
internal reliability (Rajendran, Downey & Stough, 2007) and test re-test reliability
(Palmer & Stough, 2001). For the current study cronbach alpha coefficients were as
follows: Emotional Recognition and expression (α=.80) and Emotional Control
(α=.71).
Personality Measure
International Personality Item Pool (IPIP)
The IPIP has been developed as a free measure of personality, has good reliability and
validity, and correlates well to the NEO-FFI (Gow, Whiteman & Pattie, 2005). It was
developed to provide a public domain measure of personality. It has 50 statements
scored on a scale of 1 (Very inaccurate for me) to 5 (Very accurate for me). The scale
yields 5 subscale scores: Neuroticism; Extroversion; Agreeableness; Openness; and
Conscientiousness. For each subscale the possible scores range from 0 to 50. For
participants from cohort one their personality scores from study one were used. For
cohort two participants reliability was found to be: Neuroticism: α=.85, Extroversion:
α=.90, Openness: α=.68, Agreeableness: α=.84; Conscientiousness: α=.79. For
Openness removal of any item would decrease internal reliability.
Stressor Measure
The Life Events Questionnaire
This is an inventory of 34 stressful life events which participants have to indicate if they
have experienced in the last year, and if so how upsetting they found the event on a
scale of 1 (not upsetting at all) to 4 (very upsetting). The questionnaire was derived
from Paykel’s (1983) interview for recent life events. In analysis only the frequency of
life events was used, not the total score, as this cannot be argued to be impacted upon by

- 79 -
mood or affective disorder (Roy, Steptoe, & Kirschbaum, 1998). This measure is an
inventory and as such does not have reliability or validity information.
Social Support Measure
The Social Support Network Inventory (SSNI; Flaherty, Gaviria & Pathak, 1983)
This measure asks participants to consider the five most important people in their lives.
They are then asked to rate them on a number of statements using a scale of 1 (not true
at all) to 5 (Very true). The scale assesses five subscales: (1) availability of support; (2)
practical help; (3) reciprocity; (4) emotional support; and (5) event related support. In
the current study reliability was good: availability of support α=.68; practical help
α=.75; reciprocity α=.82; emotional support α=.54; event related support α=. 84; and
overall total score α=.89. For the subscales with poor internal reliability removing
items would not have increased reliability to an acceptable level (of above α=.70).
Health Measures
Health Related Quality of Life questionnaire (HRQOL; Centre for Disease Control);
The HRQOL asks about how many of the past 30 days the participant has: had poor
physical health; been prevented from normal activities by poor physical health; found it
hard to complete normal activities due to Pain; not had enough rest or sleep; been very
healthy and full of life. The questionnaire also asks about the participants perceived
general health (from a=excellent, to e= poor). As an inventory without subscales or total
scores this questionnaire does not have reliability or validity information. Responses to
each question are treated as a separate outcome measure.
5.2 Results
5.2.1 Missing data
Following data collection, and after as much missing data was recouped from students
as possible, missing data routines were run. Only random missingness was recovered in
this way. EM missing data routines were used to overcome such missing data in
questionnaires at item level, before subscales were calculated. Normal distribution of
data was assumed, a maximum of 25 iterations were used, and no nominal data was
included in the MDR. Analyses revealed that only a maximum of 1.6% missingness
was found in the variables therefore and the extent of substitution performed was

- 80 -
acceptable. Tabachnick and Fidell (2001) recommend a general guideline of more than
5% missing data as being potentially problematic.
5.2.2 Data screening
Assumptions of multivariate analysis (Tabachnick & Fidell, 2001) were investigated
prior to analyses. Before conducting the multiple regression, basic data screening was
completed to test dependent variables for normality and outliers, and to identify
multicollinearity. Screening began with checks for errors within the data file, then the
missing data routine were applied. Checks for multicollinearity (r > .8) revealed no
evidence of multicollinearity within variables. Outliers, both univariate and
multivariate, were identified using procedures outlined in Tabachnick and Fidell (2001),
and it was intended that univariate outliers (extreme scores on one variable only) would
be retained while cases with multivariate outliers (those with unusual combinations of
scores on more than one variable) would be deleted. Extreme cases were identified as
extreme outliers using box plots, defined as more than three box-lengths from the edge
of the box. As with study one, no multivariate outliers were found in this way, so
assumptions of normality of distribution of the variables were then explored.
In checking for normality of distribution, some variables (Stressful life events,
Emotional control, all health and depression measures, all social support variables, plus
personality subscales neuroticism, extroversion, openness, and agreeableness) presented
evidence of non normal distribution (Kolmogorov-Smirnov values p<0.05). However
as the 5% trimmed means and inspection of histograms (and skewness and kurtosis
values) revealed that the assumptions of univariate normality were not severely violated,
this was not considered problematic. Additionally, positively skewed distributions
would be expected in health, stress and coping, as while the majority of participants
would be expected to be in good health and experiencing a low level of life event stress,
some individuals will be experiencing major health issues or stressors and their scores
will affect tests of normality. It would not be desirable to remove such scores as they
provide necessary variance in both independent and dependent variables.
5.2.3 Background characteristics of the final sample
The means and standard deviations for the cohort are given in tables 5.2 and 5.3. These
data include T2 and T3.

- 81 -
Table 5.2 Characteristics of cohort
MEANS & STANDARD DEVIATIONS CHARACTERISTIC
Mean S. D. n
Age 19.52 4.41 169
Emotional Recognition & Expression 37.08 5.38 169
SU
EIT
Emotional Control 25.53 4.87 169
Neuroticism 31.15 6.76 169
Extroversion 33.43 6.72 169
Openness 32.11 4.49 169
Agreeableness 39.68 4.26 169
Per
sona
lity
Conscientiousness 33.47 5.62 169
General Health 3.88 .78 169
Last GP Visit 3.53 1.61 169
Hea
lth
T1
Frequency of GP visits 3.57 .74 169
Disengaged 18.98 4.81 169
Engaged 21.65 4.68 169
Cop
ing
Social 9.88 3.57 169
Availability 11.52 1.53 169
Practical support 7.95 1.09 169
Reciprocity 8.23 1.07 169
Emotional support 12.19 1.69 169
Event support 7.22 1.62 169
Soc
ial S
uppo
rt
TOTAL support 46.95 5.33 169
Life events stress frequency T1 6.17 3.26 169

- 82 -
Table 5.3 [Continued] Characteristics of cohort
MEANS & STANDARD
DEVIATIONS
CHARACTERISTIC
Mean S. D. n
Perceived general health (Higher number = better health) 3.98 .77 83
Days physical health poor in past 30 3.72 5.97 83
Days poor health stopped usual activities 2.27 4.37 83
Days in pain of past 30 .89 2.05 83
Days healthy in past 30 12.13 8.91 83
Last GP check up. (Higher number = better health) 2.63 1.29 83
Frequency of GP check ups (Higher number = better health) 4.66 .58 83
Times to a & e in past year .25 .70 83
Hea
lth
time
two
(T2)
Time since last dental visit 1.46 .95 83
Perceived general health (Higher number = better health) 3.56 .89 45
Days physical health poor in past 30 2.84 5.54 45
Days poor health stopped usual life 1.87 4.24 45
Days in pain of past 30 1.51 3.39 45
Days healthy in past 30 11.91 9.32 45
Last GP check up. (Higher number = better health) 2.38 1.57 45
Frequency of GP check ups (Higher number = better health) 4.69 .60 45
Times to a & e in past year .13 .41 45
Time since last dental visit 4.64 .92 45
Days poor sleep in past 30 6.53 7.87 45
Number of times taken exercise in past month 8.81 7.26 45
Weight 2.29 .55 45
Hea
lth
tim
e T
hree
(T
3)
Extent of health worries in past 3 months 3.31 .67 45
Normative Data
Means and standard deviations for both the current sample and published normative
data (using large samples sizes) for the SUEIT are given in table 5.4. One-sample t-tests
explored the differences between the norm data and the SUEIT subscales scores for the
study sample at T1, T2, and T3 Significant differences are highlighted, these indicate
the extent of deviation by current sample from the scores of general population.
Normative data for the CDC health related quality of life questionnaire is not available.
However data from the British household survey for England 2008 includes responses
to one identical question relating to the participants own perceived health status. This

- 83 -
question asks ‘How is your health in general? Participants rated their health on a scale
of 1- Very Good to 5 Very Bad and responses indicate a mean score of 1.83, indicating
better perceived health at population level than the student samples in study 3 who at T2
report a mean score of 2.02 (this was later reverse scored to 3.98), and at T3 2.44 (later
reversed scored to 3.56). It is unpredicted that this student sample report worse than
average health given their young age, although findings are consistent with study 1 and
2. However, worse than average health along with the large standard deviation (and
thus variance in health scores) indicate that analyses are more likely to find statistically
significant relationships where they exist.
T1 sample
For technical manual comparisons, two tailed one sample t-test revealed the cohort of
the current study to have significantly lower means for both subscales: Emotional
Recognition & Expression t (164) = 7.47, p<.05; and Emotional Control t (164) =6.17,
p< .01. For comparisons with Gannon and Ranzijn (2005), two tailed one sample t-tests
reveal the current study to have significantly lower means for both subscales: Emotional
Recognition & Expression t (164) =2.55, p<.05; and Emotional Control t (164) =11.86,
p< .01.
T2 sample
For technical manual comparisons, two tailed one sample t-test revealed the cohort of
the current study to have significantly lower means for both subscales: Emotional
Recognition & Expression t (82) = 2.42, p<.05; and Emotional Control t(82) = 11.47,
p< .01. For comparisons with Gannon and Ranzijn (2005), two tailed one sample t-
tests reveal the current study to have significantly lower means for both subscales:
Emotional Recognition & Expression t (82) = 3.71, p<.01; and Emotional Control t (82)
= 5.61, p< .01

- 84 -
Table 5.4 Means and SD for SUEIT in study four at the three time points & from technical manuals.
NORM DATA TIME 1 (N=165) TIME 2 (N=83) TIME 3 (N=45)
Mean S.D. Mean S.D.
T-TEST
SIG Mean S.D.
T-TEST
SIG Mean S.D.
T-TEST
SIG
1 SUEIT TECHNICAL MANUAL 39.27 5.87 35.78 5.81 .00** 37.37 5.45 .00** 38.11 5.54 .17 Emotional
Recognition &
Expression 2 Gannon & Ranzijn (2005). 37.08 5.38 35.78 5.81 .01* 37.37 5.45 .84 38.11 5.54 .22
1 SUEIT TECHNICAL MANUAL 28.53 4.96 26.14 5.73 .00** 27.62 5.71 .15 28.98 6.15 .63
SU
EIT
(T
rait
EI)
Emotional Control
2 Gannon & Ranzijn (2005). 25.53 4.87 26.14 5.73 .00** 27.62 5.71 .00** 28.98 6.15 .00**
Difference from norm data ** Significant at p<.01 level.

- 85 -
T3 sample
For technical manual comparisons two tailed one sample t-test revealed the cohort of
the current study to have significantly lower means for both subscales: Emotional
Recognition & Expression t (44)=1.40, p<.05; and Emotional Control t (44) = .49, p<
.01. For comparisons with Gannon and Ranzijn (2005), two tailed one sample t-tests
revealed the current study to have significantly lower means for both subscales:
Emotional Recognition & Expression t (44)= 1.25, p<.01; and Emotional Control t (44)
= 3.77, p< .01.
In summary, participants retained at each time point are significantly lower than
previously published norms. However, the retained longitudinal sample does not differ
in EI profile significantly form the full T1 cohort (see table 5.1), and therefore EI
characteristics are not likely to be impacting upon retention. Past research suggests that
EI increases with age (Mayer, Caruso & Salovey, 2000), and therefore this
predominantly young sample would be expected to have lower EI scores than
previously published data with older samples. The SUEIT technical manual does not
provide means ages of their sample, however, in support of this notion Gannon and
Ranzijn (2005) showed higher means for all SUEIT subscales with an older sample.
5.2.4 Intercorrelations between variables
Prior to regressional analysis, correlational analyses were conducted to ascertain
significant relationships, and to reveal if the personality control variables were related to
the trait EI subscales.
Relationship between Trait EI and personality
Table 5.5 presents correlation coefficients for personality (Agreeableness; Extroversion;
Conscientiousness; Neuroticism and Openness) and EI variables (ERE and EC).
Table 5.5 Relationships between trait EI (SUIET) subscales and personality.
PERSONALITY
Neuroticism Extroversion Openness Agreeableness Conscientiousness
ERE .00 .24* .15 .44** .14
EC -.33** .00 .12 -.01 .02
* Significant at p< .05 level; ** Significant at p<.01 level.

- 86 -
Two tailed Pearson’s correlations reveal significant relationships between trait EI and
facets of personality, specifically that EC is significantly and negatively related to
neuroticism and that ERE is significantly positively related to extroversion and
agreeableness. Therefore personality subscales will be considered as control variables
to provide evidence of divergent validity between trait EI and personality. The
correlations reveal no evidence of multicollinearity.
Correlations between trait EI, coping, social support and longitudinal health
related quality of life.
For the correlational and mediational analyses three paths between variables will be
tested. These represent the paths detailed by Baron and Kenny (1986) and are
illustrated in Figure 5.1.
Figure 5.1 Mediation of the relationship between EI and health status
Path A intercorrelations between Trait EI and health related QOL were calculated for
health at T2 and T3. These results are presented in Tables 5.6 and 5.7 respectively.
Two tailed Pearson’s correlations for Path A with health T2 reveal that EC is
significantly and positively related to Perceived health, while ERE is significantly and
positively related to health (measured by frequency of GP check ups) and significantly
and negatively related to the extent to which ill health reduced participant activity
levels. At T3 correlations indicated that EC was significantly and negatively related to
number of days health was poor, and days poor health reduced activity levels; and also
significantly and positively related to concern about health
- 87 -
Correlations between trait EI and longitudinal health related quality of life.
Correlations between EI and health T2 and T3 are presented in Tables 5.6 and 5.7
respectively. Analyses reveal that only three health variables at T2 and three at T3 have
significant relationships with EI subscales. Only these health variables are therefore
further investigated as having significant amounts of variance explained by EI
subscales. At T2 ERE was significantly and negatively correlated with the number of
days ill health stopped usual activities, and positive correlated with health as measured
by frequency of GP check ups; EC was significantly and positively associated with
perceived general health. At T3 ERE was not significantly correlated with any health
variables, however EC was significantly and positively associated with concern about
health, and significantly negatively associated with days physical health was poor, and
days ill health reduced usual activities.
So that only appropriate control variables were included in subsequent hierarchical
regressional analyses, correlation analyses were performed to identify which of the
personality and demographic variables demonstrated significant relationships with both
the health and appropriate EI subscales. (See tables 5.8 and 5.9). Potential control
variables were identified as being personality subscales, age, gender, and the three
health variables taken at time one.
Correlations between the potential control variables, EI subscales, and health T2 reveals
that only three of the control variables (Neuroticism, perceived health time one, and
agreeableness) have significant correlations with either of the two EI subscales,
therefore as only these variables are explored as control variables. For perceived general
health, neuroticism and perceived health 07 will be controlled, for days ill health
reduced activity no control variable is identified, and for frequency of GP visits,
agreeableness will be controlled for. At T3 no control variables correlate with both EI
subscales and the identified health variables, therefore no control variables will be
entered in regressions for T3.

- 88 -
Table 5.6 PATH A: Correlations between Trait EI, Personality and health related quality of life T2
HEALTH RELATED QUALITY OF LIFE T2
Perceived general health (Higher number = better health)
Days physical health poor in in past 30
Days poor health stopped usual activities
Days in pain of past 30
Days healthy in past 30
Last GP check up.
Freq of GP check ups for illness injury or other condition
Times to a & e in past year
Time since last dental visit
ERE .09 -.03 -.29* -.12 -.04 .17 .27* -.04 .02
SUE
IT
EC .28* -.08 -.17 -.23 .26 .04 .20 .07 .08
* Significant at p< .05 level; ** Significant at p<.01 level.
Table 5.7 PATH A: Correlations between Trait EI, Personality and health related quality of life T3
HEALTH RELATED QUALITY OF LIFE T3
Perceived general health (Higher number = better health)
Days physical health poor in in past 30
Days poor health stopped usual life
Days in pain of past 30
Days healthy in past 30
Last GP check up.
Freq of
GP check
ups
Times to a & e in past year
Time since last dental visit
Freq Exercise in past months
Weight class according to BMI (Higher number = heavier)
Concern about health
Days sleep was poor
ERE .11 -.09 -.15 .09 .11 -.13 -.23 -.02 .01 .05 .00 -.04 -.20
SUE
IT
EC .31 -.40** -.36* -.12 .23 .19 .28 -.24 .05 .25 -.07 .38* -.13
* Significant at p< .05 level; ** Significant at p<.01 level.

- 89 -
Table 5.8 Identifying control variables for Path A: correlations between potential control variables, EI subscales and health variables T2
* Significant at p< .05 level; ** Significant at p<.01 level.
NB. Only the three health variables in bold are significantly correlated with the EI subscales, therefore only these are considered in regressional
analyses. The additional variables are included to inform selection of control variables included in later moderation analyses.
ERE EC
LIF
E E
VE
NT
S 0
7
PE
RC
EIV
ED
HE
AL
TH
08
DA
YS
PH
YS
ICA
L
HE
AL
TH
PO
OR
DA
YS
NO
T
AC
TIV
E 0
8
DA
YS
IN
PA
IN
OF
PA
ST
30
DA
YS
WIT
H
PO
OR
SL
EE
P
DA
YS
HE
AL
TH
Y
IN P
AS
T 3
0
LA
ST
GP
CH
EC
K
UP
. G
P V
ISIT
FR
EQ
.
TIM
ES
TO
A
& E
IN
PA
ST
Y
EA
R
TIM
E S
INC
E
LA
ST
DE
NT
AL
V
ISIT
Neuroticism .10 -.41** .26* -.25* .08 .38** .06 .16 -.40** .14 -.30* .00 -.25*
Extroversion .23 -.01 .07 .16 .07 -.14 -.12 -.14 .27* -.02 -.04 .07 -.06
Openness .16 .07 .22 -.08 -.10 .15 .09 .15 -.08 .14 -.05 .24* -.01
Agreeableness .48** -.06 .22 -.16 .10 -.08 .02 -.07 -.04 .04 .27* -.10 -.10
Conscientiousness .12 .04 -.02 -.13 -.16 .20 .12 .04 -.15 .05 .10 .13 -.24*
Age -.13 .13 -.05 -.07 .05 .13 -.03 -.06 .03 -.02 .00 -.02 .30*
Gender .06 -.35** .15 -.20 .11 .05 .05 .02 -.31* .00 .12 -.36** -.12
Last GP 07 -.07 .12 -.24* .36 -.02 -.17 -.01 .02 .05 .13 .24 -.02 .17
GP freq 07 .23 .21 -.05 .24 .03 -.25 .02 -.21 .11 -.11 .27* .02 .07
Perceived health 07 .10 .35** -.06 .63** -.02 -.28* -.03 -.11 .27* .07 .18 .04 .15
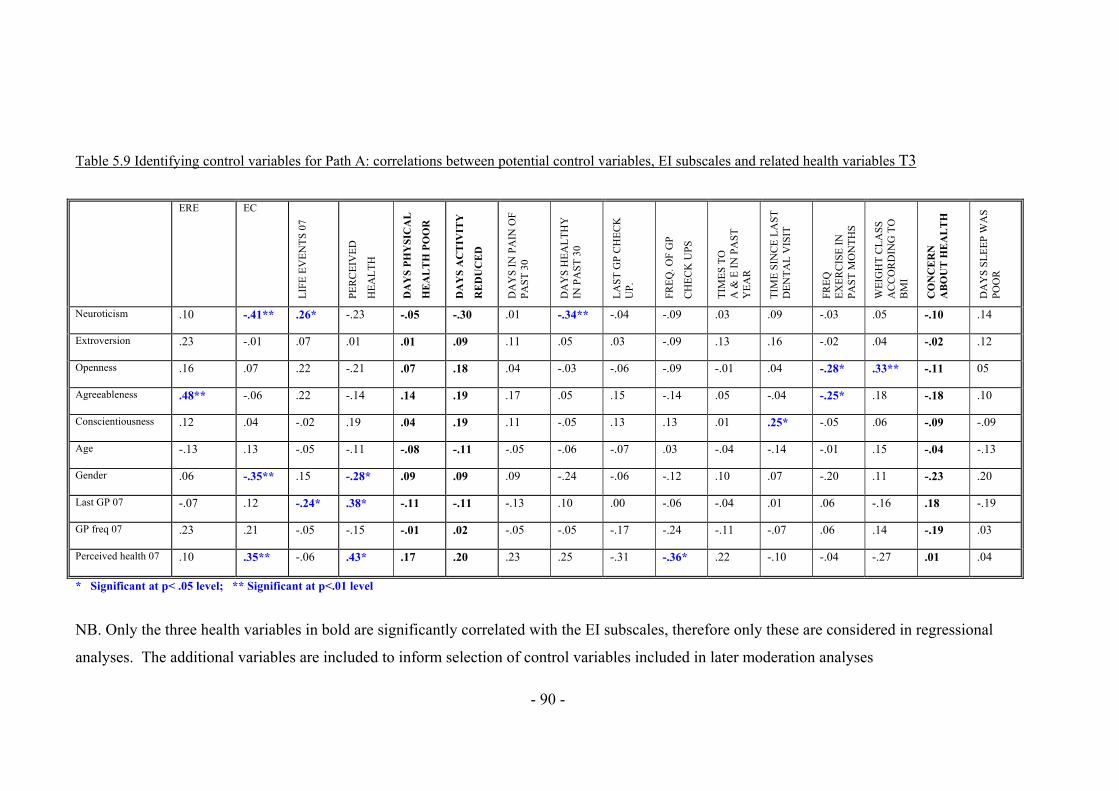
- 90 -
Table 5.9 Identifying control variables for Path A: correlations between potential control variables, EI subscales and related health variables T3
* Significant at p< .05 level; ** Significant at p<.01 level
NB. Only the three health variables in bold are significantly correlated with the EI subscales, therefore only these are considered in regressional
analyses. The additional variables are included to inform selection of control variables included in later moderation analyses
ERE EC
LIF
E E
VE
NT
S 0
7
PE
RC
EIV
ED
HE
AL
TH
DA
YS
PH
YS
ICA
L
HE
AL
TH
PO
OR
DA
YS
AC
TIV
ITY
RE
DU
CE
D
DA
YS
IN
PA
IN O
F
PA
ST
30
DA
YS
HE
AL
TH
Y
IN P
AS
T 3
0
LA
ST
GP
CH
EC
K
UP
. F
RE
Q. O
F G
P
CH
EC
K U
PS
TIM
ES
TO
A
& E
IN
PA
ST
Y
EA
R
TIM
E S
INC
E L
AS
T
DE
NT
AL
VIS
IT
FR
EQ
E
XE
RC
ISE
IN
P
AS
T M
ON
TH
S
WE
IGH
T C
LA
SS
A
CC
OR
DIN
G T
O
BM
I
CO
NC
ER
N
AB
OU
T H
EA
LT
H
DA
YS
SL
EE
P W
AS
P
OO
R
Neuroticism .10 -.41** .26* -.23 -.05 -.30 .01 -.34** -.04 -.09 .03 .09 -.03 .05 -.10 .14
Extroversion .23 -.01 .07 .01 .01 .09 .11 .05 .03 -.09 .13 .16 -.02 .04 -.02 .12
Openness .16 .07 .22 -.21 .07 .18 .04 -.03 -.06 -.09 -.01 .04 -.28* .33** -.11 05
Agreeableness .48** -.06 .22 -.14 .14 .19 .17 .05 .15 -.14 .05 -.04 -.25* .18 -.18 .10
Conscientiousness .12 .04 -.02 .19 .04 .19 .11 -.05 .13 .13 .01 .25* -.05 .06 -.09 -.09
Age -.13 .13 -.05 -.11 -.08 -.11 -.05 -.06 -.07 .03 -.04 -.14 -.01 .15 -.04 -.13
Gender .06 -.35** .15 -.28* .09 .09 .09 -.24 -.06 -.12 .10 .07 -.20 .11 -.23 .20
Last GP 07 -.07 .12 -.24* .38* -.11 -.11 -.13 .10 .00 -.06 -.04 .01 .06 -.16 .18 -.19
GP freq 07 .23 .21 -.05 -.15 -.01 .02 -.05 -.05 -.17 -.24 -.11 -.07 .06 .14 -.19 .03
Perceived health 07 .10 .35** -.06 .43* .17 .20 .23 .25 -.31 -.36* .22 -.10 -.04 -.27 .01 .04
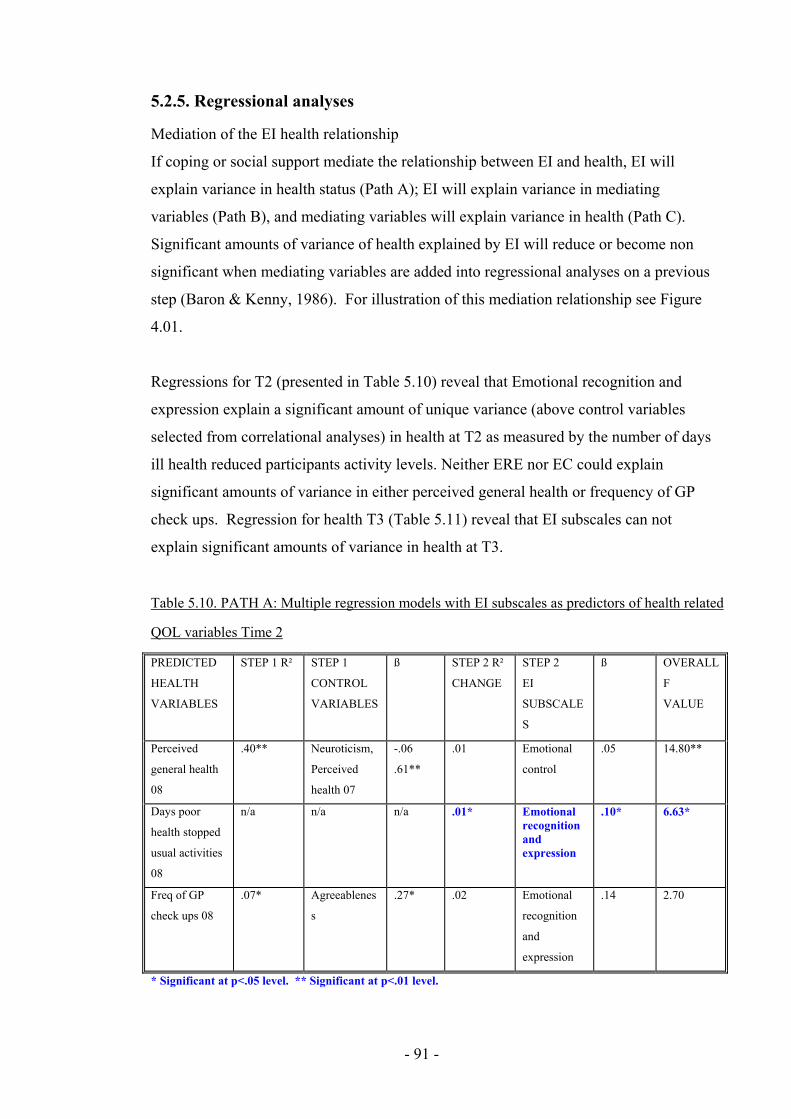
- 91 -
5.2.5. Regressional analyses
Mediation of the EI health relationship
If coping or social support mediate the relationship between EI and health, EI will
explain variance in health status (Path A); EI will explain variance in mediating
variables (Path B), and mediating variables will explain variance in health (Path C).
Significant amounts of variance of health explained by EI will reduce or become non
significant when mediating variables are added into regressional analyses on a previous
step (Baron & Kenny, 1986). For illustration of this mediation relationship see Figure
4.01.
Regressions for T2 (presented in Table 5.10) reveal that Emotional recognition and
expression explain a significant amount of unique variance (above control variables
selected from correlational analyses) in health at T2 as measured by the number of days
ill health reduced participants activity levels. Neither ERE nor EC could explain
significant amounts of variance in either perceived general health or frequency of GP
check ups. Regression for health T3 (Table 5.11) reveal that EI subscales can not
explain significant amounts of variance in health at T3.
Table 5.10. PATH A: Multiple regression models with EI subscales as predictors of health related
QOL variables Time 2
PREDICTED
HEALTH
VARIABLES
STEP 1 R² STEP 1
CONTROL
VARIABLES
ß STEP 2 R²
CHANGE
STEP 2
EI
SUBSCALE
S
ß OVERALL
F
VALUE
Perceived
general health
08
.40** Neuroticism,
Perceived
health 07
-.06
.61**
.01 Emotional
control
.05 14.80**
Days poor
health stopped
usual activities
08
n/a n/a n/a .01* Emotional recognition and expression
.10* 6.63*
Freq of GP
check ups 08
.07* Agreeablenes
s
.27* .02 Emotional
recognition
and
expression
.14 2.70
* Significant at p<.05 level. ** Significant at p<.01 level.
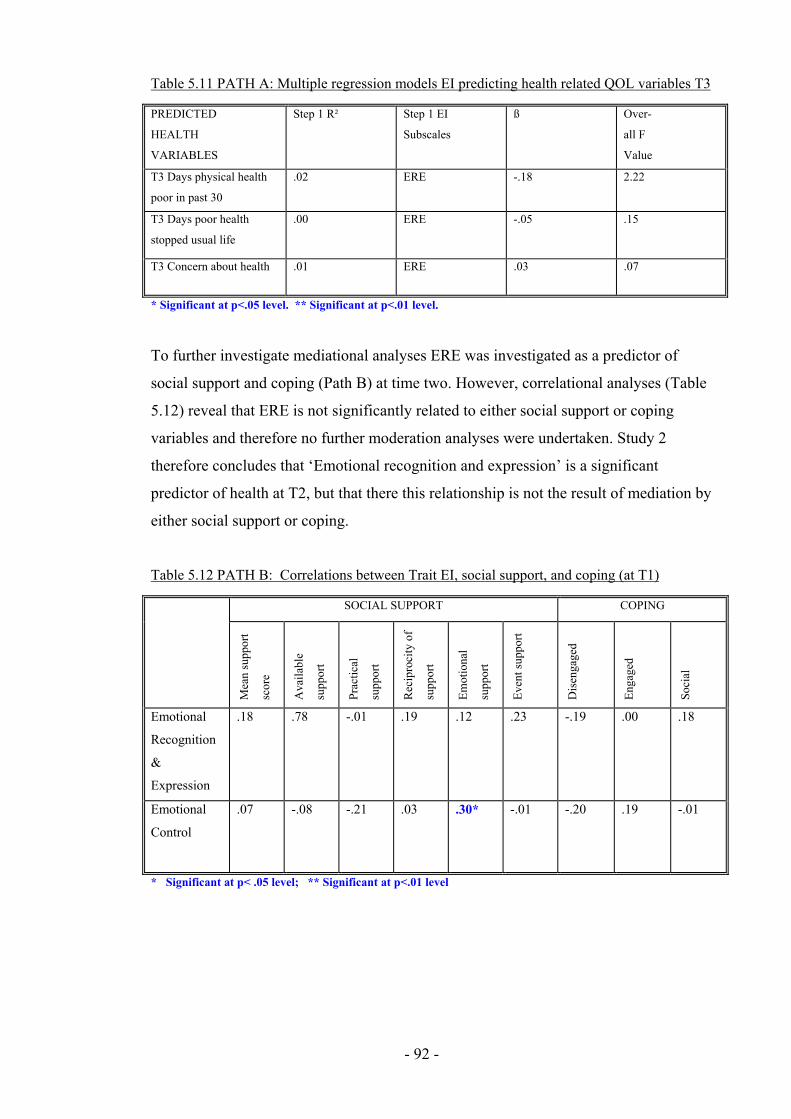
- 92 -
Table 5.11 PATH A: Multiple regression models EI predicting health related QOL variables T3
PREDICTED
HEALTH
VARIABLES
Step 1 R² Step 1 EI
Subscales
ß Over-
all F
Value
T3 Days physical health
poor in past 30
.02 ERE -.18 2.22
T3 Days poor health
stopped usual life
.00 ERE -.05 .15
T3 Concern about health .01 ERE .03 .07
* Significant at p<.05 level. ** Significant at p<.01 level.
To further investigate mediational analyses ERE was investigated as a predictor of
social support and coping (Path B) at time two. However, correlational analyses (Table
5.12) reveal that ERE is not significantly related to either social support or coping
variables and therefore no further moderation analyses were undertaken. Study 2
therefore concludes that ‘Emotional recognition and expression’ is a significant
predictor of health at T2, but that there this relationship is not the result of mediation by
either social support or coping.
Table 5.12 PATH B: Correlations between Trait EI, social support, and coping (at T1)
SOCIAL SUPPORT COPING
Mea
n su
ppor
t
scor
e
Ava
ilab
le
supp
ort
Prac
tica
l
supp
ort
Rec
ipro
city
of
supp
ort
Em
otio
nal
supp
ort
Eve
nt s
uppo
rt
Dis
enga
ged
Eng
aged
Soci
al
Emotional
Recognition
&
Expression
.18 .78 -.01 .19 .12 .23 -.19 .00 .18
Emotional
Control
.07 -.08 -.21 .03 .30* -.01 -.20 .19 -.01
* Significant at p< .05 level; ** Significant at p<.01 level
- 93 -
Moderation by EI of the longitudinal stress health relationship.
To investigate moderation effects between EI subscales and life events stress, interaction
terms will be entered in a third step of the multiple regression predicting health variables.
Moderated multiple regression is considered the appropriate analysis for detecting the effects
of moderator variables (Cohen & Cohen, 1983) and was therefore selected a priori to data
being collected. Before moderated multiple regressions were carried out the independent
variables were centred (as advised by Aiken & West, 1991) by calculating raw scores minus
mean scores. Then interaction terms were calculated by multiplying centre scored life events
stress and centre scored EI subscales.
In regressional analysis control variables are included where they demonstrate significant
correlation with the dependent variable, plus Emotional control, Emotional recognition and
expression, or stressful life events. These correlations are displayed in Tables 5.8 and 5.9.
Regressional analyses investigating the moderation by EI of the relationship between life
event stress and health are presented in tables 5.13 (health time two) and 5.14 (health time
three). To allow interpretation, significant interactions are plotted (Figures 5.2 to 5.4).
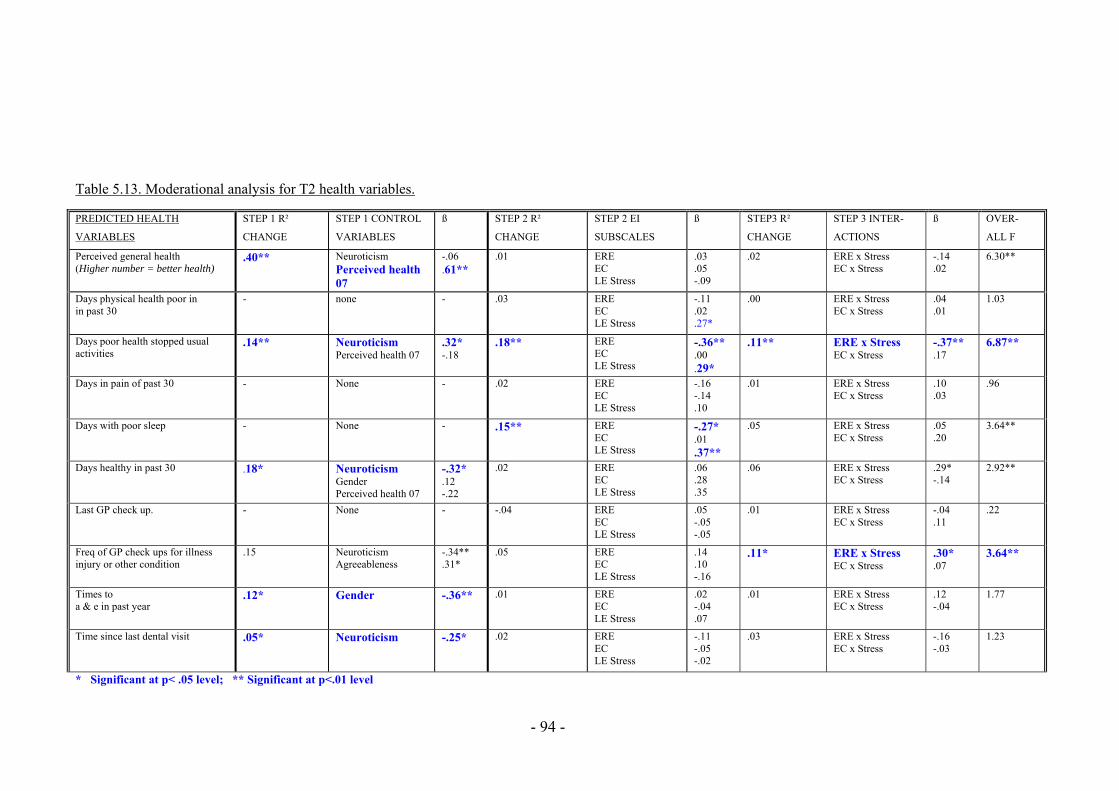
- 94 -
Table 5.13. Moderational analysis for T2 health variables.
PREDICTED HEALTH
VARIABLES
STEP 1 R²
CHANGE
STEP 1 CONTROL
VARIABLES
ß STEP 2 R²
CHANGE
STEP 2 EI
SUBSCALES
ß STEP3 R²
CHANGE
STEP 3 INTER-
ACTIONS
ß OVER-
ALL F
Perceived general health (Higher number = better health)
.40** Neuroticism Perceived health 07
-.06 .61**
.01 ERE EC LE Stress
.03
.05 -.09
.02 ERE x Stress EC x Stress
-.14 .02
6.30**
Days physical health poor in in past 30
- none - .03 ERE EC LE Stress
-.11 .02 .27*
.00 ERE x Stress EC x Stress
.04
.01 1.03
Days poor health stopped usual activities
.14** Neuroticism Perceived health 07
.32* -.18
.18** ERE EC LE Stress
-.36** .00 .29*
.11** ERE x Stress EC x Stress
-.37** .17
6.87**
Days in pain of past 30 - None - .02 ERE EC LE Stress
-.16 -.14 .10
.01 ERE x Stress EC x Stress
.10
.03 .96
Days with poor sleep
- None - .15** ERE EC LE Stress
-.27* .01 .37**
.05 ERE x Stress EC x Stress
.05
.20 3.64**
Days healthy in past 30 .18* Neuroticism Gender Perceived health 07
-.32* .12 -.22
.02 ERE EC LE Stress
.06
.28
.35
.06 ERE x Stress EC x Stress
.29* -.14
2.92**
Last GP check up.
-
None - -.04 ERE EC LE Stress
.05 -.05 -.05
.01 ERE x Stress EC x Stress
-.04 .11
.22
Freq of GP check ups for illness injury or other condition
.15 Neuroticism Agreeableness
-.34** .31*
.05 ERE EC LE Stress
.14
.10 -.16
.11* ERE x Stress EC x Stress
.30*
.07 3.64**
Times to a & e in past year
.12* Gender -.36** .01 ERE EC LE Stress
.02 -.04 .07
.01 ERE x Stress EC x Stress
.12 -.04
1.77
Time since last dental visit
.05* Neuroticism
-.25* .02 ERE EC LE Stress
-.11 -.05 -.02
.03 ERE x Stress EC x Stress
-.16 -.03
1.23
* Significant at p< .05 level; ** Significant at p<.01 level

- 95 -
Table 5.14. Moderational analysis for T3 health variables.
PREDICTED HEALTH VARIABLES
STEP 1 R² CHANGE
STEP 1 CONTROL VARIABLES
ß STEP 2 R² CHANGE
STEP 2 EI SUBSCALES
ß STEP3 R² CHANGE
STEP 3 INTER-ACTIONS
ß OVERALL F
Perceived general health (Higher number = better health)
.39 Neuroticism Perceived health 07
.33* -.44**
.08 ERE EC LE Stress
.24 -.16 .05
.02 ERE x Stress EC x Stress
.17 -.11
3.26*
Days physical health poor - None - .11 ERE EC LE Stress
-.15 -.24 -.07
.01 ERE x Stress EC x Stress
.07
.06 .90
Days not active .07 Neuroticism Perceived health 07
.22
.23 .05 ERE
EC LE Stress
-.20 -.02 -.03
.02 ERE x Stress EC x Stress
.15
.07 .74
Days in pain of past 30 - None - .06 ERE EC LE Stress
-.20 -.08 -.06
.02 ERE x Stress EC x Stress
.19
.04 .67
Days healthy in past 30 .14 Neuroticism -.37* .05 ERE EC LE Stress
.19 -.17 .01
.09 ERE x Stress EC x Stress
-.13 -.36
2.23
Last GP check up.
- None - .03 ERE EC LE Stress
-.06 .14 .08
.08 ERE x Stress EC x Stress
.32
.15 .82
GP visit freq. .02 Neuroticism Agreeableness
.05 -.13
.02 ERE EC LE Stress
-.05 .15
.01 ERE x Stress EC x Stress
.11
.08 .23
Times to a & e in past year - None - .17 ERE EC LE Stress
-.36* -.16 -.02
.05 ERE x Stress EC x Stress
.25
.11 2.00
Time since last dental visit - None - .09 ERE EC LE Stress
-.06 -.24 .24
.04 ERE x Stress EC x Stress
-.22 -.03
.79
Freq Exercise in past months .00 Agreeableness -.03 .01 ERE EC LE Stress
.03
.04
.04
.41** ERE x Stress EC x Stress
.49*
.64** 3.66*
Weight class according to BMI
- None - .02 ERE EC LE Stress
.15 -.02 -.02
.14 ERE x Stress EC x Stress
-.15 .45*
1.30
Concern about health - None - .09 ERE EC LE Stress
-.03 .25 .14
.01 ERE x Stress EC x Stress
.13 -.10
.79
Days sleep was poor - None - .04 ERE EC LE Stress
-.21 -.01 .13
.06 ERE x Stress EC x Stress
.01
.32 .82
* Significant at p< .05 level; ** Significant at p<.01 level

- 96 -
Moderation analyses reveal that at T2 Emotional Recognition and expression moderated
the relationship between life events stress and health, as measured by both GP visit
frequency and the extent to which daily activities were reduced by ill health.
Of the health variables at time three the relationship between Stressor exposure and
frequency of exercise undertaken was moderated by both Emotional Control and
Emotional Recognition and Expression.
5.2.6. Interpretation of significant interactions predicting Health T2.
The significant interactions between EI subscales and stress predicting health T2 were
investigated in figures 5.2 to 5.4.
Figure 5.2 reveals that days ill health reduced activity was highest for participants with
low Emotional Recognition & Expression and high stress, while Figure 5.3 reveals that
days feeling healthy was highest for participants with high stress and high Emotional
Recognition & Expression.
5.2.7 Interpretation of significant interactions predicting Health T3.
The significant interactions between EI subscales and stress predicting health T3 were
investigated in figures 5.4 and 5.5.
5
5.5
6
6.5
7
7.5
8
Low Stress High Stress
Day
s A
ctiv
ity R
educ
ed
Low ERE High ERE
Figure 5.2 Interaction between Stress and
Emotional Recognition & Expression
predicting Low Activity T2
30.5
31
31.5
32
Low Stress High Stress
Day
s H
ealth
y
Low ERE High ERE
Figure 5.3 Interaction between Stress and
Emotional Recognition & Expression
predicting Days Healthy

- 97 -
Figure 5.4 reveals that exercise frequency at time three was lowest under high stress for
participants with low ERE, while Figure 5.5 reveals that exercise frequency was also
lowest under high stress for participants with low EC.
5.2.8 Summary of all regressional findings
Analyses reveal that EI subscale EC is not a significant predictor of health T2, but that
subscale ERE explains significant amounts of variance in health at T2, as measured by
the number of days ill health stopped usual activities (negatively related so as ERE
increased days with low activity decreased). However, as ERE was not significantly
correlated with any social support or coping subscales no further mediational analyses
were undertaken. At T3, EI subscales could not explain significant amounts of variance
in health variables s again no further mediational analyses were undertaken. This study
therefore finds that the relationship between EI subscales and health are not mediated by
either social support or coping.
Analyses investigating EI as a moderator of the relationship between stressor exposure
and health reveal significant interactions between EI subscales and stress when
predicting health variables at T2 and T3. At T2 analysis reveals that under high stress
when ERE is high, Days healthy are greatest, and days illness reduced activity is lowest.
1010.210.410.610.8
1111.211.411.611.8
12
Low Stress HighStress
Exe
rcis
e F
requ
ency
Low ERE High ERE
Figure 5.4 Interaction between Stress and
Emotional Recognition & Expression predicting
days T3 Exercise
9
9.5
10
10.5
11
11.5
12
12.5
13
LowStress
HighStress
Exe
rcis
e F
requ
ency
Low EC High EC
Figure 5.5 Interaction between Stress
and Emotional control predicting
days T3 Exercise
- 98 -
At T3 interaction plots reveals that exercise is greatest under high stress when ERE is
high, and when EC is high.
5.3 Discussion
The current study sought to investigate the longitudinal relationship between EI and
health, asking if this relationship is mediated by coping, or social support. EC was not
found to explain significant amounts of variance in health T2 or T3, and ERE was not a
significant predictor of health T3. However, ERE significantly predicted days ill heath
reduced activities; as ERE increased so did days with low activity. This relationship is
not in the expected direction, and it seems likely that this one significant result is an
artefact of testing a high number of health variables. When combined with all other non-
significant results, this study finds that EI does not explain variance in health at T2 or
T3.
The finding that trait EI does not explain variance in health longitudinally or cross
sectionally (to amalgamate findings with those of studies one and two) is contrary to
findings from meta analysis (Martins, Ramalho & Morin, in press). There are a number
of possibilities for this discrepancy: First, as the current study reveals moderating, but
not mediating relationships, it is possible that for this young sample EI is only important
for health under high stress conditions. Study four (chapter 6) will investigate this by
asking whether trait EI can explain variance in cortisol concentrations after a stressful
public speaking task. Second, it could be that there is a significant relationship between
EI and health, but that effect sizes are small and therefore remained undetected with the
current sample size. However, this is not deemed likely given that meta-analysis has
previously reported a moderate effect size between trait EI and health. Third, sample
characteristics (for example, being young and predominantly female) may mean that the
current study is not representative of the general population. For this reason age and
gender will continue to be considered as control variables; Fourth, it could be that there
is no main effect between EI and health and that past research has reported results
which are artefacts of using measures wider in coverage than the ability EI domain.
Another unexpected finding of the current study was that EI subscales did not show
many significant correlations with social support, the only significant correlation found
being between EC and emotional support. This is inconsistent with study 1, where ERE

- 99 -
was correlated with four social support dimensions and EC was correlated with
emotional support. Also, in contrast to study 1, the current study has revealed no
significant relationships between ERE and EC and coping variables, and only one
significant relationship between trait EI and social support in study one ERE and EC
showed that five out of six correlations to be significant. This inconsistency is likely to
be due to idiosyncrasies of the samples in studies 1 to 3.
Moderation analyses have revealed that EI subscales interact with life events stress to
predict health variables 12 months and 15 months after the life events were reported.
Results reveal that health is better under high stress conditions for individuals with high
ERE and EC. This replicates the finding of study 1 that under high stress, higher EI
appears to be protective of health. The mechanisms through which EI protects health
from stress has not been revealed by studies 1, 2 or 3, therefore study 4 will investigate
physiological paths between EI and health to explore whether cortisol reactivity can
explain this complex relationship.
- 100 -
Chapter Six: The relationship between Trait Emotional
Intelligence and physiological responses to stressors.
To further explore the significant moderation by emotional intelligence (EI) on the
relationship between stressor exposure and health identified in previous studies, the
current study seeks to explore whether EI can moderate the relationship between
stressor exposure and cortisol reactivity. Past research has proposed that EI helps
regulate emotions and in turn reduces harmful physiological arousal to stressors
(Mikolajczak et al, 2007). To date, only two studies have tested this proposal and they
reported that trait EI is a significant moderator of the relationship between stressor
exposure and cortisol reactivity (Mikolajczak et al., 2007; Salovey et al., 2002). Such
research explains the connection between EI and health as the product of EI moderating
the relationship between acute stressors and physiological responses to those stressors.
In congruence with the two previous published studies investigating EI and
physiological stress reactivity, the current study will measure salivary cortisol.
Supplementary to physiological responses both previous EI-cortisol studies measured
participants’ affective states as an additional indicator of anticipation of and response to
lab based stressors. Psychological responses to stressors may be triggers of
physiological responses, coping cognitions and behaviours. Therefore measurement of
emotional activation is a useful addition to measuring physiological responses to
stressors. Previous studies reported that higher trait EI was related to lower mood
deterioration (Mikolajczak, Petrides, Coumans & Luminet, 2009; Mikolajczak et al.,
2007) and perceptions of stressors as less threatening (Salovey et al., 2002).
The current study seeks to replicate previous results that higher EI is related to lower
levels of cortisol and less mood deterioration, while controlling for personality and
using a measure of EI which is neither under nor over inclusive in its coverage of the EI
domain. Based on previous results it was predicted that higher EI would be related to
lower baseline levels of cortisol at time 1, smaller increases in cortisol immediately after
the stressor at time 2, and greater reduction in cortisol from time 2 to time 3. It was also
predicted that higher EI would be related to less tense and less energetic mood at time

- 101 -
one, two and three. Such results would help to explain the finding in studies 1 and 3 that
EI moderates the relationship between Stressor exposure and health.
6.1. Method
6.1.1 Design
A mixed design was used for the current study. Stress was operationalised on two
levels (1. high stress – participants giving oral presentations; 2. controls – participants
who were watching but not giving presentations). All participants gave repeated
measures for both salivary cortisol and mood at three points in time (before the assessed
presentations, 20 minutes after stressor onset, 40 minutes after stressor onset). The
relationship between Trait EI, mood and cortisol reactivity was then investigated
through correlational and regressional analysis.
6.1.2 Participants
Participants were undergraduate students contacted through verbal requests in lectures
and workshops; they were asked if they would take part in a salivary cortisol study
during presentations they were due to give for course assessment. 146 participants
identified in this way gave saliva samples for analysis. Of these participants, a number
gave saliva samples that were too small for analysis or failed to complete mood
questionnaires, additionally a number of cortisol results were discarded as unreliable,
and 2 participants were removed as extreme outliers. Therefore participant numbers for
analyses were reduced to 114. Of the 114 cortisol participants 45 were non presenters
(No stress control group) and 69 were presenters (high stress condition). Of the
combined 146 participants 40 (27.4%) were male and 106 (72.6%) female. Ages ranged
from 18 to 38 (mean 19.67, standard deviation 4.13)
Participants were asked at the time of initial contact to refrain from smoking, drinking
alcohol, eating, or consuming caffeine for the 2 hours before the study. Many
participants reported ignoring these requests and therefore food, caffeine, smoking, and
alcohol were included in analyses as control variables.
6.1.3 Procedure
Participants were giving an in class oral presentation being graded by tutors and peers
as part of first year course assessment. Motivated tasks which have elements of social
- 102 -
evaluative threat have been found by meta analysis to reliably produce large cortisol
reactions (Dickerson & Kemeny, 2004), therefore assessed presentations given by
students were considered to provide both a suitably stressful stimulus and ecological
validity of results. The current task also has strong parallels with the Trier Social Stress
Test (TSST; Kirschbaum, Pirke & Hellhammer, 1993) used in experimental protocols to
and found by meta analysis to provoke the most robust physiological stress responses
compared to other stress tasks (Dickerson & Kemeny, 2004). All the experimental data
was collected between 2 and 5pm to minimise the effect of circadian hormone rhythms.
Participants were given sampling packs which contained name labels with red amber
and green colour coded questionnaires and salivettes (saliva collection devices
described in section 6.1.4 below). Participants completed red questionnaires (EI,
personality and mood) and samples at baseline (T1) on arrival in the room, amber
questionnaires (mood) and samples at time two (T2) immediately after their 20 minute
presentation, and red questionnaires (mood) and samples at time three (T3) immediately
after the next group presentation. Data were therefore collected at three points in time:
T1 at 3pm; T2 20 minutes after the start of the stressor, T3 40 minutes after the start of
the stressor.
6.1.4 Materials
EI Measures
Swinburne University Emotional Intelligence Test (SUEIT; Palmer & Stough, 2001)
The SUIET demonstrates good content validity as the measure’s five factors represent
good coverage of the EI domain mapping well on to the (1997) Mayer and Salovey
model. They also demonstrate good focus on the EI domain as items do not refer to
constructs other than EI. The SUEIT has demonstrated utility by explaining unique
variance in a number of published studies predicting outcomes such as life satisfaction
(Gannon & Ranzijin, 2005), leadership (Downey, Papageorgiou & Stough, 2006), and
critical and detached behaviour (Moss, Ritossa & Nga, 2006). The SUEIT has also
been shown to have good internal reliability (Rajendran, Downey & Stough, 2007) and
test re-test reliability (Palmer & Stough, 2001). For the current study cronbach alpha
coefficients were as follows: Emotional Recognition and expression (α=.65);
Understanding of Emotions External (α=.77); Emotions Direct Cognition (α=.58);
Emotional Management (α=.74); Emotional Control (α=.80). For ERE removing item
7 would have increased reliability to α=.76, and for EDC removing item3 would
- 103 -
increase reliability to α=.61 However it was decided that this was not desirable as it
would prevent direct comparison of results with other published data.
Personality Measure
The International Personality Item Pool (IPIP) has been developed as a free measure of
personality, has good reliability and validity, and correlates well to the NEO-FFI (Gow,
Whiteman & Pattie, 2005). It was developed to provide a public domain measure of
personality. It has 50 statements scored on a scale of 1 (Very inaccurate for me) to 5
(Very accurate for me). The scale yields 5 subscale scores: Neuroticism; Extroversion;
Agreeableness; Openness; and Conscientiousness. For each subscale the possible
scores range from 0 to 50. For the current study cronbach alpha coefficients were as
follows: Neuroticism: α=.78, Extroversion: α=.73, Openness: α=.62, Agreeableness:
α=.81; Conscientiousness: α=.61. For Conscientiousness no item could be removed to
increase internal reliability. For openness removal of items 15 and 25 would increase
reliability by .01 therefore the benefit of removal items was not worth the cost of
difficulty in interpreting results.
Affect arousal
The Activation Deactivation Adjective Checklist short form (AD ACL; Thayer, 1989)
was used to measure the affective dimensions of arousal. This checklist consists of 16
items asking participants to grade the extent to which they feel a number of emotions on
a scale of one to four (four being high), and in combination these items measure four
dimensions of affect- energy (active, energetic, vigorous, lively, full-of-pep), tiredness
(sleepy, tired, drowsy, wide-awake, wakeful), calmness (placid, calm, at-rest, still,
quiet), and tension (jittery, intense, fearful, clutched-up, tense). Energy and reverse
scored tiredness are combined to create the scale ‘Energetic’, while tension and reverse
scored calmness are combined to create the subscale ‘Tense’. Participants were asked
to report how they felt at the moment they completed the checklist. The AD ACL is
well established as reliable and valid (Purcell, 1982; Thayer, 1986). For the current
study cronbach alpha coefficients were as follows: Energetic mood time 1 α=.85, tense
mood time 1 α=. 85; energetic mood time 2 α=.86, tense mood time 2 α=.82; energetic
mood time 3 α=.88, tense mood time 3 α=.73.
- 104 -
Salivary Cortisol
Saliva samples were taken using the salivette saliva sampling device (Sarstedt LTD,
Leicester, UK). Collection packs were produced and given to participants, these
included three salivettes colour coded red, amber and green. At each time point
participants were instructed to give unstimulated saliva samples by placing a salivette
under their tongue for a two- minute period or until salivettes were soggy with saliva.
Following saliva collection samples were stored at -40oC until analysis. Saliva was
recovered by thawing the salivette at room temperature for fifteen minutes, then
centrifuging samples for fifteen minutes at 1500rpm. Enzyme immunoassays were
conducted in duplicate at the University of Central Lancashire using commercial kits.
Cortisol concentration (nmol/l) in saliva was determined by a high sensitivity salivary
cortisol enzyme immunoassay kit, produced by DRG Instruments GmbH, Germany.
One assay gave results which were significantly different to all the other tests (F (14,
506) = 32.61, p<.001); these results of this assay were discarded as unreliable. Intra and
inter-assay coefficients of reliability ranged from 4 to 30%. Each participant gave three
samples; baseline, time one and time two. Cortisol Reactivity was calculated as T2
minus baseline; and Total was the sum of T2 and T3 minus T1. Collection and
presentation of cortisol in this way is consistent with clinical advice (Hanrahan,
McCarthy, Kleiber, Lutgendorf & Tsalikian, 2006).
6.2 Results
6.2.1 Data screening study 5
Assumptions of multivariate analysis (Tabachnick & Fidell, 2001) were investigated
prior to analyses. Before conducting the multiple regression, basic data screening was
completed to test dependent variables for normality and outliers, and to identify
multicollinearity. Screening began with checks for errors within the data file, then the
missing data routine were applied.
Outliers, both univariate and multivariate, were identified using procedures outlined in
Tabachnick and Fidell (2001). Inspection of box plots revealed that one of the cortisol
assays had produced scores outside of the expected range, and therefore cortisol
concentration results from this assay (test 13) were removed as being unreliable.
Extreme multivariate outliers (identified in box plots as more than 1.5 box lengths from

- 105 -
the edge of the box) were removed although this only resulted in 2 cases being taken
from the sample. In checking for normality of distribution, some variables presented
evidence of non normal distribution (Kolmogorov-Smirnov values p<0.05). However
as the 5% trimmed means and inspection of histograms (and skewness and kurtosis
values) revealed that the assumptions of univariate normality were not severely violated,
this was not considered problematic. It would not be desirable to remove such scores as
they provide necessary variance in both independent and dependent variables.
6.2.2 Background characteristics of the population
The means and standard deviations for the study 4 cohort are given in table 6.1
Table 6.1 Characteristics of cohort in study 4
Means & standard deviations
(n=114)
Characteristic
Mean S. D.
Age 19.67 4.13
Emotional Recognition & Expression 36.6 5.99
SUE
IT
Emotional Control 28.35 6.28
Neuroticism 30.81 7.30
Extroversion 34.38 7.06
Openness 32.26 4.57
Agreeableness 39.97 4.52
Per
sona
lity
Conscientiousness 33.23 5.67
Reading A – baseline 5.48 1.81
Reading B – 20 Minutes later 5.39 2.13
Cor
tiso
l
Reading C- 40 minutes after baseline 5.15 1.90
Time 1 Energetic mood 21.09 4.97
Time 1 Tense mood 20.06 5.55
Time 2 Energetic mood 21.61 5.56
Time 2 Tense mood 19.64 5.13
Time 3 Energetic mood 19.62 5.35
Moo
d
Time 3 Tense mood 15.37 3.70
Normative Data
Means and standard deviations for both the current sample and published normative
data (using large samples sizes) for the SUEIT are given in table 6.2. Significant
differences are highlighted, indicating the extent of deviation by current sample from
the scores of general population.
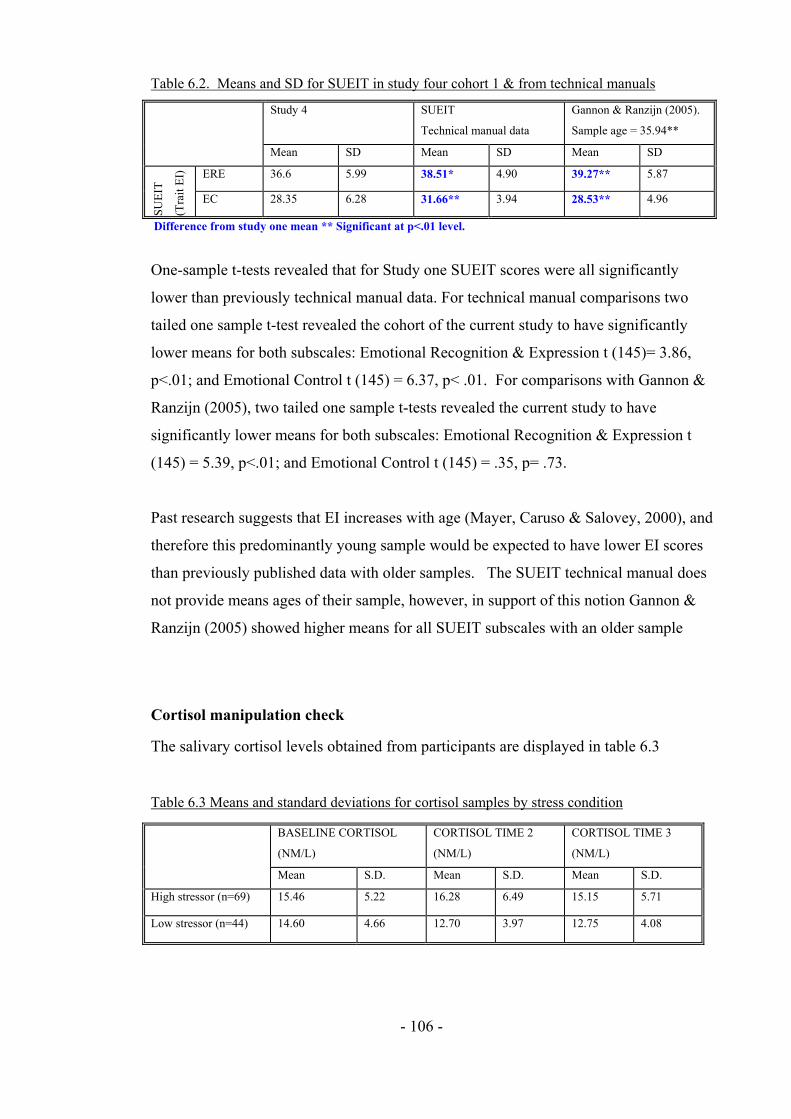
- 106 -
Table 6.2. Means and SD for SUEIT in study four cohort 1 & from technical manuals
Study 4
SUEIT
Technical manual data
Gannon & Ranzijn (2005).
Sample age = 35.94**
Mean SD Mean SD Mean SD
ERE 36.6 5.99 38.51* 4.90 39.27** 5.87 SU
EIT
(Tra
it E
I)
EC 28.35 6.28 31.66** 3.94 28.53** 4.96
Difference from study one mean ** Significant at p<.01 level.
One-sample t-tests revealed that for Study one SUEIT scores were all significantly
lower than previously technical manual data. For technical manual comparisons two
tailed one sample t-test revealed the cohort of the current study to have significantly
lower means for both subscales: Emotional Recognition & Expression t (145)= 3.86,
p<.01; and Emotional Control t (145) = 6.37, p< .01. For comparisons with Gannon &
Ranzijn (2005), two tailed one sample t-tests revealed the current study to have
significantly lower means for both subscales: Emotional Recognition & Expression t
(145) = 5.39, p<.01; and Emotional Control t (145) = .35, p= .73.
Past research suggests that EI increases with age (Mayer, Caruso & Salovey, 2000), and
therefore this predominantly young sample would be expected to have lower EI scores
than previously published data with older samples. The SUEIT technical manual does
not provide means ages of their sample, however, in support of this notion Gannon &
Ranzijn (2005) showed higher means for all SUEIT subscales with an older sample
Cortisol manipulation check
The salivary cortisol levels obtained from participants are displayed in table 6.3
Table 6.3 Means and standard deviations for cortisol samples by stress condition
BASELINE CORTISOL
(NM/L)
CORTISOL TIME 2
(NM/L)
CORTISOL TIME 3
(NM/L)
Mean S.D. Mean S.D. Mean S.D.
High stressor (n=69) 15.46 5.22 16.28 6.49 15.15 5.71
Low stressor (n=44) 14.60 4.66 12.70 3.97 12.75 4.08
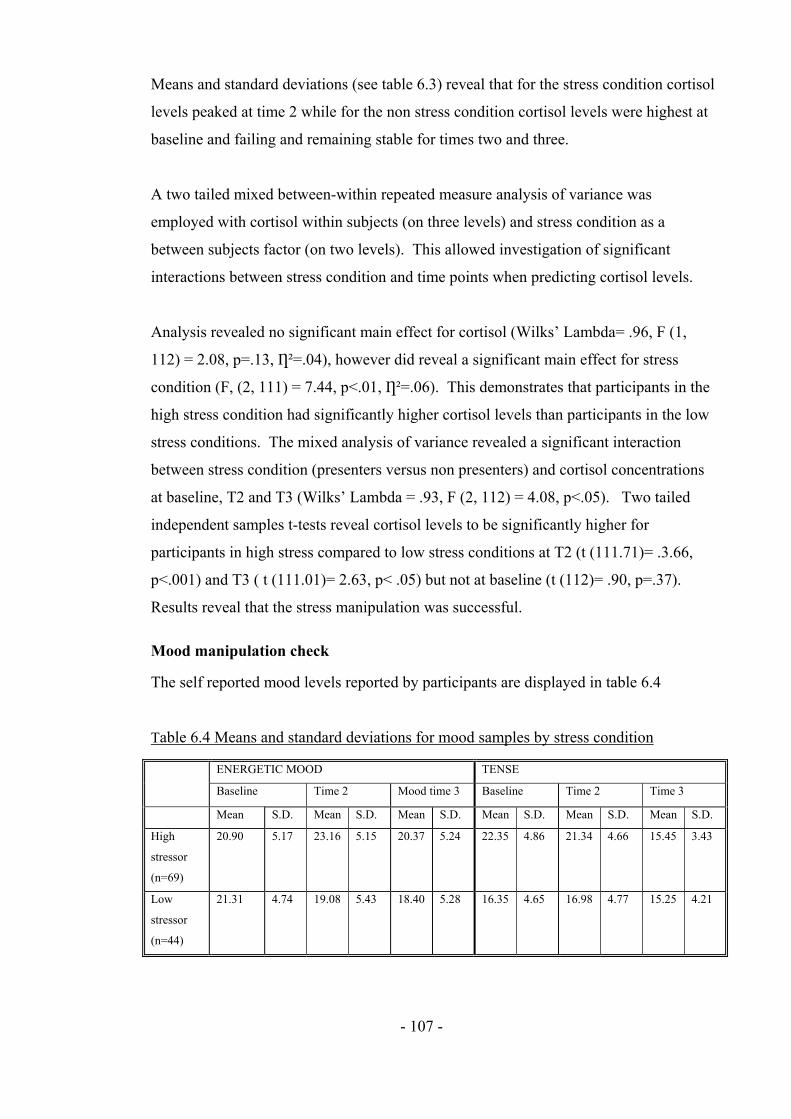
- 107 -
Means and standard deviations (see table 6.3) reveal that for the stress condition cortisol
levels peaked at time 2 while for the non stress condition cortisol levels were highest at
baseline and failing and remaining stable for times two and three.
A two tailed mixed between-within repeated measure analysis of variance was
employed with cortisol within subjects (on three levels) and stress condition as a
between subjects factor (on two levels). This allowed investigation of significant
interactions between stress condition and time points when predicting cortisol levels.
Analysis revealed no significant main effect for cortisol (Wilks’ Lambda= .96, F (1,
112) = 2.08, p=.13, Ƞ²=.04), however did reveal a significant main effect for stress
condition (F, (2, 111) = 7.44, p<.01, Ƞ²=.06). This demonstrates that participants in the
high stress condition had significantly higher cortisol levels than participants in the low
stress conditions. The mixed analysis of variance revealed a significant interaction
between stress condition (presenters versus non presenters) and cortisol concentrations
at baseline, T2 and T3 (Wilks’ Lambda = .93, F (2, 112) = 4.08, p<.05). Two tailed
independent samples t-tests reveal cortisol levels to be significantly higher for
participants in high stress compared to low stress conditions at T2 (t (111.71)= .3.66,
p<.001) and T3 ( t (111.01)= 2.63, p< .05) but not at baseline (t (112)= .90, p=.37).
Results reveal that the stress manipulation was successful.
Mood manipulation check
The self reported mood levels reported by participants are displayed in table 6.4
Table 6.4 Means and standard deviations for mood samples by stress condition
ENERGETIC MOOD TENSE
Baseline Time 2 Mood time 3 Baseline Time 2 Time 3
Mean S.D. Mean S.D. Mean S.D. Mean S.D. Mean S.D. Mean S.D.
High
stressor
(n=69)
20.90 5.17 23.16 5.15 20.37 5.24 22.35 4.86 21.34 4.66 15.45 3.43
Low
stressor
(n=44)
21.31 4.74 19.08 5.43 18.40 5.28 16.35 4.65 16.98 4.77 15.25 4.21

- 108 -
A two tailed mixed between-within repeated measure analysis of variance was
employed with energetic mood a within subjects factor (on three levels) and stress
condition as a between subjects factor (on two levels). This allowed investigation of
significant interactions between stress condition and time points in mood levels.
Analysis revealed a significant main effect for energetic mood (Wilks’ Lambda= .83, F
(1, 112) = 10.67, p=<.001, Ƞ²=.7). Bonferroni corrected post hoc test revealed that
energy was significantly higher at T2 compared to T3 (p<.05), at T1 compared to T3
(p<.05) and at T2 compared to T1 (p<.05). Analysis also revealed a significant main
effect for stress condition (F, (1, 112) = 6.79, p<.05, Ƞ²=.06). The tests show a large
significant interaction between stress condition (presenters versus non presenters) and
energetic mood at baseline, T2 and T3 (Wilks’ Lambda = .73, F (2, 112) = 14.25,
p<.001). Two tailed independent samples t-tests reveal that there are significant
differences between the high and low stress conditions for energetic mood at T2 (t
(136)= 4.43, p<.001) and T3 (t(136)= 2.13, p<.05) but not baseline (t (136) = .47,
p=.64). This suggests that the stress manipulation successfully impacted upon mood.
A second two-tailed mixed between-within repeated measure analysis of variance was
employed with energetic mood a within subjects factor (on three levels) and stress
condition as a between subjects factor (on two levels). This allowed investigation of
significant interactions between stress condition and time points in mood levels.
Analysis revealed a significant main effect for tense mood (Wilks’ Lambda= .47, F (1,
112) = 59.89, p=<.001, Ƞ²=.53). Bonferroni corrected post hoc test revealed that energy
was significantly higher at T2 compared to T3 (p<.05), at T1 compared to T3 (p<.05)
and at T2 compared to T1 (p<.05). Analysis also revealed a significant main effect for
stress condition (F, (1, 112) = 28.98, p<.01, Ƞ²=.22). The tests show a large significant
interaction between stress condition (presenters versus non presenters) and energetic
mood at baseline, T2 and T3 (Wilks’ Lambda = .71, F (2, 112) = 21.18, p<.001). Two
tailed independent samples t-tests reveal that there are significant differences between
the high and low stress conditions for energetic mood at T1 (t (136) =7.14, p<.001), and
T2 (t (136)= 5.28, p<.001 ), but not T3 (t(136)=.31, p=.76). This suggests that the stress
manipulation successfully impacted upon tense mood.
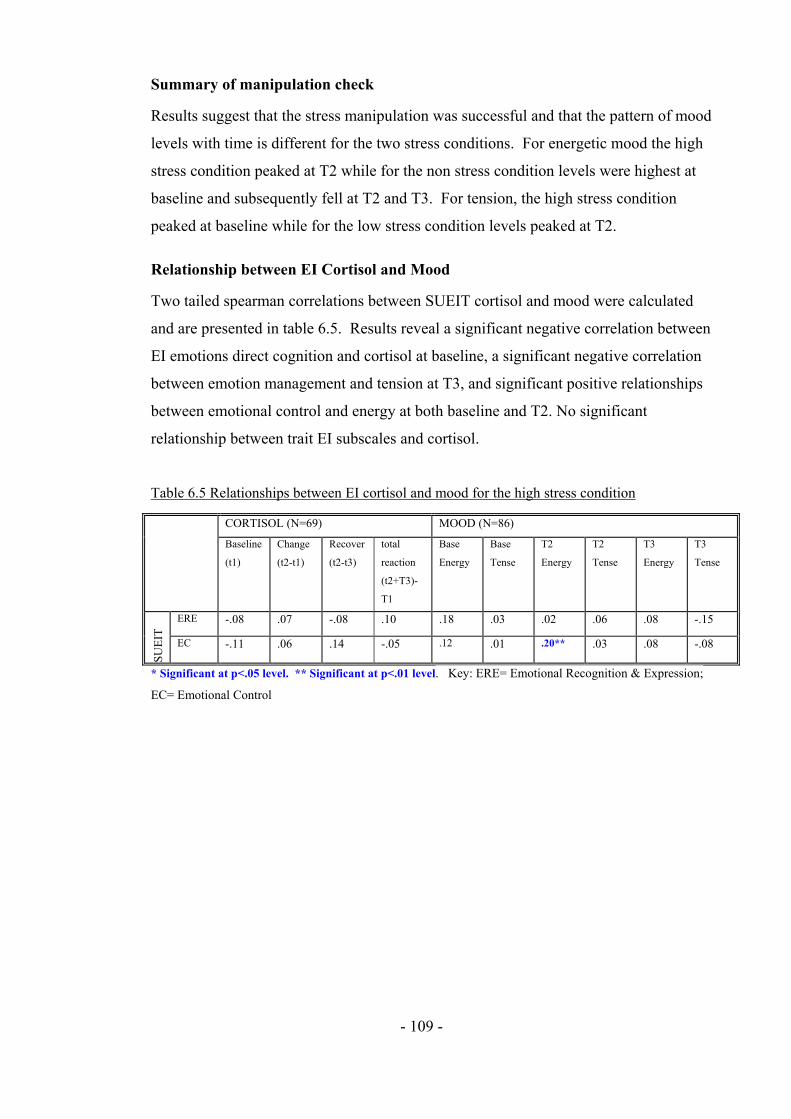
- 109 -
Summary of manipulation check
Results suggest that the stress manipulation was successful and that the pattern of mood
levels with time is different for the two stress conditions. For energetic mood the high
stress condition peaked at T2 while for the non stress condition levels were highest at
baseline and subsequently fell at T2 and T3. For tension, the high stress condition
peaked at baseline while for the low stress condition levels peaked at T2.
Relationship between EI Cortisol and Mood
Two tailed spearman correlations between SUEIT cortisol and mood were calculated
and are presented in table 6.5. Results reveal a significant negative correlation between
EI emotions direct cognition and cortisol at baseline, a significant negative correlation
between emotion management and tension at T3, and significant positive relationships
between emotional control and energy at both baseline and T2. No significant
relationship between trait EI subscales and cortisol.
Table 6.5 Relationships between EI cortisol and mood for the high stress condition
CORTISOL (N=69) MOOD (N=86)
Baseline
(t1)
Change
(t2-t1)
Recover
(t2-t3)
total
reaction
(t2+T3)-
T1
Base
Energy
Base
Tense
T2
Energy
T2
Tense
T3
Energy
T3
Tense
ERE -.08 .07 -.08 .10 .18 .03 .02 .06 .08 -.15
SUE
IT
EC -.11 .06 .14 -.05 .12 .01 .20** .03 .08 -.08
* Significant at p<.05 level. ** Significant at p<.01 level. Key: ERE= Emotional Recognition & Expression;
EC= Emotional Control

- 110 -
Emotional intelligence explaining unique variance in cortisol and mood
Regressional analyses were conducted to examine the extent to which EI can explain
unique variance in cortisol and mood, regardless of stress condition. Results are
presented in table 6.5. Two tailed Pearson’s correlations (see Table 6.5) were
conducted to identify significant relationships between EI subscales cortisol and mood
variables. Correlations reveal that neither Emotional recognition and expression nor
Emotional control were significantly related to cortisol; however Emotional control was
significantly related to energetic mood at T2. Therefore only Emotional control will be
explored in regressional analyses as a predictor of mood, and cortisol will not be further
explored. To establish which control variables should be included in regressional
analyses correlations between potential control variables energetic mood T2 and
Emotional control are displayed in table 6.5 (Correlations between control variables
and all variables are displayed for use in later moderation analyses). Only control
variables which correlate significantly with both emotional control and the Dependent
variable will be included in regressional analyses.

- 111 -
Table 6.6 Identifying control variables: correlations between potential control variables, EI subscales, Cortisol reactions and Mood.
SUEIT CORTISOL
MOOD STRESS
ERE EC Baseline (t1) Reactivity
(T2-T1)
total
reaction
(T2+T3)-T1
Base
Energy
Base
Tense
T2
Energy
T2
Tense
T3
Energy
T3
Tense
N -.04 -.07 -.38** .08 -.03 .04 -.14 .11 -.08 .17 -.05 .26**
E .12 .32** .02 -.12 .04 .03 .18 .13 .06 .04 .03 .03
O -.02 .13 .17 -.05 -.03 .02 .10 -.03 .08 -.15 -.03 -.06
A .10 .32** .05 -.03 .12 .14 .02 -.04 -.02 -.05 .03 -.10
C .13 .15 .05 -.07 .06 .04 .02 .05 -.03 -.12 -.02 .00
Age .19* .07 .10 -.22 .09 .04 .17 .08 .28** .11 .23* .10
Gender -.07 .01 -.25** -.24 -.05 -.08 -.24* .05 -.11 .11 -.13 -.03
WAKE -.02 -.13 .08 .19 .18 .16 -.23* .12 -.17 -.15 -.25* .17
FOOD -.20* .19* -.08 -.08 .01 -.05 .07 .06 -.10 .01 .07 .05
ALCOHOL .06 -.07 .19* .08 .16 .06 .23* -.12 .10 .01 .15 .04
CAFFEINE -.05 -.11 .02 -.11 .04 -.02 -.15 -.18 -.13 .13 .00 .15
Con
trol
s
SMOKE -.05 -.01 -.13 .03 -.12 -.05 -.03 .11 -.02 -.15 .09 .03
* Significant at p< .05 level; ** Significant at p<.01 level

- 112 -
Table 6.7 Multiple regression models with Emotional Control as a predictor of Mood T2
PREDICTED
HEALTH
VARIABLES
STEP 1 R² STEP 1
CONTROL
VARIABLES
ß STEP 2 R²
CHANGE
STEP 2
EI
SUBSCAL
ES
ß OVER-
ALL F
VALUE
Energetic
Mood T2
- None - .04* Emotional
control
.20* 4.53
* Significant at p< .05 level; ** Significant at p<.01 level
Regressional analysis in table 6.7 reveals that emotional control is a significant positive
predictor of energetic mood T2. This indicates that participants with higher emotional
control had greater energy at T2.
Moderation by EI of the stress health relationship.
EI was investigated as a moderator of life event stress by applying guidance of Baron
and Kenny (1986) which states that if EI is a moderator of the relationship between
stress and health, there should be (1) significant main effects but these are not required
to evidence to the moderator hypothesis; and (2) there must be a significant interaction
effect. To investigate moderation effects between EI subscales and life events stress,
interaction terms will be entered in a third step of the multiple regression predicting
health variables. Moderated multiple regression is considered the appropriate analysis
for detecting the effects of moderator variables (Cohen & Cohen, 1983) and was
therefore selected a priori to data being collected. Before moderated multiple
regressions were carried out the independent variables were centred (as advised by
Aiken & West, 1991) by calculating raw scores minus mean scores. Then interaction
terms were calculated by multiplying centre scored life events stress and centre scored
EI subscales.
In regressional analysis control variables are included where they demonstrate
significant correlation with the dependent variable, plus Emotional control, Emotional
recognition and expression, or stressful life events. These correlations are displayed in
table 6. Results of moderational regressional analyses are displayed in table 6.8 These
regressions reveal a significant interaction between Emotional control and stress
condition when predicting baseline energy, therefore interactions are plotted in figure
6.1.
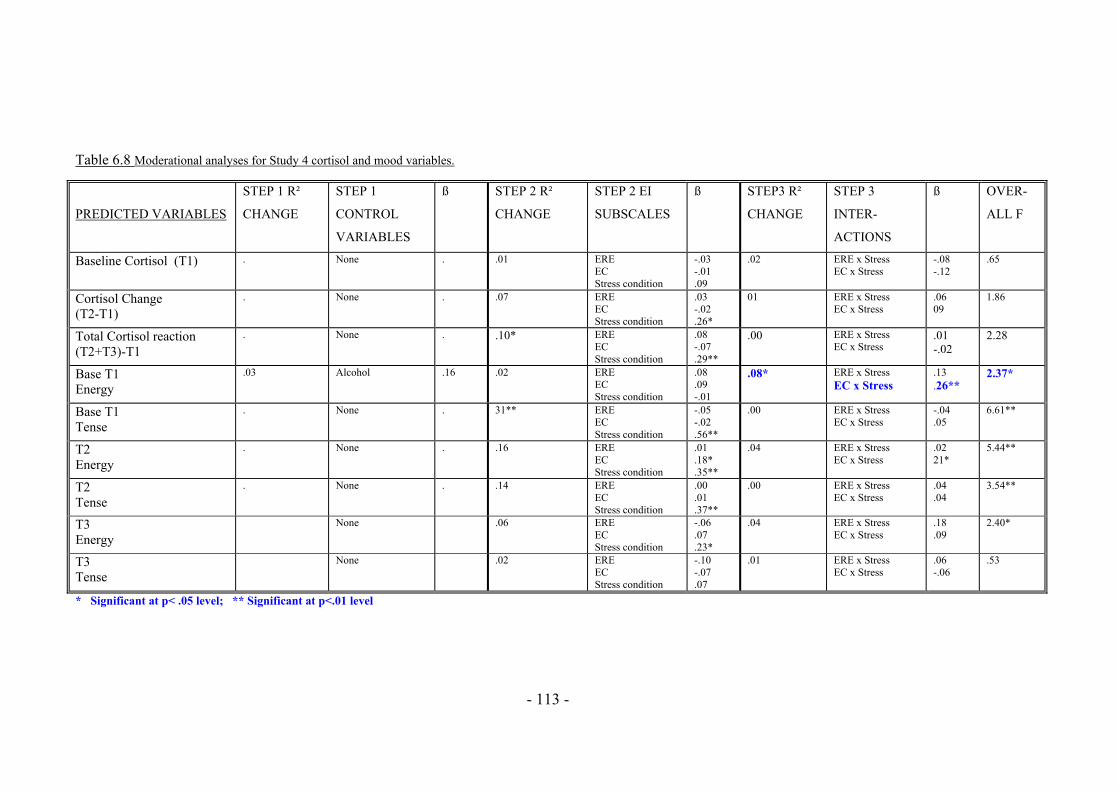
- 113 -
Table 6.8 Moderational analyses for Study 4 cortisol and mood variables.
PREDICTED VARIABLES
STEP 1 R²
CHANGE
STEP 1
CONTROL
VARIABLES
ß STEP 2 R²
CHANGE
STEP 2 EI
SUBSCALES
ß STEP3 R²
CHANGE
STEP 3
INTER-
ACTIONS
ß OVER-
ALL F
Baseline Cortisol (T1) . None . .01 ERE EC Stress condition
-.03 -.01 .09
.02 ERE x Stress EC x Stress
-.08 -.12
.65
Cortisol Change (T2-T1)
. None . .07 ERE EC Stress condition
.03 -.02 .26*
01 ERE x Stress EC x Stress
.06 09
1.86
Total Cortisol reaction (T2+T3)-T1
. None . .10* ERE EC Stress condition
.08 -.07 .29**
.00 ERE x Stress EC x Stress
.01 -.02
2.28
Base T1 Energy
.03 Alcohol .16 .02 ERE EC Stress condition
.08
.09 -.01
.08* ERE x Stress EC x Stress
.13
.26** 2.37*
Base T1 Tense
. None . 31** ERE EC Stress condition
-.05 -.02 .56**
.00 ERE x Stress EC x Stress
-.04 .05
6.61**
T2 Energy
. None . .16 ERE EC Stress condition
.01
.18*
.35**
.04 ERE x Stress EC x Stress
.02 21*
5.44**
T2 Tense
. None . .14 ERE EC Stress condition
.00
.01
.37**
.00 ERE x Stress EC x Stress
.04
.04 3.54**
T3 Energy
None .06 ERE EC Stress condition
-.06 .07 .23*
.04 ERE x Stress EC x Stress
.18
.09 2.40*
T3 Tense
None .02 ERE EC Stress condition
-.10 -.07 .07
.01 ERE x Stress EC x Stress
.06 -.06
.53
* Significant at p< .05 level; ** Significant at p<.01 level

- 114 -
6.2.3 Interpretation of significant interactions predicting Energetic baseline
mood.
The significant interaction between Emotional control and stress predicting energetic
mood T1 two were investigated in figure 6.1
Interaction plot (figure 6.1) reveals that under high stress conditions individuals with
low Emotional control report less energetic mood at onset of a stressor.
6.2.4. Summary of analyses
Regressional analyses reveal that Emotional intelligence subscales Emotional control
and Emotional Recognition and Expression cannot explain significant amounts of
variance in cortisol reactions to stressful experiences. However, Emotional Control can
explain significant amounts of variance in energetic mood following a stressor.
Moderation analyses reveal that Emotional control moderates the relationship between
stressor exposure and energetic mood.
1616.216.416.616.8
1717.217.417.617.8
18
Low Stress High Stress
En
erg
etic
Mo
od
T1
Low EC High EC
Figure 6.1 Interaction between Stress condition
and Emotional control predicting Energetic
Mood at baseline (T1)

- 115 -
6.3 Discussion
The current study sought to investigate the relationship between trait EI subscales ERE
and EC and reactions to acute stressors while overcoming the methodological
weaknesses in previous studies; weaknesses such as using EI measures which were
inclusive of EI correlates such as happiness, social skills, and optimism (Salovey et al,
2002; Mikolajczak et al., 2007), failing to control for personality (Salovey et al, 2002),
and using lab based studies which failed to provide information about how people
responds to stressors in the real world. The aim of the study was to replicate previous
findings that trait EI can explain unique variance in stress reactivity setting using both
mood and cortisol reactivity as measures of stress response.
Regressional analyses reveal that neither ERE nor EC explain significant amounts of
variance in cortisol levels. Contrary to predictions, regressional results failed to find
evidence that trait EI significantly moderates the relationship between stressor exposure
and either cortisol or mood levels. Thus, findings of the current study do not support
the proposition that the relationship between trait EI and health is the result of EI
reducing cortisol levels following an acute stress task. It is unexpected that the current
study did not find trait EI to moderate the relationship between stressor exposure and
cortisol response; however, results are supportive of the notion that using a narrower
measure of trait EI, controlling for personality age and gender where appropriate, and
testing the predictive power of trait EI in a real world setting, are important
methodological controls if the relationship between trait EI and health is to be
understood. Results of the current study are supported by past research, which has
reported that emotional regulation is not a predictor of neuroendocrine functioning (Van
Middendorp, Geenen, Sorbi, Van Doornen & Bijlsma, 2005). This suggests that
individual facets of EI (emotion regulation is part the ability model and is assessed by
trait EI measures) may not have the same predictive power as global trait EI scores.
Thus, it is important to understand which components of trait EI have the greatest
predictive power to aid theorising, understand underlying mechanisms and guide future
research.
Using an assessed undergraduate presentation as a stressor was a strength of this study.
Manipulation checks revealed that indeed the high stress condition provoked higher

- 116 -
cortisol reactions, greater tension before the task and increased energetic mood at time
two and three. Using university assessments as a stressor reveals how students
experience and react to stress in the real world, it suggests that trait emotional
intelligence does not make a significant contribution to cortisol levels before and after
oral coursework presentations.
Sample size in the current study is higher than previous published cortisol papers
(Mikolajczak et al., 2007; Salovey et al., 2002). Thus, it cannot be concluded that the
results of the current study are the result of low statistical power. Instead, it is more
likely that non-significant results from the current study are the product of controlling
for personality, using a measure of EI which was not over-inclusive, and increasing
ecological validity. In conclusion, findings from the current study are indicative that
trait emotional intelligence is not predictive of physiological reactions to stress, and is
not likely to explain the previously reported relationship between EI and health.

- 117 -
Chapter 7: Conclusions, limitations and directions for future
research
7.1 Overview of thesis
This thesis has investigated the relationship between trait EI and health, investigating
the moderating role of EI in the relationship between stressor exposure and health, and
exploring whether the relationship between EI and health is mediated by coping,
unhealthy behaviours, or social support. Both objective and subjective measures of
stress have been used, personality has been controlled, and health has been explored as a
multidimensional construct. In this chapter, I will consider the implications of this work
to theory and implications for future research.
7.2 Summary of research
7.2.1 EI explaining unique variance in health
Of the studies presented in this thesis, none present solid evidence that trait EI subscales
can explain unique variance in measures of health, over and above the variance
explained by control variables of gender, age and personality. This finding is
incongruent with past research, with recent meta analysis finding a moderate effect size
between EI and health (Martins, Ramalho & Morin, in press). If false positives were
produced by past research, then they are likely to have been produced by methods and
measures used, and failing to control for gender age and personality. Past research using
measures of trait EI which were inclusive of content wider than the ability model has
found a relationship between trait EI and health; (e.g. Dawda & Hart, 2000;
Mikolajczak, Luminet & Menil, 2006). Although research using narrower measures of
trait EI, such as the trait meta mood scale, has found that EI significantly predicted
health, the authors failed to control for personality (E.g. Extremera & Fernadez-
Berrocal, 2005; Goldman, Kraemer & Salovey, 1996). To interpret results of this thesis
in this way is suggesting that there is no real relationship between EI and health.
Alternatively, the current thesis could present false negatives, as a result of poor power
due to over estimating effect sizes, or using measures that lack predictive power.
However, the current studies had samples sizes comparable with previous research (e.g.

- 118 -
Extremera & Fernadez-Berrocal, 2005; Goldman, Kraemer & Salovey, 1996).
Furthermore effect sizes taken from meta analysis should provide a reliable basis for
sample size calculations. This suggests that lack of significant findings within the
current thesis is not the result of insufficient power.
A third explanation for the inability of ERE or EC to predict health might be that EI
only has a positive influence on health under the influence of high stress. Support for
this notion comes from the findings in studies 1 and 3 that EI subscales can moderate
the relationship between stressor exposure and health. Additionally, it may be that
certain types of emotional stressor such as grief may be hindered by emotional
awareness, while other problem based stressors such as moving home or financial
worries are helped by such skills. If EI subscales help protect health in some
circumstances and some hinder it in others, overall results could produce a ‘regression
to the mean’ effect, where having a profile high in ERE or EC does not overall benefit
more than having a Low ERE or EC profile. Future research may therefore benefit from
investigating whether types of stressor interact with emotional intelligence subscales to
influence health. Of course the proposition that EI only explains health under high
stress is something that fits with current findings but not the results of meta analysis
(Martins, Ramalho & Morin, in press).
Whatever the interpretation, it is the conclusion of this thesis that EI measures which do
not include content wider than the ability model (as proposed by Mayer & Salovey,
1997), are unable to predict health variables in populations with a normal distribution of
stress scores. Whether tests should contain elements wider than the EI model is an issue
distinct from predictive power.
7.2.2 Coping and social support as mediators of the relationship
between EI and health
The current set of studies has not found evidence that the relationship between EI and
health was mediated by either social support or coping. However, this is due to the lack
of significant results for EI predicting health and therefore further mediation analyses
not being undertaken. These studies have provided correlational evidence that trait EI is

- 119 -
significantly associated with both social support and coping which supports past
research.
7.2.3 Unhealthy behaviours as a mediator of the relationship between
EI and health
Study 2 examined whether the relationship between EI and health was mediated by
unhealthy behaviours. Correlational analyses revealed that EI subscales ERE and EC
were not significantly related to unhealthy behaviours. A recent systematic review of EI
and addiction (Kun & Demetrovics, 2010) concluded that low EI was associated with
more intensive smoking, alcohol use and illicit drug use, moreover reporting that
subscales relating to ‘emotion regulation’ and ‘decoding and differentiating emotions’
were the most important factors. Findings of this review suggest that results of the
current study are contrary to the general trend, and therefore that differences are likely
to be related to measures used or low power here [although as previously discussed,
effect sizes reported in meta analyses (Martins, Ramalho & Morin, in press) deem this
latter explanation unlikely].
7.2.4. EI moderating the relationship between trait EI and self
reported health
Studies 1 and 3 reveal that trait EI can moderate the relationship between stress and
health (in study 1 moderated health variables were GP visit frequency and perceived
health; while in study 3 moderated health variables were days healthy T2, days ill health
reduced daily activities T2, and exercise T3). The direction of findings all support the
notion that under high stress, health is best when ERE and EC are high. Although the
current studies fail to find evidence that trait EI can explain significant amounts of
variance in health, the moderational results suggest that under high stress EI may indeed
be predictive of better health. Studies 1, 2 and 3 indicate that ERE and EC are
significantly associated with social support (particularly in study 1 and 2). Therefore,
when individuals with high ERE and EC experience stress, they may well have greater
support to deal with demands, and therefore find stressors less difficult to deal with.
This could mean that behavioural and physiological responses to stress are less likely to
be activated, or consequently impact upon health. Study 1 also indicates that ERE and
EC are significantly and negatively associated with disengaged coping, therefore those
with low ERE and EC are more likely to initiate coping strategies whose aim is to avoid

- 120 -
the stressor and associated feelings. Such strategies may include unhealthy behaviours
such as drinking alcohol and taking drugs. This suggestion is supported by the
longitudinal finding from moderational analyses in study 3 that under high stress those
with high ERE or EC exercise more.
It should be noted that moderation findings have not been consistently revealed (for
example in study 2 no moderation effects were revealed) something which requires
further investigation. A potential explanation for these inconsistencies is that for
moderation analyses categories of high low stress were created by performing a median
split. This false dichotomy may have failed to meaningfully separate those
experiencing high stressor levels, compared to those with low stressor levels.
Additionally, subjective stress scores were not considered, only frequency of reported
events. This allowed separation of the stimulus and response from stressors, however in
doing so the subjective nature of stress responses was not captured.
Interestingly, the significant moderation effects have been consistent in their direction:
Under high stress, low EI has been associated with worse health. This directional
finding does lend support to the notion that EI is protective of health from the harmful
effects of stressful life events. Practical implications of this are that those with low EI
and high stress may be most suitable targets for EI interventions. These people have the
greater risk of ill health, and may benefit the most from intervention. Further, studying
this subgroup may be fruitful in explaining why low emotional intelligence is
problematic under high stress.
7.2.5 EI as a predictor of cortisol reactivity
Trait EI subscales did not predict significant amounts of unique variance in cortisol
levels or mood. Neither did EI moderate the relationship between stressor exposure and
cortisol, although trait EI was found to moderate the relationship between stress
condition and mood at baseline. Results suggest that trait EI is not related to lower
cortisol levels in daily life, and therefore fails to provide evidence that EI might impact
positively on health by precipitating lower cortisol levels (Lindfors & Lundberg, 2002).
However, it is possible that the current cortisol study’s use of naturalistic setting had an
impact upon results. Increasing ecologically valid means that for these participants
(students giving assessed presentations as part of coursework requirements) there may

- 121 -
be a large number of other factors which were more important than trait EI in predicting
stress responses. For example stress responses could be affected by the participants
perceived academic ability, time spent preparing for the presentation, experience at
giving presentations, or their understanding of the topic etc; to measure and control for
such a large number of constructs was not feasible, and was considered too intrusive
and too much of a time burden to be ethical. A further consideration is that participants
in this naturalistic setting had greater control over their environment, and so participants
with low EI profiles could have compensated for their lack of skills in emotion
regulation and expression, finding other behavioural or cognitive ways to deal with their
feelings of tension.
7.3 Emotional recognition and Expression, and Emotional control.
The studies presented in this thesis explored two specific areas of emotional
intelligence; emotional recognition and expression (ERE) and emotional control (EC).
The rationale for doing so was first, that these two subscales had a considerable body of
research evidence supporting the notion that they were influential for health; and second
that past research demonstrated that while emotional expression was good for health,
emotional control was negatively associated with good health. The studies in this thesis
have not found evidence that EC is negatively associated with health, instead finding
that all significant relationships were positive in direction. This contradicts past
research and suggests that emotional control as measured by trait EI scales, taps into a
different construct to questionnaires designed specifically to measure emotional control.
It is likely that emotional control measured as part of the EI construct is assessing
ability or ease at managing emotions, while emotional control questionnaires measure a
desire to control feelings. The lack of convergence in direction of findings between this
thesis and past research suggests that emotional control and emotional control as a facet
of emotional intelligence are qualitatively different constructs. Further, findings do not
support the earlier suggestion (in section 2.3.1) that global EI totals may include
subscales whose relationship with health are not all positive in direction, and that
summed scores could therefore be less informative than individual subscales. However,
it is still the position of this thesis that EI subscales should be explored instead of using
global scores: Understanding which individual subscales are predictive of health will
- 122 -
aid theorising about how EI might influence health, and therefore shape interventions.
This is something which global scores cannot do with precision.
7.4 Theoretical and practical implications of this research
7.4.1 Implications of Trait EI failing to explain significant variance in
health.
This thesis finds that using trait EI measures with content limited to the ability model
(as proposed by Mayer & Salovey, 1997), specifying two subscales Emotion
recognition and expression (ERE) and Emotional control (EC), and controlling for
personality age and gender where appropriate, trait EI is unable to explain unique
variance in health variables.
A good theory is sufficiently specific to allow testable hypotheses to be driven, is
parsimonious, falsifiable, can explain and predict behaviour and has application (Ogden,
2005). The current research has tested trait EI in the context of stress and health, and
has used a parsimonious ability definition of EI. However, trait EI has not explained
significant amounts of unique variance in health or cortisol reactivity. Therefore, the
following points need to be considered: First, given previously reported meta analyses
have found that trait EI does indeed explain variance in health, what type of trait EI here
lacks predictive power? The content of trait EI measures varies widely (see appendix A)
and therefore it could be argued that only measures with content narrowed to the ability
EI model lack utility. Future studies therefore need to isolate the additional material to
explore whether it is this content, rather than the ‘true’ trait EI (i.e. that which matches
the original ability EI model), which has the predictive power revealed in past studies.
Second, theoretically we need to understand how EI might protect health and focus
future investigations on refining this understanding. In this way researchers can explore
EI in a pragmatic manner, allowing utility to drive study design. As Ogden states, if
theories are useful then they should be able to shape health interventions.
What has emerged from the results of this thesis is a list of further questions,
suggestions for refinement, and propositions for future research. The null hypothesis
has not been accepted and this thesis is not proposing that EI has no utility in the field

- 123 -
of stress and health. It is simply asserting that to be useful, a full picture needs to be
drawn to understand where the latent relationships really stand. Future research should
continue to investigate individual subscales rather than global EI scores to provide
maximum theoretical understanding. Further, research should consider investigating the
relationship between EI and health should specifically in participants with high
exposure to stressors. Finally, more naturalistic research should be conducted, using
different measures of stress reactivity, to understand how EI may influence stress
reactions in the real world.
In operationalising EI, this research highlights the need to choose a measure of EI which
maps well on to the ability EI domain. While the results of this collection of studies
provides a complex set of information about the relationship between EI stress and
health, using a measure of EI which was over or under conclusive would have made
interpretation of results even more difficult. Current results reveal that a good measure
of EI without the added predictive power or self esteem, optimism, or happiness can
indeed moderate the relationship between stressor exposure and health. Having a solid
workable definition of EI will make future research an easier proposition as clear
hypotheses can be derived and tested.
7.4.2 Implications of Trait EI moderating the stress health relationship
That Emotional Control and Emotional recognition and expression have been found to
moderate the relationship between stressor exposure and health demonstrates that trait
EI subscales have utility and predictive power. Furthermore, Emotional Control relates
to inhibiting ones own emotions, as this could not be assessed objectively the subjective
measures of trait EI can be seen to provide information, which would not be captured by
ability EI measures. Findings are contrary to claims that Trait EI has no incremental
validity over personality, or little real world use (Roberts, Zeidner & Matthews, 2007).
Moreover, findings support the work of Pennebaker (1997) who reported that emotion
expression of past trauma was predictive of improved health.
Findings that Emotional Control and Emotional Recognition and Expression moderate
the relationship between EI and health reveal that under stressful conditions that
recognising, controlling and expressing of emotions are beneficial for health. However

- 124 -
emotional intelligence does not have the same predictive power over health as
behaviours such as smoking drinking alcohol, and poor diet and therefore would not be
a logical target for intervention at population level. Nevertheless, for individuals under
stressful conditions, increasing skills in Emotional Control and Emotional Recognition
and Expression might form a useful part of cognitive behavioural therapy (CBT) where
negative emotions are reduced with the aim of reducing negative cognitions or
unhealthy behaviours. Additionally findings support the work of charities such as The
Samaritans who allow people to express feelings of distress or despair, such a service is
likely to benefit the health of those who use it.
7.5 Limitations
The current studies have used a student sample, have been unequal in gender
recruitment, and have used young healthy participants. While age and gender have been
controlled for in each study, future research may investigate EI stress and health again
using a wider sample from the general population. While there are issues with using a
student sample, this population has allowed EI and cortisol to be investigated in a
naturalistic setting, something which would be difficult to achieve with other sampling
techniques. Additionally students provide a diverse spread of scores for stressful life
events; students may experience a wide range of challenges in adjusting to university
life, these challenges include but are not limited to financial, domestic, academic and
social arenas.
Investigating cortisol reactivity in a naturalistic way is not without issues. While
participants were asked to refrain from drinking alcohol, smoking, eating and drinking
caffeine before the study, a number of them did not. This is to be expected as
consuming these things will to an extent be part of preparing for an oral presentation.
Participants did record all food drink and nicotine they had consumed and this allowed
control variables to be added into the analyses. While many participants did not refrain
from drinking eating and smoking, none-the-less manipulation checks revealed that
participants giving highly stressful presentations did show physiological reactivity, with
raised cortisol levels immediately after their presentations were over.
Studies 1 to 3 used self-report measures of health. Self report measures not intrusive or
time consuming and are therefore appealing compared to objective assessments such as

- 125 -
heart rate and blood pressure; moreover self reported health has been found to be
predictive of life expectancy and future health as well if not better than medical
examinations (Helmer, Barberger-Gateau, Letenneur & Dartigues, 1999; Miilunpalo,
Vuori, Oja, Pasanen & Urponen, 1997). However such measure are problematic in that
participant’s reports may be subject to reporting biases, memory and perceived demand
characteristics (Ogden, 2007), further they may not provide the same results when
compared with objective health measures (Johnston, Propper & Shields, 2009). It may
therefore be fruitful for future research to replicate these studies using objective
measures of health such as GP records.
7.6 Conclusions
This thesis finds in studies 1,2 and 3, that two components of Trait EI, [Emotional
recognition and expression (ERE), and Emotional control (EC)] as measured with the
SUEIT, are not able to explain unique variance in health scores over the variance
explained by personality in samples with a normal distribution of stress. Additionally,
in study 4 the current study failed to reveal EI as a significant predictor of cortisol
reactivity or mood following an acute stress task. However, trait EI subscales have
revealed evidence that they can significantly moderate the relationship between stressor
exposure and health.
This thesis concludes that using trait EI measures with content limited to the ability
model (as proposed by Mayer & Salovey, 1997), controlling for personality, age and
gender, and using a population that has unspecified magnitude or frequency of stressor
exposure, trait EI is unable to explain significant amounts of variance in health
variables. Future research should therefore aim to provide evidence that more focussed
measures of trait EI have predictive power and incremental validity. Alternatively, to
explore where their predictive power lies, the individual subscales of trait EI measures
with wider content should be investigated. Trait EI has been found to moderate the
relationship between stressor exposure and health, and this should be furthered by
exploring the relationship between EI and health in the context of different levels of
stressor, to explore the possibility that EI is particularly beneficial to health under high
stress. Understanding these nuances is important in understanding how EI interventions
may be targeted to protect physical health from the effects of stressors. Stressful

- 126 -
environments are ubiquitous in work and education, therefore investigating how EI
might protect from its negative effect health should be considered worthwhile.
Refinement of the methods and measures used in this thesis would provide useful data
on whether EI can make a quantitative difference to health in the presence of acute or
prolonged stressors. In summary, this thesis does not present convincing evidence that
trait EI can protect health for people with all levels of stressor exposure. However,
results of the current study do suggest that trait EI is a significant moderator of the
relationship between stressor exposure and health. That trait EI has been found to
protect health from the effects of stress, supports the claims of theorists by revealing
that emotional intelligence really does influence everyday life, and that its interaction
with exposure to stressors is as important as claimed for coping with or experiencing
emotional stress reactions.
- 127 -
References
Abbott, J., Hart, A., Morton, A., Gee, L., & Conway, S. (2008). Health related
Quality of life in adults with cystic fibrosis: The role of coping. Journal of
Psychosomatic Research, 64, 149-157.
Aiken, L. S., & West, S. G. (1991). Multiple regression: Testing and interpreting
interactions. Newbury Park, London, Sage
Allison, P. D. (1998). Multiple Regression: A primer. Sage, London.
Amelang, M., & Steinmayr, R. (2006). Is there a validity increment for tests of
emotional intelligence in explaining the variance of performance criteria?
Intelligence, 34, 459- 468.
Anie, K. A., Steptoe, A., & Bevan, D. H. (2002). Sickle cell disease: pain coping and
quality of life in a study of adults in the UK. British Journal of Health Psychology, 7,
331-344.
Aseltine, R, H., & Gore, S. L. (2000). The variable effects of stress on alcohol use
from adolescence to early adulthood. Substance Use and Misuse, 35, 643- 668.
Austin, E. J., Dore, T. C. P. & O'Donovan, K. M. (2009) Associations of personality
and emotional intelligence with display rule perceptions and emotional
labour. Personality and Individual Differences, Vol 44(3), Feb 2008. pp. 679-688.
Autsin, E. J., Saklofske, D. H., & Egan, V. (2005). Personality, well being and health
correlate of trait emotional intelligence. Personality and Individual Differences, 38,
547-558.

- 128 -
Axelsson L, Ejlertsson G. (2002) Self-reported health, self-esteem and social support
among young unemployed people: a population-based study. International Journal of
Social Welfare, 11, 111–119.
Bandura, A. (1977). Self efficacy: toward a unifying theory of behaviour change.
Psychological review, 84, 191-215
Bandura, A. (1986). Social foundations of thought and action. Englewood Cliffs, NJ:
Prentice Hall.
Bar-On, R. (1997). Bar-On Emotional Quotient Inventory (EQ-i): Technical Manual.
Toronto Canada: Multi-Health Systems
Baron, R. M., & Kenny, D. A. (1986). The moderator-mediator variable distinction in
social psychology research: Conceptual, strategic and statistical considerations.
Journal of Personality and Social Psychology, 51 (6) 1173-1182.
Bar-On, R. (2004). The Bar-On Emotional Quotient Inventory (EQ-i): Rationale,
description and summary of descriptive properties. In G. Geher (Ed.), Measuring
emotional intelligence: Common ground and controversy (pp. 111-142). Hauppage,
NY: Nova Science.
Bastian, V. A., Burns, N. R. & Nettlebeck, T (2005). Emotional intelligence predicts
life skills, but not as well as personality and cognitive abilities. Personality and
Individual Differences, 39, 1135- 1145.
Bedeian, A. G., & Mossholder, K. W. (1994). Simple question, not so simple answer:
Interpreting interaction terms in moderated multiple regression. Journal of
Management, 20, 1 159-165.
Bermudez, J. (1999). Personality and health protective behaviour. European Journal
of Personality, 13, 83-103.

- 129 -
Bermudez, J. (2006). Personality science, self regulation and health behaviour.
Applied Psychology: An international review, 55(3), 386-396.
Bolger, N. (1990). Coping as a personality process: A prospective study. Journal of
Personality and Social Psychology, 59 (3), 525-537.
Booth-Kewley, S., & Vickers, R. R. (1994). Associations between major domains of
personality and health behaviour. Journal of Personality, 62 (3), 281- 298.
Brackett, M. A., & Mayer, J. D. (2003). Convergent, discriminant and incremental
validity of competing measures of emotional intelligence. Personality and Social
Psychology Bulletin, 29, 1147- 1158.
Brackett, M. A., Rivers, S. E., Shiffman, Lerner, N., & Salovey, P. (2006). Relating
emotional abilities to social functioning: A comparison of self report and
performance measures of Emotional Intelligence. Journal of Personality and Social
Psychology, 91 (4), 780-795.
Brantley, P. J., Dietz, L. S., McKnight, G. T., Jones, G. N., & Tulley, R. (1988).
Convergence between the daily stress inventory and endocrine measures of stress.
Consulting and Clinical Psychology, 4, 549-551.
Brantley, P. J., Waggoner, C. D., Jones, G. N., & Rappaport, N. B. (1987). A Daily
Stress Inventory: Development, reliability, and validity. Journal of Behavioral
Medicine, 10, 61-74.
Broderick, J. E., Junghaenel, D. U. & Schwartz, J. E. (2005). Written Emotional
expression produces health benefits in Fibromyalgia patients. Psychosomatic
Medicine, 67, 326- 334.
Brody, N. (2004). What cognitive intelligence is and what emotional intelligence is
not. Psychological Inquiry, 15(3), 234- 238.

- 130 -
Burleson,M. H., Poehlmann, K. M., Hawkley, L. C., Ernst, J. M., Berntson, G. G.,
Malarkey, W. B., Kiecolt-Glaser, J. K., Glaser, R., & Cacioppo, J. T. (2003).
Neuroendocrine and cardiovascular reactivity to stress in mid-aged and older women:
Long-term temporal consistency of individual differences. Psychophysiology, 40,
358-369.
Burns, N. R., Bastian, V. A., & Nettelbeck, E. (2007). Emotional intelligence: More
than personality and cognitive ability? In G. Matthews, M. Zeidner, & R. D. Roberts
(Eds.), The science of emotional intelligence: Knowns and unknowns (pp. 167-196).
New York: Oxford University Press.
Cannon, W. B. (1932). The wisdom of the body (2nd ed.). New York: Norton.
Carver, C. S. (1997). You want to measure coping but your protocol’s too long:
Consider the Brief COPE. International Journal of Behavioral Medicine, 4 (1), 92-
100.
Carver, C. S., & Scheier, M. F. (1981). Attention and self regulation: A control
theory approach to human behaviour. New York: Springer- Verlag.
Carver, C.S., Scheier, M. F. & Weintraub, J. F. (1989). Assessing coping strategies: A
theoretically based approach. Journal of Personality and Social Psychology, 56, 267-
283.
Centers for Disease Control and Prevention (CDC) (2006). Behavioral Risk Factor
Surveillance System Survey Questionnaire. Atlanta, Georgia: U.S. Department of
Health and Human Services, Centers for Disease Control and Prevention.
Chapman, B. P., & Haylsip, B. (2006). Emotional intelligence in young and middle
adulthood: Cross-sectional analysis of latent structure and means. Psychology and
Aging, 21 (2), 411-418.

- 131 -
Ciarrochi, J., Caputi, P., & Mayer, J. D. (2003). The distinctiveness and utility of a
measure of trait emotional awareness. Personality and Individual Differences, 34,
1477-1490.
Ciarrochi, J., Chan, A. Y., & Bajgar, J. (2001). Measuring Emotional Intelligence in
adolescents. Personality and Individual differences, 31, 539-561.
Ciarrochi, J., Chan, A., & Caputi, P. (2000). A critical evaluation of the emotional
intelligence construct. Personality & Individual differences, 28, 539-561
Ciarrochi, J., Deane, F. P., & Anderson, S. (2002). Emotional intelligence moderates
the relationship between stress and mental health. Personality and individual
differences, 32, 197-209.
Ciarrochi, J., Forgas, J. P. & Mayer, J. D. (2001) Emotional Intelligence in everyday
life: A scientific enquiry. New York: Psychology Press.
Ciarrochi, J. & Scott, G. (2006). The link between emotional competence and well-
being: a longitudinal study. British Journal of Guidance & Counselling, 34, 2, 231-
243.
Clark-Carter, D. (2004). Quantitative psychological research: A student handbook.
Hove: Psychology Press.
Clarke, D. & Singh, R. (2005). The influence of pessimistic explanatory style on the
relation between stressful life events and hospital doctors’ psychological distress.
Social Behavior and personality, 33 (3), 259-272.
Clements, K., & Turpin, G. (2000). Life event exposure, physiological reactivity and
psychological strain. Journal of behavioral Medicine, 23 (1), 73- 94

- 132 -
Cohen, J. (1988). Statistical power analysis for the behavioral sciences. (2nd ed.)
Hillsdale, NJ: Lawrence Erlbaum Associates.
Cohen, J. (1992). A power primer. Psychological Bulletin, 112, 155-159.
Cohen, J. & Cohen, P. (1983). Applied multiple regression/correlation
for the behavioral sciences. (2nd ed.) Hillsdale, New Jersey: Lawrence
Erlbaum Associates.
Cohen, S., Doyle, W. J., Turner, R. B., Alper, C. M., & Skoner, D. P. (2003a).
Sociability and susceptibility to the common cold. Psychology Science, 14, 389-395.
Cohen, S., Doyle, W. J., Turner, R. B., Alper, C. M., & Skoner, D. P. (2003b).
Emotional style and susceptibility to the common cold. Psychosomatic Medicine, 65,
652-657.
Cohen, S., Frank, E., Doyle, W. J., Skoner, D. P., Rabin, B. S., & Gwaltney, J. M.
(1998). Types of stressor that increase susceptibility to the common cold in health
adults. Health Psychology, 17 (3), 214-223.
Cohen, S., Kessler, R. C., & Gordon, L. U. (1997). Measuring stress: A guide for
health and social scientists. Oxford: Oxford University Press.
Cooper, M. L., Russell, M., & George, W. H. (1988). Coping expectancies, and
alcohol abuse: A test of social learning formulations. Journal of Abnormal
Psychology, 97 (2) 218-230.
Cosnes, J., Carbonnel , F., Beaugerie, L., Le Quintre, Y. and Gendre, J. P. (1996).
Effects of cigarette smoking on the long-term course of Crohn's disease.
Gastroenterology. 110, 2, 424-431.
Davies, M., Stankov, L., & Roberts, R. D. (1998). Emotional Intelligence, in search
of an elusive construct. Journal of Personality and Social Psychology, 75, 989- 1015

- 133 -
Dawda, D. & Hart, S. D. (2000). Assessing emotional intelligence: reliability and
validity of the Bar-on Emotional Quotient Inventory (EQ-i) in university students.
Personality & Individual Differences, 28, 797-812.
Daus, C. S., & Ashkanasy, N. M. (2005). The case for the ability based model of
emotional intelligence in organisational behavior. Journal of Organisational
behaviour, 26 (4), 453- 466.
Davidson, L. M., & Demaray, M. K. (2007). Social support as a moderator between
victimisation and internalising-externalising distress from bullying. School
Psychology Review, 36 (3), 383-405.
Day, A. L., Therrien D. L. & Carroll, S. A. (2005). Predicting Psychological Health:
Assessing the incremental validity of emotional intelligence beyond personality, Type
A behaviour, and daily hassles. European Journal of Personality, 19, 519- 536.
Declercq F. & Palmans, V. (2006). Two subjective factors as moderators between
critical incidents and the occurrence of post traumatic stress disorders: ‘Adult
attachment’ and ‘perception of social support’. Psychology and psychotherapy:
Theory, Research and Practcie, 79, 323-337.
DeLongis, A., Coyne, J., Dakof, G., Folkman, S. & Lazarus, R. S. (1982). The impact
of daily stress on health and mood: Psychological and social resources as mediators.
Journal of Personality and Social Psychology, 54, 486- 495.
Denollet, J. (2005). Standard assessment of negative affectivity, social inhibition, and
Type D personality. Psychosomatic medicine, 67, 89-97.
De Ridder, D., Schreurs, K., & Bensing, J. (2000). The relative benefits of being
optimistic: Optimism as a coping resource in multiple sclerosis and Parkinson’s
disease. British Journal of Health Psychology, 5, 141-155.

- 134 -
Dickerson, S. S., & Kemeny, M. E. (2004). Acute stressors and cortisol responses: A
theoretical integration and synthesis of laboratory research. Psychological Bulletin,
130 (3), 355-391.
Dom, L. D., Lucke, J. F., Loucks, T. L. & Berga, S. L. (2007). Salivary cortisol
reflects serum cortisol: Analysis of circadian profiles. Annals of Clinical
Biochemistry, 44, 3, 281- 284.
Domes, G., Heinrichs, M., Reichwald, U., & Hautzinger, M. (2002). Hypothalamic-
pituitary-adrenal axis reactivity to psychological stress and memory in middle-aged
women: High responders exhibit enhanced declarative memory performance.
Psychoneuroendocrinology, 27, 843-853.
Eisenberger, N. I., Taylor, S. E., Gable, S. L., Hilmert, C. J., & Lieberman, M. D.
(2007). Neural pathways link social support to attenuated Neuroendocrine stress
responses. NeuroImage, 35, 1601-1612
Eisenberg, N., & Spinrad, T. L. (2004). Emotional related regulation: Sharpening the
definition. Child Development, 75, 334-339.
Epel, E., Lapidus, R., McEwen, B. & Brownell, K. (2001). Stress may add bite to
appetite in women: A laboratory study of stress-induced cortisol and eating
behaviour. Psychoneuroendocrinology, 26, 37-49.
Farber, B. A. (1985). The genesis, development and implications of psychological
mindedness is psychotherapists. Psychotherapy, 22, 170-177.
Farber, B. A. (1989). Psychological mindedness: Can there be too much of a good
thing? Psychotherapy, 26, 210-217.
Field, A. (2005). Discovering Statistics Using SPSS (Second edition). London: Sage
Publications Ltd.

- 135 -
Flaherty, J A., Gaviria, F. M, Pathak, D. S., (1983). The measurement of social
support: The Social Support Network Inventory. Comprehensive Psychiatry, Vol
24(6). 521-529.
Folkman S., & Lazarus, R. S. (1980). An analysis of coping in a middle aged
community sample. Journal of Health and Social Behavior, 21, 219- 239.
Friedman, H. S. & Booth-Kewley, S. (1987) Personality, Type A behavior, and
coronary heart disease: The role of emotional expression. Journal of Personality and
social psychology, 53 (4), 783- 792.
Fuxe, K., Anderson, K., Eneroth, P., Harfstrand, A., & Adnati, L.F. (1989).
Neuroendocrine actions of nicotine and of exposure to cigarette smoke: medical
implications
Gaab, J., Rohleder, N., Nater, U. M., & Ehlert, U. (2005). Psychological determinants
of the cortisol stress response: the role of anticipatory cognitive appraisal.
Psychoneuroendocrinology, 30, 599-610.
Gallagher, D. (1996). Personality, coping and objective outcomes: Extraversion,
neuroticism, coping styles and academic performance. Personality and Individual
Differences, 21 (3), 421- 429.
Gannon, N. & Ranzijn, R. (2005). Does emotional intelligence predict unique
variance in life satisfaction beyond IQ and personality? Personality and individual
differences, 38, 1353-1364.
Gardener, H. (1983). Frames of mind: The theory of multiple intelligences. New
York: Basic books.
Gardener, H. (1993). Multiple intelligences. New York: Basic books.
- 136 -
Gardner, K. J. & Qualter, P. (2010). Concurrent & incremental validity of three
emotional intelligence measures. Australian Journal of Psychology, 62, 1, 5-13.
Geher, G., Warner, R. M., & Brown, A. S. (2001). Predictive validity of the
Emotional Accuracy Research Scale. Intelligence, 29, 373-388.
Gohm, C. L., Corser, G. C. & Dalsky, D. J. (2005). Emotional intelligence under
stress: Useful, unnecessary, or irrelevant. Personality and Individual Differences, 39,
1017- 1028.
Goldberg, L. R. (1999). A broad-bandwidth, public domain, personality inventory
measuring the lower-level facets of several five-factor models. In I. Mervielde, I.
Deary, F. De Fruyt, & F. Ostendorf (Eds.), Personality Psychology in Europe, Vol. 7
(pp. 7-28). Tilburg, The Netherlands: Tilburg University Press.
Goldenberg, I., Mathesson, K., & Mantler, J. (2006). The assessment of emotional
intelligence: A comparison of performance based and self reported methodologies.
Journal of Personality Assessment, 86, 33-45.
Goleman, D. (1995). Emotional Intelligence. New York: Bantam Books
Gomez, R., Holmberg, K., Bounds, J., Fullarton, C. & Gomez, A. (1999).
Neuroticism and extroversion as predictors of coping styles during early adolescence.
Personality and Individual Differences, 27 (1), 3-17.
Gonzalez-Bono, E., Rohleder, N., Hellhammer, D. H., Salvador, A. & Kirschbaum, C.
(2002). Glucose but not protein or fat load amplifies the cortisol response to
psychosocial stress. Hormones and Behavior, 41, 328-333.
Goode, K T., Haley, W. E., Roth, D. L., & Ford, G. R. (1998). Predicting
longitudinal changes in caregiver physical and mental health: A stress process model.
Health Psychology, 17 (2) 190- 198.

- 137 -
Gortner, E.-M., & Pennebaker, J.W. (2003). The archival anatomy of a disaster:
Media coverage and community-wide health effects of the Texas A&M Bonfire
Tragedy. Journal of Social and Clinical Psychology, 22, 580-603.
Gow, A. J., Whiteman, M. C., Pattie, A. & Deary, I. J. (2005). Goldberg’s ‘IPIP’ Big-
Five factor markers: Internal consistency and concurrent validation in Scotland.
Personality and Individual Differences, 39 (2), 317-329.
Graue, M., Wentzel-Larsen, T., Bru, E., Hanestad, B. R., & Sdegreesvik, O. (2004).
The coping styles of adolescents with type 1 diabetes are associated with degree of
metabolic control. Diabetes Care, 27 (6), 1313-1317.
Graybeal, A., Sexton, J.D., & Pennebaker, J.W. (2002). The role of story-making in
disclosure writing: The psychometrics of narrative. Psychology and Health, 17, 571-
581
Harrison, P. A., Fulkerson, J. A. & Beebe, T. J. (1997). Multiple substance use
among adolescent physical and sexual abuse victims. Child Abuse & Neglect, 21 (6),
529-539.
Harrod, N. R., & Scheer, S. D. (2005). An exploration of adolescent emotional
intelligence in relation to demographic characteristics. Adolescence, 40 (159), 503-
512.
Haslam, O’Brien, Jetten, Vormedal & Penna, (2005). Taking the strain: Social
identity, social support and the experience of stress. British Journal of Social
Psychology, 44, 355-370.
Haviland, M G., Shaw, D. G., Cummings, M. A. & Macmurray, J. P. (1988).
Alexithymia: Subscales and relationship to depression. Psychotherapy and
Psychosomatics, 50, 164-170.

- 138 -
Helgeson, V. S., & Lepore, S. J. (2004). Quality of life following prostate cancer: The
role of agency and unmitigated agency. Journal of Applied Social Psychology. 34:
2559–2585.
Helmer, C., Barberger-Gateau, P., Letenneur, L., Dartigues, J. F. (1999). Subjective
health and mortality in French elderly women and men. Journal of Gerontology in the
Psychological Sciences and Social Sciences. 54, 84–92.
Hennessy, C.H., Moriarty, D.G., Zack, M.M, Scherr, P.A. & Brackbill, R. (1994).
Measuring health-related quality of life for public health surveillance.
Public Health Reports, 109, 665-672.
Hoffman, J. P., & Su, S. S., (1998). Stressful life events and adolescent substance use
and depression: conditional gender and gender differentiated effects. Substance Use
and Misuse, 33, 2219- 2262.
Holahan, C. J., & Moos, R. H. (1987). Personal and Contextual determinants of
coping strategies. Journal of Personality and Social Psychology, 52, 946-955.
Holmes, T. H. (1979). Development and application of a quantitative measure of life
change magnitude. In J. E. Barret, R. M. Rose, & G. L. Klerman (Eds.), Stress and
mental disorder. New York: Raven Press.
Holmes, T. H., & Rahe, R. H. (1967), The social readjustment rating scale. Journal of
Psychosomatic Research, 11(2), 213-218
Houtman, I. L., & Bakker, F. C., (1991). Individual differences in reactivity to and
coping with the stress of lecturing. Journal of Psychosomatic Research, 35, 11-24.
Hutchinson, C. (1999). Social support: factors to consider when designing studies
that measure social support. Journal of Advanced Nursing, 29 (6), 1520-1526.

- 139 -
Hyman, S. M., Gold, S. M., & Cott, M. A. (2003). Forms of social support that
moderate PTSD in childhood sexual abuse survivors. Journal of family violence. 18
(5), 295- 300
Idler, E. L., & Angel, R. J. (1990). Self-Rated Health and Mortality in the NHANES-I
Epidemiologic Follow-up Study. American Journal of Public Health, 80 (4), 446-
452.
Ioannis, T. & Ioannis, N (2005). Exploring the relationship of emotional intelligence
with physical and psychological health functioning. Stress and Health, 21, 77-86.
John, O. P., & Gross, J. J (2004). Healthy and Unhealthy Emotion Regulation:
Personality Processes, Individual Differences and Life Span Development. Journal of
Personality, 72 (6), p1301-1334.
Johnston, D. W., Propper, C. & Shields, M. A. (2009). Comparing subjective and
objective measures of health: Evidence from hypertension for the income/health
gradient. Journal of Health Economics, 28, 3, 540- 552.
Jordan, P. J., Ashkanasy, N. M. & Hartel, C. E. (2002). Emotional Intelligence as a
moderator of emotional and behavioural reactions to job insecurity. Academy of
Management Review, 27, 3, 361-372.
Kanner, A. D., Coyne, J. C., Schaefer, C. & Lazarus, R. S. (1981). Comparison of
two modes of stress management: Daily hassles and uplifts verses major life events.
Journal of Behavioural Medicine, 4, 1-39.
Kaplin, R. M., & Saccuzzo, D. P. (2004). Psychological testing: Principles,
applications, and issues (6th ed.). Belmont, CA: Thompson Wadsworth.
Karmack, T., & Jenning, J. R. (1991). Biobehavioural factors in sudden cardiac
death. Psychological Bulletin, 109, 42-75.
- 140 -
Kenney, J. W., & Bhattacharjee, A. (2000). Interactive model of womens stressors,
personality traits and health problems. Journal of Advanced Nursing, 32(1), 249-258.
Kenyon, L. W., Ketterer, M. W., Gheorghiade, M., & Goldstein, S. (1991).
Psychological factors related to prehospital delay during acute myocardial infarction.
Circulation, 84, 1969- 1976.
Kessler, R. C., Price, R., & Wortman, C. (1985). Social factors in psychopathology:
Stress social support and coping processes. Annual Review of Psychology, 36, 531-
572.
Kiecolt-Glaser, J. K., Dura, J. R., & Speicher, C. E. (1991). Spousal caregivers of
dementia victims: Longitudinal changes in immunity and health. Psychosomatic
medicine, 53 (4), 345-362.
Kiecolt-Glaser, J. K., Ricker, D., George, J., Messick, G., Speicher, C. E., Garner, W.,
Glaser, R. (1984b). Urinary cortisol levels, cellular immunocompetency, and
loneliness in psychiatric inpatients. Psychosomatic medicine, 46, 15-24.
King, L. A., & Emmons, R. A. (1990). Conflict over emotional expression:
psychological and physical Correlates. Journal of Personality & Social Psychology,
58 (5), 864- 877.
Kirk, B.A., Schutte, N.S., & Hine, D.W. (2008). Development and preliminary
validation of an emotional self-efficacy scale. Personality and Individual Differences,
45, 432-436.
Kirschbaum, C., & Hellhammer, D. (1989). Salivary Cortisol in Psychobiological
Research: An Overview. Neuropsychobiology, 22 (3), 150-169.
- 141 -
Kirschbaum, C., & Hellhammer, D. (1993). Methodological aspects of salivary
cortisol measurement. In C. Kirschbaum, G. F. Read, & D. H. Hellhammer (Eds.),
Assessment of Hormones and Drugs in Saliva in Biobehavioral Research (pp.19-32)
Kirschbaum, C., Pirke, K.-M., & Hellhammer, D.H. (1993). The 'Trier Social Stress
Test'- a tool for investigating psychobiological stress responses in a laboratory setting.
Neuropsychobiology, 28, 76-81.
Kouvonen, A., Kivimaki, M., Virtanen, M., Pentti, J., & Vahtera, J. (2005). Work
stress, smoking status, and smoking intensity: An observational study of 46,190
employees. Journal of Epidemiology and Community Health, 59, 63-69.
Kudielka, B. M., Schommer, N. C., Hellhammer, D. H., & Kirschbaum, C. K. (2004).
Acute HPA axis responses, heart rate, and mood changes to psychological stress
(TSST) in humans at different times of the day. Psychoneuroendocrinology, 29, 983-
992.
Kun, B. & Demetrovics, Z. (2010). Emotional intelligence and addictions: A
systematic review. Substance Use & Misuse, 45, 7/8, 1131- 1160.
Lane, R. D., Quinlan, D. M., Schwartz, G. E., Walker, P. A., & Zeitlin, S. B. (1990).
The Levels of Emotional Awareness Scale: A cognitive developmental measure of
emotion. Journal of Personality Assessment, 55, 124- 134.
Lazarus, R. S. (1966). Psychological stress and the coping process. New York:
McGraw-Hill.
Lazarus, R. S. (1999). Stress and Emotion: A New Synthesis. New York: Springer
Lazarus, R. S. & Folkman, S. (1984). Stress appraisal and coping. New York:
Springer

- 142 -
LeBlanc, J., & Ducharme, M. B. (2005). Influence of personality traits on plasma
levels of cortisol and cholesterol. Physiology and Behaviour, 84 (5), 677- 680.
Lincoln, K. D., Chatters, L. M., & Taylor, R. J. (2003). Psychological distress among
black and white Americans: Differential effects of social support, negative interaction
and personal control. Journal of Health and Social Behaviour, 44 (3), 390-407.
Lindfors, P. & Lundberg, U. (2002). Is low cortisol release an indicator of positive
health? Stress and Health, 18, 153-160.
Ling, M., Perry, P., & Tsuang, M. (1981). Side effects of corticosteroid therapy:
Psychiatric aspects. Archives of General Psychiatry , 38, 471- 477
Litz, B. (1992). Emotional numbing in combat-related post traumatic stress disorder:
A critical review and reformulation. Clinical Psychology Review, 12, 4, 417-432.
Lopes, P. N., Brackett, M. A., Nezlek, J. B., Schutz, A., Sellin, I., & Salovey, P.
(2004). Emotional intelligence and social interaction. Personality and Social
Psychology Bulletin, 30 (8), 1018-1034.
Lopes, P. N., Salovey, P., & Straus, R. (2003). Emotional intelligence, personality,
and the perceived quality of social relationships. Personality and Individual
Differences, 35, 641- 658.
Lounsbury, J. W., Levy, J. J., Leong, F. T. & Gibson, L. W.(2007). Identity &
Personality: The Big Five Personality Traits in Relation to Sense of Identity. Identity.
7, 1, 51-70.
Lovallo, W. R. (2005) Stress & Health: Biological and psychological interactions
(2nd edition). California: Sage.

- 143 -
Low, C. A, Stanton, A. L. & Danoff- Burg, 2006). Expressive disclosure and benefit
finding among breast cancer patients: Mechanisms for positive health effects. Health
Psychology, 25 (2), 181- 189.
Lumley, M. A., Stettner, L. & Wehmer, F. (1996). How are Alexithymia and physical
ilness linked? A review and critique of Pathways. Journal of Psychosomatic
Research, 41
Lupien, S. J., & McEwen, B. S. (1997). The acute effects of corticosteroids on
cognition: Integration of animal and human model studies. Brain Research Reviews,
24, 1-27.
Lyons, J. B. & Schneider, T. R. (2005). The influence of emotional intelligence on
performance. Personality and Individual Differences. 39, 693-703.
MacCann, C., Matthews, G., Zeidner, M., & Roberts, R. D. (2004). The assessment
of emotional intelligence: on frameworks, fissures, and the future. In G. Geher (Ed.),
Measuring emotional intelligence: Common ground and controversy (pp 19-50).
Hauppauge, NY: Nova Science
MacCann, C., Roberts, R. D., Matthews, G., & Zeidner, M. (2004). Consensus
scoring and empirical option weighting of performance-based emotional intelligence
(EI) tests. Personality and Individual Differences, 36, 645-662.
Major, B., Zubek, J. M., Cooper, M., L., Cozzarelli, R., & Richards, C. (1997).
Mixed messages: Implications of social conflict and social support within close
relationships for adjustment to a stressful life event. Journal of Personality and
Social Psychology, 72 (6) 1349-1363.
Marks, D.F., Murray, M., Evans, B., Willig, C., Woodall, C. & Sykes, C. M. (2005).
Health psychology: Theory research & practice (2nd Edition). London: Sage.

- 144 -
Martins, A., Ramalho, N., & Morin, E. (In Press). A comprehensive meta-analysis of
the relationship between Emotional intelligence and health. Personality and
Individual Differences.
Matthews, Emo, Roberts & Zeider, (2006). What is this thing called emotional
intelligence? In K. R. Murphy (Ed.), A critique of emotional intelligence: What are
the problems and how can they be fixed? (pp. 3-36). Mahwah, NJ, US: Lawrence
Erlbaum Associates Publishers
Matthews, G., Zeidner, M. & Roberts, R. D. (2002a). Emotional intelligence: Science
and Myth. London: MIT press.
Mavrovelo, S., Petrides, K. V., Rieffe, C., & Bakker, F. (2007). Trait emotional
intelligence, psychological well-being and peer-rated social competence in
adolescence. British Journal of Developmental Psychology, 25, 263- 275.
Mayer, J. D. (2001). A field guide to emotional intelligence. In J. Ciarrochi, J. P.
Forgas, & J. D. Mayer (Eds.), Emotional intelligence and everyday life (pp. 3-24).
New York: Psychology Press.
Mayer, J. D., Caruso, D. R., & Salovey, P. (2000). Selecting a measure of emotional
intelligence: the case for ability scales. In R.Bar-On & J. D. A. Parker (Eds.), The
Handbook of Emotional Intelligence (pp. 320-342). Jossey-Bass: San Francisco, CA.
Mayer, J. D., Caruso, D. R., & Salovey, P. (1999). Emotional Intelligence meets
traditional standards for an intelligence. Intelligence, 27, 267-298.
Mayer J. D., & Salovey, P. (1997). What is emotional intelligence? In P. Salovey &
D. Sluyter (Eds.), Emotional development and emotional intelligence: Implication for
educators (pp. 3-31). New York: Basic Books.

- 145 -
Mayer, J. D., Salovey, P., & Caruso, D. (2000b). Models of emotional intelligence. In
Robert J.Sternberg (Ed.), Handbook of Intelligence (2nd ed.) (pp. 396-420). New
York: Cambridge University Press.
Mayer, J. D., Salovey, P., & Caruso, D. R. (2000c). Emotional Intelligence as a
zeitgeist, as personality, and as a mental ability. In R.Bar-On & J. D. A. Parker (Eds.),
The Handbook of Emotional Intelligence (pp. 92-117). San Francisco, CA: Jossey-
Bass.
Mayer, J. D., Salovey, P., & Caruso, D. R. (2002). Mayer Salovey Caruso Emotional
Intelligence Test (MSCEIT) users manual. Toronto, Canada: MHS
Mayer, J. D., Salovey, P., Caruso, D. R. & Sitarenios, G. (2003). Measuring
emotional intelligence with the MSCEIT V2.0. Emotion, 3 (1), 97-105.
McLaughlin, J. A., Miller, P., & Warwick, H. (1996). Deliberate self harm in
adolescents: Hopelessness, depression, problems and problem-solving. Journal of
Adolescence, 19, 523- 532.
Miilunpalo, S., Vuori, I., Oja, P., Pasanen, M., Urponen, H. (1997). Self-rated health
as a health measure: The predictive value of self-reported health status on the use of
physician services and mortality in the working-age population. Journal of Clinical
Epidemiology, 50, 517–528.
Mikolajczak, M., Luminet, O., Leroy, C. & Roy, E. (2007). Psychometric properties
of the trait emotional intelligence questionnaire: factor structure, reliability, construct
and incremental validity in a French speaking population. Journal of Personality
Assessment, 88 (3), 338-353.
Mikolajczak, M., Luminet, O., & Menil, C. (2006). Predicting resistance to stress:
incremental validity of trait emotional intelligence over alexithymia and optimism.
Psicothema, 18, 579- 588.
- 146 -
Mikolajczak, M., Roy, E., Luminet, O., Fillee, C., De Timary, P. (2007). The
moderating impact of emotional intelligence on free cortisol response to stress.
Psychoneuroendocrinology, 32 (8-10), 1000-1012
Montes-Berges, B., & Augusto, J. M. (2007). Exploring the relationship between
perceived emotional intelligence, coping, social support and mental health in nursing
students. Journal of Psychiatric and Mental Health Nursing, 14, 163- 171.
Moos, R. H., & Schaefer, J. A. (1993) Coping resources and processes: Current
concepts and measures. In L. Golderberger & S. Breznitz (Eds.), Handbook of stress:
Theoretical and clinical aspects. 2nd ed (pp234-57) New York: Free Press.
Montes-Berges, B., & Augusyo, J. M. (2007). Exploring the relationship between
perceived emotional intelligence, coping, social support and mental health in nursing
students. Journal of Psychiatric and Mental Health Nursing. 14, 163-171.
Morano, C. L. (2003). Appraisal and coping: Moderaotrs of mediators of stress in
Alzheimer’s disease caregivers? Social Work Research, 27 (2), 116-129.
Moushmoush, B. & Abi-Mansour, P. (1991). The Long-term Effects of Alcohol on
the Cardiovascular System. Archives of Internal Medicine. 151, 1, 36-42.
Muniz, M., Primi, R., & Miguel, F. K. (2007). Study of emotional intelligence as
stress controller for city guards. Psicologia: Teoria e Pratica, 9 (1), 27-41
Murphy, K. R. & Davidshofer, C. O. (2005). Psychological testing: Principles and
application (6th ed.). Upper Saddle River, NJ: Prentice Hall.
Najavits, L. M., Weiss, R. D., & Shaw, S. R. (1997). The link between substance
abuse and post traumatic stress disorder in women. American Journal of Addiction, 6
(4), 272-281.

- 147 -
Nemiah, J. C., Freyberger, H., & Sifneos, P. E. (1976). Alexithymia: A view of the
psychosomatic process. In O. W. Hill (Ed.), Modern trends in psychosomatic
medicine (vol. 3, pp. 430-439). London: Butterworths
Nezlek J. B., & Allen, M. R. (2006). Social support as a moderator of day-to-day
relationships between daily negative events and daily psychological well-being.
European Journal of Personality, 20, 53-68
Ng, S. K. S., & Leung, W. K. (2006). A community study on the relationship
between stress, coping, affective disposition and periodontal attachment loss.
Community Dentistry & Oral Epidemiology, 34 (4), 252- 266.
Ogden, J. (2007). Health psychology: A textbook (4th Edition). New York: Open
University Press.
Oginska-Bulik, N (2005). Emotional intelligence in the workplace: Exploring its
effects on occupational stress and health outcomes in human section workers.
International Journal of Occupational Medicine and Environmental Health, 18 (2),
167- 175.
O’Connor, R. M., & Little, I. S. (2003). Revisiting the predictive validity of
emotional intelligence: self report versus ability-based measures. Personality and
Individual Differences, 35, 1893-1902.
Orsillo, S. M., Batten, S. V., Plumb, J. C., Luterek, J. A., & Roessner, B. M. (2004).
An experimental study of emotional responding in women with post traumatic stress
disorder related to interpersonal violence. Journal of Traumatic Stress, 17, 241- 279.
Pallant, J (2006). The SPSS Survival manual. New York: Open University Press.
Palmer, R. B., & Stough, C. (2001). Swinburne University Emotional Intelligence
Test: Interim technical manual. Melbourne: Organisational Psychology Research
Unit, Swinburne University of Technology (unpublished).
- 148 -
Parker. J. D. A., Summerfeldt, L. J., Hogan, M. J., & Majeski, S. A. (2004).
Emotional Intelligence and academic success: Examining the transition from high
school to university. Personality and Individual differences, 36, 163-172.
Parker, J. D. A., Taylor, G. J., & Bagby RM.(1998). Alexithymia: Relationship with
the ego defence and coping styles. Comprehensive Psychiatry, 39, 91-98.
Parker, J. D. A., Taylor, G.J., Bagby, R. M., & Acklin, M. W. (1993). Alexithymia in
panic disorder and simple phobia: a comparative study. American Journal of
Psychiatry;150:1105-1107.
Paykel, E. S. (1983). Methodological aspects of life event research. Journal of
Psychosomatic Research, 27, 341-352.
Pennebaker, J. W., & Beall, S. K. (1986). Confronting a traumatic event:
Toward an understanding of inhibition and disease. Journal of Abnormal
Psychology, 95, 274–281.
Petrides, K. V., Frederickson, N., & Furnham, A. (2004). The role of trait emotional
intelligence in academic performance and deviant behaviour at school. Personality
and Individual Differences, 36, 277-293.
Petrides, K. V., & Furnham, A. (2000). Gender differences in measured and self
estimated trait emotional intelligence. Sex Roles, 42, 449-461.
Petrides, K. V., & Furnham, A. (2000). On the dimensional structure of emotional
intelligence. Personality and Individual Differences, 29, 313-320.
Petrides, K. V. & Furnham, A. (2001). Trait emotional intelligence: psychometric
investigation with reference to established trait taxonomies. European Journal of
Personality, 15, 425-448.
- 149 -
Petrides, K. V. & Furnham, A. (2006). The role of trait emotional intelligence in a
gender specific model of organisational variables. Journal of Applied Social
Psychology, 36, 552- 569.
Petrides, K. V., Furnham, A., & Mavroveli, S. (2007). Trait emotional intelligence:
Moving forward in the field of EI. In G. Matthews, M. Zeidner, & R. D. Roberts
(Eds.), The science of emotional intelligence: Knowns and unknowns (pp. 151-166).
New York: Oxford University Press.
Petrides, K. V., Perez-Gonzalez, J. C. & Furnham, A. (2007). On the criterion and
incremental validity of trait emotional intelligence. Cognition and Emotion, 21 (1),
26- 55.
Petrides, K. V., Pita, R., & Kokkinaki, F. (2007). The location of trait emotional
intelligence in personality factor space. British Journal of Psychology, 98, 273- 289.
Pinard, L., Negrete, J. C., Annable, L., & Audet, N. (1996). Alexithymia in
Substance users: Persistence and correlates of variance. American Journal on
Addictions, 5, 32-39.
Porter, R. J. & Gallagher, P. (2006). Abnormalities of the HPA axis in affective
disorders: Clinical subtypes and potential treatments. Acta Neuropsychiatrica, 18,
193-209.
Pritchard, M. E., & McIntosh, D. N. (2003). What predicts adjustment among law
students? A longitudinal panel study. Journal of Social Psychology, 143 (6), 727-
745.
Pruchno, R. A., & Resch, N. L. (1989). Mental health of caregiving spouses: Coping
as mediator, moderator, or main effect? Psychology and Aging, 4 (4), 454-463.
Pruessner, J. C., Hellhammer, D. H., & Kirschbaum, C. (1999). Burnout, perceived
stress and cortisol responses to awakening. Psychosomatic Medicine, 61, 197-204.

- 150 -
Radloff, L.S. (1977). The CES-D scale: A self report depression scale for research in
the general population. Applied Psychological Measurement 1: 385-401.
Rajendran, D., Downey, L., & Stough, C. (2007). Assessing Emotional Intelligence in
the Indian workplace: a preliminary reliability study. E-Journal of Applied
Psychology [Online] 3 (2) 55-59. Available:
http://ojs.lib.swin.edu.au/index.php/ejap/article/view/85
Rand, K., Hoon, E., Massey, J, & Johnson, J. (1990). Daily stress and the recurrence
of the genital herpes simplex. Archives of Internal Medicine, 150, 1889-1893.
Raven, J., Raven, J.C. and Court, J.H. (1998). Manual for Raven's Progressive
Matrices and Vocabulary Scales, Oxford Psychologists Press, London.
Riley, H. & Schutte, N. S. (2003). Low emotional intelligence as a predictor of
substance-use problems. Journal of Drug Education, 33 (4), 391- 398.
Rivers, S. E., Bracket, M. A., Salovey, P., & Mayer, J. D. (2007). Measuring
emotional intelligence as a set of mental abilities. In G. Matthews, M. Zeidner & R.
D. Roberts (Eds.) The science of emotional intelligence: Knowns and unknowns.
Oxford: Oxford University Press.
Roberts, R. D., Zeidner, M., & Matthews, G. (2001). Does emotional intelligence
meet traditional standards for an intelligence? Some new data and conclusions.
Emotion, 1(3), 196-231.
Roberts, D. R., Zeidner, M., & Matthews, G. (2007). Emotional Intelligence: Knowns
and Unknowns. In G. Matthews, M. Zeidner & R. D. Roberts (Eds.) The science of
emotional intelligence: Knowns and unknowns. Oxford: Oxford University Press.

- 151 -
Roesch, S. C., Wee, C., & Vaughn, A. A. (2006). Relations between the big five
personality traits and dispositional coping in Korean Americans: Acculturation as a
moderating factor. International Journal of Psychology, 41, 2, 85-96.
Roger, D. & Najarian, B. (1998). The relationship between emotional rumination and
cortisol secretion under stress. Personality and Individual Differences, 24, 531-538.
Rosal, M. C., King, J., & Reed, G. W. (2004). Stress, social support and cortisol:
Inverse Associations? Behavioral Medicine, 30 (1), 11-21.
Rossen, E., & Kranzler, J. H. (2009). Incremental validity of the Mayer–Salovey–
Caruso emotional intelligence test version 2.0 (MSCEIT) after controlling for
personality and intelligence. Journal of Research in Personality, 43, 1, 60-65.
Roy, M. P. (1994). Psychobiological reactivity and responses to stress: A laboratory
and field study in firefighters. Thesis. St. George's Hospital Medical School,
University of London.
Roy, M. P., Steptoe, A., & Kirschbaum (1998). Life events and social support as
moderators of individual differences in cardiovascular and cortisol reactivity. Journal
of Personality and Social Psychology, 75 (5) 1273- 1281.
Salovey, P., & Mayer, J. D. (1990). Emotional Intelligence. Imagination, Cognition
and Personality, 9, 185- 211.
Salovey, P., Stroud, L. R., Woolery, A. & Epel, E. S. (2002). Perceived Emotional
Intelligence, stress reactivity, and symptom reports: Further explorations using the
trait meta-mood scale. Psychology and Health, 17, 5, 611-627.
Schiffer, A. A., Denollet, J., Pederson, S. S., Broers, H., & Widdershoven, J. W.
(2008). Health status in patients treated with cardiac resynchronization therapy:
Modulating effects of personality. Clinical Electrophysiology, 31 (1), 28-37.

- 152 -
Schommer, N. C., Hellhammer,D. H., Kirschbaum, C. (2003). Dissociation between
reactivity of the Hypothalamus-Pituitary-Adrenal axis and the Sympathetic-
Adrenal_medullary system to repeated psychosocial stress. Psychosomatic Medicine,
65, 450-460.
Schommer, N.C.; Kudielka, B.M., Hellhammer, D. H., & Kirchbaum, C. (1999). No
Evidence for a close relationship between personality traits and circadian rhythm or a
single cortisol stress response. Psychology Reports, 84, 840-842.
Schroevers, M., Kraaij, V. & Garenefski, N. (2007), Goal disturbance, cognitive
coping strategies and psychological adjustment to different types of stressful life
event. Personality and Individual Differences, 43 (2), 413- 423.
Schulte, M. J., Ree, M. J., & Carretta, T.R. (2004). Emotional intelligence: Not much
more than g and personality. Personality and Individual Differences, 37, 5, 1059-
1068.
Schutte, N., Malouff, J., Hall, L, Haggerty, D., Cooper, J., Golden, C., & Dornheim,
L. (1998). Development and validation of a measure of emotional intelligence.
Personality and Individual Differences, 25,167-177.
Selye, H. (1956). The Stress of Life. New York: McGraw-Hill
Selye, H. (1974). Stress without distress. Philadelphia: J. B. Lippincott.
Sephton, S., Sapolsky, R., Kraemer, H., & Spiegal, D. (2000). Diurnal cortisol
rhythm as a predictor of breast cancer survival. Journal of the National Cancer
Institute, 92 (12), 994-1000
Shaffer, J. P. (1995). Multiple hypothesis testing. Annual Review of Psychology, 46,
561- 584.

- 153 -
Shen, B-J., McCreary, C. P., & Myers, H. F. (2004). Independent and mediated
contributions of personality, coping, social support, and depressive symptoms to
physical functioning outcome among patients in cardiac rehabilitation. Journal of
Behavioral Medicine, 27 (1), 39- 62.
Slaski, M. & Cartwright, S. (2002). Health, performance and emotional intelligence:
an exploratory study of retail managers. Stress & Health. 18, 63-68.
Smith, T. W. (1992). Hostility and health: Current status of a psychosomatic
hypothesis. Health Psychology, 11, 139-150.
Smyth, J. M. (1998). Written emotional expression: Effect sizes, outcomes and
moderating variables. Journal of Consulting and clinical psychology, 66, 174-184.
Smyth, J. M., Hockemeyer, J. R. & Tulloch, H. (2008). Expressive Writing and post
traumatic stress disorder: Effects on trauma symptoms, mood states, and cortisol
reactivity. British Journal of Health Psychology, 13, 85-93.
Stanton, A.L., Danoff-Burg, S., Cameron (2000) Emotionally Expressive coping
predicts psychological and physical adjustment to breast cancer. Journal of
Consulting and Clinical Psychology, 68, 875-882.
Stein, J. A. & Rotheram-Borus, M. J. (2004). Cross-sectional and longitudinal
associations in coping strategies and health outcomes among HIV-Positive youth.
Psychology & Health, 19, 3, 321- 336.
Stough, C., & Palmer, B. R. (2002, July). The development of a workplace
measure of emotional intelligence: The Swinburne University Emotional
Intelligence Test (SUEIT). Paper presented at the third international conference
on Emotions and Organizational Life, Gold Coast, Queensland, Australia.
Syme, S. L. (1986). Social networks in relation to morbidity and mortality, in: S. O.
ISACSSON & L. JANZON (Eds) Social Support, Health and Disease. Sixth

- 154 -
International Berzelius Symposium sponsored by the Delegation for Social Research
(Stockholm, Almqvist & Wiksell International).
Tabachnick, B. G., & Fidell, L. S. (2001). Using multivariate statistics (4th Edition).
Boston: Allyn & Bacon.
Taylor, G. J., & Babgy, R. M. (2000). An overview of the Alexithymia Construct. In
R. Bar-On & J. D. A. Parker (Eds.), The Handbook of Emotional Intelligence. pp 40-
67. San Francisco: Jossey-Bass.
Taylor, G. J., Bagby, R. M., & Parker, J. D. A. (1997). Disorders of affective
regulation: Alexithymia in medical and psychiatric illness. Cambridge: Cambridge
University Press.
Taylor, Parker & Bagby, (1990). A preliminary investigation of alexithymia in men
with psychoactive dependence. American Journal of Psychiatry, 147, 1228-1230.
Tett, R. P., Fox, K. E., & Wang, A. (2005). Development and validation of a self-
report measure of emotional intelligence as a multidimensional trait domain.
Personality and Social Psychology Bulletin, 31, 1-30.
Tett, R., Wang, A., Thomas, M., Griebler, J. & Linkovich, T. (1994). Testing a model
of Emotional Intelligence. Paper presented at the 1994 Annual Convention of the
Southeastern Psychological Association, Atlanta, GA.
Thompson, R. A. (1994). Emotion Regulation: A theme is search of definition. In N.
A. Fox (Ed.), The development of emotion regulation: Biological and behavioural
consideration. Monograph of the Society for Research in Child Development, 59, 25-
52.
Trinidad, D. R., & Johnson, C. A. (2002). The association between emotional
intelligence and early adolescent tobacco and alcohol use. Personality and Individual
Differences, 32, 95-105

- 155 -
Trinidad, D. R., Unger, J. B., Chih-Ping, C., Azen, S. P. & Johnson, A. (2004).
Emotional intelligence and smoking risk factors in adolescents: Interactions on
smoking intensions. Journal of Adolescent Health. 34,1, 46-55.
Trinidad, D. R., Unger, J. B., Chih-Ping, C., & Johnson, A (2005). Emotional
intelligence and acculturation to the United States: Interactions on the perceived
social consequences of smoking in early adolescents. Substance use & Misuse, 40,
11, 1697- 1706.
Turyk,M. E., Hernandez, E., Wright, R. J., Freels, S., Slezak, J., Contraras, A.,
Piorkowskie, J., & Persky, V. W. (2008). Stressful life events and asthma in
adolescents. Pediatric Allergy and Immunology, 19 (3), 255-263.
Utsey, Lanier, Williams, Bolden & Lee, (2006) Moderator effects of cognitive ability
and social support on the relation between race-related stress and quality of life in a
community sample of black Americans. Cultural and Ethnic Minority Psychology, 12
(2), 334- 346.
Van der Zee, K., Thijs, M., & Schakel, L. (2002). The relationship of emotional
intelligence with academic intelligence and the Big Five. European Journal of
Peronality,16, 88-110.
Van Rooy, D. L., Alonsa, A., & Viswesvaran, C. (2005). Group differences in
emotional intelligence scores: Theoretical and practical implications. Personality and
individual differences, 38, 689-700.
Van Rooy, D. L., & Viswesvaran, C. (2004). Emotional Intelligence: A meta-
analytic investigation of predictive validity and nomological net. Journal of
Vocational Behavior, 65 (1), 71- 95.

- 156 -
Van Rooy, D. L., Viswesvaran, C., & Pluta, P. (2005). An evaluation of construct
validity: What is this thing called emotional intelligence? Human Performance, 18
(4), 445-462.
Volkmann, E. R., & Weekes, N. Y. (2006). Basal SIgA and Cortisol levels predict
stress-related health outcomes. Stress and Health, 22, 11-23.
Volkow, N. D., Hitzemann, R., Wang, G., Fowler, J. S., Wolf, A. P., Dewey, S. L. &
Handlesman, L. (1992). Long term frontal brain metabolic changes in cocaine
abusers. Synapse. 11, 184- 190.
Walter, M., Gerhard, U., Gerlach, M., Weijers, H-G., Boening J., & Wisbeck, G. A.
(2006). Cortisol concentrations, stress-coping styles after withdrawal and long term,
abstinence in alcohol dependence. Addiction Biology, 11 (2), 157- 162.
Warwick, J., & Nettelbeck, T. (2004). Emotional intelligence is…? Personality and
Individual Differences. 37, 1091-1100.
Wurst, S., Kirschbaum, C., & Hellhammer, D. H. (1993). Smoking increases salivary
cortisol. In C. Kirschbaum, G. F. Read, & D. H. Hellhammer (Eds.), Assessment of
Hormones and Drugs in Saliva in Biobehavioral Research (pp. 51-57)
Zautra, A. J. (2003). Emotions, stress, and health. New York: Oxford University
Press.
Zeidner, M., & Kaluda, I. (2008). Romantic love: What’s emotional intelligence got
to do with it? Personality and Individual differences, 44, 1684- 1695.
Zeidner, M., Shani-Zinovich, I., Matthews, G., & Roberts, R. D. (2005). Assessing
emotional intelligence in gifted and non-gifted high school students: Outcomes
depend on the measure. Intelligence, 33, 369-391

- 157 -
Zimmerman, M. (1983). Methodological issues in the assessment of life events: A
review of issues and research. Clinical Psychology Review, 3, 33-370.

- i -
Appendix A – Justification of choice of Trait EI measure
A literature review was conducted to identify suitable trait EI measures. Searches in
popular literature and search engines such as Google reveal hundreds of measures of
emotional intelligence, however only peer reviewed scholarly sources were considered
the remit of this thesis. Data base searches in October 2005 used EBSCOHost (which
includes data bases such as Academic Search Complete, E-journals, PsycARTICLES,
and PsycINFO), and this revealed 7 predominant measures of trait Emotional
intelligence: 1. The Emotional Intelligence Scale (SEIS; Schutte et al., 1998); 2. The
Multidimensional Emotional Intelligence Assessment (MEIA; Tett, Fox, & Wang,
2005); 3. The Trait Emotional Intelligence Questionnaire (TEIQue; Petrides &
Furnham, 2003); 4. The Emotional Quotient Inventory (EQ-I; Bar-On, 1997); 5. The
Trait Meta Mood Scale (TMMS; Salovey, Mayer, Goldman, Turvey & Palfai, 1995); 6.
The twenty item Toronto Alexithymia Scale-II (TAS-20; Bagby, Taylor & Parker,
1994); 7. Swinburne University Emotional Intelligence Test (SUEIT; Palmer & Stough,
2001).
For a measure of emotional intelligence to demonstrate quality it should; (i) provide
adequate coverage of the EI domain; (ii) exhibit good reliability, (iii) be able to
demonstrate utility by predicting important practical outcomes; and (iv) have similarity
to other EI measures while being distinct from unrelated constructs (Mayer, 2001). In
order to select the best available measure these criteria were applied to the 7 identified
measures:
(i) Measures should assess the whole EI domain as defined by the ability model (Mayer
& Salovey, 1997), not the trait model defined by Petrides (2001) to include personality.
Petrides’ trait model claims to encompass variance of two kinds: one portion drawn
from higher order dimensions of established personality taxonomies (e.g., Big Five,
Giant Three) and one portion of variance that lies outside these dimensions. Many
researchers have described EI as being inclusive of trait and dispositions such as
happiness, self-esteem, optimism, and self-management, rather than as ability based
(Bar-On, 2004; Boyatzis & Sala, 2004; Tett, Fox, & Wang, 2005; Petrides & Furnham,
2001;). For example self esteem (included in the TEIQue; Petrides, 2001; Petrides &
Furnham, 2003) does not directly measure emotion or intelligence or their intersection

- ii -
(Matthews et al., 2004, p. 185, cited Mayer Salovey & Caruso, 2008). Further it seems
illogical to decide to include optimism in a measure (i.e. the TEIQue, 2001) and then
control for personality when using it (E.g. Petrides, Perez-Gonzalez, & Furnham, 2007;
Mikolajczak, Luminet, Leroy & Roy, 2007). Additionally measures of EI containing
correlates of EI such as stress management and coping (e.g. Bar-On, 1997) are
problematic for this research programme, subsequent results may include ‘false
positives’ by finding significant relationships between EI and other study variables that
are an artefact of methods or assessment, rather than indicative of a real underlying
relationship. Therefore this research aims to identify a self report (and therefore Trait
not ability EI) Emotional Intelligence questionnaire which does not assess constructs
wider than the ability model.
(ii). Measures should fully assess the whole EI domain; tests which only provide
coverage of a portion of the full domain will be excluded. (iii). Measures should have
been used in research published in peer review journals and provide evidence of
predictive power; (iv). Psychometric data should demonstrate that measures have good
reliability.
Applying the first criterion, adequate coverage of the EI domain, reveals three measures
to be too narrow in content (SEIS, TAS-20, and TMMS). The SEIS, although designed
to cover the 1997 ability model (Mayer & Salovey), fails to do so as it has poor factor
structure and does not support each of the four EI branches. The scale was originally
designed and presented as a unifactorial measure; however confirmatory factor analysis
does not support a single factor solution and several studies have suggested a four factor
solutions instead (Saklofske et al., 2003; Petrides & Furnham, 2000). These four factor
solutions have varied sufficiently to support criticism of the stability of the measures
stability. Moreover, when the most commonly used four factor solution is applied
(Petrides & Furnham, 2000) the factors produced (Optimism/Mood Regulation,
Appraisal of Emotions, Social Skills and Utilisation of Emotion) do not map well onto
the ability model, producing content which is wider than the EI domain (social skills),
and failing to assess other core areas (e.g. emotional facilitation of thinking).
Additionally the 4th factor Utilisation of Emotion solution is not always reliable enough
for use requiring that it is omitted from analyses (e.g. Ciarrichi & Dean, 2002).
Researches who have added items to the SEIS with the aim of increasing reliability of

- iii -
this 4th factor have still identified only three factors (Austin, Saklofske, Huang &
McKenny, 2004), thus again failing to capture the whole EI domain.
Also failing to cover the full EI domain were the TAS-20 and the TMMS. The TAS-20
is an alexithymia measuring three subscales (difficulty in identifying feelings, difficulty
describing feelings, and externally oriented thinking). Never intended to be used as an
EI measure the TAS-20 misses core aspects of EI (‘emotion regulation’ and ‘emotional
facilitation of thinking’). Finally, the TMMS has three subscales (attention to emotion,
emotional clarity, and emotional repair), it fails to capture the full EI domain missing
‘emotional facilitation of thinking’.
The second criterion used for selection of EI measure explored the extent to which
measures were over inclusive, by capturing constructs which fall outside the EI domain.
If an EI measure assesses aspects of other well established non EI-constructs (such as
self esteem or happiness) then results of that test do not inform the research community
about the properties of EI. Moreover, measures of trait EI have been found to overlap
significantly with personality, and have therefore been called upon to demonstrate
incremental validity by controlling for the big five. Therefore it is illogical for EI tests
to purposefully assess correlates of EI such as personality, only for test users to have to
control for them. Of the 7 identified measures of EI, three were over inclusive in
content (SEIS; EQ-i, and the TEIQue). As discussed above, the most popular factorial
solution of the SEIS (Petrides & Furnham, 2000) includes a subscale for ‘social skills’.
The EQ-i includes five subscales which relate to non-EI constructs (optimism, self-
actualisation, happiness, independence, and social responsibility). Meanwhile, the non-
EI content of the TEIQue is primarily the compound scale of Well-Being which is made
up of three subscales Happiness, Optimism and Self-esteem.
The third criterion used in selection of the EI measure was that the test should have been
used in research published in peer review journals. At the time of measure selection all
but one of the measures had been used in published research. The MEIA

- iv -
Table A1 Summary of Trait EI measures: coverage of EI domain, focus of content and availability of psychometric data
Measure
Measure sufficiently
broad to capture the
full EI domain.
Measure sufficiently focused
as not to include correlates or
constructs out with the EI
domain.
Measure used in published peer reviewed
research, therefore data on reliability and
validity available.
EQ-i
Bar-on (1997)
MEIA
Tett, Fox & Wang, (2005)
SREI
Schutte et al., (1998)
SUEIT
Palmer & Stough, (2001)
TAS-20
Bagby, Taylor & Parker, (1994)
TEIQue
Petrides & Furnham, (2003)
TMMS
Salovey, Mayer, Goldman, Turvey & Palfai
(1995)

- v -
was published in July 2005 and other than the data provided by the scale authors, the
scales had not used elsewhere. This meant that there was no evidence of the predictive
power of the measure, and further that there was no data for use in comparison of either
results or reliability.
The application of the above three criteria are summarised in Table A1. The criteria
result in the selection of the SUEIT for use in the current program of research. Of the
seven potential EI measures which could have been selected only the SUEIT met the
first three criteria. The SUEIT was developed in response to the existing measures
being either over inclusive or too narrow in focus. Aiming to measure the most
definitive elements of Emotional Intelligence, Palmer and Stough (2001) conducted a
large factor analytic study of the six predominant EI measures at the time. [1. MSCEIT;
2. EQ-I; 3. TMMS; 4. TAS-20; 5. Schutte SEIS; and 6. The Tett inventory (Tett, Wang,
Thomas, Griebler, Linkovich, 1994)]. To identify the number and nature of
components common to all of the inventories principle components analyses were
applied to each measure in turn. The main factors assessed by each inventory were in
this way identified and calculated then component scores of these main factors were
used in an exploratory component analysis. The procedure revealed five factors which
were labelled: 1. Emotional recognition and expression (in oneself) (ERE), the ability to
identify one’s own feelings and emotional states, and the ability to express those inner
feeling to others; 2. Emotions direct cognition (EDC), the extent to which emotions and
emotional knowledge are incorporated in decision making and/or problem solving; 3.
Understanding of emotions external (UE), the ability to identify and understand the
emotions of others; 4. Emotional management (EM), the ability to manage positive and
negative emotions within both oneself and others; and 5. Emotional control (EC), how
effectively emotional states experienced, such as anger, stress, anxiety and frustration
are controlled. The five factors are assessed using 64 items where respondents select a
response from a 1 to 5, indicating whether they never, seldom, sometimes, usually, or
always think, feel, or act as specified in a given situation. The scale contains a mixture
of positive and negatively worded items.
The SUEIT demonstrates good content validity as the measure’s five factors represent
good coverage of the EI domain mapping well on to the (1997) Mayer and Salovey
model (see table A2). They also demonstrate good focus on the EI domain, and items
do not refer to constructs other than EI. The SUEIT has demonstrated utility by
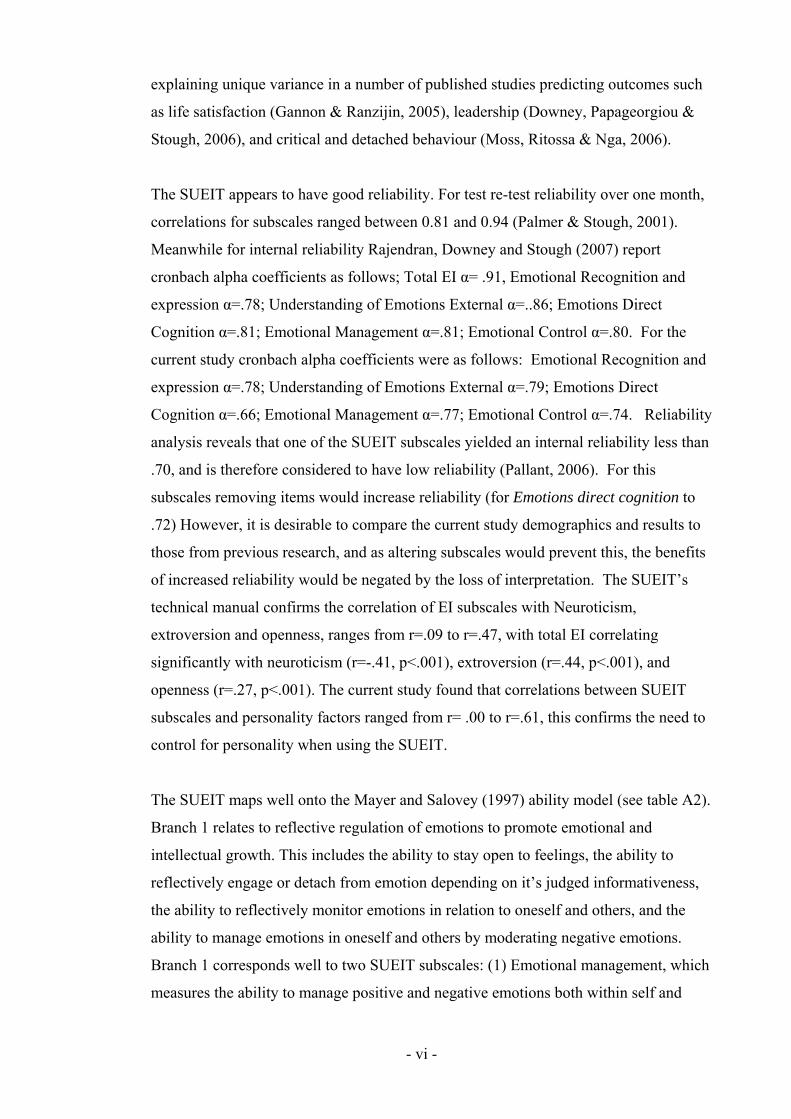
- vi -
explaining unique variance in a number of published studies predicting outcomes such
as life satisfaction (Gannon & Ranzijin, 2005), leadership (Downey, Papageorgiou &
Stough, 2006), and critical and detached behaviour (Moss, Ritossa & Nga, 2006).
The SUEIT appears to have good reliability. For test re-test reliability over one month,
correlations for subscales ranged between 0.81 and 0.94 (Palmer & Stough, 2001).
Meanwhile for internal reliability Rajendran, Downey and Stough (2007) report
cronbach alpha coefficients as follows; Total EI α= .91, Emotional Recognition and
expression α=.78; Understanding of Emotions External α=..86; Emotions Direct
Cognition α=.81; Emotional Management α=.81; Emotional Control α=.80. For the
current study cronbach alpha coefficients were as follows: Emotional Recognition and
expression α=.78; Understanding of Emotions External α=.79; Emotions Direct
Cognition α=.66; Emotional Management α=.77; Emotional Control α=.74. Reliability
analysis reveals that one of the SUEIT subscales yielded an internal reliability less than
.70, and is therefore considered to have low reliability (Pallant, 2006). For this
subscales removing items would increase reliability (for Emotions direct cognition to
.72) However, it is desirable to compare the current study demographics and results to
those from previous research, and as altering subscales would prevent this, the benefits
of increased reliability would be negated by the loss of interpretation. The SUEIT’s
technical manual confirms the correlation of EI subscales with Neuroticism,
extroversion and openness, ranges from r=.09 to r=.47, with total EI correlating
significantly with neuroticism (r=-.41, p<.001), extroversion (r=.44, p<.001), and
openness (r=.27, p<.001). The current study found that correlations between SUEIT
subscales and personality factors ranged from r= .00 to r=.61, this confirms the need to
control for personality when using the SUEIT.
The SUEIT maps well onto the Mayer and Salovey (1997) ability model (see table A2).
Branch 1 relates to reflective regulation of emotions to promote emotional and
intellectual growth. This includes the ability to stay open to feelings, the ability to
reflectively engage or detach from emotion depending on it’s judged informativeness,
the ability to reflectively monitor emotions in relation to oneself and others, and the
ability to manage emotions in oneself and others by moderating negative emotions.
Branch 1 corresponds well to two SUEIT subscales: (1) Emotional management, which
measures the ability to manage positive and negative emotions both within self and

- vii -
others and (2), Emotional Control, which relates to the ability to effectively control
strong emotions states such as anger, stress, anxiety and frustration.
Branch 2 relates to Understanding and analysing emotions, and employing emotional
knowledge. This includes the ability to label emotions and recognise relations among
the words and the emotions themselves, the ability to interpret the meanings that
emotions convey, the ability to understand complex feelings including simultaneous
feelings such as love and hate, and the ability to recognise likely transitions among
emotions such as the transitions among emotions, such as anger to shame. Branch 2
maps well onto the SUEIT subscale Understanding Emotions of Others, which
measures the ability to identify and understand the emotions of others, being conscious
of and paying attention to the emotions of others.
Branch 3 of the ability EI model relates to emotional facilitation of thinking. This
includes allowing emotions to prioritise thinking by drawing attention to important
information, using vivid emotions to be generated to aid judgement, allowing emotional
mood swings to change perspective and thus generating multiple points of view, and
allowing emotional states to encourage different problem approaches. Branch 3 is
reflected well in the content of the SUEIT subscales Emotions Direct Cognition, which
measures the extent to which emotions and emotional knowledge are incorporated in
decision making and problem solving.
Finally, branch 4 of the ability model relates to perception appraisal and expression of
emotion. This relates to the ability to identify emotion in ones physical states feelings
and thoughts, the ability to identify emotions in other people and art through language
sound appearance and behaviour, the ability to express emotions accurately and to
express related needs, and the ability to discriminate between honest and dishonest
expressions of feeling. Branch 4 maps well onto the SUEIT subscale Emotional
Recognition and Expression, which measures the ability to identify and express one’s
own feelings and emotional states.
In summary general evaluation of the SUEIT is favourable in comparison to the other
potential measures this research could have used. The measure is relatively short and is
free to use, therefore it is likely to be used by researchers more frequently as the body of
evidence demonstrating its psychometric properties and predictive power expands.

- viii -
As indicated in chapter one, the aims of this research were particularly to focus on
understanding the impact of Regulation of Emotion (branch 1) and Emotional
expression (branch 4). Therefore SUEIT subscales Emotional Control, and Emotional
Recognition and Expression were selected for use in analyses
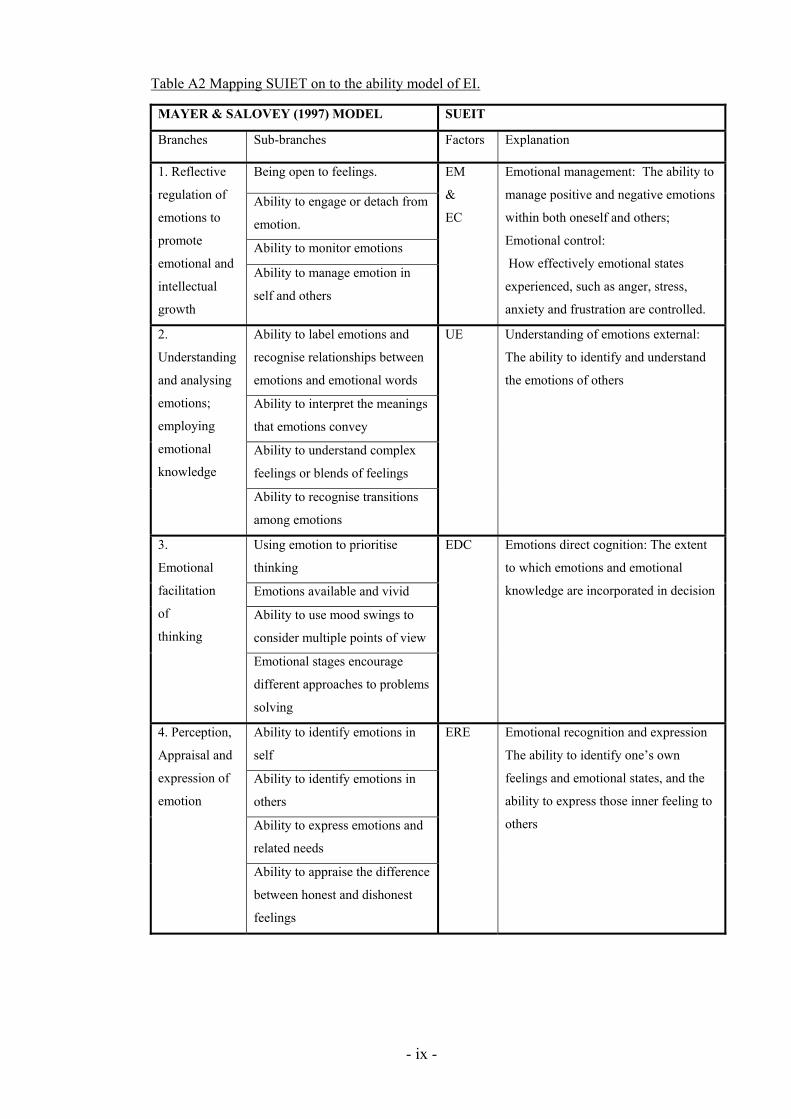
- ix -
Table A2 Mapping SUIET on to the ability model of EI.
MAYER & SALOVEY (1997) MODEL SUEIT
Branches Sub-branches Factors Explanation
Being open to feelings.
Ability to engage or detach from
emotion.
Ability to monitor emotions
1. Reflective
regulation of
emotions to
promote
emotional and
intellectual
growth
Ability to manage emotion in
self and others
EM
&
EC
Emotional management: The ability to
manage positive and negative emotions
within both oneself and others;
Emotional control:
How effectively emotional states
experienced, such as anger, stress,
anxiety and frustration are controlled.
Ability to label emotions and
recognise relationships between
emotions and emotional words
Ability to interpret the meanings
that emotions convey
Ability to understand complex
feelings or blends of feelings
2.
Understanding
and analysing
emotions;
employing
emotional
knowledge
Ability to recognise transitions
among emotions
UE
Understanding of emotions external:
The ability to identify and understand
the emotions of others
Using emotion to prioritise
thinking
Emotions available and vivid
Ability to use mood swings to
consider multiple points of view
3.
Emotional
facilitation
of
thinking
Emotional stages encourage
different approaches to problems
solving
EDC
Emotions direct cognition: The extent
to which emotions and emotional
knowledge are incorporated in decision
Ability to identify emotions in
self
Ability to identify emotions in
others
Ability to express emotions and
related needs
4. Perception,
Appraisal and
expression of
emotion
Ability to appraise the difference
between honest and dishonest
feelings
ERE Emotional recognition and expression
The ability to identify one’s own
feelings and emotional states, and the
ability to express those inner feeling to
others

- x -
Appendix B – Convergent Validity of the SUEIT
As part of data collection for study one a small group of participants were recruited
asked to complete the Swinburne University Emotional Intelligence Test (SUEIT), the
Trait Emotional Intelligence Questionnaire – Short Form (TEIQue-SF; Petrides &
Furnham, 2006); and the Schutte Self Report Inventory (SSRI; Schutte et al, 1998) to
provide data on convergent validity.
EI Measures
Swinburne University Emotional Intelligence Test (SUEIT; Palmer & Stough, 2001)
The SUIET demonstrates good content validity as the measure’s five factors represent
good coverage of the EI domain mapping well on to the (1997) Mayer and Salovey
model. They also demonstrate good focus on the EI domain, and items do not refer to
constructs other than EI. The SUEIT has demonstrated utility by explaining unique
variance in a number of published studies predicting outcomes such as life satisfaction
(Gannon & Ranzijin, 2005), leadership (Downey, Papageorgiou & Stough, 2006), and
critical and detached behaviour (Moss, Ritossa & Nga, 2006). The SUEIT has also
been shown to have good internal reliability (Rajendran, Downey & Stough, 2007) and
test re-test reliability (Palmer & Stough, 2001). For the current study cronbach alpha
coefficients were as follows: Emotional Recognition and expression (α=.80);
Understanding of Emotions External (α=.85); Emotions Direct Cognition (α=.69);
Emotional Management (α=.70); Emotional Control (α=.71). For EDC removing item
12 would have increased reliability to α=.72. However it was decided that this was not
desirable as it would prevent direct comparison of results with other published data.
The Trait Emotional Intelligence Questionnaire – Short Form (TEIQue-SF; Petrides &
Furnham, 2006).
The TEIQue-SF consists of 30 items responded to on a 7 point scale. The questionnaire
is designed to measure global trait emotional intelligence (trait EI) and is based on the
full form of the TEIQue (Petrides & Furnham, 2003), which covers the trait EI sampling
domain as defined by Petrides (2001) to include a wide range of traits and emotion
related constructs has as optimism, happiness and self-esteem,. The TEIQue-SF
provides a reliable global trait EI score that correlates with a wide range of criteria,

- xi -
including coping styles, life satisfaction, personality disorders, perceived job control,
and job satisfaction (Petrides et al., 2003). Reliability for the current study was (α=.88).
The Schutte Self Report Inventory (SSRI; Schutte et al, 1998)
The Schutte Self Report Inventory (Schutte et al., 1998) is 33-item measure of self-rated
global emotional intelligence which uses a 5 point response scale. The scale was
originally designed and presented as a unifactorial measure; however a four factor
solution is commonly applied (Petrides & Furnham, 2000) producing subscales
‘Optimism/Mood Regulation’, ‘Appraisal of Emotions’, ‘Social Skill’s and ‘Utilisation
of Emotion’. Sample items include “I am aware of my emotions as I experience them”
and “I know why my emotions change.” Reliabilities for the current study were
‘Optimism/Mood Regulation’ (α=.79); ‘Appraisal of Emotions’ (α=.74), ‘Social Skills’
(α=.70); ‘Utilisation of Emotion’ (α=.63); and scale Total (α=.88). For ‘Utilisation of
Emotion’ removal of any item would decrease increase reliability.
Comparative scores of SUEIT, TEIQue-SF, and SSRI
To provide data on the convergent validity of the SUEIT with other EI measures (and
therefore to enable comparison with the results of other EI studies) participants were
asked to complete the TEIQue-SF, and SSRI in addition to the SUEIT. Intercorrelations
are displayed in table B1.
Intercorrelations between SUEIT total and score totals for TEIQue-SF and Schutte SSRI
reveal highly significant positive relationships (r=.57 and r=.64); all SUEIT subscales
have significant positive correlations with Schutte Total (r=.18 to r= .50) all but one
SUEIT subscales (not ‘emotions direct cognition’) demonstrate highly significant
positive correlations with the TEIQue-SF total (r= .39 to r=.60); SUEIT subscales reveal
small to significant correlations (r=.14 to r=.55) with the three main Schutte subscales
but not with the final Schutte factor Utilisation of Emotion which had small and most
non significant correlations. In summary the SUEIT displays significant evidence of
convergence with other measures of EI.
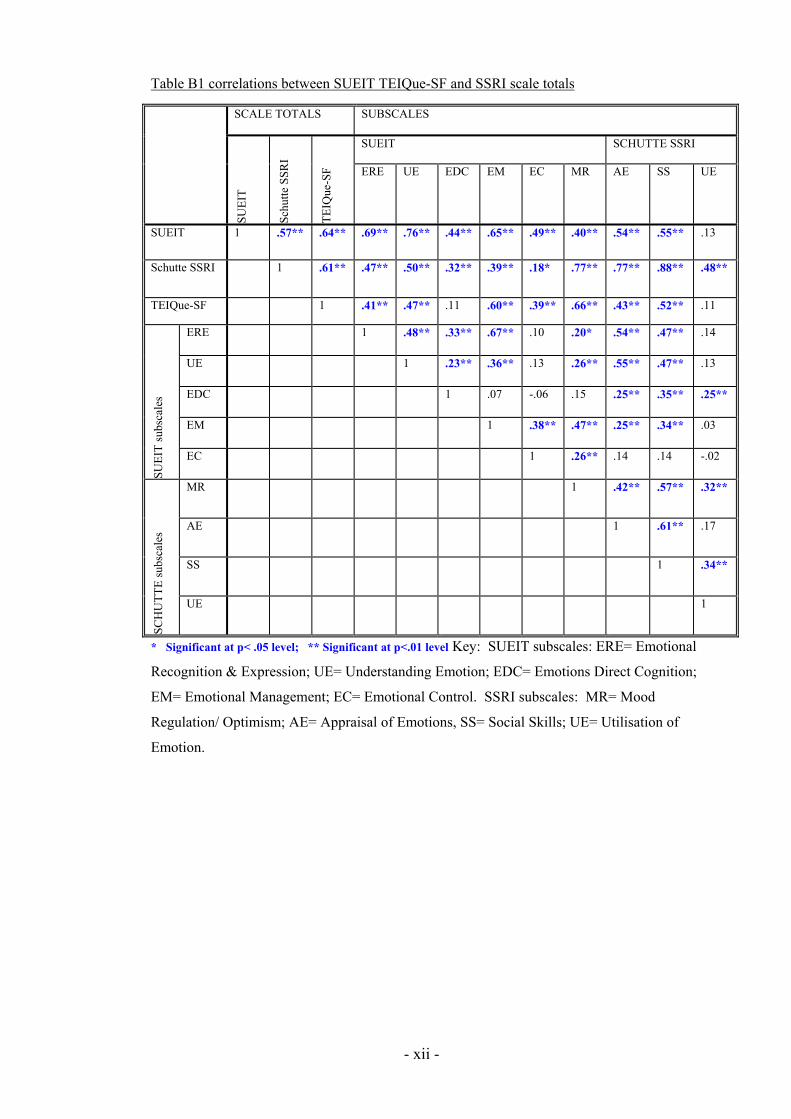
- xii -
Table B1 correlations between SUEIT TEIQue-SF and SSRI scale totals
SCALE TOTALS SUBSCALES
SUEIT SCHUTTE SSRI
SUE
IT
Sch
utte
SS
RI
TE
IQue
-SF ERE UE EDC EM EC MR AE SS UE
SUEIT 1 .57** .64** .69** .76** .44** .65** .49** .40** .54** .55** .13
Schutte SSRI 1 .61** .47** .50** .32** .39** .18* .77** .77** .88** .48**
TEIQue-SF 1 .41** .47** .11 .60** .39** .66** .43** .52** .11
ERE 1 .48** .33** .67** .10 .20* .54** .47** .14
UE 1 .23** .36** .13 .26** .55** .47** .13
EDC 1 .07 -.06 .15 .25** .35** .25**
EM 1 .38** .47** .25** .34** .03
SUE
IT s
ubsc
ales
EC 1 .26** .14 .14 -.02
MR 1 .42** .57** .32**
AE 1 .61** .17
SS 1 .34**
SCH
UT
TE
sub
scal
es
UE 1
* Significant at p< .05 level; ** Significant at p<.01 level Key: SUEIT subscales: ERE= Emotional
Recognition & Expression; UE= Understanding Emotion; EDC= Emotions Direct Cognition;
EM= Emotional Management; EC= Emotional Control. SSRI subscales: MR= Mood
Regulation/ Optimism; AE= Appraisal of Emotions, SS= Social Skills; UE= Utilisation of
Emotion.

- xiii -
Appendix C- Factor analysis of Brief Cope questionnaire
Although initial factor analysis of the Brief cope items (Carver, 1997) yielded nine
factors with Eigenvalues of more than 1.0, the original questionnaire was proposed as a
fourteen factor scale. In the current study to confirm how the 28 coping items might be
combined to create more parsimonious groups, a varimax rotation was conducted. This
is in line with suggestion by Carver, Scheier and Weintraub (1989). In agreement with
other studies which have also factor analysed the brief cope (e.g. Ng & Leung, 2006),
the current study found a three factor solution.
This procedure began with a principle components analysis, where factor loadings were
restricted to those > .3, and this found prior to rotation that eight factors with
Eigenvalues of more than 1.0 could be extracted. These explained 68.14% of the
variance. Three factors were retained on the basis of the scree plot, and a varimax
rotation revealed these three factors were constructed as below. Each of the brief cope
subscales has two items, and where there was ambiguity of distinction between
superscales a parsimonious approach was taken where a subscale had one item loaded
onto one factor and the second item on another factor the subscale was excluded. It
should be added that Carver et al. (1989) originally suggested a second order factor
analysis (in other words using the totalled subscales as the raw data), however this
produced factors which failed to make sense theoretically.
Factor analysis presented in table 7 below, confirms three groups of coping strategy
(with the original brief cope subscale names); Disengaged coping (Substance use;
Denial, Behavioural disengagement, Self blame, and Distraction); Engaged coping
(Planning, Positive reframing, Active coping, Acceptance); and Social coping
(Emotional social Support; Instrumental social support). Previous studies had found
subscales made up differently. For example Ng & Leung (2006) also found a three
factor solution.

- xiv -
Table C1 Brief Cope Factors
FACTOR LOADINGS FACTORS (BRIEF COPE ITEM
NUMBERS; AND SUBSCALE) Factor 1 Factor 2 Factor 3
1. Disengaged coping
Eigenvalue: 4.41
Variance explained: 15.73%
8 Refusing to believe it happened
4 Using alcohol/ drugs to feel better
11 Using alcohol/ drugs to get through
16 Given up coping
3 Saying “this isn’t real”
6 Given up dealing with it
13 Been criticising myself
26 Blaming myself
22 Comfort in religion or spirituality *
9 Saying things to let feelings go **
1 Using work or activity as distraction
27 Praying or meditating *
19 Distraction using TV, movies, sleep
28 Making fun of the situation ***
.704
.701
.693
.671
.668
.577
.512
.467
.449
.431
.410
.388
.373
.303
.429
.305
.423
2. Engaged coping
Eigenvalue: 4.20
Variance explained:15.01%
14 Coming up with a strategy
25 Thinking about steps to take
17 Looking for good in what happened
2 Doing something about situation
20 Accepting the reality
7 Taking action to make it better
12 Seeing it in a new positive light
24 Learning to live with it
21 Expressing negative feelings**
18 Making jokes about it***
.321
.758
.737
.677
.632
.618
.572
.571
.484
.405
.354
.369
3. Social support
Eigenvalue: 3.40
Variance explained:12.14%
5 Getting emotional support
10 Getting help and advice
15 Getting comfort and understanding
23 Getting advice about what to do
.832
.832
.805
.750
items 22 and 27 were omitted as both these religion subscales loaded onto both factors one and two,
suggesting ambiguity in meaning. ** items 9 and 21 were omitted as venting subscales loaded between
factors *** items 18 and 28 were omitted as these humour subscales loaded between factors
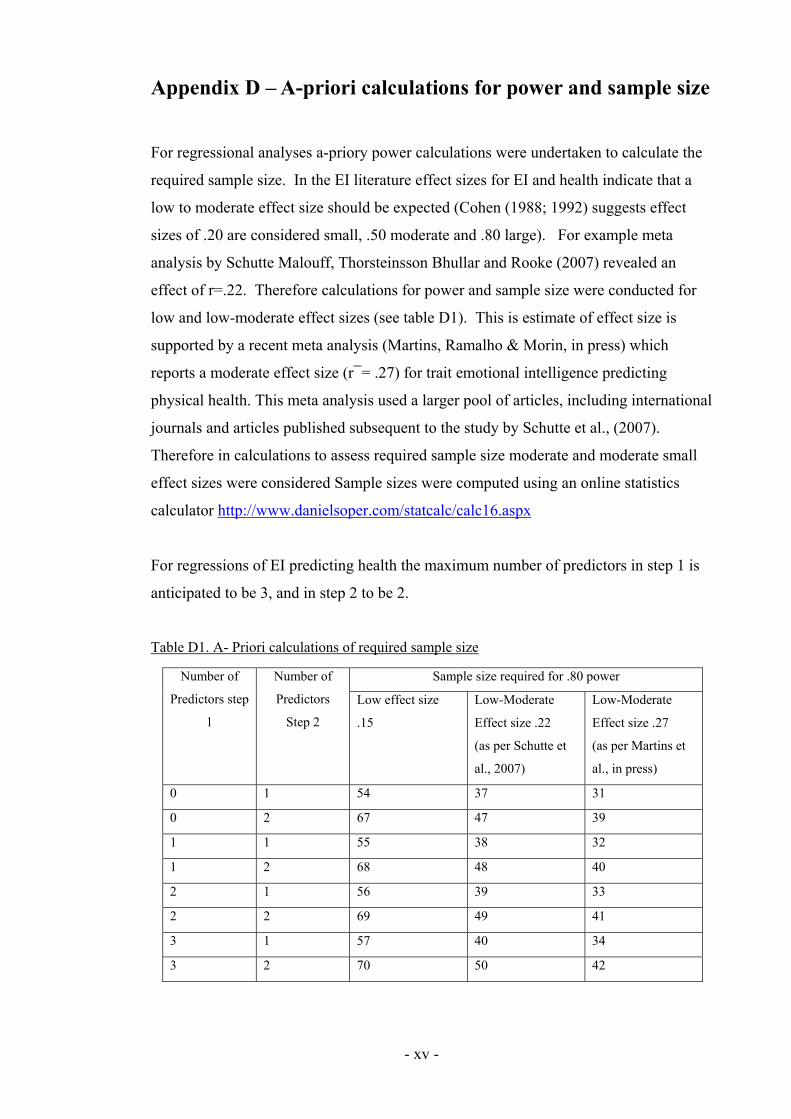
- xv -
Appendix D – A-priori calculations for power and sample size
For regressional analyses a-priory power calculations were undertaken to calculate the
required sample size. In the EI literature effect sizes for EI and health indicate that a
low to moderate effect size should be expected (Cohen (1988; 1992) suggests effect
sizes of .20 are considered small, .50 moderate and .80 large). For example meta
analysis by Schutte Malouff, Thorsteinsson Bhullar and Rooke (2007) revealed an
effect of r=.22. Therefore calculations for power and sample size were conducted for
low and low-moderate effect sizes (see table D1). This is estimate of effect size is
supported by a recent meta analysis (Martins, Ramalho & Morin, in press) which
reports a moderate effect size (r¯= .27) for trait emotional intelligence predicting
physical health. This meta analysis used a larger pool of articles, including international
journals and articles published subsequent to the study by Schutte et al., (2007).
Therefore in calculations to assess required sample size moderate and moderate small
effect sizes were considered Sample sizes were computed using an online statistics
calculator http://www.danielsoper.com/statcalc/calc16.aspx
For regressions of EI predicting health the maximum number of predictors in step 1 is
anticipated to be 3, and in step 2 to be 2.
Table D1. A- Priori calculations of required sample size
Sample size required for .80 power Number of
Predictors step
1
Number of
Predictors
Step 2
Low effect size
.15
Low-Moderate
Effect size .22
(as per Schutte et
al., 2007)
Low-Moderate
Effect size .27
(as per Martins et
al., in press)
0 1 54 37 31
0 2 67 47 39
1 1 55 38 32
1 2 68 48 40
2 1 56 39 33
2 2 69 49 41
3 1 57 40 34
3 2 70 50 42