training for improvement of business skills of agrocultural producer organizations 2013
DESCRIPTION
business skills in agrocultureTRANSCRIPT

M.A. Edin Salihbašić, BBADirector of Finance, Accounting and
ControllingService Provider “Limitless” ltd Tuzla
18/04/23
Training for Improvement of Business Skills of Agricultural Producers and Processors
BUSINESS PLAN / LOAN APPLICATION DEVELOPMENT
M.A. Edin Salihbašić, BBADirector of Finance, Accounting and ControllingService Provider “Limitless” ltd Tuzla
Content
18/04/23
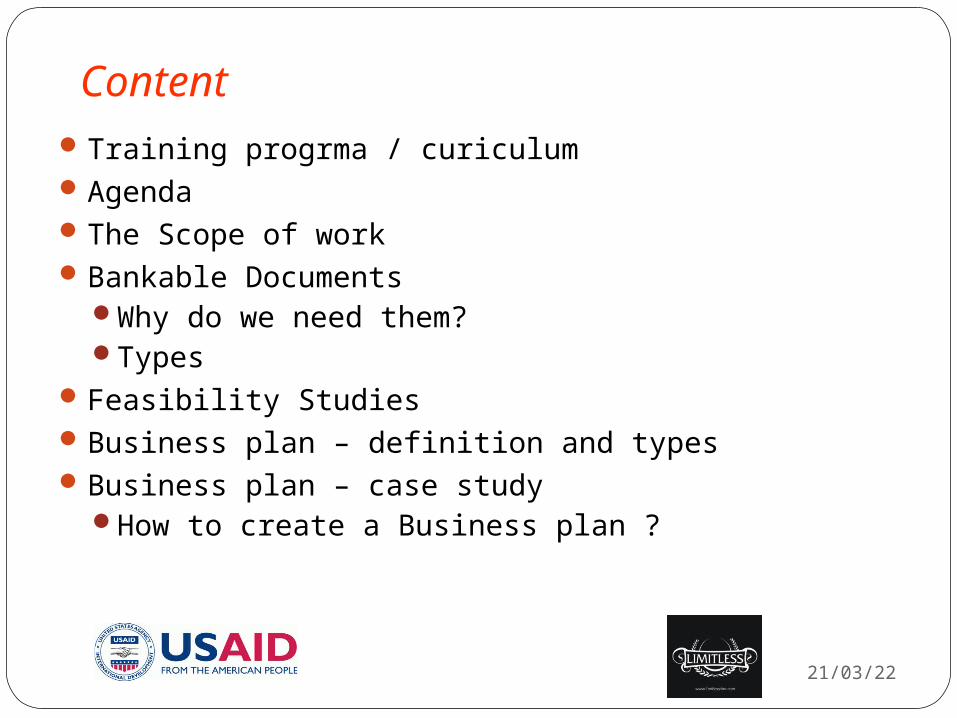
Training progrma / curiculumAgendaThe Scope of workBankable Documents
Why do we need them?Types
Feasibility StudiesBusiness plan – definition and typesBusiness plan – case study
How to create a Business plan ?
18/04/23
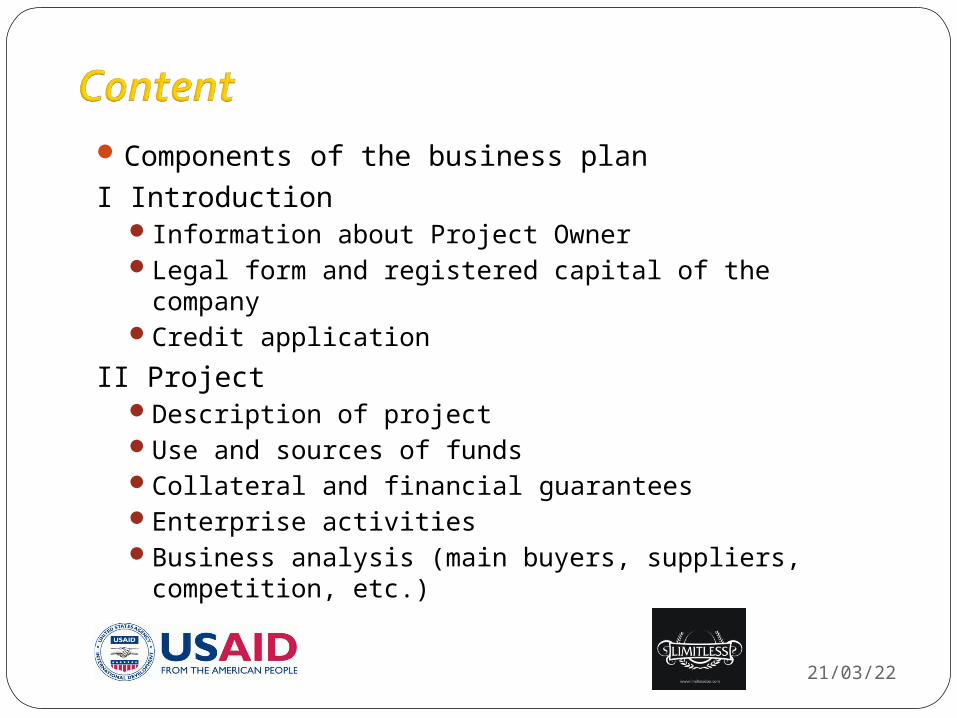
Components of the business plan
I IntroductionInformation about Project OwnerLegal form and registered capital of the companyCredit application
II ProjectDescription of projectUse and sources of fundsCollateral and financial guaranteesEnterprise activitiesBusiness analysis (main buyers, suppliers,
competition, etc.)
18/04/23
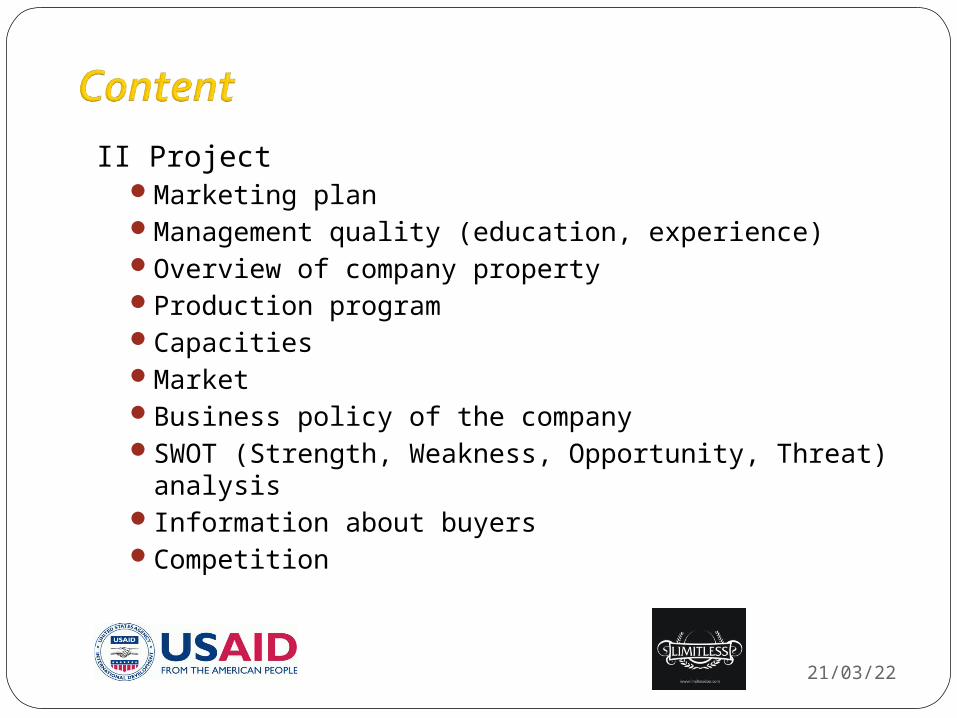
II ProjectMarketing planManagement quality (education, experience)Overview of company propertyProduction programCapacitiesMarketBusiness policy of the companySWOT (Strength, Weakness, Opportunity, Threat)
analysisInformation about buyersCompetition
18/04/23
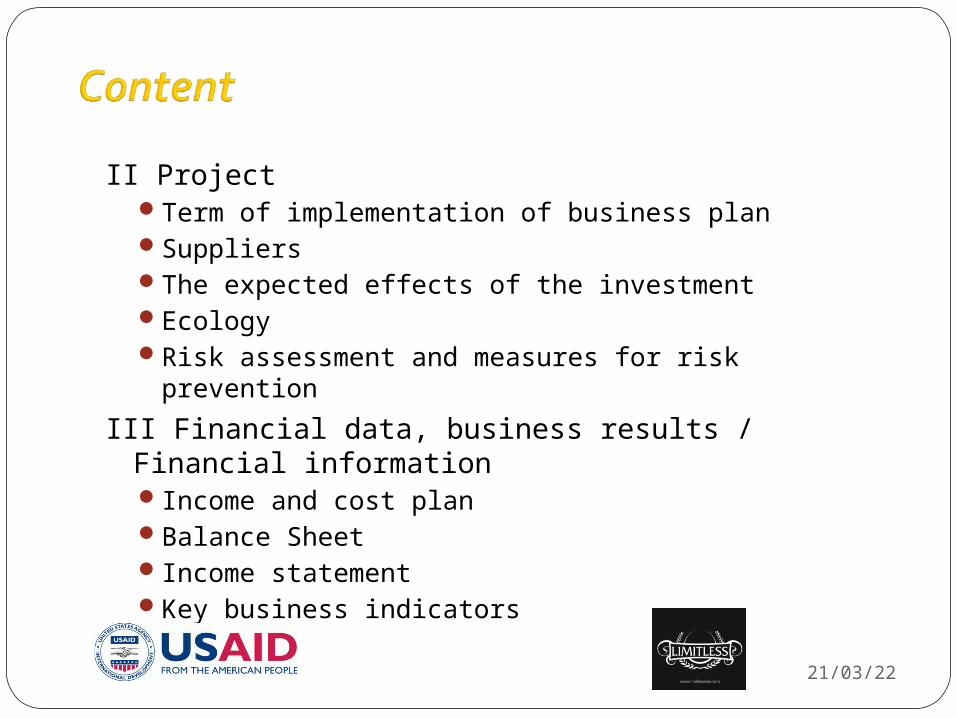
II ProjectTerm of implementation of business planSuppliersThe expected effects of the investmentEcologyRisk assessment and measures for risk prevention
III Financial data, business results / Financial informationIncome and cost planBalance SheetIncome statementKey business indicators
18/04/23
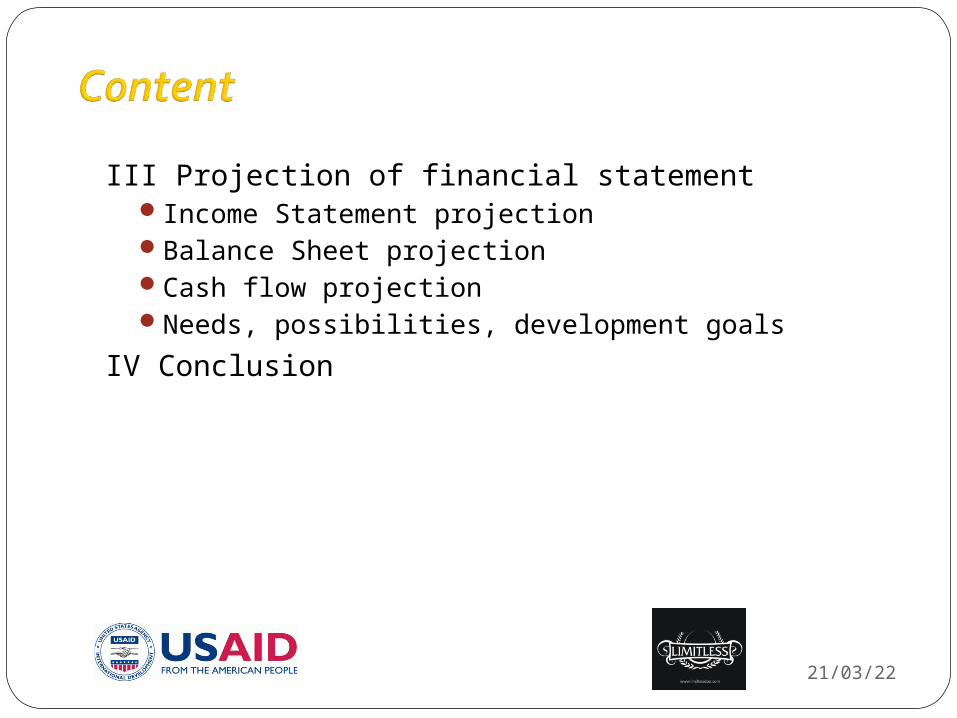
III Projection of financial statementIncome Statement projectionBalance Sheet projectionCash flow projectionNeeds, possibilities, development goals
IV Conclusion
18/04/23
Agenda
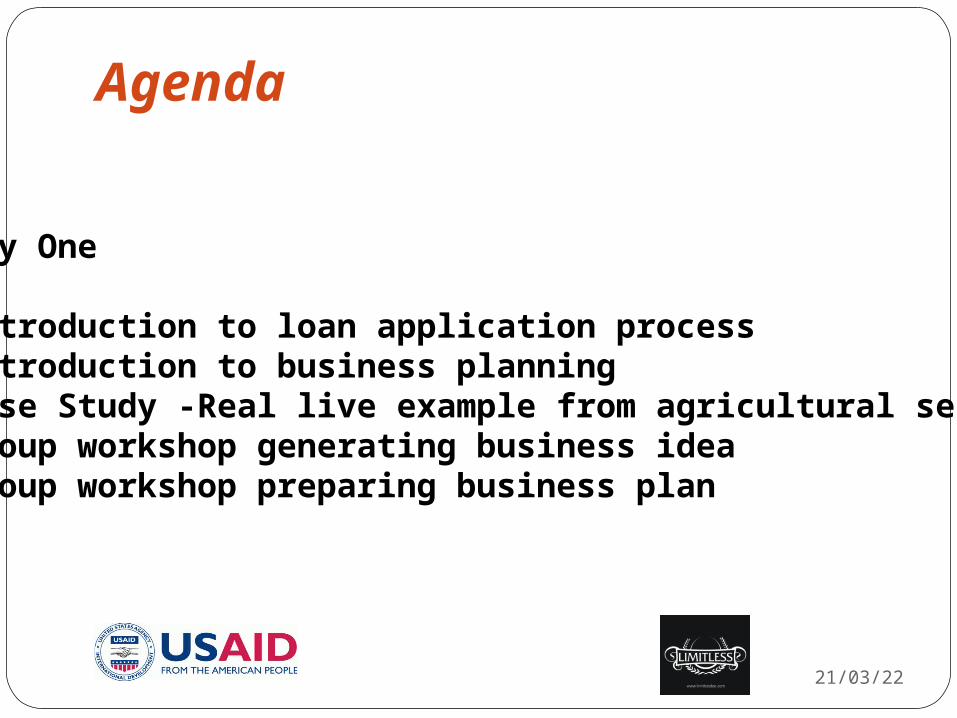
Day One
Introduction to loan application processIntroduction to business planningCase Study -Real live example from agricultural sectorGroup workshop generating business ideaGroup workshop preparing business plan
Agenda
18/04/23
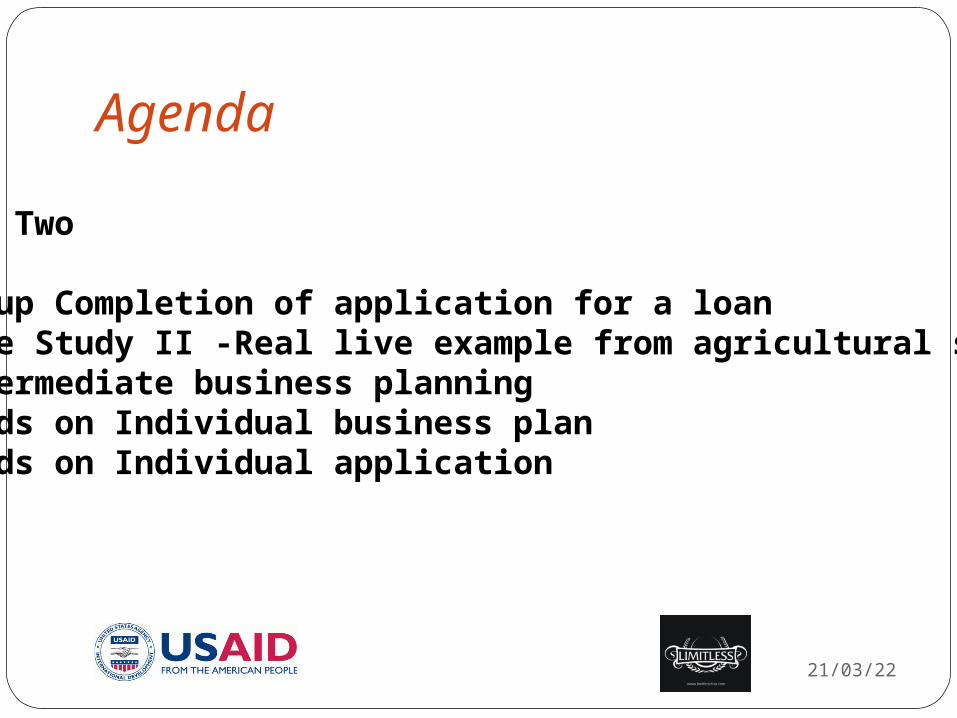
Day Two
Group Completion of application for a loanCase Study II -Real live example from agricultural sectorIntermediate business planningHands on Individual business planHands on Individual application
Agenda
18/04/23
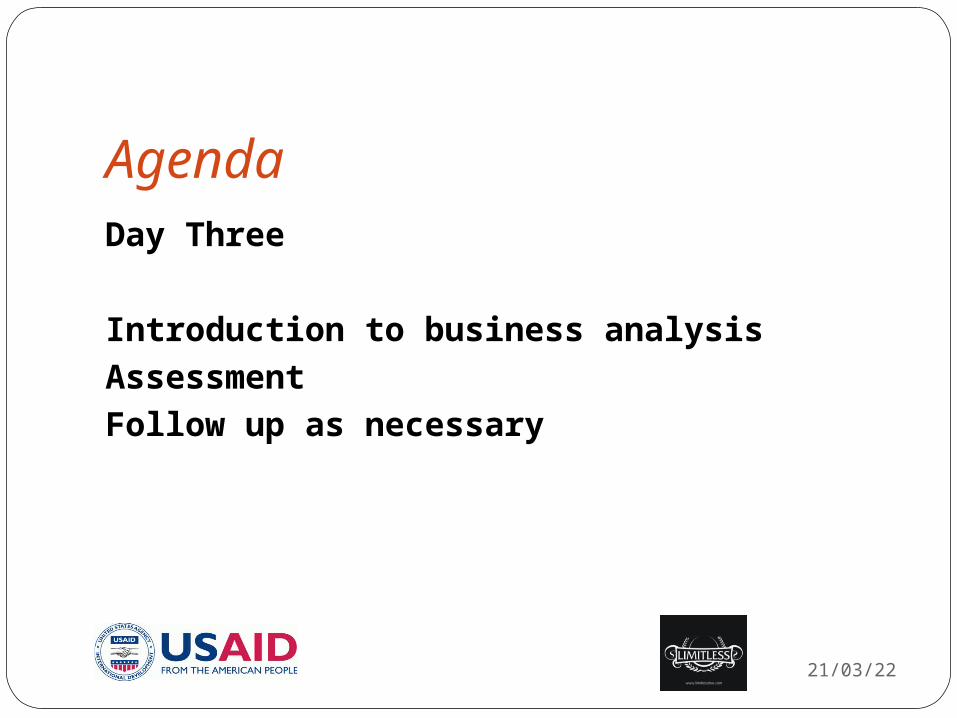
Day Three
Introduction to business analysis
Assessment
Follow up as necessary
The Scope of work
18/04/23
This document and the training program is designed for agricultural producers and processors and representatives of farmers, cooperatives and small and medium enterprises.
The purpose of this training program is to train and educate agricultural producers and processors to improve their business skills, to learn about the benefits of the proper business planning process, gain a better understanding of companies financial statement and banking requirements, development of business plan and loan applications, to improve and expand business operations.
After the training agricultural producers and processors will also be able to recognize the demands of the bank and prepare bankable documents including application form and a comprehensive business plan.
What is Bankable Document?
18/04/23
A report that describes a project from various angles in such a format that is generally required by financing entities in order to make the financing decision: To whom the products / services will be sold,
why and how How the products/services will be
acquired/produced and delivered to the market
Financial summary and returns Risks involved and mitigating measures
Why do we need a bankable document?
18/04/23
Projects owners need “external financing” to implement their projects
while,
Financiers need “bankable document” to judge if a project is worthwhile to finance, i.e., if it is “bankable”
thus:
Project owners need to prepare bankable documents to attract financing or equity investments
Bankable documents provide a common language between project owners and financiers
Types of Bankable Documents
18/04/23
Two related types
Feasibility Report Description of viability aspects of a project by an existing entity
Projects (Greenfield, expansion, ...)
Business PlanBlueprint of an action plan and evidence of viability of a new business
Starting up businesses
Feasibility Studies: What is a Feasibility Study
18/04/23
Feasibility study is an analysis of the viability of a project. Feasibility study helps answer various questions: Should we proceed with the proposed
project?How much are we expecting to earn?What are the risks and how are we going to
mitigate them?
Components of Feasibility (Report)
18/04/23
I.Description of the Project
II. Market Study
III.Technical Feasibility
IV. Organizational/Managerial Feasibility
V. Financial Feasibility
VI. Conclusions
Definition of Business Plan
18/04/23
A business plan is a document that summarizes the operational and financial objectives of a business and contains the detailed plans and budgets showing how the objectives are to be realized.
It is a formal statement of a set of business goals, the reasons why they are believed to be attainable, explaining the plan for reaching those goals.
Generally it contains background information about the organization or team attempting to reach those goals.
For – profit business plans typically focus on financing goals, such us profit or creation of wealth.
Writing a business plan is one of the most important aspects of starting a business in today's every changing environment.
Types of Business Plan
18/04/23
Business plans are sometimes referred to as strategic plans, investment plans, expansion plans, operational plans, annual plans, internal plans, growth plans, product plans, feasibility plans, and many other names.
However, in all these different varieties of business
plan, the plan matches your specific situation.
For example, if you’re developing a plan for internal use only, not for sending out to banks or investors, you may not need to include all the background details that you already know.
Description of the management team is very important for investors, while financial history is most important for banks.
Business Plan – Case Study
18/04/23
How to create a Business Plan?
To create a business plan you need to know the activities of the company and to have as much information about the company.
It is particularly necessary to know the market, engineering and technology, organization and management and financial indicators.
I Introduction
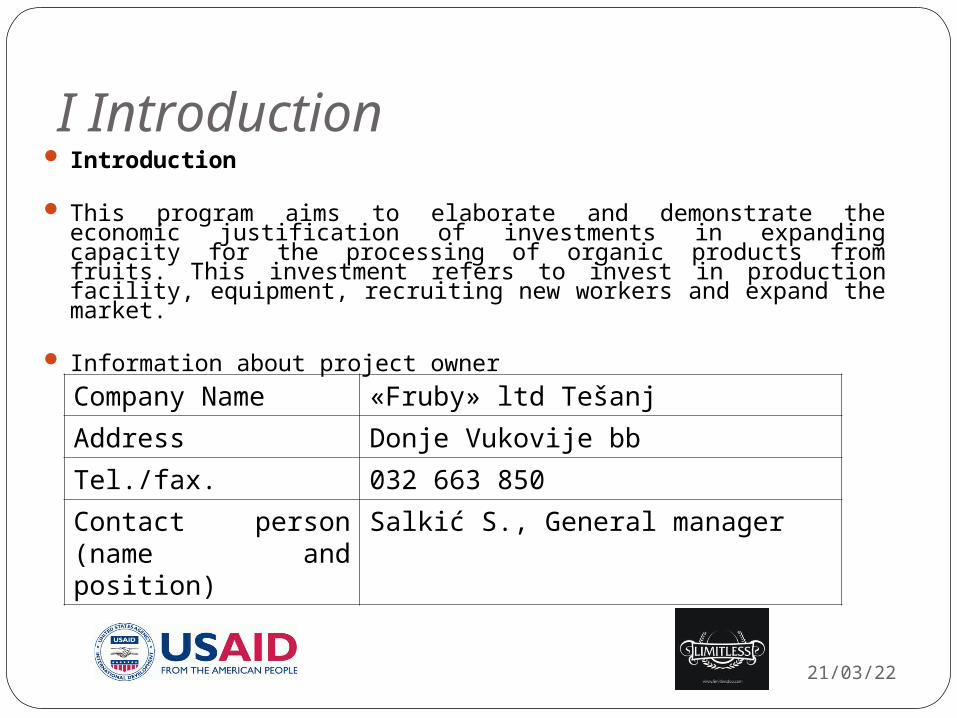
Company Name «Fruby» ltd Tešanj
Address Donje Vukovije bb
Tel./fax. 032 663 850
Contact person (name and position)
Salkić S., General manager
18/04/23
Introduction
This program aims to elaborate and demonstrate the economic justification of investments in expanding capacity for the processing of organic products from fruits. This investment refers to invest in production facility, equipment, recruiting new workers and expand the market.
Information about project owner
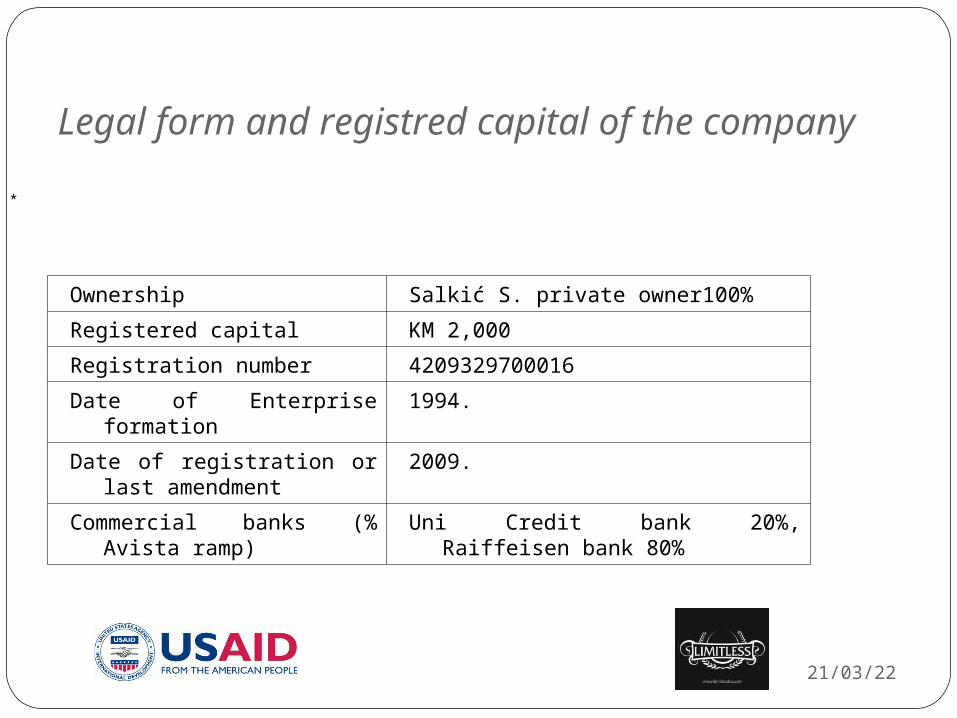
Legal form and registred capital of the company
Ownership Salkić S. private owner100%
Registered capital KM 2,000
Registration number 4209329700016
Date of Enterprise formation 1994.
Date of registration or last amendment
2009.
Commercial banks (% Avista ramp)
Uni Credit bank 20%, Raiffeisen bank 80%
18/04/23
*
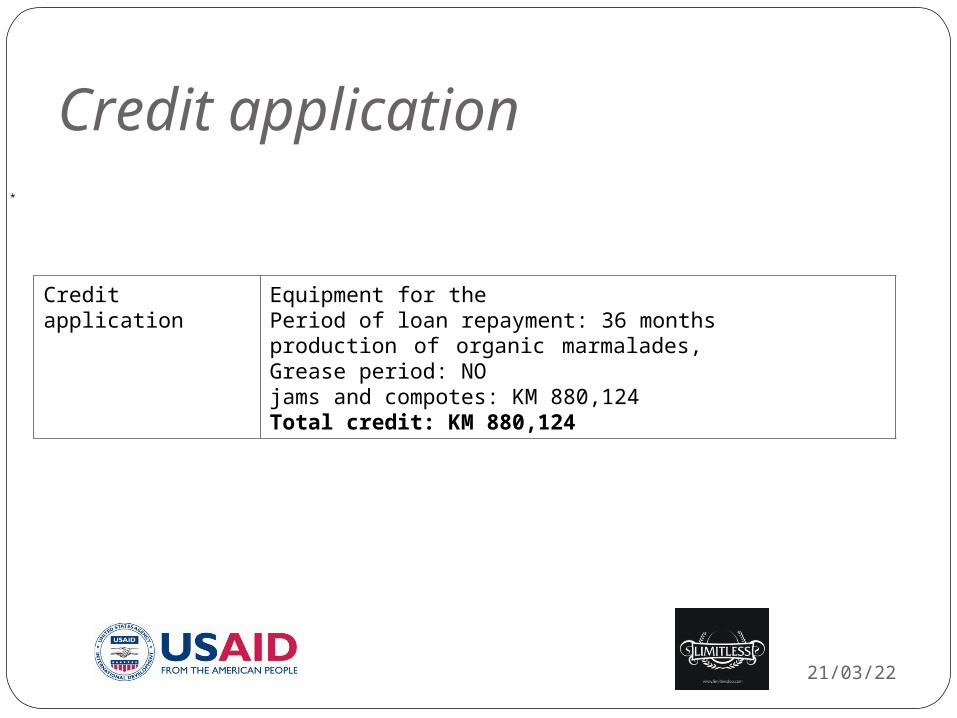
Credit application
Credit application Equipment for the Period of loan repayment: 36 monthsproduction of organic marmalades, Grease period: NO jams and compotes: KM 880,124Total credit: KM 880,124
18/04/23
*
18/04/23
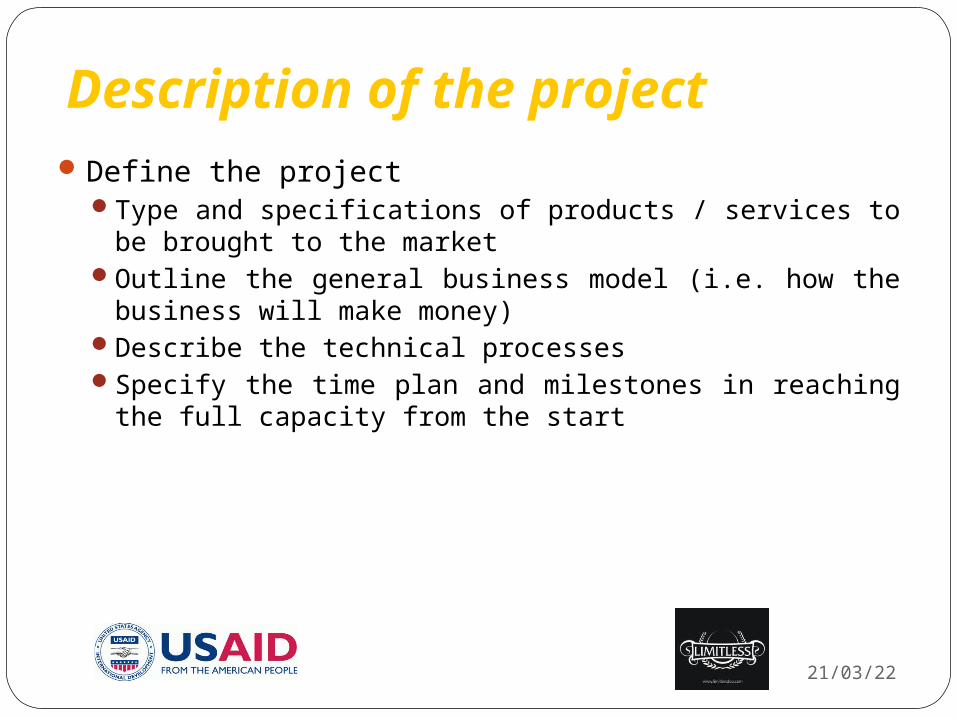
Define the projectType and specifications of products / services to be
brought to the marketOutline the general business model (i.e. how the business
will make money)Describe the technical processesSpecify the time plan and milestones in reaching the full
capacity from the start
Description of the project
Description of the project
18/04/23
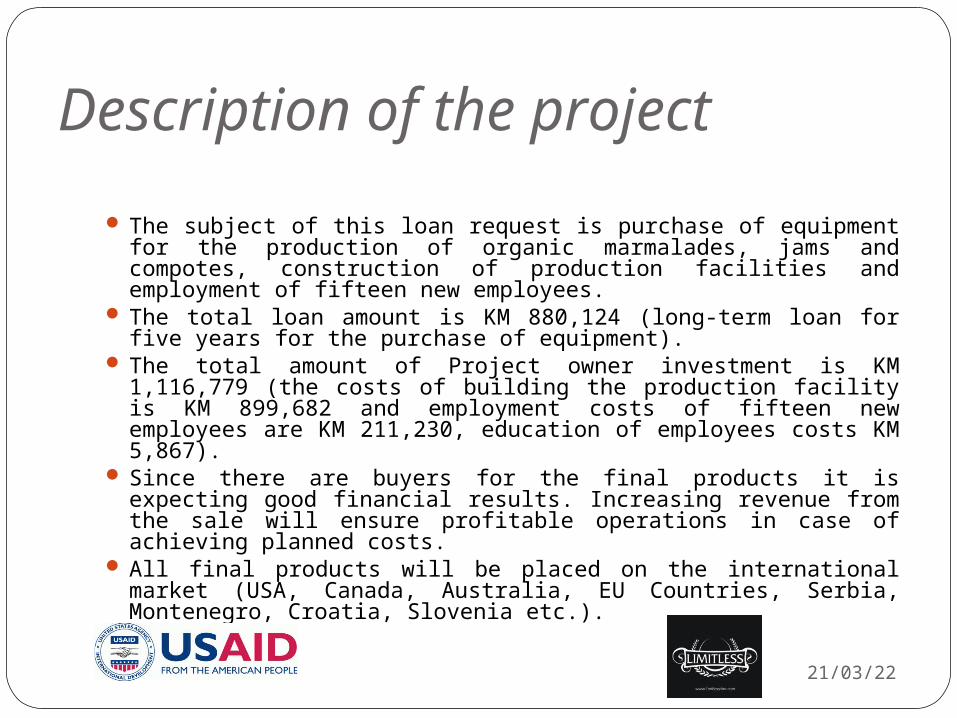
The subject of this loan request is purchase of equipment for the production of organic marmalades, jams and compotes, construction of production facilities and employment of fifteen new employees.
The total loan amount is KM 880,124 (long-term loan for five years for the purchase of equipment).
The total amount of Project owner investment is KM 1,116,779 (the costs of building the production facility is KM 899,682 and employment costs of fifteen new employees are KM 211,230, education of employees costs KM 5,867).
Since there are buyers for the final products it is expecting good financial results. Increasing revenue from the sale will ensure profitable operations in case of achieving planned costs.
All final products will be placed on the international market (USA, Canada, Australia, EU Countries, Serbia, Montenegro, Croatia, Slovenia etc.).

Use and sources of foundsNum Name of investment Supplier Document Date Price
without VAT KM
Sources of funds
Project Owner
Financingbank
Other sources
1. Equipment for the production of organic products
KRONES Germany
Proforma invoice1290027/10
04.02.'10 880,124 880,124
2. Production facility Širbegović ltd Gračanic
Invoice 672-09/10
03.15.'10 586,749 586,749
3. Preparing production facilities.
Other suppliers
Invoice 03.15.'10 312,933 312,933
4. Employment 04.10.’10 211,230 211,230
5. Education of employees
04.25.’10 5,867 5,867
Total: 1,996,903 1,116,779 880,124 0
55.9% 44.1% 0.0%
18/04/23
Collateral and financial guarantees
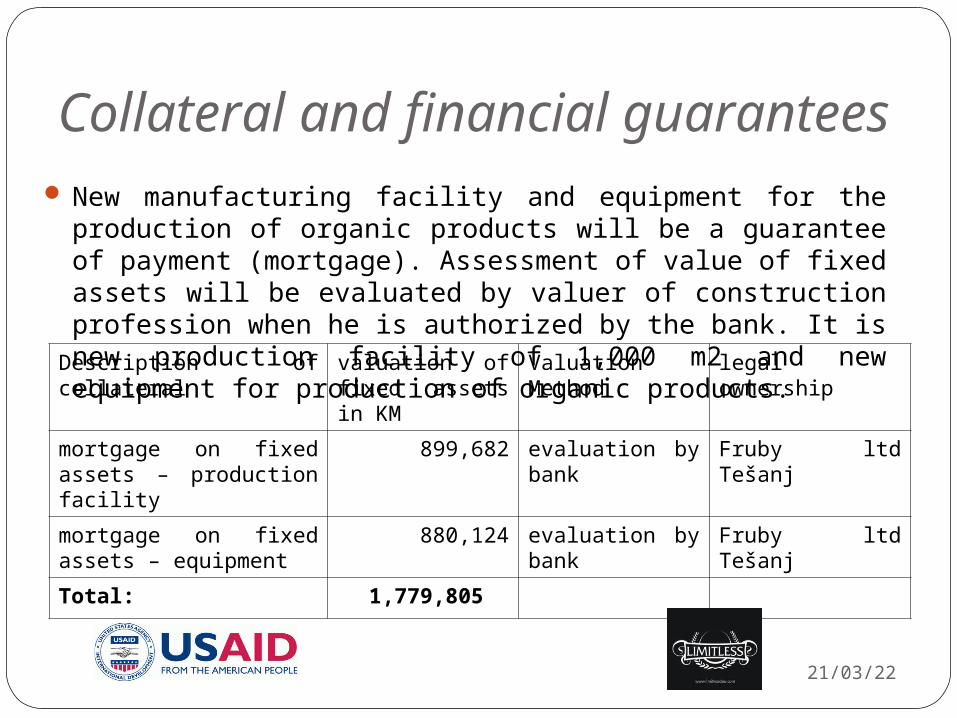
Description of collateral valuation of fixed assets in KM
Valuation Method
legal ownership
mortgage on fixed assets – production facility
899,682 evaluation by bank
Fruby ltd Tešanj
mortgage on fixed assets – equipment
880,124 evaluation by bank
Fruby ltd Tešanj
Total: 1,779,805
18/04/23
New manufacturing facility and equipment for the production of organic products will be a guarantee of payment (mortgage). Assessment of value of fixed assets will be evaluated by valuer of construction profession when he is authorized by the bank. It is new production facility of 1,000 m2 and new equipment for production of organic products.
Enterprise activities
18/04/23
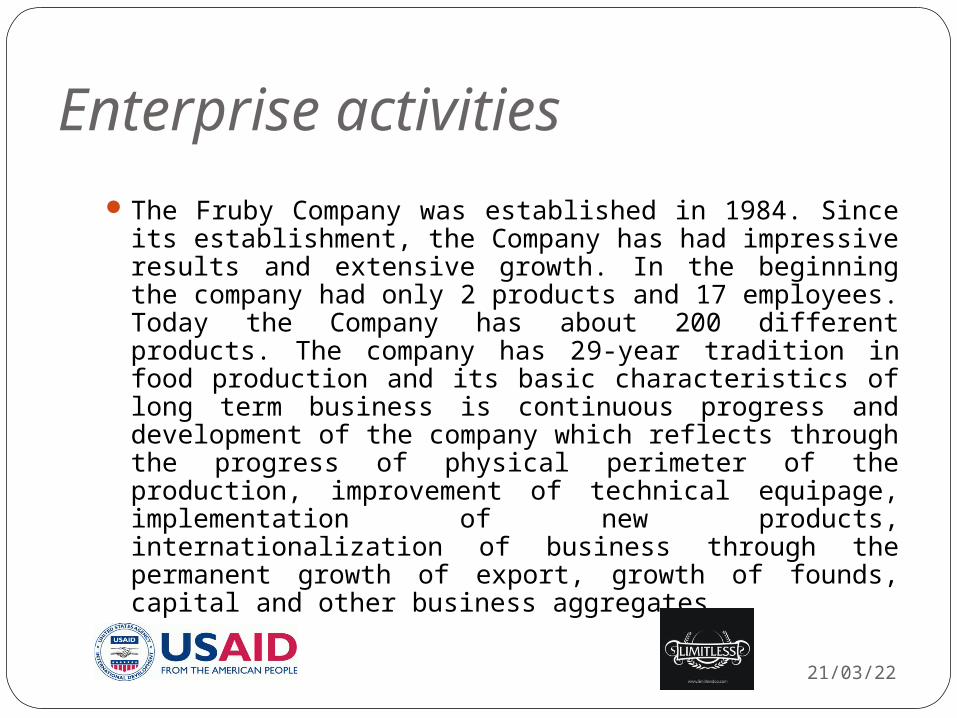
The Fruby Company was established in 1984. Since its establishment, the Company has had impressive results and extensive growth. In the beginning the company had only 2 products and 17 employees. Today the Company has about 200 different products. The company has 29-year tradition in food production and its basic characteristics of long term business is continuous progress and development of the company which reflects through the progress of physical perimeter of the production, improvement of technical equipage, implementation of new products, internationalization of business through the permanent growth of export, growth of founds, capital and other business aggregates.
Business analysis (main buyers, suppliers, competition etc.)
18/04/23
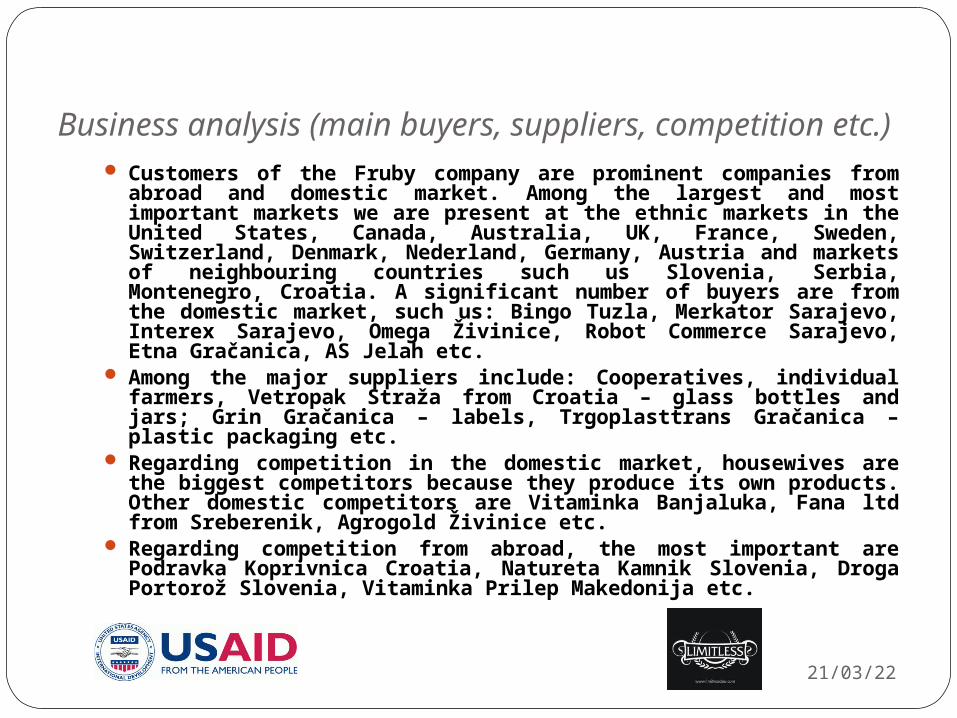
Customers of the Fruby company are prominent companies from abroad and domestic market. Among the largest and most important markets we are present at the ethnic markets in the United States, Canada, Australia, UK, France, Sweden, Switzerland, Denmark, Nederland, Germany, Austria and markets of neighbouring countries such us Slovenia, Serbia, Montenegro, Croatia. A significant number of buyers are from the domestic market, such us: Bingo Tuzla, Merkator Sarajevo, Interex Sarajevo, Omega Živinice, Robot Commerce Sarajevo, Etna Gračanica, AS Jelah etc.
Among the major suppliers include: Cooperatives, individual farmers, Vetropak Straža from Croatia – glass bottles and jars; Grin Gračanica – labels, Trgoplasttrans Gračanica – plastic packaging etc.
Regarding competition in the domestic market, housewives are the biggest competitors because they produce its own products. Other domestic competitors are Vitaminka Banjaluka, Fana ltd from Sreberenik, Agrogold Živinice etc.
Regarding competition from abroad, the most important are Podravka Koprivnica Croatia, Natureta Kamnik Slovenia, Droga Portorož Slovenia, Vitaminka Prilep Makedonija etc.
Marketing plan
18/04/23
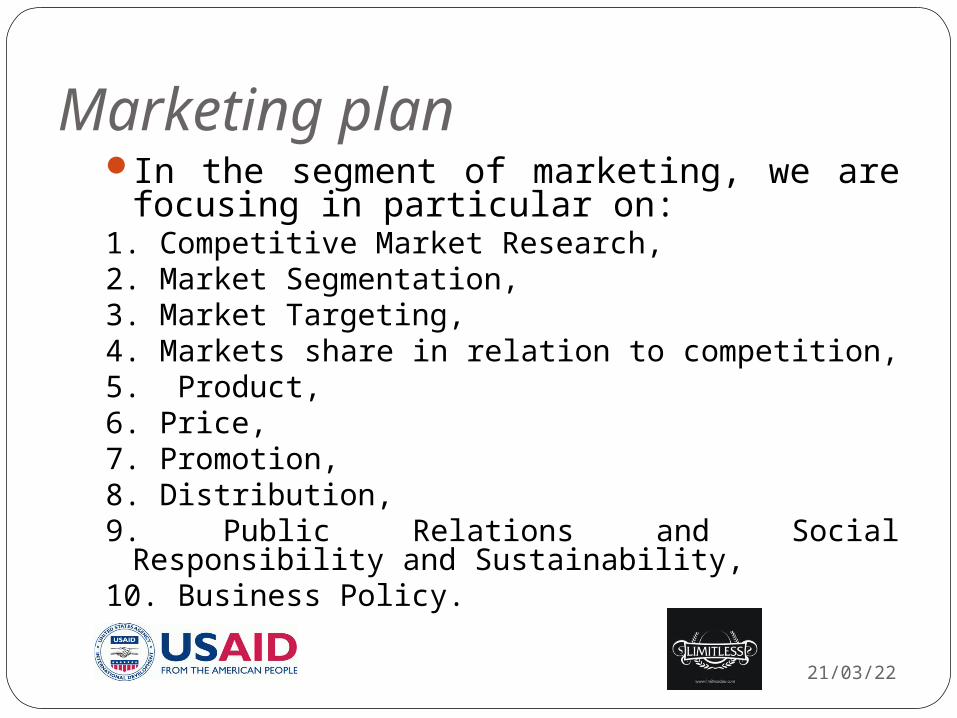
In the segment of marketing, we are focusing in particular on:
1. Competitive Market Research, 2. Market Segmentation, 3. Market Targeting, 4. Markets share in relation to competition, 5. Product, 6. Price, 7. Promotion, 8. Distribution, 9. Public Relations and Social Responsibility and
Sustainability, 10. Business Policy.
18/04/23
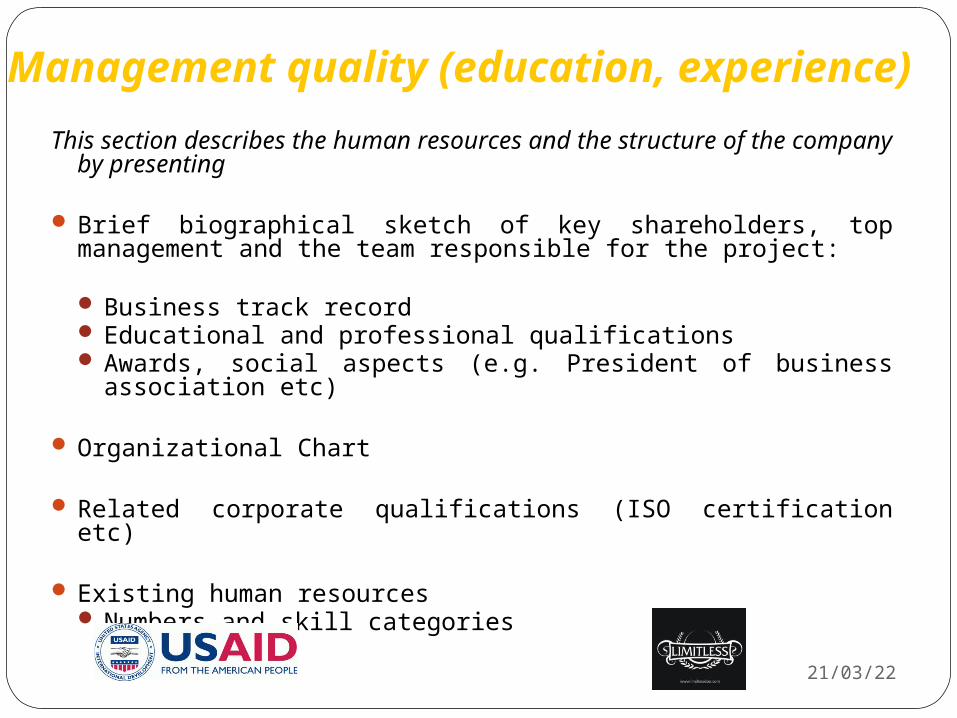
This section describes the human resources and the structure of the company by presenting
Brief biographical sketch of key shareholders, top management and the team responsible for the project:
Business track recordEducational and professional qualificationsAwards, social aspects (e.g. President of business
association etc)
Organizational Chart
Related corporate qualifications (ISO certification etc)
Existing human resources Numbers and skill categories
Management quality (education, experience)
Management quality (education, experience)
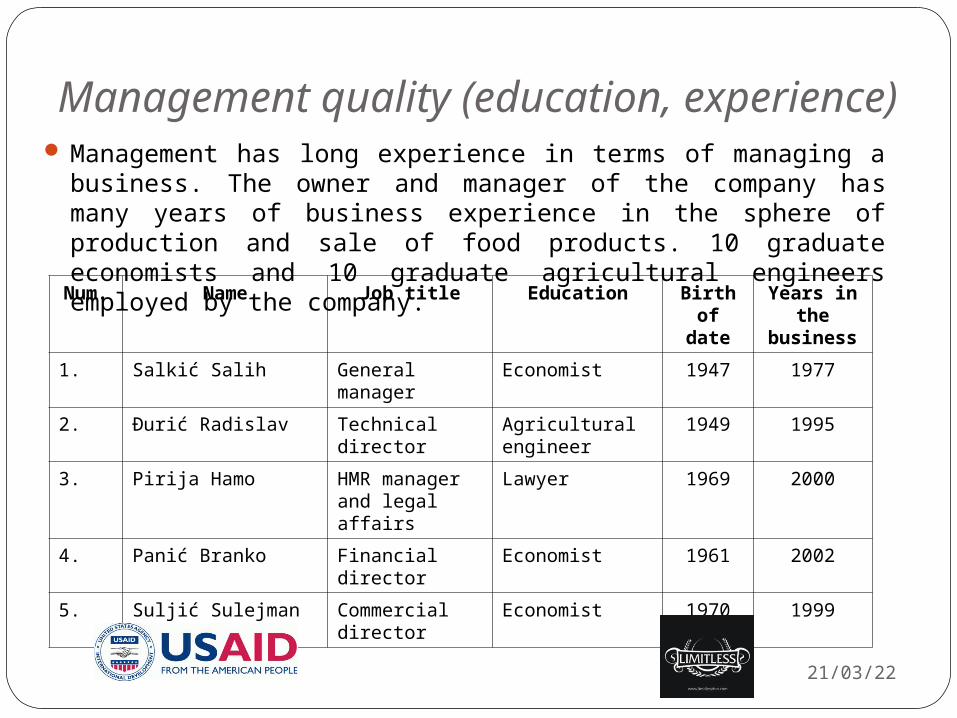
Num.
Name Job title Education Birth of
date
Years in the
business
1. Salkić Salih General manager
Economist 1947 1977
2. Đurić Radislav Technical director
Agricultural engineer
1949 1995
3. Pirija Hamo HMR manager and legal affairs
Lawyer 1969 2000
4. Panić Branko Financial director
Economist 1961 2002
5. Suljić Sulejman Commercial director
Economist 1970 1999
18/04/23
Management has long experience in terms of managing a business. The owner and manager of the company has many years of business experience in the sphere of production and sale of food products. 10 graduate economists and 10 graduate agricultural engineers employed by the company.
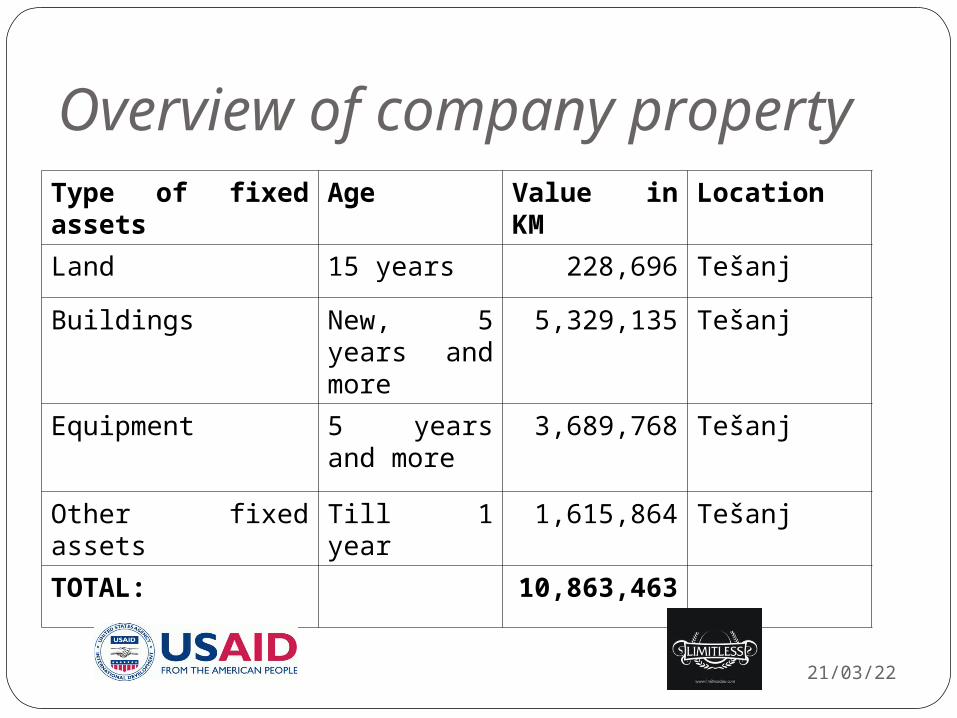
Overview of company propertyType of fixed assets Age Value in KM Location
Land 15 years 228,696 Tešanj
Buildings New, 5 years and more
5,329,135 Tešanj
Equipment 5 years and more
3,689,768 Tešanj
Other fixed assets Till 1 year 1,615,864 Tešanj
TOTAL: 10,863,463
18/04/23
18/04/23
Sales Projections
Specify main assumptions (prices, capacity utilization and physical production amounts) and project sales (sales of key products categories as well as the total sales)
Production program
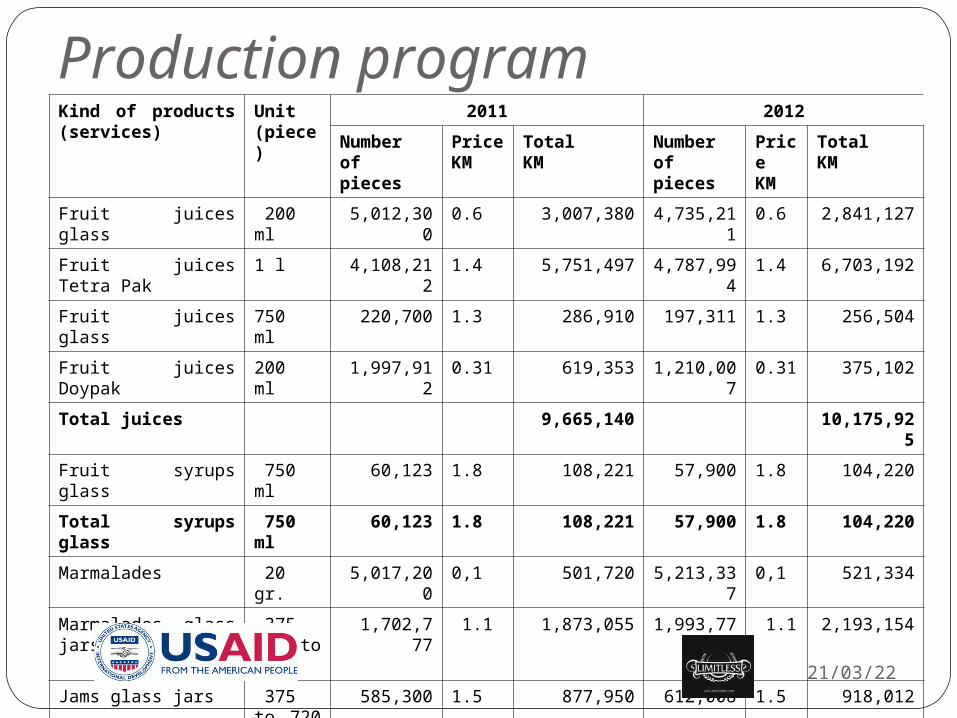
Production programKind of products (services)
Unit (piece)
2011 2012
Number of pieces
PriceKM
TotalKM
Number of pieces
PriceKM
TotalKM
Fruit juices glass 200 ml 5,012,300 0.6 3,007,380 4,735,211 0.6 2,841,127
Fruit juices Tetra Pak 1 l 4,108,212 1.4 5,751,497 4,787,994 1.4 6,703,192
Fruit juices glass 750 ml 220,700 1.3 286,910 197,311 1.3 256,504
Fruit juices Doypak 200 ml 1,997,912 0.31 619,353 1,210,007 0.31 375,102
Total juices 9,665,140 10,175,925
Fruit syrups glass 750 ml 60,123 1.8 108,221 57,900 1.8 104,220
Total syrups glass 750 ml 60,123 1.8 108,221 57,900 1.8 104,220
Marmalades 20 gr. 5,017,200 0,1 501,720 5,213,337 0,1 521,334
Marmalades glass jars and PET
375 ml to 3 kg
1,702,777 1.1 1,873,055 1,993,776 1.1 2,193,154
Jams glass jars 375 to 720 ml
585,300 1.5 877,950 612,008 1.5 918,012
Compote glass jars 212 to 720 ml
377,110 1.35 509,099 391,200 1.35 528,120
Total marmalades and jams
3,761,824 4,160,620
18/04/23
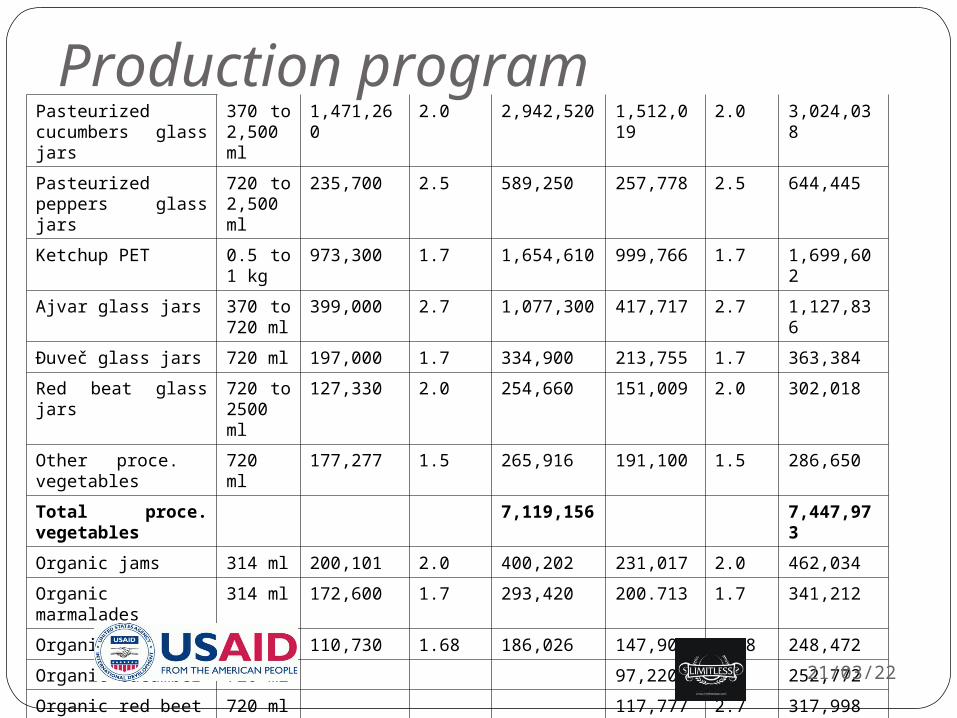
Production programPasteurized cucumbers glass jars
370 to 2,500 ml
1,471,260 2.0 2,942,520 1,512,019 2.0 3,024,038
Pasteurized peppers glass jars
720 to 2,500 ml
235,700 2.5 589,250 257,778 2.5 644,445
Ketchup PET 0.5 to 1 kg
973,300 1.7 1,654,610 999,766 1.7 1,699,602
Ajvar glass jars 370 to 720 ml
399,000 2.7 1,077,300 417,717 2.7 1,127,836
Đuveč glass jars 720 ml 197,000 1.7 334,900 213,755 1.7 363,384
Red beat glass jars 720 to 2500 ml
127,330 2.0 254,660 151,009 2.0 302,018
Other proce. vegetables 720 ml 177,277 1.5 265,916 191,100 1.5 286,650
Total proce. vegetables 7,119,156 7,447,973
Organic jams 314 ml 200,101 2.0 400,202 231,017 2.0 462,034
Organic marmalades 314 ml 172,600 1.7 293,420 200.713 1.7 341,212
Organic compotes 212 ml 110,730 1.68 186,026 147,900 1.68 248,472
Organic cucumber 720 ml 97,220 2.6 252,772
Organic red beet 720 ml 117,777 2.7 317,998
Total organic 879,648 1,622,488
Total 21,533,989 23,511,226
18/04/23
18/04/23
This section describes the technical processes to be utilized in order to produce and deliver the products to the market. Explains
How the production will be done (technology) Where the production will be done Why the production will be done there
Ease of access to raw materials, energy, markets Ease of access to manpower with necessary qualifications
How the products will be delivered to the market (distribution channel)
Cost structure Materials Labor Transportation or Shipping Other production costs Administrative costs
Technology
Capacities
18/04/23
The group classified as a machine has classified all the equipment for fruits and vegetables processing. Equipment is continuously maintained. The intensity of use of equipment is high. There is a certain amount of spare parts needed for maintenance. During the year the equipment is used continuously on the basis of work in three shifts. Use value of equipment is 46% because it is amortized to 54%. Capacity utilization of these machines is about 95%.
18/04/23
This section defines where and to whom the
products/services will be sold in order to
maximize revenues:
Who are going to be my clients and sources of
my revenues: Description of the Industry
Analysis of the Market and Competition
Future Market Potential
Sales Projections
Market
Market
18/04/23
Fruby products are determined for mass markets and products are being realized through almost all distribution channels and organizations.
Assortment structure of products is very wide and different and is divided in groups and every group is specific with regard to distribution.
Significant part of production is being processed for known buyer. These are usually domestic or foreign buyers who traditionally work with the factory.
Basic characteristic of the market is that it continuously expands and offers greater possibilities for finding place for the goods.
Business policy of the company
18/04/23
From the beginning to the present days business orientation of the company is based on the strategy of dynamic growth and development.
For the upcoming period the company has created a solid financial basis, with steady growth that is achieved thanks to the business - technical cooperation with customers.
The business policy of the company in the future based on further dynamic growth and development and investment in highly sophisticated equipment to improve product quality, service and retain the leading position in the market.
SWOT analysis
18/04/23
SWOT analysis is an objective review of strengths and weaknesses as well as internal factors and opportunities and threats as external factors (the forces that operate in the environment). It is the best way to show where the company is in comparison with the competition.
18/04/23
Potential Buyers and Sources of Revenues
Your current key customers including governmental clients and the potential for new or renewed contracts.
Any sales leads that may generate new customers or clients.
A list of market segments you intend to target such as seniors citizens, working mothers, organizations, specialty retailers, etc.
Informations about buyers

Informations about buyersBuyer name Country Ownership
Private/State
2010 in %
2011 in %
2012 in %
Payment terms
Advance Deferred payment
DIV Promet Velika Gorica Croatia Private 10.4% 11.7% 12% 60 days
Šimić Company Split Croatia Private 8% 8.72% 9.5% 60 days
Centroproizvod Beograd Serbia Private 4.8% 6.1% 7.2% 60 days
Omega Živinice B&H Private 4,9% 6,5% 2,9% 60 days
Bosnaprodukt Gradačac B&H Private 6.7% 7.3% 9.4% 60 days
Krug Split Croatia Private 3.9% 3% 3.4% Advance
TUT’S Detroit USA Private 0.9% 1.3% 1.6% Advance
18/04/23
18/04/23
CompetitionWho are your competitors (direct / substitute products) ?Describe the industry concentration. Are there just a few
large producers or many small producers? Describe the major competitors. Will you compete
directly against them? Analyze the barriers to entry of new competitors into the
market or industry. Can more competitors enter market easily?
Describe the price competitiveness of your product/service.
Competition
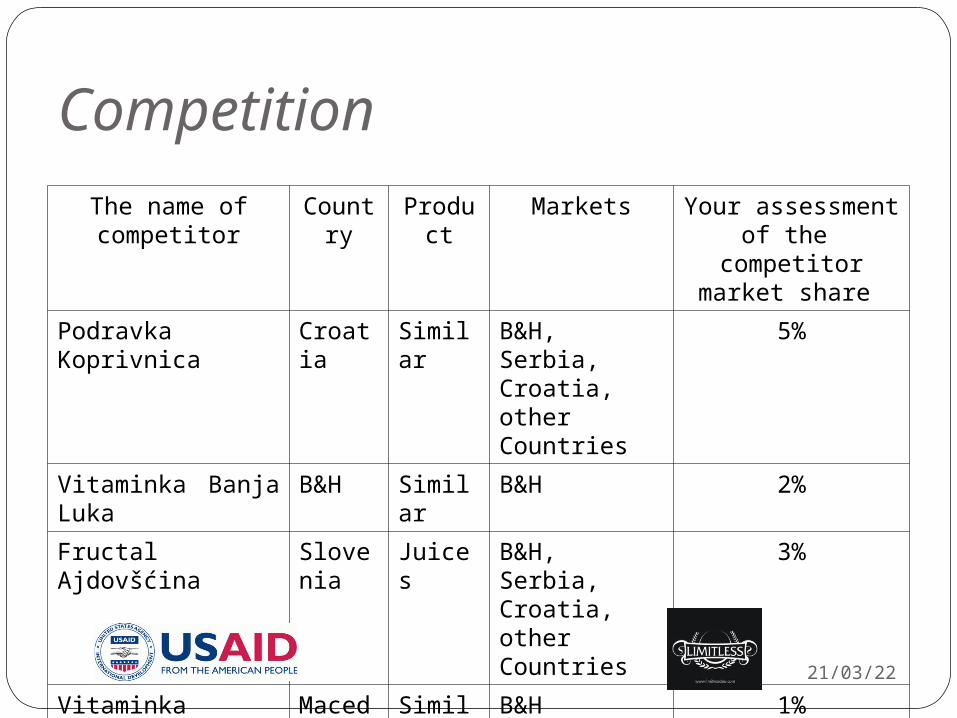
CompetitionThe name of competitor
Country Product Markets Your assessment of the competitor market share
Podravka Koprivnica Croatia Similar B&H, Serbia, Croatia, other Countries
5%
Vitaminka Banja Luka B&H Similar B&H 2%
Fructal Ajdovšćina Slovenia
Juices B&H, Serbia, Croatia, other Countries
3%
Vitaminka Prilep Macedonia
Similar B&H 1%
18/04/23
Term business plan implementation
18/04/23
If Fruby get a long-term loan within 10 days we can begin with implementation of project.
Procurement of equipment will be done immediately.
Payment of equipment must be made in advance.
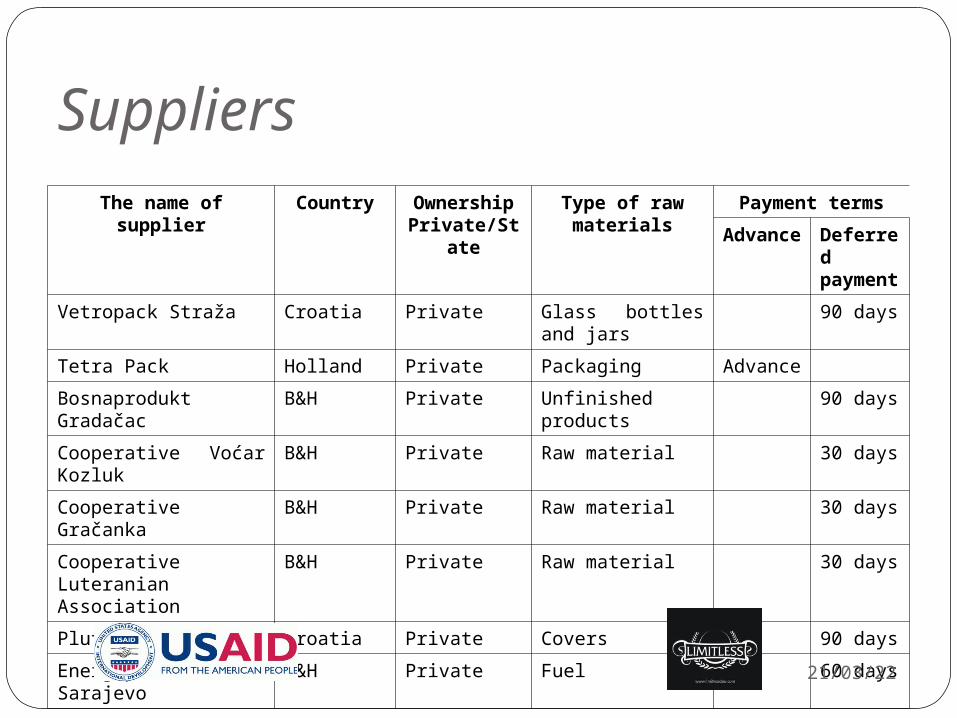
SuppliersThe name of supplier Country Ownership
Private/StateType of raw
materialsPayment terms
Advance Deferred payment
Vetropack Straža Croatia Private Glass bottles and jars 90 days
Tetra Pack Holland Private Packaging Advance
Bosnaprodukt Gradačac B&H Private Unfinished products 90 days
Cooperative Voćar Kozluk B&H Private Raw material 30 days
Cooperative Gračanka B&H Private Raw material 30 days
Cooperative Luteranian Association
B&H Private Raw material 30 days
Pluto Zagreb Croatia Private Covers 90 days
Energopetrol Sarajevo B&H Private Fuel 60 days
18/04/23
The expected effects of the investment
18/04/23
The Company expects to have multiple effects of the planned investment in capacity expansion.
First of all there will be expansion of the production group assortment of organic products.
For this group of products has provided the market.
By investing in the production hall and purchase of modern equipment the company will ensure capital intensive production with reduced cost base and increasing profits.
Ecology
18/04/23
The company has all the necessary work permits. The company has invested large funds in the protection of
environment and preventing pollution of water and air. The introduction of clean production standard is in the process. In the process of production remains solid waste from fruits
and vegetables. Of that waste is a real natural fertilizer. Waste cardboard is pressed and re-selling manufacturer of
cardboard. Waste that can not be recycled are placed in containers is
transported by utility company to the municipal waste landfill.
Risk assessment and measures for risk prevention
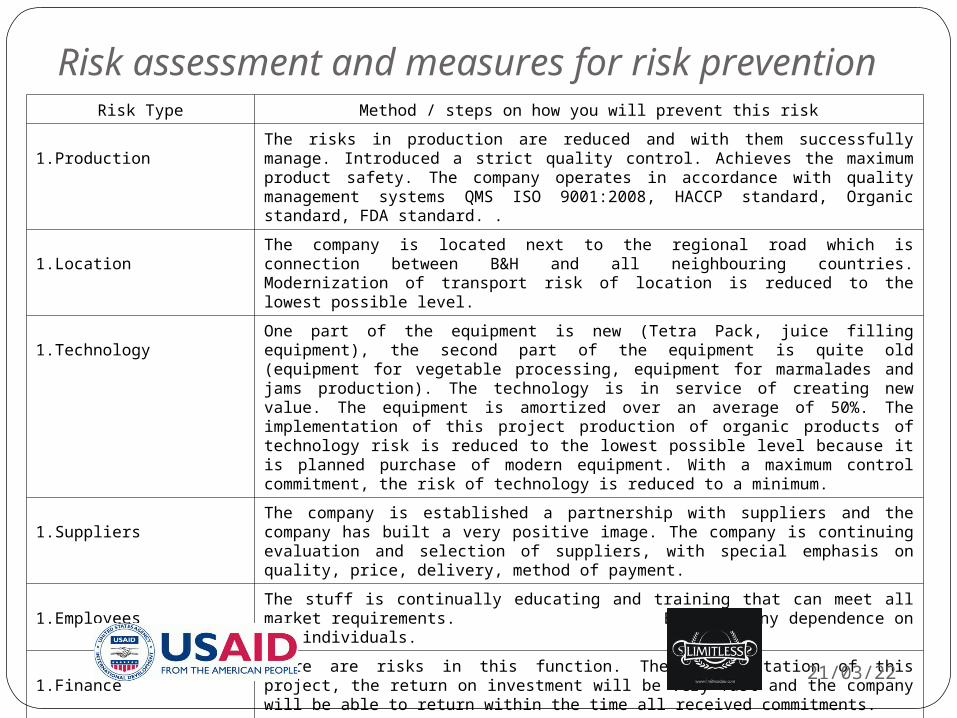
Risk Type Method / steps on how you will prevent this risk
1.ProductionThe risks in production are reduced and with them successfully manage. Introduced a strict quality control. Achieves the maximum product safety. The company operates in accordance with quality management systems QMS ISO 9001:2008, HACCP standard, Organic standard, FDA standard. .
1.LocationThe company is located next to the regional road which is connection between B&H and all neighbouring countries. Modernization of transport risk of location is reduced to the lowest possible level.
1.TechnologyOne part of the equipment is new (Tetra Pack, juice filling equipment), the second part of the equipment is quite old (equipment for vegetable processing, equipment for marmalades and jams production). The technology is in service of creating new value. The equipment is amortized over an average of 50%. The implementation of this project production of organic products of technology risk is reduced to the lowest possible level because it is planned purchase of modern equipment. With a maximum control commitment, the risk of technology is reduced to a minimum.
1.SuppliersThe company is established a partnership with suppliers and the company has built a very positive image. The company is continuing evaluation and selection of suppliers, with special emphasis on quality, price, delivery, method of payment.
1.EmployeesThe stuff is continually educating and training that can meet all market requirements. Excluded any dependence on key individuals.
1.FinanceThere are risks in this function. The implementation of this project, the return on investment will be very fast and the company will be able to return within the time all received commitments.
1.Market About 40% of production is exported to foreign markets only verified buyers. The company continuously expands business in other markets.
18/04/23
18/04/23
Estimate the total capital requirements and relevant
timetable
Estimate equity to be invested from your side
Estimate external equity / financing needs and
repayment schedules
Project Income Statements
Project (Free) Cash Flow Statements
Calculate Financial Returns
Financial analysis
Business results / Financial informations
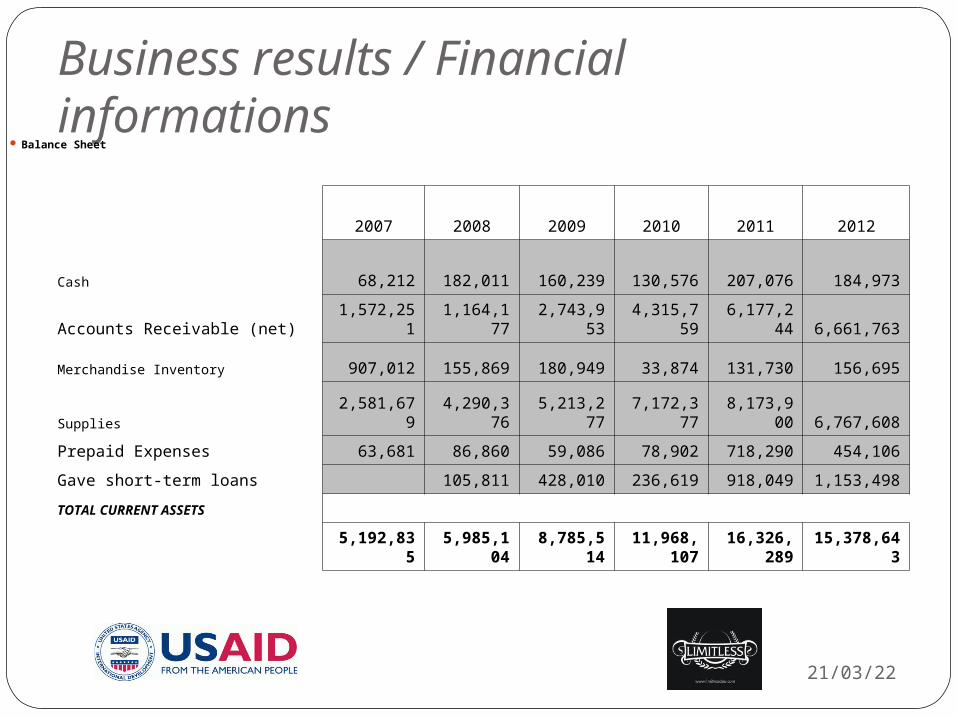
2007 2008 2009 2010 2011 2012
Cash 68,212 182,011 160,239 130,576 207,076 184,973
Accounts Receivable (net) 1,572,251 1,164,177 2,743,953 4,315,759 6,177,244 6,661,763
Merchandise Inventory 907,012 155,869 180,949 33,874 131,730 156,695
Supplies 2,581,679 4,290,376 5,213,277 7,172,377 8,173,900 6,767,608
Prepaid Expenses 63,681 86,860 59,086 78,902 718,290 454,106
Gave short-term loans 105,811 428,010 236,619 918,049 1,153,498
TOTAL CURRENT ASSETS
5,192,835 5,985,104 8,785,514 11,968,107 16,326,289 15,378,643
18/04/23
Balance Sheet
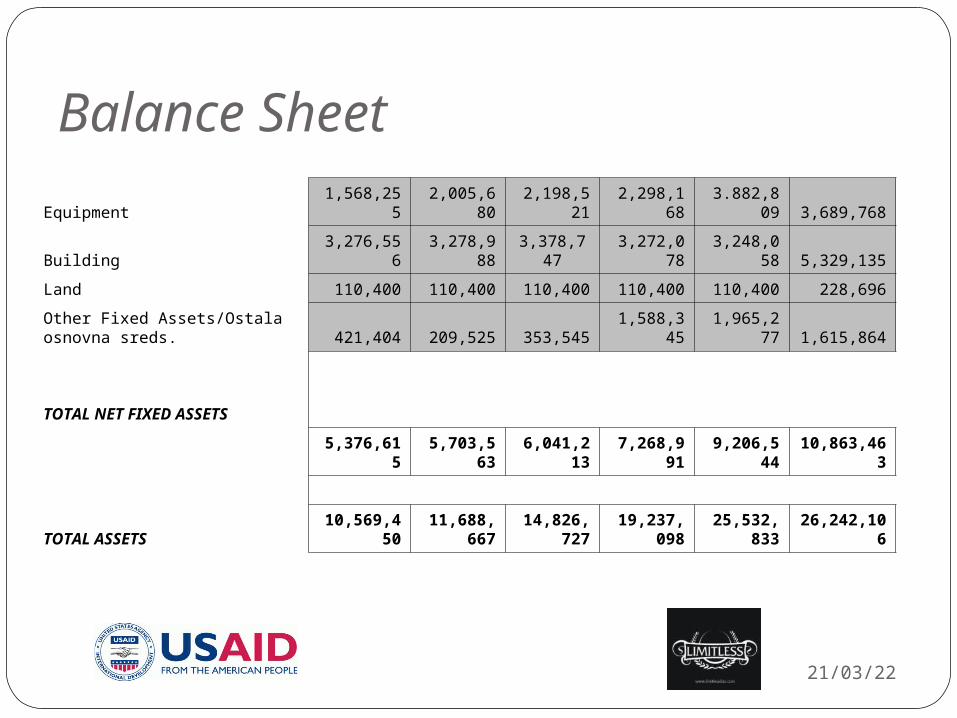
Balance SheetEquipment 1,568,255 2,005,680 2,198,521 2,298,168 3.882,809 3,689,768
Building 3,276,556 3,278,988 3,378,747 3,272,078 3,248,058 5,329,135
Land 110,400 110,400 110,400 110,400 110,400 228,696
Other Fixed Assets/Ostala osnovna sreds. 421,404 209,525 353,545 1,588,345 1,965,277 1,615,864
TOTAL NET FIXED ASSETS
5,376,615 5,703,563 6,041,213 7,268,991 9,206,544 10,863,463
TOTAL ASSETS 10,569,450 11,688,667 14,826,727 19,237,098 25,532,833 26,242,106
18/04/23
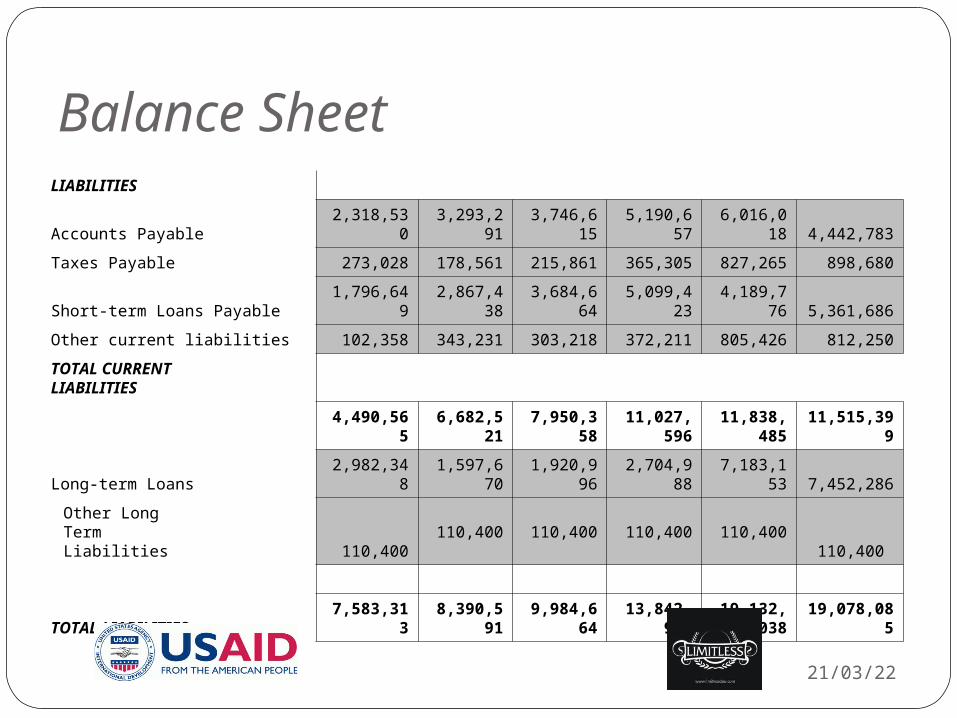
Balance SheetLIABILITIES
Accounts Payable 2,318,530 3,293,291 3,746,615 5,190,657 6,016,018 4,442,783
Taxes Payable 273,028 178,561 215,861 365,305 827,265 898,680
Short-term Loans Payable 1,796,649 2,867,438 3,684,664 5,099,423 4,189,776 5,361,686
Other current liabilities 102,358 343,231 303,218 372,211 805,426 812,250
TOTAL CURRENT LIABILITIES
4,490,565 6,682,521 7,950,358 11,027,596 11,838,485 11,515,399
Long-term Loans 2,982,348 1,597,670 1,920,996 2,704,988 7,183,153 7,452,286
Other Long Term Liabilities 110,400 110,400 110,400 110,400 110,400 110,400
TOTAL LIABILITIES 7,583,313 8,390,591 9,984,664 13,842,984 19,132,038 19,078,085
18/04/23
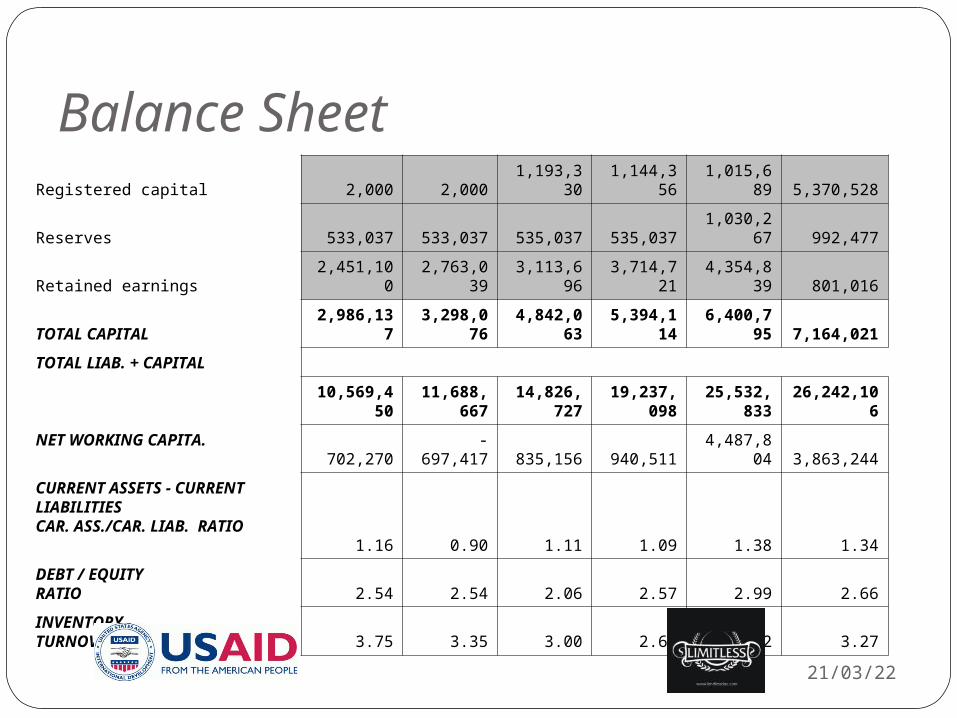
Balance SheetRegistered capital 2,000 2,000 1,193,330 1,144,356 1,015,689 5,370,528
Reserves 533,037 533,037 535,037 535,037 1,030,267 992,477
Retained earnings 2,451,100 2,763,039 3,113,696 3,714,721 4,354,839 801,016
TOTAL CAPITAL 2,986,137 3,298,076 4,842,063 5,394,114 6,400,795 7,164,021
TOTAL LIAB. + CAPITAL
10,569,450 11,688,667 14,826,727 19,237,098 25,532,833 26,242,106
NET WORKING CAPITA. 702,270 -697,417 835,156 940,511 4,487,804 3,863,244
CURRENT ASSETS - CURRENT LIABILITIES CAR. ASS./CAR. LIAB. RATIO 1.16 0.90 1.11 1.09 1.38 1.34
DEBT / EQUITY RATIO 2.54 2.54 2.06 2.57 2.99 2.66
INVENTORY TURNOV. RATIO 3.75 3.35 3.00 2.62 2.72 3.27
18/04/23
Income Statement
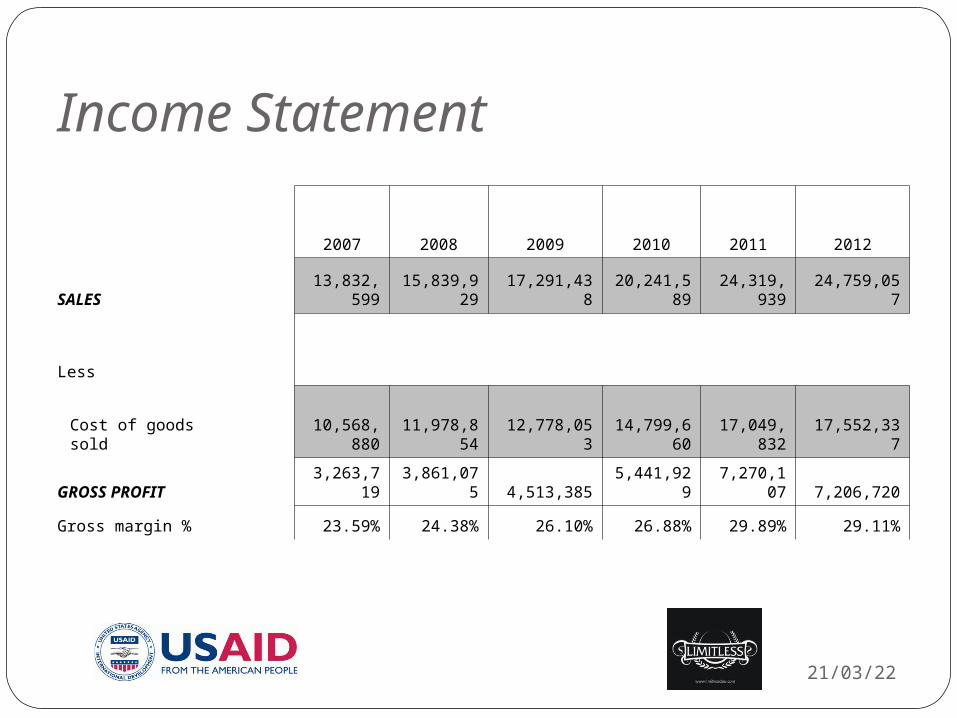
2007 2008 2009 2010 2011 2012
SALES 13,832,599 15,839,929 17,291,438 20,241,589 24,319,939 24,759,057
Less
Cost of goods sold 10,568,880 11,978,854 12,778,053 14,799,660 17,049,832 17,552,337
GROSS PROFIT 3,263,719 3,861,075 4,513,385 5,441,929 7,270,107 7,206,720
Gross margin % 23.59% 24.38% 26.10% 26.88% 29.89% 29.11%
18/04/23
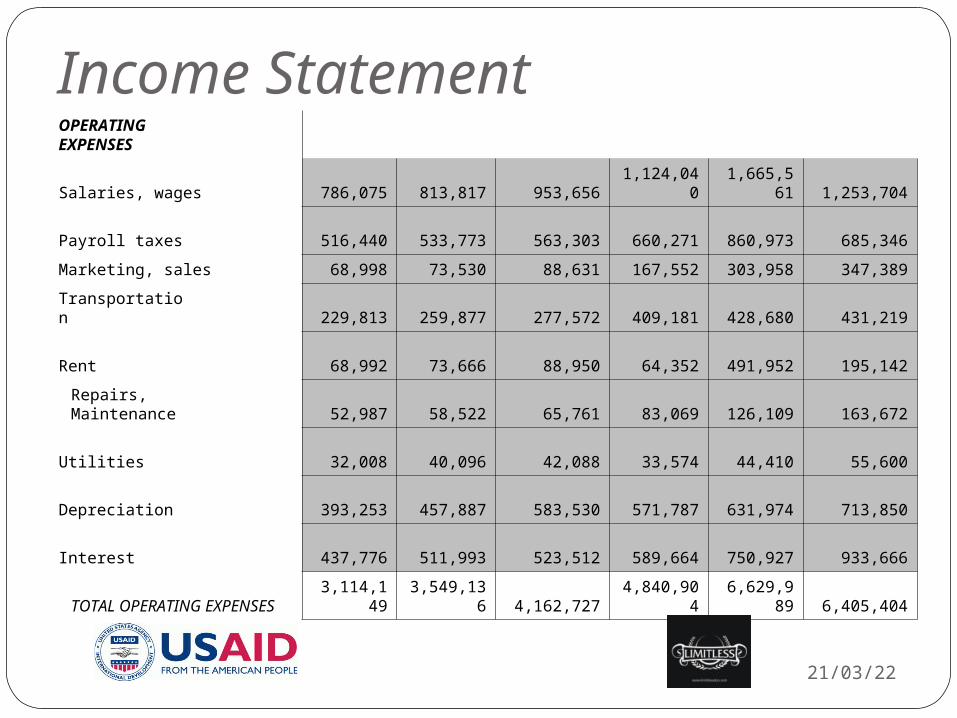
Income StatementOPERATING EXPENSES
Salaries, wages 786,075 813,817 953,656 1,124,040 1,665,561 1,253,704
Payroll taxes 516,440 533,773 563,303 660,271 860,973 685,346
Marketing, sales 68,998 73,530 88,631 167,552 303,958 347,389
Transportation 229,813 259,877 277,572 409,181 428,680 431,219
Rent 68,992 73,666 88,950 64,352 491,952 195,142
Repairs, Maintenance 52,987 58,522 65,761 83,069 126,109 163,672
Utilities 32,008 40,096 42,088 33,574 44,410 55,600
Depreciation 393,253 457,887 583,530 571,787 631,974 713,850
Interest 437,776 511,993 523,512 589,664 750,927 933,666
TOTAL OPERATING EXPENSES 3,114,149 3,549,136 4,162,727 4,840,904 6,629,989 6,405,404
18/04/23
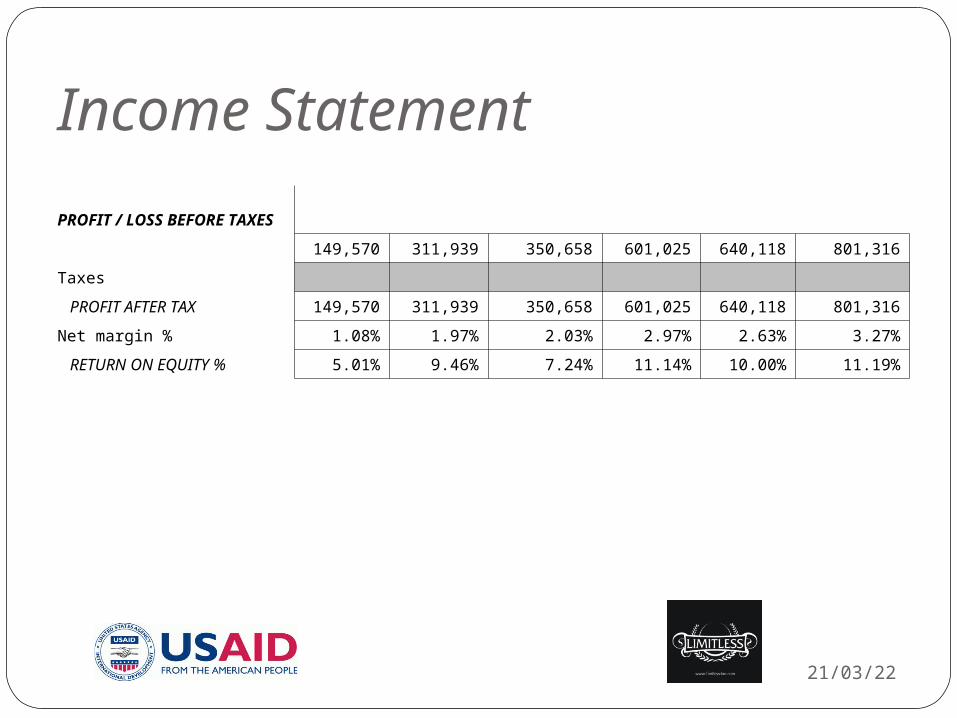
Income StatementPROFIT / LOSS BEFORE TAXES
149,570 311,939 350,658 601,025 640,118 801,316
Taxes
PROFIT AFTER TAX 149,570 311,939 350,658 601,025 640,118 801,316
Net margin % 1.08% 1.97% 2.03% 2.97% 2.63% 3.27%
RETURN ON EQUITY % 5.01% 9.46% 7.24% 11.14% 10.00% 11.19%
18/04/23
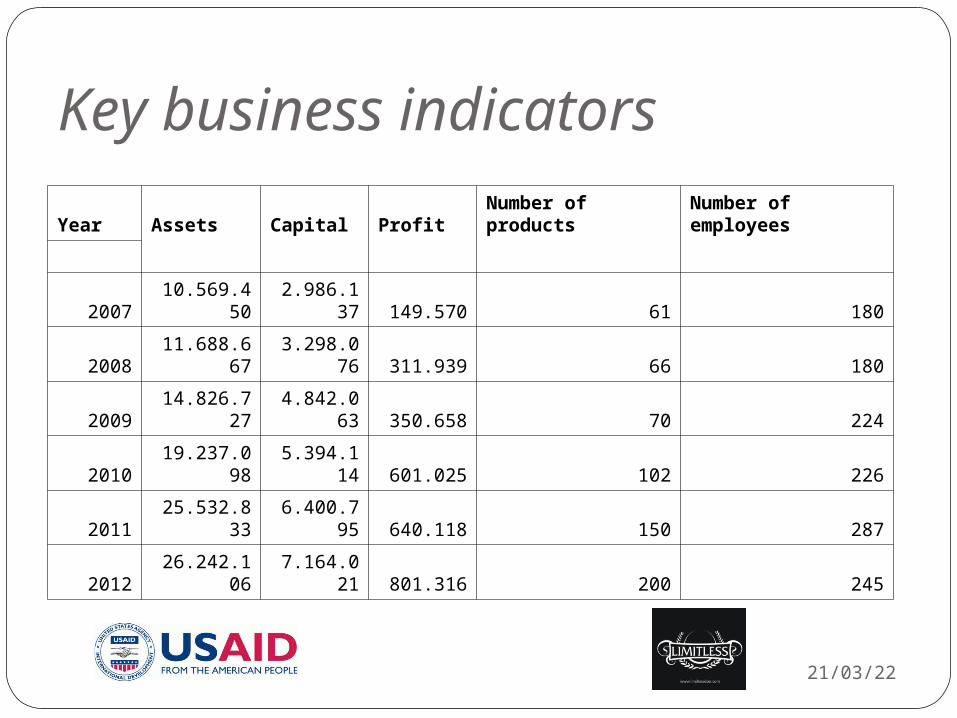
Key business indicators
Year Assets Capital Profit Number of products Number of employees
2007 10.569.450 2.986.137 149.570 61 180
2008 11.688.667 3.298.076 311.939 66 180
2009 14.826.727 4.842.063 350.658 70 224
2010 19.237.098 5.394.114 601.025 102 226
2011 25.532.833 6.400.795 640.118 150 287
2012 26.242.106 7.164.021 801.316 200 245
18/04/23
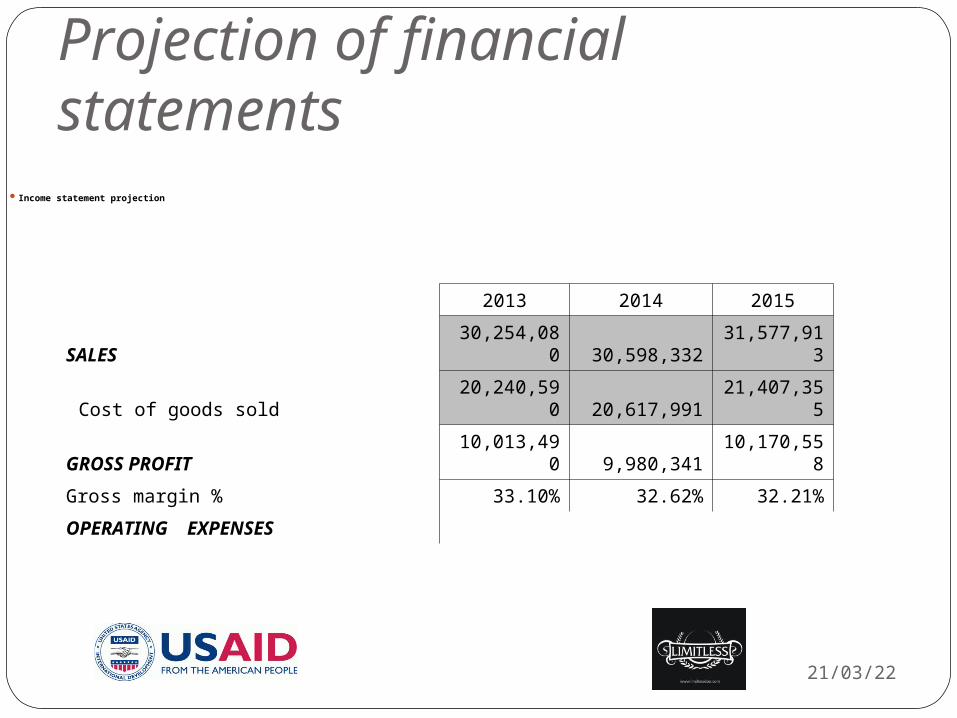
Projection of financial statements
2013 2014 2015
SALES 30,254,080 30,598,332 31,577,913
Cost of goods sold 20,240,590 20,617,991 21,407,355
GROSS PROFIT 10,013,490 9,980,341 10,170,558
Gross margin % 33.10% 32.62% 32.21%
OPERATING EXPENSES
18/04/23
Income statement projection

Income Statement projectionSalaries, wages and other employees costs 3,326,810 3,397,004 3,427,434
Payroll taxes 685,000 701,888 729,111
Marketing, sales 359,900 519,067 581,332
Transportation 945,109 987,988 962,313
Repairs, Maintenence 195,613 187,993 201,330
Utilities 55,800 74,999 89,442
Insurance 137,770 153,413 162,313
Depreciation 879,900 861,813 901,347
Interest 839,990 823,547 699,991
Other 560,471 678,334 692,337
TOTAL OPERATING EXPENSES 8,456,433 8,782,018 8,852,654
18/04/23
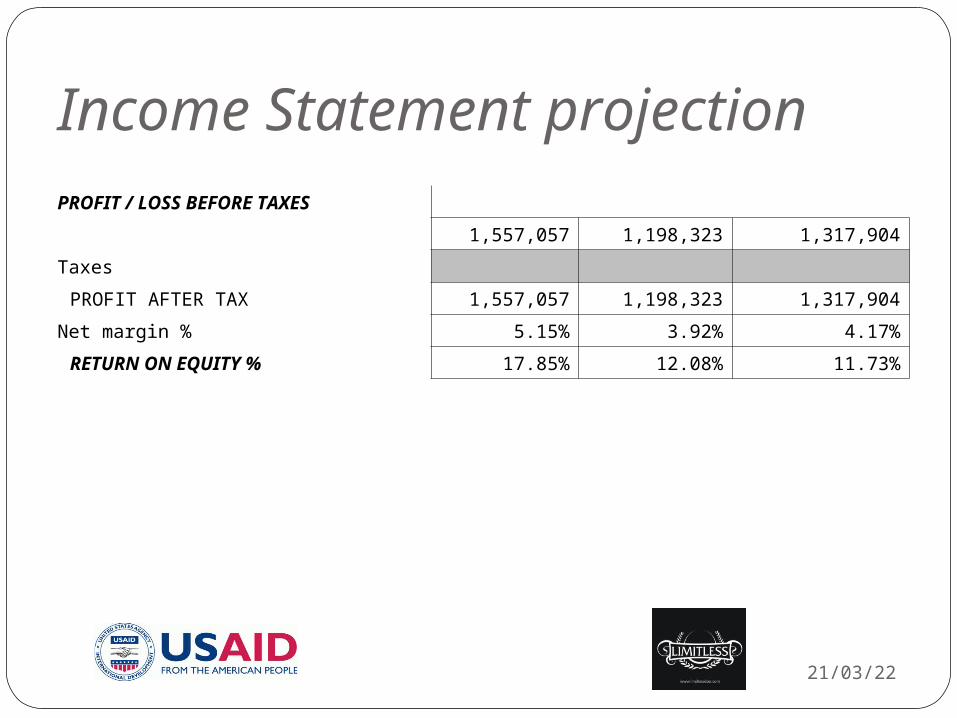
Income Statement projectionPROFIT / LOSS BEFORE TAXES
1,557,057 1,198,323 1,317,904
Taxes
PROFIT AFTER TAX 1,557,057 1,198,323 1,317,904
Net margin % 5.15% 3.92% 4.17%
RETURN ON EQUITY % 17.85% 12.08% 11.73%
18/04/23
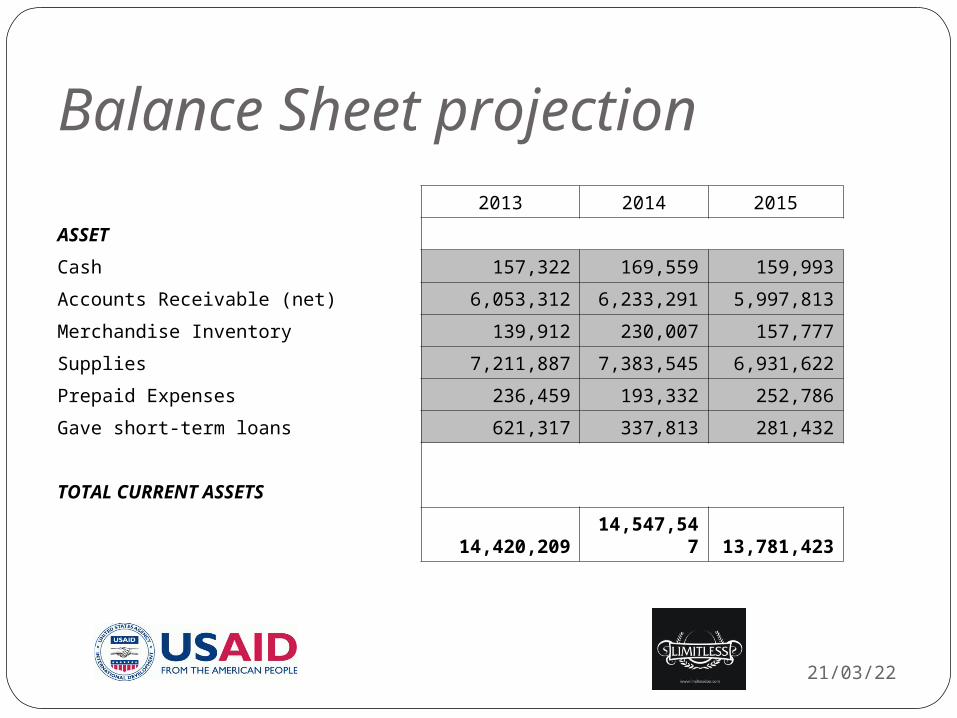
Balance Sheet projection2013 2014 2015
ASSET
Cash 157,322 169,559 159,993
Accounts Receivable (net) 6,053,312 6,233,291 5,997,813
Merchandise Inventory 139,912 230,007 157,777
Supplies 7,211,887 7,383,545 6,931,622
Prepaid Expenses 236,459 193,332 252,786
Gave short-term loans 621,317 337,813 281,432
TOTAL CURRENT ASSETS
14,420,209 14,547,547 13,781,423
18/04/23
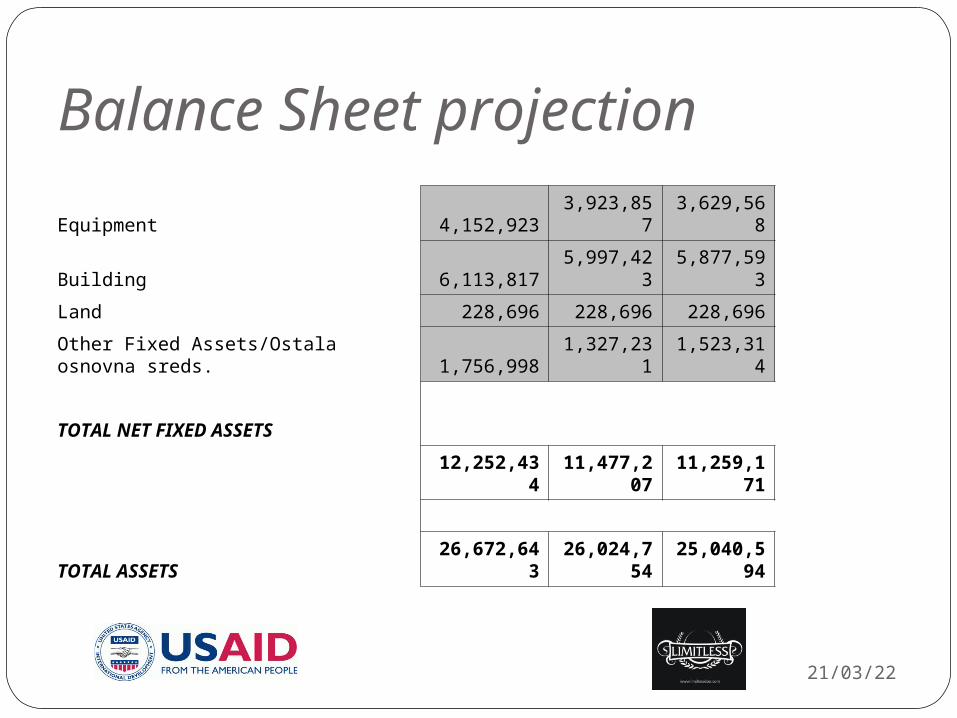
Balance Sheet projectionEquipment 4,152,923 3,923,857 3,629,568
Building 6,113,817 5,997,423 5,877,593
Land 228,696 228,696 228,696
Other Fixed Assets/Ostala osnovna sreds. 1,756,998 1,327,231 1,523,314
TOTAL NET FIXED ASSETS
12,252,434 11,477,207 11,259,171
TOTAL ASSETS 26,672,643 26,024,754 25,040,594
18/04/23

Balance Sheet projectionLIABILITIES
Accounts Payable 4,077,222 4,232,654 4,142,783
Taxes Payable 839,558 897,356 898,680
Short-term Loans Payable 5,024,686 5,188,776 4,761,686
Other current liabilities 798,321 807,496 812,250
TOTAL CURRENT LIABILITIES
10,739,787 11,126,282 10,615,399
Long-term Loans 7,101,378 4,886,741 3,159,490
Other Long Term Liabilities 110,400 92,330 28,400
LONG TER. LIABILITIES
7,211,778 4.979.071 3,187,890
TOTAL LIABILITIES 17,951,565 16,105,353 13,803.289
18/04/23
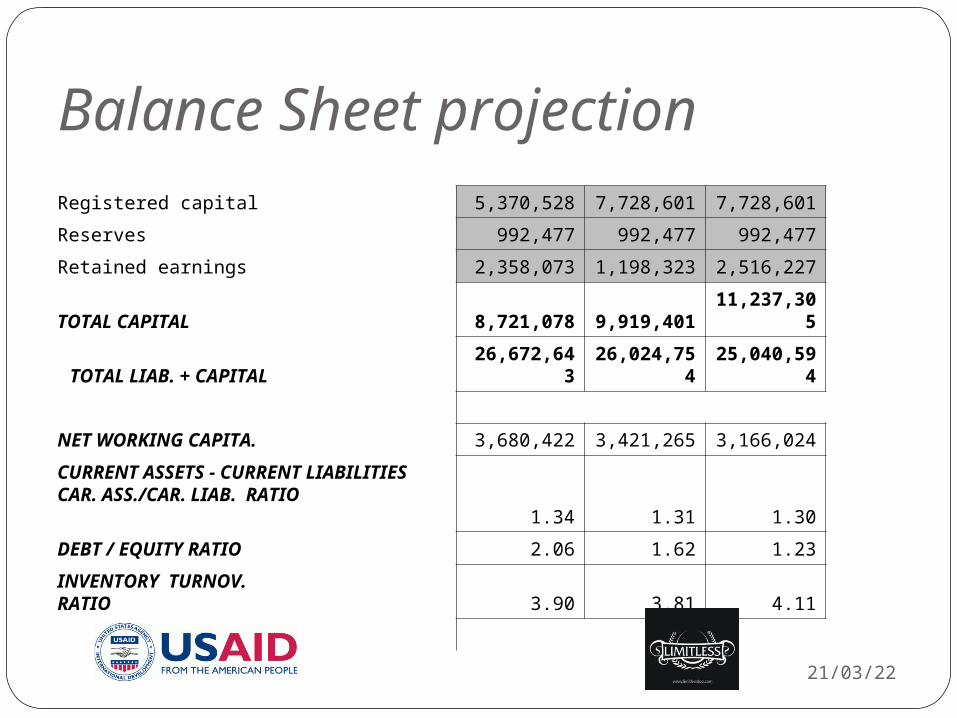
Balance Sheet projectionRegistered capital 5,370,528 7,728,601 7,728,601
Reserves 992,477 992,477 992,477
Retained earnings 2,358,073 1,198,323 2,516,227
TOTAL CAPITAL 8,721,078 9,919,401 11,237,305
TOTAL LIAB. + CAPITAL 26,672,643 26,024,754 25,040,594
NET WORKING CAPITA. 3,680,422 3,421,265 3,166,024
CURRENT ASSETS - CURRENT LIABILITIES CAR. ASS./CAR. LIAB. RATIO 1.34 1.31 1.30
DEBT / EQUITY RATIO 2.06 1.62 1.23
INVENTORY TURNOV. RATIO 3.90 3.81 4.11
18/04/23
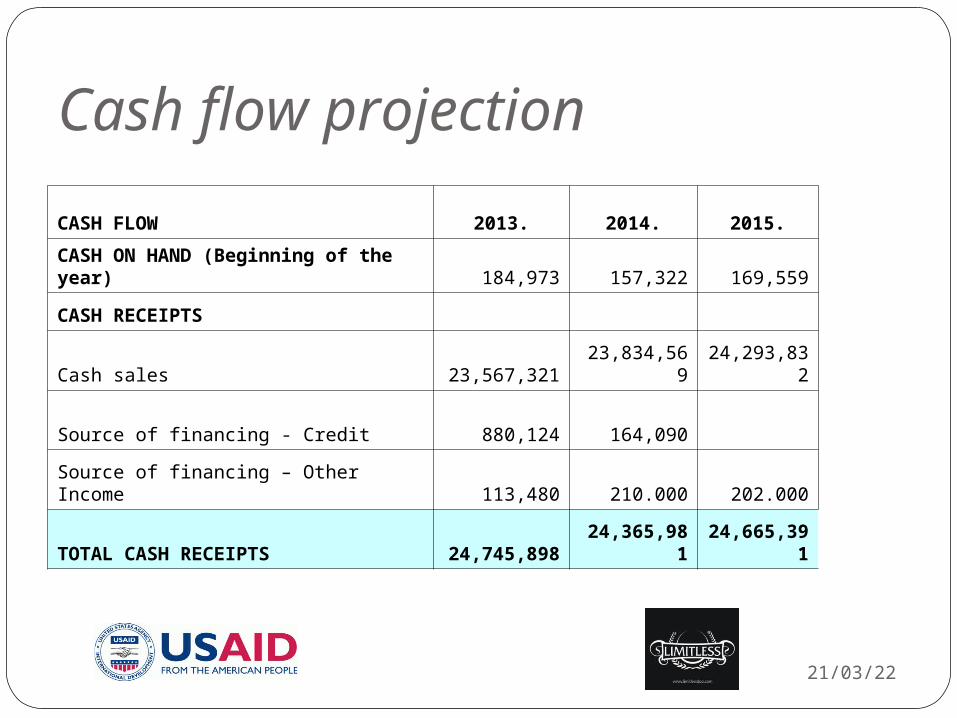
Cash flow projection
CASH FLOW 2013. 2014. 2015.
CASH ON HAND (Beginning of the year) 184,973 157,322 169,559
CASH RECEIPTS
Cash sales 23,567,321 23,834,569 24,293,832
Source of financing - Credit 880,124 164,090
Source of financing – Other Income 113,480 210.000 202.000
TOTAL CASH RECEIPTS 24,745,898 24,365,981 24,665,391
18/04/23
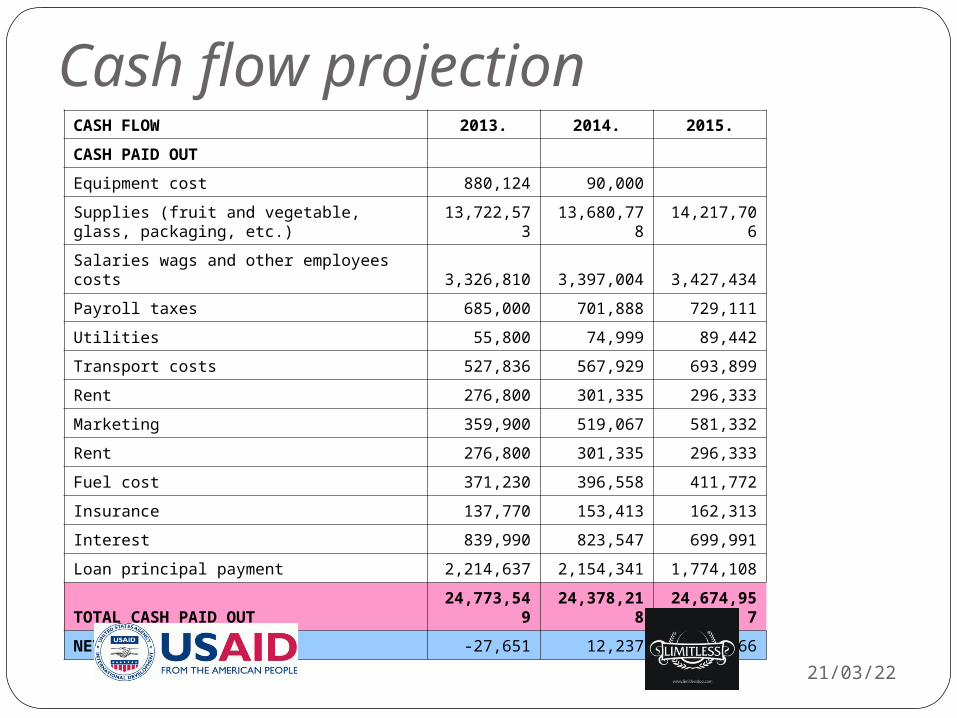
Cash flow projectionCASH FLOW 2013. 2014. 2015.
CASH PAID OUT
Equipment cost 880,124 90,000
Supplies (fruit and vegetable, glass, packaging, etc.) 13,722,573 13,680,778 14,217,706
Salaries wags and other employees costs 3,326,810 3,397,004 3,427,434
Payroll taxes 685,000 701,888 729,111
Utilities 55,800 74,999 89,442
Transport costs 527,836 567,929 693,899
Rent 276,800 301,335 296,333
Marketing 359,900 519,067 581,332
Rent 276,800 301,335 296,333
Fuel cost 371,230 396,558 411,772
Insurance 137,770 153,413 162,313
Interest 839,990 823,547 699,991
Loan principal payment 2,214,637 2,154,341 1,774,108
TOTAL CASH PAID OUT 24,773,549 24,378,218 24,674,957
NET CASH FLOW -27,651 12,237 -9,566
18/04/23
Cash flow projection
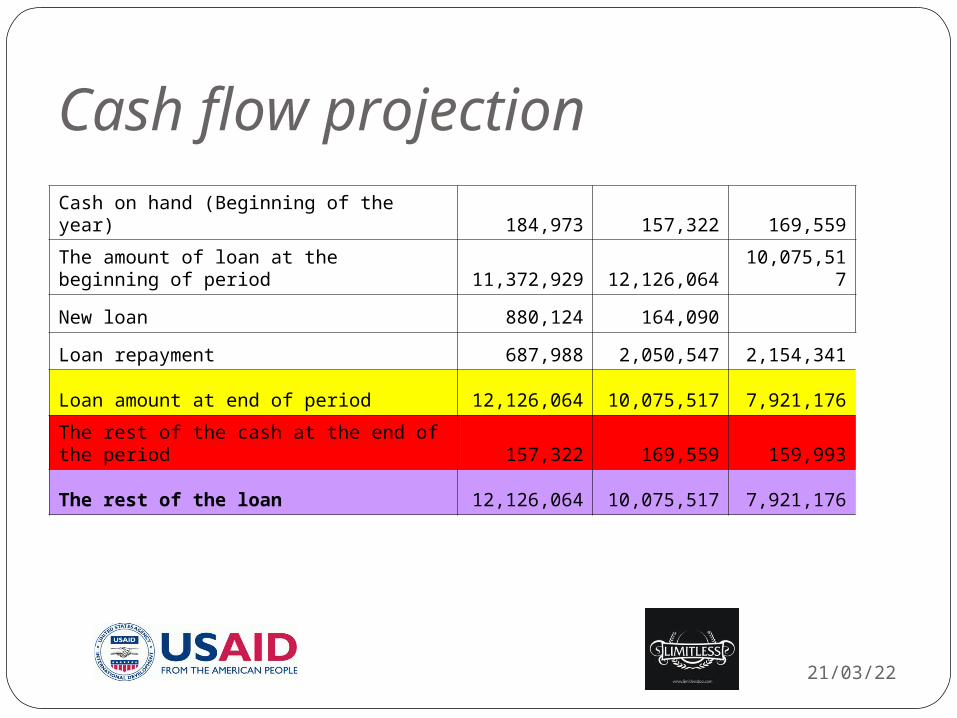
Cash on hand (Beginning of the year) 184,973 157,322 169,559
The amount of loan at the beginning of period 11,372,929 12,126,064 10,075,517
New loan 880,124 164,090
Loan repayment 687,988 2,050,547 2,154,341
Loan amount at end of period 12,126,064 10,075,517 7,921,176
The rest of the cash at the end of the period 157,322 169,559 159,993
The rest of the loan 12,126,064 10,075,517 7,921,176
18/04/23
Needs, possibilities, development goals
18/04/23
In order to stay in business and in the market, company has to develop continuously and to invest constantly, as even the smallest pause in company development, can create loss of business capability; therefore, investment in development is an imperative of business policy.
There are all preconditions to implement development goals: market for products, team of experts, lead by the general manager, who can implement development goals, facilities, production equipment, production infrastructure, location, etc.
Internationalization of company business, international quality standards, assortment structure and personnel has created conditions for company to join European integrations without problems.
Conclusion
18/04/23
The main guarantee for continuous maintenance of creditworthiness is quality organization, planning of all processes in the company, monitoring and analysis of realization and adjustment of demands and obligations according to the height and deadline, as well as adjustment of relationships in funds and resources of funds according to the horizontal and vertical structure.
18/04/23
Thank you …Thank you …