farmers producer organizations in india · mostly producer companies in india, to understand the...
TRANSCRIPT

A Study Report
21st February, 2016
FARMERS’ PRODUCER ORGANIZATIONS IN INDIA
Institute of Livelihood Research and Training Hyderabad
ii
Contents
Acknowledgments .................................................................................................................................. iii
Abbreviations ......................................................................................................................................... iv
Executive Summary ................................................................................................................................ vi
1. Introduction to the Study ........................................................................................................ 1
1.1. Background of the study ......................................................................................................... 1
1.2. Need for the Study .................................................................................................................. 2
1.3. Objectives of the study ............................................................................................................ 2
1.4. Methodology Adopted ............................................................................................................ 2
2. Significant Observations and Findings ..................................................................................... 6
2.1. Basic Profile (of the 22 FPO reports analysed) ........................................................................ 6
2.2. Reach and Coverage ................................................................................................................ 7
2.3. Business Mix and Performance ............................................................................................... 8
2.4. Governance ........................................................................................................................... 10
2.5. Capability ............................................................................................................................... 12
2.6. Capital .................................................................................................................................... 20
2.7. Business Processes and Systems ........................................................................................... 23
3. Overall Maturity in Terms of Capital and Capability ............................................................. 27
4. Assessed Score for Capital and Capability for Enterprise (ASCENT) of an FPO .................... 28
4.1. Business Mix .......................................................................................................................... 28
4.2. Capital .................................................................................................................................... 30
4.3. Board Capability .................................................................................................................... 31
4.4. Staff Capability ....................................................................................................................... 33
4.5. External Environment ............................................................................................................ 35

iii
Acknowledgments
This study was carried out by a team led by Ms Rama Kandarpa, Vice-Dean, Institute of
Livelihood Research and Training (ILRT).
The study was anchored by Ms Rashmi Adlekha and she also carried out the initial field
survey, which led to the design of the guidance for and supervision of the field survey by six
students of the Institute of Rural Management, Anand (IRMA) - Nishchal Jain, Piyush Singh,
Haritha S K, Aveek Biswas, Krishna Mohan Gupta and Mangesh Kapgate. Rashmi then
supervised the data analysis and drafted the initial report. Ms Mona Dikshit supported
Rashmi in several of the above activities and also in the second review of the report.
The authors would like to thank Dr Jeemol Unni, Director, IRMA for not only offering the
IRMA post-graduate students for field work, but also inviting all the team members of this
study to IRMA for a workshop on Farmers’ Producer Organisations.
Comments on the field study report and earlier drafts were received from Dr Sankar Datta,
Dr Gouri Krishna, Dr Tabrez Nasar, Mr Manab Chakraborty and Mr GA Swamy and are
gratefully acknowledged.
The instrument ASCENT of an FPO for assessing the evolutionary maturity of an FPO was
designed by Ms Rashmi Adlekha under the guidance of Mr Vijay Mahajan. This was partly
based on a 2014 paper written by Mr Vijay Mahajan on FPOs, which posited the “capital-
capability double helix” as the evolutionary path for an FPO and partly on the insights
gained during the field work.
iv
Abbreviations
AGM: Assistant General Manager
AKPC: Aman Kisan Samruddhi producer Company
AKPCL: Ankur Kisan Producer Company Limited
ALCI: Access Livelihood Consulting India Pvt. Ltd
AOA: Articles of Association
ASCPCL: Akola Soya and Cotton Producer Company Ltd
BASICS: Bhartiya Samruddhi Investments and Consulting Services
BCTS: BASIX Consulting and Technology Services
BDM: Business Development Manage
BSFL: BHARTIYA SAMRUDDHI FINANCE LIMITED
CCD: Centre for Collective Development
CEO: Chief Executive Officer
CIKS: Centre for Information Knowledge Systems
DPIP: District Poverty Initiatives Project
DSC: Development Support Centre
FIG: Farmers’ Interest Group
FPC: Farmers’ Producer Company
FPO: Farmers’ Producer Organization
FWWB: Friends of Women’s World Banking
GDPCL: Gram Development Producer Company Ltd., Kannauj, Uttar Pradesh
HAMPCO: Hardoi Agriculture Marketing and Producer Company Private Limited
HVGPCL: Hooghly Vegetable Grower’s Producer Company Ltd, West Bengal
IFFDC: Indian Farm Forestry Development Cooperative Limited'
IGS: Indian Grameen Services
ILRT: Institute of Livelihood Research and Training
JKPCL: Jai Kisan Producer Company Limited
JVPCL: Johar Vegetable Producers Company Limited, Ranchi, Jharkhand
KPCL: Krushidhan Producer Company Ltd.
v
KVK: Krishi Vigyan Kendra
LSPs: Livelihood Service Provider
MACS: Mutually Aided Cooperative Societies
MAIDC: Maharashtra Agro Industries Development Corporation Ltd
MBA: Master of Business Administration
MIS: Management Information System
MOA: Memorandum of Association
MSP: Minimum support Price
NABARD: National Bank for Agriculture and Rural Development
NABFIN: NABARD Financial Services Limited
NCDEX: National Commodity & Derivatives Exchange
PMRMS: Prajamithra Rythu Mutually Aided Cooperative Societies
RIs: Resource Institutions
SCPCL: Soya and Cotton Producer Company Ltd.
SFAC: Small Farmers' Agriculture-Business Consortium
SHG: Self-Help Group
SMPCL: Samridhi Mahila Crop Producer Company Ltd
SRIJAN: Self-Reliant Initiatives through Joint Action
SRTT: Sir Ratan Tata Trust
UPBSN: Uttar Pradesh Bhumi Sudhar Nigam
VGAI: Vegetable Growers’ Association of India
WSCPCL: Wardha Soya and Cotton Producer Company Ltd
ZKSPCL: Zimmedar Kisan Samruddhi Producer Company Ltd

vi
Executive Summary
In the recent years, the focus of the Government of India, state governments and the
various development agencies has been towards promotion of farmers’ producer
organizations (FPOs). Many of the non government organizations (NGOs) in the country had
been facilitating formation of producer organizations and in the recent years and some of
them have graduated to facilitate formation of producer companies on behalf of the state
governments and development funding agencies. The key argument to the entire efforts is
to enhance the participation of small and marginal producers in the value chain and the
inherent potential of organizations of farmers to ensure such enhanced participation.
Institute of Livelihood Research and Training (ILRT) undertook a research study on FPO –
mostly Producer Companies in India, to understand the current status of FPOs, their
business and institutional development needs and the policy constraints which are impeding
access to finance. The research study covered a field sample of 39 FPOs across 11 states in
the country. Three types of FPOs based on the legal form were covered in the field sample:
Farmers’ Producer Companies (FPC, majority), Cooperatives, and Societies/Trusts. The
sample was also selected on the basis of nature of the promoting institution. Three types of
promoting institutions were covered: Government bodies, Not-for-profit entities and for-
profit entities. A team of six students from IRMA were involved for conducting the field
study. As part of the study methodology, each FPO was visited for 2-3 days and both
qualitative and quantitative information were collected from various stakeholders - internal
and external. Out of 39 FPOs studied, 22 FPOs were considered for the purpose of analysis –
which comprised 18 FPCs, one Apex Cooperative Federation, two Mutually Aided
Cooperative Societies (one each in AP and Karnataka), and one Trust.
About half of the FPOs were young, incorporated in or after 2013. Oldest two FPOs were
incorporated in 2006 and 2007. The modal range for number of shareholders was 1000-
2000. It was found that age of the FPO is not the determinant of the shareholder-base of the
FPO. FPOs which started with a good shareholder base of at least 1000 shareholders and a
sizable equity could easily establish their business in the first year itself.
All FPOs started their business with the input supply services to its shareholders. The
shareholders expressed their satisfaction in getting quality inputs at better prices and at the
door step in majority of the cases except in few where seed licence is yet to be possessed.
Input supply service as the flagship service of the FPO is found to be beneficial in creating
goodwill among its shareholders in its initial phase. But, as a FPO matures, the expectation
of shareholders enters the arena of marketing of the produce and value addition, as seen in
many older FPOs of three years above. Among the FPOs analysed, only eight FPOs were
involved in direct marketing of the produce and only two FPOs have started working on
value addition. Though the shareholders in many FPOs expressed their satisfaction over the

vii
quality of the services, barely 30% (less than one-third) of the total input requirement of a
shareholder is currently fulfilled through FPO.
It was found that less than two-fifth of the shareholders use the FPO services and around
three-fifth of the total users of the FPO services were non-shareholders. All these point to
the significance or otherwise of the FPO and its services to its’ Shareholders. It also shows
the scope for FPOs to widen and deepen their services. FPOs have Shareholders and
members spread across a number of villages.
All FPOs started with primary, smaller village level producer groups (commonly called FIGs).
The average size of the FIG was around 20 members. The Chart below summarises the
nature and activity-level of the FIGs.
Total 22 FPOs
6 FPOs not
working
16 FPOs that working and evolving
4 having serious
issues of
Governance
and/or FPC
becoming
inactive.
2 where there is
not enough or
valid data for any
kind of analysis.
14 FPOs where FIG is only or major VLI 2 FPOs where SHG is the
only kind of VLI
6 where
FIGs
inactive
8 where FIGs alive and active to
different extent
4 with FIGs
only
2 with FIGs and
other types of
VLI
In 14 of these working FPOs, FIGs are the only or major VLI, but in as many as 6 cases FIGs
have become inactive. In all of the above cases, the functioning of FIGs seems to be not a
necessary condition once the FPO is set up and working. On the other hand in the remaining
8 among the 14 established and working FPOs, FIGs come out as being relevant and robust.
Women SHGs (homogeneous thrift & credit affinity groups) as VLIs (along with or in place of
FIGs) also found suitable as farmer-producer groups for the purpose of FPOs, as are male
farmer-producer groups. With the added advantage that they give an opportunity to link up
with the many government schemes and benefits available for SHGs.
Even if FIGs are somewhat active, if there is a mixed membership of farmers from
economic/socially dominant backgrounds as well as marginalised/poor sections of society,
the former usually dominates the activities and agenda within the FIG as well as
viii
representing the FIG in the FPO. The weaker members are found to be quiet, inactive or
unaware though they may be availing of whatever services of the FPO they have access to.
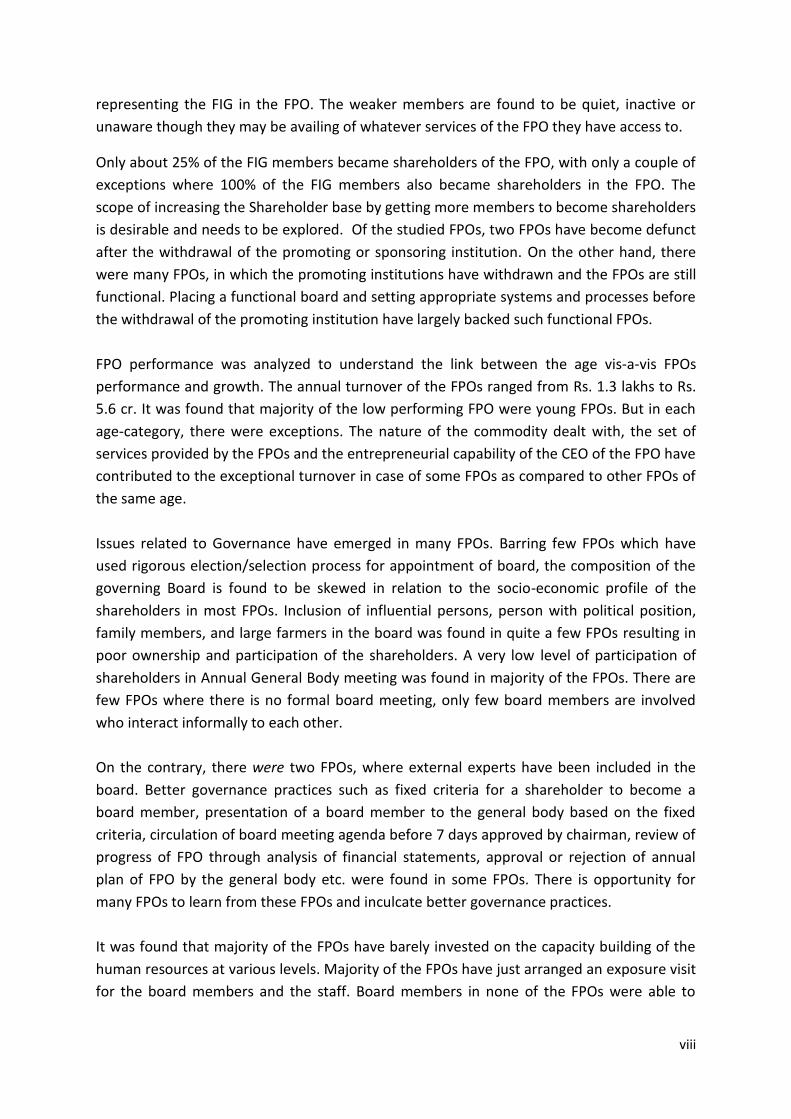
Only about 25% of the FIG members became shareholders of the FPO, with only a couple of
exceptions where 100% of the FIG members also became shareholders in the FPO. The
scope of increasing the Shareholder base by getting more members to become shareholders
is desirable and needs to be explored. Of the studied FPOs, two FPOs have become defunct
after the withdrawal of the promoting or sponsoring institution. On the other hand, there
were many FPOs, in which the promoting institutions have withdrawn and the FPOs are still
functional. Placing a functional board and setting appropriate systems and processes before
the withdrawal of the promoting institution have largely backed such functional FPOs.
FPO performance was analyzed to understand the link between the age vis-a-vis FPOs
performance and growth. The annual turnover of the FPOs ranged from Rs. 1.3 lakhs to Rs.
5.6 cr. It was found that majority of the low performing FPO were young FPOs. But in each
age-category, there were exceptions. The nature of the commodity dealt with, the set of
services provided by the FPOs and the entrepreneurial capability of the CEO of the FPO have
contributed to the exceptional turnover in case of some FPOs as compared to other FPOs of
the same age.
Issues related to Governance have emerged in many FPOs. Barring few FPOs which have
used rigorous election/selection process for appointment of board, the composition of the
governing Board is found to be skewed in relation to the socio-economic profile of the
shareholders in most FPOs. Inclusion of influential persons, person with political position,
family members, and large farmers in the board was found in quite a few FPOs resulting in
poor ownership and participation of the shareholders. A very low level of participation of
shareholders in Annual General Body meeting was found in majority of the FPOs. There are
few FPOs where there is no formal board meeting, only few board members are involved
who interact informally to each other.
On the contrary, there were two FPOs, where external experts have been included in the
board. Better governance practices such as fixed criteria for a shareholder to become a
board member, presentation of a board member to the general body based on the fixed
criteria, circulation of board meeting agenda before 7 days approved by chairman, review of
progress of FPO through analysis of financial statements, approval or rejection of annual
plan of FPO by the general body etc. were found in some FPOs. There is opportunity for
many FPOs to learn from these FPOs and inculcate better governance practices.
It was found that majority of the FPOs have barely invested on the capacity building of the
human resources at various levels. Majority of the FPOs have just arranged an exposure visit
for the board members and the staff. Board members in none of the FPOs were able to

ix
understand financial statements and critic on their financial progress. It was the same with
the CEO only a few had this capacity.
Accounting system which is considered to be the backbone of any enterprise was found to
be manual in majority of the cases. In cases where there is a computerized system, the
reports are not generated and used on regular basis. In majority of the cases, the bills for all
transaction are submitted to the external auditor once a year, who then prepares the audit
report along with all financial statements. In many cases, these financial statements are not
even looked at by the CEOs.
Six FPOs have done long term business planning. These plans were made for submission for
some project or to the sponsoring agency as a matter of deliverable. Probably, this is the
area in which all most all FPOs have to gear up. This goes hand in hand with the fact that
many FPOs have not applied for any loan. Two FPOs have advanced to taking up value
addition of produce.
On the capital front, three FPOs had not applied for any loan though they were 3+ years old.
The common thread among the three was the nature of the commodity dealt with - all three
were dealing with vegetables which were procured, transported and sold in nearby
wholesale and/or retail markets. The payment from sale of vegetables back to the farmer
was therefore very quick. The remaining FPOs had applied to public sector banks and
commercial banks for loans. From among 18 FPOs that applied for credit, four received
assistance from Ananya Microfinance and FWWB, four from banks and four received
working capital loan from NABARD and NABFIN.
Six FPOs had been denied credit from local banks. Lack of solid track record, lack of
awareness of bank officials about the new legal form, absence of any guidelines from
regional office to treat the producer company under priority sector, lack of collateral etc.
were some of the reasons for denial by the banks. FPOs found it more convenient to start
their relationship with Ananya Microfinance Pvt. Ltd, rather than go through the regular
banks. After an FPO has had few rounds of funding from Ananya, private sector banks such
as HDFC Bank, Yes Bank and others feel comfortable to extend financial support.
With the findings that emerged from the study, a growth trajectory for first five years of life
cycle of a FPO could be developed. A self assessment tool: “Assessed Score for Capital and
Capability for Enterprise (ASCENT) of an FPO was developed considering this emerging
growth trajectory. ASCENT of an FPO has five verticals with each vertical having variable and
parameters. For each parameter a maximum score and a benchmark score have been
assigned based on the age of the FPO. ASCENT will be useful for an FPO to assess its
performance, comparing its score with the bench mark score appropriate for its age.
Application of the Tool will provide pointers to FPOs on areas that need attention and focus.

1
1. Introduction to the Study
1.1. Background of the study
In India, the majority of cultivators are small farmers having land holding of less than two ha
and marginal farmers having land holding of less than one hectare. As revealed by
agricultural census data1, land holdings of less than two hectares constituted 41.14 percent
of the total cultivated land in 2005-06. Moreover, the share of cultivators holding land of
less than two hectares among the total cultivators in India was 83.29 percent in 2005-06.
Small and marginal farmers contribute significantly to the total value of crop output.
The Situation Assessment Survey of Farmers 2003 (NSS 59th Round) data shows that
marginal farmers account for 29 percent of total output and small farmers 22 percent of
total output. Small farms are characterised by low capital input and high labour and other
inputs, with a higher index of cropping intensity and diversification.
As the small farms struggle to get access to inputs, market and credit – they need a level
playing field to be able to compete with other market players on equal terms. Due to factors
beyond their control and absence of institutions to safeguard their interests, they are
unable to integrate with the agricultural value chains, fight the risks and vulnerabilities such
as commodity price volatility, crop failure, insect pest-attacks etc. on their own.
Collectivizing farmers into Producer Organizations (POs) has been considered as one of the
way to overcome these challenges faced by the small and marginal farmers.
Over the years, there has been a growing interest in promoting an enabling environment for
Farmers’ Producer Organizations. Several initiatives have been taken by the Government,
Apex financial institutions such as NABARD, private donor organizations, financial
institutions and many other institutions to support the growth of the FPCs and facilitate
their emergence as successful business enterprises. Under the 12th Five Year Plan of the
Government of India, promotion and strengthening of FPOs has been one of the key
strategies to achieve inclusive agricultural growth.
The Small Farmers’ Agri-Business Consortium (SFAC) particularly was mandated by the
Government of India to support formation of FPOs. “Equity Grant and Credit Guarantee
Fund Scheme, Minimum Support Price Support Programme for pulses and oilseed, and the
Support from the National Bank for Agriculture and Rural Development (NABARD) for
incubating 2000 FPCs, are some of the schemes and programmes of Government conducive
to promotion and nurturing of FPOs.
1 Government of India, Agricultural Census, 2011.

2
1.2. Need for the Study
Under the support of SFAC, altogether 801 FPCs have been promoted, of which 445 are
registered and rest are in the process of registration. Data on registered FPCs shows that
80% are concentrated in 10 states - Tamil Nadu, Madhya Pradesh, Uttarakhand, Telangana,
Maharashtra, Rajasthan, Uttar Pradesh, Assam, Gujarat and West Bengal. A similar pattern
is seen in FPCs which are in the process of registration. First hand information shows that
FPCs which have input licenses, mandi licenses and warehouse facility are only 21%, 21%
and 11% respectively. This data is an indicator of the proportion of active FPOs. Another
important data on SFAC supported FPCs is that only 26% of the FPOs have received
financing from banks.
As reiterated by many research studies conducted in past, there are varied levels of
performance of FPOs in the country. A research study to understand the current status of
the FPOs in the country focusing on their business and institutional development paths and
needs, and policy constraints, would not only help practitioners engaged in promoting such
FPOs but also the policy makers who are encouraging the promotion of FPOs. With this
thought, ILRT undertook a vertical study of a sample of FPOs spread across various states.
1.3. Objectives of the study
A vertical study of FPOs - mainly FPCs, was undertaken by ILRT during July-Aug 2015 with
following objectives:
To understand the business and institutional development paths and needs of FPOs and
to identify the suitable and varied practices adopted in their promotion and nurturing.
To understand the current institutional and financial capacity of FPOs to negotiate for
credit and term loans and to identify the institutional and policy constraints which are
impeding access to finance by FPOs.
1.4. Methodology Adopted
Secondary material such as previous research studies, policy papers, and process guidelines
on FPCs were studied. A sampling exercise was done for selection of the FPOs for field
study. Following were the selection criteria -
The FPO should be registered in or before year 2013.
Different legal forms of FPOs - Producer Companies, Coops and Trusts be covered.
The major commodity (ies) of the FPO should be from agriculture or agri-allied sector.
FPOs promoted by different type of promoting institution such as Government, Not-for-
profit and for-profit should be covered.
Adequate representation of total number of FPOs promoted in a state.

3
The FPO list of SFAC and list from NABCONS study were mainly used to set the universe for
the study. 39 FPOs were covered under the study spread across 11 states. Of the 39 FPOs,
18 were promoted by BASIX Social Enterprise Group (includes IGS and BCTS), while rest
were those promoted by other agencies.
A team of six students from IRMA supported ILRT to collect field level data through 2-3 days
visit to each FPO. An assessment framework focusing on the institutional aspect was
developed as a tool for the study. The framework was piloted in two FPOs of BASIX, one
promoted by IGS and another by BCTS. The framework was revised with the learning of the
pilot. A FPO financing questionnaire was also developed focusing on the financing aspect of
FPO. Both quantitative and qualitative information were collected from various stakeholders
such as FIG members, shareholders, board members, CEO, staff, Local Bank officials,
Government Department officials, suppliers and buyers of the FPOs.
Of the 39 FPOs visited, visit reports of 29 FPOs were received from the interns. Of these 29
FPOs, 22 FPOs were analysed. Of which 11 were promoted by BASIX entities and 11 by other
promoting agencies. A list of FPOs studied and analysed is given below.
Sl.
No FPO Studied State
Resource
Institution
Visit Report
Received
Analysis
Done
1 Panchali Farmer Producing
Company Uttar Pradesh BCTS yes Yes
2 Jaunpur Kisan Vikas Producer
Company Limited Uttar Pradesh BCTS yes Yes
State No of FPOs studied Promoting Institutions
Bihar 2 IGS
Jharkhand 1 IGS
West Bengal 4 IGS, ADS, Jamgoria Sevabrata
Madhya Pradesh 6 IGS, DPIP, PRADAN, IFFDC
Maharashtra 7 IGS, ALCI India, ISAP, AFARM,
VGAI, NWCYD
Rajasthan 5 IGS, SRIJAN, ADS, IFFDC
Gujarat 1 DSC
Uttar Pradesh 7 BCTS
Telangana 2 ALCI India, ISAP, CCD
Karnataka 3 ISAP, Vrutti
Tamil Nadu 1 CIKS
Total 39

4
Sl.
No FPO Studied State
Resource
Institution
Visit Report
Received
Analysis
Done
3 Jai Kisan Producer Company Limited Uttar Pradesh BCTS Yes Yes
4 Ankur Kisan Producer Company
Limited Uttar Pradesh BCTS Yes Yes
5 Nav Jyoyi Kisan Producer Company
Limited Uttar Pradesh BCTS yes Yes
6 Ahorwa Bhawani Farmer Producer
Company Limited Uttar Pradesh BCTS No No
7 Gram Development Producer
Company Ltd. Uttar Pradesh BCTS Yes Yes
8 Johar Vegetable Producers
Company Limited Jharkhand IGS yes Yes
9 Prakash Agro Producers Company
Limited Bihar IGS yes Yes
10 Samruddhi Sunhera Kal Krishak
Trust Bihar IGS yes Yes
11 Hooghly Vegetable Growers
Producer Company Limited West Bengal IGS yes Yes
12 Bhangar Vegetable Producer's
Company West Bengal
Access
Development
Services
yes Yes
13 Manbazar Agro Producer Company
Limited West Bengal
Sevabrata
Jamgoria yes No
14 Howrah Agro Producer Company
Limited West Bengal
Access
Development
Services
yes No
15 Narayangad Agro Producer
Company Ltd Maharashtra AFARM no No
16 Wardha Cotton and Soya Producers
Company Ltd Maharashtra IGS yes Yes
17 Akola Soya and Cotton Producer
Company Ltd. Maharashtra IGS Yes Yes
18 Shahapur Farmer Services Producer
Company Ltd Maharashtra ALCI yes Yes
19 Jailakshmi Farmers Producers
Company Ltd Maharashtra ISAP no No
20 Seloo Vibhag Baliraja Producer
Company Ltd. Maharashtra NIWYCD no No

5
Sl.
No FPO Studied State
Resource
Institution
Visit Report
Received
Analysis
Done
21 Junnar Taluka Farmers Producer
Company Ltd Maharashtra VGAI yes Yes
22 Jaikishan Souharda Multipurpose
Cooperative limited Karnataka ISAP No No
23 Negila Yogi Alland Farmers
Federation Karnataka ISAP Yes No
24 Nisarga Farmer Producer Company Karnataka Vrutti yes Yes
25 Marutham Sustainable Agriculture
Producer Company Limited Tamil Nadu CIKS Yes Yes
26 Prajamithra Raitu MAC Federation
Ltd Telangana CCD Yes Yes
27 Kodangal Farmer Producer
Company Telangana ALCI Yes Yes
28 Shri Kalyan Maharaj Dalhan
Producer Company Limited Rajasthan IFFDC yes Yes
29 KrushiDhan Producer Company Ltd Gujarat DSC yes Yes
30 Aman Kisan Surruddhi Producer
Company Ltd Rajasthan IGS Yes Yes
31 Ajaymeru Kishan Samruddhi
Producer Co. Ltd. Rajasthan IGS yes Yes
32 Samruddhi Mahila Crop Producer
Company Rajasthan SRIJAN yes Yes
33 Jaipur Veg Agro Producer Company
Ltd. Rajasthan
Access
Development
Services
No No
34 Zimmedar Kisan Samruddhi
Producer Company Limited
Madhya
Pradesh IGS Yes Yes
35 Balram Kisan Samruddhi Producer
Company Limited
Madhya
Pradesh IGS No No
36 Kisan Ekta Samruddhi Producer
Company Limited
Madhya
Pradesh IGS No No
37 Sironj Crops Producer Company
Private Limited
Madhya
Pradesh PRADAN No No
38 Kamtanath Krishak Producer
Company Limited
Madhya
Pradesh IFFDC No No
39 Hardoi Agricultural Marketing and
Producer Company Limited
Madhya
Pradesh DPIP Yes Yes

6
2. Significant Observations and Findings
2.1. Basic Profile (of the 22 FPO reports analysed)
Age of the FPO Legal Form Nature of the RI Years of engagement
of RI with farmers
prior to FPO
promotion
13 FPOs were
young
incorporated in or
after 2013
7 FPOs were
middle aged
incorporated
between 2011-
13.
2 FPOs were
older
incorporated
2006-07
21 PCs
1 MACS
In 13 FPOs, the RI
is a not-for profit
entity
In 6 FPOs, the RI
is a for profit
entity.
In three FPOs,
the RI is
Government
body
Less than two
years engagement
in case of 10 FPOs
3-5 years
engagement in
case of 6 FPOs
6-10 years
engagement in
case of 6 FPOs
No. of shareholders Type of
shareholding
Shareholding limit Primary Commodity
FPO is dealing with
Less than 500
shareholders- 8
FPOs
500-1000
shareholders- 5
FPOs
1000-2000
shareholders- 6
FPOs
More than 2000
shareholders-
three FPOs
20 FPOs with
individual
shareholding
2 FPOs with
individual and
institutional
shareholding
Only four FPOs
have fixed upper
limit on
shareholding per
shareholder
Oilseed, Pulses -
12
Vegetables – 4
Cereal – 3
Cattle feed – 1

7
Nature of RI: In three FPOs which were promoted by Government agencies, better
convergence with the Government schemes was found as compared to FPOs promoted by
non-Government institutions. Government schemes were tapped for creation of
infrastructure facilities like godown, cold storage, vehicles, etc. One FPO had a written
Agreement with the Agriculture department to produce and supply soya seed to all the-
promoted agricultural cooperatives. This gave the FPO an assured large market for its seed
production activity. This contributed to the high turnover and profitability of the FPO to a
great extent. On the other hand, these three FPOs are subject to some level of interference
and influence of the Government promoter which had negative impacts on the overall
functioning of the FPOs. For example, in one of FPOs the annual audit was not done for last
two years. The FPO is largely a one- man show. In another case, the recruitment of CEO is
influenced by Government officials, though unofficially.
Where the RI was engaged with the farmers prior to the FPO promotion for a considerable
period of 5-6 years, the FPO promotion has been taken up as the logical next step in the
activities with the same farmers.
Shareholding Pattern: In the analysis of number of shareholders across FPOs of various ages,
it was found that age was not a determinant of number of shareholders in a FPO.
Shareholders of more than 2000 were found in all age groups of FPOs (young, middle-aged
and older). The modal range for shareholder was found 1000-2000. This showed that it is
possible for the FPO to start with a good shareholder base of at least 1000. The FPOs which
were started with a good shareholder base and equity could easily settle down in their
businesses in the first year itself.
2.2. Reach and Coverage
Operational Area:
In majority of the FPOs analyzed, the FPO was operational in a contiguous area within one
district, covering less than 50 villages dispersed over 1-2 blocks, there is just one exception
where the FPO works with Shareholders spread across 7 blocks of four districts. The NGO
had been working for many years with the farmers in these areas under successive evolving
programs, and it made strategic sense to work with the same farmer base and graduate into
organising them under a single FPC, with a centrally located head office.
Coverage of Members and Shareholders in FIGs and FPOs:
In majority of the FPOs, farmers were mobilized at the primary village level coming together
as members of farmers’ interest groups (FIGs) of different kinds (detailed in Section 2.5). On
an average three FIGs were promoted in each village, with an average of 20 members per
FIG. FIG members interested to join FPO become shareholders of the FPO. About 25% of the
members became shareholders of the FPO. There were few FPOs that were exceptions
where 100% of the FIG members became shareholders of the FPO. Rigorous meeting by the
8
RI in each FIG was done which led to high inclusion of FIG members in these FPOs. This
reinforces the potential to increase the shareholder base from a FIG covering maximum
number of FIG members.
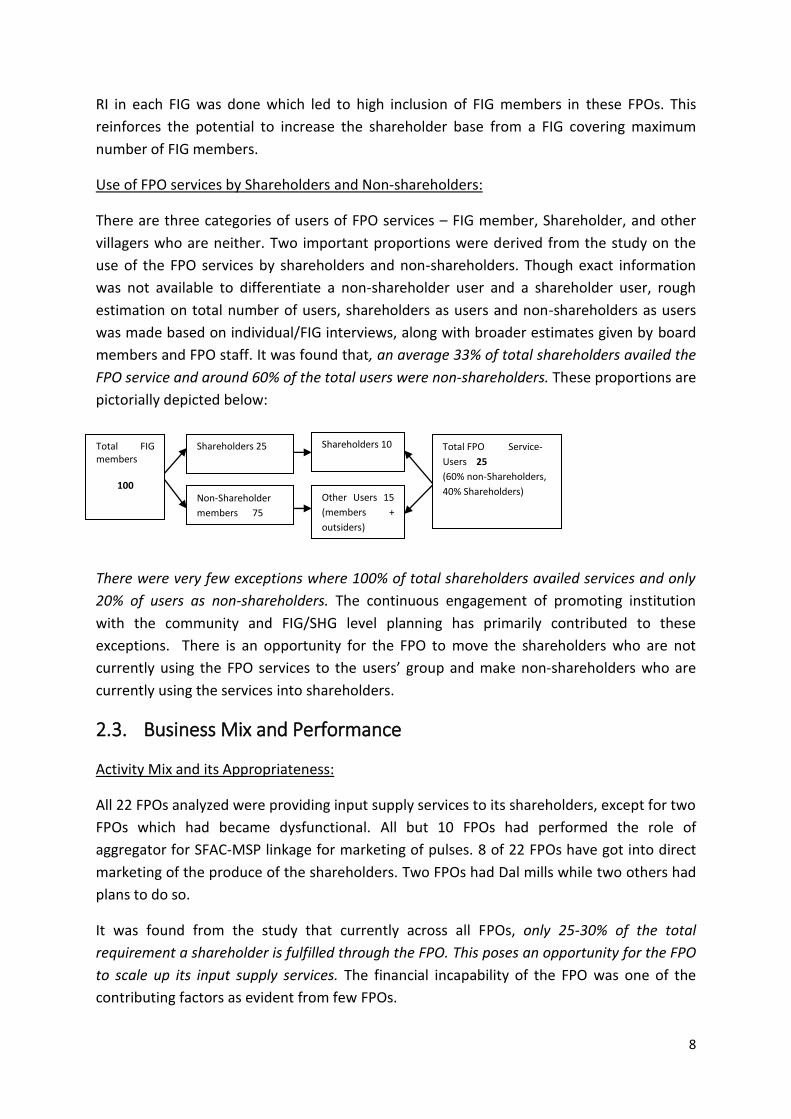
Use of FPO services by Shareholders and Non-shareholders:
There are three categories of users of FPO services – FIG member, Shareholder, and other
villagers who are neither. Two important proportions were derived from the study on the
use of the FPO services by shareholders and non-shareholders. Though exact information
was not available to differentiate a non-shareholder user and a shareholder user, rough
estimation on total number of users, shareholders as users and non-shareholders as users
was made based on individual/FIG interviews, along with broader estimates given by board
members and FPO staff. It was found that, an average 33% of total shareholders availed the
FPO service and around 60% of the total users were non-shareholders. These proportions are
pictorially depicted below:
100
There were very few exceptions where 100% of total shareholders availed services and only
20% of users as non-shareholders. The continuous engagement of promoting institution
with the community and FIG/SHG level planning has primarily contributed to these
exceptions. There is an opportunity for the FPO to move the shareholders who are not
currently using the FPO services to the users’ group and make non-shareholders who are
currently using the services into shareholders.
2.3. Business Mix and Performance
Activity Mix and its Appropriateness:
All 22 FPOs analyzed were providing input supply services to its shareholders, except for two
FPOs which had became dysfunctional. All but 10 FPOs had performed the role of
aggregator for SFAC-MSP linkage for marketing of pulses. 8 of 22 FPOs have got into direct
marketing of the produce of the shareholders. Two FPOs had Dal mills while two others had
plans to do so.
It was found from the study that currently across all FPOs, only 25-30% of the total
requirement a shareholder is fulfilled through the FPO. This poses an opportunity for the FPO
to scale up its input supply services. The financial incapability of the FPO was one of the
contributing factors as evident from few FPOs.
Total FIG members
100
Shareholders 25
Non-Shareholder
members 75
Total FPO Service-
Users 25
(60% non-Shareholders,
40% Shareholders)
Shareholders 10
Other Users 15
(members +
outsiders)

9
The FPOs which are into direct marketing were not able to provide marketing services only to
a limited number of their farmers because of the financial constraint. In operational area of
some of the FPOs, the real need of the area as expressed by the shareholders was to
provide marketing support to the farmers with required infrastructure like cold storage,
warehouse etc. But these FPOs were still in the struggling phase to establish their business
because of lack of capital.
Activity Mix and Turnover:
A pattern that emerges in the activity mix is that the sooner the FPO enters into produce
marketing the sooner it achieved high turnover. 7 FPOs fall in the minimal turnover category
(ranging between Rs. 1.5 lakhs to Rs. 10 lakhs) as their main business is only input supply.
Age and Turn Over:
Among the older FPOs (incorporated in 2006 and 2007), both the FPOs could do annual
turnover of more than Rs. 2.5 cr. One FPO did business worth Rs 4.5 cr in 2013-14. Assured
market for its seed production activity had contributed to the high turnover of the FPO. The
FPO could establish linkages with cooperatives and agriculture departments to supply seeds
produced by its members. (Of this 70% was for outside supply and 30% seed sale was to its
own shareholders).
Among the middle aged FPOs (incorporated in 2011-12), two FPOs could cross the turnover
of Rs. 2.5 cr challenging the older FPOs. One FPO could do the maximum turnover of Rs. 5.6
cr in 2013-14 the highest of all FPOs. Three FPOs experienced a dip in their turnover over
last two years. The lack of appropriate pricing policy, sales policy and ability of the CEO to
take correct strategic decisions were few critical factors that contributed to the dip in the
turn over.
Among the young FPOs (incorporated 2013-14), one FPO exceptionally could attain the
highest turnover of Rs. 1.38 cr beating some of the middle aged FPOs. The major reason for
the high turnover was established marketing linkages and a huge network of input sellers.
The FPO passes all the slow moving stock to the other sellers in the area where such
products/item are high in demand. By this, the FPC was able to maintain the good inventory
turnover ratio and low material loss.
Commodity and Turnover:
FPOs which are primarily dealing with high value commodity (vegetables) as their major
commodities are likely to attain high turnover in lesser time as compared to FPO dealing
with cereals and pulses as their major commodities, as evident in case of three FPOs which
are purely dealing with vegetables.

10
2.4. Governance
Board Composition
In most cases the number of Board members in the FPO is between ten to twelve members,
except two cases with 15-16 members.
Three FPOs have one or two external professionals such as agricultural expert, senior staff of
RI, representative from KVK on their Boards. In another case, the RI has constituted an
Advisory Board to the FPO Management, comprising persons from RI.
Three FPOs were all-women FPO with 100% shareholders and all board members as women.
Apart from these there were two FPOs with a considerable proportion of women
shareholders. In these two FPOs, the proportion of women shareholders to the total
shareholders was 59% and 33% respectively. In these two FPOs, more than 50% of the
board members were women. In some FPOs there are 1 or two women on the Board, they
were recently included to comply with SFAC guidelines.
Board Appointment Process
Eleven FPOs broadly followed a bottom-up election/selection process from village level
(FIG/SHG) to an intermediate level (Cluster of FIGs/SHGs) leading up to representation and
selection/election on the FPO Board. At the FIG level one representative is usually
unanimously selected (only in few cases is there an election at this level) to a geographical
cluster-level body of representatives. This number of representatives in the cluster level
body is much more than the required number of Board members (around 10-12 members).
At the cluster level body which may go up to 60-75 members, usually elections were held to
constitute the FPO Board.
In some FPOs, the RI played an active role in filtration, interviews, or selection of Board.
External agencies like the local KVK or other relevant Government agency was also called
upon to be part of the selecting jury as in the case of one FPO. In one FPO, the selection of
board from cluster body was rigorous through a three day long extensive selection exercise,
closely conducted and monitored by the RI. The FPO with the facilitation of RI had fixed 11
selection criteria for board. Except for this FPO, no FPO had fixed any criteria for a board
member. The unofficial criterion for a shareholder to become board member in many cases
was that the board member needs to invest lot of time on voluntary basis which results in
inclusion of the more influential and resourceful shareholders in the Board.

11
For FPOs where such bottom up approach was not followed, distrust could be seen at the
level of the FIGs and shareholders for the FPOs governance. As expressed by the
shareholders of one FPO, Chairman receives undue favors from the Board. The Gram
Panchayat heads always were selected because of the unquestionable power they yielded. There were 5 FPOs where the process of selection of the Board member and constitution of
the Board were different, but what was common among them was that it was not
transparent or representative and led to elite capture, poor institutional development and
in few cases no take off of business activity. In these FPOs, the unofficial criterion of board
member was the ability and willingness to contribute as equity at least 50 times of the
equity put by a single shareholder. In one of these FPO, few board members are politically
active and in another four members were from the same family.
In one FPO, although the Board member elections occurred without controversies in the
AGM, all the Board members were only from among 15 (out of 117) FIGs. In the governance,
business and institutional activities, only these 15 FIGs were closely involved with and fully
benefit from the FPO. Some of the above FPOs have their business activities running well,
but the FPO is more like a limited private enterprise.
Roles and Responsibilities of Board
In half the studied FPOs, the board members are involved in day to day activities like input
demand generation, distribution, stock maintenance etc. which they perceive as their core
roles and responsibilities. These eleven FPOs do not have village level staff.
Board meeting and agenda
Of the 22 FPOs which were analysed, in case of four FPOs the board does not meet on
regular basis. In two cases, the FPOs were defunct. In other two cases, only 2-3 board
members were involved and there was not a much felt need by the board members to have
a formal meeting. The impact of a weak board could easily be reflected through poor
business performance and a sceptical image of the FPOs in the local area. Moreover
decisions that should be taken in the AGM / Board like appointment, reappointment or
termination of a board member were being taken independently by a handful of active
Board members.

12
In the remaining FPOs where the board meetings are conducted, usually items related to
monthly transactions, seasonal planning and general day to day affairs are discussed. Issues
like long term business planning, membership increase, funds mobilisation are rarely on the
agenda. There is no prior circulation of agenda of board meeting to the members. three
FPOs were an exception to this. Inclusion of external expert on board was common to these
three FPOs. Better board meeting proceedings could be said to be a direct outcome of this.
Practices such as circulation of board meeting agenda 7 days prior to board meeting with
approval of Chairman, discussions based on the analysis of financial statements were
specific to these FPOs.
Annual General Body Meetings
Annual general body meetings are conducted for the sake of compliance, not with an
objective of report to the general body in majority of the cases. This can be inferred from
the low participation of the shareholders in the annual general body meetings. The reason
for non-participation cited by the shareholders was that they were informed just one day
before the AGM with no prior circulation of the agenda. Few malpractices related to fulfilling
the quorum for AGM was also found, though in very few cases. The AGMs were mostly one-
sided with either the CEO or RI presenting the audited financial statements and audit report.
Shareholders’ speak or clarification sessions were not included by design.
Compliance: Annual financial audit has not been conducted on time in most of the FPOs. As
a result, the FPOs have had to pay a penal fee also. In some cases, the audit was conducted
beyond the prescribed time period. In three FPOs, the annual audit was not done for the last
two years. In some cases, even after two years of incorporation, seed licence is not taken by
the FPO.
2.5. Capability
2.5.1 General Body of the FPO: Farmer-Members and Shareholders across villages:
As mentioned earlier mostly the FIGs/SHGs membership ranges from 10-20 members, all
coming together in a FPO with a total membership base which has a wide range from over
1000 to 16000. Most FPOs had membership in the order of over 1000 up to 3000. Only
around 25% FIG members became shareholders of the FPO. There is one exception where
100% of the FIG members are also FPO shareholders. There are two more FPCs where the
almost all FIG members are Shareholders too.
The reasons for the gap between members in the FPO to become Shareholders could not be
systematically analysed. Broadly two reasons came out for this (1) not all members are
aware or interested enough to become a shareholder and are satisfied availing FPO services.
(2) Caste and political divides also play a role in determining membership in a FIG and
becoming Shareholder in the FPO.

13
2.5.2 Shareholders
The connection of the FPO with the majority of shareholders is observed to be weak. In
most cases the awareness of the shareholders about the FPO activities is found to be quite
low. Many shareholders equate the FPO with an input supply shop. Participation in Annual
General Meetings is quite low. Only in two FPOs was a clear instance of active and
democratic participation in the AGM was articulated.
An investment in building the awareness of the shareholders about the concept and
functioning of FPO was found only in 7 FPOs analyzed. In three FPOs, the shareholders were
also aware of the long term vision of the FPO. The reason cited was constant visit by
company staff to the shareholders and their participation in planning. Training received by
the shareholders is mostly related to productivity enhancement under some project of the
Resource Institution. No exposure visit or training programmes was arranged for
shareholders in relation to FPO functioning except for two FPOs.
2.5.3 Primary Producer Groups at the Village level (Village Level Institutions/PGs)
Types of VLIs
A small producer group at the village level with 10-20 members is the form of primary
institution in almost all (19) FPOs. They go by varied names (Producer groups, Farmer
Interest Groups, Kisan clubs, Farmer Affinity Groups, Commodity Cooperatives and CIG).
Five FPOs among these had Women Farmer Groups also among these FIGs. There are two
FPOs which have 100% women FIGs, while there are another two which have over 50%
women FIGs.
One FPO has only SHGs (and no FIGs) as the primary institution. This is due to the fact that
the RI had SHGs developed and working prior to the formation of the FPC and the SHG form
also worked well as a FIG for the purpose of FPC formation and operations. Four FPOs have
more than one kind of VLI (FIGs and SHGs) both of whose members are shareholders and
participate in the FPO. Among these in one case, the CIGs which were initially prominent
have given way predominantly to SHGs for company operations as it was found to work
better. In another case, the FIGs includes Men SHGs , Women SHGs, Joint liability groups
and farmers' clubs, with WSHG and Men SHG being the majority VLIs. The idea behind the
different types of groups was to enable linkage under suitable NABARD programs in future.
In another case, out of total present 5880 shareholders, over a 1000 SHG member joined up
subsequently when the RI started operations in a new and tribal area thus adding a women
and pro-poor focus in the FPO. In the older Kisan club areas also the formation and inclusion
of women SHG members and Shareholders is being promoted since past few years. In one of
the FPOs, apart from FIGs (commodity Cooperatives) the federation simultaneously
promoted thrift and credit cooperatives where savings and internal lending took place, even
though these are formally not linked with the FPO.
14
Thus we see that Women SHGs (homogeneous thrift & credit affinity groups) as VLIs (along
with or in place of FIGs) also are suitable as farmer-producer groups for the purpose of FPOs,
as are male farmer-producer groups. With the added advantage that they give an
opportunity to link up with the many government schemes and benefits available for SHGs.
Intermediary Institutions between FIGs and the FPO
In seven FPOs the presence of intermediary institutions at the level of a cluster of
villages/FIGs, which link the members/FIG at the village and the FPO Board and operations,
is clearly articulated and present. They go by various names such as Cluster Level
Committee, Representative General Body and Cluster Agriculture Development Committee.
The Cluster Committee plays the role of taking decisions for the FIGs and is also vital for
selection/Election of FPO-Level Board Members from among the leaders who represent the
FIGs at the Cluster level.
There is one unique case of an intermediary organisation: The FPO has SHGs at the village
level and a VDC at the cluster level of 4-5 villages. Each SHG registers as member of its VDC
with minimum fees of Rs. 500 and monthly saving of minimum Rs 50. VDC also lends to
SHGs as well as FPO. VDC are also institutional shareholders in the FPC. The VDC evolved like
this: Earlier they had Service Providers to service CIGs/SHGs and obtain demand from
farmers for the company on commission basis. Due to failure of Service Provider model, the
company decided to make VDC an institutional buyer, so that some of the aggregation
operation of demand collection can be done at VDC level.
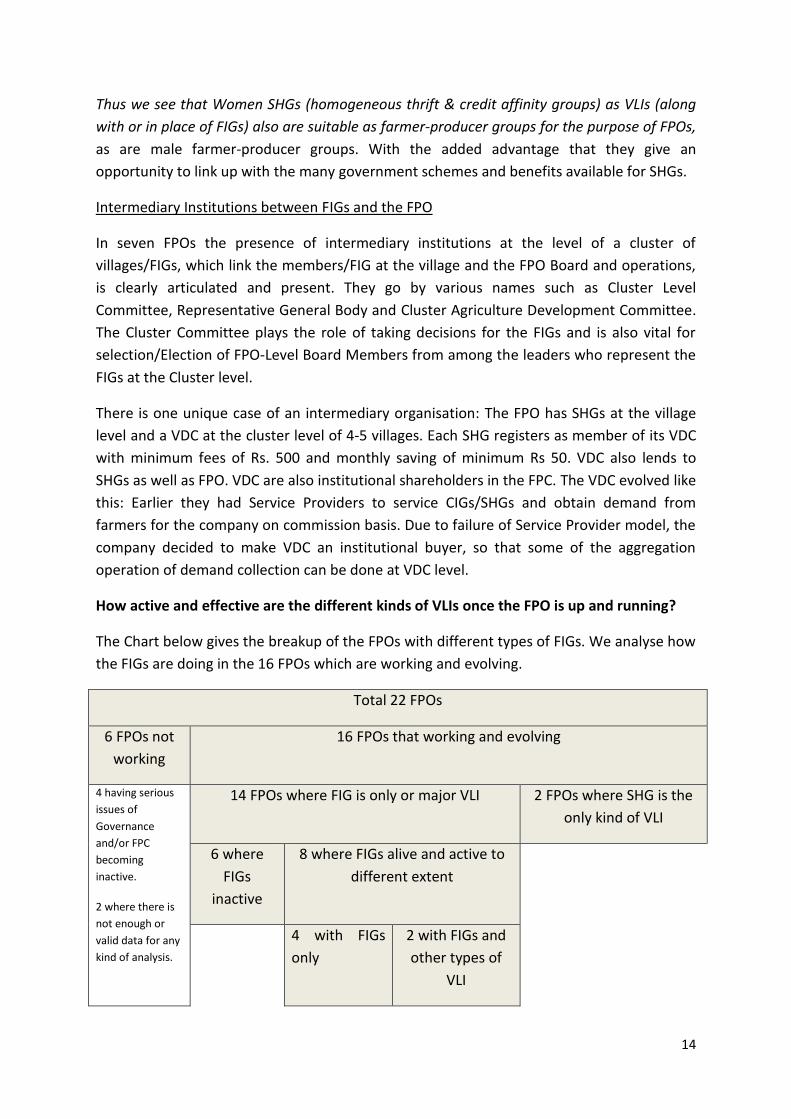
How active and effective are the different kinds of VLIs once the FPO is up and running?
The Chart below gives the breakup of the FPOs with different types of FIGs. We analyse how
the FIGs are doing in the 16 FPOs which are working and evolving.
Total 22 FPOs
6 FPOs not
working
16 FPOs that working and evolving
4 having serious
issues of
Governance
and/or FPC
becoming
inactive.
2 where there is
not enough or
valid data for any
kind of analysis.
14 FPOs where FIG is only or major VLI 2 FPOs where SHG is the
only kind of VLI
6 where
FIGs
inactive
8 where FIGs alive and active to
different extent
4 with FIGs
only
2 with FIGs and
other types of
VLI

15
In 14 of these working FPOs, FIGs are the only or major VLI, but in as many as 6 cases FIGs
have become inactive. Various activities were initiated like regular meetings, member
saving, maintaining records, opening bank account etc. In one FIG interview it was said
‘There is no regularity in meetings of FIG. They discuss everything under sun when people
gather around the common place” Due to lack of attendance or agenda in meetings, lack of
awareness of the role of FIG, no sustained activity, conflicts among members, dominance of
one group over another etc.; the FIGs have become inactive. There have been opportunities
like linking under ATMA Scheme, getting Bank linkage, starting a group enterprise etc., but
they have not been harnessed. FIGs role is only transactional, with members interfacing with
their FIG/FPO during farming seasons for business: demand estimation, procurement and
aggregation of produce for sale, distribution of inputs, payments, trainings etc.
Among these 6 FPCs are two extreme cases. In one case, only 15 out of its 117 FIG’s are
closely linked with the FPO and they are very efficient and active. Its’ members are engaged
in business as well as governance. The Board believes that it cannot work with all the FIGs
and took the call of leaving out the FIGs, which would not support the Board in its ventures.
In another case, the FPC cum RI Chairman is very resourceful, and is a one-man-show who
developed and runs the FPC well with his patronage, resources and staff of the promoting
institution. Members get benefitted by FPO role and services but the need for FIG seems to
have been obviated.
In all of the above cases, the functioning of FIGs seems to be not a necessary condition once
the FPO is set up and working. On the other hand in the remaining 8 among the 14
established and working FPOs, FIGs come out as being relevant and robust as we will see
below.
Two of the FPCs are set up in vegetable clusters: In one case, the FIGs are in close contact
with the FPO and 90% are actively connected. Majority of the members are aware of the
FPO. FPO enjoys complete support of members. 30-60% members are Shareholders in the
FPC. The FIG’s are principally constituted by farmers having land > 2acres. Another case
reports FIGs that are alive with regular savings and meeting, although the principal works of
the Figs’ are input demand estimation and distribution.
In the four FPCs, FIGs are alive and somewhat active thanks to investment of time in
promoting and developing the FIGs for at least a year if not more, prior to initiating the FPO.
FIG activities include regular monthly meeting, monthly saving, and occasional taking up of
village development activity (e.g. Cleanliness Campaign), taking up group enterprise (e.g.
seed production, Spice production, Bio-pesticides, vermicompost). One FIG saved money
(600 pm per member) for a limited number of months for a particular purpose and stopped
after having utilised the money for the purpose it was collected. There are instances of large
FIGs registered as a society. Where FIG members are homogeneous and farmers’ are less
well off (small, marginal) small savings of say up to Rs. 100 pm carries on more regularly. In
16
heterogeneous groups or large, well off farmer groups, regularly monthly savings does not
sustain. All the above are thus examples of how to form and keep a FIG alive and relevant.
Even if FIGs are somewhat active, if there is a mixed membership of farmers from
economic/socially dominant backgrounds as well as marginalised/poor sections of society,
the former usually dominates the activities and agenda within the FIG as well as
representing the FIG in the FPO. The weaker members are found to be quiet, inactive or
unaware though they may be availing of whatever services of the FPO they have access to. It
is moot to consider whether the FPO /RI could consider a strategy of promoting more but
homogeneous FIGs in the same village rather than one heterogeneous FIG. In a way this is
happening in FPOs which are starting to promote Women SHGs in the same village alongside
the existing FIGs.
In the two FPOs that have FIGs and other VLIs, FIGs are also active and groups inculcate
savings and internal lending apart from other agriculture related activities among its
members. There is a plan to make a linkage with NABARD for credit support programme in
the future. The other FPO followed the strategy of clearly forming two parallel sets of VLIs
from the outset: the Farmer Groups (commodity Cooperatives) whose meetings are held
only after the commencing of procurement season, and the Thrift & Credit cooperative
where savings and internal lending regularly round the year. These have nothing to do with
the functioning of the FPC but benefit from it. Both kinds of groups are active in their own
way and meetings generally see an attendance of more than 90%.
With the two FPOs that have only SHGs as the form of producer VLI, the SHGs are active as
there has proper groundwork and institutional development efforts to form them. In both
cases, the RI has been in constant touch and secondary level institutions of SHGs such as
SHG federations and VDC respectively are in place. Regular savings, record maintenance,
meetings, inter-loaning and Bank linkage, group socio-economic homogeneity, leadership
selection and roles are all followed with support from RI. All this makes it possible for them
to remain alive and active as SHGs apart from functioning as farmer groups as part of the
FPO.
Board of Directors
Of the total five FPOs where women are on board with majority, contrasting
observations from two FPOs came out in the course of the study. In one FPO, the 9
women directors are not involved in FPO, rather their husbands are involved. In another
case, the women members were found to be quite capable as board members. Of the
two women board members interviewed, one was part of the finance committee and
other as the secretary, holding an important position in the board. The literacy level of
these women board members could be linked to the above observation. In that FPO,
two of the woman board members have educational level up to Graduation and Post-
Graduation level respectively.

17
Except for one FPO, in none of the FPOs, the board members have gone through the
Memorandum of Association and Articles of Association of FPO. In majority of the cases,
the MOA and AOA are formulated by the RI using the standard formats.
Except for four cases, the board in majority of the cases is not able to understand the
financial statements and progress. One of the reasons for this as found in 7 FPOs, was
that the RI personnel attached to the FPO himself lack understanding in financial
statements. The other contributing factor to this could be the non-unavailability of an
updated accounting system and a robust MIS system.
In 10 FPOs, there is a computerized accounting system. Out of these five FPOs generate
financial statements on monthly basis and use them. 12, out of 19 FPOs (3 FPOs have
not done their audit for last two financial years), submit all bills to the auditor once in
year and the balance sheets for the year are generated.
In Six FPOs the board was able to visualize the FPO over a period with key activities and
the major strategy the FPO would take up in the future. Out of 22 FPOs, long term
business plans were found in only these six FPOs and articulated in three others. All
these are listed below:
Name of FPO LT Vision and Strategy
1 RI services to be provided at a cost based on annual plan and contract
agreement between FPC and RI. Ultimately, the FPC should hire RI as a
Consultant to provide a list of services for a fee, based on a written
Agreement to be made on an annual/periodical basis.
Reduce RI financial support by by 20%, 50% and 100% over the coming
three years. Three years more is the time the FPC will require to be
capable financially and institutionally to run on its own.
2 Setting up a Dal Mill
3 opening retail stores at Kolkata.
potato seed production and scented rice at a largescale.
• Installing a rice mill for processing of scented rice to thereafter be packed
and sold in the brand name of the FPC. Packets also procured from the
FPO.
promote the concept of CHC (Custom Hiring Centre)wherein FPC has
decided
to purchase high value machineries like tractor, power- tiller and combine
harvester. These machineries will be provided at subsidized rent to the
farmers.
attain sustainability in the financial year 2015- 16.

18
• The FPC wishes to create assets like land and processing plants to ensure
future growth and prosperity.
4 cold storage, ware house construction.
5 seed processing unit
6 RI is on its way out and the FPC has to operate on its own.
Construct a warehouse to meet the future needs.
Applied to FSSAI for Retail marketing in future
become an institutional member of NCDEX for derivative trading and
own a warehouse and a processing plant
7 Hiring more trained and technical staff at mid and bottom level so that they
can be promoted at senior position once they acquire experience and
knowledge as a replacement of SRIJAN staff.
Link Exchange approved warehouse to Banks so farmers get Loan on Pledge
8 Company hired a consultant for the same, and along with CEO made plan
for next 10 years. Board of directors were not a part of making the plan:
• Achieve sixty per cent SRR in the operating villages
• Develop a network of Service Providers as a delivery system
• diversify business by entering into the processing of wheat flour and soya
milk
• Merger with a Milk Producer Company Limited
The training inputs received by the board members were quite minimal. In 13 FPOS, the
board members were taken for exposure visit. In 8 FPOs, no training for board members
were organized on FPO functioning. In 6 FPOs, only one training programme was arranged
since their inception. No training programme in any FPO covered the concept of
understanding financial statements and understanding the FPO business.
CEO
There are two FPOs where the CEO is recruited, appointed and paid by the FPO. In one case,
the staff of the promoting institution who promoted the FPO became full time CEO. In
another case,initially the promoting institution had appointed the CEO. When his term got
over, one of the Board Members took over as CEO.
In another 13 FPOs, the CEO or the person performing the role of CEO is from the RI. One of
the reasons could be majority of the RIs are more confident in deploying their own staff. In 6
of these 13 FPOs, the CEOs are deployed from the RI and paid by FPO, while in the rest 7
cases; the project manager of the RI is performing the role of CEO and supporting the FPO.
In FPOs, the project managers of RI performing the role of CEO and paid by RI do not give
enough time to FPO as he/she is involved in other projects of the RI. In one FPO, the low
performance (Rs. 10 lakhs turnover after four years of operation) of FPO was directly linked
with the lack of enough time given by the project manager/CEO of the RI.

19
Of the 22 FPOs, 7 FPOs have no person performing the role of CEO either from the RI or
FPO. The chairmen of these FPOs have largely taken the charge of the FPO. All these 7 FPOs
are young FPOs struggling to establish their business.
In two FPOs, the CEO is from local area, while in rest cases the CEO are from RI and has
some professional background. The ability to analyze the business and financial
performance of the FPO, visualize and plan for the FPO found to be the major differentiating
factor for a CEO with some professional background from that from a local area. One of the
contributing factors to the low skill level of the local persons is that they did not get or avail
of any training
CEOs of two FPOs had undergone a good amount of training and exposure.
Staff (Excluding CEO)
There are eight FPOs which do not have any staff (other than CEO). In rest 14 FPOs, the
number of staff varied from 1 to 10. In 6 FPOs, the number of staff is more than 5. In one
case, there are 36 village level staff on commission basis, one for each village. These 6
FPOs are better both in terms of business performance and connection with
shareholders as well. The high awareness level of shareholders in these FPOs can be
related to the regular touch with the shareholders through the larger staff strength of
the FPOs.
Level of Dependence on RI
Of the two FPOs which are older (incorporated in 2006 and 2007) in the entire sample,
in one case the current level of dependence of FPO on RI is minimal. The FPO is making
high turnover with good profits and able to hire professional (CEO- MBA with
satisfactory salary) and able to bear the cost of its entire staff (10). While in other case
the RI is very closely connected to the FPO.
Of the 5 FPOs which are in the middle age (incorporated in 2011 and 12), in three FPOs
there is minimal level of dependence on RI. The financials of these FPOs support their
independence and their ability to bear their cost of staff. In all three cases, the CEOs are
professional and deployed from RI. While in other two cases the FPOs are still dependent
on RI to a great extent. In case of one FPO, though the FPO has a CEO who is a local
person and 6 other staff, the RI is still involved in FPO functions even in the day to day
ones. Either the RI is not enough confident of the CEO appointed by RI itself or there is
inertia in letting go.
Of the 13 FPOs which were young (incorporated in 2013 and 14) in the entire sample,
different degrees of dependence was observed starting from heavy to moderate to
minimal. Of the 13 FPOs, 10 FPOs are dependent on RI to a great extent. Two FPOs have
20
progressed a bit with moderate level of dependence. In one of these two FPOs, some of
the staff is still partially paid by RI. Only in one FPO minimal support of RI was found.
Two FPOs have become defunct with the end of the project support. The RIs could not
establish the business, systems and processes and personnel during the project period
so that the FPO could continue to run after the project period.
It can be inferred from the analysis that a FPO in which the staff are deployed/appointed in
first two years itself will be able achieve independence from RI sooner. Another inference
can be FPOs with professional CEOs are more likely to stand on their feet sooner than the
FPOs with CEOs as local persons.
A pattern could be drawn from three FPOs promoted by three RI which are quite well
known and appreciated for their work on community mobilization and farmers’ issues.
Though the FPOs have attained financial stability, the involvement of RIs is quite high. The
reason could be very nature of work of these organizations working closely with same
community for a quite a long time. While, in others, especially FPOs promoted under SFAC,
the project period was fixed and some RIs could really put systems and personnel
beforehand and could withdraw to some extent.
2.6. Capital
Equity
The equity put by each shareholder varied from Rs.100-1000 in most FPOs, except in case of
7 FPO where the board members have put equity to the tune of Rs. 10,000 each. In case of
these 7 FPO, the equity put by the shareholders was Rs. 100/- which generated a very low
equity base for the FPO. The result of low equity base for start-up of the FPOs which
reflected on the low turnover of the FPO. FPOs with low equity base are struggling to
establish themselves and fulfilling the needs of their shareholders on time.
Paid up Equity of Shareholders was Rs. 1-3 lakhs in 7 FPOs, Rs 3-6 lakhs in 5 FPOs, Rs. 6-10
lakhs in five FPOs and > 10 lakhs in two FPOs. The information was not available for two
FPOs and one FPO with promoters’ equity of Rs. 45000 was not functional from the initial
days.
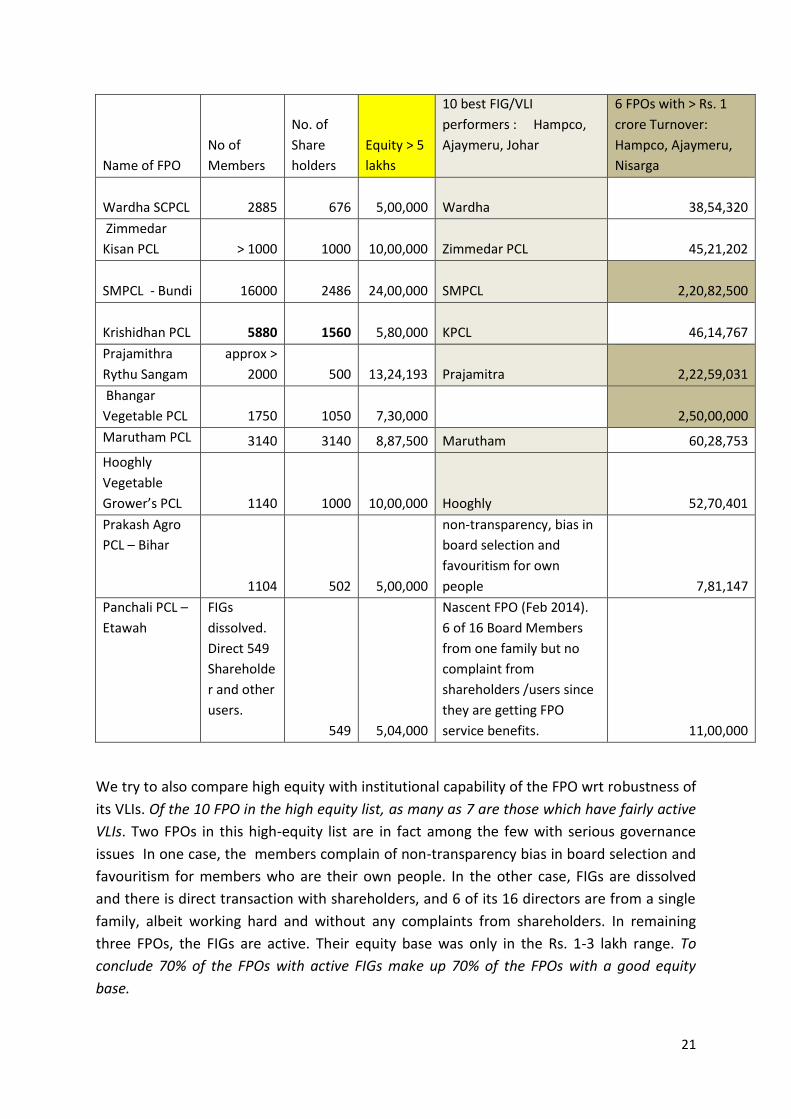
We looked at the FPOs which have the equity base of Rs. 5 lakhs and more to analyse their
performance. There are 10 out of 19 FPOs (approx 50%) in this category. Out of the total
FPO sample, there are 6 FPOs with the highest Turnover (of > Rs. 1 Crore). However, only
three of the high-equity FPOs also fall in the high turnover list (shaded in dark grey in the
Table below). The remaining three in the high turnover list have a lower equity base falling
within Rs. 1-3 lakhs but still manage high turnovers.
Table: High Equity FPOs and comparison with FIG/VLI and Turnover Performance
21
Name of FPO
No of
Members
No. of
Share
holders
Equity > 5
lakhs
10 best FIG/VLI
performers : Hampco,
Ajaymeru, Johar
6 FPOs with > Rs. 1
crore Turnover:
Hampco, Ajaymeru,
Nisarga
Wardha SCPCL 2885 676 5,00,000 Wardha
38,54,320
Zimmedar
Kisan PCL > 1000
1000
10,00,000 Zimmedar PCL
45,21,202
SMPCL - Bundi 16000 2486
24,00,000 SMPCL
2,20,82,500
Krishidhan PCL 5880 1560
5,80,000 KPCL
46,14,767
Prajamithra
Rythu Sangam
approx >
2000 500
13,24,193 Prajamitra
2,22,59,031
Bhangar
Vegetable PCL 1750 1050
7,30,000 2,50,00,000
Marutham PCL 3140 3140 8,87,500 Marutham 60,28,753
Hooghly
Vegetable
Grower’s PCL 1140 1000
10,00,000 Hooghly
52,70,401
Prakash Agro
PCL – Bihar
1104 502 5,00,000
non-transparency, bias in
board selection and
favouritism for own
people
7,81,147
Panchali PCL –
Etawah
FIGs
dissolved.
Direct 549
Shareholde
r and other
users.
549
5,04,000
Nascent FPO (Feb 2014).
6 of 16 Board Members
from one family but no
complaint from
shareholders /users since
they are getting FPO
service benefits.
11,00,000
We try to also compare high equity with institutional capability of the FPO wrt robustness of
its VLIs. Of the 10 FPO in the high equity list, as many as 7 are those which have fairly active
VLIs. Two FPOs in this high-equity list are in fact among the few with serious governance
issues In one case, the members complain of non-transparency bias in board selection and
favouritism for members who are their own people. In the other case, FIGs are dissolved
and there is direct transaction with shareholders, and 6 of its 16 directors are from a single
family, albeit working hard and without any complaints from shareholders. In remaining
three FPOs, the FIGs are active. Their equity base was only in the Rs. 1-3 lakh range. To
conclude 70% of the FPOs with active FIGs make up 70% of the FPOs with a good equity
base.

22
There are only two FPOs that are common in the list of FPOs performing better in all three
parameters of high turnover, active FIGs and high equity base. There are another two FPOs
that are common in the list of top-performing FPOs having active FIGs and good Turnover,
but do not figure in the top equity list.
Access to credit
Of the 22 FPOs, four FPOs did not apply for any loan. Of the four, in three FPOs which
have not applied for the loans, vegetable is the major commodity. Because of the nature
of commodity, the FPOs are able to generate enough working capital and hence these
FPOs do not feel the requirement of applying for a loan.
18 have applied for credit, out of which four received assistance from Ananya
Microfinance and FWWB, four received from banks and four received working capital
loan from NABARD and NABFIN. 6 FPOs have been denied by the local banks for credit
services.
Lack of solid track record for three years is one of the major reasons of rejection of
credit application by public sector banks. In cases where the FPO could get credit from
the bank, RI played a critical role to the extent of giving guarantee and taking loan on its
name.
FPO directors are unable to provide immovable assets as collateral required by the
banks. FPOs have low internally generated funds, and own contributed equity. Banks
feel more comfortable where the FPO members have put in good amount of their
capital. Bank branches are not aware of details of FPO related schemes.
FPOs find it more convenient to start their relationship with Ananya Microfinance Pvt.
Ltd, rather than go through the grind of regular banking channel. Ananya provides
working capital without collateral at an interest rate between 12% -18%, and also some
amount of training to FPO office bearers.
After an FPO has had few rounds of funding from Ananya, private sector banks such as
HDFC Bank, Yes Bank and others feel comfortable to extend financial support.
Access to Grant
7 FPOs could channelize grants. The sources are NABARD, State Government and Royal
Bank of Scotland, SRTT. In two cases, the grants were for specific project to be
implemented under the banner of FPO. RI played a crucial role in channelizing these
funds.

23
2.7. Business Processes and Systems
Inputs Supply System
The seeds are procured from one or more of these sources – Local Traders, Dealers,
Govt. Department, or by own seed production. Fertilizers and Pesticides are procured
from one or more of these sources – Local Traders, dealers, getting a sub-dealership for
a larger dealer, getting a Company dealership, getting a Govt. Corporation Dealership,
getting a Sub-dealership for a large trader operating in a bigger town/city. 7 FPOs have
got direct dealership from the manufacturing company. Two have sub-dealerships for a
larger Dealer who operates in a bigger Town/City. However, this has the risks of being
‘squeezed’ for stocks at a crucial time by the dealer, deliberately. Two FPOs do outright
purchase from the Manufacturing Company. One FPO deals purely with organic
products.
Dealership license direct from company gives better margins to FPO but usually a
company Dealership is given for a whole area and on outright cash purchase of stock.
Thus this requires selling to all people in the area and not limiting it to members and
shareholders. Purchasing from local dealer gives lesser margin to the FPO but it allows
buying on credit basis and returning unsold stock. It also allows the FPO to cater to
variations in demand from shareholders – variation in quantity as well as offering
different varieties to the members according to their preference by purchasing from
more than one dealer.
There are instances (cited in at least two FPOs) where existing dealers try to persuade
the manufacturing Company not to provide dealership to the FPO. In case the
manufacturing company agrees to give the FPO a sub-dealership, FPO usually has to buy
from the manufacturing company’s main dealer in the area, who may try to limit supply
to the FPO for sub-dealership, causing shortages to the members.
In one case, there is a FPO shareholder who is a dealer of a prominent fertilizer
company. The input requirement in terms of fertilizers and pesticides of the farmers in
the village and nearby areas are mostly catered by the shop that he had put up since 10
years. Hence, only a few people availed inputs from the FPO. However, they buy the
seeds if required from the FPO shop.
In majority of the FPO, demand estimation is done at the FIG / SHG level prior to the
season. To capture the input demand a proper indent is filled at shareholder level where
the data like input required for next cropping season and other inputs (seeds, fertilizers
and pesticides) required which are not available in company’s outlet etc. For procuring
inputs to sell over and above members’ demand, estimates and targets are set centre-
wise, based on cluster size.
24
One FPO runs a week-long awareness campaign before the start of the sowing season
which serves the purpose of marketing campaign for the inputs and also a membership
campaign. The RI for the FPO spends around Rs. 2-2.5 lakhs per cluster for this purpose.
In an opposite approach, one FPO does no aggregation of demand at the village primary
cooperative level. The farmers buy the inputs from the shop directly when they go to the
taluka.
The procedure for payment for inputs ordered by the members varies across FPOs. Few
FPOs take a partial advance from members at the time of collecting indent, while others
sell inputs to members on cash-and-carry basis.
Once the inputs arrive, storage is usually in a rented Godown. Further distribution to
FIGs is by collection and storage (usually in the leader’s house) at the village level by the
FIG leader.
Almost all FPOs have opened separate outlets/Shops though few only distribute from
the Office premises/Godown. The separate outlets work as functional sales shops for
purchase/sale by shareholders and non-shareholders. In the case of one FPO, the sales
outlet is conceptualized to be a complete Agro-service Centre. Even local enterprise
groups of the FPO are encouraged to place their product (Vermicompost etc) for sale.
Two FPOs had faced challenges in getting rented shops for their FPO outlet from the
local retailer and sub-dealers.
Most FPOs sell inputs at a rate slightly lower than the market rate to shareholders and
keep a higher price for non-shareholders. Few keep the price at par with the market
since the advantage to the member comes in the form of quality inputs and doorstep
supply. One FPO proposes to provide maximum extra incentive to their members in the
form of withheld price or in the form subsidy during supply of agro input etc. instead of
profit distribution as profits of the company attract Income Tax.
Seed Production and Marketing
In case of one FPO, the main FPO business activities and financials revolve round the
entire Seed value chain. The FPO is producer, processor, whole-sale supplier, retail seller
and sells to own members. Three other FPOs also have a significant seed production and
sale business line. Breeder or Foundation seeds are acquired by establishing linkage with
an agency like Agriculture institute, Department or SOPA. In all cases, they are
consciously branding the seeds and building the Brand.
This business requires assured availability of Storage facility, stock-holding and
management capacity for at least 6 months in each cycle. The certification process takes
place through various stages over almost 6-7 months time, during which the company
stores the seeds in warehouse.
25
Only selected farmers can be seed producers. The selection is based on various factors
like, the land availability of the farmer, irrigation facilities available to the farmer,
financial capacity of the farmer. They need to be registered, trained and follow a strict
protocol. FPOs in seed production can get into assured govt. market by becoming seed
wholesaler to govt agencies and sellers to other cooperative societies, as done in one
FPO.
In case of FPOS involved in Vegetables production and sale, they are involved in
production of seedling/saplings for sale to shareholders. They operate a central Nursery
and seedlings are prepared based on prior collection of shareholders demand.
Productivity Enhancement (Pen):
Almost all FPOs are providing this service to members. In most cases it is done by the RI
and is a free service to farmers. In many cases there is an ongoing Project of RI under
which it carries out the Pen activities. Many FPOs have access to RML and Krishidoot for
Pen information. In three FPCs, even Animal Husbandry related Pen services are provided
to members.
Aggregation, Procurement and Sale (apart from seed production)
Aggregation and outright purchase from shareholders and sold in local mandi or to
wholesaler: In 6 FPOs where farmers are involved in Vegetable farming are involved in
wholesale. Of these, three FPOs also have retail sale business in addition to the
wholesale line of business. 5 FPOs are into wholesale at the local mandi or to a local
wholesaler. One FPO has a significant retail sale business in neem-seed powder. Outright
purchase and direct sale to Company/Industry is being undertaken by five FPOs since the
buyers’ processing plant in the vicinity.
Aggregating, storing and selling the commodity when the prices are optimum, in peak
season is undertaken only by two FPOs. In such cases when large quantities need to be
aggregated, only part payment is made immediately to the shareholders from whom it is
procured. The remaining is paid later after the sale.
In case of one FPO, the sales turnover in 2014-15, increased in a big way, due to soya
purchasing/warehousing and receipt financing – this has been done only by this one
FPO. It is worth mentioning that the FPO has a dual marketing model for the procured
output - 30% of the total procurement is bought by the FPO from farmers and then sold
in the market and 70% of remaining procurement is bought from the farmers by paying
those cash at 70% of the cost. This quantity is further stocked in the warehouse which is
sold in peak season and some quantity is also traded through NCDEX during lean season.
Of the studied FPOs, 10 had participated in MSP Procurement for and sale on
commission to SFAC. All FPOs involved in large scale aggregation and sale need to also

26
buy from non-shareholders or even from the mandi if needed, to make up for large
quantity to traded or large sale commitments. Both for marketing adequate quantities
committed to a bulk buyer, or for selling adequate quantities based on an input
dealership contract, FPO has to prepare to buy from/sell to non-members also to reach a
marketable lot size.
Processing and Value addition
Very few FPOs are into processing: two have a dal mill and two are planning to set up
Dal Mill.

27
3. Overall Maturity in Terms of Capital and Capability
Many of the FPOs studied were struggling to kick start their business because of low equity
base. Majority of the FPOs were unable to raise loans from banks. Dearth of working capital
in many FPOs contributed to limited services to shareholders and serving few shareholders
only. Majority of the commercial banks treated the producer companies as private firms
and do not consider those under priority sector. Some FPOs have taken loans from private
institutions such as Ananya Finance at an interest of around 13% per annum.
Majority of the FPOs were able to supply quality inputs at better price and at the door step
to their members. Only around two-fifth of the members, however, availed the FPOs’
services. Only two FPOs, however, were able to start working on value addition aspect.
More than half of the FPOs were not providing any marketing services to their members
which was their prime need.
The FPOs did not have any system to track and review such issues. Very few FPOs reviewed
their business performance or analysed their financial statements on regular basis. Majority
of the FPOs neither had the systems to track the progress nor the capability. A majority of
the FPOs studied had no long term plan and most FPOs have not applied for any loan though
they are more than three years old. The lack of business orientation of the board members
has contributed to this.
Issues related to governance surfaced in many FPOs. Inclusion of influential persons and
large farmers on board, dummy board members, inactive board members led to questions
about the board appointment process adopted in many FPOs. Low level of participation of
shareholders in AGMs and the poor design of AGMs resulted in low awareness of the
shareholders and a sceptical view about the FPO among the shareholders and local people.
Irregular board meetings coupled with low attendance of board members in few FPOs
triggered virtual conversion of these FPOs to private enterprises.
Many policy issues related to FPOs have come to light during the study. Many FPOs have
faced challenges in getting proper licences. While the cooperatives existing in the FPO
operational area possess fertilizer dealership of IFFCO, the producer companies were denied
the same. The reason was the IFFCO policy which allows only cooperatives to get the
dealerships. This has contributed to the low margin and irregular supply of fertilizer.
Taking the agricultural context of the country into consideration, FPOs have been hailed as
the engines of change for the small and marginal farmers. The study affirms this argument
broadly but also raises many notes of caution. There were signs of optimism among the
shareholders of more than half of the FPOs studied. The promoting institutions have played
a major role in identifying the Board members and in putting systems and processes in
place, but in most cases, their role came to a premature end due to the completion of the
support period. Had they worked longer, FPOs would have been stronger.

28
4. Assessed Score for Capital and Capability for Enterprise
(ASCENT) of an FPO Based on the findings of the study, a trajectory for FPO over first five years of its life cycle
has been proposed. A self-assessment tool: “Assessed Score for Capital and Capability for
Enterprise” (ASCENT) of an FPO was developed considering this emerging growth trajectory.
ASCENT of an FPO has five verticals with each vertical having variable and parameters. For
each parameter a maximum score and a benchmark score have been assigned based on the
age of the FPO. ASCENT will be useful for an FPO to assess its performance, comparing its
score with the bench mark score appropriate for its age. Application of the tool will provide
pointers to FPOs on areas that need attention and focus.
Variables and parameters have been identified and put together in the form of ASCENT of
an FPO. This tool is a self-assessment tool for the FPOs to identify the areas where the FPO
needs to direct its attention and focus. ASCENT can be used by FPOs to undertake annual
self-assessment. For initial one or two rounds of usage of the tool, the promoting institution
would need to play a facilitation role.
The tool has five parts: Business Mix, Capital, Board Capability, Staff Capability and External
Environment.
Assessed Score for Capital and Capability for Enterprise (ASCENT) of an FPO
Max Score for an FPO (choose based on FPO
age in years) -M Score of FPO being
assessed-S % overall Score = S/ M
%
Business Mix 200
Capital 200
Board Capability 200
Staff Capability 200
External 200
Total score 1000
4.1. Business Mix
The Business Mix part presents the business trajectory envisaged for first five years of life
cycle of a FPO. Two variables have been identified to present the business trajectory of the
FPO. The variable: business activity mix and coverage denotes the importance of various
business activities in various years of life cycle of a FPO. The variable: turnover covers the
turnover growth chart of a FPO over the years and the varied levels of contribution of
various business activities to the overall turnover of the FPO over its life cycle. Following
tables presents the score sheet for Business Mix.
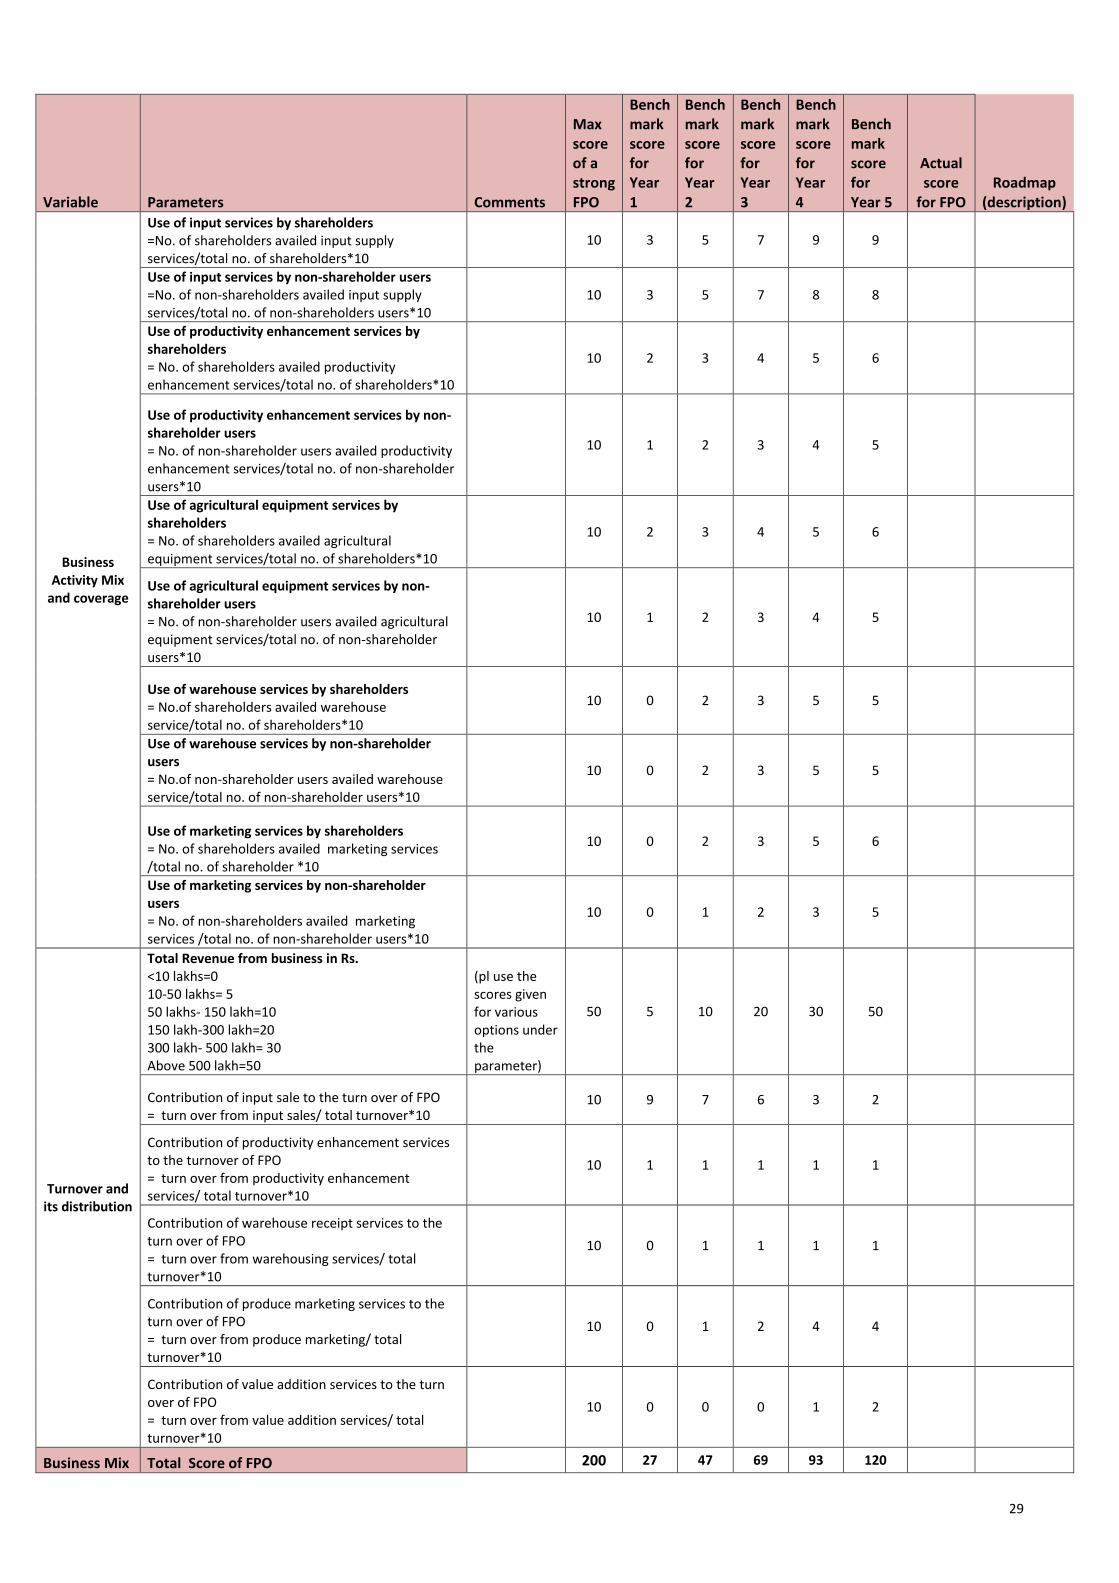
29
Variable Parameters Comments
Max score of a strong FPO
Bench mark score for Year 1
Bench mark score for Year 2
Bench mark score for Year 3
Bench mark score for Year 4
Bench mark score for Year 5
Actual score
for FPO Roadmap
(description)
Business Activity Mix
and coverage
Use of input services by shareholders =No. of shareholders availed input supply services/total no. of shareholders*10
10 3 5 7 9 9
Use of input services by non-shareholder users =No. of non-shareholders availed input supply services/total no. of non-shareholders users*10
10 3 5 7 8 8
Use of productivity enhancement services by shareholders = No. of shareholders availed productivity enhancement services/total no. of shareholders*10
10 2 3 4 5 6
Use of productivity enhancement services by non-shareholder users = No. of non-shareholder users availed productivity enhancement services/total no. of non-shareholder users*10
10 1 2 3 4 5
Use of agricultural equipment services by shareholders = No. of shareholders availed agricultural equipment services/total no. of shareholders*10
10 2 3 4 5 6
Use of agricultural equipment services by non-shareholder users = No. of non-shareholder users availed agricultural equipment services/total no. of non-shareholder users*10
10 1 2 3 4 5
Use of warehouse services by shareholders = No.of shareholders availed warehouse service/total no. of shareholders*10
10 0 2 3 5 5
Use of warehouse services by non-shareholder users = No.of non-shareholder users availed warehouse service/total no. of non-shareholder users*10
10 0 2 3 5 5
Use of marketing services by shareholders = No. of shareholders availed marketing services /total no. of shareholder *10
10 0 2 3 5 6
Use of marketing services by non-shareholder users = No. of non-shareholders availed marketing services /total no. of non-shareholder users*10
10 0 1 2 3 5
Turnover and its distribution
Total Revenue from business in Rs. <10 lakhs=0 10-50 lakhs= 5 50 lakhs- 150 lakh=10 150 lakh-300 lakh=20 300 lakh- 500 lakh= 30 Above 500 lakh=50
(pl use the scores given for various options under the parameter)
50 5 10 20 30 50
Contribution of input sale to the turn over of FPO = turn over from input sales/ total turnover*10
10 9 7 6 3 2
Contribution of productivity enhancement services to the turnover of FPO = turn over from productivity enhancement services/ total turnover*10
10 1 1 1 1 1
Contribution of warehouse receipt services to the turn over of FPO = turn over from warehousing services/ total turnover*10
10 0 1 1 1 1
Contribution of produce marketing services to the turn over of FPO = turn over from produce marketing/ total turnover*10
10 0 1 2 4 4
Contribution of value addition services to the turn over of FPO = turn over from value addition services/ total turnover*10
10 0 0 0 1 2
Business Mix Total Score of FPO 200 27 47 69 93 120

30
4.2. Capital
Variable Parameters Comments
Max score of a strong FPO
Bench mark score for Year 1
Bench mark score for Year 2
Bench mark score for Year 3
Bench mark score for Year 4
Bench mark score for Year 5
Actual score
for FPO Roadmap
(description)
Adequacy of Capital
Adequacy of operating expenditure (OPEX) = total funds available for OPEX/ total funds needed for OPEX as per Board plan*50
For more than 50, give 50
50 10 20 30 40 50
Adequacy of capital expenditure (CAPEX) = total funds available for CAPEX/ total funds needed for CAPEX as per Board plan*50
For more than 50, give 50
50 10 20 30 40 50
Profitability Sustainability
Reliance on Revenue Source= Total Business Revenue/Total Income*10
10 2 4 6 8 10
Operating Self-sufficiency= Business Revenue/Total Expenses*10
10 2 4 6 8 10
Net Profit Margin= Net Profit/Business Revenue*10
For more than 10, give 10
10 2 4 6 8 10
Return on Assets= Net Profit after taxes/Total Capital Employed*10
For more than 10, give 10
10 2 4 6 8 10
Return on Equity= Net Profit/shareholders equity capital*10
For more than 10, give 10
10 2 4 6 8 10
Operational Efficiency
Days in Accounts Receivable= Average Accounts Receivable/(sales*365), More than 90 days= 0 60-90 days= 2 45-60 days= 6 45- 30 days= 8 <30 days= 10
10 2 4 6 8 10
Days in Inventory= Average Inventory/(Cost of goods sold*365) More than 90 days= 0 60-90 days= 2 45-60 days= 6 45- 30 days= 8 <30 days= 10
10 2 4 6 8 10
Liquidity position
Current Ratio= Current Assets/current Liabilities, Ratio of 0.5:1 = 0 Ratio in between 0.5: 1 to 1:1= 2 Ratio in between 1:1 to 1.5:1= 60 Ratio in between 1.5:1 to 2:1=80 Ratio More than equal to 2:1= 100
10 2 4 6 8 10
Ability to Leverage
Debt to Equity= Total Debt/Total equity, Ratio of less than 0.5:1 = 0 Ratio in between 0.5: 1 to 1:1= 2 Ratio in between 1:1 to 1.5:1= 6 Ratio in between 1.5:1 to 2:1=8 Ratio More than equal to 2:1= 10
10 2 4 6 8 10
Debt Servicing Ratio= Net profit before deduction of interest and income tax/Interest Expenses Ratio value of 2-3= 2 Ratio value of 3-4= 4 Ratio value of 4-5= 6 Ratio value of 4-5=8 Ratio value of more than 6= 10
10 2 4 6 8 10
Capital Total Score of FPO 200 40 80 120 160 200

31
4.3. Board Capability
Variable Parameters Comments
Max score of a strong FPO
Bench mark score for Year 1
Bench mark score for Year 2
Bench mark score for Year 3
Bench mark score for Year 4
Bench mark score for Year 5
Actual score
for FPO
Roadmap (description
)
Shareholder Base and its participation
Number of shareholders 11-100 shareholders -0 101-500 shareholders= two 501-1000 shareholders=4 1001-2000 shareholders = 6 2001-3000 shareholders = 8 More than 3000 shares = 10
(pl use the scores given for various options under the parameter)
10 2 2 4 6 8
Extent of inclusion of women in FPO % of Women shareholders = No of shareholders who are women/total no. of shareholders*10)
10 1 1 2 3 3
Extent of inclusion of small and marginal farmers in FPO % of shareholders as small and marginal farmers = No of shareholders who are having land less than two ha/total no. of shareholders*10)
10 4 6 7 8 8
Proportion of shareholders using the services of FPO % of active shareholders = No of shareholders who have used the services of FPO/total no. of shareholders*10)
10 4 5 6 8 10
Level of participation of shareholders in Annual general body meetings(AGM) of this year % of shareholders participated in AGM= No. of shareholders participated in AGM/total no. of shareholders *10)
10 3 5 5 6 6
Appropriateness of the input and
output services of the FPO to
the shareholders
Appropriateness of services provided by FPO =Number of services provided by FPO out of top five services required by the farmers in the area/5*10
10 2 4 6 8 10
Appropriateness of input services provided by FPO =Number of types of inputs provided by FPO out of top five type of inputs required by farmers in the area/5*10
10 2 4 6 8 10
Extent of fulfilment of input requirement of shareholders through FPO % of total input requirement of shareholder fulfilled through FPO = Total worth of inputs purchased by shareholders from FPO/Total worth of inputs required by shareholders*10)
10 2 4 6 8 10
Appropriateness of the commodity that the FPO is helping in marketing =No of commodities dealt by FPO out of top 5 commodities produced in the area/5*10
10 2 4 6 8 10
Extent of fulfilment of marketing service requirement of shareholders % of total produce of shareholders marketed through FPO = Worth of total produce of shareholders marketed through FPO/worth of total produce of shareholders marketed*100)
10 20 2 4 8 10
Governance
Appointment of Board (Nobody knows or willing to say how Board was selected =0 The board was selected by RI= 2 The board was selected in AGM= 4 The board was elected using raising hands=6 The board was elected using secret ballot boxes=10)
(pl use the scores given for various options under the parameter)
10 4 6 10 10 10
Extent of Inclusion of women in board = actual number /desired number *10 desired number of women board members = No. of women members/total no. of members*10)
10 2 4 6 8 10

32
Extent of inclusion of small and marginal farmers in board = actual number /desired number *100 desired number of board members as small and marginal farmers=(No. of members having land less than two ha/total no. of members*10)
10 2 4 6 8 10
Breadth of representation of board members = ( total no. of board members- (no. of board members from same family-1)-(no. of board members from same village-2))/ total no. of board members*10)
10 2 4 6 8 10
Level of apolitical composition of board = ( total no. of board members - No. of board members holding political party or elected positions)/total no. of board members*10
10 2 4 6 8 10
Board meeting Regularity % of regularity of board meeting = No. of board meeting held in a year/8 *10. Give 10 if no of Board meetings in a year is more than 8.
10 2 4 6 8 10
Regularity of board members in attending board meeting % of attendance of board members in board meeting = Cumulative attendance of board members in board meeting/ (total no. of board members* no. of board meetings held)*10
10 2 4 6 8 10
Existence and usage of Long term plans No planning has been done= 0 Only Annual planning is done= 2 A three/five business planning has been done, but is not incorporated into annual plans=4 A three/five year business planning has been done and incorporated into annual plans, but are neither implemented nor reviewed = 6 A three/five year business planning has been done and incorporated into annual plans and are implemented and reviewed = 10
(pl use the scores given for various options under the parameter)
10 2 4 6 8 10
Possession of required licenses for carrying out the business = No. of licenses the FPO possesses required licenses/number of required licenses*10
10 4 8 10 10 10
Monthly Accounts, MIS and Annual audit Annual audit for last year is not done or done only for completing the formaility= 0 Annual audit is done on time but AGM, Board and CEO don’t understand =2; Monthly a/cs, MIS and Annual audit is done on time but AGM and Board does not understand, CEO understands =4; Monthly a/cs, MIS and Annual audit is done on time but AGM does not understand, Board and CEO understand =6; Monthly a/cs, MIS and Annual audit is done on time and AGM, Board and CEO understand =8; Monthly a/cs, MIS and Half- yearly audit is done on time and AGM, Board and CEO understand =10;
(pl use the scores given for various options under the parameter)
10 2 4 6 8 10
Capability Total Score of FPO 200 66 83 120 155 185
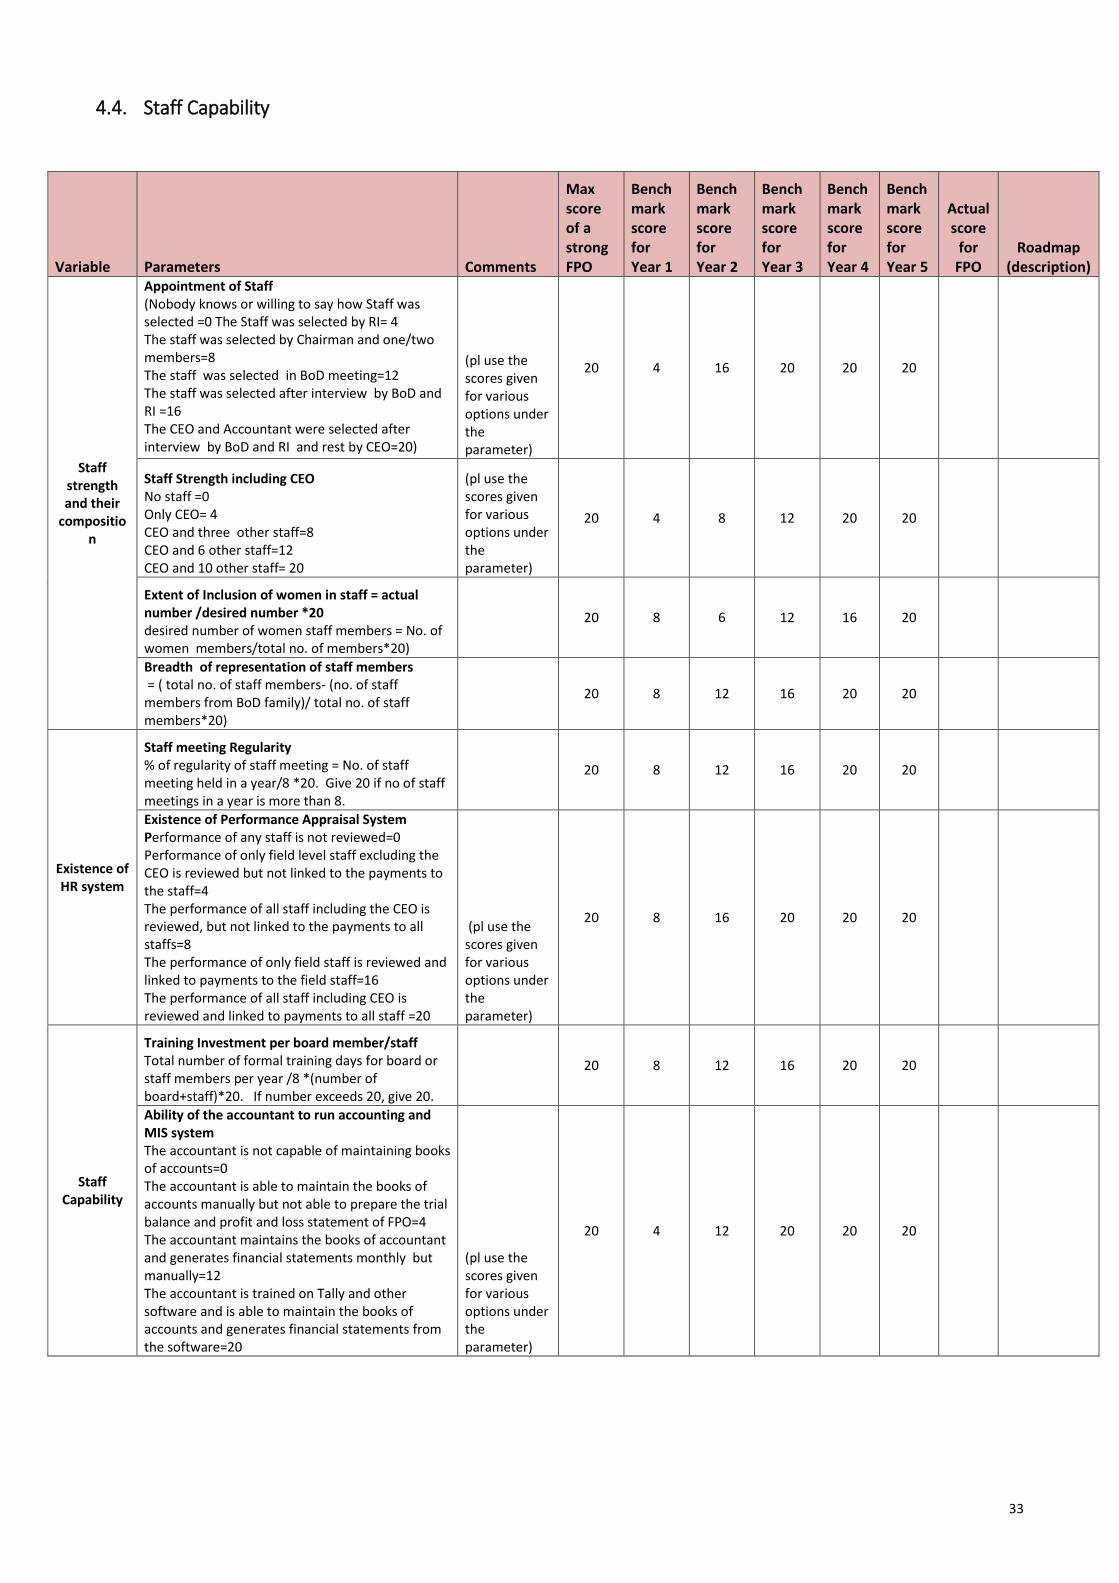
33
4.4. Staff Capability
Variable Parameters Comments
Max score of a strong FPO
Bench mark score for Year 1
Bench mark score for Year 2
Bench mark score for Year 3
Bench mark score for Year 4
Bench mark score for Year 5
Actual score
for FPO
Roadmap (description)
Staff strength and their
composition
Appointment of Staff (Nobody knows or willing to say how Staff was selected =0 The Staff was selected by RI= 4 The staff was selected by Chairman and one/two members=8 The staff was selected in BoD meeting=12 The staff was selected after interview by BoD and RI =16 The CEO and Accountant were selected after interview by BoD and RI and rest by CEO=20)
(pl use the scores given for various options under the parameter)
20 4 16 20 20 20
Staff Strength including CEO No staff =0 Only CEO= 4 CEO and three other staff=8 CEO and 6 other staff=12 CEO and 10 other staff= 20
(pl use the scores given for various options under the parameter)
20 4 8 12 20 20
Extent of Inclusion of women in staff = actual number /desired number *20 desired number of women staff members = No. of women members/total no. of members*20)
20 8 6 12 16 20
Breadth of representation of staff members = ( total no. of staff members- (no. of staff members from BoD family)/ total no. of staff members*20)
20 8 12 16 20 20
Existence of HR system
Staff meeting Regularity % of regularity of staff meeting = No. of staff meeting held in a year/8 *20. Give 20 if no of staff meetings in a year is more than 8.
20 8 12 16 20 20
Existence of Performance Appraisal System Performance of any staff is not reviewed=0 Performance of only field level staff excluding the CEO is reviewed but not linked to the payments to the staff=4 The performance of all staff including the CEO is reviewed, but not linked to the payments to all staffs=8 The performance of only field staff is reviewed and linked to payments to the field staff=16 The performance of all staff including CEO is reviewed and linked to payments to all staff =20
(pl use the scores given for various options under the parameter)
20 8 16 20 20 20
Staff Capability
Training Investment per board member/staff Total number of formal training days for board or staff members per year /8 *(number of board+staff)*20. If number exceeds 20, give 20.
20 8 12 16 20 20
Ability of the accountant to run accounting and MIS system The accountant is not capable of maintaining books of accounts=0 The accountant is able to maintain the books of accounts manually but not able to prepare the trial balance and profit and loss statement of FPO=4 The accountant maintains the books of accountant and generates financial statements monthly but manually=12 The accountant is trained on Tally and other software and is able to maintain the books of accounts and generates financial statements from the software=20
(pl use the scores given for various options under the parameter)
20 4 12 20 20 20

34
Competence of CEO and Accountant to review of FPO business performance and use Both CEO and accountant do not understand the financial statements=0 Only accountant understand the financial statements=8 Both CEO and Accountant understand the financial statements, but the CEO do not use=12 Both CEO and accountant understand the financial statements and the CEO presents the findings to board=20
(pl use the scores given for various options under the parameter)
20 8 12 20 20 20
Understanding of CEO on Business Planning The CEO is not aware of long term business planning=0 The CEO is aware of long term business planning but does not understand business plan=4 The CEO understands a long term business plan but does not have for his/her FPO=12 The CEO understands long term business plan and has it for his/her FPO=20
(pl use the scores given for various options under the parameter)
20 12 20 20 20 20
Staff Capability Total Score of FPO 200 72 126 172 196 200
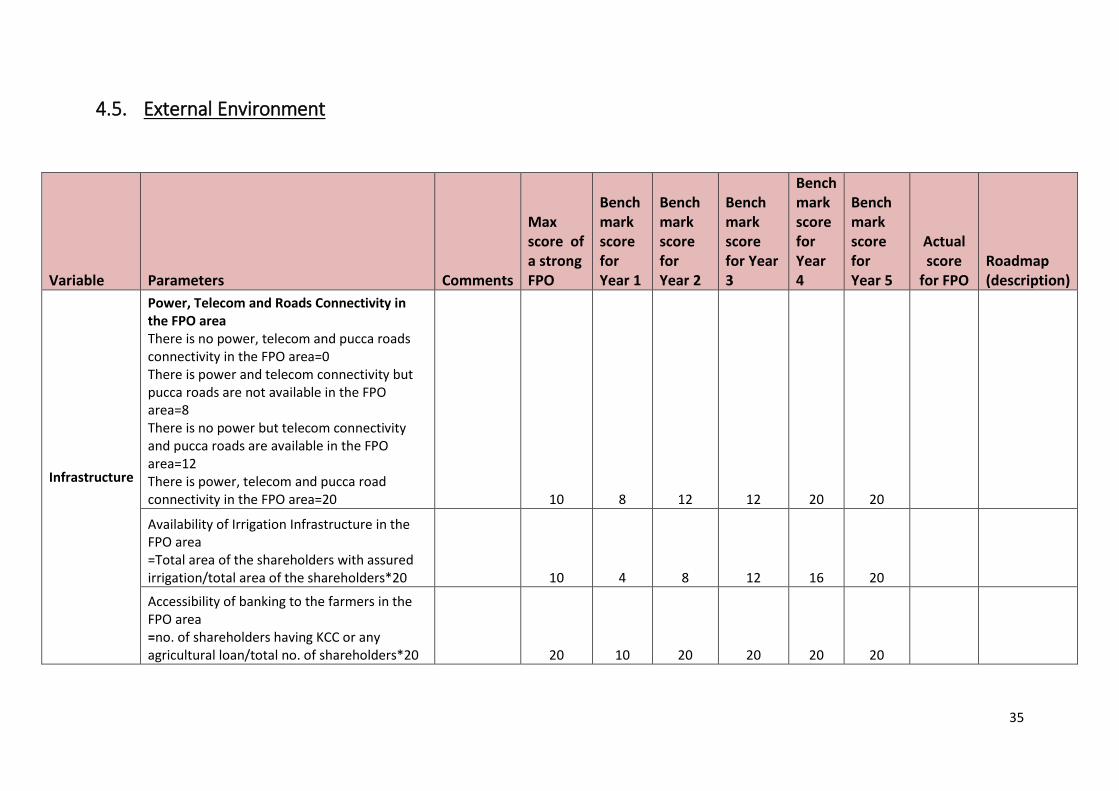
35
4.5. External Environment
Variable Parameters Comments
Max score of a strong FPO
Bench mark score for Year 1
Bench mark score for Year 2
Bench mark score for Year 3
Bench mark score for Year 4
Bench mark score for Year 5
Actual score
for FPO Roadmap (description)
Infrastructure
Power, Telecom and Roads Connectivity in the FPO area There is no power, telecom and pucca roads connectivity in the FPO area=0 There is power and telecom connectivity but pucca roads are not available in the FPO area=8 There is no power but telecom connectivity and pucca roads are available in the FPO area=12 There is power, telecom and pucca road connectivity in the FPO area=20 10 8 12 12 20 20
Availability of Irrigation Infrastructure in the FPO area =Total area of the shareholders with assured irrigation/total area of the shareholders*20 10 4 8 12 16 20
Accessibility of banking to the farmers in the FPO area =no. of shareholders having KCC or any agricultural loan/total no. of shareholders*20 20 10 20 20 20 20
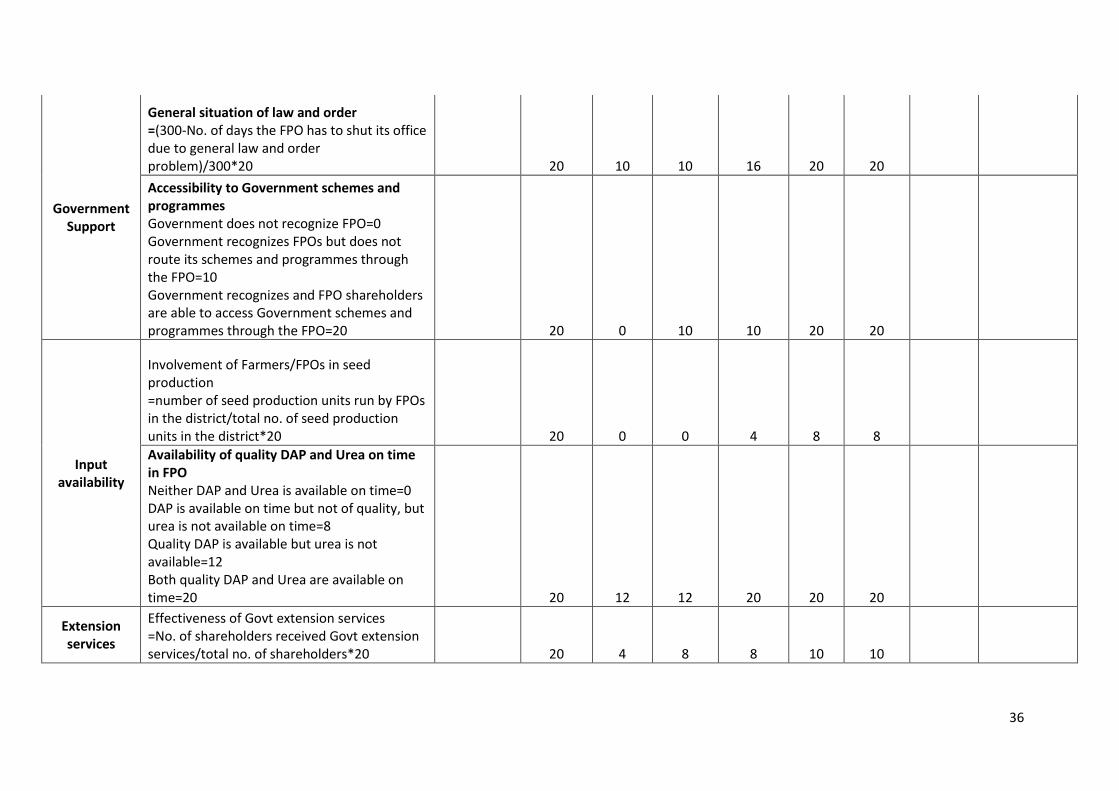
36
Government Support
General situation of law and order =(300-No. of days the FPO has to shut its office due to general law and order problem)/300*20 20 10 10 16 20 20
Accessibility to Government schemes and programmes Government does not recognize FPO=0 Government recognizes FPOs but does not route its schemes and programmes through the FPO=10 Government recognizes and FPO shareholders are able to access Government schemes and programmes through the FPO=20 20 0 10 10 20 20
Input availability
Involvement of Farmers/FPOs in seed production =number of seed production units run by FPOs in the district/total no. of seed production units in the district*20 20 0 0 4 8 8
Availability of quality DAP and Urea on time in FPO Neither DAP and Urea is available on time=0 DAP is available on time but not of quality, but urea is not available on time=8 Quality DAP is available but urea is not available=12 Both quality DAP and Urea are available on time=20 20 12 12 20 20 20
Extension services
Effectiveness of Govt extension services =No. of shareholders received Govt extension services/total no. of shareholders*20 20 4 8 8 10 10

37
Effectiveness of pvt extension services No. of shareholders accessed private extension services/total no. of shareholders*20 20 4 8 8 10 10
Market access
Effectiveness of agri-market yards (mandis) =No. of shareholders sell their produce in mandis/no. of shareholders*20 20 4 6 8 8 10
Effectiveness of pvt agri produce buyers =no. of shareholders sell their produce to pvt. Agri produce buyers*20 20 10 8 6 6 4
Total 200 66 102 124 158 162