traffic safety and economic fluctuation - semantic … safety and economic fluctuation ... referat...
TRANSCRIPT

www.vti.se/publications
Mats Wiklund
Lennart Simonsson
Åsa Forsman
Traffic safety and economic fluctuation
Long-term and short-term analyses
and a literature survey
VTI rapport 704APublished 2012


Publisher:
Publication:
VTI rapport 704A
Published:
2012
Project code:
200809
Dnr:
2008/0616-28
SE-581 95 Linköping Sweden Project: The influence of the economic situation on the number killed and injured in traffic.
Author: Sponsor: Mats Wiklund, Lennart Simonsson, Åsa Forsman The Swedish Road Administration
VTI
Title: Traffic safety and economic fluctuation. Long-term and short-term analyses and a literature survey
Abstract (background, aim, method, result) max 200 words:
In studies of traffic safety is it important to have good knowledge of both internal and external factors. Examples of the former are driver behaviour and the roads’ safety standard, while examples of the latter are the demographic structure and the economic situation.
This report includes a survey of methods used by previous researchers comprising which variables they used as indicators of the state of the market. It was concluded that unemployment was the most common economic variable, where an increase in unemployment indicates a decrease in the number of killed road users. The same result was found when a time series analysis was performed on Swedish data. It was also shown that part of the reduction in the number of fatalities in Sweden during a recession was explained by young drivers’ reducing their car use. There is, however, still a remaining effect of unemployment that cannot be explained by young drivers car use.
One theory is that the state of the market affects the road users´ travel patterns. Data collected from fatal accident reports during the recession in December 2008-March 2009, were compared to the same period in 2005/2006, 2006/2007 and 2007/2008 during which period the economy was stronger. The only significant difference was that the number of fatalities and number of fatal accidents were higher during periods of economic growth. No significant difference was found with respect to, among others, accident type, time of day, age or gender distribution.
Keywords: traffic safety, state of the market, recession, model, accidents, driver behaviour ISSN: Language: No. of pages:
0347-6030 English 32

Utgivare: Publikation:
VTI rapport 704A
Utgivningsår:
2012
Projektnummer:
200809
Dnr:
2008/0616-28
581 95 Linköping Projektnamn: Konjunkturens påverkan på dödade och skadade i trafiken
Författare: Uppdragsgivare: Mats Wiklund, Lennart Simonsson, Åsa Forsman Vägverket
VTI
Titel: Trafiksäkerhet och konjunktur. Långtids- och korttidsanalyser samt litteraturstudie
Referat (bakgrund, syfte, metod, resultat) max 200 ord:
Vid analys av trafiksäkerhetsdata är det viktigt att ha så god kunskap som möjligt om både system-interna och systemexterna faktorer. Exempel på det förra är trafikantbeteende och vägarnas säkerhetsstandard, medan exempel på det senare är demografisk sammansättning och ekonomisk konjunktur.
I denna rapport ges en översikt över tidigare studier om kopplingen mellan ekonomisk konjunktur och trafiksäkerhet och vilka mått på det ekonomiska läget som använts. Det visade sig att arbetslöshet var den vanligaste ekonomiska förklaringsvariabeln där en ökning av arbetslösheten indikerar en nedgång av antalet trafikdödade. Samma resultat visade sig gälla för svenska förhållanden när en tidsserieanalys utfördes på svenska data. Det visade sig också att en del av nedgången i antalet trafikdödade under lågkonjunktur förklaras av att unga förare minskar sitt bilåkande. Detta är dock inte hela förklaringen utan det finns kvar en effekt av arbetslöshet som inte beror på unga förares bilåkande.
En hypotes är att det ekonomiska tillståndet påverkar inte bara unga förare utan resmönster mer generellt. För att studera detta jämfördes data från dödsolyckor under en period med lågkonjunktur, december 2008 – mars 2009, med data från motsvarande period 1, 2 och 3 år tidigare då det ekonomiska läget var bättre. Den enda signifikanta skillnaden som hittades var att antal dödade och anta dödsolyckor var fler under högkonjunktur. Inga signifikanta skillnader kunde påvisas med avseende på, bland annat, olyckstyp, tid på dagen, ålders- eller könsfördelning.
Nyckelord:
Trafiksäkerhet, konjunktur, lågkonjunktur, modell, olyckor, trafikantgrupp, trafikantbeteende ISSN: Språk: Antal sidor:
0347-6030 Engelska 32

VTI rapport 704A Photos: Hejdlösa Bilder
Preface This is a shortened international version of the VTI Report 704 “Traffic safety and the economic situation-model approaches and a literature survey” by Wiklund et al. (2011). The original report was commissioned by the Swedish Road Administration to study the connection between the number of road fatalities and the economic situation. The project consisted of three tasks: a survey of literature, an analysis of historical accident data and a closer examination of fatal accidents occurring around the most recent recession at the end of 2008.
The authors thank the Swedish Road Administration for allowing us to use material from their in-depth fatal accidents studies. We thank our colleagues at VTI, Hillevi Nilsson Ternström, for assistance with the literature survey, and Mohammad-Reza Yahya for estimates of annual traffic mileage for people of different ages based on an annual traffic safety questionnaire. We are also very grateful to Örjan Hallberg and Östen Johansson for their discussion on the elevated risk of traffic accidents involving inexperienced car drivers as a supplement to the original report.
Linköping, October 2012
Åsa Forsman

VTI rapport 704A
Quality review This is a shortened international version of the VTI report 704 (Swedish version). Internal peer review of the Swedish version was performed on 10 December 2010 by Jörgen Larsson. Lennart Simonsson has made alterations to the final manuscript of the report. The research director and project manager Astrid Linder examined and approved the report for publication on 14 February 2012.

VTI rapport 704A
Contents
Summary ............................................................................................................ 5
1 Introduction .............................................................................................. 7 1.1 Purpose ................................................................................................... 7 1.2 Overview .................................................................................................. 7 1.3 Material not included in this translation .................................................... 8
2 The influence of the business cycle on traffic safety – theories and results from time series analyses – a literature review............................. 9
2.1 Theories about the association between economic development and traffic safety ............................................................................................. 9
2.2 Measures of economic development ..................................................... 11 2.3 Time series analyses ............................................................................. 12 2.4 Discussion and conclusions ................................................................... 13
3 Analysis of a time series of Swedish accident data ............................... 14 3.1 Brüde’s model ........................................................................................ 14 3.2 Brüde’s model expanded with the number of unemployed .................... 15 3.3 Brüde’s model with different types of traffic mileage .............................. 16
4 Analysis of fatal accidents during a period of severe economic recession. Part I: Travel patterns and traffic composition ........................................ 19
4.1 The number of accidents and accident victims ...................................... 20 4.2 Type of accident .................................................................................... 21 4.3 Time of day ............................................................................................ 22 4.4 Road authorities ..................................................................................... 22 4.5 Age and gender ..................................................................................... 23 4.6 Traffic elements ..................................................................................... 24
5 Analysis of fatal accidents during a period of severe economic recession. Part II: Driver behaviour ......................................................................... 25
5.1 Presentation of the material ................................................................... 25 5.2 Risky behaviour ..................................................................................... 26
6 Concluding remarks ............................................................................... 29 6.1 Summary of models for road fatalities.................................................... 29 6.2 Further research .................................................................................... 30
References ....................................................................................................... 31

VTI rapport 704A

VTI rapport 704A 5
Traffic safety and economic fluctuation. Long-term and short-term analyses and a literature survey by Mats Wiklund, Lennart Simonsson and Åsa Forsman VTI (Swedish National Road and Transport Research Institute) SE-581 95 Linköping, Sweden
Summary One reason for studying the traffic mortality rate is to establish if a traffic safety improvement measure, such as reducing speed limits, has been effective. In doing so, it is important to consider other variables that also influence the mortality rate. One such variable that is often included in traffic safety analyses is the vehicle mileage on the roads. Another factor is fluctuation in the economy. Several researchers have found statistical correlation between the state of the economy and the traffic mortality rate. This correlation was recently observed in Sweden during the recession in the autumn of 2008 when a substantial drop in the number of fatal road accidents occurred.
This report includes a survey of statistical methods used by previous researchers comprising which variables they used as indicators of the state of the market. The most common variables were unemployment rate or the number of unemployed, while the level of the industrial production such as the Gross National Product (GNP) was used to a lesser extent. Based on these findings, a model including time trend, vehicle mileage and the number of unemployed was fitted to a time series of Swedish data. The results showed that an increase in unemployment indicates a decrease in the number of traffic fatalities.
Two theories as to why the employment rate correlates to the mortality rate have been studied in greater detail. The first theory is based on that the demand declines in a recession. Hence, less Heavy Goods Vehicles (HGV) utilise the roads, which in turn influence the mortality rate since accidents involving HGVs often have serious consequences. The second theory is that young adults, who tend to have an increased risk of being involved in a traffic accident, often are affected worse by unemployment during a recession and therefore decrease their car use more than others. Estimates of the annual mileage of HGVs and the annual mileage of drivers under the age of 25, as well as the unemployment rate, were included in a model of the number of road fatalities in Sweden between 1981 and 2008. However, only the annual mileage of drivers under the age of 25 and the unemployment rate were kept in the final model.
A further theory is that the state of the market affects the road users’ travel patterns. Data collected from fatal accident reports during the recession in December 2008–March 2009, were compared to the same period in 2005/2006 and 2006/2007 during which the economy was stronger. The results showed that the number of fatalities and number of fatal accidents were higher and collisions accidents were more frequent during periods of economic growth. No significant difference was found with respect to, among others, time of day, age or gender distribution.

6 VTI rapport 704A
It has been suggested that periods of economic growth may induce a higher level of stress in society. Therefore, the above mentioned fatal accidents were also compared with respect to possible high risk behaviour by the involved drivers such as speeding, not wearing a seat belt, driving while tired or under the influence of drugs or alcohol. Further high risk behaviour which may be influenced by the economy is driving without a valid driving license or using illegal or inappropriate tyres for the road conditions. The results showed that the above mentioned driver behaviour seems to be the same irrespective of the state of the market. The comparison thus appears to indicate that the amount of “general” fatal accidents as well as fatal accidents where possible high risk behaviour was present, decreased at the same rate during periods of recession. The only exception was the number of suspected suicides, which was constant or slightly elevated during the recession period, making their share of the traffic fatalities greater during recession than during economic growth.
This study confirms results gained in previous studies that the number of road fatalities appears to decrease during a recession. The reduction in the traffic mortality rate during an extended period can partly be attributed to young adults driving less; in particular during the recession in the early 1990s. However, the question of how economic fluctuation affects the mortality rate is still largely unanswered. A more detailed study into how travel habits vary according to the state of the economic market may illuminate new ideas for further research.

VTI rapport 704A 7
1 Introduction There are convincing reasons to assume that the business cycle influences traffic safety. There is less demand for transportation in a period of low economic activity, which implies that there is less traffic on the roads. Less traffic means that the road-users are less exposed to the risk of having a traffic accident. Thus the traffic safety tends to improve in a recession and deteriorate in times of economic growth.
The state of the economy may affect traffic safety in other ways than just the sheer amount of mileage and a number of theories have been suggested as reasons for the change in the accident rate. One theory is that the traffic mileage change during an economic growth and HGV road use increase. A higher number of HGVs on the roads may have an impact on traffic safety as accidents involving HGVs often has severe consequences.
Other theories are that our behaviour as road-users is influenced by economic conditions and that our mode and habits of travel is different in a recession compared to in economic growth. A particular example of the latter is that younger people are worse affected by unemployment in a recession and tend to reduce their car driving more than older people. They may also await better economic times to take their driver’s license, hence fewer inexperienced driver´s, prone to accidents, use the roads. Arguments along these lines appear in the short note by Bjørnskau (2009) that discusses why there were fewer road fatalities in Norway in 2008, during the international financial crisis, than in 2009.
1.1 Purpose The aims of this study were threefold. The first step was to survey previous studies that have explored how traffic safety is related to the economic situation. The second goal of the study was to incorporate variables that are connected to the state of the economy into a statistical model of road fatalities in Sweden.
Finally, fatal accidents that occurred during the recession around the turn of the year 2008/2009 were compared to accidents that occurred in better economic conditions. The third part of the study concerns the traffic situation as well as driver behaviour, e.g., drink-driving.
1.2 Overview Section 2 is a review of literature up to the year 2008 that in some way incorporate economic factors into an analysis of traffic accident statistics. The theories of how the business cycle influences traffic safety are presented followed by an account of variables they used to represent the state of the economy.
In Section 3, a regression model of road fatalities in Sweden first proposed by Brüde (1995) is supplemented with further explanatory variables. In the first part of the section, unemployment is introduced as a new variable and that improved the fit of the model considerably. The second part of the section uses a more exploratory approach where, in addition to economic variables, an estimate of the mileage for HGVs and young car drivers is added to the model.

8 VTI rapport 704A
From December 2008 to March 2009 there were unusually few road fatalities in Sweden. This period coincided with a recession following the financial crisis in 2008. Those accidents have been compared to accidents in the same winter months during the three preceding years when the economic conditions were better. In Section 4, data from the official accidents statistics is compared to investigate if proportionally more young people are killed on the roads in a period of high economic activity, or if the type of vehicles involved in accidents differs. Section 5 focuses on inappropriate driver behaviour and uses information from in-depth studies of fatal accidents. The occurrence of speeding, drink-driving and driving while tired is compared to establish if the theory that more aggressive driving occur in a period of economic growth. Driving without a valid licence or driving with summer tyres fitted on winter roads are further inappropriate behaviour that may be due to variables in the economy.
Section 6 concludes the report with a summary and brief discussion of results.
1.3 Material not included in this translation Wiklund et al. (2011) comprise certain material that is of somewhat less relevance and has been omitted in order to improve readability. An extensive presentation of the statistical models used by the references in Section 2 has not been included; none of the references use the Poisson regression framework in Section 3 so the continuity of the exposition is not lost. In Section 3, the description of models including GNP instead of unemployment was dropped since unemployment transpired as a better descriptive variable.
The greatest omission in Section 3 is a series of experiments comprising models inspired by Forsman (2008) who uses Poisson regression with a more complicated model for the random errors. Some tests experienced issues with numerical stability of the estimates and potential over-fitting of the data. Therefore, those variants of Poisson regression could not be fully supported and are not presented here.
A small number of tables with data showing no significant difference between accidents during the recession or accidents during the economic growth were deleted from Section 4.
Wiklund et al. (2011) include a supplement by Örjan Hallberg and Östen Johansson regarding the higher risk of young and inexperienced car drivers to be involved in traffic accidents. They presented a model of the road fatalities in Sweden with an estimate of the number of novice drivers entering the driver population each year as the only explanatory variable. Though that model is very interesting in its own right, after deliberation, we decided not to include it here because it does not correlate traffic safety directly to the economic situation.

VTI rapport 704A 9
2 The influence of the business cycle on traffic safety – theories and results from time series analyses – a literature review
In this chapter, we summarise available literature on how the business cycle influence traffic safety. In some of the reviewed papers, the goal has been to specifically study the association between economic factors and traffic safety, while other papers only aim at controlling for these factors when, for example, evaluating certain traffic safety measures. In this chapter, however, we describe theories about and results for the economic development, including papers where this has not been the main purpose.
For a long time, discussions about the correlation between economic development in general and the number of traffic accidents, has been active. Peltzman (1975) discusses how income may influence driving behaviour and consequently also the accident risk. He argues that increased income leads to increased demand for intense driving. Although not specifically defined, intense driving means risky behaviour, for example speeding and a predisposition to overtake other cars. Since then, a number of studies have been conducted where economic development is used to explain changes in traffic safety. Different approaches to measure traffic safety have been used, such as the number of fatal accidents, the number of killed and severely injured people, and the number of fatalities per motor vehicle mileage. For the purpose of this presentation we have used the concepts accident and accident risk in general, unless it is of importance to specify the specific approach.
2.1 Theories about the association between economic
development and traffic safety A change in the economic situation affects individuals’ needs and possibilities for travelling, which in turn influences the risk of being injured or killed in a traffic accident. In order to understand how economic development affects traffic safety, it is necessary to understand the whole chain of events. In the reviewed papers there are many theories about the nature of this association. These can be roughly categorised into theories about travelling frequency and pattern, driving behaviour, and vehicle safety and road conditions.
Most papers do not discuss the association between economic factors and traffic safety in detail; they only mention a possible theory. Many papers present more or less the same theories, and the origin of the theories is often unknown.
In some papers, however, there are longer discussions about the influence of the economy. Peltzman (1975) has a line of argument about the demand for driving intensity and travelling safety, and how this is affected by personal economic prerequisites. Tay (2003) discusses a number of different theories which in part is a compilation of earlier work. In Wagenaar (1984) the perspective is broadened into how economic factors affect people’s health in more general terms, not just in relation to traffic.
2.1.1 Theories about changes in travelling frequency and pattern The starting point is that an economic recession leads to less travelling and hence less exposure to traffic and a decreased number of accidents. This is partly because people cannot afford to travel as much as before, partly because the recession leads to higher unemployment rates, implying fewer journeys to and from work. All of the papers in

10 VTI rapport 704A
this study concentrate on the travelling of households, but Tay (2003) mentions that even freight traffic follows the economic cycles, and Haque (1993) writes that freight traffic is more heavily influenced than commuter traffic during an economic recession.
In addition to a general decrease in travelling, the economic development may influence the distribution of travel across travel types as well as demographic groups. One theory is that travel for recreational purposes and in connection with leisure activities are influenced more than journeys to and from work if income is changed (Hakim et al., 1991; Haque 1993; Tay, 2003; Wagenaar, 1984). Such travels are also connected with a higher accident risk, since they are more often done in the evening and at night. Travelling in the evening and at night is riskier than travelling during the day due to lack of visibility, higher speeds and a larger proportion of tired, drunken, and young drivers on the road. Longer holiday travels are also connected with an increased risk, since they more often than other travel types take place on roads with high speed limits and in unknown environments.
Tay (2003) goes on to write that increased income leads to an increased demand for travelling in private vehicles instead of by public transport. This may also have a negative effect on traffic safety, since public transport travelling is generally safer than other types of travel.
Many authors also mention that young people’s travels to a great extent are influenced by the business cycle (Hakim et al., 1991; Haque 1993; Tay, 2003; Wilde and Simonet, 1996). The explanation is that young drivers more often than others become unemployed when times are hard, and that they also have a higher accident risk, which leads to a stronger effect of economic changes. Tay (2003) mentions that this may also be true of the elder labour force, while the middle-aged are least affected by economic fluctuations in general.
An economic recession may also lead to a decreased number of new driving license holders, which leads to fewer novices in traffic (Joksch, 1984).
2.1.2 Theories about changes in driving behaviour Many researchers have stated that driving behaviour may be influenced by changes in the economic cycle, which in turn affect the risk of an accident.
One theory is that people drive more carefully during an economic recession, possibly in order to avoid the resulting costs of an accident, e.g., costs of repair (Joksch, 1984; Wilde, 1991). On the other hand, unemployment or unemployment threat may lead to mental stress, which results in worse driving behaviour such as aggression, lack of attention, and increased risk-taking (Haque, 1993; Van den Bossche et al., 2005; Wagenaar, 1984).
Another type of stress connected to time pressure due to work and lifestyle may arise from economic growth. Gullon (2002) brings up that stress related to work leads to distraction, which leads to accidents. Peltzman (1975) argues that increased driving intensity in the form of driving at higher speed with more overtaking’s leads to having more time to spend on working and making money. In times of economic growth there is a demand for high driving intensity, which increases the risk of an accident.
Thus, both economic recession and growth may lead to the very same behaviour, but for different reasons.

VTI rapport 704A 11
2.1.3 Theories about changes in vehicle safety and road conditions A negative effect of difficult economic times is that car manufacturers are less likely to invest in safety improvements (Tay, 2003). There is also less demand for safe cars which is negative for traffic safety (Van den Bossche et al., 2005; Scuffham, 2003; Tay, 2003). However, Van den Bossche et al. (2005) presents the theory that this could lead to risk compensation: you drive more carefully because you know your car is less safe. Correspondingly, Peltzman (1975) argues that people with higher income demand safer cars, but at the same time these people may also feel that increased safety allows for riskier behaviour.
Some researchers have a similar reasoning when it comes to road safety standards. During an economic recession the infrastructure budget may be reduced, leading to roads of poorer quality which could have a negative effect on safety (Van den Bossche et al., 2005; Scuffham, 2003; Tay, 2003).
2.2 Measures of economic development There are a number of different variables used to describe economic development, but mostly only one variable per study is used. This is probably because the variables are strongly correlated, which may cause model fitting problems.
The most common measure in the reviewed literature is the degree of unemployment (Farmer, 1997; Haque, 1993; Hermans et al., 2006; Neumayer, 2004; Newstead et al., 1998; Partyka, 1991; Pettitt et al., 1992; Reinfurt et al., 1991; Scuffham, 2002; Tay, 2003; Wagenaar, 1984; Van den Bossche et al., 2005; Wilde et al., 1991; Wilde and Simonet, 1996). The number of unemployed and the unemployment rate are about equally common. Sometimes there are other measures of employment, such as the number of employees, the number of full-time employees, and the number of people out of the labour force (Partyka, 1991; Reinfurt et al., 1991; Wilde and Simonet, 1996). However, these measures always appear as supplements to the number of unemployed and the unemployment rate.
Wilde and Simonet (1996) point out that there are some problems with using the unemployment rate as a measure: if unemployment persists for a long time, young people may invest their time in education instead of trying to find a job, and the elderly among the unemployed may tire of looking for work and therefore retire. This leads to a change in the number of people accounted for as part of the labour force.
Other measures that are also related to an individual’s situation are disposable income (Neumayer, 2004; Peltzman, 1975), gross income (Fridstrøm, 1997), and consumers’ valuation of the economic situation (consumer sentiment) (Pettitt et al., 1992).
Many researchers have also chosen to use measures of the general economic development. In studies from the US (Joksch, 1984), Spain (Garcia-Ferrer, 2007), and Switzerland (Wilde and Simonet, 1996), the index for industrial production is used, and in an Australian study (Tay, 2003) the ‘leading index’ is used. The Gross Domestic Product (GDP) is used by Al-Alawi et al (1996), Gullon (2002), and Noland (2005), and a regionally divided GDP has been used to study accident trends in China (Hu et al., 2008).
Often the choice of economic variable is not further explained, but in Tay (2003) there is a comparison between the two variables unemployment rate and leading index. It is assumed that the unemployment rate describes short-term changes, and that the leading

12 VTI rapport 704A
index describes mid-term changes. The result shows that the unemployment rate better explains the observed number of accidents with severe injuries during periods of time being defined as alcohol intensive (mainly evenings and nights), while the leading index is the better measure concerning accidents during other time periods. One possible reason for this is that travels made in the evening and by night are more sensitive to short-time changes in income than are travels made during the day. There is also a belief that the consumption of alcohol is influenced by changes in income, making people drink at home to a greater extent than in restaurants in times of high unemployment. Hence the unemployment rate would be a suitable measure when explaining accidents occurring in the evening and by night.
In the review of earlier studies presented in Hakim et al. (1991), the following additional measures of economic development are included: GNP, consumption per capita, retail trade sales, grocery sales, and bank rates. However, the most common measure is the number of unemployed or the unemployment rate.
2.3 Time series analyses A number of different kinds of statistical models have been used to study traffic safety development.
In general, a negative association is obtained between economic development and traffic safety; economic expansion with fewer unemployed leads to reduced traffic safety in the form of more accidents, injuries and fatalities. This can be seen in studies from many different countries: Australia (Haque, 1993; Newstead et al., 1998; Tay, 2003), Norway (Fridstrøm, 1997), Switzerland (Wilde and Simonet, 1996), Germany (Neumayer, 2004), and the US (Farmer, 1997; Joksch, 1984; Partyka, 1991; Peltzman, 1975; Reinfurt et al., 1991; Wagenaar, 1984). In some of these studies, however, there is no significant association between economic development and traffic safety when subpopulations are analysed.
The theory of a negative association between economic development and traffic safety is also supported by the review of studies presented in Hakim et al. (1991). In all of these studies a negative association was found.
There are, however, a few exceptions indicating the opposite effect. The first is data from Belgium examined by Hermans et al. (2006) and Van den Bossche et al. (2005). The two studies are comparatively equal concerning the variables used, but the time series are of unequal length. Van den Bossche et al. (2005) examined data from 1990 to 2001, while Hermans et al. (2006) looked at data from 1974 to 1999. In both cases monthly data was used. Van den Bossche et al. (2005) presented results where the number of unemployed was positively associated with the number of fatal and severe accidents, as well as with the number of killed and severely injured people. However, there were no significant associations concerning slightly injured and the number of accidents with slightly injured people. The results were the same whether or not exposure was included in the model. Hermans et al. (2006) only found significant (at the 10 % level) results concerning the number of killed and injured people.
The second exception is a study from Oman resulting in a negative association between GPD and the number of car accidents (Al-Alawi et al., 1996). Here, annual data from the period 1976-1990 was analysed by means of principal component regression.
In the other studies there were no significant associations (Noland, 2005; Pettitt et al., 1992) or no statistical tests were performed (Gullon, 2002).

VTI rapport 704A 13
In the above given review we have only looked at the effect of simultaneous associations, that is, the association between the outcome of one economic variable for one period of time and the number of accidents or injured for the same period of time. In Wagenaar (1984) there are also lagged associations and the result shows that an increase in the proportion of unemployed leads to a decrease in the number of drivers involved in accidents the very same month, and an increase the next month.
There are also a couple of studies where only lagged associations are found. A study from Spain shows that an increase in the index for industrial production is followed by an increase in the number of accidents the next month (Garcia-Ferrer, 2007). Scuffham (2002, 2003) shows that an increase in the proportion of unemployed is followed by a decrease in the number of fatal accidents, one and three quarters months later, respectively.
It is hard to describe the lagged associations in general terms since they are examined in only a few studies. If such associations exist they could be partly due to delayed effects of economic changes, partly due to a time lag in the economic measure itself.
2.4 Discussion and conclusions The theories being presented in the literature supports both positive and negative consequences for traffic safety in times of economic growth. However, results from the time series analyses show that the negative associations almost always take effect. Economic growth is followed by traffic safety degradation.
In order to meet increased risks in times of economic growth it is of great importance to understand the associations. However, from the reviewed studies it is difficult to make a connection between results and theories. This is because the associations studied are between economic factors and the number of accidents or the number of injured, while the theories describe, for example, how travel patterns and driving behaviour change. To better understand the associations there is a need for building models being more closely connected with the theories by, for example, utilising travel surveys and surveys of individual income and occupation.
In most of the studies unemployment has been used as a measure of economic development. There is, however, a need for more research concerning what measures should be used. Results from Tay (2003) shows that different measures can be relevant for different types of accidents.
Almost exclusively, the articles treat passenger transport and the households’ needs for transports. However, freight transport should be more closely examined as well, along with its changes in times of economic growth and recession, and its impact on traffic safety.

14 VTI rapport 704A
3 Analysis of a time series of Swedish accident data In this chapter, a previous model of the number of annual traffic fatalities is complemented with economic variables. Also, we test the theories that part of the increase in the number of traffic fatalities in times of economic growth is explained by the presence of a larger number of both inexperienced drivers and HGVs in traffic.
3.1 Brüde’s model Poisson regression models are often used to analyse accident data. In the version that has been used by VTI, the dependent variable, ( )ty = the number of traffic fatalities in year t, is assumed to be a Poisson random variable, and the logarithm of its expected value is assumed to be a linear function of d explanatory variables.
( ) ))((E)(,)()()(exp)( 22110 tyttxbtxbtxbbt dd =++++= µµ (1)
Brüde (1995) used model (1) with the two explanatory variables )(1 tx = time (t=1 in 1977) and )(2 tx = the logarithm of the traffic index, where the traffic index is 100 times the traffic mileage relative to 1977. The number of traffic fatalities between 1977 and 2008 along with an estimate of the annual traffic mileage were used to fit the model
ct extrafficindabty =)( (2)
Which yielded the estimates 𝑎�=0.028, 𝑏�=0.939 and �̂�=2.276. According to this model, the number of traffic fatalities decreases by, on average, 6 per cent each year, given that there is no change in traffic mileage.
There is no economic variable explicitly included in (2), but Brüde (1995) mentions that traffic mileage seems to be strongly correlated with the economic situation. Two measures of the economic situation are GNP and the number of unemployed. GNP per capita (in the monetary value of the year 2000) and the number of unemployed was collected from Statistics Sweden; these data are shown in Figure 1. Traffic mileage as well as GNP per capita is described fairly well by a straight line. The correlation between GNP per capita and each of the two variables traffic mileage and time (t) is
96.0≈ρ . The number of unemployed is not as strongly correlated with traffic mileage
( 65.0≈ρ ) and time ( 71.0≈ρ ), and hence it may be a more suitable economic variable.

VTI rapport 704A 15
3.2 Brüde’s model expanded with the number of unemployed Due to the strong correlation between GNP per capita and traffic mileage we decided to use the number of unemployed to describe the economic situation. The following model was used
dct unemployedextrafficindabty =)( (3)
yielding the parameter estimates 𝑎�=1.454, 𝑏�=0.956, �̂�=1.471 and �̂�=-0.120. Compared with (2) a large part of the effect of traffic mileage is carried over to the number of unemployed. As is shown in Figure 2, the model (3) is better than the model (2) when detecting the increase in the number of fatalities right before the turn of the century.
Figure 1 Time series of the two economic variables GNP per capita (green solid line, in tens of thousands of kronor) and the number of unemployed (red dashed line, in tens of thousands of persons). The units are chosen so that the two variables may be shown in the same figure.

16 VTI rapport 704A
Figure 2. The red circles show the number of traffic fatalities according to official statistics. The graphs are based on values calculated in accordance with Brüde’s original model (2) with only time and traffic mileage as explanatory variables (green dashed line), and the expanded version (3) including the number of unemployed (grey dotted line). 3.3 Brüde’s model with different types of traffic mileage In good economic times increased demand generates more freight transports, some of which take place on roads. Accidents involving HGVs often have serious consequences, and therefore the amount of truck traffic is a candidate for model inclusion. Young drivers are associated with a higher accident risk, and they are also supposed to suffer more greatly from unemployment during economic recession, which could lead to a decrease in travels. As in Forsman (2008), drivers up to the age of 24 are categorised as young.
The traffic mileage for HGVs was collected from Björketun and Nilsson (2007), in which the total amount of traffic mileage is divided into different types of vehicles. The traffic mileage of young drivers was estimated via a questionnaire study (a traffic safety survey conducted by the Swedish Road Administration) which included a question on last year’s distance driven by car. Further details can be found in Wiklund et al. (2011).

VTI rapport 704A 17
If the traffic mileage in model (3) is broken down into HGVs, private cars driven by young persons, and other vehicles, and if both GNP and unemployment are used, the model becomes
gfedct RTMHTMYTMunemployedGNPabt =)(µ (4)
where
=)(tµ expected value of the number of traffic fatalities (assumed to be a Poisson random variable)
t = the number of years passed since 1981 (t = 0)
GNP = GNP transformed into the monetary value of the year 2000, in hundreds of billions
unemployed = the number of unemployed, in tens of thousands of persons
YTM = traffic mileage of private cars driven by persons up to the age of 24, in billions of km
HTM = traffic mileage of HGVs, in billions of km
RTM = remaining traffic mileage, in billions of km Data from 1981 (the start of the traffic safety surveys) to 2008 is used to estimate the model parameters. A stepwise regression starting with the complete set of variables resulted in removing GNP and the traffic mileage of heavy trucks. The parameter estimates of the final model were a=36.525, b=0.969, d=-0.121, e=0.266 and g=0.789.
On the way towards the final model the variable GNP was the first to be dropped, followed by HTM, the traffic mileage of heavy trucks. This is probably due to a strong correlation with the total traffic mileage. During the time period of interest, with small year by year variations the HGV traffic was 5.2–6.2 per cent of the total traffic mileage, thus a fairly constant proportion.
According to Figure 3 this is not valid for young persons; their proportion of the total traffic mileage was large (>10 %) in the 1980’s, but then a downward trend started during the beginning of the 1990’s, perhaps as a result of the economic recession at that time. The continuously low level may in part be explained by the fact that young persons of today favour studies over work and hence cannot afford having a car.

18 VTI rapport 704A
Figure 3. Traffic mileage of private cars driven by persons up to the age of 24, estimated using data from traffic safety surveys. The red stars show the traffic mileage in billions of km, and the blue circles show the estimated proportion (%) of the total traffic mileage. According to the model, the decrease in the number of fatalities during the 1990’s may in part be explained by a reduced traffic mileage among young drivers. The increase in the number of traffic fatalities in the end of the 1990’s corresponds to an increase in traffic mileage among young drivers. This association between traffic mileage among young drivers and fatal accidents has, among others, been observed by Brüde (2001).
HGV traffic mileage did not enter the final model since it was more or less a constant proportion of the total traffic mileage. However, it could be part of a separate model for HGVs. Further possible developments include constructing models based on monthly or quarterly data, since the economic situation may change at any time of the year.

VTI rapport 704A 19
4 Analysis of fatal accidents during a period of severe economic recession. Part I: Travel patterns and traffic composition
During the period December 2008 to March 2009 there was a substantial decrease in the number of traffic fatalities compared with the same period in earlier years. Since this period coincided with economic recession in Sweden, it is a suitable period to use for studying the association between economic development and traffic safety. Here we present results from a short-time study where the time period mentioned above is compared with the corresponding time period one, two and three years earlier (control period).
During the control period there was economic growth. This is illustrated by Figure 4 showing the Economic Tendency Survey of the National Institute of Economic Research (NIER), which compiles business and consumers’ view of the economy and pictures the economic situation. By using the same months, problems with seasonal variation is avoided. Furthermore, keeping to a relatively short period of time decreases the risk of long-term trends becoming a nuisance factor in comparisons. There may however be a small effect from different weather conditions between the four winters that this study does not attempt to take into account.
Figure 4. The Economic Tendency Survey of the National Institute of Economic Research, monthly from September 2003 to September 2009. Red dots represent the studied period and blue dots represent the control periods. Source: NIER. Below we take a closer look at accident statistics that in some respect might be linked with travel patterns and traffic composition. This includes the number of fatalities and the number of vehicles involved per accident, the proportion of accidents involving HGVs, and collision accidents compared with single-vehicle accidents. As journeys made by young persons and during non-working hours are assumed to be more common in times of economic growth, it is also of interest to examine the age distribution of persons killed in traffic and the time at which the accidents occurred.
0
20
40
60
80
100
120
2003
M9
2003
M12
2004
M3
2004
M6
2004
M9
2004
M12
2005
M3
2005
M6
2005
M9
2005
M12
2006
M3
2006
M6
2006
M9
2006
M12
2007
M3
2007
M6
2007
M9
2007
M12
2008
M3
2008
M6
2008
M9
2008
M12
2009
M3
2009
M6
2009
M9

20 VTI rapport 704A
The results presented here are data on accidents resulting in fatalities or serious injuries that have been reported to the Swedish Traffic Accident Data Acquisition (STRADA) by the police. Of primary interest are the fatal accidents; the non-fatal accidents are used to check whether results based on the fatal accidents are due to real changes or simply chance.
The results are presented in tables which include P-values from odds1 tests (Tables 1 and 3) and tests of homogeneity, so-called chi-square tests, which are used when comparing two or more populations with respect to the distribution of some categorical variable. Prior to testing, the data from the three periods of economic growth was combined. Relative decrease means a decrease in the number of accidents between the period of growth and the period of recession, defined as 1 – #(accidents during recession) / mean(#(accidents during growth)), where mean(#(accidents during growth)) is the average number of accidents of the three periods of economic growth. Concerning relative decrease, the results in Tables 4-8 are presented for purposes of description and no further testing has been performed.
4.1 The number of accidents and accident victims Table 1 shows the number of fatal accidents and the number of fatalities for each time period. The number of fatalities has relatively decreased more than the number of fatal accidents. During the recession period there are only two cases with more than one fatality per accident.
Table 1. The number of fatal accidents and the corresponding number of fatalities. High06 means the period December 2005–March 2006; High07 means December 2006–March 2007, etc. High06 High07 High08 High
average Low09 Relative
decrease P-value
Number of fatal accidents
104 123 102 109.7 69 37.1 % < 0,001
Number of fatalities
121 136 122 126.3 71 43.8 % < 0,001
In Table 2 we see a significant difference between the High and Low periods with respect to the proportion of fatal accidents with more than one fatality per accident. This could be because of changes in accident types as well as fewer passengers per vehicle during the Low period.
1 From Table 1, an estimate of the odds of a fatal accident during economic recession is 3×69/(104+123+102); an estimate of the variance of the logarithm of the odds is (1/104)+(1/123)+(1/102)+(1/69). The null hypothesis is that the logarithm of the odds is 0. Odds tests concerning the number of fatalities in Tables 1 and 3 are carried out in the same way.

VTI rapport 704A 21
Table 2. The number of killed, severely injured and slightly injured persons per fatal accident. High06 High07 High08 High
average Low09 P-value
Number of fatalities/ fatal accident
1.16 (1.09)*
1.11 (1.07)*
1.20 1.15 1.03
Prop. of fatal accidents with 2 or more fatalities
8.7 % 6.5 % 16.7 % 10.3 % 2.9 % 0.05
Number of seriously injured/fatal accident
0.64 (0.42)*
0.39 (0.34)*
0.45 0.49 0.26
Prop. of fatal accidents with seriously injured
30.8 % 23.6 % 25.5 % 26.4 % 20.3 % 0.29
Number of slightly injured/fatal accident
0.86 (0.69)*
0.91 (0.53)*
0.47 0.76 0.46
Prop. of fatal accidents with slightly injured
41.3 % 30.1 % 28.4 % 33.1 % 31.9 % 0.84
* Each of High06 and High07 includes a serious bus accident involving several persons killed or injured. Results exclusive of these accidents are shown within brackets.
The number of severely injured persons has not decreased to the same extent as the number of fatalities (Table 3). Equally, there is no distinct change in the number of injured per accident.
Table 3. The number of accidents involving severely injured persons and the corresponding number of severely injured persons. High06 High07 High08 High
average Low09 Relative
decrease
Number of accidents with sev. injured
709 871 764 781.3 707 9.5 % 0.43
Number of severely injured
939 1096 938 991 865 12.7 % 0.22
Number of injured per accident
1.32 1.26 1.23 1.27 1.22
4.2 Type of accident Concerning the distribution across collision types there is a significant difference between the High and Low periods. Moreover, the largest relative decrease in the number of accidents is within the category pedestrian/cyclist/mopedist (p/c/m) road-users in collision with motor vehicles; collisions between motor vehicles comes next, followed by single vehicle collisions. The fact that collision accidents decrease more than single vehicle accidents when traffic mileage decreases is inherent, since the number of oncoming vehicles decreases roughly in proportion to the square of the traffic mileage. However, it is unclear why the largest decrease is seen within the class p/c/m road users in collision with motor vehicles.

22 VTI rapport 704A
Table 4. Distribution of fatal accidents by collision type. P=0.04. Collision type distribution by time period
High06 High07 High08 High average Low09 Relative decrease in the
number of accidents p/c/m & motor veh. 25.0 % 30.9 % 21.6 % 26.1 % 18.8 % 54.6 %
Motor vehicles 48.1 % 36.6 % 47.1 % 43.5 % 36.2 % 47.6 %
Single vehicle 22.1 % 24.4 % 24.5 % 23.7 % 29.0 % 23.1 % Other 4.8 % 8.1 % 6.9 % 6.7 % 15.9 % Incr. 50.0 %
Even for accidents involving seriously injured, the largest decrease is within the category p/c/m road users in collision with motor vehicles, followed by collisions between motor vehicles. The number of single vehicle accidents is basically unchanged.
Table 5. Distribution of accidents with severely injured by collision type. P=0.07. Collision type distribution by time period
High06 High07 High08 High average Low09 Relative decrease in the
number of accidents p/c/m & motor veh. 19.6 26.1 24.7 23.7 19.1 27.0 %
Motor vehicles 41.3 33.5 29.8 34.7 35.6 7.0 %
Single vehicle 27.5 29.9 35.2 30.9 34.0 0.6 % Other 11.6 10.6 10.2 10.8 11.3 4.8 %
4.3 Time of day The High and Low time periods have also been compared with respect to the distribution of accidents by the hours of the day. The day was split into three parts and the results are presented in Table 6. The difference between the distributions is not significant, but the observed relative decrease is largest during evenings.
Table 6. Distribution of fatal accidents by time of day. P=0.30. High06 High07 High08 High average Low09 Relative
decrease
Day (6-18) 69.2 65.9 66.7 67.2 73.5 32.1 %
Evening (18-23)
17.3 20.3 21.6 19.8 11.8 63.1 %
Night 13.5 13.8 11.8 13.1 14.7 30.2 %
4.4 Road authorities All Swedish highways and major rural roads are maintained by the Swedish Transport Administration while streets in built-up areas are maintained by each District Council. Minor roads in Sweden are maintained by the land owners with the support of government funds. The road authority variable in STRADA can be used as a proxy for whether the accident occurred within a built-up area.
The largest decrease is seen among persons killed in the District Council road networks (Table 7).

VTI rapport 704A 23
Concerning severely injured persons, the variable road authority was not available; therefore, the variable built-up area was used instead. Here, the largest decrease was seen within built-up areas (not significant, however).
Table 7. The distribution of fatalities by road authority High06 High07 High08 High average Low09 Relative
decrease
District Council
15.7 26.5 15.6 19.5 16.9 51.3 %
Public 82.6 71.3 79.5 77.6 78.9 42.9 %
Private 1.7 2.2 4.9 2.9 4.2 18.2 %
4.5 Age and gender Concerning discussions about traffic safety and the economic situation, one common theory is that accidents involving young drivers would decrease more than others since young persons (according to the theory) are more affected by an economic recession. Table 8 shows the proportion of killed drivers of private cars by age group. No significant difference is found between the High and Low periods.
Table 8. The distribution of killed drivers of private cars by age group, P=0.29. Age group High06 High07 High08 High average Low09 Relative
decrease
18-24 9.3 22.4 17.5 16.6 20.0 17.2 %
25-39 38.9 20.7 22.2 26.9 15.0 61.7 %
Others 51.9 56.9 60.3 56.6 65.0 21.2 %
Table 9 shows results for drivers of private cars involved in accidents with severe injuries (thus the drivers need not be injured).
Table 9. The distribution of drivers of private cars involved in accidents sustaining severe injuries by age, all collision types, P=0.35. Age group High06 High07 High08 High average Low09
18-24 16.7 19.0 20.1 18.6 19.4
25-39 31.8 28.3 27.8 29.3 26.8
Others 51.5 52.7 52.1 52.1 53.8
To obtain a complete picture, the proportion of men and women, respectively, were compared among killed and severely injured persons. No significant differences were found between the High and Low periods, nor were any differences apparent when accidents were divided into age groups among men and women.

24 VTI rapport 704A
4.6 Traffic elements During economic recession, HGV traffic decreases more than passenger traffic. However, this is not mirrored in accident statistics, since the per-accident number of vehicles of a certain type is more or less constant for all periods (Table 10). There was no significant difference between the High and Low periods for any of the vehicle types.
Table 10. The number of vehicles of a specific type per fatal accident.
High06 High07 High08 High average
Low09
HGV 0.22 0.24 0.20 0.22 0.22
Car 1.20 1.01 1.18 1.12 1.07
Bus 0.05 0.08 0.04 0.06 0.03
There were no notable differences in the corresponding values for accidents sustaining severe injuries. However the average numbers of HGVs were considerably lower in all periods (close to 0.08).
VTI rapport 704A 25
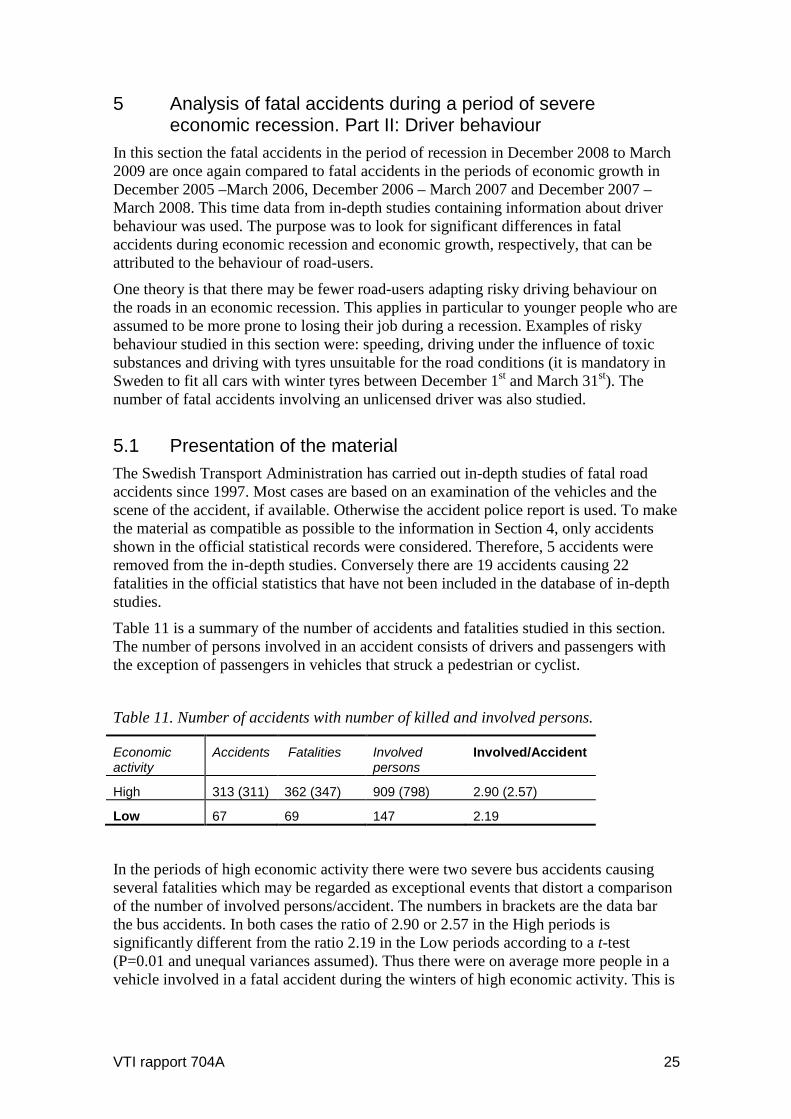
5 Analysis of fatal accidents during a period of severe economic recession. Part II: Driver behaviour
In this section the fatal accidents in the period of recession in December 2008 to March 2009 are once again compared to fatal accidents in the periods of economic growth in December 2005 –March 2006, December 2006 – March 2007 and December 2007 – March 2008. This time data from in-depth studies containing information about driver behaviour was used. The purpose was to look for significant differences in fatal accidents during economic recession and economic growth, respectively, that can be attributed to the behaviour of road-users.
One theory is that there may be fewer road-users adapting risky driving behaviour on the roads in an economic recession. This applies in particular to younger people who are assumed to be more prone to losing their job during a recession. Examples of risky behaviour studied in this section were: speeding, driving under the influence of toxic substances and driving with tyres unsuitable for the road conditions (it is mandatory in Sweden to fit all cars with winter tyres between December 1st and March 31st). The number of fatal accidents involving an unlicensed driver was also studied.
5.1 Presentation of the material The Swedish Transport Administration has carried out in-depth studies of fatal road accidents since 1997. Most cases are based on an examination of the vehicles and the scene of the accident, if available. Otherwise the accident police report is used. To make the material as compatible as possible to the information in Section 4, only accidents shown in the official statistical records were considered. Therefore, 5 accidents were removed from the in-depth studies. Conversely there are 19 accidents causing 22 fatalities in the official statistics that have not been included in the database of in-depth studies.
Table 11 is a summary of the number of accidents and fatalities studied in this section. The number of persons involved in an accident consists of drivers and passengers with the exception of passengers in vehicles that struck a pedestrian or cyclist.
Table 11. Number of accidents with number of killed and involved persons.
Economic activity
Accidents Fatalities Involved persons
Involved/Accident
High 313 (311) 362 (347) 909 (798) 2.90 (2.57)
Low 67 69 147 2.19
In the periods of high economic activity there were two severe bus accidents causing several fatalities which may be regarded as exceptional events that distort a comparison of the number of involved persons/accident. The numbers in brackets are the data bar the bus accidents. In both cases the ratio of 2.90 or 2.57 in the High periods is significantly different from the ratio 2.19 in the Low periods according to a t-test (P=0.01 and unequal variances assumed). Thus there were on average more people in a vehicle involved in a fatal accident during the winters of high economic activity. This is

26 VTI rapport 704A
in line with the observation that there were only 2 out of 67 accidents involving more than one fatality in the winter of low economic activity.
5.2 Risky behaviour In this section the number of fatal accidents where risky or unsuitable behaviour is suspected to be present is compared between the High and Low periods. Risky or unsuitable behaviour includes: suicide2, non-use of seat belt, unlicensed driving, speeding, use of toxic substances, sleepiness/distraction and using tyres unsuitable for wintery road conditions. At the time of the study the material from the in-depth studies were being made available electronically. The interface was however not fully developed yet so it was not always possible to search specifically for the occurrence of risky behaviour. Therefore the comments and supplements had to be examined for each accident. Unfortunately, due to time restraint when perusing the material, accidents involving risky behaviour might have been overlooked. Speeding and sleepiness/distraction were the most difficult to detect examining the comments and supplements.
In this section the 2χ -test was utilised to detect if there was a difference in the proportion of fatal accidents involving risky behaviour between the High and Low periods. A P value less than 0.05 was deemed significant. Table 12 shows a significant difference in the rate of suspected suicides among the traffic fatalities between the High and Low periods.
Table 12. Suspected suicides among the traffic fatalities. P=0.03.
Economic activity Suspected suicides Other fatalities Total
High 20 (5.5 %) 342 (94.5 %) 362
Low 9 (13.0 %) 60 (87.0 %) 69
Table 13 shows seat belt use among persons killed in a car or HGV. No difference can be detected between the two periods.
Table 13. Seat belt use in fatalities in cars or HGVs, P=0.41.
Economic activity Seat belt not used Other fatalities Total
High 72 (27.9 %) 158 (72.1 %) 258
Low 18 (34.0 %) 35 (66.0 %) 53
Neither of the two risk behaviours, driving under the influence of toxic substances or driving while tired, is significantly different among the fatal accidents in the High and Low periods. It should be noted that the investigators performing the in-depth studies appear to pay more attention to sleepiness in traffic in the more recent studies. Hence
2 As of 2010, suspected suicides are no longer classified as road accidents in the official statistics.

VTI rapport 704A 27
the number of accidents involving suspected sleepiness in Table 14 may be underestimated in the High period.
Table 14. Fatal accidents where at least one person tested positively for toxic substances, P=0.52.
Economic activity At least one intoxicated person
Other accidents Total
High 74 (23.6 %) 239 (76.4 %) 313
Low 13 (19.4 %) 54 (80.6 %) 67
Table 15. Fatal accidents where a person was suspected of sleepiness, P=0.33.
Economic activity At least one person suspected of sleepiness
Other accidents Total
High 41 (13.1 %) 272 (86.9 %) 313
Low 12 (17.9 %) 55 (82.1 %) 67
Illegal driving and suspicion of speeding was studied in accidents where at least one of the following vehicles was involved: car, bus, lorry or motorcycle. Vehicles that do not require a comprehensive training to obtain a driving license or are not allowed for use on roads were not considered. This criterion ruled out 8 accidents involving snow mobiles, 3 accidents involving bicycles and 2 moped accidents. According to Table 16 there is a significant difference in the share of accidents involving an unlicensed driver between the High and Low periods.
Table 16. Fatal accident where at least one driver was unlicensed. P=0.03.
Economic activity Unlicensed driver in the accident
Other accidents Total
High 23 (7.6 %) 280 (92.4 %) 303
Low 11 (17.2 %) 53 (82.8 %) 64
Table 17. Fatal accidents where at least one driver was suspected of speeding, P=0.62.
Economic activity Suspected speeding before the accident
Other accidents Total
High 66 (21.8 %) 237 (78.2 %) 303
Low 16 (25.0 %) 48 (75.0 %) 64
Further inappropriate behaviour is using tyres unsuitable for current road conditions. The category unsuitable tyres in Table 18, comprise both vehicles fitted with tyres of low and illegal quality and cases where the investigator made a complaint (the most

28 VTI rapport 704A
common being that the tyres were heavily worn or had too few studs left). There is a shortfall because it was not always possible for the investigator to inspect the tyres of all vehicles involved in an accident. The third category in Table 18, are accidents where one vehicle had tyres of unknown quality, unless there was another vehicle involved fitted with unsuitable tyres. In the last case the accident was put in the “unsuitable” category.
Table 18. Quality of tyres of the vehicles involved in fatal accidents, P=0.55.
Economic activity At least one vehicle had unsuitable tyres
All vehicles had good tyres
Some vehicle had tyres of unknown quality
Total
High 71 (23.4 %) 186 (61.4 %) 46 (15.2 %) 303
Low 11 (17.2 %) 42 (65.6 %) 11 (17.2 %) 64
The results of the tests concerning risky behaviour are summarised in Table 19. The most significant difference is that the rate of suspected suicides is higher in the period of low economic activity. A closer inspection shows that the number of suicides each winter is fairly constant hence the rate increases when the total number of accidents decreases during a recession. Furthermore, in two of the accidents not classified as suspected suicides during the recession in 2008-2009, the investigator mentions that the victims may have had economic problems and that they had also displayed extremely reckless driving behaviour prior to the accident. It is therefore possible that the number of suicides may have been underestimated in the recession period.
Furthermore, a higher share of the fatal accidents during the recession period was involving drivers lacking a valid driving license which may partly be explained by many people driving illegally due to not being able to afford to pay for courses required for passing a driving license. On the other hand, an accident involving a driver who has had the license revoked due to a traffic offence has no direct link to the economic situation.
The theory that the road-users would be more prone to risk taking behaviour in a period of economic growth could not be confirmed. None of the risky behaviour such as driving while intoxicated, driving tired, exceeding the speed limit and not using a seat belt was more common in the fatal accidents in the three winters of economic growth.
Driving with unsuitable tyres fitted, which could possibly be due to economic reasons, occur more frequently in the fatal accidents in each of the two periods of different economic activity.
Table 19. Summary of results of risky behaviour.
Suspected suicide
Suspected speeding
Non-use of seat belt
Influence of drugs or alcohol
Suspicion of sleepiness
Driving without a license
Using tyres unsuitable to the road conditions
More common during the recession
No significant difference
No significant difference
No significant difference
No significant difference
More common during the recession
No significant difference

VTI rapport 704A 29
6 Concluding remarks There was a much greater decrease in the number of road fatalities in Sweden than could be expected from the reduction of traffic mileage at the time of the financial crisis in the turn of the year 2008/2009. Most of the theories could not be confirmed by the analyses presented in this report as was the case for the assumption of fewer HGVs and young, inexperienced drivers on the roads in a recession period. Neither the share of fatal accidents involving an HGV nor the share of young persons in the fatalities was significantly lower during the recession.
The data showed that the average number of persons killed in fatal accidents was higher in the winters with economic growth and also that more persons were involved in fatal accidents. A related observation is that a collision between two motor vehicles was significantly more frequent in the fatal accidents in the three winters experiencing a better economic climate. A reduction in the mileage during a recession lessens the number of conflict situations between vehicles however some of the effect may also be due to the safety improvements of the roads e.g., constructing lane dividers.
This study could not confirm the theory that risky behaviour among car drivers is more frequent during sound economic conditions. The share of fatal accidents where at least one road user is suspected to have speeded, been under influence of toxic substances or been tired was not significantly different between the recession period and the winters experiencing a better economic climate. The only difference is that there appear to be relatively more accidents involving unlicensed drivers in the recession period. Those drivers include persons who have never had a driving licence issued, as well as persons who have had their driving licence suspended or revoked because of traffic offences.
Additionally, a larger share of suspected suicides occurred among the road fatalities during the recession. As of 2010, suicides are however no longer included in the official statistics of traffic accident victims in Sweden. It appears to be few differences in the composition of the types of accidents examined in this study during the recession compared to periods of economic growths. The biggest difference is plainly that there were much fewer fatal accidents during the recession period.
6.1 Summary of models for road fatalities It is crucial to choose suitable explanatory variables in a statistical model. It is in general not good practice to use variables that are strongly correlated, for example to include both GNP per capita and the time trend in the models in Section 3. If strongly correlated explanatory variables are used it becomes difficult to interpret the results from the model, and there is also a risk for the estimates to become erroneous. This may be the case in Wilde & Simonet (1996) who report a correlation greater than 0.9 between the index of industrial production and employment that were both included in a model of traffic fatalities. Such correlations question their finding that a higher employment rate has a negative effect on traffic safety, which contradicts to most other studies.
Leaving out a confounding variable from a model is another cause for concern. An example of this may be Al-Alawi et al. (1996), who at a time when the GNP was high, chose not to include in their model of injurious accidents, newly introduced seat belt legislation mentioned in their study. According to the model a higher GNP decreases the injury accidents. It is thus possible that the improvement in traffic safety was

30 VTI rapport 704A
attributed to the strong economic growth when the real effect may be due to the introduced seat belt legislation.
The impression gained from the literature survey is that unemployment is the most commonly used economic variable. This inspired us to expand the original model of traffic fatalities in Sweden by Brüde (1995) seen in Section 3
276.2_)939.0(*0298.0)( indextrafficty t=
to include the number of unemployed persons (see e.g. Newstead et al., 1996) 120.0471.1_)956.0(*454.1)( −= unemployedindextrafficty t
The final model in Section 3 also contains annual mileage of car drivers < 25 years old (YTM) and annual traffic mileage for all bar young car drivers and HGVs (RTM)
789.0266.0121.0)969.0(*5.36)( RTMYTMunemployedty t −=
As the number of unemployed people is significant in the model, there still appear that a recession can have a positive effect on traffic safety, which cannot be explained by a decrease in the mileage of young car drivers.
6.2 Further research A missing piece of the puzzle is time series of travel habits. Traditional travel surveys are performed intermittently and their usability when studying how travel habits and modes of travel vary across the business cycle is limited. A survey of the literature analysing travel survey data is needed to investigate ideas for further theories on how travel habits correlates to fluctuation in the economy.
It would also be beneficial to have more comprehensive statistical material on fatal accidents. Therefore, to compile the required material, the next step would be to commence international cooperation for analysis of data collected in several different countries.

VTI rapport 704A 31
References AL-ALAWI, S., ALI, G. & BAKHEIT, C. (1996) A novel approach for traffic accident analysis and prediction using artificial neural networks. Road and Transport Research, 5, 118–128.
BJÖRKETUN, U. & NILSSON, G. The VTI model for estimation of the annual vehicle mileage in Sweden. Model development and auxiliary information up to 2005 and annual estimation of vehicle mileage 1950–2005. VTI notat 20-2007. (English summary).
BJÖRNSKAU, T. (2009) Traffikkulykkene i 2009: Hvorfor ble färre drept? Samferdsel 49(1), 6–7.
BRÜDE, U. (1995) What is happening to the number of fatalities in road accidents? A model for forecasts and continous monitoring of development up to the year 2000. Accident Analysis and Prevention, 27, 405–410.
BRÜDE, U. (2001) Förklaringsfaktorer till antal dödade i trafiken- samt förslag till Basic facts. VTI notat 38-2001.
FARMER, C. M. (1997) Trends in motor vehicle fatalities. Journal of Safety Research, 28, 37-48. FORSMAN, Å. (2008) Forecasting models of the number of fatalities in road traffic– An evaluation of a Poisson regression model with serially correlated residuals. VTI rapport 607. (English summary)
GARCIA-FERRER, A., DE JUAN, A. & PONCELA, P. (2007) The relationship between road traffic accidents and real economic activity in Spain: Common cycles and health issues. Health Economics, 16, 603–626.
GULLON, A. (2002) Crash course. The fundamental cause of traffic collisions and other mysteries. Traffic technology international 2002/02/03, 92–96.
HAKIM, S., SHEFER, D., HAKKERT, A. S. & HOCHERMAN, I. (1991) A critical review of macro models for road accidents. Accident Analysis and Prevention, 23, 379–400.
HAQUE, O. (1993) Unemployment and road fatalities. International Journal of Transport Economics, 20, 175-195. (Rapportversion har VTIacc P8613:91–10).
JOKSCH, H. C. (1984) The relation between motor vehicle accident deaths and economic activity. Accident Analysis and Prevention, 16, 207–210.
HERMANS, E., WETS, G. & VAN DEN BOSSCHE, F. (2006) Frequency and severity of Belgian road traffic accidents studied by state-space methods. Journal of Transportation and Statistics, 9, 63–75.
HU, G., WEN, M., BAKER, T. D. & BAKER, S. P. (2008) Road-traffic deaths in China, 1985–2005: threat and opportunity. Inj Prev, 14, 149-53.
NEUMAYER, E. (2004) Recessions lower (some) mortality rates: Evidence from Germany. Social Science and Medicine, 58, 1037–1047.
NEWSTEAD, S., CAMERON, M. & NARAYAN, S. (1998) Further modelling of some major factors influencing road trauma trends in Victoria 1990–96. Monash University, Accident research centre Report 129.

32 VTI rapport 704A
NOLAND, R. B. (2005) Fuel economy and traffic fatalities: multivariate analysis of international data. Energy Policy, 33, 2183–2190.
PARTYKA, S. (1991) Simple models of fatality trends revisited seven years later. Accident Analysis and Prevention, 23, 423–430.
PELTZMAN, S. (1975) The Effects of Automobile Safety Regulation. Journal of political economy, nr 4 vol 83, 677–725.
PETTITT, A., HAYNES, M. & LOW, S. (1992) Factors affecting fatal road crash trends. Rapport 106 från Australian department of transport and communications, federal office of road safety.
REINFURT, D. W., STEWART, J. R. & WEAVER, N. L. (1991) The economy as a factor in motor vehicle fatalities, suicides, and homicides. Accident Analysis and Prevention, 23, 453–462.
SCUFFHAM, P. A. (2003) Economic factors and traffic crashes in New Zealand. Applied Economics, 35, 179–188.
SCUFFHAM, P. A. & LANGLEY, J. D. (2002) A model of traffic crashes in New Zealand. Accident Analysis and Prevention, 34, 673–687.
TAY, R. (2003) The efficacy of unemployment rate and leading index as predictors of speed and alcohol related crashes in Australia. International Journal of Transport Economics, 30, 363–380.
THORESEN, T., FRY, T., HELMAN, L. & CAMERON, M. (1992) Linking economic activity, road safety measures and other factors with the Victorian road toll. Monash University, Accident research centre Report 29.
VAN DEN BOSSCHE, F., WETS, G. & BRIJS, T. (2005) Role of exposure in analysis of road accidents - A Belgian case study. Statistical Methods; Highway Safety Data, Analysis, and Evaluation; Occupant Protection; Systematic Reviews and Meta-Analysis, 96–103.
WAGENAAR, A. C. (1984) Effects of macroeconomic conditions on the incidence of motor vehicle accidents. Accident Analysis and Prevention, 16, 191–205.
WILDE, G. (1991) Economics and accidents: a commentary. Journal of Applied Behaviour Analysis, 24, 81–84.
WILDE, G. & SIMONET, S. (1996) Economic fluctuations and the traffic accident rate in Switzerland; a longitudinal approach.


VTI är ett oberoende och internationellt framstående forskningsinstitut som arbetar med
forskning och utveckling inom transportsektorn. Vi arbetar med samtliga trafikslag och
kärnkompetensen finns inom områdena säkerhet, ekonomi, miljö, trafik- och transportanalys,
beteende och samspel mellan människa-fordon-transportsystem samt inom vägkonstruktion,
drift och underhåll. VTI är världsledande inom ett flertal områden, till exempel simulatorteknik.
VTI har tjänster som sträcker sig från förstudier, oberoende kvalificerade utredningar och
expertutlåtanden till projektledning samt forskning och utveckling. Vår tekniska utrustning består
bland annat av körsimulatorer för väg- och järnvägstrafik, väglaboratorium, däckprovnings-
anläggning, krockbanor och mycket mer. Vi kan även erbjuda ett brett utbud av kurser och
seminarier inom transportområdet.
VTI is an independent, internationally outstanding research institute which is engaged on
research and development in the transport sector. Our work covers all modes, and our core
competence is in the fields of safety, economy, environment, traffic and transport analysis,
behaviour and the man-vehicle-transport system interaction, and in road design, operation
and maintenance. VTI is a world leader in several areas, for instance in simulator technology.
VTI provides services ranging from preliminary studies, highlevel independent investigations
and expert statements to project management, research and development. Our technical
equipment includes driving simulators for road and rail traffic, a road laboratory, a tyre testing
facility, crash tracks and a lot more. We can also offer a broad selection of courses and seminars
in the field of transport.
HUVUDKONTOR/HEAD OFFICE
LINKÖPING BORLÄNGE STOCKHOLM GÖTEBORGPOST/MAIL SE-581 95 LINKÖPING POST/MAIL BOX 920 POST/MAIL BOX 55685 POST/MAIL BOX 8072TEL +46(0)13 20 40 00 SE-781 29 BORLÄNGE SE-102 15 STOCKHOLM SE-402 78 GÖTEBORGwww.vti.se TEL +46 (0)243 446 860 TEL +46 (0)8 555 770 20 TEL +46 (0)31 750 26 00