traffic impact analysis of urban intersections with comprehensive waiting area on urban intersection...
TRANSCRIPT
Procedia - Social and Behavioral Sciences 96 ( 2013 ) 1910 – 1920
1877-0428 © 2013 The Authors. Published by Elsevier Ltd.Selection and peer-review under responsibility of Chinese Overseas Transportation Association (COTA).doi: 10.1016/j.sbspro.2013.08.216
ScienceDirect
13th COTA International Conference of Transportation Professionals (CICTP 2013)
Traffic Impact Analysis of Urban Intersections with Comprehensive Waiting Area on Urban Intersection Based on
PARAMICS XIA Xi1, HE ZhaoCheng 2*, SUN WenBo 3 , CHEN ZhanQiu4 and GONG JunFeng 5
1,2,3,4Research Center of Intelligent Transportation System, Sun Yat-sen University, Guangzhou 510006, Guangdong Prov., China; Phone: 8620-39332772-311,Fax: 8620-39332775, Email: [email protected] 5School of Civil Engineering and Transportation, South China University of Technology, Guangzhou, 510641, China; Phone: (0086) 020-87111030; Fax: (0086) 020-87114460 Tel: 1370255201, Email: [email protected]
Abstract
To improve the traffic operation and take advantage of the space resource, left-turn vehicles waiting area and straight vehicles waiting area are adopted separately at intersection at home and abroad, but there is not much research for using left-turn and straight waiting area together at the same intersection. Research using simulation software PARAMICS combining with programming API to simulate a specific comprehensive waiting area in Guangzhou city under nine different traffic volumes for three conditions: following control strategy, underutilizing control strategy and without control strategy. By evaluating the following four indexes: link delay, queue length, link average speed and passing vehicles, the simulation results indicate that the improving effect of following control strategy is superior to the underutilizing control strategy. Implementing comprehensive waiting area and in conjunction with the following control strategy can improve traffic operation when traffic volume is larger than the surveyed situation volume while the improvement is more effectively when traffic volume continues to increase. Setting comprehensive waiting area cannot improve intersection traffic operation but will worsen the traffic operation when traffic volume is less than the surveyed situation volume.
Keywords:comprehensive waiting area; PARAMICS simulation; API plugin; following control strategy;underutilizing control strategy;without control strategyIntroduction
1 INTRODUCTION
The acceleration of the process of urbanization, modernization and motorization results in the large burden of Chinese urban transport. For large and medium-sized cities, road construction has basically been saturated. Road construction is not a good way to improve traffic operation and should optimize traffic management and traffic organization. Implementing some special form of transportation organization can play a more significant role in raising the intersection level of service for some high-saturation intersections.
Left-turn vehicles waiting area and straight vehicles waiting area are usually adopted at intersection at home and abroad, these two forms of organizations are based on the idea of space for time.
* Corresponding author. Tel: 8620-39332772; fax: 8620-39332775. E-mail address: [email protected]
Available online at www.sciencedirect.com
© 2013 The Authors. Published by Elsevier Ltd.Selection and peer-review under responsibility of Chinese Overseas Transportation Association (COTA).

1911 Xia Xi et al. / Procedia - Social and Behavioral Sciences 96 ( 2013 ) 1910 – 1920
A traffic organization named shared-parking area method and signal phase sequence were proposed(Yuan, et al.,2008). The research on phase sequence can be used for reference for comprehensive waiting area.
Speed limit program under the highway accident conditions was compared and evaluated, combined with PARAMICS microscopic simulation(Zheng,et al.,2004); API function was applied to program plug-in to simulate ITS control and guidance strategies(Zhuang,etal.,2005).Using PARAMICS simulation platform for quantitative simulation and programming API plug-in to realize the control strategy can be learned in this paper.
Research on left-turn waiting area and straight waiting area was conducted respectively, and did not focus on comprehensive usage for left-turn waiting area and straight waiting area(Li, et al., 2011;Ji, et al., 2006; Wang, 2009).
This paper applies PARAMICS to simulate the traffic operation in the comprehensive waiting area adopted by a certain entrance at a crossing intersection and take a traffic impact analysis for the comprehensive waiting area.
2 TRAFFIC IMPACT ANALYSIS OF COMPREHENSIVE WAITING AREABASED ON PARAMICS
MICROSCOPIC SIMULATION
2.1 Introduction to Comprehensive Waiting Area
Comprehensive waiting area has been used in practice in Shanghai and Guangzhou. Drivers do not quite understand the intersection control strategy because comprehensive waiting area is a new intersection control strategy. This paper takes the comprehensive waiting area, located at between the Shangdu Road and Bingjiang Road crossing intersection and the T-intersection, as an example to introduce comprehensive waiting area. Comprehensive waiting area has two stop lines, the first stop line locates at the front of the comprehensive waiting area and the second stop line locates at the end of the comprehensive waiting area such as figure 1 shows. The comprehensive waiting area needs to set a two-phase signal control at T-intersection. The first phase is left-turn and U-turn phase, and the second phase is straight and right-turn phase.
The study will conduct simulation under three conditions, namely following control strategy(abbreviated as FCS), underutilizing control strategy(abbreviated as UCS) and without control strategy(abbreviated as WCS).
The FCS situation means when the signal is in the first phase, left-turn vehicles can drive into the comprehensive waiting area occupying three entrances and U-turn vehicles can turn around while straight vehicles and right-turn vehicles stop at the first stop line shown as the state 1 of figure 1, and when the signal is in the second phase, straight vehicles and right-turn vehicles can drive into the comprehensive waiting area occupying three entrances while left-turn vehicles and U-turn vehicles stop at the first stop line shown as the state 2 of figure 2. T-intersection signal control has all-red time and all vehicles should stop at the first stop line shown as the state 3 of figure 3.
The UCS situation means left-turn vehicles just occupy the inside lane of the comprehensive waiting area under state 1 and straight vehicles just occupy the lateral two lanes under state 2. State 3 is the same as FCS. Since now drivers do not understand the correct comprehensive waiting area control strategy, the UCS situation is the current situation of the surveyed comprehensive waiting area.
The WCS situation means there is no comprehensive waiting area and T-intersection has not signal control.

1912 Xia Xi et al. / Procedia - Social and Behavioral Sciences 96 ( 2013 ) 1910 – 1920
Figure 1.Vehicle driving schematic diagram under state 1 in comprehensive waiting area
Figure 2.Vehicle driving schematic diagram under state 2 in comprehensive waiting area
Figure3.Vehicle driving schematic diagram under state 3 in comprehensive waiting area
2.2 PARAMICS Introduction
PARAMICS mainly consists of six main tool modules: Modeller, Processor, Analyser, Programmer, Estimator, Monitor(Quadstone Limited,2003). PARAMICS consists of four kinds of functions: QPO, QPX, QPG and QPS. QPO let the user replace algorithms / routines in the core PARAMICS network with their own code; QPX let the user add new code to the PARAMICS simulation; QPG let the user query the value and state of objects in the PARAMICS model and QPS let the user set values, states and action for objects in the PARAMICS model.
Call the above four API functions through C language to program a plug-in and load it into PARAMICS network in order to achieve the control strategy(Zhuang, et al., 2005).
1913 Xia Xi et al. / Procedia - Social and Behavioral Sciences 96 ( 2013 ) 1910 – 1920
2.3 PARAMICS Traffic Impact Analysis Process
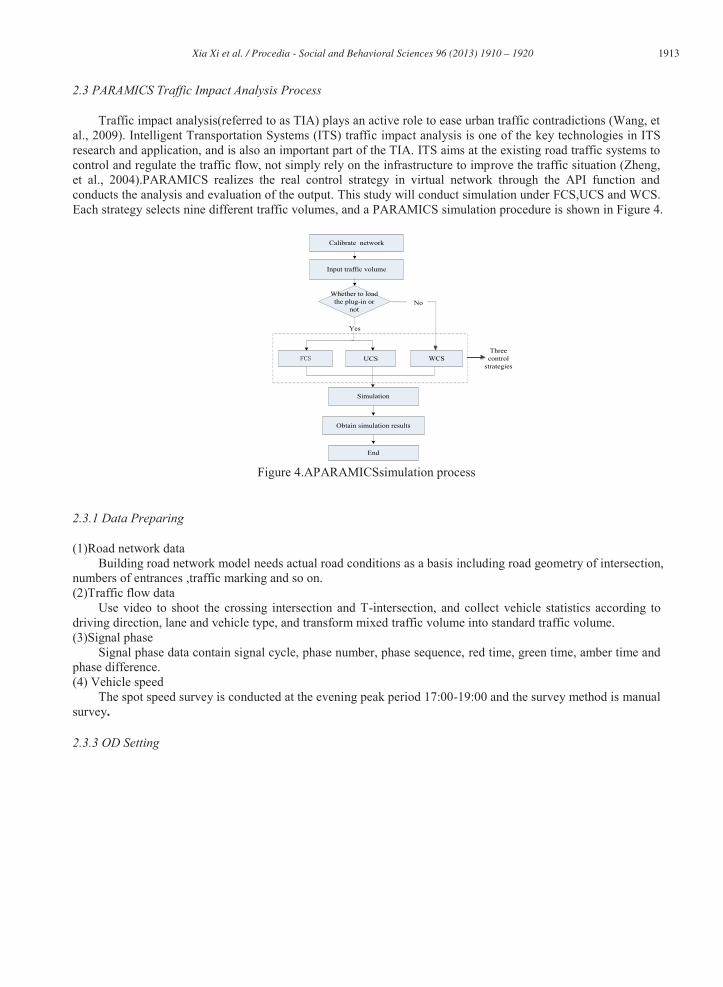
Traffic impact analysis(referred to as TIA) plays an active role to ease urban traffic contradictions (Wang, et al., 2009). Intelligent Transportation Systems (ITS) traffic impact analysis is one of the key technologies in ITS research and application, and is also an important part of the TIA. ITS aims at the existing road traffic systems to control and regulate the traffic flow, not simply rely on the infrastructure to improve the traffic situation (Zheng, et al., 2004).PARAMICS realizes the real control strategy in virtual network through the API function and conducts the analysis and evaluation of the output. This study will conduct simulation under FCS,UCS and WCS. Each strategy selects nine different traffic volumes, and a PARAMICS simulation procedure is shown in Figure 4.
Calibrate network
Input traffic volume
UCS WCS
Simulation
Obtain simulation results
End
Whether to load the plug-in or
not
Yes
No
Three control
strategies
Figure 4.APARAMICSsimulation process
2.3.1 Data Preparing
(1)Road network data Building road network model needs actual road conditions as a basis including road geometry of intersection,
numbers of entrances ,traffic marking and so on. (2)Traffic flow data
Use video to shoot the crossing intersection and T-intersection, and collect vehicle statistics according to driving direction, lane and vehicle type, and transform mixed traffic volume into standard traffic volume. (3)Signal phase
Signal phase data contain signal cycle, phase number, phase sequence, red time, green time, amber time and phase difference. (4) Vehicle speed
The spot speed survey is conducted at the evening peak period 17:00-19:00 and the survey method is manual survey.
2.3.3 OD Setting

1914 Xia Xi et al. / Procedia - Social and Behavioral Sciences 96 ( 2013 ) 1910 – 1920
This study only focuses on comprehensive waiting area located at the east entrance of Shangdu Road and Bingjiang Road crossing intersection, so only requires to set specific OD in order to meet the east entrance traffic operation, and does not need the OD estimation tool in PARAMICS to estimate the whole network OD matrix.
2.3.4 Parameter Calibration
This study takes traffic volume and spot speed as the calibration parameter. Input the actual surveyed traffic volume and spot speed into PARAMICS and make a comparison with the simulation value. The network is available if deviation is within the acceptable range, and if deviation is without the acceptable range, the headway, vehicle reaction time and desired speed require to be calibrated to meet the network accuracy requirements.
2.3.5 Plug-in Programming
A specific plug-in needs to be programmed and loaded to the network in order to realize the comprehensive waiting area signal control strategy. Plug-in algorithm flowchart is shown as figure 5.
Simulation running
Vehicles drive as the system speed
Whether to belong to the T-intersection signal control area
No
Yes
Call lane-changing function
Whether driving direction and green
phase of T-intersection is
consistent or not
Yes
Whether vehicles should slow down or
not
Yes
Vehicles drive as the system speed
No
Call speed-decreasing function and begin to
queue
End
No
Figure 5. Plug-in algorithm flowchart
2.3.6 Simulation Experiment
In this paper, simulation will be conducted under FCS, UCS and WCS. Input nine different traffic volumes with five simulation seeds respectively under three kinds of control strategies. The nine traffic volumes are 0.6Q,0.7Q,0.8Q,0.9Q, Q,1.1Q,1.2Q, 1.3Q and1.4Q. Q stands for the actual surveyed traffic volume.
Since the crossing intersection delay may be passed on to the T-intersection, the comprehensive waiting area and a certain distance before T-intersection are combined together to form a system. The paper studies the system traffic operation influenced by the comprehensive waiting area under three control strategies. The system consists
1915 Xia Xi et al. / Procedia - Social and Behavioral Sciences 96 ( 2013 ) 1910 – 1920
of 92-meter comprehensive waiting area and 200-meter road segment 2(shown as figure 1). The analysis of the four indexes under three control strategies aims at the system.
These four indexes are link delay, queue length, link average speed and passing vehicles. The link delay is the sum of the comprehensive waiting area delay and road segment 2 delay; the queue length is the sum of the comprehensive waiting area queue length and segment 2 queue length; the link average speed is the average of the comprehensive waiting area and road segment 2 vehicle speed, and the passing vehicles is the passing vehicles of T-intersection.
3 CASE STUDY
3.1 Intersection Current Situation
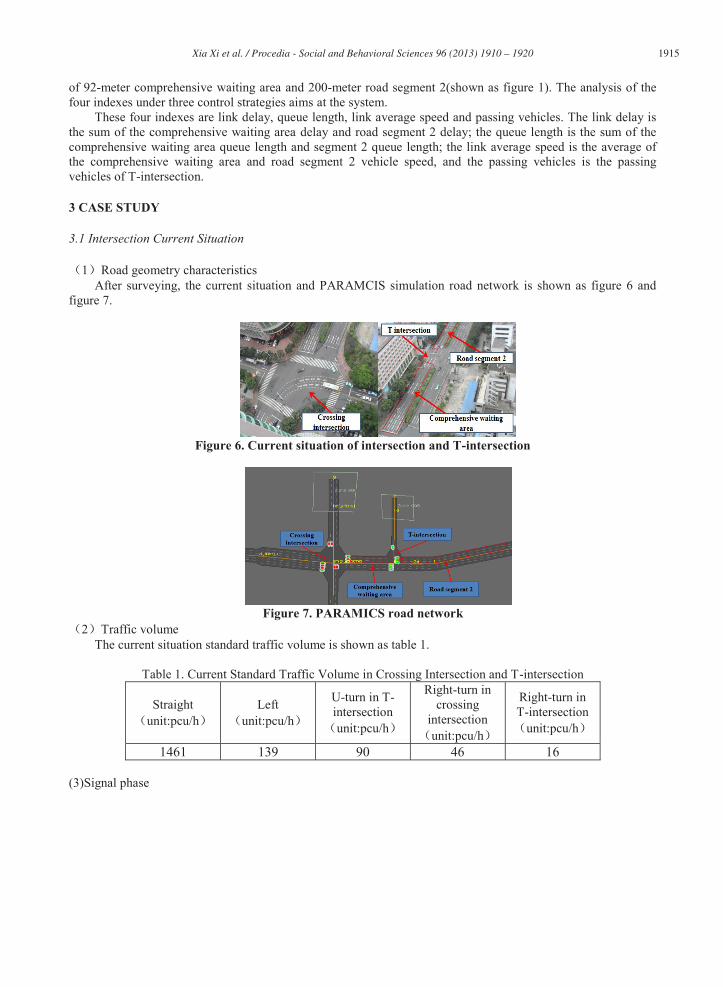
1 Road geometry characteristics After surveying, the current situation and PARAMCIS simulation road network is shown as figure 6 and
figure 7.
Figure 6. Current situation of intersection and T-intersection
Figure 7. PARAMICS road network
2 Traffic volume The current situation standard traffic volume is shown as table 1.
Table 1. Current Standard Traffic Volume in Crossing Intersection and T-intersection
Straightunit:pcu/h
Leftunit:pcu/h
U-turn in T-intersectionunit:pcu/h
Right-turn in crossing
intersection unit:pcu/h
Right-turn in T-intersection
unit:pcu/h
1461 139 90 46 16 (3)Signal phase
1916 Xia Xi et al. / Procedia - Social and Behavioral Sciences 96 ( 2013 ) 1910 – 1920
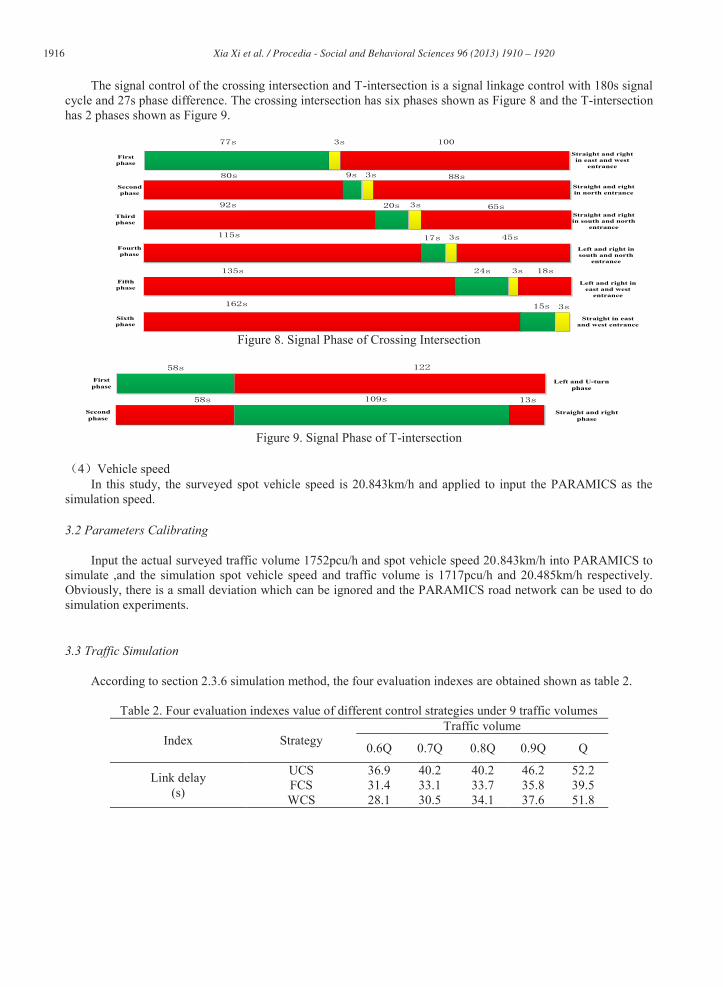
The signal control of the crossing intersection and T-intersection is a signal linkage control with 180s signal cycle and 27s phase difference. The crossing intersection has six phases shown as Figure 8 and the T-intersection has 2 phases shown as Figure 9.
First phase
Second phase
Third phase
Fourth phase
Fifth phase
Sixth phase
Straight and right in east and west
entrance
Straight and right in north entrance
Straight and right in south and north
entrance
Left and right in south and north
entrance
Left and right in east and west
entrance
Straight in east and west entrance
Figure 8. Signal Phase of Crossing Intersection
First phase
Second phase
Left and U-turn phase
Straight and right phase
Figure 9. Signal Phase of T-intersection
4 Vehicle speed
In this study, the surveyed spot vehicle speed is 20.843km/h and applied to input the PARAMICS as the simulation speed.
3.2 Parameters Calibrating
Input the actual surveyed traffic volume 1752pcu/h and spot vehicle speed 20.843km/h into PARAMICS to simulate ,and the simulation spot vehicle speed and traffic volume is 1717pcu/h and 20.485km/h respectively. Obviously, there is a small deviation which can be ignored and the PARAMICS road network can be used to do simulation experiments.
3.3 Traffic Simulation
According to section 2.3.6 simulation method, the four evaluation indexes are obtained shown as table 2.
Table 2. Four evaluation indexes value of different control strategies under 9 traffic volumes
Index Strategy Traffic volume
0.6Q 0.7Q 0.8Q 0.9Q Q
Link delay (s)
UCS 36.9 40.2 40.2 46.2 52.2 FCS 31.4 33.1 33.7 35.8 39.5 WCS 28.1 30.5 34.1 37.6 51.8

1917 Xia Xi et al. / Procedia - Social and Behavioral Sciences 96 ( 2013 ) 1910 – 1920
Queue length (veh)
UCS 17 18 18 22 25 FCS 16 15 17 19 22 WCS 9 11 15 17 21
Passing vehicles (pcu/h)
UCS 990 1180 1180 1508 1679 FCS 990 1180 1318 1517 1681 WCS 1009 1188 1351 1529 1695
Inputting value 1057 1233 1409 1585 1761
Link average speed (km/h)
UCS 21.7 20.5 19.4 17.7 16.0 FCS 23.3 22.4 21.9 20.7 19.3 WCS 28.8 26.7 24.6 22.9 19.3
Continue the Table2
Index Strategy Traffic volume
Q 1.1Q 1.2Q 1.3Q 1.4Q
Delay (s)
UCS 52.2 91.9 112.3 119.3 118.8 FCS 39.5 40.1 79.4 76.4 82.9 WCS 51.8 84.9 129.6 143.4 149.3
Queue length (veh)
UCS 25 33 36 37 37 FCS 22 23 28 25 33 WCS 21 29 39 41 42
Passing vehicles (pcu/h)
UCS 1679 1804 1826 1817 1839 FCS 1681 1843 1880 1919 2257 WCS 1695 1830 1896 1916 1936
Inputting value 1761 1937 2113 2289 2465
Link average speed (km/h)
UCS 16.0 11.3 10.0 9.5 9.6 FCS 19.3 18.9 15.2 14.9 13.9 WCS 19.3 13.5 8.8 7.9 7.2
Note Q=1761pcu/h(the traffic volume in current traffic situation)
3.4 The Analysis of Simulation Result
After simulating, the outputs are analyzed shown as figure 10,figure 11,figure 12 and figure 13.
Figure 10. Link delay comparison under different traffic volumes
1918 Xia Xi et al. / Procedia - Social and Behavioral Sciences 96 ( 2013 ) 1910 – 1920
From figure 10, when the inputting traffic volume is less than Q, the link delay under the FCS and WCS is
basically the same and the link delay under UCS is a little higher than the other two strategies. When the inputting volume is Q, the FCS is superior to the WCS and UCS by decreasing delay 5s. When the volume continues to increase, the improvement of FCS becomes more obvious, and the UCS is superior to the WCS until the volume is larger than 1.3Q.
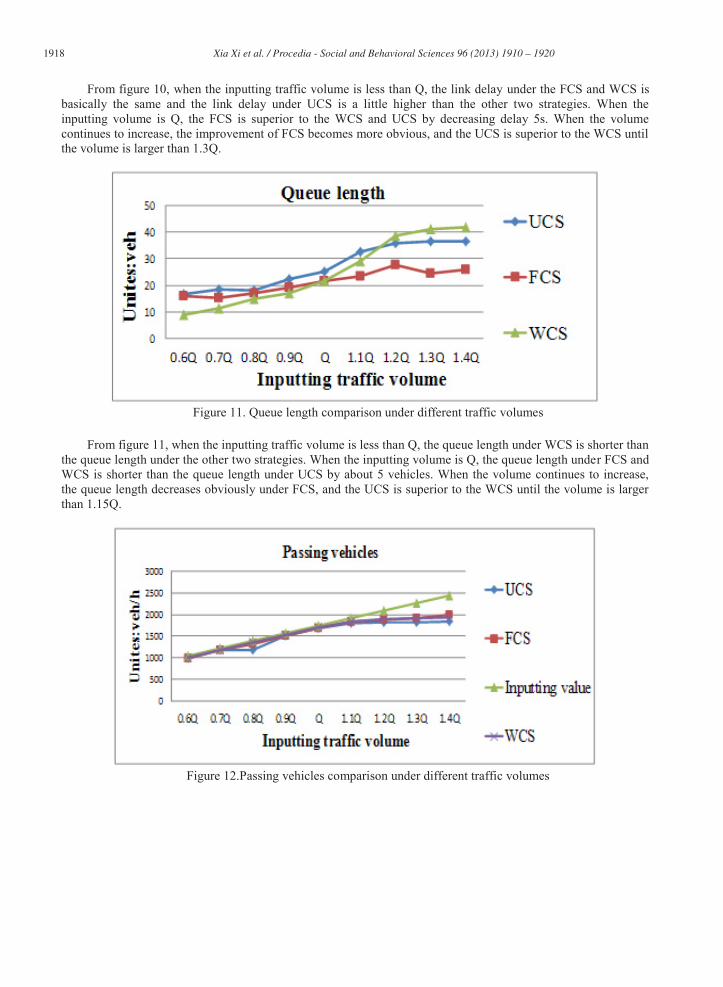
Figure 11. Queue length comparison under different traffic volumes
From figure 11, when the inputting traffic volume is less than Q, the queue length under WCS is shorter than the queue length under the other two strategies. When the inputting volume is Q, the queue length under FCS and WCS is shorter than the queue length under UCS by about 5 vehicles. When the volume continues to increase, the queue length decreases obviously under FCS, and the UCS is superior to the WCS until the volume is larger than 1.15Q.
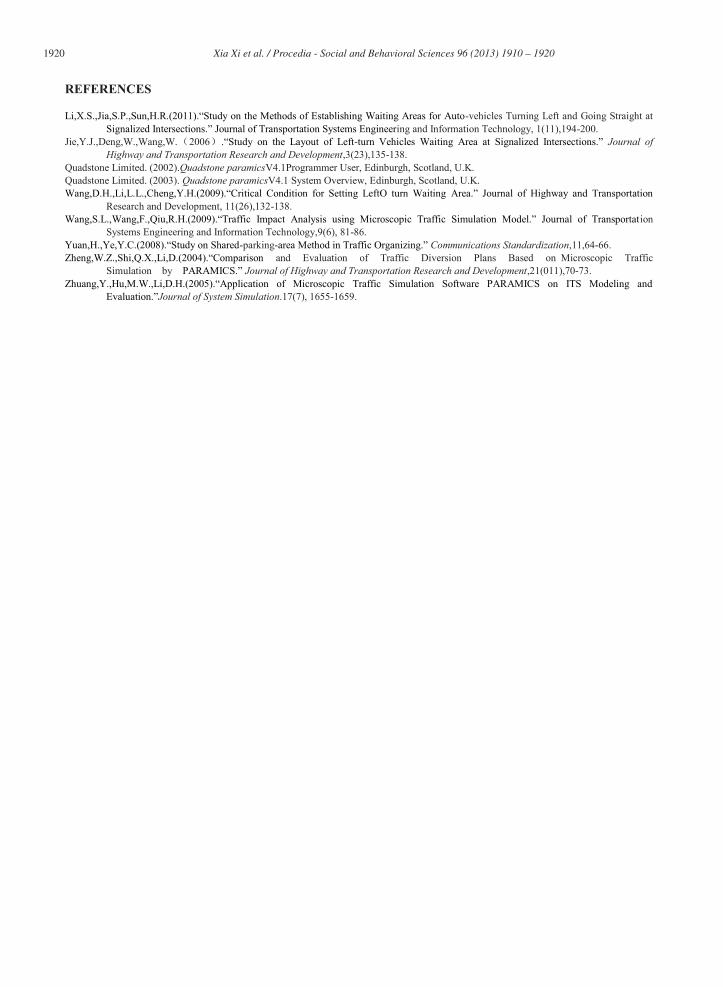
Figure 12.Passing vehicles comparison under different traffic volumes

1919 Xia Xi et al. / Procedia - Social and Behavioral Sciences 96 ( 2013 ) 1910 – 1920
From figure 12 When the inputting traffic volume is in 0.6Q -1.1Q, the passing vehicles under the three control strategies are basically the same, and when the inputting volume is larger than 1.1Q, the three control strategies all cannot improve the passing vehicles.
Figure 13.Link average speed under different traffic volumes
From the figure 13, when the inputting traffic volume is in 0.6Q-1.0Q, the link average speed under WCS is
higher than the other two strategies. When the inputting volume is Q, the link average speed under FCS and WCS is basically the same and a little higher than the vehicle speed under the UCS by increasing 3km/h. When the inputting volume is larger than Q, the improvement of FCS is more obvious, and the UCS is superior to the WCS until the volume is larger than 1.15Q.
4 CONCLUSION
In this study, a research on a specific Guangzhou comprehensive waiting area has been made under three situations containing FCS, UCS and WCS based on field investigation. API functions are loaded into PARAMICS simulation platform in order to realize the required control strategy. From link delay index, queue length index and link average speed index, the traffic improvement effect under FCS is obviously better compared with UCS and the improvement effect will become more obvious with the increase of traffic volume. When the traffic volume is less than Q, implementing comprehensive waiting area not only cannot improve traffic operation but also worsen traffic. Conducting FCS will improve the intersection traffic operation effectively until the traffic volume is larger than Q. The UCS will improve the intersection traffic operation until the traffic volume continues to increase in 1.15Q-1.4Q. From the passing vehicle index, there is no obvious different whether to implement comprehensive waiting area or not.
Since many drivers still have not understand the driving rule of comprehensive waiting area quite, traffic administrative department needs to promote the comprehensive waiting area control strategy in order to improve the intersection traffic operation effectively when traffic volume is large.
ACKNOWLEDGEMENTS
This paper is supported by National High Technology Research and Development Program of China (863 Program). (No.2011AA110305)
1920 Xia Xi et al. / Procedia - Social and Behavioral Sciences 96 ( 2013 ) 1910 – 1920
REFERENCES
-vehicles Turning Left and Going Straight at ing and Information Technology, 1(11),194-200.
Jie,Y.J.,Deng,W.,Wang,W. 2006 - Journal of Highway and Transportation Research and Development,3(23),135-138.
Quadstone Limited. (2002).Quadstone paramicsV4.1Programmer User, Edinburgh, Scotland, U.K. Quadstone Limited. (2003). Quadstone paramicsV4.1 System Overview, Edinburgh, Scotland, U.K.
Research and Development, 11(26),132-138. ion
Systems Engineering and Information Technology,9(6), 81-86. -parking- Communications Standardization,11,64-66.
and Evaluation of Traffic Diversion Plans Based on Microscopic TrafficSimulation by Journal of Highway and Transportation Research and Development,21(011),70-73.
Journal of System Simulation.17(7), 1655-1659.