traffi c impact study for the 853 fourth street west …...1 traffic impact study for the 853 fourth...
TRANSCRIPT

Balancing Functionality and Livability since 1995w-trans.com
TRAFFIC ENGINEERINGTRANSPORTATION PLANNING
June 15, 2018
Prepared for the City of Sonoma
Submitted byW-Trans
Traffi c Impact Study for the853 Fourth Street West Project


i Traffic Impact Study for the 853 Fourth Street West Project June 15, 2018
Table of Contents
Executive Summary .................................................................................................................................................................. 1
Introduction ................................................................................................................................................................................. 2
Transportation Setting ............................................................................................................................................................. 4
Capacity Analysis ....................................................................................................................................................................... 7
Alternative Modes .................................................................................................................................................................. 16
Access and Circulation .......................................................................................................................................................... 17
Conclusions and Recommendations ............................................................................................................................... 19
Study Participants and References ................................................................................................................................... 20
Figures
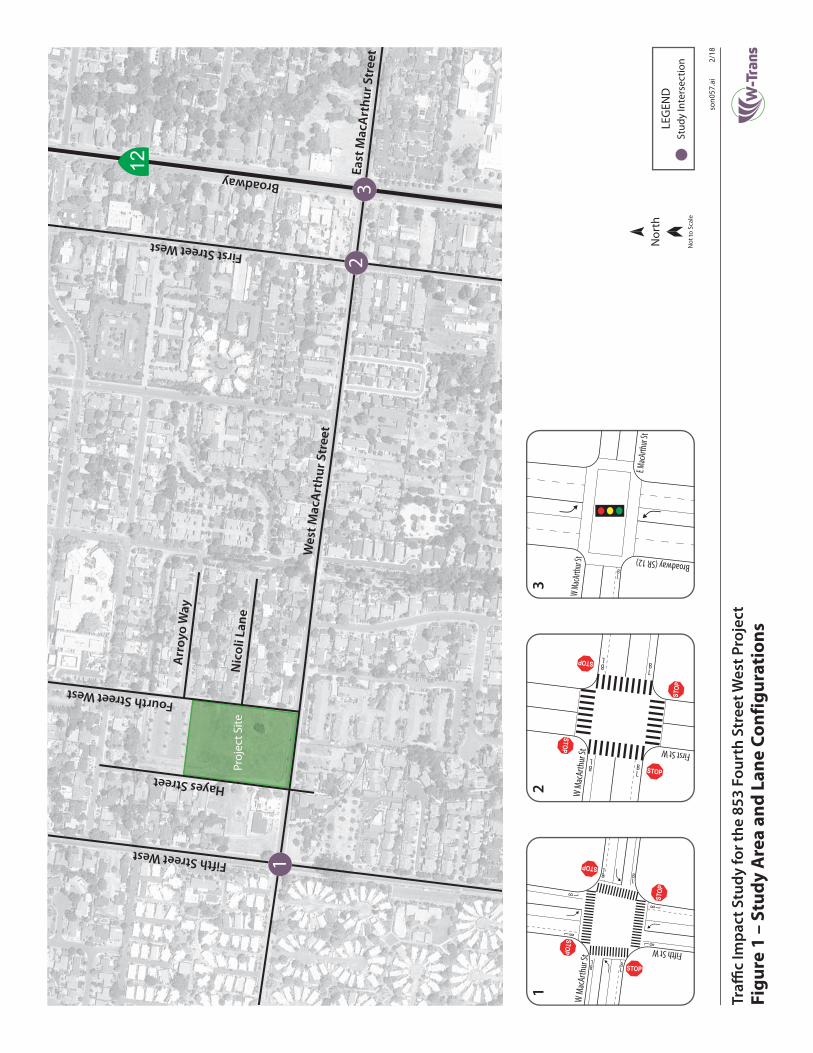
1. Study Area and Lane Configurations ................................................................................................................................... 3 2. Existing Traffic Volumes ........................................................................................................................................................... 9 3. Future Traffic Volumes ........................................................................................................................................................... 11 4. Site Plan ....................................................................................................................................................................................... 12 5. Project Traffic Volumes ........................................................................................................................................................... 14
Tables
1. Collision Rates at the Study Intersection ............................................................................................................................ 5 2. Bicycle Facility Summary ......................................................................................................................................................... 6 3. Intersection Level of Service Criteria ................................................................................................................................... 7 4. Existing Peak Hour Intersection Levels of Service ........................................................................................................... 8 5. Future Peak Hour Intersection Levels of Service ........................................................................................................... 10 6. Trip Generation Summary ..................................................................................................................................................... 13 7. Trip Distribution Assumptions ............................................................................................................................................. 13 8. Existing and Existing plus Project Peak Hour Intersection Levels of Service ....................................................... 15 9. Future and Future plus Project Peak Hour Intersection Levels of Service ............................................................ 15
Appendices
A. Collision Rate Calculations B. Intersection Level of Service Calculations C. Signal Warrant and Proportional Share D. Turn Lane Warrant Calculations


1 Traffic Impact Study for the 853 Fourth Street West Project June 15, 2018
Executive Summary
The proposed project would provide a total of 32 dwelling units, including 16 single family homes, four duplex units and 12 accessory dwelling units on a currently vacant site located on the northwest corner of the intersection of West MacArthur Street and Fourth Street West. The proposed project would be expected to generate an average of 268 daily trips, including 19 weekday a.m. peak hour trips and 25 trips during the weekday p.m. peak hour.
Three intersections along West MacArthur Street (at Fifth Street West, First Street West and Broadway) were evaluated under current volumes, projected future volumes, and with project-generated traffic added to both. All three intersections are expected to operate acceptably under all scenarios, resulting in a less-than-significant impact due to adding project-generated traffic.
There are continuous sidewalks in and around the project site, providing adequate connectivity for pedestrians. Existing and planned future Class II bike lanes, along with the shared use of minor streets, provide adequate access for bicyclists. There are existing bus stops along the project frontage on West MacArthur Street, providing access to transit facilities connecting the site to Santa Rosa, Sonoma Valley, and San Rafael.
Access to the project site is expected to operate acceptably, with adequate sight distance and no need for turn lanes. It is recommended that a stop sign be installed on the driveway where it intersects Fourth Street West.

2 Traffic Impact Study for the 853 Fourth Street West Project
June 15, 2018
Introduction
This report presents an analysis of the potential traffic impacts that would be associated with development of a proposed residential project to be located at 853 Fourth Street East in the City of Sonoma. The traffic study was completed in accordance with the criteria established by the City of Sonoma, and is consistent with standard traffic engineering techniques.
Prelude
The purpose of a traffic impact study is to provide City staff and policy makers with data that they can use to make an informed decision regarding the potential traffic impacts of a proposed project, and any associated improvements that would be required to mitigate these impacts to a level of insignificance as defined by the City’s General Plan or other policies. Vehicular traffic impacts are typically evaluated by determining the number of new trips that the proposed use would be expected to generate, distributing these trips to the surrounding street system based on existing travel patterns or anticipated travel patterns specific to the proposed project, then analyzing the impact the new traffic would be expected to have on critical intersections or roadway segments. Impacts relative to access for pedestrians, bicyclists, and to transit are also addressed.
Project Profile
The proposed project would include a total of 20 units on 18 lots, including four units in duplexes, together with 12 accessory dwelling units. The currently vacant project site is located on the northwest corner of Fourth Street West and West MacArthur Street in the City of Sonoma, as shown in Figure 1.
Traffi
c Im
pact
Stu
dy fo
r the
853
Fou
rth
Stre
et W
est P
roje
ct
son0
57.a
i 2/
18
Proj
ect S
ite
Fourth Street West
Hayes Street
Broadway
First Street West
Nic
oli L
ane
Arr
oyo
Way
East
Mac
Art
hur S
tree
t
Wes
t Mac
Art
hur S
tree
t
Fifth Street West
12
1
23
Nor
th
Not
to S
cale
BL
E MacA
rthur
St
W Ma
cArth
ur St Broadway (SR 12)
3
BL
BL
BL
BL
First St W
W M
acAr
thur
St
2
B L
BL
B L
BL
BL
BL
BL
BL
W M
acAr
thur
St
Fifth St W
1
Stud
y In
ters
ectio
nLE
GEN
D
Fig
ure
1 –
Stu
dy
Are
a a
nd
La
ne
Co
nfi
gu
rati
on
s

4 Traffic Impact Study for the 853 Fourth Street West Project
June 15, 2018
Transportation Setting
Operational Analysis
Study Area and Periods
The study area included the following three intersections.
1. Fifth Street West/West MacArthur Street 2. First Street West/West MacArthur Street 3. Broadway/MacArthur Street
Fifth Street West/West MacArthur Street is a four-legged all-way stop-controlled intersection with marked crosswalks on all approaches.
First Street West/West MacArthur Street is a four-way stop-controlled intersection with crosswalks marked on all approaches.
Broadway/MacArthur Street is a signalized four-legged intersection with protected left turns on the north and south approaches and permitted left turns on the east and west approaches. The intersection includes crosswalks on all legs.
The locations of the study intersections and the existing lane configurations and controls are shown in Figure 1.
Operating conditions during the a.m. and p.m. peak periods were evaluated to capture the highest potential impacts for the proposed project as well as the highest volumes on the local transportation network. The morning peak hour occurs between 7:00 and 9:00 a.m. and reflects conditions during the home to work or school commute, while the p.m. peak hour occurs between 4:00 and 6:00 p.m. and typically reflects the highest level of congestion during the homeward bound commute.
Collision History
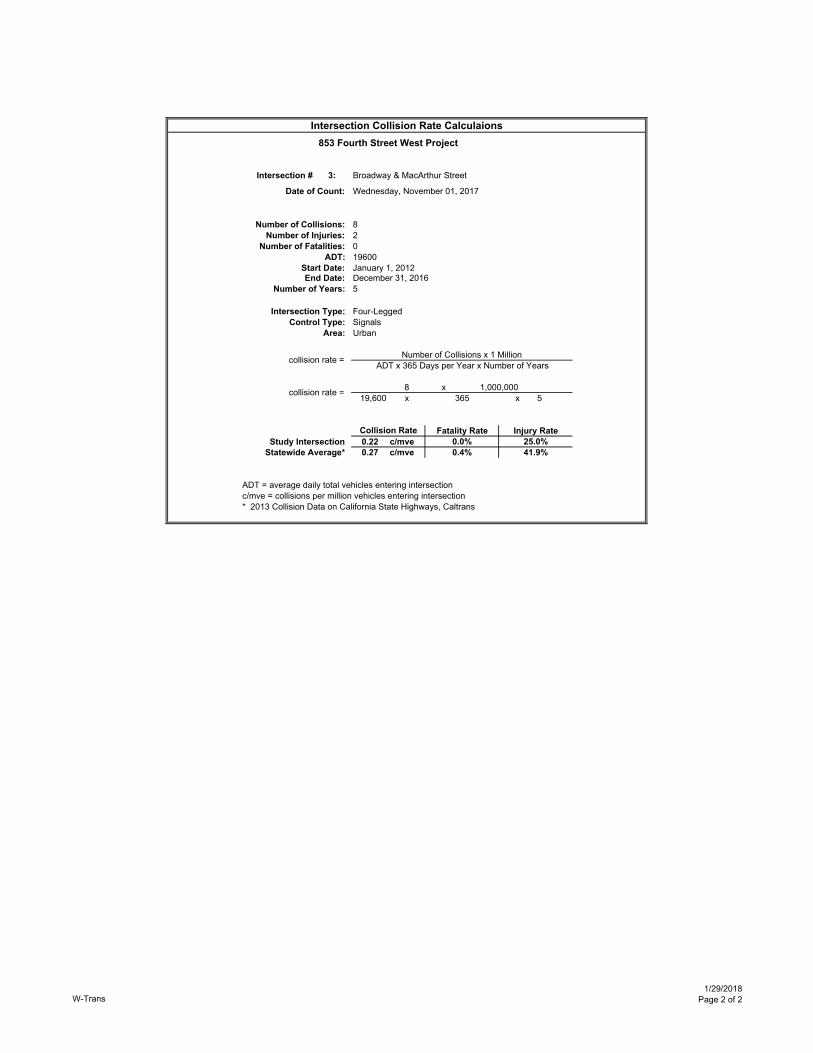
The collision histories for the study intersections were reviewed to determine any trends or patterns that may indicate a safety issue. Collision rates were calculated based on records available from the California Highway Patrol as published in their Statewide Integrated Traffic Records System (SWITRS) reports. The most current five-year period available is January 1, 2012 through December 31, 2016.
As presented in Table 1, the calculated collision rates for the study intersections were compared to the average collision rates for similar facilities statewide, as indicated in 2013 Collision Data on California State Highways, California Department of Transportation (Caltrans). The calculated collision rates for the three study intersections are lower that the statewide averages for similar facilities, indicating that the intersections are operating within acceptable safety parameters. The collision rate calculations are provided in Appendix A.

5 Traffic Impact Study for the 853 Fourth Street West Project June 15, 2018
Table 1 – Collision Rates at the Study Intersection
Study Intersection Number of
Collisions
(2012-2016)
Calculated
Collision Rate
(c/mve)
Statewide Average
Collision Rate
(c/mve)
1. Fifth St W/W MacArthur St 7 0.29 0.32
2. First St W/W MacArthur St 5 0.27 0.32
3. Broadway/MacArthur St 8 0.22 0.27
Note: c/mve = collisions per million vehicles entering
Alternative Modes
Pedestrian Facilities
Pedestrian facilities include sidewalks, crosswalks, pedestrian signal phases, curb ramps, curb extensions, and various streetscape amenities such as lighting, benches, etc. In general, a network of sidewalks, crosswalks, pedestrian signals, and curb ramps provide access for pedestrians in the vicinity of the proposed project site.
Fifth Street West – Full sidewalk connectivity exists along Fifth Street West and crosswalks are marked at most major and minor street intersections. Lighting is provided via post-top street lights along the west side of the street.
West MacArthur Street – Continuous sidewalks exist along the West MacArthur Street with lighting provided along its southern sidewalk. There are crosswalks and curb ramps at minor and major street intersections.
First Street West – Pedestrian amenities along First Street West include full sidewalk coverage, marked crosswalks, lighting along its east side, and curb ramps.
Broadway – Full sidewalk coverage is provided on both sides of Broadway between Napa Street and Clay Street. The signalized intersection of Broadway/MacArthur Street located east of the project area includes pedestrian phasing, marked crosswalks, and curb ramps.
Bicycle Facilities
The Highway Design Manual, Caltrans, 2017, classifies bikeways into four categories:
Class I Multi-Use Path – a completely separated right-of-way for the exclusive use of bicycles and pedestrians with cross flows of motorized traffic minimized.
Class II Bike Lane – a striped and signed lane for one-way bike travel on a street or highway. Class III Bike Route – signing only for shared use with motor vehicles within the same travel lane on a street
or highway. Class IV Bikeway – also known as a separated bikeway, a Class IV Bikeway is for the exclusive use of bicycles
and includes a separation between the bikeway and the motor vehicle traffic lane. The separation may include, but is not limited to, grade separation, flexible posts, inflexible physical barriers, or on-street parking.
There are existing Class II bike lanes along Fifth Street West and West MacArthur Street and future bicycle facilities are planned for Broadway and East MacArthur Street. Table 2 summarizes the existing and planned bicycle facilities in the project vicinity, as contained in the 2014 Sonoma Bicycle and Pedestrian Master Plan.

6 Traffic Impact Study for the 853 Fourth Street West Project
June 15, 2018
Table 2 – Bicycle Facility Summary
Status
Facility
Class Length
(miles)
Begin Point End Point
Existing
Fifth Street West II 0.65 Oregon Street Harrington Drive
West MacArthur Street II 0.56 Fifth Street West Broadway
Planned
Broadway II 1.12 Napa Street Napa Road
East MacArthur Street II 0.33 Sonoma City Limits 8th Street East
Source: SCTA Countywide Bicycle and Pedestrian Master Plan, Sonoma County Transportation Authority, 2014
Transit Facilities
Transit Services in the City of Sonoma, and throughout Sonoma County, are provided by Sonoma County Transit (SCT). There are four SCT transit stops within what is typically considered acceptable walking distance (one quarter-mile) of the site. SCT Route 32 provides loop service to destinations throughout the City and stops on both sides of Fifth Street West, just north of the intersection with West MacArthur Street. This route operates Monday through Friday with approximately 45-minute headways between 8:00 a.m. and 4:30 p.m. Saturday service operates with approximately one-hour headways between 9:00 a.m. and 3:00 p.m.
Routes 30 and 34 provide regional service to destinations throughout Santa Rosa and Sonoma Valley. Route 30 has stops located on both sides of West MacArthur Street, adjacent to the project frontage, and Route 34 has stops located on both sides of Fifth Street West. Route 30 operates seven days a week with approximately one-and-a-half-hour headways on weekdays between 6:00 a.m. and 9:00 p.m. and approximately 3-hour headways on weekends from 7:00 a.m. to 7:00 p.m. Route 34 offers weekday service from 8:00 a.m. to 4:00 p.m. with 45-minute headways and Saturday service from 9:00 a.m. to 2:00 p.m. with one-and-a-quarter-hour headways.
Routes 38 provides regional service to and from San Rafael and stops on both sides of Fifth Street West near the project site. Routes 38 operates on weekdays with service limited to the morning and evening peak hours.
Two to three bicycles can be carried on most SCT buses. Bike rack space is on a first-come, first-served basis. Additional bicycles are allowed on SCT buses at the discretion of the driver.
Dial-a-ride, also known as paratransit, or door-to-door service, is available for those who are unable to independently use the transit system due to a physical or mental disability. SCT Paratransit is designed to serve the needs of individuals with disabilities within Sonoma and the greater County of Sonoma area.

7 Traffic Impact Study for the 853 Fourth Street West Project June 15, 2018
Capacity Analysis
Intersection Level of Service Methodologies
Level of Service (LOS) is used to rank traffic operation on various types of facilities based on traffic volumes and roadway capacity using a series of letter designations ranging from A to F. Generally, Level of Service A represents free flow conditions and Level of Service F represents forced flow or breakdown conditions. A unit of measure that indicates a level of delay generally accompanies the LOS designation. The study intersections were evaluated using methodologies published in the Highway Capacity Manual (HCM), Transportation Research Board, 2010. This source contains methodologies for various types of intersection control, all of which are related to a measurement of delay in average number of seconds per vehicle.
The study intersections of Fifth Street West/West MacArthur Street and First Street West/West MacArthur Street, which have stop signs on all approaches, were analyzed using the “All-Way Stop-Controlled” Intersection methodology from the HCM. This methodology evaluates delay for each approach based on turning movements, opposing and conflicting traffic volumes, and the number of lanes. Average vehicle delay is computed for the intersection overall, which is then related to a Level of Service.
Broadway/MacArthur Street was analyzed using the signalized methodology, which is based on factors including traffic volumes, green time for each movement, phasing, whether the signals are coordinated or not, truck traffic, and pedestrian activity. Average stopped delay per vehicle in seconds is used as the basis for evaluation in this LOS methodology. For purposes of this study, delays were calculated using actual signal timing from timing sheets provided by Caltrans.
The ranges of delay associated with the various levels of service are indicated in Table 3.
Table 3 – Intersection Level of Service Criteria
LOS All-Way Stop-Controlled Signalized
A Delay of 0 to 10 seconds. Upon stopping, drivers are immediately able to proceed.
Delay of 0 to 10 seconds. Most vehicles arrive during the green phase, so do not stop at all.
B Delay of 10 to 15 seconds. Drivers may wait for one or two vehicles to clear the intersection before proceeding from a stop.
Delay of 10 to 20 seconds. More vehicles stop than with LOS A, but many drivers still do not have to stop.
C Delay of 15 to 25 seconds. Drivers will enter a queue of one or two vehicles on the same approach, and wait for vehicle to clear from one or more approaches prior to entering the intersection.
Delay of 20 to 35 seconds. The number of vehicles stopping is significant, although many still pass through without stopping.
D Delay of 25 to 35 seconds. Queues of more than two vehicles are encountered on one or more approaches.
Delay of 35 to 55 seconds. The influence of congestion is noticeable, and most vehicles have to stop.
E Delay of 35 to 50 seconds. Longer queues are encountered on more than one approach to the intersection.
Delay of 55 to 80 seconds. Most, if not all, vehicles must stop and drivers consider the delay excessive.
F Delay of more than 50 seconds. Drivers enter long queues on all approaches.
Delay of more than 80 seconds. Vehicles may wait through more than one cycle to clear the intersection.
Reference: Highway Capacity Manual, Transportation Research Board, 2010

8 Traffic Impact Study for the 853 Fourth Street West Project
June 15, 2018
Traffic Operation Standards
City of Sonoma
In the 2016 Circulation Element of the City of Sonoma 2020 General Plan, the following policy was adopted:
Policy 1.5: Establish a motor vehicle Level of Service (LOS) standard of LOS D at intersections. The following shall be taken into consideration in applying this standard:
Efforts to meet the vehicle LOS standard shall not result in diminished safety for other modes including walking, bicycling, or transit (see Policy 1.6).
The standard shall be applied to the overall intersection operation and not that of any individual approach or movement.
Consideration shall be given to the operation of the intersection over time, rather than relying exclusively on peak period conditions.
The five intersections surrounding the historic Sonoma Plaza shall be exempt from vehicle LOS standards in order to maintain the historic integrity of the Plaza and prioritize non-auto modes.
Caltrans
The study intersection on Broadway, which serves as State Route (SR) 12 through the City of Sonoma, is under the jurisdiction of Caltrans, and their policy indicates that they endeavor to maintain operation at the transition from LOS C to LOS D. Where Caltrans facilities serve as part of a local street system, the local agency’s policies are generally applied, so the City’s LOS D standard was applied for purposes of this analysis.
Existing Conditions
The Existing Conditions scenario provides an evaluation of current operation based on existing traffic volumes during the a.m. and p.m. peak periods. This condition does not include project-generated traffic volumes. Volume data was collected in November 2017 and January 2018 while local schools were in session. It is noted that because these counts were collected after the firestorms that threatened the City of Sonoma in mid-October, the data was compared to counts obtained for other projects prior to the fire, and the highest volumes used to provide the most reasonable analysis.
Intersection Levels of Service
Under existing conditions, all the study intersections operate at an acceptable LOS C or better during both the morning and evening peak periods. A summary of the intersection level of service calculations is contained in Table 4, existing traffic volumes are shown in Figure 2, and copies of the Level of Service calculations are provided in Appendix B.
Table 4 – Existing Peak Hour Intersection Levels of Service
Study Intersection AM Peak PM Peak
Delay LOS Delay LOS
1. Fifth St W/W MacArthur St 14.9 B 12.3 B
2. First St W/W MacArthur St 14.1 B 10.1 B
3. Broadway/MacArthur St 21.4 C 17.6 B
Notes: Delay is measured in average seconds per vehicle; LOS = Level of Service

Traffi
c Im
pact
Stu
dy fo
r the
853
Fou
rth
Stre
et W
est P
roje
ct
son0
57.a
i 2/
18
Proj
ect S
ite
Fourth Street West
Hayes Street
Broadway
First Street West
Nic
oli L
ane
Arr
oyo
Way
East
Mac
Art
hur S
tree
t
Wes
t Mac
Art
hur S
tree
t
Fifth Street West
12
1
23
Nor
th
Not
to S
cale
15 (29)303(254)129(240)
(20)
20(8
)15
(10)
11
(4) 4(46)301(18) 71
127(
202)
4 (
19)
55 (
69)
1
9 (20)48(17)31(11)
(14)
12
(223
)261
(54)
95
(49)51(30)39(11)36
19 (
26)
189(
239)
19 (
9)
2
22 (34)355(319)71 (43)
(20)
13
(109
)124
(105
)166
(115)115(388)385
(55) 7865
(60)
81(1
28)
95(6
2)
3
(xx)
PM P
eak
Hou
r Vol
ume
xxA
M P
eak
Hou
r Vol
ume
Stud
y In
ters
ectio
nLE
GEN
D
Fig
ure
2–
Ex
isti
ng
Tra
ffic
Vo
lum
es

10 Traffic Impact Study for the 853 Fourth Street West Project
June 15, 2018
Future Conditions
Evening peak hour volumes for the horizon year of 2040 for the intersections of Fifth Street West/West MacArthur Street and Broadway/MacArthur Street were obtained from the Circulation Element of the City’s General Plan.
Because the City’s General Plan does not include future volume projections for the morning peak hour, the overall growth rate at Broadway/MacArthur Street was calculated based on the evening peak hour and applied to the existing morning peak hour turning movement counts to arrive at future volumes.
Application of the growth factor resulted in unreasonably high future volumes for the a.m. peak hour for the intersection of 5th Street West/MacArthur Street. Morning peak hour segment volumes for the horizon year of 2040 were obtained from the County’s gravity demand model as maintained by the Sonoma County Transportation Authority (SCTA) and translated to turning movement volumes using the “Furness” method. The Furness method is an iterative process that employs existing turn movement data, existing link volumes, and future link volumes to project likely turning future movement volumes at intersections. This exercise provided volumes that represent a more realistic increase in volumes than were achieved using a growth factor, so these volumes were used for the analysis.
Future volume projections for the intersection of First Street West/West MacArthur Street are not included in the City’s General Plan, nor are they included in the County’s model. Therefore, future volumes for this intersection were estimated using a growth rate of half-a-percent per year at the minor First Street West approaches and one percent per year at the major West MacArthur Street approaches.
Under the anticipated Future volumes, the study intersections are expected to operate acceptably at LOS D or better. Future volumes are shown in Figure 3 and operating conditions are summarized in Table 5.
Table 5 – Future Peak Hour Intersection Levels of Service
Study Intersection AM Peak PM Peak
Delay LOS Delay LOS
1. Fifth St W/W MacArthur St 15.3 C 24.8 C
2. First St W/W MacArthur St 25.4 D 11.9 B
3. Broadway/MacArthur St 31.3 C 21.6 C
Notes: Delay is measured in average seconds per vehicle; LOS = Level of Service
Project Description
The proposed residential development would include 16 single family homes, four duplex units in two buildings, and 12 accessory dwelling units. The currently vacant project site is located on the northwest corner of Fourth Street West and West MacArthur Street. The project would have an internal street providing access to all 18 lots and connecting Hayes Street on the west to Fourth Street West just south of Nicoli Lane at its eastern end. Two units would have access directly to Hayes Street and two others to Fourth Street. The currently unimproved frontages along both Hayes Street and Fourth Street West would be improved to include curb, gutter and sidewalk, with Hayes Street extended northerly to connect to the existing terminus near the site’s northerly property line. The project site plan is shown in Figure 4.

Traffi
c Im
pact
Stu
dy fo
r the
853
Fou
rth
Stre
et W
est P
roje
ct
son0
57.a
i 4/
18
Proj
ect S
ite
Fourth Street West
Hayes Street
Broadway
First Street West
Nic
oli L
ane
Arr
oyo
Way
East
Mac
Art
hur S
tree
t
Wes
t Mac
Art
hur S
tree
t
Fifth Street West
12
1
23
Nor
th
Not
to S
cale
15 (23)303(369)165(122)
(11)2
0(9
)16
(6)11
(6) 4(409)307
(80) 88
144(
181)
4 (
8)56
(90
)
1
10(22)54(19)35(12)
(21)
15
(280
)328
(68)
119
(55)57(34)44(12)40
24 (
33)
238(
300)
24 (
11)
2
34 (46)547(570)109(103)
(26)
20
(147
)191
(147
)256
(114)177(618)593
(88)12010
0(11
5)12
5(16
2)14
6(76
)
3
(xx)
PM P
eak
Hou
r Vol
ume
xxA
M P
eak
Hou
r Vol
ume
Stud
y In
ters
ectio
nLE
GEN
D
Fig
ure
3 –
Fu
ture
Tra
ffic
Vo
lum
es

Traffi
c Im
pact
Stu
dy fo
r the
853
Fou
rth
Stre
et W
est P
roje
ct
son0
57.a
i 4/
18So
urce
: Ca
rlson
, Bar
bee
& G
ibso
n, In
c. 5
/18
Fig
ure
4 –
Sit
e P
lan
13 Traffic Impact Study for the 853 Fourth Street West Project June 15, 2018
Trip Generation
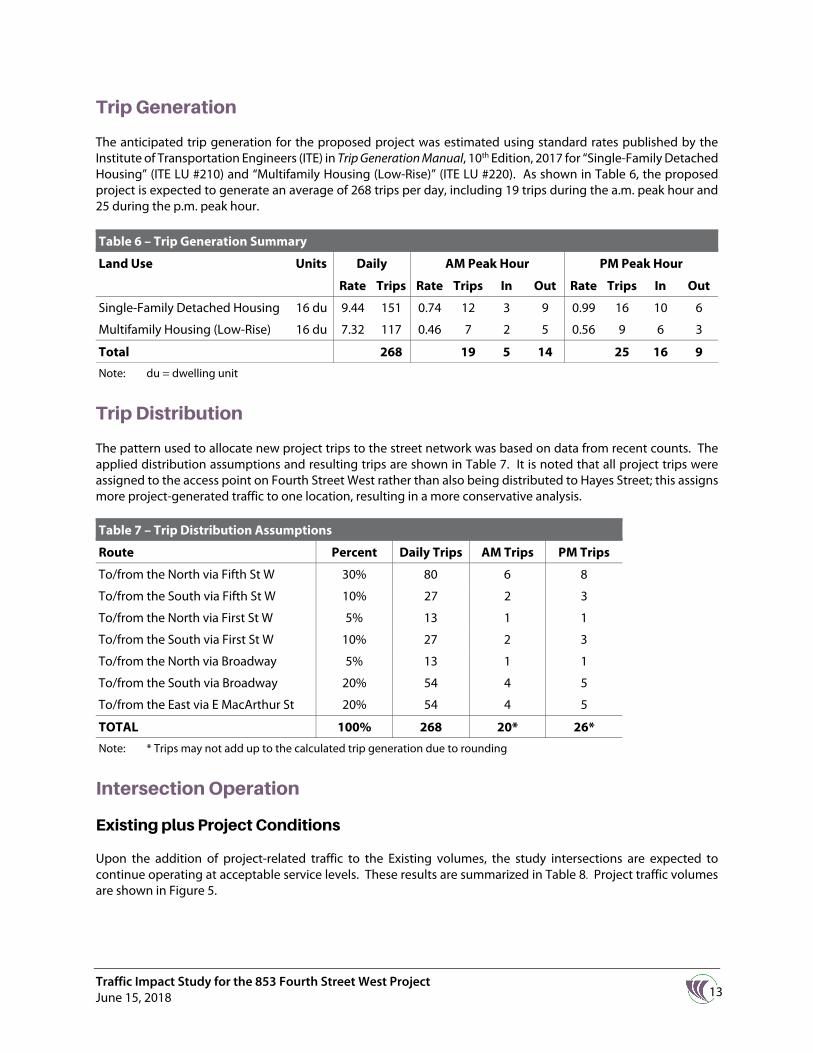
The anticipated trip generation for the proposed project was estimated using standard rates published by the Institute of Transportation Engineers (ITE) in Trip Generation Manual, 10th Edition, 2017 for “Single-Family Detached Housing” (ITE LU #210) and “Multifamily Housing (Low-Rise)” (ITE LU #220). As shown in Table 6, the proposed project is expected to generate an average of 268 trips per day, including 19 trips during the a.m. peak hour and 25 during the p.m. peak hour.
Table 6 – Trip Generation Summary
Land Use Units Daily AM Peak Hour PM Peak Hour
Rate Trips Rate Trips In Out Rate Trips In Out
Single-Family Detached Housing 16 du 9.44 151 0.74 12 3 9 0.99 16 10 6
Multifamily Housing (Low-Rise) 16 du 7.32 117 0.46 7 2 5 0.56 9 6 3
Total 268 19 5 14 25 16 9
Note: du = dwelling unit
Trip Distribution
The pattern used to allocate new project trips to the street network was based on data from recent counts. The applied distribution assumptions and resulting trips are shown in Table 7. It is noted that all project trips were assigned to the access point on Fourth Street West rather than also being distributed to Hayes Street; this assigns more project-generated traffic to one location, resulting in a more conservative analysis.
Intersection Operation
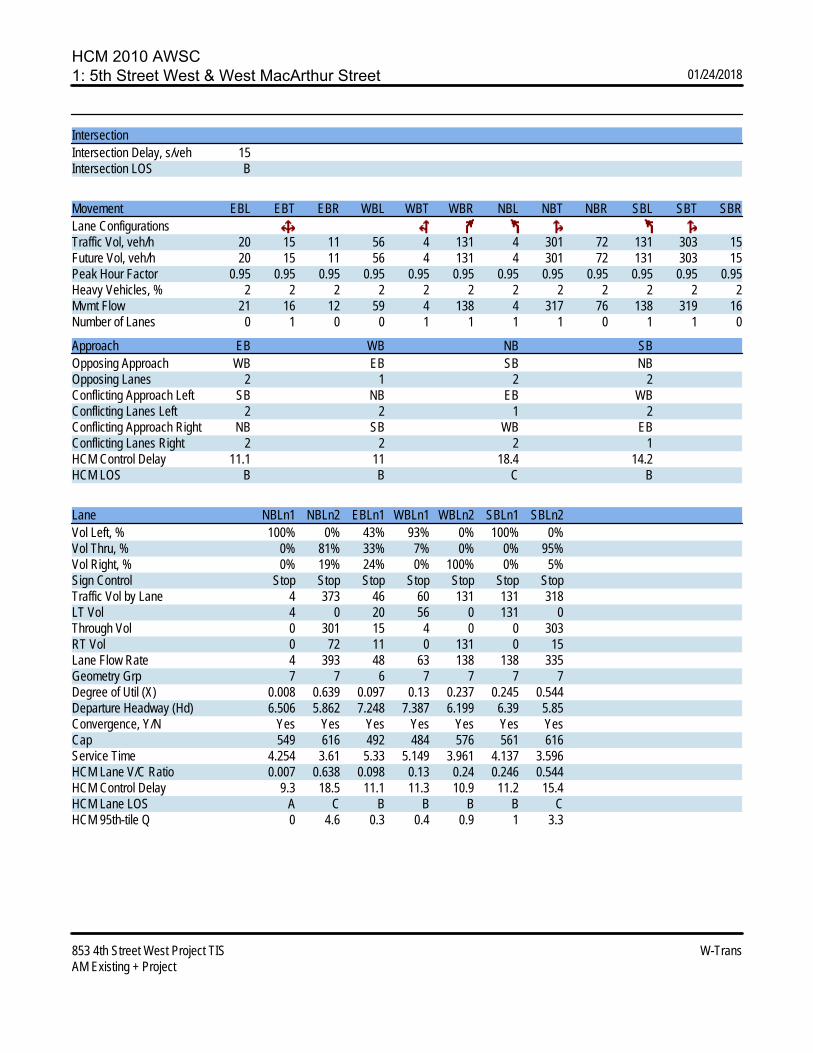
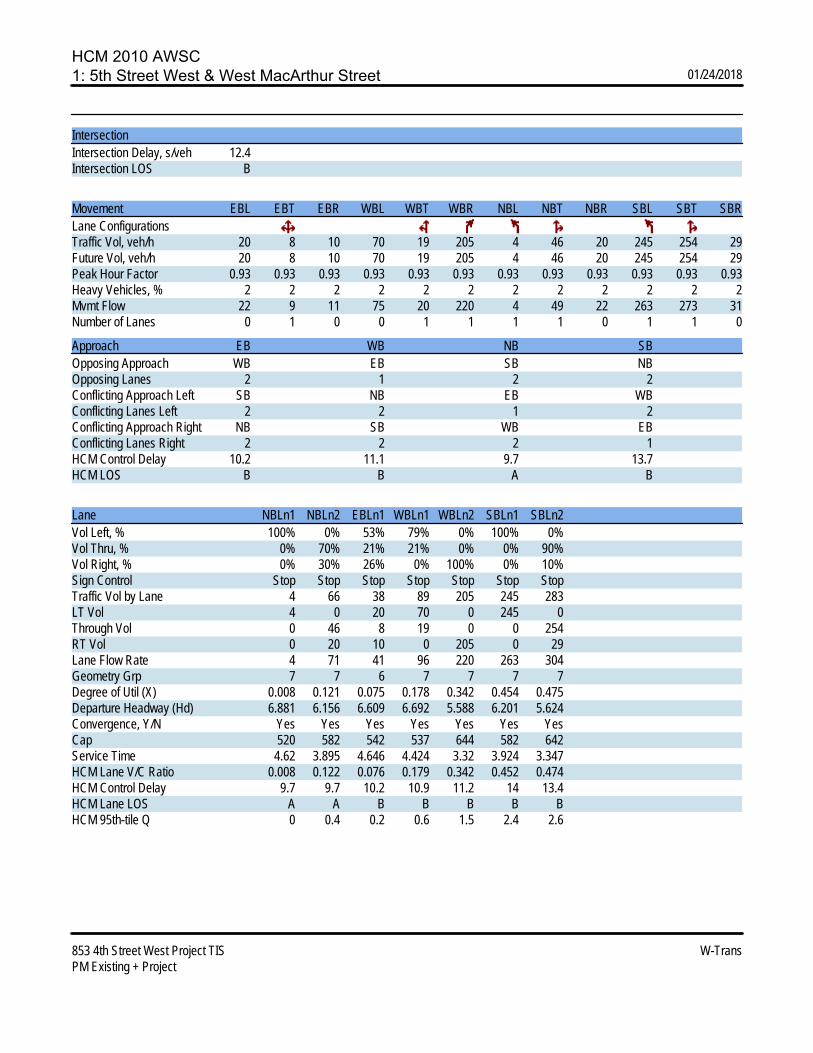
Existing plus Project Conditions
Upon the addition of project-related traffic to the Existing volumes, the study intersections are expected to continue operating at acceptable service levels. These results are summarized in Table 8. Project traffic volumes are shown in Figure 5.
Table 7 – Trip Distribution Assumptions
Route Percent Daily Trips AM Trips PM Trips
To/from the North via Fifth St W 30% 80 6 8
To/from the South via Fifth St W 10% 27 2 3
To/from the North via First St W 5% 13 1 1
To/from the South via First St W 10% 27 2 3
To/from the North via Broadway 5% 13 1 1
To/from the South via Broadway 20% 54 4 5
To/from the East via E MacArthur St 20% 54 4 5
TOTAL 100% 268 20* 26*
Note: * Trips may not add up to the calculated trip generation due to rounding

Traffi
c Im
pact
Stu
dy fo
r the
853
Fou
rth
Stre
et W
est P
roje
ct
son0
57.a
i 2/
18
Proj
ect S
ite
Fourth Street West
Hayes Street
Broadway
First Street West
Nic
oli L
ane
Arr
oyo
Way
East
Mac
Art
hur S
tree
t
Wes
t Mac
Art
hur S
tree
t
Fifth Street West
12
1
23
Nor
th
Not
to S
cale
0(0)0(0)2(5)
(0)0
(0)0
(0)0
(0)0(0)0(2)1
4(3)
0(0)
1(1)
1
0(1)0(0)0(0)
(1)1
(5)6
(1)1
(2)1(0)0(0)0
0(0)
2(7)
0(0)
2
0(1)0(0)0(0)
(1)1
(2)3
(2)3
(3)1(0)0(0)0
0(0)
1(3)
0(0)
3
(xx)
PM P
eak
Hou
r Vol
ume
xxA
M P
eak
Hou
r Vol
ume
Stud
y In
ters
ectio
nLE
GEN
D
Fig
ure
5 –
Pro
jec
t T
raff
ic V
olu
me
s
15 Traffic Impact Study for the 853 Fourth Street West Project June 15, 2018
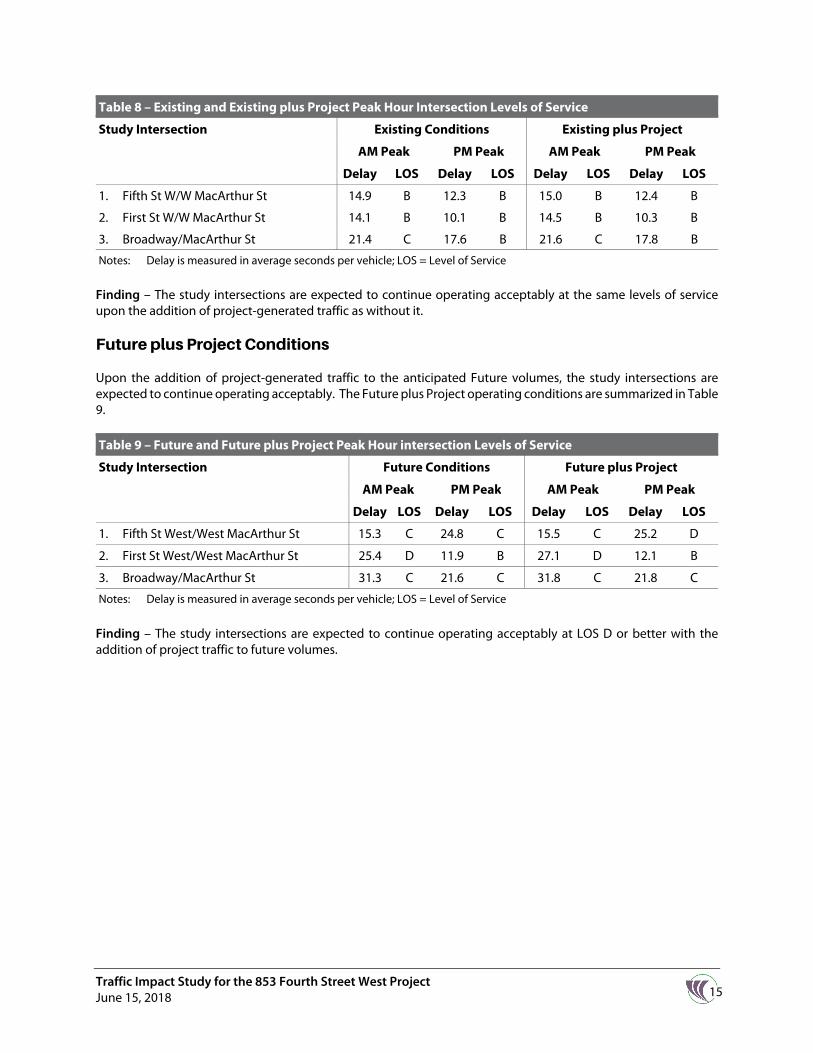
Table 8 – Existing and Existing plus Project Peak Hour Intersection Levels of Service
Study Intersection Existing Conditions Existing plus Project
AM Peak PM Peak AM Peak PM Peak
Delay LOS Delay LOS Delay LOS Delay LOS
1. Fifth St W/W MacArthur St 14.9 B 12.3 B 15.0 B 12.4 B
2. First St W/W MacArthur St 14.1 B 10.1 B 14.5 B 10.3 B
3. Broadway/MacArthur St 21.4 C 17.6 B 21.6 C 17.8 B
Notes: Delay is measured in average seconds per vehicle; LOS = Level of Service
Finding – The study intersections are expected to continue operating acceptably at the same levels of service upon the addition of project-generated traffic as without it.
Future plus Project Conditions
Upon the addition of project-generated traffic to the anticipated Future volumes, the study intersections are expected to continue operating acceptably. The Future plus Project operating conditions are summarized in Table 9.
Table 9 – Future and Future plus Project Peak Hour intersection Levels of Service
Study Intersection Future Conditions Future plus Project
AM Peak PM Peak AM Peak PM Peak
Delay LOS Delay LOS Delay LOS Delay LOS
1. Fifth St West/West MacArthur St 15.3 C 24.8 C 15.5 C 25.2 D
2. First St West/West MacArthur St 25.4 D 11.9 B 27.1 D 12.1 B
3. Broadway/MacArthur St 31.3 C 21.6 C 31.8 C 21.8 C
Notes: Delay is measured in average seconds per vehicle; LOS = Level of Service
Finding – The study intersections are expected to continue operating acceptably at LOS D or better with the addition of project traffic to future volumes.

16 Traffic Impact Study for the 853 Fourth Street West Project
June 15, 2018
Alternative Modes
Pedestrian Facilities
Given that the site is surrounded by primarily residential land uses, with some public and commercial land uses located to the north and east, it is reasonable to assume that some project residents will want to walk and/or bicycle to reach their destinations. Combined with the new sidewalks that would be constructed on both Hayes Street and Fourth Street West, the existing sidewalks on West MacArthur Street would adequately serve the project, effectively connecting the site to the surrounding pedestrian network. In general, the pedestrian network surrounding the project site is well connected and provides adequate access for pedestrians.
Finding – Pedestrian facilities serving the area will be improved by the project, and will be adequate to serve project demand.
Bicycle Facilities
Existing and planned future bicycle facilities, together with shared use of minor streets, provide adequate access for bicyclists.
Finding – Bicycle facilities serving the project site are adequate.
Bicycle Storage
Zoning regulations for the City of Sonoma do not state a rate at which bicycle parking should be provided for multifamily residential projects. According to the City of Santa Rosa’s municipal code, Chapter 20.36.040, multifamily project should provide one space per four units if the units do not have a private garage or private storage space for bike storage. Based on the site plan, all units will have garages that can be used to store bicycles; bicycle storage is therefore adequate.
Transit
Existing transit routes are adequate to accommodate project-generated transit trips. Existing stops are within acceptable walking distance of the site.
Finding – Transit facilities serving the project site are adequate.

17 Traffic Impact Study for the 853 Fourth Street West Project June 15, 2018
Access and Circulation
Site Access
As proposed, the project would take access via an internal street network, with “Street A” traversing the site east-west and connecting to Hayes Street on the west and Fourth Street West to the east. A north-south “Street B” would connect to the individual parcels, and intersection “Street A” approximately mid-site. The intersection of “Street A” with Fourth Street West would be offset to the south of Nicoli Lane, effectively creating a four-legged intersection. Consideration was given to potential benefits of moving “Street A” northerly one parcel (putting Parcels 5 and 14 on the south side of the street rather than the north side); however, the intersection would still be offset and the direction of the offset would be less conducive to vehicles turning left from both directions of Fourth Street East simultaneously so it is recommended that the proposed configuration be retained. To ensure that drivers exiting the site yield right-of-way to through traffic on Hayes Street and Fourth Street West it is recommended that stop signs be installed on “Street A” where it intersects both Hayes Street and Fourth Street West.
Sight Distance
At private street and driveway approaches a substantially clear line of sight should be maintained between the driver of a vehicle waiting on the driveway and the driver of an approaching vehicle. Adequate time must be provided for the waiting vehicle to either cross, turn left, or turn right, without requiring the through traffic to radically alter their speed. Sight distance is typically measured from a 3.5-foot height at the location of the driver on the minor road to a 4.25-foot object height in the center of the approaching lane of the major road. Set-back for a driver on the minor street approach is a minimum of 15 feet, measured from the edge of the traveled way, though a lesser set-back is generally more appropriate for a driveway approach.
Sight distances along Hayes Street and Fourth Street West were evaluated based on sight distance criteria contained in the Highway Design Manual published by Caltrans. The recommended sight distances for private street approaches are based on stopping sight distance, with the approach travel speeds used as the basis for determining the recommended sight distance. Additionally, the stopping sight distance needed for a following driver to stop if there is a vehicle waiting to turn into a side street or driveway is evaluated based on stopping sight distance criterion and the approach speed on the major street.
Based on a design speed of 25 mph, the minimum stopping sight distance needed is 155 feet. Both Hayes Street and Fourth Street West are straight and flat. As a result, sight lines exceed the 155 feet needed to meet the criteria recommended. Similarly, drivers would have clear visibility of a vehicle waiting to turn left into the site.
Upon widening both Hayes Street and Fourth Street West to provide a full cross-section, there may be sufficient width to accommodate parking. Should that be the case, parking should be prohibited for 50 feet on either side Street A at both Hayes Street and Fourth Street West; this could be accomplished by painting the curb red.
Consideration was also given to the adequacy of sight distance for the four driveways proposed on Fourth Street West and Hayes Street. Given that both streets are straight and flat, adequate stopping sight distance would be available, with better sight lines available from the elevated height of the driveway than from street-level.
Left-Turn Lane Warrant
Consideration was given to the potential need for a left-turn pocket on Fourth Street West at “Street A” based on criteria contained in the Intersection Channelization Design Guide, National Cooperative Highway Research Program (NCHRP) Report No. 279, Transportation Research Board, 1985, as well as a more recent update of the

18 Traffic Impact Study for the 853 Fourth Street West Project
June 15, 2018
methodology developed by the Washington State Department of Transportation. To estimate volumes for Fourth Street West the number of residences around the site and parking spaces at the Sonoma Valley Hospital lot north of the site were counted to arrive at a conservative estimate for the traffic volume on Fourth Street West. There are 60 residences accessible via Fourth Street West, between Bettencourt Street and West MacArthur Street, in the general vicinity of the project site and 80 parking spaces at the Sonoma Valley Hospital lot directly north of the project site. Additionally, trips to and from the Sonoma Valley Hospital and other residences in the greater vicinity that may use Fourth Street West were accounted for to arrive at an assumed peak hour volume of 250 vehicles each direction, which is likely substantially higher than the actual traffic volume. Under these conservative estimates, a left-turn lane is not warranted on Fourth Street West at the project’s driveway. It is similarly concluded that Hayes Street, which has lower volumes than Fourth Street West, would not warrant a left-turn pocket at the new street connection. The turn lane warrant analysis spreadsheets are provided in Appendix D.

19 Traffic Impact Study for the 853 Fourth Street West Project June 15, 2018
Conclusions and Recommendations
Conclusions
The proposed project is expected to generate an average of 268 daily trips, including 19 weekday a.m. peak hour trips and 25 trips during the weekday p.m. peak hour.
Under existing conditions, the study intersections operate acceptably at LOS B or C, and they would be expected to continue operating at the same service levels with project-generated traffic added.
Under anticipated future volumes and with project-related traffic added, the study intersections are expected to operate acceptably at LOS D or better.
Pedestrian facilities exist along the project frontages on West MacArthur Street and Fourth Street West are adequate for the proposed project.
Existing and planned future Class II bike lanes, along with the shared use of minor streets, provide adequate access for bicyclists.
Transit facilities connect the site to Santa Rosa, Sonoma Valley, and San Rafael and the site is served by bus stops along the project frontage on West MacArthur Street.
Sight distance along East MacArthur Street at the project driveway is adequate for the posted 25-mph speed limit.
Recommendations
Stop signs should be installed on both ends of “Street A’ where they intersect Hayes Street and Fourth Street West.
The curbs should be painted red for 50 feet on both sides of the intersections of “Street A” with Hayes Street and Fourth Street.

20 Traffic Impact Study for the 853 Fourth Street West Project
June 15, 2018
Study Participants and References
Study Participants
Principal in Charge Dalene J. Whitlock, PE, PTOE Assistant Engineer Kevin Rangel, EIT Graphics Angela McCoy Editing/Formatting Alex Scrobonia Report Review Dalene J. Whitlock, PE, PTOE
References
2013 Collision Data on California State Highways, California Department of Transportation, 2016 City of Sonoma 2020 General Plan: Circulation Element, City of Sonoma, 2016 Design Information Bulletin Number 89: Class IV Bikeway Guidance (Separated Bikeways/Cycle Tracks), California
Department of Transportation, 2015 Guide for the Preparation of Traffic Impact Studies, California Department of Transportation, 2002 Highway Capacity Manual, Transportation Research Board, 2010 Highway Design Manual, 6th Edition, California Department of Transportation, 2017 Intersection Channelization Design Guide, National Cooperative Highway Research Program (NCHRP) Report No.
279, Transportation Research Board, 1985 Santa Rosa City Code, Quality Code Publishing, 2017 SCTA Countywide Bicycle and Pedestrian Master Plan, Sonoma County Transportation Authority, 2014 Sonoma Bicycle and Pedestrian Master Plan, Sonoma County Transportation Authority, 2014 Sonoma County Transit, http://sctransit.com/ Sonoma Municipal Code, Code Publishing Company, 2017 Statewide Integrated Traffic Records System (SWITRS), California Highway Patrol, 2012-2016 Trip Generation Manual, 10th Edition, Institute of Transportation Engineers, 2017
SON057

A Traffic Impact Study for the 853 Fourth Street West Project June 2018
Appendix A
Collision Rate Calculations


Date of Count:
Number of Collisions: 7Number of Injuries: 3
Number of Fatalities: 0ADT: 13200
Start Date: End Date:
Number of Years: 5
Intersection Type: Four-LeggedControl Type: 4 Way Stop
Area: Suburban
7 x13,200 x x 5
Study Intersection 0.29 c/mveStatewide Average* 0.32 c/mve
c/mve = collisions per million vehicles entering intersection* 2013 Collision Data on California State Highways, Caltrans
Date of Count:
Number of Collisions: 5Number of Injuries: 1
Number of Fatalities: 0ADT: 10100
Start Date: End Date:
Number of Years: 5
Intersection Type: Four-LeggedControl Type: 4 Way Stop
Area: Suburban
5 x10,100 x x 5
Study Intersection 0.27 c/mveStatewide Average* 0.32 c/mve
c/mve = collisions per million vehicles entering intersection* 2013 Collision Data on California State Highways, Caltrans
853 Fourth Street West Project
Tuesday, December 19, 2017
Wednesday, January 17, 2018
44.7%
Intersection Collision Rate Calculations
January 1, 2012December 31, 2016
Intersection # Fifth Street West & West MacArthur Street
collision rate = 1,000,000
First Street West & West MacArthur Strret
44.7%
ADT = average daily total vehicles entering intersection
January 1, 2012
365
Intersection #
December 31, 2016
Number of Collisions x 1 Millioncollision rate =
1:
Collision Rate Injury Rate
20.0%Collision Rate Fatality Rate
collision rate = 365
2:
Number of Collisions x 1 Million
0.4%
collision rate = ADT x 365 Days per Year x Number of Years
42.9%
1,000,000
Injury Rate
Fatality Rate0.0%
ADT x 365 Days per Year x Number of Years
0.0%
ADT = average daily total vehicles entering intersection
0.4%
W-Trans1/29/2018
Page 1 of 2
Date of Count:
Number of Collisions: 8Number of Injuries: 2
Number of Fatalities: 0ADT: 19600
Start Date: End Date:
Number of Years: 5
Intersection Type: Four-LeggedControl Type: Signals
Area: Urban
8 x19,600 x x 5
Study Intersection 0.22 c/mveStatewide Average* 0.27 c/mve
c/mve = collisions per million vehicles entering intersection* 2013 Collision Data on California State Highways, Caltrans
ADT = average daily total vehicles entering intersection
0.4%
Wednesday, November 01, 2017
25.0%0.0%
Intersection Collision Rate Calculaions
Intersection #
Fatality Rate
365
Collision Rate
3: Broadway & MacArthur Street
collision rate = 1,000,000
Number of Collisions x 1 MillionADT x 365 Days per Year x Number of Years
Injury Rate
December 31, 2016
853 Fourth Street West Project
January 1, 2012
collision rate =
41.9%
W-Trans1/29/2018
Page 2 of 2

B Traffic Impact Study for the 853 Fourth Street West Project June 2018
Appendix B
Intersection Level of Service Calculations


HCM 2010 AWSC1: 5th Street West & West MacArthur Street 01/24/2018
853 4th Street West Project TIS W-TransAM Existing
IntersectionIntersection Delay, s/veh 14.9Intersection LOS B
Movement EBL EBT EBR WBL WBT WBR NBL NBT NBR SBL SBT SBRLane ConfigurationsTraffic Vol, veh/h 20 15 11 55 4 127 4 301 71 129 303 15Future Vol, veh/h 20 15 11 55 4 127 4 301 71 129 303 15Peak Hour Factor 0.95 0.95 0.95 0.95 0.95 0.95 0.95 0.95 0.95 0.95 0.95 0.95Heavy Vehicles, % 2 2 2 2 2 2 2 2 2 2 2 2Mvmt Flow 21 16 12 58 4 134 4 317 75 136 319 16Number of Lanes 0 1 0 0 1 1 1 1 0 1 1 0
Approach EB WB NB SBOpposing Approach WB EB SB NBOpposing Lanes 2 1 2 2Conflicting Approach Left SB NB EB WBConflicting Lanes Left 2 2 1 2Conflicting Approach Right NB SB WB EBConflicting Lanes Right 2 2 2 1HCM Control Delay 11.1 10.9 18.2 14.1HCM LOS B B C B
Lane NBLn1 NBLn2 EBLn1 WBLn1 WBLn2 SBLn1 SBLn2Vol Left, % 100% 0% 43% 93% 0% 100% 0%Vol Thru, % 0% 81% 33% 7% 0% 0% 95%Vol Right, % 0% 19% 24% 0% 100% 0% 5%Sign Control Stop Stop Stop Stop Stop Stop StopTraffic Vol by Lane 4 372 46 59 127 129 318LT Vol 4 0 20 55 0 129 0Through Vol 0 301 15 4 0 0 303RT Vol 0 71 11 0 127 0 15Lane Flow Rate 4 392 48 62 134 136 335Geometry Grp 7 7 6 7 7 7 7Degree of Util (X) 0.008 0.635 0.097 0.127 0.23 0.24 0.542Departure Headway (Hd) 6.483 5.841 7.223 7.375 6.188 6.369 5.829Convergence, Y/N Yes Yes Yes Yes Yes Yes YesCap 552 619 494 485 579 564 619Service Time 4.228 3.585 5.3 5.135 3.947 4.113 3.572HCM Lane V/C Ratio 0.007 0.633 0.097 0.128 0.231 0.241 0.541HCM Control Delay 9.3 18.3 11.1 11.2 10.8 11.1 15.3HCM Lane LOS A C B B B B CHCM 95th-tile Q 0 4.5 0.3 0.4 0.9 0.9 3.2

HCM 2010 AWSC1: 5th Street West & West MacArthur Street 01/24/2018
853 4th Street West Project TIS W-TransPM Existing
IntersectionIntersection Delay, s/veh 12.3Intersection LOS B
Movement EBL EBT EBR WBL WBT WBR NBL NBT NBR SBL SBT SBRLane ConfigurationsTraffic Vol, veh/h 20 8 10 69 19 202 4 46 18 240 254 29Future Vol, veh/h 20 8 10 69 19 202 4 46 18 240 254 29Peak Hour Factor 0.93 0.93 0.93 0.93 0.93 0.93 0.93 0.93 0.93 0.93 0.93 0.93Heavy Vehicles, % 2 2 2 2 2 2 2 2 2 2 2 2Mvmt Flow 22 9 11 74 20 217 4 49 19 258 273 31Number of Lanes 0 1 0 0 1 1 1 1 0 1 1 0
Approach EB WB NB SBOpposing Approach WB EB SB NBOpposing Lanes 2 1 2 2Conflicting Approach Left SB NB EB WBConflicting Lanes Left 2 2 1 2Conflicting Approach Right NB SB WB EBConflicting Lanes Right 2 2 2 1HCM Control Delay 10.2 11 9.7 13.5HCM LOS B B A B
Lane NBLn1 NBLn2 EBLn1 WBLn1 WBLn2 SBLn1 SBLn2Vol Left, % 100% 0% 53% 78% 0% 100% 0%Vol Thru, % 0% 72% 21% 22% 0% 0% 90%Vol Right, % 0% 28% 26% 0% 100% 0% 10%Sign Control Stop Stop Stop Stop Stop Stop StopTraffic Vol by Lane 4 64 38 88 202 240 283LT Vol 4 0 20 69 0 240 0Through Vol 0 46 8 19 0 0 254RT Vol 0 18 10 0 202 0 29Lane Flow Rate 4 69 41 95 217 258 304Geometry Grp 7 7 6 7 7 7 7Degree of Util (X) 0.008 0.117 0.075 0.175 0.336 0.443 0.474Departure Headway (Hd) 6.854 6.146 6.579 6.67 5.567 6.182 5.605Convergence, Y/N Yes Yes Yes Yes Yes Yes YesCap 522 583 545 538 647 583 645Service Time 4.593 3.884 4.616 4.401 3.298 3.905 3.328HCM Lane V/C Ratio 0.008 0.118 0.075 0.177 0.335 0.443 0.471HCM Control Delay 9.6 9.7 10.2 10.8 11.1 13.7 13.3HCM Lane LOS A A B B B B BHCM 95th-tile Q 0 0.4 0.2 0.6 1.5 2.3 2.5

HCM 2010 AWSC2: 1st Street West & West MacArthur Street 01/24/2018
853 4th Street West Project TIS W-TransAM Existing
IntersectionIntersection Delay, s/veh 14.1Intersection LOS B
Movement EBL EBT EBR WBL WBT WBR NBL NBT NBR SBL SBT SBRLane ConfigurationsTraffic Vol, veh/h 12 261 95 19 189 19 51 39 36 31 48 9Future Vol, veh/h 12 261 95 19 189 19 51 39 36 31 48 9Peak Hour Factor 0.80 0.80 0.80 0.80 0.80 0.80 0.80 0.80 0.80 0.80 0.80 0.80Heavy Vehicles, % 2 2 2 2 2 2 2 2 2 2 2 2Mvmt Flow 15 326 119 24 236 24 64 49 45 39 60 11Number of Lanes 0 1 0 0 1 0 0 1 0 0 1 0
Approach EB WB NB SBOpposing Approach WB EB SB NBOpposing Lanes 1 1 1 1Conflicting Approach Left SB NB EB WBConflicting Lanes Left 1 1 1 1Conflicting Approach Right NB SB WB EBConflicting Lanes Right 1 1 1 1HCM Control Delay 16.9 12.4 11.2 10.7HCM LOS C B B B
Lane NBLn1 EBLn1 WBLn1 SBLn1Vol Left, % 40% 3% 8% 35%Vol Thru, % 31% 71% 83% 55%Vol Right, % 29% 26% 8% 10%Sign Control Stop Stop Stop StopTraffic Vol by Lane 126 368 227 88LT Vol 51 12 19 31Through Vol 39 261 189 48RT Vol 36 95 19 9Lane Flow Rate 158 460 284 110Geometry Grp 1 1 1 1Degree of Util (X) 0.262 0.645 0.425 0.189Departure Headway (Hd) 5.985 5.048 5.393 6.194Convergence, Y/N Yes Yes Yes YesCap 599 713 667 576Service Time 4.046 3.092 3.445 4.261HCM Lane V/C Ratio 0.264 0.645 0.426 0.191HCM Control Delay 11.2 16.9 12.4 10.7HCM Lane LOS B C B BHCM 95th-tile Q 1 4.7 2.1 0.7

HCM 2010 AWSC2: 1st Street West & West MacArthur Street 01/24/2018
853 4th Street West Project TIS W-TransPM Existing
IntersectionIntersection Delay, s/veh 10.1Intersection LOS B
Movement EBL EBT EBR WBL WBT WBR NBL NBT NBR SBL SBT SBRLane ConfigurationsTraffic Vol, veh/h 17 223 54 9 239 26 49 30 11 11 17 20Future Vol, veh/h 17 223 54 9 239 26 49 30 11 11 17 20Peak Hour Factor 0.96 0.96 0.96 0.96 0.96 0.96 0.96 0.96 0.96 0.96 0.96 0.96Heavy Vehicles, % 2 2 2 2 2 2 2 2 2 2 2 2Mvmt Flow 18 232 56 9 249 27 51 31 11 11 18 21Number of Lanes 0 1 0 0 1 0 0 1 0 0 1 0
Approach EB WB NB SBOpposing Approach WB EB SB NBOpposing Lanes 1 1 1 1Conflicting Approach Left SB NB EB WBConflicting Lanes Left 1 1 1 1Conflicting Approach Right NB SB WB EBConflicting Lanes Right 1 1 1 1HCM Control Delay 10.4 10.3 9.3 8.7HCM LOS B B A A
Lane NBLn1 EBLn1 WBLn1 SBLn1Vol Left, % 54% 6% 3% 23%Vol Thru, % 33% 76% 87% 35%Vol Right, % 12% 18% 9% 42%Sign Control Stop Stop Stop StopTraffic Vol by Lane 90 294 274 48LT Vol 49 17 9 11Through Vol 30 223 239 17RT Vol 11 54 26 20Lane Flow Rate 94 306 285 50Geometry Grp 1 1 1 1Degree of Util (X) 0.14 0.386 0.365 0.072Departure Headway (Hd) 5.365 4.537 4.603 5.202Convergence, Y/N Yes Yes Yes YesCap 664 790 779 682Service Time 3.438 2.585 2.653 3.283HCM Lane V/C Ratio 0.142 0.387 0.366 0.073HCM Control Delay 9.3 10.4 10.3 8.7HCM Lane LOS A B B AHCM 95th-tile Q 0.5 1.8 1.7 0.2

HCM 2010 Signalized Intersection Summary3: Broadway & West MacArthur Street/East MacArthur Street 01/24/2018
853 4th Street West Project TIS W-TransAM Existing
Movement EBL EBT EBR WBL WBT WBR NBL NBT NBR SBL SBT SBRLane ConfigurationsTraffic Volume (veh/h) 13 124 166 95 81 65 115 385 78 71 355 22Future Volume (veh/h) 13 124 166 95 81 65 115 385 78 71 355 22Number 7 4 14 3 8 18 5 2 12 1 6 16Initial Q (Qb), veh 0 1 0 0 3 0 0 0 0 0 0 0Ped-Bike Adj(A_pbT) 0.98 0.96 0.98 0.97 1.00 0.97 1.00 0.96Parking Bus, Adj 1.00 1.00 1.00 1.00 1.00 1.00 1.00 1.00 1.00 1.00 1.00 1.00Adj Sat Flow, veh/h/ln 1900 1863 1900 1900 1863 1900 1863 1863 1900 1863 1863 1863Adj Flow Rate, veh/h 16 149 112 114 98 48 139 464 72 86 428 21Adj No. of Lanes 0 1 0 0 1 0 1 2 0 1 2 1Peak Hour Factor 0.83 0.83 0.83 0.83 0.83 0.83 0.83 0.83 0.83 0.83 0.83 0.83Percent Heavy Veh, % 2 2 2 2 2 2 2 2 2 2 2 2Cap, veh/h 60 306 207 219 192 77 188 1318 203 206 1560 672Arrive On Green 0.31 0.31 0.31 0.31 0.31 0.31 0.11 0.43 0.43 0.12 0.44 0.44Sat Flow, veh/h 42 961 681 519 595 252 1774 3059 472 1774 3539 1524Grp Volume(v), veh/h 277 0 0 260 0 0 139 267 269 86 428 21Grp Sat Flow(s),veh/h/ln 1684 0 0 1365 0 0 1774 1770 1761 1774 1770 1524Q Serve(g_s), s 0.0 0.0 0.0 2.5 0.0 0.0 6.2 8.2 8.3 3.6 6.2 0.6Cycle Q Clear(g_c), s 10.8 0.0 0.0 13.3 0.0 0.0 6.2 8.2 8.3 3.6 6.2 0.6Prop In Lane 0.06 0.40 0.44 0.18 1.00 0.27 1.00 1.00Lane Grp Cap(c), veh/h 571 0 0 490 0 0 188 763 759 206 1560 672V/C Ratio(X) 0.49 0.00 0.00 0.53 0.00 0.00 0.74 0.35 0.35 0.42 0.27 0.03Avail Cap(c_a), veh/h 730 0 0 622 0 0 350 764 761 263 1564 673HCM Platoon Ratio 1.00 1.00 1.00 1.00 1.00 1.00 1.00 1.00 1.00 1.00 1.00 1.00Upstream Filter(I) 1.00 0.00 0.00 1.00 0.00 0.00 1.00 1.00 1.00 1.00 1.00 1.00Uniform Delay (d), s/veh 23.1 0.0 0.0 23.8 0.0 0.0 35.2 15.5 15.5 33.4 14.5 12.9Incr Delay (d2), s/veh 0.6 0.0 0.0 0.9 0.0 0.0 5.6 1.3 1.3 1.4 0.4 0.1Initial Q Delay(d3),s/veh 0.0 0.0 0.0 0.6 0.0 0.0 0.0 0.0 0.0 0.0 0.0 0.0%ile BackOfQ(50%),veh/ln 5.3 0.0 0.0 5.5 0.0 0.0 3.3 4.3 4.3 1.9 3.1 0.3LnGrp Delay(d),s/veh 23.8 0.0 0.0 25.3 0.0 0.0 40.8 16.8 16.8 34.7 14.9 13.0LnGrp LOS C C D B B C B BApproach Vol, veh/h 277 260 675 535Approach Delay, s/veh 23.8 25.3 21.7 18.0Approach LOS C C C B
Timer 1 2 3 4 5 6 7 8Assigned Phs 1 2 4 5 6 8Phs Duration (G+Y+Rc), s 12.4 40.0 28.6 11.6 40.8 28.6Change Period (Y+Rc), s 3.0 5.0 3.5 3.0 5.0 3.5Max Green Setting (Gmax), s 12.0 35.0 33.0 16.0 35.0 33.0Max Q Clear Time (g_c+I1), s 5.6 10.3 12.8 8.2 8.2 15.3Green Ext Time (p_c), s 0.1 6.6 1.7 0.2 5.4 1.6
Intersection SummaryHCM 2010 Ctrl Delay 21.4HCM 2010 LOS C

HCM 2010 Signalized Intersection Summary3: Broadway & West MacArthur Street/East MacArthur Street 01/24/2018
853 4th Street West Project TIS W-TransPM Existing
Movement EBL EBT EBR WBL WBT WBR NBL NBT NBR SBL SBT SBRLane ConfigurationsTraffic Volume (veh/h) 20 109 105 62 128 60 115 388 55 43 319 34Future Volume (veh/h) 20 109 105 62 128 60 115 388 55 43 319 34Number 7 4 14 3 8 18 5 2 12 1 6 16Initial Q (Qb), veh 0 1 0 0 1 0 0 1 0 0 0 0Ped-Bike Adj(A_pbT) 1.00 0.98 1.00 0.98 1.00 0.99 1.00 1.00Parking Bus, Adj 1.00 1.00 1.00 1.00 1.00 1.00 1.00 1.00 1.00 1.00 1.00 1.00Adj Sat Flow, veh/h/ln 1900 1863 1900 1900 1863 1900 1863 1863 1900 1863 1863 1863Adj Flow Rate, veh/h 22 122 70 70 144 49 129 436 51 48 358 31Adj No. of Lanes 0 1 0 0 1 0 1 2 0 1 2 1Peak Hour Factor 0.89 0.89 0.89 0.89 0.89 0.89 0.89 0.89 0.89 0.89 0.89 0.89Percent Heavy Veh, % 2 2 2 2 2 2 2 2 2 2 2 2Cap, veh/h 77 240 125 139 229 69 208 1659 192 169 1758 786Arrive On Green 0.22 0.22 0.22 0.22 0.22 0.22 0.12 0.52 0.52 0.10 0.50 0.50Sat Flow, veh/h 92 1071 565 340 1024 312 1774 3193 372 1774 3539 1583Grp Volume(v), veh/h 214 0 0 263 0 0 129 241 246 48 358 31Grp Sat Flow(s),veh/h/ln 1728 0 0 1675 0 0 1774 1770 1795 1774 1770 1583Q Serve(g_s), s 0.0 0.0 0.0 2.1 0.0 0.0 4.9 5.3 5.4 1.8 4.0 0.7Cycle Q Clear(g_c), s 7.6 0.0 0.0 9.7 0.0 0.0 4.9 5.3 5.4 1.8 4.0 0.7Prop In Lane 0.10 0.33 0.27 0.19 1.00 0.21 1.00 1.00Lane Grp Cap(c), veh/h 442 0 0 438 0 0 208 919 932 169 1758 786V/C Ratio(X) 0.48 0.00 0.00 0.60 0.00 0.00 0.62 0.26 0.26 0.28 0.20 0.04Avail Cap(c_a), veh/h 849 0 0 822 0 0 403 920 933 302 1760 787HCM Platoon Ratio 1.00 1.00 1.00 1.00 1.00 1.00 1.00 1.00 1.00 1.00 1.00 1.00Upstream Filter(I) 1.00 0.00 0.00 1.00 0.00 0.00 1.00 1.00 1.00 1.00 1.00 1.00Uniform Delay (d), s/veh 24.3 0.0 0.0 25.0 0.0 0.0 29.6 9.5 9.5 29.7 9.9 9.1Incr Delay (d2), s/veh 0.8 0.0 0.0 1.3 0.0 0.0 3.0 0.7 0.7 0.9 0.3 0.1Initial Q Delay(d3),s/veh 0.1 0.0 0.0 0.1 0.0 0.0 0.0 0.0 0.0 0.0 0.0 0.0%ile BackOfQ(50%),veh/ln 3.9 0.0 0.0 5.0 0.0 0.0 2.5 2.8 2.9 0.9 2.0 0.3LnGrp Delay(d),s/veh 25.2 0.0 0.0 26.4 0.0 0.0 32.6 10.2 10.2 30.6 10.2 9.2LnGrp LOS C C C B B C B AApproach Vol, veh/h 214 263 616 437Approach Delay, s/veh 25.2 26.4 14.9 12.4Approach LOS C C B B
Timer 1 2 3 4 5 6 7 8Assigned Phs 1 2 4 5 6 8Phs Duration (G+Y+Rc), s 9.7 41.6 19.1 11.3 40.0 19.1Change Period (Y+Rc), s 3.0 5.0 3.5 3.0 5.0 3.5Max Green Setting (Gmax), s 12.0 35.0 33.0 16.0 35.0 33.0Max Q Clear Time (g_c+I1), s 3.8 7.4 9.6 6.9 6.0 11.7Green Ext Time (p_c), s 0.0 6.1 1.3 0.2 4.7 1.7
Intersection SummaryHCM 2010 Ctrl Delay 17.6HCM 2010 LOS B

HCM 2010 AWSC1: 5th Street West & West MacArthur Street 06/13/2018
853 4th Street West Project TIS W-TransAM Future
IntersectionIntersection Delay, s/veh 15.3Intersection LOS C
Movement EBL EBT EBR WBL WBT WBR NBL NBT NBR SBL SBT SBRLane ConfigurationsTraffic Vol, veh/h 20 16 11 56 4 144 4 307 88 165 303 15Future Vol, veh/h 20 16 11 56 4 144 4 307 88 165 303 15Peak Hour Factor 0.98 0.98 0.98 0.98 0.98 0.98 0.98 0.98 0.98 0.98 0.98 0.98Heavy Vehicles, % 2 2 2 2 2 2 2 2 2 2 2 2Mvmt Flow 20 16 11 57 4 147 4 313 90 168 309 15Number of Lanes 0 1 0 0 1 1 1 1 0 1 1 0
Approach EB WB NB SBOpposing Approach WB EB SB NBOpposing Lanes 2 1 2 2Conflicting Approach Left SB NB EB WBConflicting Lanes Left 2 2 1 2Conflicting Approach Right NB SB WB EBConflicting Lanes Right 2 2 2 1HCM Control Delay 11.2 11.2 19.4 14.1HCM LOS B B C B
Lane NBLn1 NBLn2 EBLn1 WBLn1 WBLn2 SBLn1 SBLn2Vol Left, % 100% 0% 43% 93% 0% 100% 0%Vol Thru, % 0% 78% 34% 7% 0% 0% 95%Vol Right, % 0% 22% 23% 0% 100% 0% 5%Sign Control Stop Stop Stop Stop Stop Stop StopTraffic Vol by Lane 4 395 47 60 144 165 318LT Vol 4 0 20 56 0 165 0Through Vol 0 307 16 4 0 0 303RT Vol 0 88 11 0 144 0 15Lane Flow Rate 4 403 48 61 147 168 324Geometry Grp 7 7 6 7 7 7 7Degree of Util (X) 0.007 0.661 0.098 0.127 0.256 0.301 0.532Departure Headway (Hd) 6.572 5.906 7.345 7.457 6.268 6.439 5.898Convergence, Y/N Yes Yes Yes Yes Yes Yes YesCap 543 609 485 479 570 557 610Service Time 4.326 3.661 5.431 5.221 4.032 4.192 3.651HCM Lane V/C Ratio 0.007 0.662 0.099 0.127 0.258 0.302 0.531HCM Control Delay 9.4 19.5 11.2 11.3 11.2 12 15.2HCM Lane LOS A C B B B B CHCM 95th-tile Q 0 4.9 0.3 0.4 1 1.3 3.1

HCM 2010 AWSC1: 5th Street West & West MacArthur Street 01/30/2018
853 4th Street West Project TIS W-TransPM Future
IntersectionIntersection Delay, s/veh 24.8Intersection LOS C
Movement EBL EBT EBR WBL WBT WBR NBL NBT NBR SBL SBT SBRLane ConfigurationsTraffic Vol, veh/h 11 9 6 90 8 181 6 409 80 122 369 23Future Vol, veh/h 11 9 6 90 8 181 6 409 80 122 369 23Peak Hour Factor 0.98 0.98 0.98 0.98 0.98 0.98 0.98 0.98 0.98 0.98 0.98 0.98Heavy Vehicles, % 2 2 2 2 2 2 2 2 2 2 2 2Mvmt Flow 11 9 6 92 8 185 6 417 82 124 377 23Number of Lanes 0 1 0 0 1 1 1 1 0 1 1 0
Approach EB WB NB SBOpposing Approach WB EB SB NBOpposing Lanes 2 1 2 2Conflicting Approach Left SB NB EB WBConflicting Lanes Left 2 2 1 2Conflicting Approach Right NB SB WB EBConflicting Lanes Right 2 2 2 1HCM Control Delay 11.8 12.8 37 20.1HCM LOS B B E C
Lane NBLn1 NBLn2 EBLn1 WBLn1 WBLn2 SBLn1 SBLn2Vol Left, % 100% 0% 42% 92% 0% 100% 0%Vol Thru, % 0% 84% 35% 8% 0% 0% 94%Vol Right, % 0% 16% 23% 0% 100% 0% 6%Sign Control Stop Stop Stop Stop Stop Stop StopTraffic Vol by Lane 6 489 26 98 181 122 392LT Vol 6 0 11 90 0 122 0Through Vol 0 409 9 8 0 0 369RT Vol 0 80 6 0 181 0 23Lane Flow Rate 6 499 27 100 185 124 400Geometry Grp 7 7 6 7 7 7 7Degree of Util (X) 0.012 0.868 0.061 0.217 0.34 0.237 0.701Departure Headway (Hd) 6.886 6.261 8.299 7.813 6.626 6.856 6.305Convergence, Y/N Yes Yes Yes Yes Yes Yes YesCap 517 574 434 457 537 520 568Service Time 4.669 4.043 6.299 5.609 4.422 4.641 4.089HCM Lane V/C Ratio 0.012 0.869 0.062 0.219 0.345 0.238 0.704HCM Control Delay 9.8 37.3 11.8 12.8 12.8 11.8 22.7HCM Lane LOS A E B B B B CHCM 95th-tile Q 0 9.7 0.2 0.8 1.5 0.9 5.6

HCM 2010 AWSC2: 1st Street West & West MacArthur Street 01/30/2018
853 4th Street West Project TIS W-TransAM Future
IntersectionIntersection Delay, s/veh 25.4Intersection LOS D
Movement EBL EBT EBR WBL WBT WBR NBL NBT NBR SBL SBT SBRLane ConfigurationsTraffic Vol, veh/h 15 328 119 24 238 24 57 44 40 35 54 10Future Vol, veh/h 15 328 119 24 238 24 57 44 40 35 54 10Peak Hour Factor 0.80 0.80 0.80 0.80 0.80 0.80 0.80 0.80 0.80 0.80 0.80 0.80Heavy Vehicles, % 2 2 2 2 2 2 2 2 2 2 2 2Mvmt Flow 19 410 149 30 298 30 71 55 50 44 68 13Number of Lanes 0 1 0 0 1 0 0 1 0 0 1 0
Approach EB WB NB SBOpposing Approach WB EB SB NBOpposing Lanes 1 1 1 1Conflicting Approach Left SB NB EB WBConflicting Lanes Left 1 1 1 1Conflicting Approach Right NB SB WB EBConflicting Lanes Right 1 1 1 1HCM Control Delay 36.9 17.3 13.3 12.4HCM LOS E C B B
Lane NBLn1 EBLn1 WBLn1 SBLn1Vol Left, % 40% 3% 8% 35%Vol Thru, % 31% 71% 83% 55%Vol Right, % 28% 26% 8% 10%Sign Control Stop Stop Stop StopTraffic Vol by Lane 141 462 286 99LT Vol 57 15 24 35Through Vol 44 328 238 54RT Vol 40 119 24 10Lane Flow Rate 176 578 358 124Geometry Grp 1 1 1 1Degree of Util (X) 0.333 0.889 0.591 0.243Departure Headway (Hd) 6.799 5.544 5.953 7.072Convergence, Y/N Yes Yes Yes YesCap 527 658 604 506Service Time 4.863 3.544 4.006 5.143HCM Lane V/C Ratio 0.334 0.878 0.593 0.245HCM Control Delay 13.3 36.9 17.3 12.4HCM Lane LOS B E C BHCM 95th-tile Q 1.4 10.9 3.9 0.9

HCM 2010 AWSC2: 1st Street West & West MacArthur Street 01/30/2018
853 4th Street West Project TIS W-TransPM Future
IntersectionIntersection Delay, s/veh 11.9Intersection LOS B
Movement EBL EBT EBR WBL WBT WBR NBL NBT NBR SBL SBT SBRLane ConfigurationsTraffic Vol, veh/h 21 280 68 11 300 33 55 34 12 12 19 22Future Vol, veh/h 21 280 68 11 300 33 55 34 12 12 19 22Peak Hour Factor 0.96 0.96 0.96 0.96 0.96 0.96 0.96 0.96 0.96 0.96 0.96 0.96Heavy Vehicles, % 2 2 2 2 2 2 2 2 2 2 2 2Mvmt Flow 22 292 71 11 313 34 57 35 13 13 20 23Number of Lanes 0 1 0 0 1 0 0 1 0 0 1 0
Approach EB WB NB SBOpposing Approach WB EB SB NBOpposing Lanes 1 1 1 1Conflicting Approach Left SB NB EB WBConflicting Lanes Left 1 1 1 1Conflicting Approach Right NB SB WB EBConflicting Lanes Right 1 1 1 1HCM Control Delay 12.5 12.2 10.1 9.3HCM LOS B B B A
Lane NBLn1 EBLn1 WBLn1 SBLn1Vol Left, % 54% 6% 3% 23%Vol Thru, % 34% 76% 87% 36%Vol Right, % 12% 18% 10% 42%Sign Control Stop Stop Stop StopTraffic Vol by Lane 101 369 344 53LT Vol 55 21 11 12Through Vol 34 280 300 19RT Vol 12 68 33 22Lane Flow Rate 105 384 358 55Geometry Grp 1 1 1 1Degree of Util (X) 0.171 0.502 0.475 0.088Departure Headway (Hd) 5.851 4.701 4.773 5.727Convergence, Y/N Yes Yes Yes YesCap 617 757 745 629Service Time 3.854 2.787 2.862 3.732HCM Lane V/C Ratio 0.17 0.507 0.481 0.087HCM Control Delay 10.1 12.5 12.2 9.3HCM Lane LOS B B B AHCM 95th-tile Q 0.6 2.9 2.6 0.3

HCM 2010 Signalized Intersection Summary3: Broadway & West MacArthur Street/East MacArthur Street 01/30/2018
853 4th Street West Project TIS W-TransAM Future
Movement EBL EBT EBR WBL WBT WBR NBL NBT NBR SBL SBT SBRLane ConfigurationsTraffic Volume (veh/h) 20 191 256 146 125 100 177 593 120 109 547 34Future Volume (veh/h) 20 191 256 146 125 100 177 593 120 109 547 34Number 7 4 14 3 8 18 5 2 12 1 6 16Initial Q (Qb), veh 0 1 0 0 3 0 0 0 0 0 0 0Ped-Bike Adj(A_pbT) 0.99 0.96 0.99 0.97 1.00 0.97 1.00 0.96Parking Bus, Adj 1.00 1.00 1.00 1.00 1.00 1.00 1.00 1.00 1.00 1.00 1.00 1.00Adj Sat Flow, veh/h/ln 1900 1863 1900 1900 1863 1900 1863 1863 1900 1863 1863 1863Adj Flow Rate, veh/h 22 210 201 160 137 83 195 652 112 120 601 32Adj No. of Lanes 0 1 0 0 1 0 1 2 0 1 2 1Peak Hour Factor 0.91 0.91 0.91 0.91 0.91 0.91 0.91 0.91 0.91 0.91 0.91 0.91Percent Heavy Veh, % 2 2 2 2 2 2 2 2 2 2 2 2Cap, veh/h 58 334 274 182 167 77 232 1198 205 203 1355 582Arrive On Green 0.36 0.36 0.36 0.36 0.36 0.36 0.13 0.40 0.40 0.11 0.38 0.38Sat Flow, veh/h 45 877 799 386 420 225 1774 3005 515 1774 3539 1519Grp Volume(v), veh/h 433 0 0 380 0 0 195 383 381 120 601 32Grp Sat Flow(s),veh/h/ln 1722 0 0 1031 0 0 1774 1770 1751 1774 1770 1519Q Serve(g_s), s 0.0 0.0 0.0 13.0 0.0 0.0 9.8 15.2 15.3 5.9 11.5 1.2Cycle Q Clear(g_c), s 20.0 0.0 0.0 33.0 0.0 0.0 9.8 15.2 15.3 5.9 11.5 1.2Prop In Lane 0.05 0.46 0.42 0.22 1.00 0.29 1.00 1.00Lane Grp Cap(c), veh/h 663 0 0 435 0 0 232 706 698 203 1355 582V/C Ratio(X) 0.65 0.00 0.00 0.87 0.00 0.00 0.84 0.54 0.55 0.59 0.44 0.06Avail Cap(c_a), veh/h 663 0 0 428 0 0 310 706 698 233 1355 582HCM Platoon Ratio 1.00 1.00 1.00 1.00 1.00 1.00 1.00 1.00 1.00 1.00 1.00 1.00Upstream Filter(I) 1.00 0.00 0.00 1.00 0.00 0.00 1.00 1.00 1.00 1.00 1.00 1.00Uniform Delay (d), s/veh 25.2 0.0 0.0 30.6 0.0 0.0 38.8 21.1 21.1 38.4 21.0 17.8Incr Delay (d2), s/veh 2.3 0.0 0.0 18.0 0.0 0.0 14.4 3.0 3.0 3.0 1.1 0.2Initial Q Delay(d3),s/veh 0.0 0.0 0.0 2.7 0.0 0.0 0.0 0.0 0.0 0.0 0.0 0.0%ile BackOfQ(50%),veh/ln 9.9 0.0 0.0 12.3 0.0 0.0 5.7 7.9 7.9 3.0 5.8 0.5LnGrp Delay(d),s/veh 27.5 0.0 0.0 51.3 0.0 0.0 53.2 24.1 24.2 41.5 22.0 18.0LnGrp LOS C D D C C D C BApproach Vol, veh/h 433 380 959 753Approach Delay, s/veh 27.5 51.3 30.0 25.0Approach LOS C D C C
Timer 1 2 3 4 5 6 7 8Assigned Phs 1 2 4 5 6 8Phs Duration (G+Y+Rc), s 13.5 41.5 36.5 14.9 40.0 36.5Change Period (Y+Rc), s 3.0 5.0 3.5 3.0 5.0 3.5Max Green Setting (Gmax), s 12.0 35.0 33.0 16.0 35.0 33.0Max Q Clear Time (g_c+I1), s 7.9 17.3 22.0 11.8 13.5 35.0Green Ext Time (p_c), s 0.1 8.2 2.3 0.2 7.2 0.0
Intersection SummaryHCM 2010 Ctrl Delay 31.3HCM 2010 LOS C

HCM 2010 Signalized Intersection Summary3: Broadway & West MacArthur Street/East MacArthur Street 01/30/2018
853 4th Street West Project TIS W-TransPM Future
Movement EBL EBT EBR WBL WBT WBR NBL NBT NBR SBL SBT SBRLane ConfigurationsTraffic Volume (veh/h) 26 147 147 76 162 115 114 618 88 103 570 46Future Volume (veh/h) 26 147 147 76 162 115 114 618 88 103 570 46Number 7 4 14 3 8 18 5 2 12 1 6 16Initial Q (Qb), veh 0 1 0 0 1 0 0 1 0 0 0 0Ped-Bike Adj(A_pbT) 1.00 0.98 1.00 0.98 1.00 0.99 1.00 1.00Parking Bus, Adj 1.00 1.00 1.00 1.00 1.00 1.00 1.00 1.00 1.00 1.00 1.00 1.00Adj Sat Flow, veh/h/ln 1900 1863 1900 1900 1863 1900 1863 1863 1900 1863 1863 1863Adj Flow Rate, veh/h 29 162 115 84 178 108 125 679 86 113 626 44Adj No. of Lanes 0 1 0 0 1 0 1 2 0 1 2 1Peak Hour Factor 0.91 0.91 0.91 0.91 0.91 0.91 0.91 0.91 0.91 0.91 0.91 0.91Percent Heavy Veh, % 2 2 2 2 2 2 2 2 2 2 2 2Cap, veh/h 75 284 183 135 242 131 188 1391 175 225 1630 729Arrive On Green 0.29 0.29 0.29 0.29 0.29 0.29 0.11 0.44 0.44 0.13 0.46 0.46Sat Flow, veh/h 90 975 642 278 832 458 1774 3159 400 1774 3539 1583Grp Volume(v), veh/h 306 0 0 370 0 0 125 380 385 113 626 44Grp Sat Flow(s),veh/h/ln 1707 0 0 1567 0 0 1774 1770 1789 1774 1770 1583Q Serve(g_s), s 0.0 0.0 0.0 5.2 0.0 0.0 5.4 12.2 12.2 4.7 9.2 1.2Cycle Q Clear(g_c), s 12.1 0.0 0.0 17.3 0.0 0.0 5.4 12.2 12.2 4.7 9.2 1.2Prop In Lane 0.09 0.38 0.23 0.29 1.00 0.22 1.00 1.00Lane Grp Cap(c), veh/h 543 0 0 509 0 0 188 778 787 225 1630 729V/C Ratio(X) 0.56 0.00 0.00 0.73 0.00 0.00 0.67 0.49 0.49 0.50 0.38 0.06Avail Cap(c_a), veh/h 748 0 0 701 0 0 357 779 788 268 1632 730HCM Platoon Ratio 1.00 1.00 1.00 1.00 1.00 1.00 1.00 1.00 1.00 1.00 1.00 1.00Upstream Filter(I) 1.00 0.00 0.00 1.00 0.00 0.00 1.00 1.00 1.00 1.00 1.00 1.00Uniform Delay (d), s/veh 24.5 0.0 0.0 26.1 0.0 0.0 34.2 15.9 15.9 32.4 14.1 11.9Incr Delay (d2), s/veh 0.9 0.0 0.0 2.4 0.0 0.0 4.0 2.2 2.2 1.7 0.7 0.2Initial Q Delay(d3),s/veh 0.1 0.0 0.0 0.1 0.0 0.0 0.0 0.0 0.0 0.0 0.0 0.0%ile BackOfQ(50%),veh/ln 6.0 0.0 0.0 8.0 0.0 0.0 2.9 6.5 6.5 2.4 4.6 0.6LnGrp Delay(d),s/veh 25.5 0.0 0.0 28.6 0.0 0.0 38.2 18.1 18.1 34.1 14.8 12.1LnGrp LOS C C D B B C B BApproach Vol, veh/h 306 370 890 783Approach Delay, s/veh 25.5 28.6 20.9 17.4Approach LOS C C C B
Timer 1 2 3 4 5 6 7 8Assigned Phs 1 2 4 5 6 8Phs Duration (G+Y+Rc), s 13.1 40.0 26.4 11.4 41.7 26.4Change Period (Y+Rc), s 3.0 5.0 3.5 3.0 5.0 3.5Max Green Setting (Gmax), s 12.0 35.0 33.0 16.0 35.0 33.0Max Q Clear Time (g_c+I1), s 6.7 14.2 14.1 7.4 11.2 19.3Green Ext Time (p_c), s 0.1 9.0 1.9 0.2 8.0 2.1
Intersection SummaryHCM 2010 Ctrl Delay 21.6HCM 2010 LOS C
HCM 2010 AWSC1: 5th Street West & West MacArthur Street 01/24/2018
853 4th Street West Project TIS W-TransAM Existing + Project
IntersectionIntersection Delay, s/veh 15Intersection LOS B
Movement EBL EBT EBR WBL WBT WBR NBL NBT NBR SBL SBT SBRLane ConfigurationsTraffic Vol, veh/h 20 15 11 56 4 131 4 301 72 131 303 15Future Vol, veh/h 20 15 11 56 4 131 4 301 72 131 303 15Peak Hour Factor 0.95 0.95 0.95 0.95 0.95 0.95 0.95 0.95 0.95 0.95 0.95 0.95Heavy Vehicles, % 2 2 2 2 2 2 2 2 2 2 2 2Mvmt Flow 21 16 12 59 4 138 4 317 76 138 319 16Number of Lanes 0 1 0 0 1 1 1 1 0 1 1 0
Approach EB WB NB SBOpposing Approach WB EB SB NBOpposing Lanes 2 1 2 2Conflicting Approach Left SB NB EB WBConflicting Lanes Left 2 2 1 2Conflicting Approach Right NB SB WB EBConflicting Lanes Right 2 2 2 1HCM Control Delay 11.1 11 18.4 14.2HCM LOS B B C B
Lane NBLn1 NBLn2 EBLn1 WBLn1 WBLn2 SBLn1 SBLn2Vol Left, % 100% 0% 43% 93% 0% 100% 0%Vol Thru, % 0% 81% 33% 7% 0% 0% 95%Vol Right, % 0% 19% 24% 0% 100% 0% 5%Sign Control Stop Stop Stop Stop Stop Stop StopTraffic Vol by Lane 4 373 46 60 131 131 318LT Vol 4 0 20 56 0 131 0Through Vol 0 301 15 4 0 0 303RT Vol 0 72 11 0 131 0 15Lane Flow Rate 4 393 48 63 138 138 335Geometry Grp 7 7 6 7 7 7 7Degree of Util (X) 0.008 0.639 0.097 0.13 0.237 0.245 0.544Departure Headway (Hd) 6.506 5.862 7.248 7.387 6.199 6.39 5.85Convergence, Y/N Yes Yes Yes Yes Yes Yes YesCap 549 616 492 484 576 561 616Service Time 4.254 3.61 5.33 5.149 3.961 4.137 3.596HCM Lane V/C Ratio 0.007 0.638 0.098 0.13 0.24 0.246 0.544HCM Control Delay 9.3 18.5 11.1 11.3 10.9 11.2 15.4HCM Lane LOS A C B B B B CHCM 95th-tile Q 0 4.6 0.3 0.4 0.9 1 3.3
HCM 2010 AWSC1: 5th Street West & West MacArthur Street 01/24/2018
853 4th Street West Project TIS W-TransPM Existing + Project
IntersectionIntersection Delay, s/veh 12.4Intersection LOS B
Movement EBL EBT EBR WBL WBT WBR NBL NBT NBR SBL SBT SBRLane ConfigurationsTraffic Vol, veh/h 20 8 10 70 19 205 4 46 20 245 254 29Future Vol, veh/h 20 8 10 70 19 205 4 46 20 245 254 29Peak Hour Factor 0.93 0.93 0.93 0.93 0.93 0.93 0.93 0.93 0.93 0.93 0.93 0.93Heavy Vehicles, % 2 2 2 2 2 2 2 2 2 2 2 2Mvmt Flow 22 9 11 75 20 220 4 49 22 263 273 31Number of Lanes 0 1 0 0 1 1 1 1 0 1 1 0
Approach EB WB NB SBOpposing Approach WB EB SB NBOpposing Lanes 2 1 2 2Conflicting Approach Left SB NB EB WBConflicting Lanes Left 2 2 1 2Conflicting Approach Right NB SB WB EBConflicting Lanes Right 2 2 2 1HCM Control Delay 10.2 11.1 9.7 13.7HCM LOS B B A B
Lane NBLn1 NBLn2 EBLn1 WBLn1 WBLn2 SBLn1 SBLn2Vol Left, % 100% 0% 53% 79% 0% 100% 0%Vol Thru, % 0% 70% 21% 21% 0% 0% 90%Vol Right, % 0% 30% 26% 0% 100% 0% 10%Sign Control Stop Stop Stop Stop Stop Stop StopTraffic Vol by Lane 4 66 38 89 205 245 283LT Vol 4 0 20 70 0 245 0Through Vol 0 46 8 19 0 0 254RT Vol 0 20 10 0 205 0 29Lane Flow Rate 4 71 41 96 220 263 304Geometry Grp 7 7 6 7 7 7 7Degree of Util (X) 0.008 0.121 0.075 0.178 0.342 0.454 0.475Departure Headway (Hd) 6.881 6.156 6.609 6.692 5.588 6.201 5.624Convergence, Y/N Yes Yes Yes Yes Yes Yes YesCap 520 582 542 537 644 582 642Service Time 4.62 3.895 4.646 4.424 3.32 3.924 3.347HCM Lane V/C Ratio 0.008 0.122 0.076 0.179 0.342 0.452 0.474HCM Control Delay 9.7 9.7 10.2 10.9 11.2 14 13.4HCM Lane LOS A A B B B B BHCM 95th-tile Q 0 0.4 0.2 0.6 1.5 2.4 2.6

HCM 2010 AWSC2: 1st Street West & West MacArthur Street 01/24/2018
853 4th Street West Project TIS W-TransAM Existing + Project
IntersectionIntersection Delay, s/veh 14.5Intersection LOS B
Movement EBL EBT EBR WBL WBT WBR NBL NBT NBR SBL SBT SBRLane ConfigurationsTraffic Vol, veh/h 13 267 96 19 191 19 52 39 36 31 48 9Future Vol, veh/h 13 267 96 19 191 19 52 39 36 31 48 9Peak Hour Factor 0.80 0.80 0.80 0.80 0.80 0.80 0.80 0.80 0.80 0.80 0.80 0.80Heavy Vehicles, % 2 2 2 2 2 2 2 2 2 2 2 2Mvmt Flow 16 334 120 24 239 24 65 49 45 39 60 11Number of Lanes 0 1 0 0 1 0 0 1 0 0 1 0
Approach EB WB NB SBOpposing Approach WB EB SB NBOpposing Lanes 1 1 1 1Conflicting Approach Left SB NB EB WBConflicting Lanes Left 1 1 1 1Conflicting Approach Right NB SB WB EBConflicting Lanes Right 1 1 1 1HCM Control Delay 17.5 12.6 11.3 10.8HCM LOS C B B B
Lane NBLn1 EBLn1 WBLn1 SBLn1Vol Left, % 41% 3% 8% 35%Vol Thru, % 31% 71% 83% 55%Vol Right, % 28% 26% 8% 10%Sign Control Stop Stop Stop StopTraffic Vol by Lane 127 376 229 88LT Vol 52 13 19 31Through Vol 39 267 191 48RT Vol 36 96 19 9Lane Flow Rate 159 470 286 110Geometry Grp 1 1 1 1Degree of Util (X) 0.266 0.661 0.431 0.191Departure Headway (Hd) 6.025 5.066 5.421 6.237Convergence, Y/N Yes Yes Yes YesCap 594 710 661 572Service Time 4.091 3.113 3.476 4.309HCM Lane V/C Ratio 0.268 0.662 0.433 0.192HCM Control Delay 11.3 17.5 12.6 10.8HCM Lane LOS B C B BHCM 95th-tile Q 1.1 5 2.2 0.7

HCM 2010 AWSC2: 1st Street West & West MacArthur Street 01/24/2018
853 4th Street West Project TIS W-TransPM Existing + Project
IntersectionIntersection Delay, s/veh 10.3Intersection LOS B
Movement EBL EBT EBR WBL WBT WBR NBL NBT NBR SBL SBT SBRLane ConfigurationsTraffic Vol, veh/h 18 228 55 9 246 26 51 30 11 11 17 21Future Vol, veh/h 18 228 55 9 246 26 51 30 11 11 17 21Peak Hour Factor 0.96 0.96 0.96 0.96 0.96 0.96 0.96 0.96 0.96 0.96 0.96 0.96Heavy Vehicles, % 2 2 2 2 2 2 2 2 2 2 2 2Mvmt Flow 19 238 57 9 256 27 53 31 11 11 18 22Number of Lanes 0 1 0 0 1 0 0 1 0 0 1 0
Approach EB WB NB SBOpposing Approach WB EB SB NBOpposing Lanes 1 1 1 1Conflicting Approach Left SB NB EB WBConflicting Lanes Left 1 1 1 1Conflicting Approach Right NB SB WB EBConflicting Lanes Right 1 1 1 1HCM Control Delay 10.6 10.5 9.4 8.7HCM LOS B B A A
Lane NBLn1 EBLn1 WBLn1 SBLn1Vol Left, % 55% 6% 3% 22%Vol Thru, % 33% 76% 88% 35%Vol Right, % 12% 18% 9% 43%Sign Control Stop Stop Stop StopTraffic Vol by Lane 92 301 281 49LT Vol 51 18 9 11Through Vol 30 228 246 17RT Vol 11 55 26 21Lane Flow Rate 96 314 293 51Geometry Grp 1 1 1 1Degree of Util (X) 0.144 0.397 0.376 0.074Departure Headway (Hd) 5.405 4.557 4.624 5.235Convergence, Y/N Yes Yes Yes YesCap 658 787 773 677Service Time 3.483 2.608 2.677 3.32HCM Lane V/C Ratio 0.146 0.399 0.379 0.075HCM Control Delay 9.4 10.6 10.5 8.7HCM Lane LOS A B B AHCM 95th-tile Q 0.5 1.9 1.8 0.2

HCM 2010 Signalized Intersection Summary3: Broadway & West MacArthur Street/East MacArthur Street 01/24/2018
853 4th Street West Project TIS W-TransAM Existing + Project
Movement EBL EBT EBR WBL WBT WBR NBL NBT NBR SBL SBT SBRLane ConfigurationsTraffic Volume (veh/h) 14 127 169 95 82 65 116 385 78 71 355 22Future Volume (veh/h) 14 127 169 95 82 65 116 385 78 71 355 22Number 7 4 14 3 8 18 5 2 12 1 6 16Initial Q (Qb), veh 0 1 0 0 3 0 0 0 0 0 0 0Ped-Bike Adj(A_pbT) 0.98 0.96 0.98 0.97 1.00 0.97 1.00 0.96Parking Bus, Adj 1.00 1.00 1.00 1.00 1.00 1.00 1.00 1.00 1.00 1.00 1.00 1.00Adj Sat Flow, veh/h/ln 1900 1863 1900 1900 1863 1900 1863 1863 1900 1863 1863 1863Adj Flow Rate, veh/h 17 153 116 114 99 48 140 464 72 86 428 21Adj No. of Lanes 0 1 0 0 1 0 1 2 0 1 2 1Peak Hour Factor 0.83 0.83 0.83 0.83 0.83 0.83 0.83 0.83 0.83 0.83 0.83 0.83Percent Heavy Veh, % 2 2 2 2 2 2 2 2 2 2 2 2Cap, veh/h 61 306 209 216 192 76 188 1315 203 205 1556 670Arrive On Green 0.31 0.31 0.31 0.31 0.31 0.31 0.11 0.43 0.43 0.12 0.44 0.44Sat Flow, veh/h 45 955 682 510 592 248 1774 3059 472 1774 3539 1524Grp Volume(v), veh/h 286 0 0 261 0 0 140 267 269 86 428 21Grp Sat Flow(s),veh/h/ln 1683 0 0 1350 0 0 1774 1770 1761 1774 1770 1524Q Serve(g_s), s 0.0 0.0 0.0 2.4 0.0 0.0 6.2 8.2 8.3 3.7 6.3 0.6Cycle Q Clear(g_c), s 11.3 0.0 0.0 13.7 0.0 0.0 6.2 8.2 8.3 3.7 6.3 0.6Prop In Lane 0.06 0.41 0.44 0.18 1.00 0.27 1.00 1.00Lane Grp Cap(c), veh/h 573 0 0 488 0 0 188 761 757 205 1556 670V/C Ratio(X) 0.50 0.00 0.00 0.54 0.00 0.00 0.75 0.35 0.36 0.42 0.28 0.03Avail Cap(c_a), veh/h 728 0 0 615 0 0 349 762 759 262 1560 671HCM Platoon Ratio 1.00 1.00 1.00 1.00 1.00 1.00 1.00 1.00 1.00 1.00 1.00 1.00Upstream Filter(I) 1.00 0.00 0.00 1.00 0.00 0.00 1.00 1.00 1.00 1.00 1.00 1.00Uniform Delay (d), s/veh 23.2 0.0 0.0 23.9 0.0 0.0 35.3 15.6 15.6 33.5 14.5 13.0Incr Delay (d2), s/veh 0.7 0.0 0.0 0.9 0.0 0.0 5.8 1.3 1.3 1.4 0.4 0.1Initial Q Delay(d3),s/veh 0.0 0.0 0.0 0.6 0.0 0.0 0.0 0.0 0.0 0.0 0.0 0.0%ile BackOfQ(50%),veh/ln 5.6 0.0 0.0 5.6 0.0 0.0 3.3 4.3 4.3 1.9 3.1 0.3LnGrp Delay(d),s/veh 23.9 0.0 0.0 25.4 0.0 0.0 41.1 16.9 16.9 34.8 15.0 13.1LnGrp LOS C C D B B C B BApproach Vol, veh/h 286 261 676 535Approach Delay, s/veh 23.9 25.4 21.9 18.1Approach LOS C C C B
Timer 1 2 3 4 5 6 7 8Assigned Phs 1 2 4 5 6 8Phs Duration (G+Y+Rc), s 12.4 40.0 28.8 11.6 40.8 28.8Change Period (Y+Rc), s 3.0 5.0 3.5 3.0 5.0 3.5Max Green Setting (Gmax), s 12.0 35.0 33.0 16.0 35.0 33.0Max Q Clear Time (g_c+I1), s 5.7 10.3 13.3 8.2 8.3 15.7Green Ext Time (p_c), s 0.1 6.6 1.8 0.2 5.4 1.6
Intersection SummaryHCM 2010 Ctrl Delay 21.6HCM 2010 LOS C

HCM 2010 Signalized Intersection Summary3: Broadway & West MacArthur Street/East MacArthur Street 01/24/2018
853 4th Street West Project TIS W-TransPM Existing + Project
Movement EBL EBT EBR WBL WBT WBR NBL NBT NBR SBL SBT SBRLane ConfigurationsTraffic Volume (veh/h) 21 111 107 62 131 60 118 388 55 43 319 35Future Volume (veh/h) 21 111 107 62 131 60 118 388 55 43 319 35Number 7 4 14 3 8 18 5 2 12 1 6 16Initial Q (Qb), veh 0 1 0 0 1 0 0 1 0 0 0 0Ped-Bike Adj(A_pbT) 1.00 0.98 1.00 0.98 1.00 0.99 1.00 1.00Parking Bus, Adj 1.00 1.00 1.00 1.00 1.00 1.00 1.00 1.00 1.00 1.00 1.00 1.00Adj Sat Flow, veh/h/ln 1900 1863 1900 1900 1863 1900 1863 1863 1900 1863 1863 1863Adj Flow Rate, veh/h 24 125 72 70 147 49 133 436 51 48 358 32Adj No. of Lanes 0 1 0 0 1 0 1 2 0 1 2 1Peak Hour Factor 0.89 0.89 0.89 0.89 0.89 0.89 0.89 0.89 0.89 0.89 0.89 0.89Percent Heavy Veh, % 2 2 2 2 2 2 2 2 2 2 2 2Cap, veh/h 79 241 125 138 233 69 209 1655 192 168 1751 784Arrive On Green 0.22 0.22 0.22 0.22 0.22 0.22 0.12 0.52 0.52 0.10 0.50 0.50Sat Flow, veh/h 101 1065 563 334 1029 308 1774 3193 372 1774 3539 1583Grp Volume(v), veh/h 221 0 0 266 0 0 133 241 246 48 358 32Grp Sat Flow(s),veh/h/ln 1729 0 0 1672 0 0 1774 1770 1795 1774 1770 1583Q Serve(g_s), s 0.0 0.0 0.0 2.0 0.0 0.0 5.0 5.4 5.4 1.8 4.0 0.7Cycle Q Clear(g_c), s 7.9 0.0 0.0 9.9 0.0 0.0 5.0 5.4 5.4 1.8 4.0 0.7Prop In Lane 0.11 0.33 0.26 0.18 1.00 0.21 1.00 1.00Lane Grp Cap(c), veh/h 445 0 0 440 0 0 209 917 930 168 1751 784V/C Ratio(X) 0.50 0.00 0.00 0.60 0.00 0.00 0.64 0.26 0.26 0.28 0.20 0.04Avail Cap(c_a), veh/h 845 0 0 819 0 0 402 918 931 301 1754 785HCM Platoon Ratio 1.00 1.00 1.00 1.00 1.00 1.00 1.00 1.00 1.00 1.00 1.00 1.00Upstream Filter(I) 1.00 0.00 0.00 1.00 0.00 0.00 1.00 1.00 1.00 1.00 1.00 1.00Uniform Delay (d), s/veh 24.4 0.0 0.0 25.1 0.0 0.0 29.8 9.5 9.6 29.8 10.1 9.2Incr Delay (d2), s/veh 0.9 0.0 0.0 1.3 0.0 0.0 3.2 0.7 0.7 0.9 0.3 0.1Initial Q Delay(d3),s/veh 0.1 0.0 0.0 0.1 0.0 0.0 0.0 0.0 0.0 0.0 0.0 0.0%ile BackOfQ(50%),veh/ln 4.0 0.0 0.0 5.0 0.0 0.0 2.7 2.8 2.9 0.9 2.0 0.3LnGrp Delay(d),s/veh 25.3 0.0 0.0 26.5 0.0 0.0 32.9 10.2 10.3 30.7 10.3 9.3LnGrp LOS C C C B B C B AApproach Vol, veh/h 221 266 620 438Approach Delay, s/veh 25.3 26.5 15.1 12.5Approach LOS C C B B
Timer 1 2 3 4 5 6 7 8Assigned Phs 1 2 4 5 6 8Phs Duration (G+Y+Rc), s 9.7 41.6 19.3 11.3 40.0 19.3Change Period (Y+Rc), s 3.0 5.0 3.5 3.0 5.0 3.5Max Green Setting (Gmax), s 12.0 35.0 33.0 16.0 35.0 33.0Max Q Clear Time (g_c+I1), s 3.8 7.4 9.9 7.0 6.0 11.9Green Ext Time (p_c), s 0.0 6.1 1.4 0.2 4.7 1.7
Intersection SummaryHCM 2010 Ctrl Delay 17.8HCM 2010 LOS B

HCM 2010 AWSC1: 5th Street West & West MacArthur Street 06/13/2018
853 4th Street West Project TIS W-TransAM Future + Project
IntersectionIntersection Delay, s/veh 15.5Intersection LOS C
Movement EBL EBT EBR WBL WBT WBR NBL NBT NBR SBL SBT SBRLane ConfigurationsTraffic Vol, veh/h 20 16 11 57 4 148 4 307 89 167 303 15Future Vol, veh/h 20 16 11 57 4 148 4 307 89 167 303 15Peak Hour Factor 0.98 0.98 0.98 0.98 0.98 0.98 0.98 0.98 0.98 0.98 0.98 0.98Heavy Vehicles, % 2 2 2 2 2 2 2 2 2 2 2 2Mvmt Flow 20 16 11 58 4 151 4 313 91 170 309 15Number of Lanes 0 1 0 0 1 1 1 1 0 1 1 0
Approach EB WB NB SBOpposing Approach WB EB SB NBOpposing Lanes 2 1 2 2Conflicting Approach Left SB NB EB WBConflicting Lanes Left 2 2 1 2Conflicting Approach Right NB SB WB EBConflicting Lanes Right 2 2 2 1HCM Control Delay 11.3 11.3 19.7 14.2HCM LOS B B C B
Lane NBLn1 NBLn2 EBLn1 WBLn1 WBLn2 SBLn1 SBLn2Vol Left, % 100% 0% 43% 93% 0% 100% 0%Vol Thru, % 0% 78% 34% 7% 0% 0% 95%Vol Right, % 0% 22% 23% 0% 100% 0% 5%Sign Control Stop Stop Stop Stop Stop Stop StopTraffic Vol by Lane 4 396 47 61 148 167 318LT Vol 4 0 20 57 0 167 0Through Vol 0 307 16 4 0 0 303RT Vol 0 89 11 0 148 0 15Lane Flow Rate 4 404 48 62 151 170 324Geometry Grp 7 7 6 7 7 7 7Degree of Util (X) 0.007 0.666 0.098 0.129 0.263 0.306 0.534Departure Headway (Hd) 6.596 5.929 7.373 7.469 6.28 6.464 5.923Convergence, Y/N Yes Yes Yes Yes Yes Yes YesCap 541 606 483 479 569 556 607Service Time 4.35 3.683 5.461 5.237 4.046 4.216 3.675HCM Lane V/C Ratio 0.007 0.667 0.099 0.129 0.265 0.306 0.534HCM Control Delay 9.4 19.8 11.3 11.4 11.3 12.1 15.3HCM Lane LOS A C B B B B CHCM 95th-tile Q 0 5 0.3 0.4 1 1.3 3.2
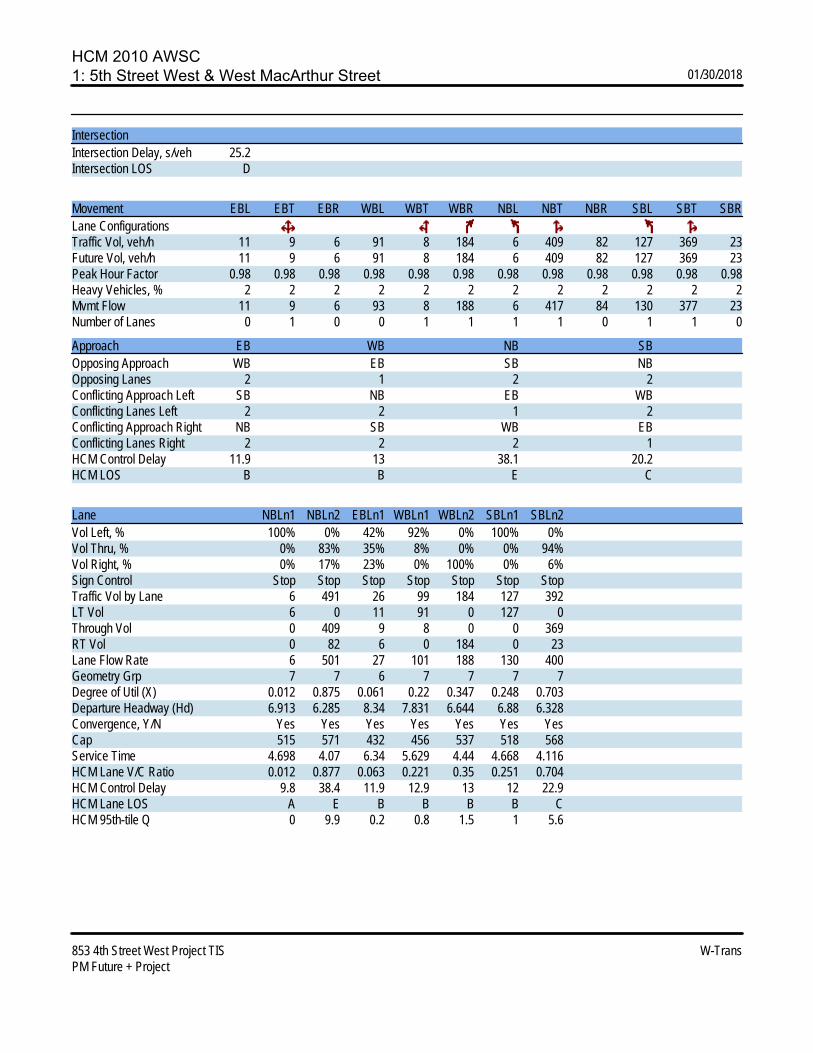
HCM 2010 AWSC1: 5th Street West & West MacArthur Street 01/30/2018
853 4th Street West Project TIS W-TransPM Future + Project
IntersectionIntersection Delay, s/veh 25.2Intersection LOS D
Movement EBL EBT EBR WBL WBT WBR NBL NBT NBR SBL SBT SBRLane ConfigurationsTraffic Vol, veh/h 11 9 6 91 8 184 6 409 82 127 369 23Future Vol, veh/h 11 9 6 91 8 184 6 409 82 127 369 23Peak Hour Factor 0.98 0.98 0.98 0.98 0.98 0.98 0.98 0.98 0.98 0.98 0.98 0.98Heavy Vehicles, % 2 2 2 2 2 2 2 2 2 2 2 2Mvmt Flow 11 9 6 93 8 188 6 417 84 130 377 23Number of Lanes 0 1 0 0 1 1 1 1 0 1 1 0
Approach EB WB NB SBOpposing Approach WB EB SB NBOpposing Lanes 2 1 2 2Conflicting Approach Left SB NB EB WBConflicting Lanes Left 2 2 1 2Conflicting Approach Right NB SB WB EBConflicting Lanes Right 2 2 2 1HCM Control Delay 11.9 13 38.1 20.2HCM LOS B B E C
Lane NBLn1 NBLn2 EBLn1 WBLn1 WBLn2 SBLn1 SBLn2Vol Left, % 100% 0% 42% 92% 0% 100% 0%Vol Thru, % 0% 83% 35% 8% 0% 0% 94%Vol Right, % 0% 17% 23% 0% 100% 0% 6%Sign Control Stop Stop Stop Stop Stop Stop StopTraffic Vol by Lane 6 491 26 99 184 127 392LT Vol 6 0 11 91 0 127 0Through Vol 0 409 9 8 0 0 369RT Vol 0 82 6 0 184 0 23Lane Flow Rate 6 501 27 101 188 130 400Geometry Grp 7 7 6 7 7 7 7Degree of Util (X) 0.012 0.875 0.061 0.22 0.347 0.248 0.703Departure Headway (Hd) 6.913 6.285 8.34 7.831 6.644 6.88 6.328Convergence, Y/N Yes Yes Yes Yes Yes Yes YesCap 515 571 432 456 537 518 568Service Time 4.698 4.07 6.34 5.629 4.44 4.668 4.116HCM Lane V/C Ratio 0.012 0.877 0.063 0.221 0.35 0.251 0.704HCM Control Delay 9.8 38.4 11.9 12.9 13 12 22.9HCM Lane LOS A E B B B B CHCM 95th-tile Q 0 9.9 0.2 0.8 1.5 1 5.6

HCM 2010 AWSC2: 1st Street West & West MacArthur Street 01/30/2018
853 4th Street West Project TIS W-TransAM Future + Project
IntersectionIntersection Delay, s/veh 27.1Intersection LOS D
Movement EBL EBT EBR WBL WBT WBR NBL NBT NBR SBL SBT SBRLane ConfigurationsTraffic Vol, veh/h 16 334 120 24 240 24 58 44 40 35 54 10Future Vol, veh/h 16 334 120 24 240 24 58 44 40 35 54 10Peak Hour Factor 0.80 0.80 0.80 0.80 0.80 0.80 0.80 0.80 0.80 0.80 0.80 0.80Heavy Vehicles, % 2 2 2 2 2 2 2 2 2 2 2 2Mvmt Flow 20 418 150 30 300 30 73 55 50 44 68 13Number of Lanes 0 1 0 0 1 0 0 1 0 0 1 0
Approach EB WB NB SBOpposing Approach WB EB SB NBOpposing Lanes 1 1 1 1Conflicting Approach Left SB NB EB WBConflicting Lanes Left 1 1 1 1Conflicting Approach Right NB SB WB EBConflicting Lanes Right 1 1 1 1HCM Control Delay 40 17.7 13.4 12.5HCM LOS E C B B
Lane NBLn1 EBLn1 WBLn1 SBLn1Vol Left, % 41% 3% 8% 35%Vol Thru, % 31% 71% 83% 55%Vol Right, % 28% 26% 8% 10%Sign Control Stop Stop Stop StopTraffic Vol by Lane 142 470 288 99LT Vol 58 16 24 35Through Vol 44 334 240 54RT Vol 40 120 24 10Lane Flow Rate 178 588 360 124Geometry Grp 1 1 1 1Degree of Util (X) 0.338 0.909 0.599 0.245Departure Headway (Hd) 6.85 5.57 5.992 7.13Convergence, Y/N Yes Yes Yes YesCap 524 658 601 501Service Time 4.918 3.57 4.047 5.205HCM Lane V/C Ratio 0.34 0.894 0.599 0.248HCM Control Delay 13.4 40 17.7 12.5HCM Lane LOS B E C BHCM 95th-tile Q 1.5 11.6 4 1

HCM 2010 AWSC2: 1st Street West & West MacArthur Street 01/30/2018
853 4th Street West Project TIS W-TransPM Future + Project
IntersectionIntersection Delay, s/veh 12.1Intersection LOS B
Movement EBL EBT EBR WBL WBT WBR NBL NBT NBR SBL SBT SBRLane ConfigurationsTraffic Vol, veh/h 22 285 69 11 307 33 57 34 12 12 19 23Future Vol, veh/h 22 285 69 11 307 33 57 34 12 12 19 23Peak Hour Factor 0.96 0.96 0.96 0.96 0.96 0.96 0.96 0.96 0.96 0.96 0.96 0.96Heavy Vehicles, % 2 2 2 2 2 2 2 2 2 2 2 2Mvmt Flow 23 297 72 11 320 34 59 35 13 13 20 24Number of Lanes 0 1 0 0 1 0 0 1 0 0 1 0
Approach EB WB NB SBOpposing Approach WB EB SB NBOpposing Lanes 1 1 1 1Conflicting Approach Left SB NB EB WBConflicting Lanes Left 1 1 1 1Conflicting Approach Right NB SB WB EBConflicting Lanes Right 1 1 1 1HCM Control Delay 12.8 12.4 10.2 9.3HCM LOS B B B A
Lane NBLn1 EBLn1 WBLn1 SBLn1Vol Left, % 55% 6% 3% 22%Vol Thru, % 33% 76% 87% 35%Vol Right, % 12% 18% 9% 43%Sign Control Stop Stop Stop StopTraffic Vol by Lane 103 376 351 54LT Vol 57 22 11 12Through Vol 34 285 307 19RT Vol 12 69 33 23Lane Flow Rate 107 392 366 56Geometry Grp 1 1 1 1Degree of Util (X) 0.176 0.514 0.487 0.09Departure Headway (Hd) 5.898 4.72 4.792 5.768Convergence, Y/N Yes Yes Yes YesCap 612 752 742 624Service Time 3.901 2.815 2.89 3.774HCM Lane V/C Ratio 0.175 0.521 0.493 0.09HCM Control Delay 10.2 12.8 12.4 9.3HCM Lane LOS B B B AHCM 95th-tile Q 0.6 3 2.7 0.3

HCM 2010 Signalized Intersection Summary3: Broadway & West MacArthur Street/East MacArthur Street 01/30/2018
853 4th Street West Project TIS W-TransAM Future + Project
Movement EBL EBT EBR WBL WBT WBR NBL NBT NBR SBL SBT SBRLane ConfigurationsTraffic Volume (veh/h) 21 194 259 146 126 100 178 593 120 109 547 34Future Volume (veh/h) 21 194 259 146 126 100 178 593 120 109 547 34Number 7 4 14 3 8 18 5 2 12 1 6 16Initial Q (Qb), veh 0 1 0 0 3 0 0 0 0 0 0 0Ped-Bike Adj(A_pbT) 0.99 0.96 0.99 0.97 1.00 0.97 1.00 0.96Parking Bus, Adj 1.00 1.00 1.00 1.00 1.00 1.00 1.00 1.00 1.00 1.00 1.00 1.00Adj Sat Flow, veh/h/ln 1900 1863 1900 1900 1863 1900 1863 1863 1900 1863 1863 1863Adj Flow Rate, veh/h 23 213 205 160 138 83 196 652 112 120 601 32Adj No. of Lanes 0 1 0 0 1 0 1 2 0 1 2 1Peak Hour Factor 0.91 0.91 0.91 0.91 0.91 0.91 0.91 0.91 0.91 0.91 0.91 0.91Percent Heavy Veh, % 2 2 2 2 2 2 2 2 2 2 2 2Cap, veh/h 58 332 274 179 166 76 233 1199 206 203 1354 581Arrive On Green 0.36 0.36 0.36 0.36 0.36 0.36 0.13 0.40 0.40 0.11 0.38 0.38Sat Flow, veh/h 47 873 800 378 416 221 1774 3005 515 1774 3539 1519Grp Volume(v), veh/h 441 0 0 381 0 0 196 383 381 120 601 32Grp Sat Flow(s),veh/h/ln 1720 0 0 1015 0 0 1774 1770 1751 1774 1770 1519Q Serve(g_s), s 0.0 0.0 0.0 12.5 0.0 0.0 9.9 15.2 15.3 5.9 11.6 1.2Cycle Q Clear(g_c), s 20.5 0.0 0.0 33.0 0.0 0.0 9.9 15.2 15.3 5.9 11.6 1.2Prop In Lane 0.05 0.46 0.42 0.22 1.00 0.29 1.00 1.00Lane Grp Cap(c), veh/h 662 0 0 429 0 0 233 706 699 203 1354 581V/C Ratio(X) 0.67 0.00 0.00 0.89 0.00 0.00 0.84 0.54 0.54 0.59 0.44 0.06Avail Cap(c_a), veh/h 662 0 0 422 0 0 310 706 699 233 1354 581HCM Platoon Ratio 1.00 1.00 1.00 1.00 1.00 1.00 1.00 1.00 1.00 1.00 1.00 1.00Upstream Filter(I) 1.00 0.00 0.00 1.00 0.00 0.00 1.00 1.00 1.00 1.00 1.00 1.00Uniform Delay (d), s/veh 25.4 0.0 0.0 30.8 0.0 0.0 38.8 21.1 21.1 38.5 21.0 17.8Incr Delay (d2), s/veh 2.5 0.0 0.0 20.0 0.0 0.0 14.6 3.0 3.0 3.0 1.1 0.2Initial Q Delay(d3),s/veh 0.0 0.0 0.0 3.1 0.0 0.0 0.0 0.0 0.0 0.0 0.0 0.0%ile BackOfQ(50%),veh/ln 10.2 0.0 0.0 12.6 0.0 0.0 5.8 7.9 7.9 3.0 5.8 0.5LnGrp Delay(d),s/veh 28.0 0.0 0.0 54.0 0.0 0.0 53.4 24.1 24.1 41.5 22.1 18.0LnGrp LOS C D D C C D C BApproach Vol, veh/h 441 381 960 753Approach Delay, s/veh 28.0 54.0 30.1 25.0Approach LOS C D C C
Timer 1 2 3 4 5 6 7 8Assigned Phs 1 2 4 5 6 8Phs Duration (G+Y+Rc), s 13.5 41.5 36.5 15.0 40.0 36.5Change Period (Y+Rc), s 3.0 5.0 3.5 3.0 5.0 3.5Max Green Setting (Gmax), s 12.0 35.0 33.0 16.0 35.0 33.0Max Q Clear Time (g_c+I1), s 7.9 17.3 22.5 11.9 13.6 35.0Green Ext Time (p_c), s 0.1 8.2 2.3 0.2 7.2 0.0
Intersection SummaryHCM 2010 Ctrl Delay 31.8HCM 2010 LOS C

HCM 2010 Signalized Intersection Summary3: Broadway & West MacArthur Street/East MacArthur Street 01/30/2018
853 4th Street West Project TIS W-TransPM Future + Project
Movement EBL EBT EBR WBL WBT WBR NBL NBT NBR SBL SBT SBRLane ConfigurationsTraffic Volume (veh/h) 27 149 149 76 165 115 117 618 88 103 570 47Future Volume (veh/h) 27 149 149 76 165 115 117 618 88 103 570 47Number 7 4 14 3 8 18 5 2 12 1 6 16Initial Q (Qb), veh 0 1 0 0 1 0 0 1 0 0 0 0Ped-Bike Adj(A_pbT) 1.00 0.98 1.00 0.98 1.00 0.99 1.00 1.00Parking Bus, Adj 1.00 1.00 1.00 1.00 1.00 1.00 1.00 1.00 1.00 1.00 1.00 1.00Adj Sat Flow, veh/h/ln 1900 1863 1900 1900 1863 1900 1863 1863 1900 1863 1863 1863Adj Flow Rate, veh/h 30 164 117 84 181 108 129 679 86 113 626 45Adj No. of Lanes 0 1 0 0 1 0 1 2 0 1 2 1Peak Hour Factor 0.91 0.91 0.91 0.91 0.91 0.91 0.91 0.91 0.91 0.91 0.91 0.91Percent Heavy Veh, % 2 2 2 2 2 2 2 2 2 2 2 2Cap, veh/h 76 285 184 134 245 130 189 1387 175 225 1624 726Arrive On Green 0.29 0.29 0.29 0.29 0.29 0.29 0.11 0.44 0.44 0.13 0.46 0.46Sat Flow, veh/h 93 970 641 275 836 453 1774 3159 400 1774 3539 1583Grp Volume(v), veh/h 311 0 0 373 0 0 129 380 385 113 626 45Grp Sat Flow(s),veh/h/ln 1703 0 0 1564 0 0 1774 1770 1789 1774 1770 1583Q Serve(g_s), s 0.0 0.0 0.0 5.2 0.0 0.0 5.6 12.2 12.3 4.7 9.3 1.3Cycle Q Clear(g_c), s 12.4 0.0 0.0 17.6 0.0 0.0 5.6 12.2 12.3 4.7 9.3 1.3Prop In Lane 0.10 0.38 0.23 0.29 1.00 0.22 1.00 1.00Lane Grp Cap(c), veh/h 545 0 0 511 0 0 189 776 785 225 1624 726V/C Ratio(X) 0.57 0.00 0.00 0.73 0.00 0.00 0.68 0.49 0.49 0.50 0.39 0.06Avail Cap(c_a), veh/h 745 0 0 698 0 0 356 777 785 267 1625 727HCM Platoon Ratio 1.00 1.00 1.00 1.00 1.00 1.00 1.00 1.00 1.00 1.00 1.00 1.00Upstream Filter(I) 1.00 0.00 0.00 1.00 0.00 0.00 1.00 1.00 1.00 1.00 1.00 1.00Uniform Delay (d), s/veh 24.5 0.0 0.0 26.1 0.0 0.0 34.4 16.1 16.1 32.5 14.2 12.0Incr Delay (d2), s/veh 0.9 0.0 0.0 2.5 0.0 0.0 4.3 2.2 2.2 1.7 0.7 0.2Initial Q Delay(d3),s/veh 0.1 0.0 0.0 0.1 0.0 0.0 0.0 0.0 0.0 0.0 0.0 0.0%ile BackOfQ(50%),veh/ln 6.1 0.0 0.0 8.1 0.0 0.0 3.0 6.5 6.5 2.4 4.7 0.6LnGrp Delay(d),s/veh 25.5 0.0 0.0 28.8 0.0 0.0 38.7 18.3 18.3 34.3 14.9 12.2LnGrp LOS C C D B B C B BApproach Vol, veh/h 311 373 894 784Approach Delay, s/veh 25.5 28.8 21.2 17.5Approach LOS C C C B
Timer 1 2 3 4 5 6 7 8Assigned Phs 1 2 4 5 6 8Phs Duration (G+Y+Rc), s 13.1 40.0 26.6 11.5 41.6 26.6Change Period (Y+Rc), s 3.0 5.0 3.5 3.0 5.0 3.5Max Green Setting (Gmax), s 12.0 35.0 33.0 16.0 35.0 33.0Max Q Clear Time (g_c+I1), s 6.7 14.3 14.4 7.6 11.3 19.6Green Ext Time (p_c), s 0.1 9.0 1.9 0.2 8.0 2.1
Intersection SummaryHCM 2010 Ctrl Delay 21.8HCM 2010 LOS C

C Traffic Impact Study for the 853 Fourth Street West Project June 2018
Appendix C
Signal Warrant and Proportional Share


Warrant 3: Peak-Hour Volumes and Delay
Street Name
Direction
Number of Lanes
Approach Speed
Population less than 10,000? NoDate of Count:
Scenario:
Warrant 3 Met?: Met when either Condition A or B is met Yes
Condition A: Met when conditions A1, A2, and A3 are met Not MetCondition A1 Not Met
1.08Condition A2 Met
267 vphCondition A3 Met
1509 vphCondition B Met
General Plan Projections
West MacArthur Street
2 130
The total delay experienced by traffic on one minor street approach (one direction only) controlled by a STOP sign equals or exceeds four vehicle-hours for a one lane approach, or five vehicle-hours for a two-lane approach
The volume on the same minor street approach (one direction only) equals or exceeds 100 vph for one moving lane of traffic of 150 vph for two moving lanes
The total entering volume serviced during the hour equals or exceeds 800 vph for intersections with four or more appraches or 650 vph for intersections with three approaches
The plotted point falls above the curve
Minor Approach Delay: vehicle-hours
Minor Approach Volume:
Total Entering Volume:
Fifth Street West
AM Future Volumes
853 Fourth Street West ProjectProject Name:
Intersection: 1City of SonomaFifth Street West & West MacArthur Street
Major Street Minor Street
25
N-S E-W
0
100
200
300
400
500
600
700
0 500 1000 1500 2000
MIN
OR
ST
RE
ET―
HIG
HE
R V
OL
UM
E
AP
PR
OA
CH
(V
PH
)
MAJOR STREET―TOTAL OF BOTH APPROACHES
VEHICLES PER HOUR (VPH)
Warrant 3, Peak Hour
2 OR MORE LANES & 2 OR MORE LANES
2 OR MORE LANES & 1 LANE
1 LANE & 1 LANE
1/30/2018 Signal Warrant Analysis

PM PMExisting 1055
Project Trips (T) 8 Future Year 1509
Description of Project Improvement:
Calculation of Project Share
P = T / (TB - TE)where:P = Equitable ShareT = Project trips during the affected peak hourTB = Build-out volumesTE = Existing volumes
T 8TB 1509TE 1055P 1.8
Total Estimated Cost of Improvements $500,000
Equitable Share Contribution $9,000
Equitable Share (per Caltrans "Guide for the Preparation of Traffic Impact Studies")
Equitable Share Calculations853 Fourth Street East Project
Total Volume Entering the Intersection of
Fifth Street West and West MacArthur Stree
Installation of a traffic signal.

D Traffic Impact Study for the 853 Fourth Street West Project June 2018
Appendix D
Turn Lane Warrant Calculations

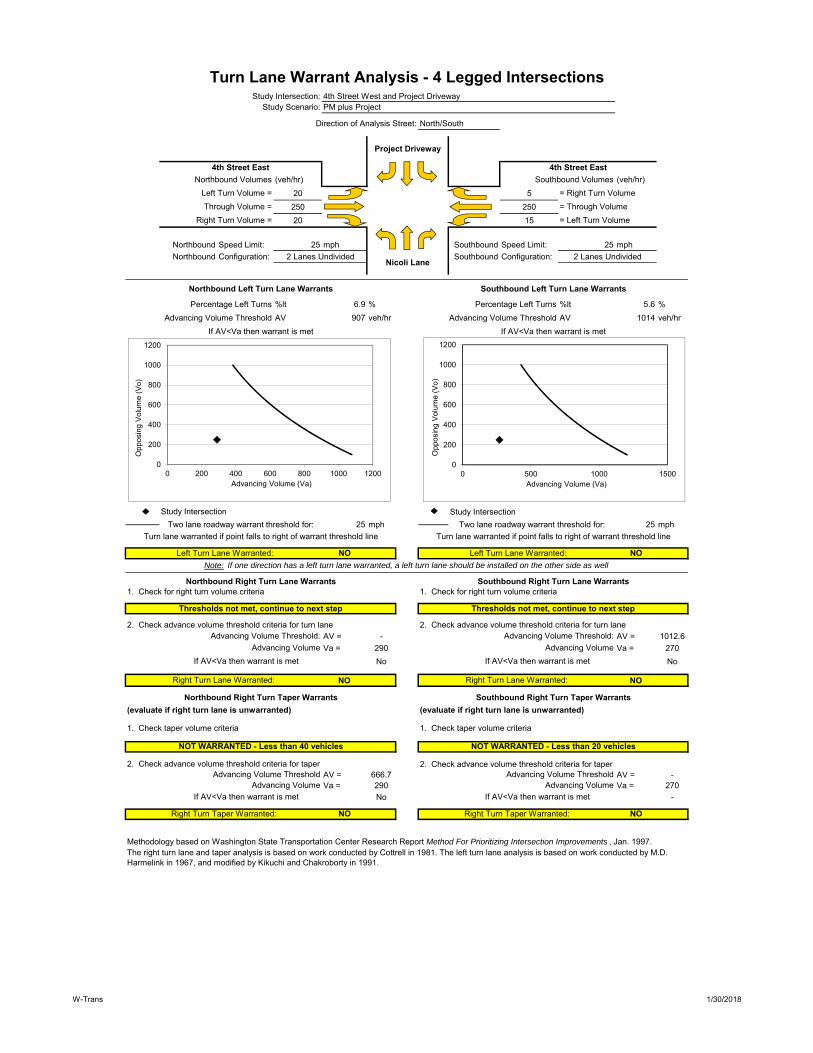
(veh/hr) (veh/hr)20 5250 25020 15
Speed Limit: 25 mph Southbound Speed Limit: 25 mphConfiguration: Southbound Configuration:
%lt 6.9 % %lt 5.6 %AV 907 veh/hr AV 1014 veh/hr
Study Intersection
NO NO
1. Check for right turn volume criteria 1. Check for right turn volume criteria
AV = - AV = 1012.6Va = 290 Va = 270
No No
NO NO
1. Check taper volume criteria 1. Check taper volume criteria
2. Check advance volume threshold criteria for taperAV = 666.7 AV = -Va = 290 Va = 270
No -
NO NO
Turn Lane Warrant Analysis - 4 Legged Intersections
Percentage Left Turns
If AV<Va then warrant is met
The right turn lane and taper analysis is based on work conducted by Cottrell in 1981. The left turn lane analysis is based on work conducted by M.D. Harmelink in 1967, and modified by Kikuchi and Chakroborty in 1991.
Right Turn Taper Warranted:
Advancing Volume Threshold
NOT WARRANTED - Less than 40 vehicles
Right Turn Taper Warranted:
Through Volume =Right Turn Volume =
Study Intersection
Left Turn Lane Warranted:
Turn lane warranted if point falls to right of warrant threshold line
Thresholds not met, continue to next step Thresholds not met, continue to next step
If AV<Va then warrant is met
Advancing Volume Threshold:
Right Turn Lane Warranted:
If AV<Va then warrant is met
Advancing Volume Threshold:
If AV<Va then warrant is metAdvancing Volume
Advancing Volume
(evaluate if right turn lane is unwarranted)
NOT WARRANTED - Less than 20 vehicles
Advancing VolumeIf AV<Va then warrant is met
Advancing Volume Threshold
Southbound Right Turn Taper WarrantsNorthbound Right Turn Taper Warrants
Advancing Volume
2. Check advance volume threshold criteria for taper
Right Turn Lane Warranted:
Methodology based on Washington State Transportation Center Research Report Method For Prioritizing Intersection Improvements , Jan. 1997.
(evaluate if right turn lane is unwarranted)
Direction of Analysis Street: North/South
Study Intersection: 4th Street West and Project DrivewayStudy Scenario:
Advancing Volume Threshold
mph
2 Lanes Undivided
PM plus Project
Two lane roadway warrant threshold for: 25
Advancing Volume ThresholdIf AV<Va then warrant is met
Southbound Left Turn Lane WarrantsNorthbound Left Turn Lane Warrants
Project Driveway
Left Turn Volume =Northbound Volumes
4th Street East
Northbound
Nicoli LaneNorthbound
= Through Volume
4th Street East
Southbound Volumes= Right Turn Volume
Turn lane warranted if point falls to right of warrant threshold linemph
= Left Turn Volume
2 Lanes Undivided
Percentage Left Turns
Two lane roadway warrant threshold for: 25
2. Check advance volume threshold criteria for turn lane 2. Check advance volume threshold criteria for turn lane
Left Turn Lane Warranted:
Northbound Right Turn Lane Warrants Southbound Right Turn Lane Warrants
Note: If one direction has a left turn lane warranted, a left turn lane should be installed on the other side as well
0
200
400
600
800
1000
1200
0 200 400 600 800 1000 1200
Opp
osin
g Vo
lum
e (V
o)
Advancing Volume (Va)
0
200
400
600
800
1000
1200
0 500 1000 1500
Opp
osin
g Vo
lum
e (V
o)
Advancing Volume (Va)
W-Trans 1/30/2018