trading range intact
TRANSCRIPT

8/16/2019 Trading Range Intact
http://slidepdf.com/reader/full/trading-range-intact 1/8

8/16/2019 Trading Range Intact
http://slidepdf.com/reader/full/trading-range-intact 2/8
Investment Strategy Outlook
The day-to-day movements in the stock
market can amount to little more than
noise -- noise that should be actively
and intentionally drowned out. That
seems to have been especially true over
the past year-plus. The S&P 500
currently trades in close proximity to
where it began 2016 and where it began
2015. The wide range on the S&P 500
that we have seen in 2016 (between
1800 and 2120) has not covered any
ground not seen over the prior year and
a half. More recently, the S&P 500 has
re-settled into a narrower trading range
(support near 2040 and resistance near
2100) that was prominent in the first half
of 2015 and also re-emerged in the
fourth quarter of last year. In other
words, the S&P 500 has gone nowhere,but it has done so quickly.
Fed policy is neutral. Even if the 25
basis point rate hike from December is
followed by two more rate hikes this
year (which is the official expectation of
the Fed, but not the market), it would
be hard to argue that actual monetary
policy has tightened significantly or is
poised to have an undue negative
influence on stocks or bonds.
However, the disconnect between
market expectations and
prospective Fed actions does raise
risks for both stocks and bonds.
Fed officials have become more vocal
in expressing their view that the marketis underestimating the likelihood of
future rate hikes. Bond yields have
continued to drift lower and optimism in
bonds (which has produced higher
prices and as a result lower yields) has
reached levels not seen since 2012.
Source: Ned Davis Research
Source: Stock Charts
8/16/2019 Trading Range Intact
http://slidepdf.com/reader/full/trading-range-intact 3/8
Investment Strategy Outlook
Robert W. Baird & Co. Page 3 of 8
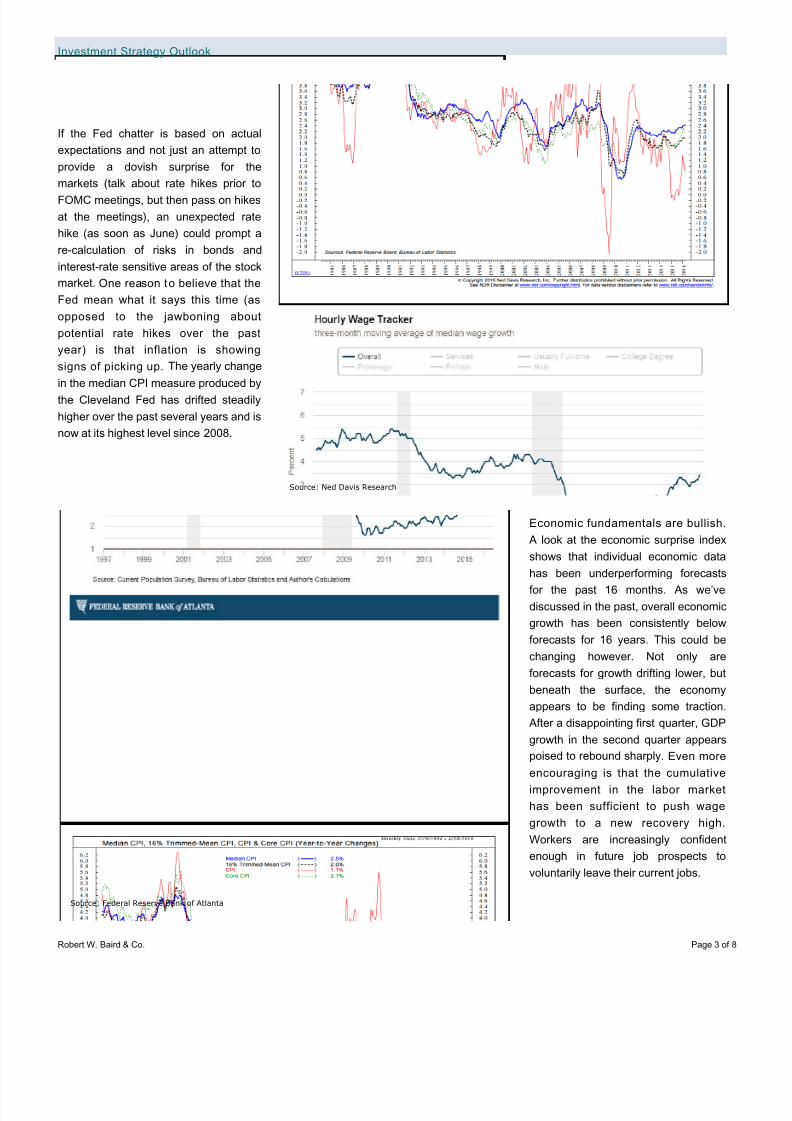
If the Fed chatter is based on actual
expectations and not just an attempt to
provide a dovish surprise for the
markets (talk about rate hikes prior to
FOMC meetings, but then pass on hikes
at the meetings), an unexpected rate
hike (as soon as June) could prompt a
re-calculation of risks in bonds and
interest-rate sensitive areas of the stock
market. One reason to believe that the
Fed mean what it says this time (as
opposed to the jawboning about
potential rate hikes over the past
year) is that inflation is showing
signs of picking up. The yearly change
in the median CPI measure produced bythe Cleveland Fed has drifted steadily
higher over the past several years and is
now at its highest level since 2008.
Economic fundamentals are bullish.
A look at the economic surprise index
shows that individual economic data
has been underperforming forecastsfor the past 16 months. As we’ve
discussed in the past, overall economic
growth has been consistently below
forecasts for 16 years. This could be
changing however. Not only are
forecasts for growth drifting lower, but
beneath the surface, the economy
appears to be finding some traction.
After a disappointing first quarter, GDP
growth in the second quarter appears
poised to rebound sharply. Even more
encouraging is that the cumulative
improvement in the labor market
has been sufficient to push wage
growth to a new recovery high.
Workers are increasingly confident
enough in future job prospects to
voluntarily leave their current jobs.
Source: Federal Reserve Bank of Atlanta
Source: Ned Davis Research

8/16/2019 Trading Range Intact
http://slidepdf.com/reader/full/trading-range-intact 4/8
Investment Strategy Outlook
Robert W. Baird & Co. Page 4 of 8
Valuations remain bearish. In time,
Keynes is right -- the market can stay
irrational longer than you can stay
solvent. But over time, elevated
valuations have tended to be followed
by periods of sub-par returns. Applying
this to the current case, there is little
evidence that the currently extended
valuations will prompt a price correction
(although the risk is certainly there). A
more likely scenario is that stocks
will struggle to make meaningful
progress to the upside without strong
evidence that fundamentals are
improving. Currency-related earnings
tailwinds would be helpful, but what isreally needed is a sustained up-tick in
top-line growth.
Sentiment is neutral. The early
optimism that accompanied the March
rally in stocks has faded. A big concern
for us was that the rally in stocks would
produce excessive optimism. To some
extent, the opposite has happened.
Stocks have been relatively resilient
in the face of waning optimism (on
the sentiment surveys) and
persistent equity fund outflows.
Fund flows are not just reflecting a
secular shift from mutual funds to ETFs
but are showing a net move away from
equities. While some of the shorter-term sentiment indicators show
excessive pessimism, the message
from the more intermediate-term
measures (including the NAAIM
Exposure Index) is that optimism has
faded but sentiment is still neutral.
Source: Ned Davis Research

8/16/2019 Trading Range Intact
http://slidepdf.com/reader/full/trading-range-intact 5/8
Investment Strategy Outlook
Robert W. Baird & Co. Page 5 of 8
Seasonal patterns and trends are
neutral. After the experience of 2015,
the "Sell in May" chorus has been loud
this year (perhaps contributing to the
fading in investor optimism discussed
above). History shows that this seasonalpattern tends not to works as well in
Presidential Election years. The noise
and uncertainty associated with political
campaigns may overwhelm other
seasonal impacts. While historically the
stock market does better in years when
the incumbent party wins (as shown in
the chart), the nature of the victory also
matters. Close elections tend to mean
more uncertainty and that is a negative
for stocks. Landslides (by ether party)
can be anticipated earlier and selling
gives way to buying well in advance of
the actual election. While we continue
to expect election-related noise to
add to stock market volatility, this is
likely mostly noise and seasonal
patterns are neutral.
The tape (breadth) is still neutral.
Improving breadth has marked the rally
off of the early 2016 lows as different
from the rallies seen over the pastseveral years (in particular, the rally off
of the Q3 2015 lows). Whether
looking from the perspective of
individual stocks, industry groups
or sectors, the participation in this
rally has been broad and
encouraging. Sector-level price,
momentum and breadth trends were
better at the early 2016 lows than the
late 2015 lows (a positive breadth
divergence) and have improved ahead
of the S&P 500 for most of the ensuing
rally. While breadth has been better,
we have not yet seen sufficient
strength to prompt an upgrade in this
indicator. That could come on an
upside breakout or if breadth shows
better resiliency than price in the event
of a pullback.
Source: Ned Davis Research

8/16/2019 Trading Range Intact
http://slidepdf.com/reader/full/trading-range-intact 6/8
Investment Strategy Outlook
Robert W. Baird & Co. Page 6 of 8
Despite the overall neutral message
from the weight of the evidence, there
are still relative opportunities for
tactical investors. As mentioned at the
outset, small-caps and international
stocks have struggled, losing groundwhile the S&P 500 has marked time. We
continue to see relative leadership from
U.S. large-cap stocks (reflecting the
improving trends for the average stock,
an equal-weight approach may be more
appropriate than a cap-weighted
approach).
Equities overall have seen outflows,
but defensive and yield-generating
areas of the market continue to look
crowded. If bond yields start to movehigher, sentiment in these areas could
shift quickly. We have already seen
hints of that, while bond yields have
hardly budged.
Given the prospect of upward pressure
in bond yields and volatility in stocks
(and in light of the neutral message
from the weight of the evidence),
holding elevated levels of cash may
continue to be appropriate.
From a sector allocation perspective,
defensive groups have struggled to
hold onto their leadership positions.
Cyclical areas are gaining strength.
Materials and Energy are in the sector
leadership group and have relativestrength trends that are moving up.
More than anything, the sector
rankings have shown elevated rotation
and volatility as a new set of leaders
emerges and previous leaders have
faded.Source: Baird. Ranking of 1 indicates best relative strength; ranking of 10 indicates worst relative
strength.
Source: Stock Charts

8/16/2019 Trading Range Intact
http://slidepdf.com/reader/full/trading-range-intact 7/8
Investment Strategy Outlook
Robert W. Baird & Co. Page 7 of 8
B AIRD STRATEGIC ASSET ALLOCATION MODEL PORTFOLIOS
Baird offers six strategic asset allocation model portfolios for consideration (see table below), four of which have a mix of equity and
fixed income. An individual’s personal situation, preferences and objectives may suggest an allocation more suitable than those shown
below. Please consult a Baird Financial Advisor in determining an asset allocation that will meet your needs.
Model PortfolioMix: Stocks /
(Bonds + Cash)Risk Tolerance Strategic Asset Allocation Model Summary
All Growth 100 / 0 Well above averageEmphasis on providing aggressive growth of capital with highfluctuations in the annual returns and overall market value of theportfolio.
Capital Growth 80 / 20 Above averageEmphasis on providing growth of capital with moderately highfluctuations in the annual returns and overall market value of theportfolio.
Growth withIncome
60 / 40 AverageEmphasis on providing moderate growth of capital and somecurrent income with moderate fluctuations in annual returns andoverall market value of the portfolio.
Income withGrowth
40 / 60 Below averageEmphasis on providing high current income and some growth ofcapital with moderate fluctuations in the annual returns and
overall market value of the portfolio.Conservative
Income20 / 80 Well below average
Emphasis on providing high current income with relatively smallfluctuations in the annual returns and overall market value of theportfolio.
CapitalPreservation
0 / 100 Well below averageEmphasis on preserving capital while generating current incomewith relatively small fluctuations in the annual returns andoverall market value of the portfolio.
Baird’s Investment Policy Committee offers a view of potential tactical allocations among equity, fixed income and cash, based upon a
consideration of U.S. Federal Reserve policy, underlying U.S. economic fundamentals, investor sentiment, valuations, seasonal trends
and broad market trends. As conditions change, the Investment Policy Committee adjusts the weightings. The table below shows both
the normal range and current recommended allocation to stocks, bonds and cash. Please consult a Baird Financial Advisor indetermining if an adjustment to your strategic asset allocation is appropriate in your situation.
Asset Class /Model Portfolio
All Growth Capital GrowthGrowth with
IncomeIncome with
GrowthConservative
IncomeCapital
Preservation
Equities:
Suggested allocation 95% 75% 55% 35% 15% 0%
Normal range 90 – 100% 70 - 90% 50 - 70% 30 - 50% 10 - 30% 0%
Fixed Income:
Suggested allocation 0% 15% 35% 45% 50% 60%
Normal range 0 - 0% 10 - 30% 30 - 50% 40 - 60% 45 - 65% 55 – 85%
Cash:Suggested allocation 5% 10% 10% 20% 35% 40%
Normal range 0 - 10% 0 - 20% 0 - 20% 10 - 30% 25 - 45% 15 - 45%

8/16/2019 Trading Range Intact
http://slidepdf.com/reader/full/trading-range-intact 8/8
Investment Strategy Outlook
Robert W. Baird & Co. Page 8 of 8
ROBERT W. B AIRD’S INVESTMENT POLICY COMMITTEE
Bruce A. Bittles B. Craig Elder Jay E. Schwister, CFAManaging Director Director Managing DirectorChief Investment Strategist PWM – Fixed Income Analyst Baird Advisors, Sr. PM
Kathy Blake Carey, CFA Jon A. Langenfeld, CFA Timothy M. Steffen, CPA, CFPDirector Managing Director Director
Associate Director of Asset Mgr Research Head of Global Equities Director of Financial Planning
Patrick J. Cronin , CFA, CAIA Warren D. Pierson, CFA Laura K. Thurow, CFADirector Managing Director Managing DirectorInstitutional Consulting Baird Advisors, Sr. PM Co-Director of PWM Research, Prod &
William A. Delwiche, CMT, CFADirector Investment Strategist
Appendix – Important Disclosures and Analyst Certi fi cat ion
This is not a complete analysis of every material fact regarding any company, industry or security. The opinions expressed here reflect o judgment at this date and are subject to change. The information has been obtained from sources we consider to be reliable, but we canguarantee the accuracy.
ADDITIONAL INFORMATION ON COMPANIES MENTIONED HEREIN IS AVAILABLE UPON REQUESTThe indices used in this report to measure and report performance of various sectors of the market are unmanaged and direct investmentindices is not available.
Baird is exempt from the requirement to hold an Australian financial services license. Baird is regulated by the United States Securities aExchange Commission, FINRA, and various other self-regulatory organizations and those laws and regulations may differ from Australilaws. This report has been prepared in accordance with the laws and regulations governing United States broker-dealers and not Australlaws.
Copyright 2016 Robert W. Baird & Co. Incorporated
Other Disclosures
United Kingdom (“UK”) disclosure requirements for the purpose of distri buting this research into the UK and other countries which Robert W. Baird Limi ted (“RWBL” ) holds a MiFID passpor t.
This material is distributed in the UK and the European Economic Area (“EEA”) by RWBL, which has an office at Finsbury Circus House, Finsbury Circus, London EC2M 7EB and is authorized and regulated by the Financial Conduct Authority (“FCA”).
For the purposes of the FCA requirements, this investment research report is classified as investment research and is objective.
This material is only directed at and is only made available to persons in the EEA who would satisfy the criteria of being "Professioninvestors under MiFID and to persons in the UK falling within articles 19, 38, 47, and 49 of the Financial Services and Markets Act of 20(Financial Promotion) Order 2005 (all such persons being referred to as “relevant persons”). Accordingly, this document is intended only persons regarded as investment professionals (or equivalent) and is not to be distributed to or passed onto any other person (such persons who would be classified as Retail clients under MiFID).
Robert W. Baird & Co. Incorporated and RWBL have in place organizational and administrative arrangements for the disclosure aavoidance of conflicts of interest with respect to research recommendations.
This material is not intended for persons in jurisdictions where the distribution or publication of this research report is not permitted under tapplicable laws or regulations of such jurisdiction.
Investment involves risk. The price of securities may fluctuate and past performance is not indicative of future results. Any recommendatcontained in the research report does not have regard to the specific investment objectives, financial situation and the particular needs any individuals. You are advised to exercise caution in relation to the research report. If you are in any doubt about any of the contentsthis document, you should obtain independent professional advice.
RWBL is exempt from the requirement to hold an Australian financial services license. RWBL is regulated by the FCA under UK laws, whmay differ from Australian laws. This document has been prepared in accordance with FCA requirements and not Australian laws.