trade winds march issue
DESCRIPTION
This issue includes: Analysis of Sugar Supply Chain, Palm Kernel Oil Interview of Mr. Rahul Poddar, Strategic Buyer, Nestle Article on Chilli and Guntur Yard by IIFT Alum Mr. Anil Kumar Kolla Analysis of Indian Ports Company Profile - GlencoreTRANSCRIPT

[email protected]. All rights reserved.
March 2012
TTTRADERADERADEWWWINDSINDSINDS Monthly magazine on National and International Trade
Analysis of Indian Ports
Company Profile GLENCORE
Sugar Supply Chain Industry Speaks Industry in India Rahul Poddar
Palm Kernel Oil Analysis
Analysis of Chilli and
Guntur Yard
Editor’s Desk
INDIAN INSTITUTE OF FOREIGN TRADE
Inside this issue
NEWS Snippets………………………..2
Industry Speaks ……………...…….8
Palm Kernel Oil……………………..11
Indian Ports….…………….…………14
Supply Chain Management in
Sugar Industry ……………………...18
Team Trade Winds is proud to bring to you the latest edition
of IIFT’s monthly trade digest.
Commodities look like they will take center-stage with
prospects of global recovery increasing. Government
decisions seem to make a flip-flop in commodities such as
cotton. In this issue, we bring all the latest news in this
sector over the last month. Our students bring about
analysis of commodities such as Sugar and Palm-Kernel oil.
Emphasis has been made on the operational aspect of
Sugar commodity. In our constant endeavor to provide a di-
verse knowledge, we have come up with a brief report on
the ports of India. In the company profile section we bring
to you a snap-shot of Glencore. After bringing to you the
views of our distinguished alumnus Sanjeev Asthana in the
previous issue, we bring to you excerpts of interview with
Rahul Poddar, Strategic buyer at Nestle and a distinguished
alumnus of IIFT (2000-2002).
- S.V.Praneet Varma
March 2012
“If the United
Nations is a country
unto itself, then the
commodity it exports
most is words.”
- Esther B. Fien
Write to us at [email protected]
Barclays and JPMor-
gan Chase have
become top players in global commodity
derivatives trading, catching up with long-time
leaders Goldman Sachs Group and Morgan
Stanley. The two banks tied Goldman Sachs
and surpassed Morgan Stanley in the share of
clients who use them for over-the- counter
energy derivative trades, a Greenwich Associ-
ates survey of corporate treasury officials
shows. In metals derivatives, JPMorgan domi-
nated with a 60% market penetration. In
energy derivatives, Barclays, Goldman Sachs
and JPMorgan each had 41% market penetra-
tion, and Morgan Stanley had 37%, according
to the survey. Among executives who use
derivatives to hedge metals prices, 35% chose
Barclays, 22% used Morgan Stanley and 21%
did business with Goldman Sachs. Some
companies use multiple investment banks for
commodities derivatives trading. Although
European energy companies said they do
more business with London-based Barclays
than its rivals, they selected Goldman Sachs
and Morgan Stanley, both based in New York,
as the top banks for service quality.
MCX SOARS ON MARKET DEBUT, FUELS OP-
TIMISM
BARCLAYS, JPMORGAN TURN ACE COM-
MODITIES PLAYERS
The Multi Com-
modity Exchange
(MCX), first Indian
exchange to come
out with an IPO,
and also the first public offer of the year 2012
revived the overall market sentiment when it
was listed at a premium of 34%.MCX also
became the first company to list under the
new Sebi rules introducing pre-open bidding in
the first-day trade of stocks listing after IPOs.
It had set a price band of Rs 860-1,032 per
share for the IPO, and the final price was fixed
at the top end (Rs 1,032) given the strong de-
mand witnessed for the offer. Based on a new
price-discovery mechanism, followed for the
first time in MCX listing, the shares finally
opened normal trade at the BSE at Rs 1,387 --
a premium of 34 per cent, and went on to gain
further ground to a high of Rs 1,420. The pro-
moters FTIL was holding 31.2 per cent in MCX,
which came down to about 26 per cent after
the IPO. FTIL, SBI, Bank of Baroda, GLF Finan-
cials Fund, Alexandra Mauritius Ltd, Corpora-
tion Bank and ICICI Lombard General Insur-
ance were the investors divesting part of their
holdings in MCX through the IPO.
2
Did you know:
Japan is now the 3rd largest consumer of coffee. They use it to improve their skin and reduce wrinkles by bathing in coffee grounds fermented with pineapple pulp. Amazing! Beats mud-bathing.

Crude oil pro-
duction by the
OPEC group
rose by 4 lakh
barrels per day to reach 31.27 million b/d in Feb-
ruary as compared to January. This is the highest
monthly output from the 12 producing countries
since the autumn of 2008, a Platts survey of the
Organization of the Petroleum Exporting Coun-
tries and oil industry officials and analysts has
revealed. Continuing recovery in Libyan produc-
tion accounted for 2.5 lakh b/d of the month-on-
month increase while smaller increments came
from Angola, Kuwait, Nigeria, Saudi Arabia and
Venezuela.
"For all of 2012, the call is 29.9 million b/d. In-
stead, OPEC is producing well over a million
barrels per day above that, yet oil prices con-
tinue to climb. Output dipped slightly in Iran,
Iraq and the UAE", said John Kingston, Platts
global director of news. Given that EU Oil em-
bargo on Iranian oil is due to come into force
on July 1, this prompted other producers to
ramp up facilities to meet the shortfall.
FOOD MINISTRY HIKES SUGAR PRODUCTION ESTIMATES
OPEC OIL PRODUCTION UP TO RECORD LEVELS IN FEB SINCE 2008
Food ministry has reviewed the out-put estimations for this year and sugar production
is set to cross 25 million tonne - more than the initial estimates of 24.6 million tonne. Last year, sugar output stood at 24.3 million tonne. The revised estimation is expected to brighten prospects of more shipments from India
( World's 2nd largest producer). The govern-ment has already allowed exports of 2 million tonne. Indian millers have been lobbying the government to allow up to 4 million tonne of exports this year. This may lead to an upward revision in the estimates and may prompt the government to open more exports. The cash flow from the exports will help millers make timely payments to farmers.
3
WILMAR BUYS STAKE IN GOODMAN FIELDER, EYES MORE
Singapore headquartered
palm oil company Wilmar International said it has
acquired a 10.1% stake in Goodman Fielder Ltd ,
Australia's largest listed food company, for $124
million and added its brands were a good fit.
Wilmar is among several Asian companies that
have been snapping up Australian food busi-
nesses. Wilmar bought Australia's largest sugar
miller, CSR's Sucrogen, in 2010 for A$1.75 billion
and last year took over Proserpine Sugar
Co-operative for A$120 million. It beat off compe-
tition for Proserpine from Chinese state-owned
food giant COFCO, which earlier took over
mid-sized sugar miller Tully Sugar. Most recently,
Thailand's Mitr Phol moved to complete the take-
over of MSF Sugar.
Drought tight-ens corn supply before huge har-vest Droughts from Mex-ico to Argentina are shrinking corn stock-piles to a five-year low, raising the pros-pect of a bull market before US farmers start reaping the big-gest crop ever. Global reserves will drop 4.2% to 123.43 million tonne by Oc-tober 1, according to the average of 21 ana-lyst estimates com-piled by Bloomberg. That's equal to 52 days of consumption, the fewest since 1974. Goldman Sachs ex-pects prices to rise 8.8% to $7 a bushel before the US har-vest starts in Septem-ber, 21% above the one-year closing low reached on the Chi-cago Board of Trade in December.
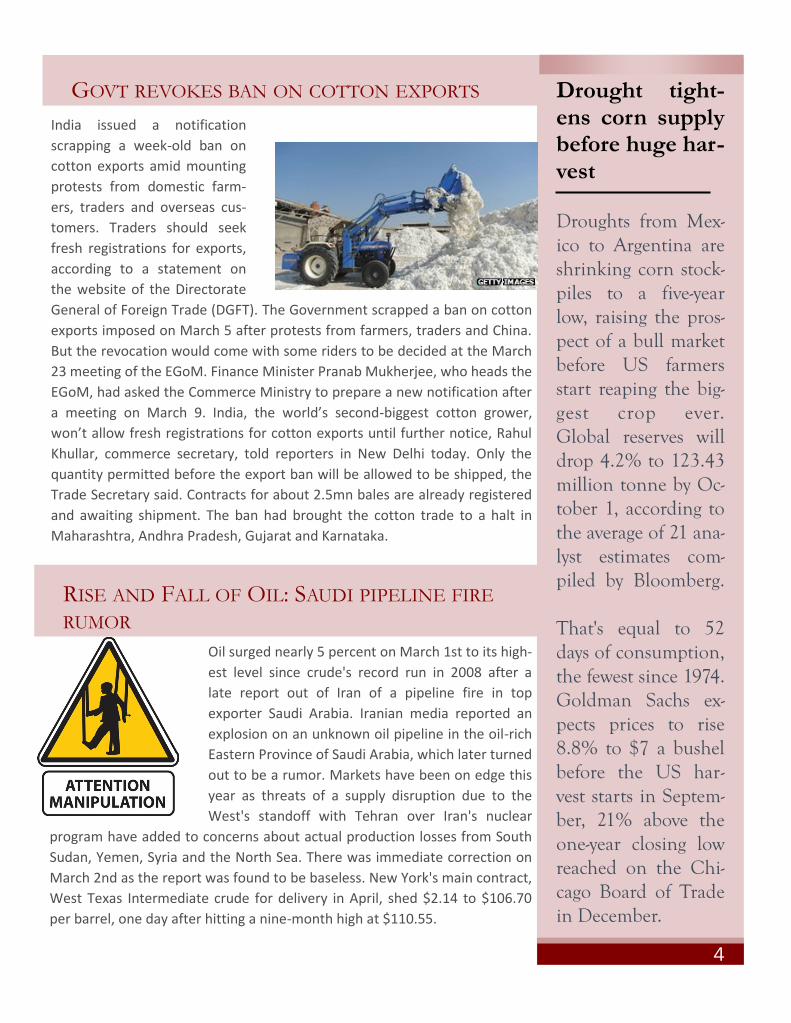
GOVT REVOKES BAN ON COTTON EXPORTS
India issued a notification
scrapping a week-old ban on
cotton exports amid mounting
protests from domestic farm-
ers, traders and overseas cus-
tomers. Traders should seek
fresh registrations for exports,
according to a statement on
the website of the Directorate
General of Foreign Trade (DGFT). The Government scrapped a ban on cotton
exports imposed on March 5 after protests from farmers, traders and China.
But the revocation would come with some riders to be decided at the March
23 meeting of the EGoM. Finance Minister Pranab Mukherjee, who heads the
EGoM, had asked the Commerce Ministry to prepare a new notification after
a meeting on March 9. India, the world’s second-biggest cotton grower,
won’t allow fresh registrations for cotton exports until further notice, Rahul
Khullar, commerce secretary, told reporters in New Delhi today. Only the
quantity permitted before the export ban will be allowed to be shipped, the
Trade Secretary said. Contracts for about 2.5mn bales are already registered
and awaiting shipment. The ban had brought the cotton trade to a halt in
Maharashtra, Andhra Pradesh, Gujarat and Karnataka.
4
RISE AND FALL OF OIL: SAUDI PIPELINE FIRE RUMOR
Oil surged nearly 5 percent on March 1st to its high-
est level since crude's record run in 2008 after a
late report out of Iran of a pipeline fire in top
exporter Saudi Arabia. Iranian media reported an
explosion on an unknown oil pipeline in the oil-rich
Eastern Province of Saudi Arabia, which later turned
out to be a rumor. Markets have been on edge this
year as threats of a supply disruption due to the
West's standoff with Tehran over Iran's nuclear
program have added to concerns about actual production losses from South
Sudan, Yemen, Syria and the North Sea. There was immediate correction on
March 2nd as the report was found to be baseless. New York's main contract,
West Texas Intermediate crude for delivery in April, shed $2.14 to $106.70
per barrel, one day after hitting a nine-month high at $110.55.

CWB signs grain deal with Cargill T h e C a n a d i a n Wheat Board has agreed with Cargill Ltd to move the CWB's 2012/13 grains through its grain elevators and port facilities, the first such deal as the board moves to com-pete in the open market. The Wheat Board will lose its wheat and barley marketing monopoly in August for the next harvest, leaving it to compete to buy f a r m e r s ' g r a i n against companies like Cargill, Viterra and Richardson In-ternational. The CWB lacks country elevators and port storage space.
TRADERS EYE NEW MARKETS IN IRAN AND IRAQ AS WHEAT HARVEST BEGINS Wheat harvesting has begun
across parts of Gujarat, Rajasthan,
Maharashtra and Madhya Pradesh
and supplies will pick up in a fort-
night across central, peninsular
and north India. With international
wheat companies Cargill, Louis
Dreyfus, Olam India, Glencore, and
Noble yet to lease godowns,
traders and warehouse owners are
worried about off take. According
to the US Department of Agricul-
ture (USDA), with global stocks of
wheat at record levels, India's
minimum support price works out
to $346 a tonne which is higher
than the world market, leaving
little room for exports. However,
Indian wheat traders are exploring
new markets in sanction-struck
Iran and its neighbor Iraq. Scien-
tists have observed higher yields
this year in early-sown wheat
varieties across the country and if
there was no heavy rainfall, hail
and snowfall, India could record a
bumper wheat production of 88.31
million tonne in 2012. Wheat trad-
ers and companies have been able
to export only around 5 lakh tonne
of wheat after an export ban was
lifted in September last year.
Indian wheat, which lost the race
to cheaper Russian and Australian
wheat in global market, could be
offloaded to Iran as its is scaling up
grain imports on fear of poor crops
due to dry weather. Similarly,
Iraq's 2012 wheat crop is expected
to fall 11% to around 1.87 million
tonne as fewer rains in the north-
ern growing region have reduced
planted area and yield prospects.
Iraq has approached India to buy
rice, sugar and edible oil, besides
wheat.
Did you know:
The world's only Corn Palace was built in 1892 in Mitchell, South Dakota to celebrate the farmer's harvest and as a tribute to the agricultural heritage of South Dakota.
The Aztec emperor Montezuma reportedly drank fifty or more portions of chocolate every day!
5
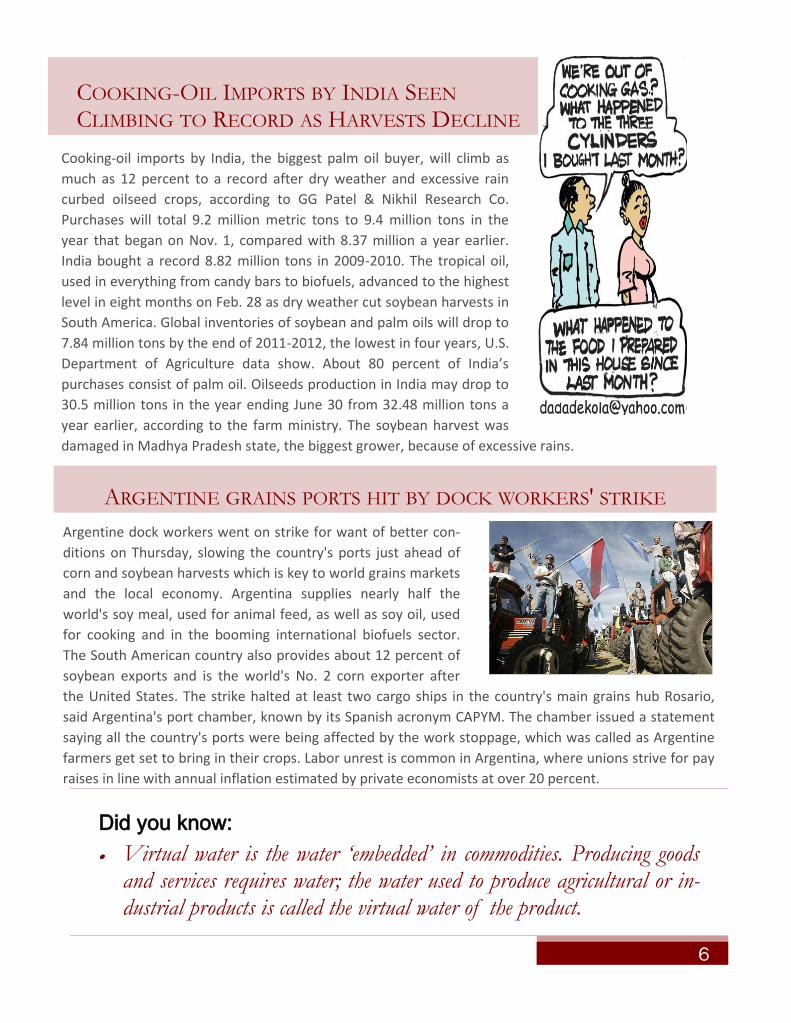
Cooking-oil imports by India, the biggest palm oil buyer, will climb as
much as 12 percent to a record after dry weather and excessive rain
curbed oilseed crops, according to GG Patel & Nikhil Research Co.
Purchases will total 9.2 million metric tons to 9.4 million tons in the
year that began on Nov. 1, compared with 8.37 million a year earlier.
India bought a record 8.82 million tons in 2009-2010. The tropical oil,
used in everything from candy bars to biofuels, advanced to the highest
level in eight months on Feb. 28 as dry weather cut soybean harvests in
South America. Global inventories of soybean and palm oils will drop to
7.84 million tons by the end of 2011-2012, the lowest in four years, U.S.
Department of Agriculture data show. About 80 percent of India’s
purchases consist of palm oil. Oilseeds production in India may drop to
30.5 million tons in the year ending June 30 from 32.48 million tons a
year earlier, according to the farm ministry. The soybean harvest was
damaged in Madhya Pradesh state, the biggest grower, because of excessive rains.
6
COOKING-OIL IMPORTS BY INDIA SEEN CLIMBING TO RECORD AS HARVESTS DECLINE
ARGENTINE GRAINS PORTS HIT BY DOCK WORKERS' STRIKE
Argentine dock workers went on strike for want of better con-
ditions on Thursday, slowing the country's ports just ahead of
corn and soybean harvests which is key to world grains markets
and the local economy. Argentina supplies nearly half the
world's soy meal, used for animal feed, as well as soy oil, used
for cooking and in the booming international biofuels sector.
The South American country also provides about 12 percent of
soybean exports and is the world's No. 2 corn exporter after
the United States. The strike halted at least two cargo ships in the country's main grains hub Rosario,
said Argentina's port chamber, known by its Spanish acronym CAPYM. The chamber issued a statement
saying all the country's ports were being affected by the work stoppage, which was called as Argentine
farmers get set to bring in their crops. Labor unrest is common in Argentina, where unions strive for pay
raises in line with annual inflation estimated by private economists at over 20 percent.
Did you know:
Virtual water is the water ‘embedded’ in commodities. Producing goods and services requires water; the water used to produce agricultural or in-dustrial products is called the virtual water of the product.
US HIKES DUMPING DUTY ON INDIAN SHRIMP IMPORTS
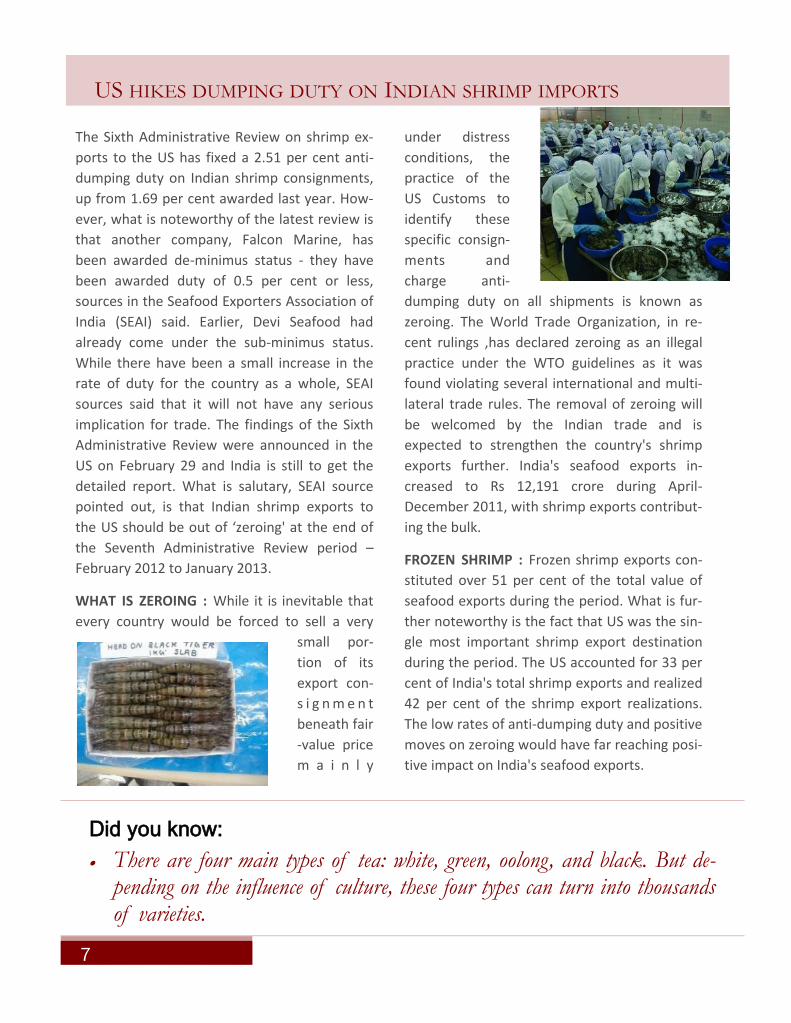
The Sixth Administrative Review on shrimp ex-
ports to the US has fixed a 2.51 per cent anti-
dumping duty on Indian shrimp consignments,
up from 1.69 per cent awarded last year. How-
ever, what is noteworthy of the latest review is
that another company, Falcon Marine, has
been awarded de-minimus status - they have
been awarded duty of 0.5 per cent or less,
sources in the Seafood Exporters Association of
India (SEAI) said. Earlier, Devi Seafood had
already come under the sub-minimus status.
While there have been a small increase in the
rate of duty for the country as a whole, SEAI
sources said that it will not have any serious
implication for trade. The findings of the Sixth
Administrative Review were announced in the
US on February 29 and India is still to get the
detailed report. What is salutary, SEAI source
pointed out, is that Indian shrimp exports to
the US should be out of ‘zeroing' at the end of
the Seventh Administrative Review period –
February 2012 to January 2013.
WHAT IS ZEROING : While it is inevitable that
every country would be forced to sell a very
small por-
tion of its
export con-
s i g n m e n t
beneath fair
-value price
m a i n l y
under distress
conditions, the
practice of the
US Customs to
identify these
specific consign-
ments and
charge anti-
dumping duty on all shipments is known as
zeroing. The World Trade Organization, in re-
cent rulings ,has declared zeroing as an illegal
practice under the WTO guidelines as it was
found violating several international and multi-
lateral trade rules. The removal of zeroing will
be welcomed by the Indian trade and is
expected to strengthen the country's shrimp
exports further. India's seafood exports in-
creased to Rs 12,191 crore during April-
December 2011, with shrimp exports contribut-
ing the bulk.
FROZEN SHRIMP : Frozen shrimp exports con-
stituted over 51 per cent of the total value of
seafood exports during the period. What is fur-
ther noteworthy is the fact that US was the sin-
gle most important shrimp export destination
during the period. The US accounted for 33 per
cent of India's total shrimp exports and realized
42 per cent of the shrimp export realizations.
The low rates of anti-dumping duty and positive
moves on zeroing would have far reaching posi-
tive impact on India's seafood exports.
7
Did you know:
There are four main types of tea: white, green, oolong, and black. But de-pending on the influence of culture, these four types can turn into thousands of varieties.
8
INDUSTRY SPEAKS AN INTERVIEW WITH RAHUL PODDAR
SUPPLY CHAIN – The Enabler
Rahul Poddar (A distinguished alumnus of IIFT), has seen the complete integration of supply chain from
farm to factory gate of many agro Commodities and one of the select few who was responsible for rolling
out and managing the "e- choupal" channel very early into his work at ITC. Later he moved to AWB India
Pvt Ltd. as a trader before taking up the challenging role of Controlling a spend of Rs 300 Cr as Strategic
Buyer at Nestle India Ltd. Here are few excerpts from the Interview
How technology and innovation could enable better supply chains for procurement and sourcing?
Technology is making possible real time assimilation and analysis of information expanding across geogra-
phy and cutting across different functional departments. This in turn has automated decision making to
large extent and for the ones which still require human intervention there is a drastic cut in decision
making and dispersion time. All this comes together to make real time and agile yet intelligent Supply
Chain to respond to dynamic and volatile market needs in most efficient and optimized manner. With
today’s pressures on costs due to commodity volatility and depleting consumer expenditure every penny
saved by operational efficiency is money earned.
Apart from infrastructure, what other issues cripple supply chains of companies doing procurement in
India?
Variable regulatory requirements and taxation structure are the main problem areas for the supply chains
of India. Often these two factors force in sub optimization in supply chain structuring thereby leading to
wastes which otherwise would have been easily avoidable.
There is too much hype and hoopla around contract farming. Is it justified?
Contract farming as a concept has miserably failed in India. There are enough examples in the past two decades of failed attempts by reputed corporate across geography of India. This concept is unworkable in India for two reasons. Firstly it places restrictions on the freedom of choice of farmer which statutorily is almost impossible to enforce in India given laxity in our commercial laws and elongated time required for litigation finalization. Secondly despite being the largest producers India is still deficit in almost all the crops due to its huge consumption base. This fundamentally short circuits the idea of making seller of scarce commodity to comply to a contract restricting his selling options.
What are your views on APMC act with respect to the sourcing for food industry?
As per my information there is no centralized APMC act in India. Agriculture is a state subject and each state administers its own APMC act. Mostly the provisions are designed as per the individual state’s inter-est in mind w.r.t its consumption or production. This distorts the supply chain structure across different states. This causes unnecessary diversions or routings of flow of commodities from farmers to consumers thereby causing more wastage and increase in final cost to consumer.
9
Any suggestions for the current students at IIFT who would like to build a career in this field?
Supply chain management is a key vertical in any manufacturing oriented organization. Given cut throat competition in all industries there is no scope of inefficiency available to organizations. With top line and bottom-line pressures increasing, supply chain plays the key role in providing the organization a competitive edge to survive or thrive in market.
PALM KERNEL OIL MARKET-INDONESIA by Hitesh Yadav (1st year MBA-IB)
Indonesia Palm Kernel Oil Market Overview “Palm oil area of production is ex-pected to increase to 15 million hectares, double compared to current levels, by 2020.” ------ Agriculture Department, Indonesia
Key Highlights
Exports dominate the demand for PKO in the Indonesian palm kernel oil market. More than 60% of the PKO produced in the country is exported.
The domestic (Indonesian) demand for PKO grew at a CAGR of 5.51% between 2006/07 till 2009/10. During the same period, production grew at the rate of 5.12%. This growth was mostly driven by the demand from the global market.
The production of PKO is expected to increase at a CAGR of 3.78% and Indonesia’s domestic de-mand is expected to grow at a CAGR of 2.85% between 2010/11 till 2014/15. Both production and demand will be driven by the growing demand from across the globe.
Malaysia, a leading producer of palm kernel oil in 2003, started losing its market share from 2003 due to production and stiff competition from Indonesia.
Malaysia’s idle agricultural land for palm production totals only 0.8 million hectares. Indonesia, however, has 26.8 million hectares.
Indonesia has a very high potential to grow and is likely to be a market leader. It is projected that Indonesia will produce 48% of global palm kernel oil production in 2015, up from 44% in 2009.
Global Trend
Historically, from 1998–2011, palm kernel oil production grew at a CAGR of 5% in Malaysia, 11.1% in Indonesia and 6.1% in the rest of the world due to the increase in per capita consumption of palm oil. Globally, the per capita consumption of palm kernel oil was growing at a CAGR of 5.3% from 1998–2009 and is expected to grow at a CAGR of 2.4% from 2009–2015. The increase in per capita income

and the growing population are expected to increase the demand for PKO (Palm Kernel Oil), which will lead to a rise in the production of PKO in Indonesia.
Trade Activity
Key Highlights:
From 1998–2011, palm kernel oil exported from Malaysia and Indonesia grew at a CAGR of 1.6% and 16%, respectively, since the demand for palm ker-nel oil from China and Europe started increasing.
In 2008, 74% of palm kernel oil exports were from Indonesia and 26% were from Malaysia. These two countries are expected to be the largest PKO exporting nations in the near future due to the high availability of PKO in these countries.
The import of palm oil in China and Europe was growing at a CAGR of 36.6% and 3.8%, re-spectively, from 1999–2009.
The demand for PKO from emerging countries, such as India and China, is being driven by their growing population and increasing per capita income. This demand is expected to in-crease the exports of PKO from Indonesia.
PKO Drivers and Constraints in In-donesia
Industry Drivers
The growing demand for palm kernel oil in developing nations, especially from the food sector (which is increasing because of the growth in population), is ex-pected to drive the demand for palm kernel oil.
The growing demand for palm oil across the globe is expected to increase the availability of palm kernel, thereby increasing the supply of palm kernel oil in Indonesia.
The increasing prices of CPO (Crude Palm Oil) are expected to drive small holders to in-crease their plantation area, which is expected to increase the availability of CPO and PKO.
Industry Constraints
Growing concerns about deforestation in Indonesia’s forest for the purpose of palm planta-
10

11
tion, which affects the wildlife and increases CO2 emissions, are hindering plantation expansions.
Major producers, like Unilever and Nestle, have implemented initiatives to source only from RSPO (Round Table Sustainable Palm Oil ) certified suppliers. This practice will affect the future expansion of large companies.
Regulations and Export Tariffs
Indonesia Sustainable Palm Oil (ISPO)
The Indonesian government has implemented ISPO, an initiative to save the forest. According to this mandatory requirement, players are not allowed to set up new plantations in reserved and pro-tected forest areas.
Producers are also expected to manage their waste responsibly and employ renewable energy in the production process.
Export Taxes
Indonesia has imposed export tariff slabs for CPKO as well as CPO. As the price increases, the tariff per-
centage also increases, which prevents price hikes.
Key Takeaway: Indonesia’s palm oil production is expected to be greater than other producing coun-
tries and rise steadily in the export market. Its continued increase in production is a result of plantation
area expansions and favorable weather conditions.
12
ANALYSIS OF INDIAN PORTS by Prince Jain (MBA-IB—2011-2013)
India has an extensive coastline of 7517 km (excluding Andaman and Nicobar Is-
lands) with 12 major and 200 non-major ports. They handle 95% in terms of volume
and 70% in terms of value of country’s trade amounting to 849.9 million tones. Non-
major ports account for around one-third of the same. The classification of Indian
ports into major, minor and intermediate has an administrative significance. Indian
government has a federal structure, and according to its constitution, maritime
transport falls under the "concurrent list", to be administered by both the Central and the State governments.
While the Central Shipping Ministry administer the major ports, the minor and intermediate ports are adminis-
tered by the relevant departments or ministries in the nine coastal states—West Bengal, Orissa, Andhra
Pradesh, Kerala, Karnataka, Goa, Maharashtra, Gujarat and Tamil Nadu.
The 12 major Ports are-
Kandla (Gujarat)
Mumbai (Maharashtra)
Jawaharlal Nehru (Maharashtra)
Marmugao (Goa)
New Mangalore (Karnataka)
Cochin (Kerala)
Tuticorin (Tamil Nadu)
Chennai (Tamil Nadu)
Ennore (Tamil Nadu)
Visakhapatnam (Andhra Pradesh)
Paradip (Orissa)
Kolkata, Haldia (West Bengal)
The gap between the cargo traffic handled by major ports (i.e., government-
owned ports) and minor ports is narrowing, with major ports’ share of cargo
traffic shrinking while minor ports’ share of cargo traffic grew accordingly. In
fiscal year 1998, major ports handled around 90% of India’s total cargo traf-
fic, leaving about 10% for the minor ports. However, the cargo traffic han-
dled by minor ports has trended upward since 1998. Over the last 12 years,
the major ports’ share of cargo traffic has dropped to approximately 65% while minor ports’ share has in-
creased dramatically to nearly 35%. These changing trends were the result of increasing private participation
in establishing minor ports. Cargo traffic handled by the major ports grew by just 5.8%, while cargo traffic han-
13
dled by minor ports grew at 35.5% during fiscal year 2009-2010.
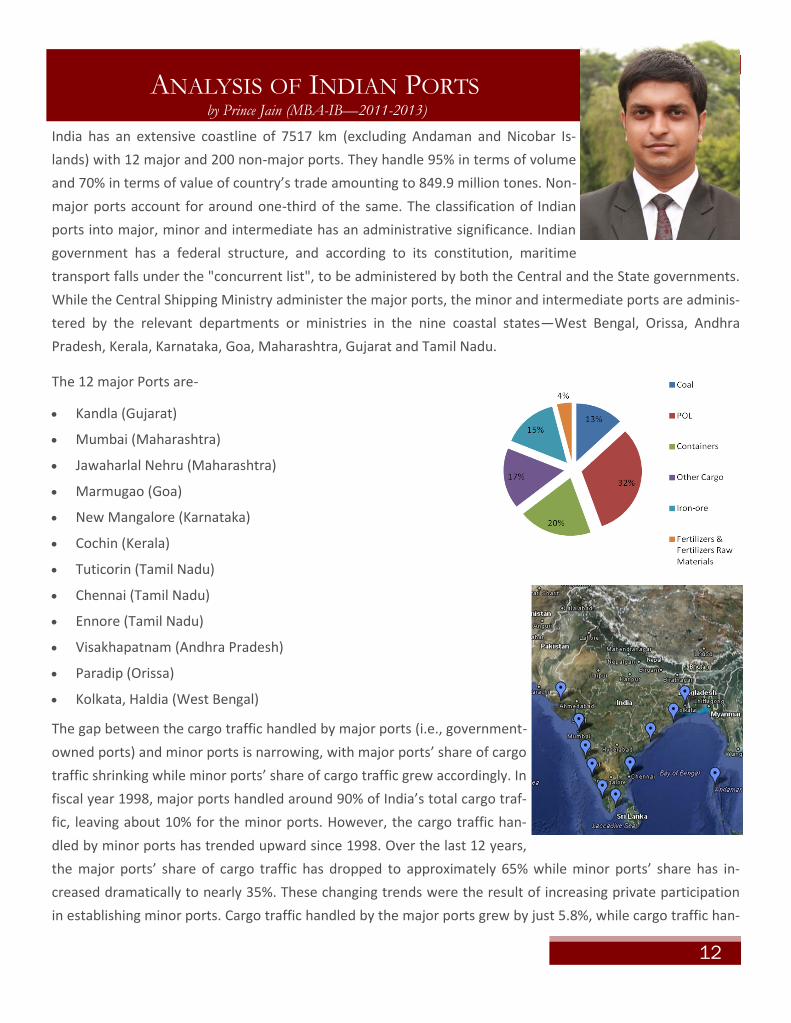
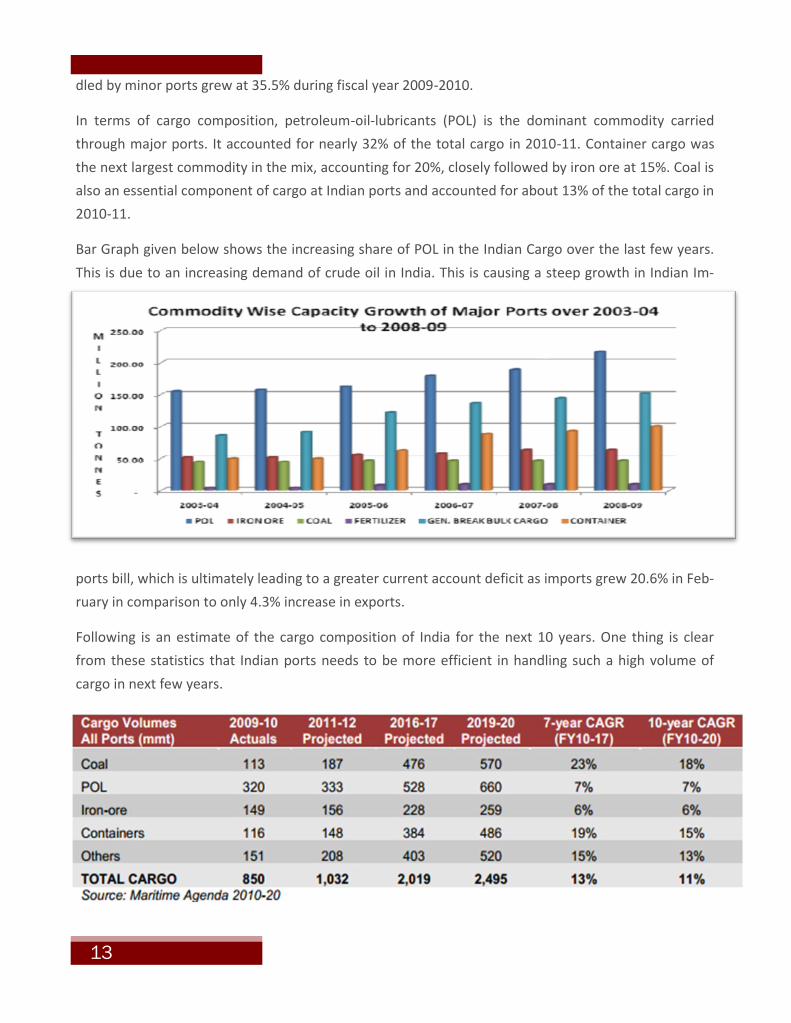
In terms of cargo composition, petroleum-oil-lubricants (POL) is the dominant commodity carried
through major ports. It accounted for nearly 32% of the total cargo in 2010-11. Container cargo was
the next largest commodity in the mix, accounting for 20%, closely followed by iron ore at 15%. Coal is
also an essential component of cargo at Indian ports and accounted for about 13% of the total cargo in
2010-11.
Bar Graph given below shows the increasing share of POL in the Indian Cargo over the last few years.
This is due to an increasing demand of crude oil in India. This is causing a steep growth in Indian Im-
ports bill, which is ultimately leading to a greater current account deficit as imports grew 20.6% in Feb-
ruary in comparison to only 4.3% increase in exports.
Following is an estimate of the cargo composition of India for the next 10 years. One thing is clear
from these statistics that Indian ports needs to be more efficient in handling such a high volume of
cargo in next few years.
14
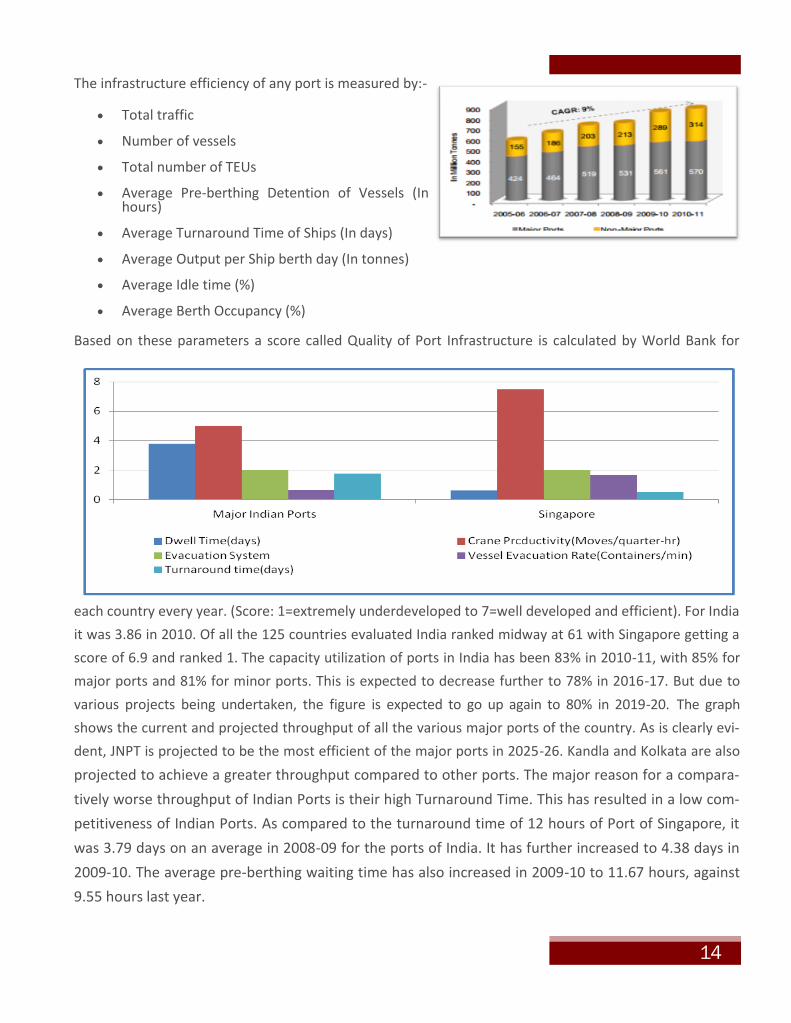
The infrastructure efficiency of any port is measured by:-
Total traffic
Number of vessels
Total number of TEUs
Average Pre-berthing Detention of Vessels (In hours)
Average Turnaround Time of Ships (In days)
Average Output per Ship berth day (In tonnes)
Average Idle time (%)
Average Berth Occupancy (%)
Based on these parameters a score called Quality of Port Infrastructure is calculated by World Bank for
each country every year. (Score: 1=extremely underdeveloped to 7=well developed and efficient). For India
it was 3.86 in 2010. Of all the 125 countries evaluated India ranked midway at 61 with Singapore getting a
score of 6.9 and ranked 1. The capacity utilization of ports in India has been 83% in 2010-11, with 85% for
major ports and 81% for minor ports. This is expected to decrease further to 78% in 2016-17. But due to
various projects being undertaken, the figure is expected to go up again to 80% in 2019-20. The graph
shows the current and projected throughput of all the various major ports of the country. As is clearly evi-
dent, JNPT is projected to be the most efficient of the major ports in 2025-26. Kandla and Kolkata are also
projected to achieve a greater throughput compared to other ports. The major reason for a compara-
tively worse throughput of Indian Ports is their high Turnaround Time. This has resulted in a low com-
petitiveness of Indian Ports. As compared to the turnaround time of 12 hours of Port of Singapore, it
was 3.79 days on an average in 2008-09 for the ports of India. It has further increased to 4.38 days in
2009-10. The average pre-berthing waiting time has also increased in 2009-10 to 11.67 hours, against
9.55 hours last year.

15
Conclusion: The Indian port industry is poised for tremen-
dous growth in the coming years as a long coast-
line provides India an opportunity to transform
itself into a transshipment hub. Also a huge In-
dian market and landlocked countries in the
north will ensure that the ports see a rise in traf-
fic. The sector has a huge potential, in order to
fully tap this potential there is a need to tackle
some key issues, like:
Port capacity
Improving the port productivity to international levels, in terms of measurable like turnaround
times, dwell times etc.
Making the cargo handling systems more efficient
Lowering port dues on vessels
Improving inland transportation capacity
Making the institutional framework less rigid
Use of IT for improving process efficiency at all major ports
Revised regulation of Port tariffs
Improving the quality of services/business attitude
Professional Port Management
Did you know:
LCL stands for less than container load, FCL stands for full container load and the mass/weight ratio in freight shipping will always be in 1 cbm (cubic metre) to 1 ton.
There was a time in the past, when Indians were the masters of the sea borne trade of Europe, Asia and Africa. They built ships, navigated the sea, and held in their hands all the threads of international commerce, whether carried on overland or sea. In Sanskrit books we constantly read of merchants, traders and men engrossed in commercial pursuits. Manu Smriti, the oldest law book in the world, lays down laws to govern commercial dis-putes having references to sea borne traffic as well as inland and overland commerce.

16
SUPPLY CHAIN MANAGEMENT IN SUGAR INDUSTRY by Himanshu Verma (1st year MBA-IB)
Sugar industry is second largest agro-based commodity in India after textile.
Sugar production in India follows a five year cycle with 2-3 years of high pro-
duction followed by 2-3 years of low production. There are 553 installed sugar
mills in the country with a production capacity of 180 lakh MT of sugar. 60% of
these mills are in the co-operative sector, 35% of the total are in the private
sector and rest in the public sector.
Sugar industry can be classified into unorganized and organized sectors. In India, sugar industry is highly
regulated. Perishable nature of cane, small farm landholdings and the need to influence domestic
prices; all have been the drivers for regulations. Since 1993, the regulatory environment has considera-
bly eased, but sugar still continues to be an essential commodity under the Essential Commodity Act.
SUPPLY CHAIN OF SUGAR
VALUE CHAIN
The industry is highly regulated in India across the entire value chain from cane growers to millers/
manufacturers, traders and final consumer. Various controls on the industry cover the aspects such as
licensing, capacity, cane area, location of mills, specific taxes and levies, cane cess, etc.
The cost of cane procurement accounts for 70 percent of the ex-mill sugar price and is the largest cost
component of sugar. The sugar industry contributes to the government through a number of taxes lev-
ied across the value chain. When the mills purchase sugarcane, a purchase tax is levied by the respec-
tive state governments. This purchase tax varies across states. Haryana and Bihar have the lowest pur-
chase tax, while Tamil Nadu and Karnataka have the highest purchase tax.
17
The sugar produced by the mills attracts an excise duty and a cess. The mills also pay an excise
duty on molasses. In addition to the various taxes discussed above, the industry also pays direct
taxes to the government. Additional taxes also accrue from other value added products like alco-
hol, chemicals, paper boards, and so on.
The farm-to-retail price spread measures contributions of food manufacturing, wholesaling, and
retailing firms. The difference between farm value and retail price rarely gets transformed into
any significant value addition — more often than not, there is only value depletion. Micro-studies
on marketing margins show that cereals have a margin of 19.2%, 32.9% for fruits and vegetables,
7.2% for oilseeds, 6.7% for milk and milk products, and 37.2% for sugar and sugarcane. In India,
there are usually 7-8 middlemen between the farmer and the retail consumer.
PROCUREMENT
Farming in India is highly fragmented with farmers owning small tracts of lands. Sugar mills in In-
dia produces refined white sugar of 100-159 ICUMSA, known as plantation white sugar using sug-
arcane as Input.
In India every sugar factory whether it is private or co-operative has their command area allotted
to them based on their crushing capacity by the government. During the crushing season they are
allowed to procure sugarcane from command area which gives a regular supply of sugarcane.
Each sugar mill both in the private and cooperative segments of the industry in its command area
enters into a formal written contract with farmers for cane delivery to a mill. Mills conduct a com-
prehensive annual farm survey during the month of May/June to assess each cane grower’s area
under the early, mid and late cane varieties and the major cultivable practices i.e. plant and ra-
toon.
Each sugar mill procures cane from about 8,000-10,000 diversified farmers that increase the com-
plexity of managing cane procurement, quality control and cane development. Being a bulky prod-
uct, sugarcane must be processed within days of harvesting or it loses its sucrose content. There-
fore, mills must be located closer to the cane fields to minimize transport costs and sucrose losses.
Sugar mills have monopsony power under the “command area" or zoning system, whereby farm-
ers who have land in a particular area can only sell cane to the assigned mill in that region and the
mill can only buy cane from the farmers in its command area. Cane price floors are set by state
and national governments. Each mill pays its farmers a single price per metric tonne of cane every
year, based on weight {i.e., mills cannot price discriminate on the basis of quality, each farmer
must be paid the same price per ton of cane.
SUGAR PRODUCTION
Sugar production is a two-stage process. The first stage consists of planting and growing sugar-
cane, and harvesting and transporting it to the factory. Sugarcane is a water and fertilizer inten-
18
sive crop that is harvested yearly. Once harvested, the stalk can re-grow for another 1-3 harvests. The
second stage involves extracting sugar from the cane at the factory. The harvested cane is crushed to
extract sucrose-rich juice, which is boiled and refined using lime and sulphur to produce sugar crystals.
The crushing season usually runs from November through April/May.
DISTRIBUTION
All mills regularly submit data pertaining to sugar stock position to the Department of Food and Public
Distribution. The Department directly allocates sugar sales quotas to each private mill while to the co-
operative mills it is allocated through the State Sugar federation.
The government has approved licensed supply agents, actual users with storage license and the mills
are entitled to sell sugar only to these authorized agents. Supply agents are attached to each coopera-
tive sugar mill from both within the state and the adjoining states.
These agents collect sugar purchase orders from wholesalers, place these along with delivery instruc-
tions before mills, arrange for sugar deliveries from mills and collect payments from wholesalers for
the client mills. Mills pay them commission @ 0.5% - 0.75% for the rendering of these services.
Every year, the Central Government fixes a statutory minimum price (SMP) of sugarcane for farmers.
Different states also announce independently state-advised prices (SAP), which are often higher and
bear no relationship with the SMP. The prescribed sugarcane prices have now been related to the su-
crose content in the cane, which has motivated the farmers to improve the quality of the crop. The
Supreme Court had decreed in a judgment that only the SMP announced by the Central Government is
relevant in negotiating the price of cane.
Sales agents are required to sell sugar within two weeks of its receipt (earlier it was one week) to re-
tailers/wholesalers (only once). Secondary sale deeds are transacted through brokers. Such brokers
bring together wholesalers and retailers for an ultimate sale and they charge a brokerage up to 0.25%.
Sugar moves from mills as a mass product to the wholesale/retail markets. Finally, retailers break
down these whole lots and pack sugar into consumer packs.
Did you know:
The first traces of crystallizing sugarcane dates back to the Gupta dynasty in India. Around this time, people chewed sugarcane in its raw form to ex-tract its sweetness, as the concept of crystallized sugar was unimportant. The method of turning sugarcane juice into crystals was discovered by Indi-ans. They realized that the crystallized form was not only easy to store, but also convenient, when it came to transportation.

19
Chilli is the second largest traded spice in the world with a 22% contribution in
the world spice trade. It is a fruit of the plant Capsicum annuum and Capsicum
frutecens that belong to the family Solanaceae. It is known for its sharp acidic
flavor and color and is primarily used in making beverages and medicines. The
duration of crop is 3 to 4 months. The crop is planted as and when the rainfall
occurs starting from August and harvesting takes place in December and chillies
start reaching the major markets in February and March. There are several va-
rieties of chilli cultivated in India. The most popular among these are (Guntur)
Sannam, LC 334, Byadgi, Wonder Hot, Jwala etc.
A few salient points about Chilli Trade in India are –
India is the largest consumer of chilli in the world. Around 90% of India's production is con-
sumed within the country. India contributes 25% of the Global chilli exports
It is estimated that around 25-30% of the chilly crop is used for powder preparation, with the
branded chilli powder manufacturers accounting for around 5% of the total volume
Guntur is Asia's largest market for chillies. The marketing season begins in the first week of
February, peaks during the month of April, and closes by the middle of May
India exports chillies in the form of dried chillies, chilli powder, picked chillies and chilly oleore
Out of all spices , Chilli occupies first position in Spice exports from India
The area of chilli cultivation in Andhra Pradesh is 26 per cent of the total area in India while
the production stands at 55 per cent level. This is due to the very high productivity in Andhra
Pradesh. Guntur district in Andhra Pradesh stands first with 38 per cent production followed by
Khammam, Warangal and Prakasam.
World Trade in Chilli
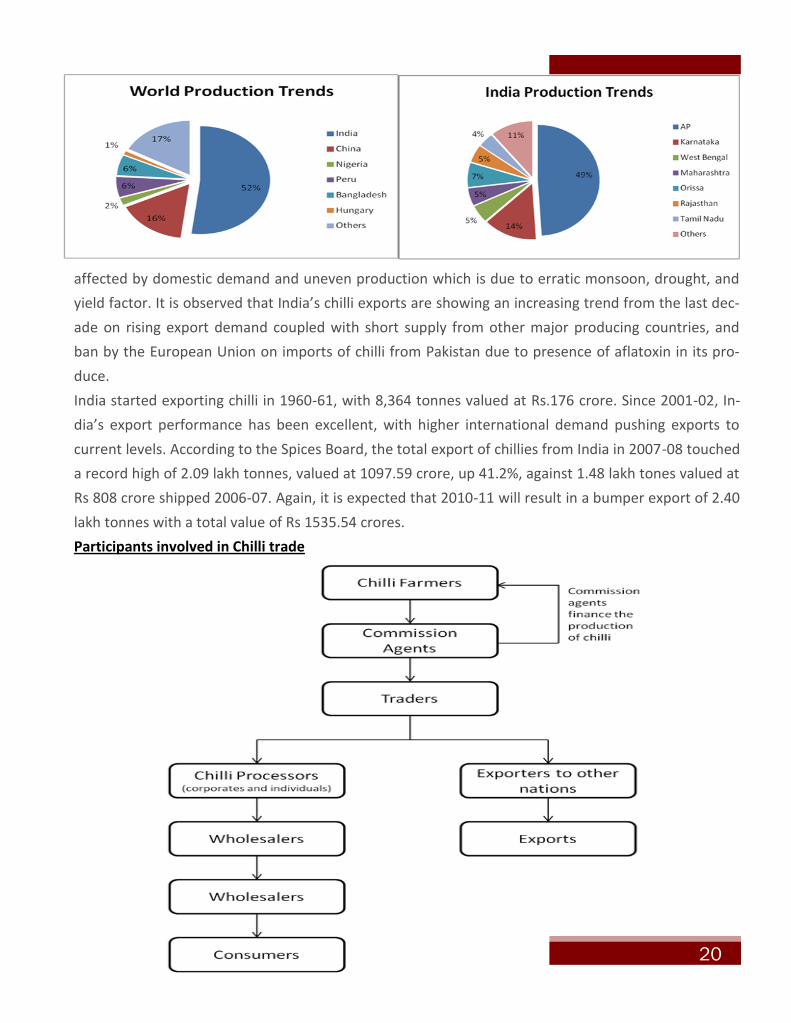
Global production of chilli stands at about 20 lakh MT to 25 lakh MT per annum. India is the larg-
est producer and contributes about 12 lakh MT to 13 lakh MT annually followed by China, Nigeria,
Peru, Bangladesh, Hungary, Spain, Mexico, Pakistan, Morocco and Turkey. Domestically, Andhra
contributes 49 % of total production followed by Karnataka (14 %), Orissa (7 %), Maharashtra (5
%), West Bengal (5 %), Rajasthan (5 %) and Tamil Nadu (4 %).
Major importers of Indian chillies are Sri Lanka, Bangladesh, U.K, Germany, France and U.S.A.
India has immense potential to export different types of chillies required by various markets
around the world. It is the leader in export, with 25% share in world trade, followed by China with
24% share in total global export. Clearly, China is a serious competitor to India in the international
markets, penetrating all major markets like Indonesia and the US. Indian chilli exports are mainly
ANALYSIS OF CHILLI AND GUNTUR YARD by Anil Kumar Kolla (IIFT 2010-2012)
20
affected by domestic demand and uneven production which is due to erratic monsoon, drought, and
yield factor. It is observed that India’s chilli exports are showing an increasing trend from the last dec-
ade on rising export demand coupled with short supply from other major producing countries, and
ban by the European Union on imports of chilli from Pakistan due to presence of aflatoxin in its pro-
duce.
India started exporting chilli in 1960-61, with 8,364 tonnes valued at Rs.176 crore. Since 2001-02, In-
dia’s export performance has been excellent, with higher international demand pushing exports to
current levels. According to the Spices Board, the total export of chillies from India in 2007-08 touched
a record high of 2.09 lakh tonnes, valued at 1097.59 crore, up 41.2%, against 1.48 lakh tones valued at
Rs 808 crore shipped 2006-07. Again, it is expected that 2010-11 will result in a bumper export of 2.40
lakh tonnes with a total value of Rs 1535.54 crores.
Participants involved in Chilli trade

21
Chilli Balance Sheet
About Guntur Chilli Yard
Guntur Chilli Yard, also famously called as Guntur Mirchi Yard, is regulated and owned by the Agri-
cultural Market Committee (AMC), Guntur. Originally called as ‘The Guntur– Bezawada Tobacco
Market Committee’, it was constituted in the year 1939 for the prime purpose of regularisation of
trade of Tobacco. Its objectives are –
To supervise and regulate the sale and purchase of agriculture produce
To provide organizational protection to the producer
and purchaser by avoiding the malpractices and exploi-
tation in the Market
To help the farmer from the clutches of the middleman
To provide justice both to the purchaser and seller in all
activities relating to purchase and sale of agriculture
produce
Finally, to establish a place with all facilities required for
smooth transaction of sale and purchase of agriculture
produce
Asia’s Biggest Chilli Market: Reputed to be as largest Chilli Market in Asia, the market attracts
produce from different parts of the state and buyers from all over the world. It also generates the
highest revenue in terms of market fee among all the Market Committees in the state.
Sale-Commission-Agent System: Over the years, the AMC has been following the tried and tested
method of selling the agricultural product through Commission Agent system. Chillies brought to
the Market Yard are sold in an open auction. The market has 575 Commission Agents as selling
agents on behalf of chilli farmers and has 375 chilli purchasers and exporters (Traders). The sale of
chilli in the Market Yard starts soon after model auction at 7.00 a.m. The sale price will be an-

22
nounced through a public announcement system and the traders could procure chillies after examin-
ing and verifying the samples
The major states to which chilli is exported from Andhra Pradesh and particularly from Guntur are –
Tamilnadu, Maharashtra, Kerala, Delhi, West Bengal, Karnataka, Gujarat, Orissa
Participants in the Guntur Chilli Yard
There are two important participants in the Chilli Yard – Commission Agents and Traders. Their busi-
ness model has been in existence and has been successful over decades.
The Commission agent’s working model is as follows –
Commission agents or kachcha adatias are small traders to whom the farmers typically sell their
produce
The trader/commission agent provides financial assistance to the farmers to buy the seeds, fertil-
izers and other information regarding the crop demand so that the farmers get leverage to buy the
required inputs and till their land for the season
Once the produce is collated after the production season, the farmer brings it in bags to the com-
mission agents
The agents act as intermediaries and help farmers in finding suitable purchasers.
The agents receive a specific pre-defined percentage commission from the farmer on the sale of
the produce.
The agents pay the farmers upfront after the sale of the produce, but give a credit of about 15
days to the buyer of the produce
Traders are those people who buy the chilli from commission agents and export them to various states
where processing plants are located or from where sometimes chilli is exported. The typical business
model of these traders is as follows –
Traders buy the chilli produce from farmers via commission agents
The traders are given a credit of 15 days by the commission agents, but the commission agents pay
the farmers upfront once the trade is done
The traders gather demand from their buyers and thus make the forecasts of demand of chilli for
the next season
The prices quoted by the traders are a function of demand and supply of chilli
Occasionally, traders do buy/sell chillies over the exchange when there is a huge difference in the
market price and the exchange price. They get updated about the exchange prices over SMS updates
with the market opening and closing prices and perform their exchange trades via brokerage houses.
Conclusion
Though India is the largest producer of Chilli our exports are not huge due to high local consump-
tion. But, there is a huge potential in the exports of chilli powder and other processed items.
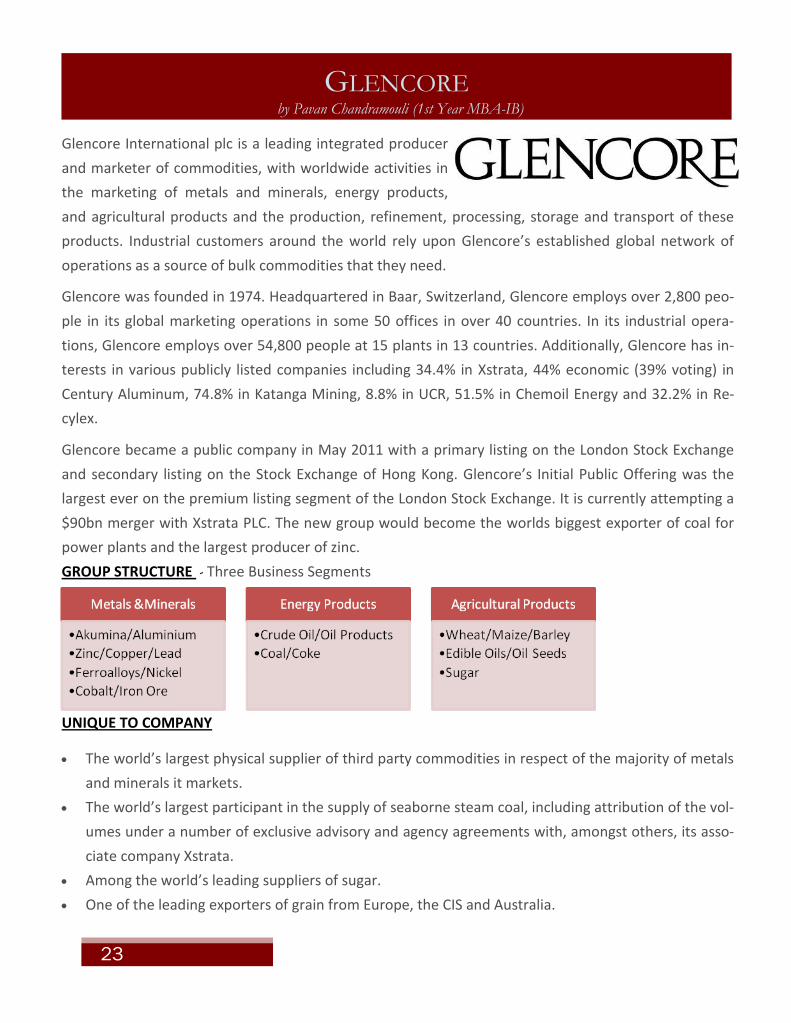
GLENCORE by Pavan Chandramouli (1st Year MBA-IB)
Glencore International plc is a leading integrated producer
and marketer of commodities, with worldwide activities in
the marketing of metals and minerals, energy products,
and agricultural products and the production, refinement, processing, storage and transport of these
products. Industrial customers around the world rely upon Glencore’s established global network of
operations as a source of bulk commodities that they need. Glencore was founded in 1974. Headquartered in Baar, Switzerland, Glencore employs over 2,800 peo-
ple in its global marketing operations in some 50 offices in over 40 countries. In its industrial opera-
tions, Glencore employs over 54,800 people at 15 plants in 13 countries. Additionally, Glencore has in-
terests in various publicly listed companies including 34.4% in Xstrata, 44% economic (39% voting) in
Century Aluminum, 74.8% in Katanga Mining, 8.8% in UCR, 51.5% in Chemoil Energy and 32.2% in Re-
cylex. Glencore became a public company in May 2011 with a primary listing on the London Stock Exchange
and secondary listing on the Stock Exchange of Hong Kong. Glencore’s Initial Public Offering was the
largest ever on the premium listing segment of the London Stock Exchange. It is currently attempting a
$90bn merger with Xstrata PLC. The new group would become the worlds biggest exporter of coal for
power plants and the largest producer of zinc.
GROUP STRUCTURE - Three Business Segments
UNIQUE TO COMPANY
The world’s largest physical supplier of third party commodities in respect of the majority of metals
and minerals it markets.
The world’s largest participant in the supply of seaborne steam coal, including attribution of the vol-
umes under a number of exclusive advisory and agency agreements with, amongst others, its asso-
ciate company Xstrata.
Among the world’s leading suppliers of sugar.
One of the leading exporters of grain from Europe, the CIS and Australia.
23
Indian Institute of Foreign Trade (IIFT) is India's nodal institu-
tion of excellence in the field of International Trade and Business.
Since its inception in 1963, IIFT has kept pace with the extremely
dynamic Global business environment by focusing on International
Trade and Logistics-related issues. The rigorous, extremely dynamic
and up-to-date course curriculum stands testimony to this fact.
Supplementing the classroom, IIFT organizes several events and
discussions on currently relevant issues in the field of Trade and
Logistics, which are graced by pre-eminent professionals, industry
veterans and academicians, alike. Our students have maintained and
sustained IIFT.s rich legacy by successfully exhibiting their skills
time and again in various Live Projects and Competitions. The
institution has groomed international business managers for over 40
years and boasts alumni base spread over geographies and business
verticals.
About IIFT BLASH is the official International Trade Club at Indian Institute of Foreign Trade. The club focuses on provid-ing a platform for the student community to learn and discuss about various aspects of In-ternational trade. Besides releasing the monthly newsletter, the club organizes vari-ous guest lectures, sessions, corporate interactions, quizzes, live-projects and com-petitions for the stu-dent community at IIFT
INDIAN INSTITUTE OF FOREIGN TRADE
IIFT Bhawan
B - 21, Qutab Institutional Area
New Delhi - 110016
Phone: +91 11 26853055
Fax: +91 11 2685 3956
BLASH COORDINATORS:
Amit Sharma (+919899219807, [email protected]) Kamal Raju Gotte (+919650637712, [email protected])
Puneet Garg (+917838872848, [email protected])
TRADE WINDS EDITORIAL TEAM:
S.V.Praneet Varma (+918447574308, [email protected]) Chief Editor
Pavan Chandramouli (+919990925135,[email protected]) Editor
About BLASH
Send in your entries to [email protected]
Articles Invited for Next Issue of
TradeWinds