trade policy and prospects - dfat.gov.au · trade policy and prospects key points ... intermediate...
TRANSCRIPT
C h a p t e r 5
P A G E 111
TRADE POLICY AND PROSPECTS
KEY POINTS
• Oil dominates regional exports and oil prices drive imports.
Historical import to oil price relationships suggest higher oil prices
will generate 15 to 20 per cent import growth in 2000 and 2001.
However, once oil prices stabilise or fall, OPEC quotas will constrain
export and import growth.
• Reducing oil dependence is a gradual process but rapid gas export
growth will assist it.
• Unlike exports, Gulf imports are diverse. Reflecting the oil industry’s
capital intensity, capital goods dominate all Gulf economies’ imports.
The UAE’s entrepot role means consumer goods imports are particularly
important for the UAE, while Iran’s diverse economy and protectionist
policies means intermediate product imports are important.
• The UAE is expected to remain the dominant Gulf entrepot, despite
increased competition from Salalah in Oman and Aden in Yemen. Its
re-exports are about four times the level of other non-oil exports,
and between 1990 and 1998, doubled to US$11 billion.
• World Trade Organization, WTO, membership is driving reform
in critical areas including intellectual property protection,
agency arrangements, foreign investment equity restrictions,
telecommunications market access, and agricultural trade policy.
A C C E S S I N G T H E M I D D L E E A S T
B U S I N E S S O P P O R T U N I T I E S I N T H E A R A B I A N P E N I N S U L A A N D I R A N
P A G E 112
The Gulf region has a long trading history. Its strategic location between Asia and Europe, and
uneven distribution of arable land and fresh water put it on major trade routes from the earliest times,
ensuring local tribes engaged in trade. In the eighteenth and nineteenth century, the Gulf region
became a major transhipment point between Europe and Asia. Gulf economies are now the hub of
the world’s oil trade, supplying two thirds of globally traded oil.
This chapter examines the Gulf economies’ recent merchandise trade developments and performance,
highlighting the most dynamic sectors. It then analyses intra-regional trade and regional re-export
centres. Finally, it examines regional trade reform progress, much induced by World Trade
Organization, WTO, membership and membership applications, and assesses restraints to trade
imposed by tariffs and non-tariff barriers.
THE IMPORTANCE OF TRADE IN THE GULF ECONOMIES
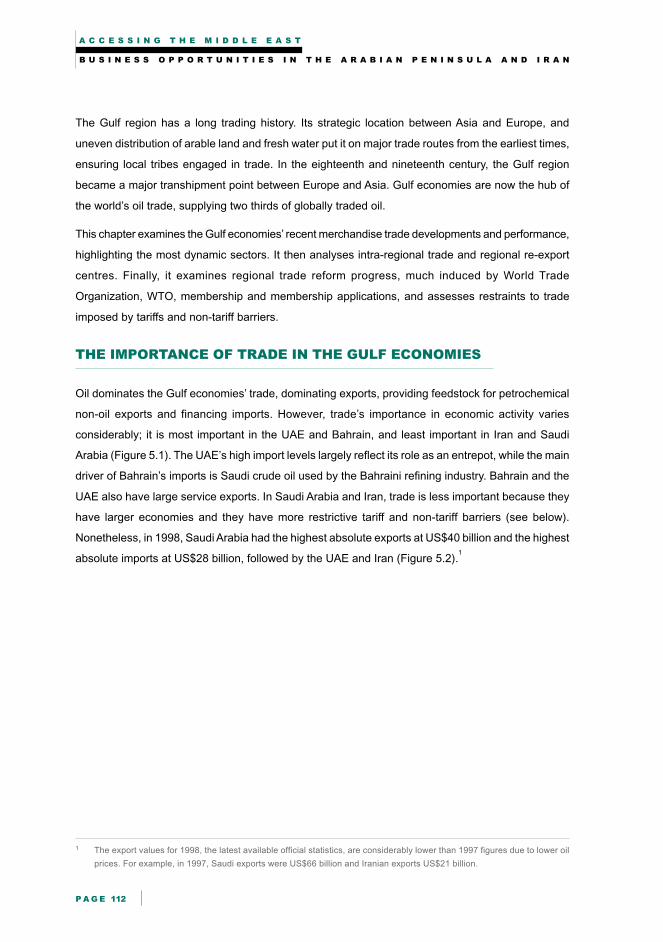
Oil dominates the Gulf economies’ trade, dominating exports, providing feedstock for petrochemical
non-oil exports and financing imports. However, trade’s importance in economic activity varies
considerably; it is most important in the UAE and Bahrain, and least important in Iran and Saudi
Arabia (Figure 5.1). The UAE’s high import levels largely reflect its role as an entrepot, while the main
driver of Bahrain’s imports is Saudi crude oil used by the Bahraini refining industry. Bahrain and the
UAE also have large service exports. In Saudi Arabia and Iran, trade is less important because they
have larger economies and they have more restrictive tariff and non-tariff barriers (see below).
Nonetheless, in 1998, Saudi Arabia had the highest absolute exports at US$40 billion and the highest
absolute imports at US$28 billion, followed by the UAE and Iran (Figure 5.2).1
1 The export values for 1998, the latest available official statistics, are considerably lower than 1997 figures due to lower oil
prices. For example, in 1997, Saudi exports were US$66 billion and Iranian exports US$21 billion.
T r a d e
P A G E 113
US
$ b
illio
n
0
5
10
15
20
25
30
35
40
45
Saudi Arabia UAE Iran Kuwait Oman Qatar Bahrain Yemen
Exports
Imports
F i g u r e 5 . 1
Gulf Region Has Relatively Open Economies
Ratio of Merchandise Exports and Imports to GDP, 1998
Source: Datastream, 2000; and Department of Foreign Affairs and Trade, 2000a.
F i g u r e 5 . 2
Saudi Arabia, the UAE, Iran and Kuwait Dominate Regional Trade
Gulf Merchandise Exports and Imports, 1998, US Dollars
Note: International Economic Data Bank data for exports and imports were used for all economies except Saudi Arabia, where oil export
data was clearly understated. Business Monitor International data were used for Saudi exports for 1998.
Source: International Economic Data Bank, 2000; and Business Monitor International, 2000a.
Pe
r ce
nt
0
10
20
30
40
50
60
70
Bahrain Yemen APECAverage
Qatar Oman Kuwait SaudiArabia
Australia Iran
Exports to GDP
Imports to GDP
A C C E S S I N G T H E M I D D L E E A S T
B U S I N E S S O P P O R T U N I T I E S I N T H E A R A B I A N P E N I N S U L A A N D I R A N
P A G E 114
2 For example, following the oil prices of US$23 per barrel in 1990 and US$19.40 per barrel in 1991, import growth of 18.5 per
cent was recorded in 1991, with growth of 21.1 per cent recorded in 1992.
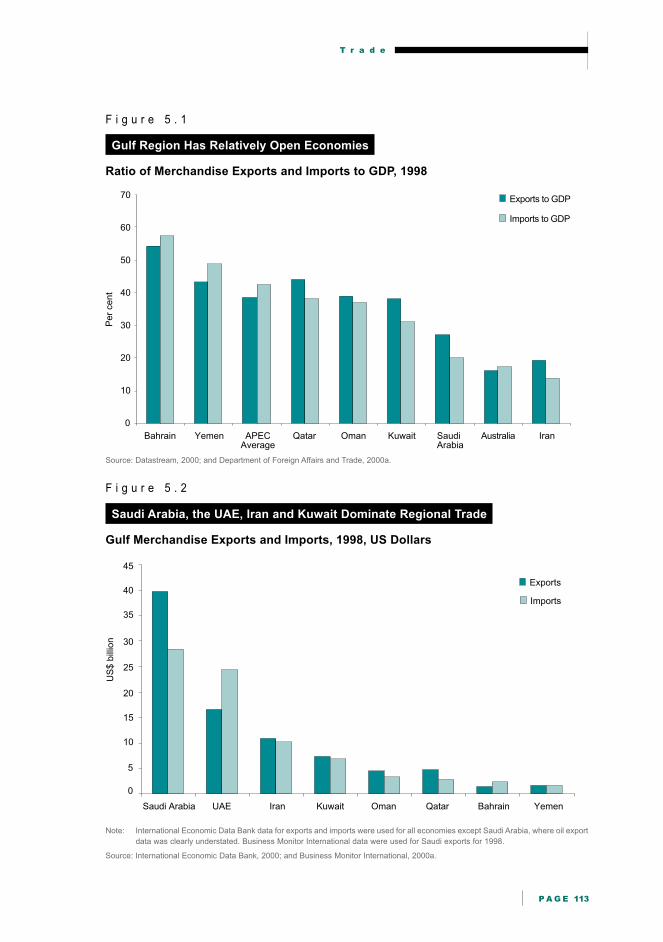
F i g u r e 5 . 3
Gulf Trade Growth Slower than World Average
US Dollar Export and Import Growth, 1993-98, Per cent
Note: Data range was chosen to reduce the impact of the Gulf war.
Source: Business Monitor International, 2000a; Gulf Cooperation Council, 1999; and International Monetary Fund, 1999.
TRADE GROWTH
Between 1993 and 1998, most regional economies’ trade grew slowly, well below the world
average, due to their dependence on quota restricted oil (Figure 5.3). Export growth was strongest
in the small economies of Qatar and Yemen, and the most dynamic import markets were Qatar
and the UAE (Figure 5.3).
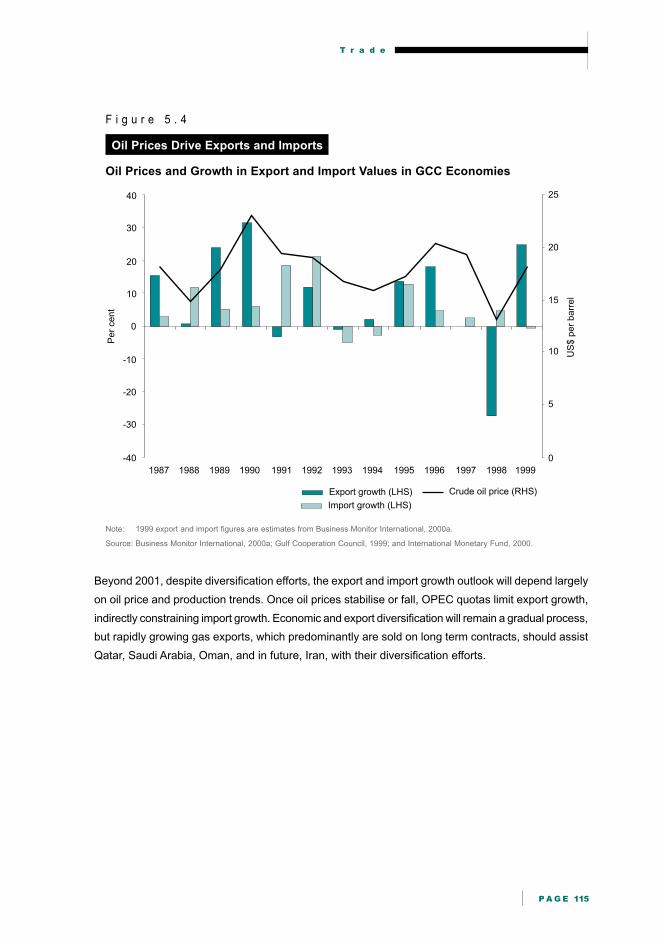
The Impact of High Oil Prices in 2000
Oil prices rose rapidly from their low of below US$10 per barrel in December 1998 to over
US$25 since December 1999; this expanded Gulf Cooperation Council, GCC, economies’ exports by
an estimated 25 per cent in 1999 (Figure 5.4). Effects on imports lag about a year, but on past
experience, imports should grow 15 to 20 per cent in 2000 and 2001.2
Pe
r ce
nt
-10
-5
0
5
10
15
20
25
30
35
40
Qatar Yemen UAE World Oman Kuwait SaudiArabia
Bahrain Iran
Imports Exports
T r a d e
P A G E 115
F i g u r e 5 . 4
Oil Prices Drive Exports and Imports
Oil Prices and Growth in Export and Import Values in GCC Economies
Note: 1999 export and import figures are estimates from Business Monitor International, 2000a.
Source: Business Monitor International, 2000a; Gulf Cooperation Council, 1999; and International Monetary Fund, 2000.
Beyond 2001, despite diversification efforts, the export and import growth outlook will depend largely
on oil price and production trends. Once oil prices stabilise or fall, OPEC quotas limit export growth,
indirectly constraining import growth. Economic and export diversification will remain a gradual process,
but rapidly growing gas exports, which predominantly are sold on long term contracts, should assist
Qatar, Saudi Arabia, Oman, and in future, Iran, with their diversification efforts.
Per
cent
US
$ p
er
barr
el
-40
-30
-20
-10
0
10
20
30
40
1987 1988 1989 1990 1991 1992 1993 1994 1995 1996 1997 1998 1999
0
5
10
15
20
25
Export growth (LHS)
Import growth (LHS)
Crude oil price (RHS)
A C C E S S I N G T H E M I D D L E E A S T
B U S I N E S S O P P O R T U N I T I E S I N T H E A R A B I A N P E N I N S U L A A N D I R A N
P A G E 116
US
$ b
illio
n
0
5
10
15
20
25
30
35
40
45
50
55
60
1987 1988 1989 1990 1991 1992 1993 1994 1995 1996 1997 1998
Non-electrical machinery
Industrial measuring instrumentsand clocks
Clothing
Transport equipmentElectrical machinery
Iron and steel
Other metal manufacturesOther non-metal mineral manufactures
Textiles and fabricsCereals and cereal preparations
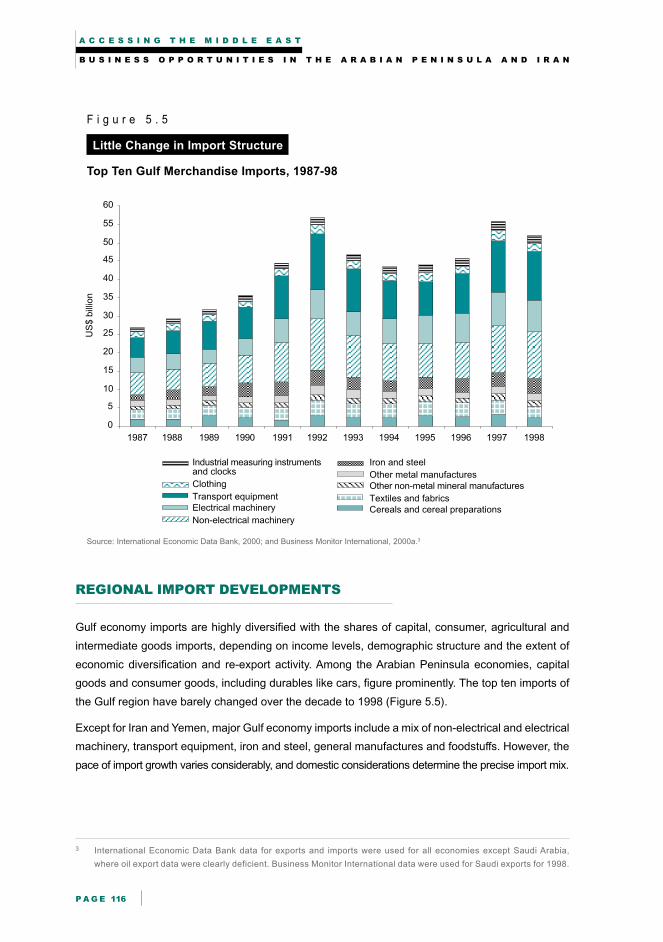
F i g u r e 5 . 5
Little Change in Import Structure
Top Ten Gulf Merchandise Imports, 1987-98
Source: International Economic Data Bank, 2000; and Business Monitor International, 2000a.3
REGIONAL IMPORT DEVELOPMENTS
Gulf economy imports are highly diversified with the shares of capital, consumer, agricultural and
intermediate goods imports, depending on income levels, demographic structure and the extent of
economic diversification and re-export activity. Among the Arabian Peninsula economies, capital
goods and consumer goods, including durables like cars, figure prominently. The top ten imports of
the Gulf region have barely changed over the decade to 1998 (Figure 5.5).
Except for Iran and Yemen, major Gulf economy imports include a mix of non-electrical and electrical
machinery, transport equipment, iron and steel, general manufactures and foodstuffs. However, the
pace of import growth varies considerably, and domestic considerations determine the precise import mix.
3 International Economic Data Bank data for exports and imports were used for all economies except Saudi Arabia,
where oil export data were clearly deficient. Business Monitor International data were used for Saudi exports for 1998.
T r a d e
P A G E 117
0 1 000 2 000 3 000 4 000 5 000 6 000 7 000
Non-ferrous metals
Other manufactured goods
Medicinal products
Clothing
Textiles and fabrics
Cereals and cerealpreparations
Iron and steel
Electrical machinery
Non-electrical machinery
Transport equipment
US$ million
199619971998
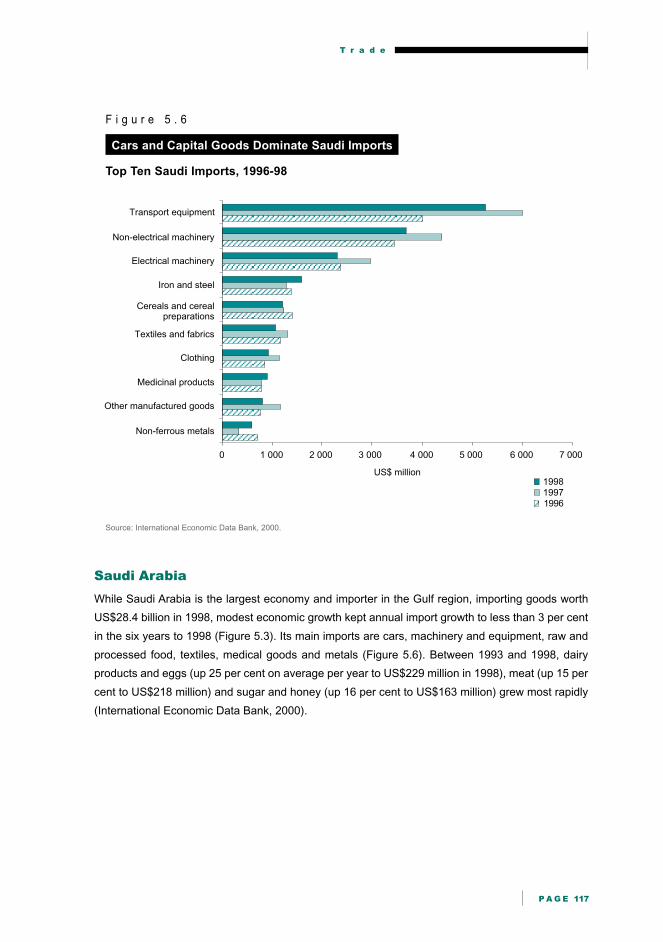
F i g u r e 5 . 6
Cars and Capital Goods Dominate Saudi Imports
Top Ten Saudi Imports, 1996-98
Source: International Economic Data Bank, 2000.
Saudi Arabia
While Saudi Arabia is the largest economy and importer in the Gulf region, importing goods worth
US$28.4 billion in 1998, modest economic growth kept annual import growth to less than 3 per cent
in the six years to 1998 (Figure 5.3). Its main imports are cars, machinery and equipment, raw and
processed food, textiles, medical goods and metals (Figure 5.6). Between 1993 and 1998, dairy
products and eggs (up 25 per cent on average per year to US$229 million in 1998), meat (up 15 per
cent to US$218 million) and sugar and honey (up 16 per cent to US$163 million) grew most rapidly
(International Economic Data Bank, 2000).
A C C E S S I N G T H E M I D D L E E A S T
B U S I N E S S O P P O R T U N I T I E S I N T H E A R A B I A N P E N I N S U L A A N D I R A N
P A G E 118
0 500 1 000 1 500 2 000 2 500 3 000 3 500 4 000 4 500
Household chemicals
Clothing
Industrial measuringinstruments and clocks
Other manufacturedgoods
Electrical machinery
$US million
Non-electricalmachinery
Transport equipment
Textiles and fabrics
Iron and steel
Other metalmanufactures
199619971998
US$ million
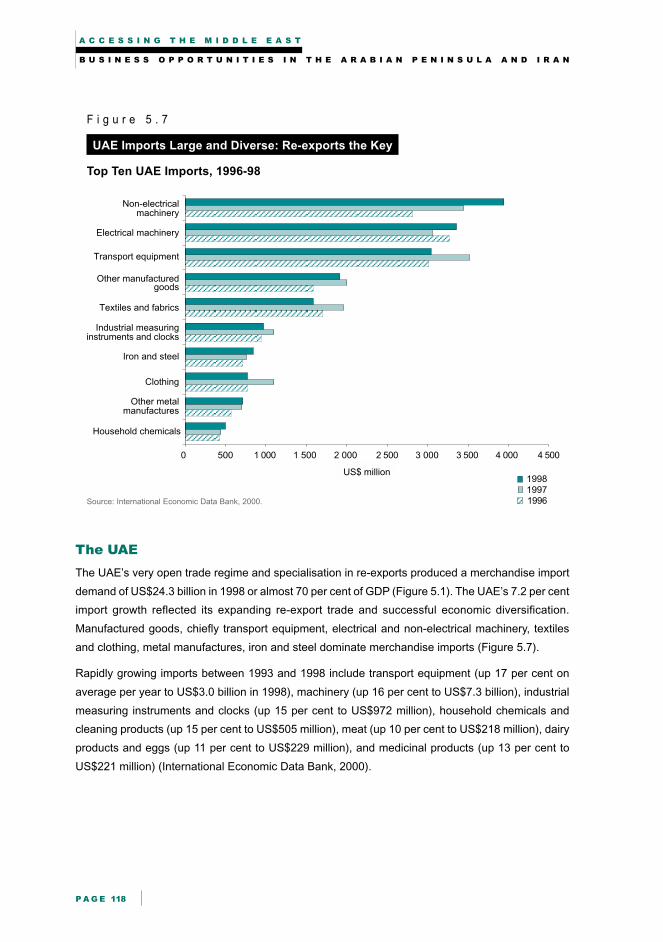
F i g u r e 5 . 7
UAE Imports Large and Diverse: Re-exports the Key
Top Ten UAE Imports, 1996-98
Source: International Economic Data Bank, 2000.
The UAE
The UAE’s very open trade regime and specialisation in re-exports produced a merchandise import
demand of US$24.3 billion in 1998 or almost 70 per cent of GDP (Figure 5.1). The UAE’s 7.2 per cent
import growth reflected its expanding re-export trade and successful economic diversification.
Manufactured goods, chiefly transport equipment, electrical and non-electrical machinery, textiles
and clothing, metal manufactures, iron and steel dominate merchandise imports (Figure 5.7).
Rapidly growing imports between 1993 and 1998 include transport equipment (up 17 per cent on
average per year to US$3.0 billion in 1998), machinery (up 16 per cent to US$7.3 billion), industrial
measuring instruments and clocks (up 15 per cent to US$972 million), household chemicals and
cleaning products (up 15 per cent to US$505 million), meat (up 10 per cent to US$218 million), dairy
products and eggs (up 11 per cent to US$229 million), and medicinal products (up 13 per cent to
US$221 million) (International Economic Data Bank, 2000).
T r a d e
P A G E 119
0 500 1 000 1 500 2 000 2 500
Animal feedstuffs
Medical products
Cereals and cerealpreparations
Iron and steel
Electrical machinery
US$ million
Non-electricalmachinery
Transport equipment
Vegetable oil
Chemicals
Paper andpaperboard
199619971998
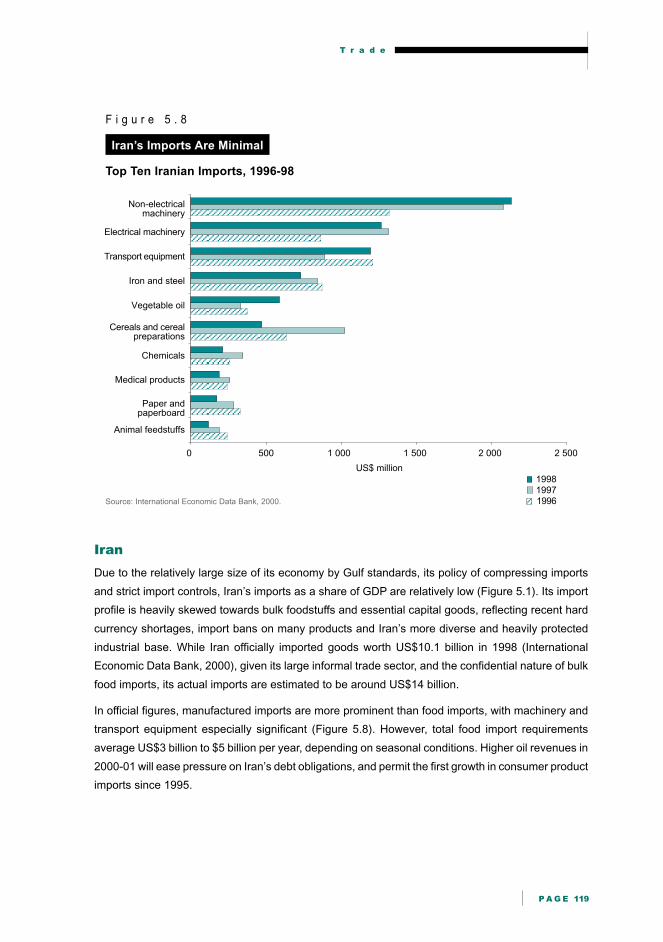
F i g u r e 5 . 8
Iran’s Imports Are Minimal
Top Ten Iranian Imports, 1996-98
Source: International Economic Data Bank, 2000.
Iran
Due to the relatively large size of its economy by Gulf standards, its policy of compressing imports
and strict import controls, Iran’s imports as a share of GDP are relatively low (Figure 5.1). Its import
profile is heavily skewed towards bulk foodstuffs and essential capital goods, reflecting recent hard
currency shortages, import bans on many products and Iran’s more diverse and heavily protected
industrial base. While Iran officially imported goods worth US$10.1 billion in 1998 (International
Economic Data Bank, 2000), given its large informal trade sector, and the confidential nature of bulk
food imports, its actual imports are estimated to be around US$14 billion.
In official figures, manufactured imports are more prominent than food imports, with machinery and
transport equipment especially significant (Figure 5.8). However, total food import requirements
average US$3 billion to $5 billion per year, depending on seasonal conditions. Higher oil revenues in
2000-01 will ease pressure on Iran’s debt obligations, and permit the first growth in consumer product
imports since 1995.
A C C E S S I N G T H E M I D D L E E A S T
B U S I N E S S O P P O R T U N I T I E S I N T H E A R A B I A N P E N I N S U L A A N D I R A N
P A G E 120
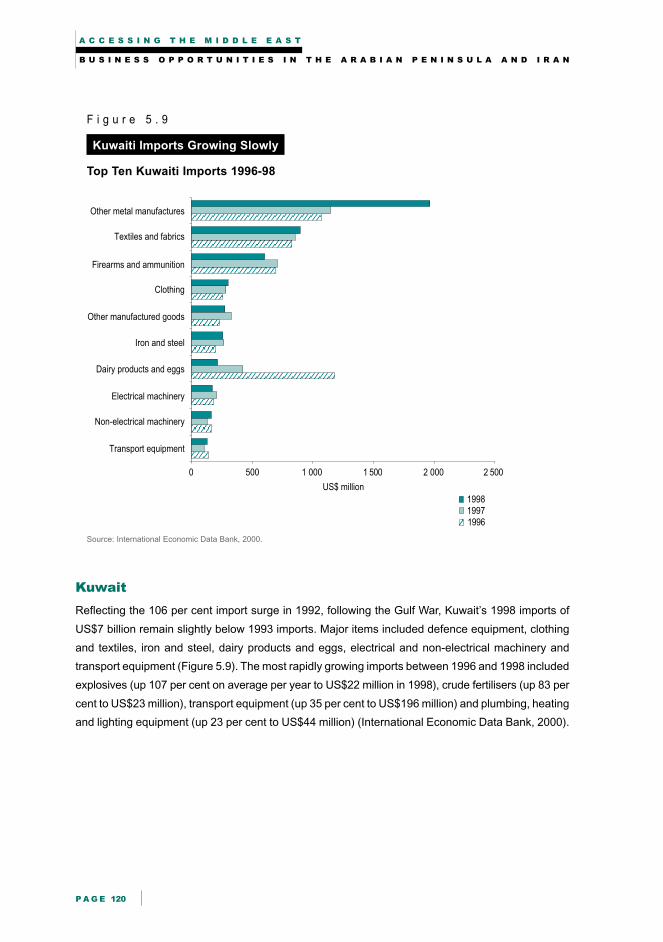
F i g u r e 5 . 9
Kuwaiti Imports Growing Slowly
Top Ten Kuwaiti Imports 1996-98
Source: International Economic Data Bank, 2000.
Kuwait
Reflecting the 106 per cent import surge in 1992, following the Gulf War, Kuwait’s 1998 imports of
US$7 billion remain slightly below 1993 imports. Major items included defence equipment, clothing
and textiles, iron and steel, dairy products and eggs, electrical and non-electrical machinery and
transport equipment (Figure 5.9). The most rapidly growing imports between 1996 and 1998 included
explosives (up 107 per cent on average per year to US$22 million in 1998), crude fertilisers (up 83 per
cent to US$23 million), transport equipment (up 35 per cent to US$196 million) and plumbing, heating
and lighting equipment (up 23 per cent to US$44 million) (International Economic Data Bank, 2000).
0 500 1 000 1 500 2 000 2 500
Transport equipment
Non-electrical machinery
Electrical machinery
Dairy products and eggs
Iron and steel
Other manufactured goods
Clothing
Firearms and ammunition
Textiles and fabrics
Other metal manufactures
US$ million
199619971998
T r a d e
P A G E 121
0 200 400 600 800 1 000 1 200
Fruit and vegetables
Cereals and cerealpreparations
Tobacco
Non-metallic minerals
Textiles and fabrics
Other manufactured goods
Iron and steel
Electrical machinery
Transport equipment
Non-electrical machinery
US$ million
199619971998
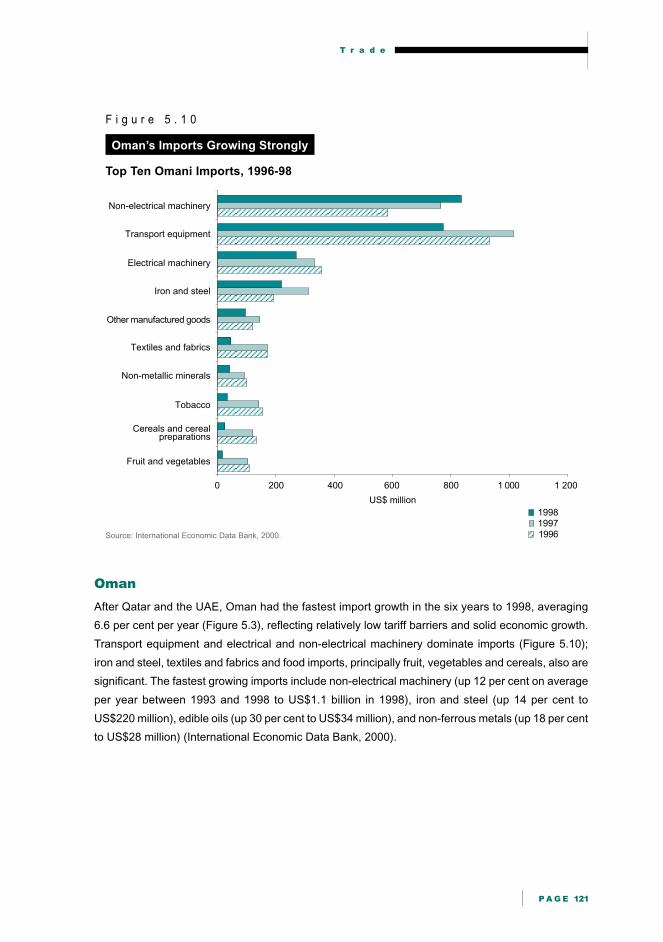
F i g u r e 5 . 1 0
Oman’s Imports Growing Strongly
Top Ten Omani Imports, 1996-98
Source: International Economic Data Bank, 2000.
Oman
After Qatar and the UAE, Oman had the fastest import growth in the six years to 1998, averaging
6.6 per cent per year (Figure 5.3), reflecting relatively low tariff barriers and solid economic growth.
Transport equipment and electrical and non-electrical machinery dominate imports (Figure 5.10);
iron and steel, textiles and fabrics and food imports, principally fruit, vegetables and cereals, also are
significant. The fastest growing imports include non-electrical machinery (up 12 per cent on average
per year between 1993 and 1998 to US$1.1 billion in 1998), iron and steel (up 14 per cent to
US$220 million), edible oils (up 30 per cent to US$34 million), and non-ferrous metals (up 18 per cent
to US$28 million) (International Economic Data Bank, 2000).
A C C E S S I N G T H E M I D D L E E A S T
B U S I N E S S O P P O R T U N I T I E S I N T H E A R A B I A N P E N I N S U L A A N D I R A N
P A G E 122
0 200 400 600 800 1 000 1 200
Dairy products and eggs
Textiles and fabrics
Non-metallic minerals
Industrial measuringinstruments and clocks
Other metalmanufactures
Other manufacturedgoods
Iron and steel
Electrical machinery
Transport equipment
Non-electrical machinery
US$ million
199619971998
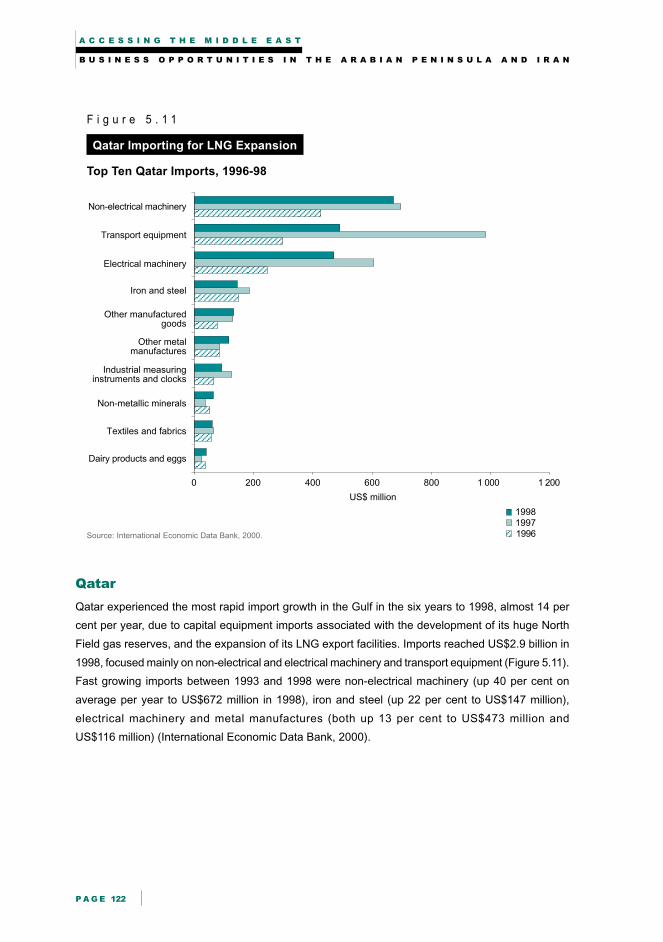
F i g u r e 5 . 1 1
Qatar Importing for LNG Expansion
Top Ten Qatar Imports, 1996-98
Source: International Economic Data Bank, 2000.
Qatar
Qatar experienced the most rapid import growth in the Gulf in the six years to 1998, almost 14 per
cent per year, due to capital equipment imports associated with the development of its huge North
Field gas reserves, and the expansion of its LNG export facilities. Imports reached US$2.9 billion in
1998, focused mainly on non-electrical and electrical machinery and transport equipment (Figure 5.11).
Fast growing imports between 1993 and 1998 were non-electrical machinery (up 40 per cent on
average per year to US$672 million in 1998), iron and steel (up 22 per cent to US$147 million),
electrical machinery and metal manufactures (both up 13 per cent to US$473 million and
US$116 million) (International Economic Data Bank, 2000).
T r a d e
P A G E 123
0 50 100 150 200 250 300 350 400 450
Dairy products and eggs
Industrial measuringinstruments and clocks
Other metal manufactures
Textiles and fabrics
Non-metallic minerals
Special transactions
Other miscellaneousmanufactured goods
Electrical machinery
Transport equipment
Non-electrical machinery
US$ million
199619971998
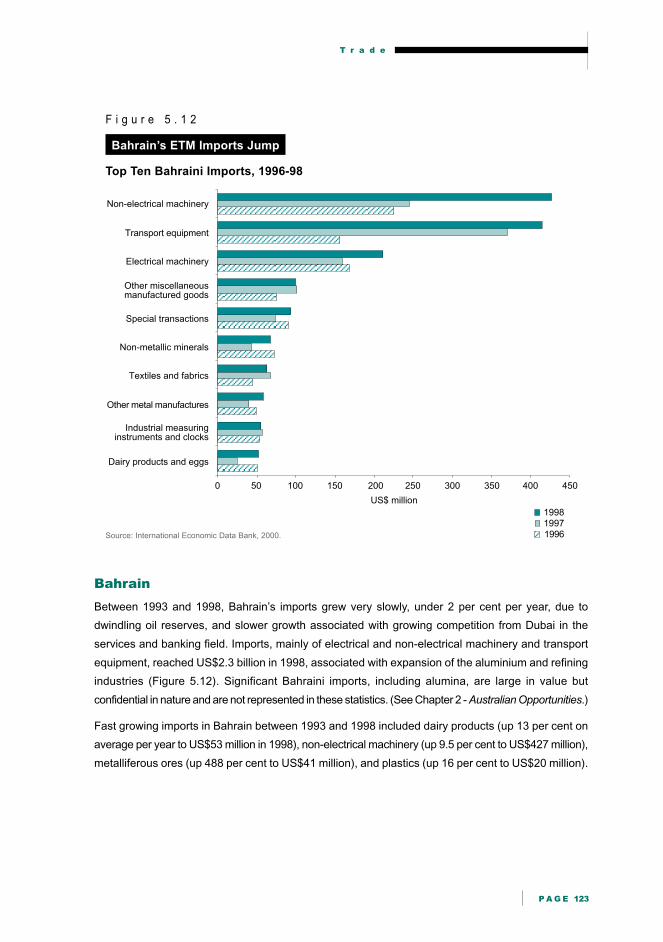
F i g u r e 5 . 1 2
Bahrain’s ETM Imports Jump
Top Ten Bahraini Imports, 1996-98
Source: International Economic Data Bank, 2000.
Bahrain
Between 1993 and 1998, Bahrain’s imports grew very slowly, under 2 per cent per year, due to
dwindling oil reserves, and slower growth associated with growing competition from Dubai in the
services and banking field. Imports, mainly of electrical and non-electrical machinery and transport
equipment, reached US$2.3 billion in 1998, associated with expansion of the aluminium and refining
industries (Figure 5.12). Significant Bahraini imports, including alumina, are large in value but
confidential in nature and are not represented in these statistics. (See Chapter 2 - Australian Opportunities.)
Fast growing imports in Bahrain between 1993 and 1998 included dairy products (up 13 per cent on
average per year to US$53 million in 1998), non-electrical machinery (up 9.5 per cent to US$427 million),
metalliferous ores (up 488 per cent to US$41 million), and plastics (up 16 per cent to US$20 million).
A C C E S S I N G T H E M I D D L E E A S T
B U S I N E S S O P P O R T U N I T I E S I N T H E A R A B I A N P E N I N S U L A A N D I R A N
P A G E 124
0 50 100 150 200 250 300
Petroleum andpetroleum products
Other rubber manufactures
Textiles and fabrics
Sugar, molassesand honey
Vegetable oil
Dairy products and eggs
Transport equipment
Iron and steel
Electrical machinery
Non-electrical machinery
US$ million
199619971998
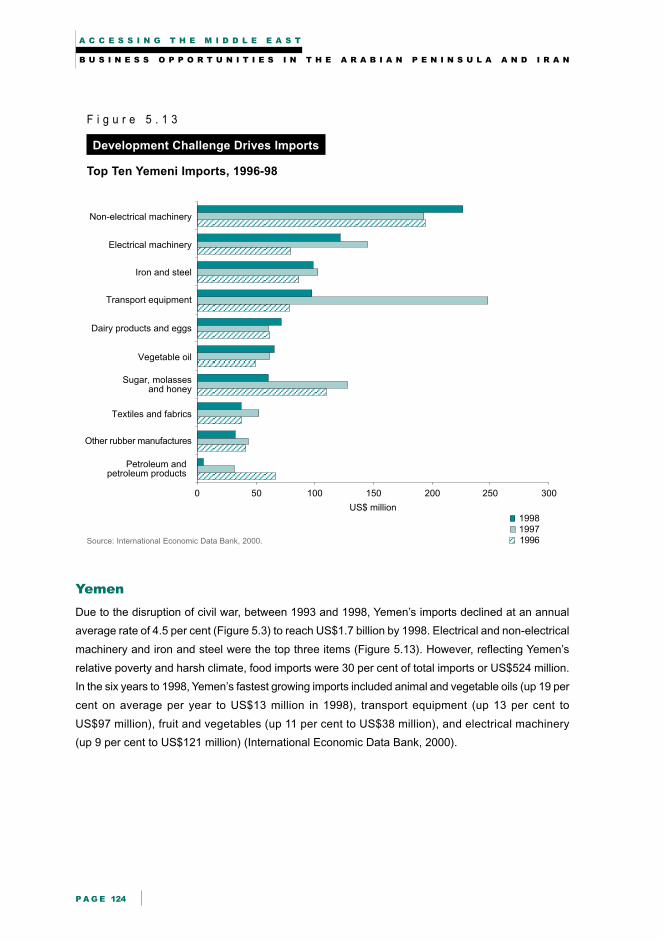
F i g u r e 5 . 1 3
Development Challenge Drives Imports
Top Ten Yemeni Imports, 1996-98
Source: International Economic Data Bank, 2000.
Yemen
Due to the disruption of civil war, between 1993 and 1998, Yemen’s imports declined at an annual
average rate of 4.5 per cent (Figure 5.3) to reach US$1.7 billion by 1998. Electrical and non-electrical
machinery and iron and steel were the top three items (Figure 5.13). However, reflecting Yemen’s
relative poverty and harsh climate, food imports were 30 per cent of total imports or US$524 million.
In the six years to 1998, Yemen’s fastest growing imports included animal and vegetable oils (up 19 per
cent on average per year to US$13 million in 1998), transport equipment (up 13 per cent to
US$97 million), fruit and vegetables (up 11 per cent to US$38 million), and electrical machinery
(up 9 per cent to US$121 million) (International Economic Data Bank, 2000).
T r a d e
P A G E 125
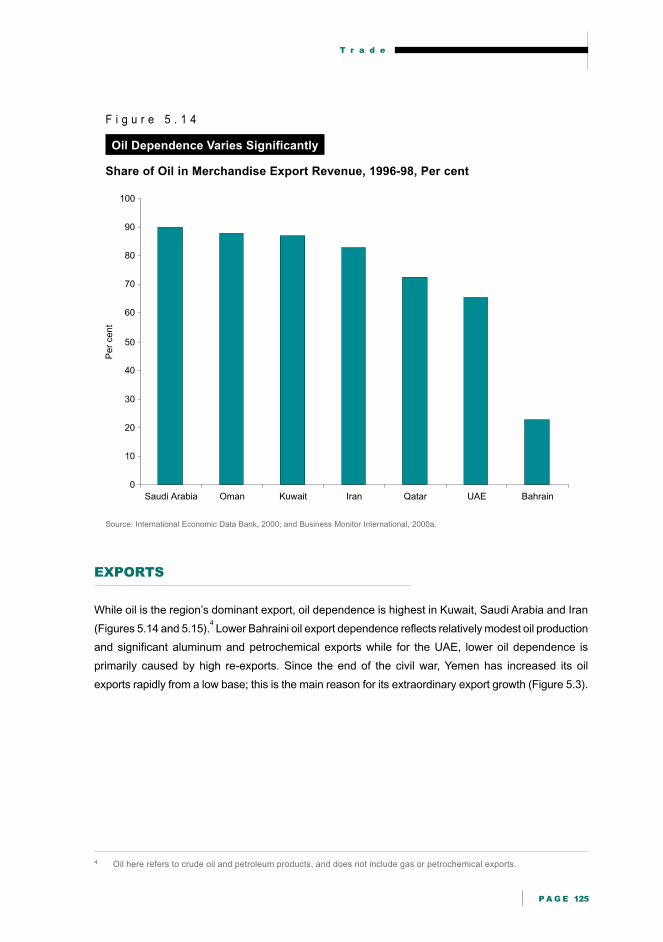
F i g u r e 5 . 1 4
Oil Dependence Varies Significantly
Share of Oil in Merchandise Export Revenue, 1996-98, Per cent
Source: International Economic Data Bank, 2000; and Business Monitor International, 2000a.
EXPORTS
While oil is the region’s dominant export, oil dependence is highest in Kuwait, Saudi Arabia and Iran
(Figures 5.14 and 5.15).4 Lower Bahraini oil export dependence reflects relatively modest oil production
and significant aluminum and petrochemical exports while for the UAE, lower oil dependence is
primarily caused by high re-exports. Since the end of the civil war, Yemen has increased its oil
exports rapidly from a low base; this is the main reason for its extraordinary export growth (Figure 5.3).
4 Oil here refers to crude oil and petroleum products, and does not include gas or petrochemical exports.
Pe
r ce
nt
0
10
20
30
40
50
60
70
80
90
100
Saudi Arabia Oman Kuwait Iran Qatar UAE Bahrain
A C C E S S I N G T H E M I D D L E E A S T
B U S I N E S S O P P O R T U N I T I E S I N T H E A R A B I A N P E N I N S U L A A N D I R A N
P A G E 126
US
$ b
illio
n
0
5
10
15
20
25
30
35
Oil Exports Manufactures Other Agriculture
IranUAESaudi Arabia
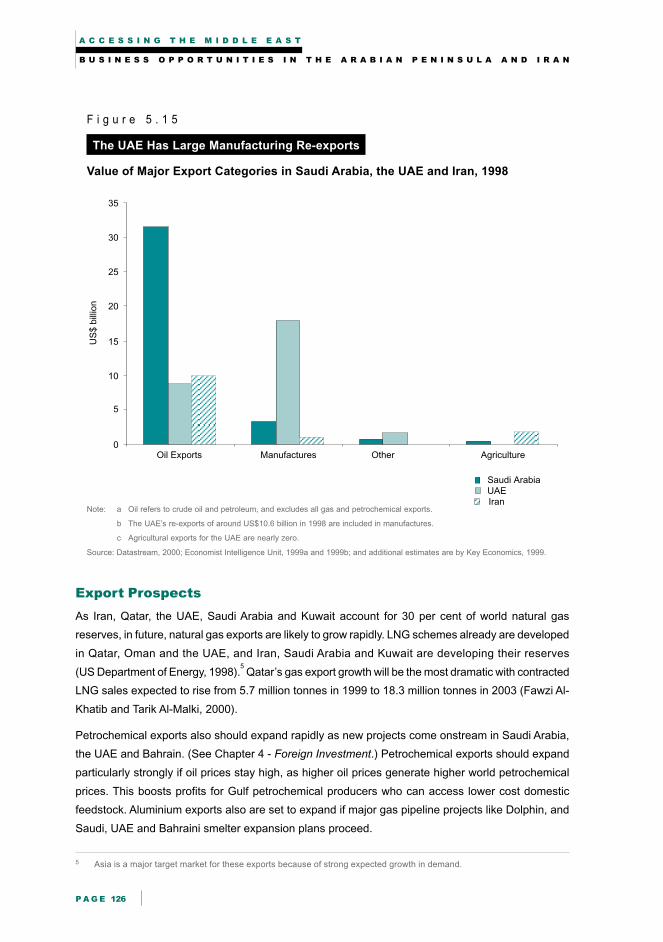
F i g u r e 5 . 1 5
The UAE Has Large Manufacturing Re-exports
Value of Major Export Categories in Saudi Arabia, the UAE and Iran, 1998
Note: a Oil refers to crude oil and petroleum, and excludes all gas and petrochemical exports.
b The UAE’s re-exports of around US$10.6 billion in 1998 are included in manufactures.
c Agricultural exports for the UAE are nearly zero.
Source: Datastream, 2000; Economist Intelligence Unit, 1999a and 1999b; and additional estimates are by Key Economics, 1999.
Export Prospects
As Iran, Qatar, the UAE, Saudi Arabia and Kuwait account for 30 per cent of world natural gas
reserves, in future, natural gas exports are likely to grow rapidly. LNG schemes already are developed
in Qatar, Oman and the UAE, and Iran, Saudi Arabia and Kuwait are developing their reserves
(US Department of Energy, 1998).5 Qatar’s gas export growth will be the most dramatic with contracted
LNG sales expected to rise from 5.7 million tonnes in 1999 to 18.3 million tonnes in 2003 (Fawzi Al-
Khatib and Tarik Al-Malki, 2000).
Petrochemical exports also should expand rapidly as new projects come onstream in Saudi Arabia,
the UAE and Bahrain. (See Chapter 4 - Foreign Investment.) Petrochemical exports should expand
particularly strongly if oil prices stay high, as higher oil prices generate higher world petrochemical
prices. This boosts profits for Gulf petrochemical producers who can access lower cost domestic
feedstock. Aluminium exports also are set to expand if major gas pipeline projects like Dolphin, and
Saudi, UAE and Bahraini smelter expansion plans proceed.
5 Asia is a major target market for these exports because of strong expected growth in demand.
T r a d e
P A G E 127
Per
cent
0
5
10
15
20
25
USA Japan UK Germany Italy Republicof Korea
France India Australia Canada
Share in total regional imports
Share in total regional exports
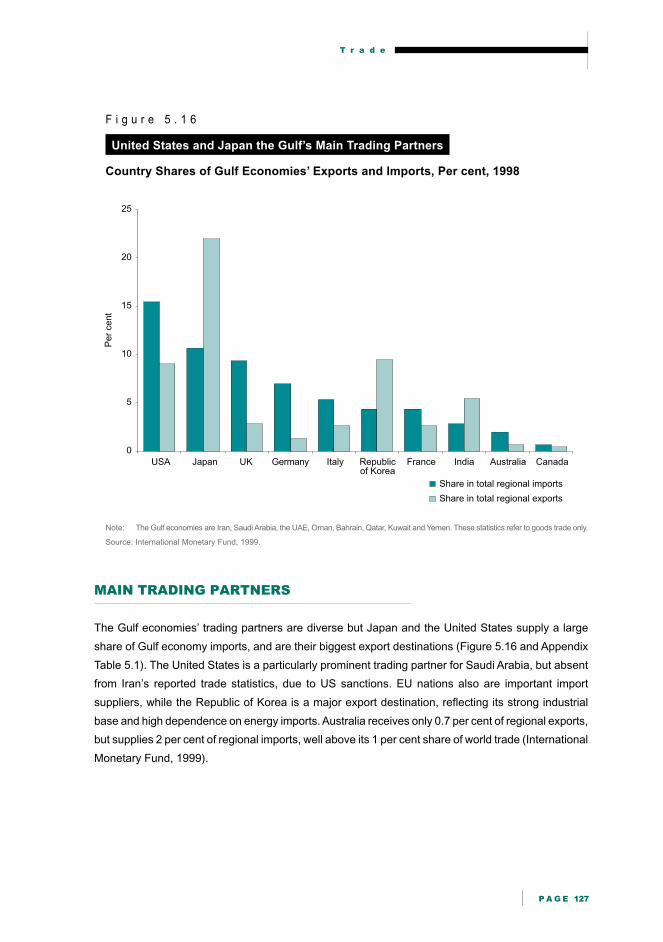
F i g u r e 5 . 1 6
United States and Japan the Gulf’s Main Trading Partners
Country Shares of Gulf Economies’ Exports and Imports, Per cent, 1998
Note: The Gulf economies are Iran, Saudi Arabia, the UAE, Oman, Bahrain, Qatar, Kuwait and Yemen. These statistics refer to goods trade only.
Source: International Monetary Fund, 1999.
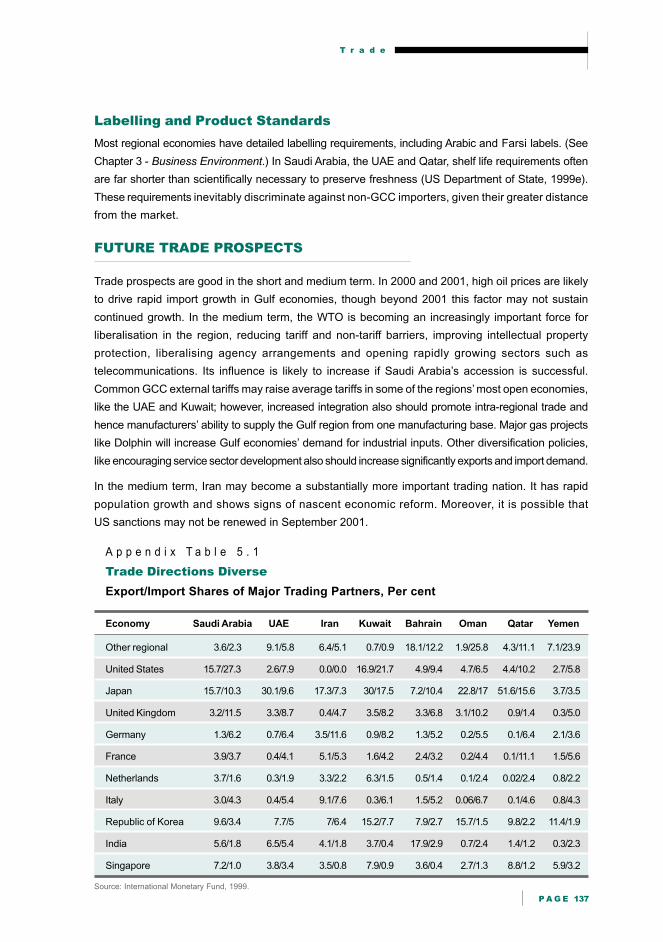
MAIN TRADING PARTNERS
The Gulf economies’ trading partners are diverse but Japan and the United States supply a large
share of Gulf economy imports, and are their biggest export destinations (Figure 5.16 and Appendix
Table 5.1). The United States is a particularly prominent trading partner for Saudi Arabia, but absent
from Iran’s reported trade statistics, due to US sanctions. EU nations also are important import
suppliers, while the Republic of Korea is a major export destination, reflecting its strong industrial
base and high dependence on energy imports. Australia receives only 0.7 per cent of regional exports,
but supplies 2 per cent of regional imports, well above its 1 per cent share of world trade (International
Monetary Fund, 1999).
A C C E S S I N G T H E M I D D L E E A S T
B U S I N E S S O P P O R T U N I T I E S I N T H E A R A B I A N P E N I N S U L A A N D I R A N
P A G E 128
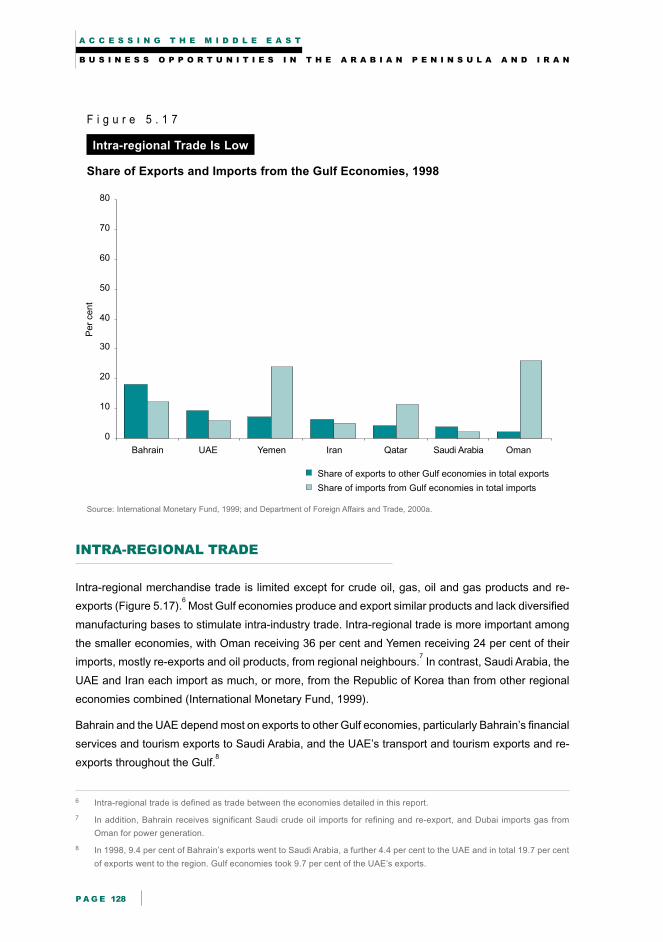
F i g u r e 5 . 1 7
Intra-regional Trade Is Low
Share of Exports and Imports from the Gulf Economies, 1998
Source: International Monetary Fund, 1999; and Department of Foreign Affairs and Trade, 2000a.
INTRA-REGIONAL TRADE
Intra-regional merchandise trade is limited except for crude oil, gas, oil and gas products and re-
exports (Figure 5.17).6 Most Gulf economies produce and export similar products and lack diversified
manufacturing bases to stimulate intra-industry trade. Intra-regional trade is more important among
the smaller economies, with Oman receiving 36 per cent and Yemen receiving 24 per cent of their
imports, mostly re-exports and oil products, from regional neighbours.7 In contrast, Saudi Arabia, the
UAE and Iran each import as much, or more, from the Republic of Korea than from other regional
economies combined (International Monetary Fund, 1999).
Bahrain and the UAE depend most on exports to other Gulf economies, particularly Bahrain’s financial
services and tourism exports to Saudi Arabia, and the UAE’s transport and tourism exports and re-
exports throughout the Gulf.8
6 Intra-regional trade is defined as trade between the economies detailed in this report.
7 In addition, Bahrain receives significant Saudi crude oil imports for refining and re-export, and Dubai imports gas from
Oman for power generation.
8 In 1998, 9.4 per cent of Bahrain’s exports went to Saudi Arabia, a further 4.4 per cent to the UAE and in total 19.7 per cent
of exports went to the region. Gulf economies took 9.7 per cent of the UAE’s exports.
Per
cent
0
10
20
30
40
50
60
70
80
Bahrain UAE Yemen Iran Qatar Saudi Arabia Oman
Share of exports to other Gulf economies in total exports
Share of imports from Gulf economies in total imports
T r a d e
P A G E 129
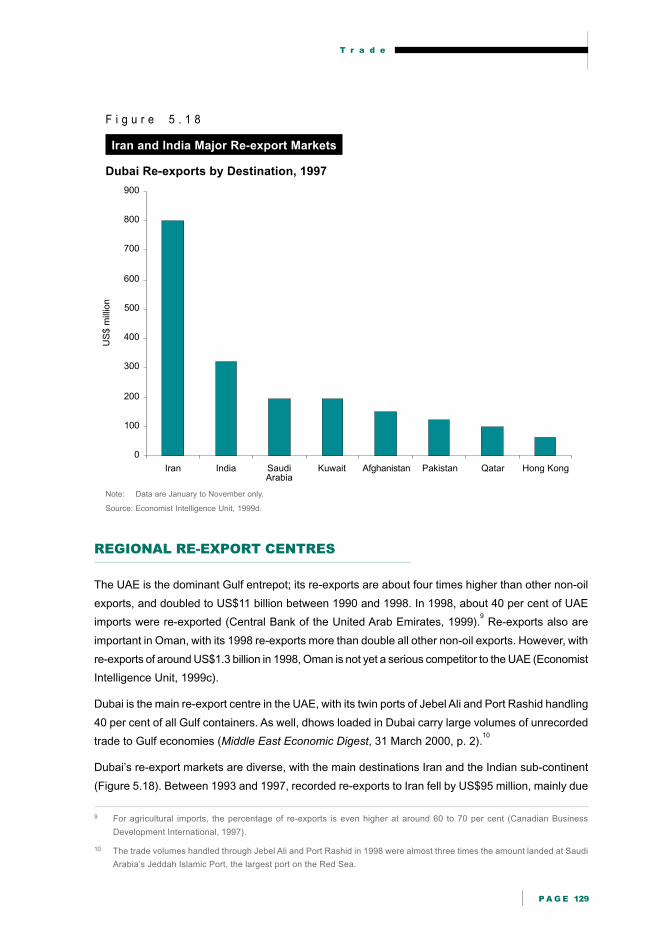
F i g u r e 5 . 1 8
Iran and India Major Re-export Markets
Dubai Re-exports by Destination, 1997
Note: Data are January to November only.
Source: Economist Intelligence Unit, 1999d.
REGIONAL RE-EXPORT CENTRES
The UAE is the dominant Gulf entrepot; its re-exports are about four times higher than other non-oil
exports, and doubled to US$11 billion between 1990 and 1998. In 1998, about 40 per cent of UAE
imports were re-exported (Central Bank of the United Arab Emirates, 1999).9 Re-exports also are
important in Oman, with its 1998 re-exports more than double all other non-oil exports. However, with
re-exports of around US$1.3 billion in 1998, Oman is not yet a serious competitor to the UAE (Economist
Intelligence Unit, 1999c).
Dubai is the main re-export centre in the UAE, with its twin ports of Jebel Ali and Port Rashid handling
40 per cent of all Gulf containers. As well, dhows loaded in Dubai carry large volumes of unrecorded
trade to Gulf economies (Middle East Economic Digest, 31 March 2000, p. 2).10
Dubai’s re-export markets are diverse, with the main destinations Iran and the Indian sub-continent
(Figure 5.18). Between 1993 and 1997, recorded re-exports to Iran fell by US$95 million, mainly due
9 For agricultural imports, the percentage of re-exports is even higher at around 60 to 70 per cent (Canadian Business
Development International, 1997).
10 The trade volumes handled through Jebel Ali and Port Rashid in 1998 were almost three times the amount landed at Saudi
Arabia’s Jeddah Islamic Port, the largest port on the Red Sea.
US
$ m
illio
n
0
100
200
300
400
500
600
700
800
900
Iran India SaudiArabia
Kuwait Afghanistan Pakistan Qatar Hong Kong
A C C E S S I N G T H E M I D D L E E A S T
B U S I N E S S O P P O R T U N I T I E S I N T H E A R A B I A N P E N I N S U L A A N D I R A N
P A G E 130
to Iran’s foreign exchange shortages. However, this decline was more than offset by growth in re-
exports to India, up from US$98 million in 1993 to US$320 million in 1997, as Indian economic
growth improved (Economist Intelligence Unit, 1999d).
Dubai’s Prospects
Competition for Dubai’s re-export business is increasing, mainly from Oman and Yemen. Oman is
looking to the new port of Salalah, managed by Maersk Sealand to increase its re-exports further. By
mid 2000, Maersk Sealand had diverted around 30 per cent of its transhipments from Dubai to
Salalah, with much of Salalah’s other throughput coming from less efficient ports outside the Gulf,
such as Colombo (Middle East Economic Digest, 31 March 2000, p. 2). Nonetheless, in 1999, Dubai
ports’ throughput increased by 1.4 per cent, down on the 7.7 per cent increase of 1998, but impressive
given reduced Maersk Sealand business.
Yemen plans to expand throughput in Aden by using its strategic location at the entrance to the Red
Sea leading to the Suez Canal. Its prospects are boosted by the 60 per cent equity share taken by
the Port of Singapore Authority (Gulf Business, 2000).
One major factor underpinning the continued attractiveness of Dubai and other UAE ports as re-
export centres is the UAE’s considerable internal market. The UAE’s GDP of US$49 billion and per
capita GDP of US$15 100 compares favourably with Oman’s US$14 billion GDP and US$6 120 per
capita income and Yemen’s US$5.6 billion GDP and tiny US$340 per capita income.11
Domestic
market size matters, as ports with larger domestic markets offer more back loading potential and
lower average transport costs for primary cargoes.
Dubai’s record of efficient operations also will underpin its continued central role as a trade hub.
Reflecting their high efficiency, Dubai’s ports have the highest crane utilisation rates in the region
(Middle East Economic Digest, 31 March 2000, p. 2).
EFFECTS OF WTO MEMBERSHIP ON REFORM
WTO membership and associated trade liberalisation is critical for the region’s future economic
prospects, lifting economic growth and boosting foreign investor confidence (Borland, 2000). Bahrain,
Kuwait, Qatar and the UAE are all WTO members.12
Oman, Saudi Arabia and Yemen are applying for
membership and negotiating entry conditions, although Yemen’s accession is in its infancy. Iran’s
application for WTO membership has not been scheduled for consideration due to US opposition.
11 Other significant ports in the UAE include Khor Fakkan and Mina Khalid in Sharjah, Fujairah port in Fujairah and Mina
Zayed in Abu Dhabi.
12 Bahrain, Kuwait , Qatar and the UAE proceeded from GATT membership to WTO membership.
T r a d e
P A G E 131
Impact of WTO on Existing Members
WTO membership is an important driver of reform, limiting the forms of protection economies can
apply and generating commitments to future liberalisation. For example, trade liberalisation, particularly
in agriculture and services, elimination of subsidies, protection of intellectual property and equal
treatment of domestic and foreign companies are all requirements of WTO membership. Members
also must remove non-tariff barriers, such as standards, certification, licensing, inspection and
quarantine regimes not in accordance with WTO rules.
One area of major progress is intellectual property protection. For example, before joining the WTO
in 1995, the UAE expanded copyright protection to cover audio and video tapes and computer software,
and introduced legislation governing registration of patents and trademarks (British Bank of the Middle
East, 1998). As UAE legislation and enforcement improved, the United States Trade Representative’s
Office removed the UAE from its watch list on intellectual property protection in the pharmaceutical
and computer software industries (Business Monitor International, 2000b).
Kuwait and Qatar also are improving intellectual property protection. In May 1997, Qatar introduced
an intellectual property law, and should introduce new trademark and intellectual property laws
consistent with World Intellectual Property Standards by the end of 2000 (Hong Kong and Shanghai
Banking Corporation, 2000). Similarly, in 1999 Kuwait passed new copyright and patent protection
laws and regulations to enforce these laws (US Department of State, 1999a).
WTO requirements also are opening important new sectors to foreign competition in several Gulf
economies. For example, the UAE telecommunications monopoly, Etisalat, will face competition from
foreign telecommunications companies by 2004. WTO rules also caused Bahrain to eliminate exclusive
agencies and introduce fixed term agency agreements.
Oman’s WTO Accession
Oman’s WTO admission is imminent. The accession process has driven major reform, with important
benefits for Australia. Oman has agreed to liberalise tariffs and bind tariff commitments for agricultural
exports, as well as minerals, cars, information technology products, chemicals and pharmaceuticals,
paper products and construction materials. It also is adopting WTO rules on standards and quarantine
regimes, and reforming customs valuation procedures.
Oman also has agreed to ensure no taxation discrimination between domestic and foreign companies,
and increased foreign ownership limits from 49 to 70 per cent. It is opening new sectors to competition,
introducing then shortening timeframes for foreign participation in the telecommunications sector,
with foreign participation to start from 2002.13
It also is opening up its electricity sector to foreign
participation after introducing a world’s best practice competitive market environment, similar to that
in Victoria, Australia.
13 Foreign participation in the telecommunications sector will be liberalised progressively, starting in 2002 with payphones
and calling cards, and moving into mobile phones, telex services, audiovisual services and data transmission.
A C C E S S I N G T H E M I D D L E E A S T
B U S I N E S S O P P O R T U N I T I E S I N T H E A R A B I A N P E N I N S U L A A N D I R A N
P A G E 132
Saudi Arabian WTO Accession
Saudi WTO accession will have important domestic and regional implications, given the Saudi
economy’s size. Saudi Arabia’s unilateral foreign investment liberalisation announcement in April 2000
and its improved tax treatment for foreign companies already has placed GCC neighbours like the
UAE under pressure to improve their treatment of foreign investors.
Multilateral and bilateral negotiations to complete Saudi Arabia’s accession process still are underway.
Bilaterally agreed market access improvements, which will apply to all WTO members, will yield
significant benefits should Saudi Arabia’s WTO accession proceed. Multilateral negotiations also
could yield major improvements in access to the Saudi market via reduced agricultural subsidies,
fewer quantitative restrictions, improved intellectual property protection, equal tax treatment for
domestic and foreign companies, and improved customs procedures.
Australia has completed its bilateral accession negotiations with Saudi Arabia, securing access for
previously banned packaged milk, substantially reduced tariffs for wheat and wheat flour, and reduced
tariffs and increased access security for car and car component exports (Vaile, 2000). However, the
United States, European Union and Canada are yet to finalise their bilateral negotiations.
TARIFF BARRIERS
Tariff barriers vary across the Gulf economies; Kuwait and the UAE have the lowest average tariffs at
around 3.5 per cent, and Saudi Arabia has the highest. Kuwait’s agricultural imports incur tariffs of
0 to 4 per cent, while all industrial imports incur 4 per cent tariffs; tobacco product imports incur 70 per
cent tariffs (Department of Foreign Affairs and Trade, 2000b).14
In the UAE, most tariffs are 4 per
cent, although around 75 per cent of imports enter duty free (US Department of State, 1999b). The
main duty free imports are:
• imports entering the free trade zones
• tariff free items including foodstuffs, medicines and public sector imports
• imports from GCC economies, which largely enter the UAE and other GCC economies duty free,
if the GCC adds at least 40 per cent of their value and GCC nationals own at least 51 per cent of
the producing firm.
Saudi Arabia’s simple average tariff rate is 12.5 per cent (Department of Foreign Affairs and Trade,
2000b). Imports of basic foodstuffs and medicine are duty free, with a general 12 per cent tariff on
most other imports, and a 20 per cent tariff on many imports which also are produced locally (Saudi
British Bank, 1999).
Among the other economies, tariff data are less comprehensive. However, the key points are:
• Qatar: the general tariff rate is 4 per cent but tariffs of 20 to 30 per cent apply to goods competing with
local products such as cement, steel and urea (Hong Kong Shanghai Banking Corporation, 2000)
14 Prohibited imports include alcohol, wheat flour, asbestos, fireworks and drinking water coolers.
T r a d e
P A G E 133
• Bahrain: imports of raw materials, semi-manufactured goods and products for development
projects or re-export are duty free (Canadian Business Development International, 1997). Tariffs
start at 5 per cent on foodstuffs and necessities, and as in many other regional economies, much
higher rates apply to cigarettes (50 per cent) and alcohol (125 per cent)
• Oman: a wide range of essential consumer goods enter duty free, as do industrial inputs.15
‘Luxury’ consumer goods, including tea, coffee and prepared foods, attract 15 per cent tariffs,
while cars incur 10 to 15 per cent tariffs depending on engine size (US Department of State,
1999c). Oman’s WTO entry will drive further tariff and non-tariff barrier reductions. For example,
following criticism of its 10 per cent price preference for Omani companies in government
procurement tenders, Oman has agreed to initiate negotiations to join the WTO Agreement on
Government Procurement upon accession (United States Trade Representative, 2000)
• Iran: most consumer good imports incur 30 to 50 per cent tariffs. Capital and intermediate goods
attract lower tariffs, while medicines, wheat and other strategic goods are duty free (Mohammed
Reza Raf’ati, 1995). Regular checks for specific information are critical, as particulars of import
regulations change often.16
Non-essential imports often are banned, due to currency restrictions
• Yemen: since 1996, as part of the IMF sponsored reform program, tariffs have fallen to between
5 and 25 per cent.
Tariff Unification within the GCC
In November 1999, GCC economies decided to move external tariffs to a common range between
5.5 and 7.5 per cent by 2005. The impact of this agreement depends on exemptions and phase-in
times which are yet to be released publicly. However, one factor pushing for effective implementation
is that the GCC free trade agreement with the European Union depends on implementing the common
tariff by 2005. Full implementation of the agreement would see Saudi tariffs fall, resulting in significantly
improved access to the region’s main market. On the other hand, the UAE and Kuwait would have to
raise tariffs, which they are wary of doing.
Moving to a common external tariff will transform the GCC from a regional trading arrangement to a
customs union.17
As such, it is likely to be subject to greater WTO scrutiny, and in common with other
customs unions, will be ineligible for developing countries status (Ravier, 2000).
15 Essential products include rice and meat, seeds, fertilisers, live plants, agricultural implements and books. In May 1999,
around 40 industrial items became tariff free (US Department of State, 1999c).
16 Iran’s trade regime is highly opaque due to overlapping ministerial responsibilities for trade, and ad-hoc administrative
decision making. Some imports like meat are banned in some years, when a domestic surplus is envisaged, but permitted
in others, when a shortfall is predicted.
17 By definition, a customs union involves a grouping with common external tariffs while a regional trading arrangement has
internal tariff concessions for members but no common external tariff.
A C C E S S I N G T H E M I D D L E E A S T
B U S I N E S S O P P O R T U N I T I E S I N T H E A R A B I A N P E N I N S U L A A N D I R A N
P A G E 134
NON-TARIFF BARRIERS
Extensive non-tariff barriers are a defining feature of the regional trading environment. Common
barriers include:
• exclusive agency requirements
• government procurement policies favouring nationals
• significant numbers of prohibited imports
• restrictive labelling requirements.
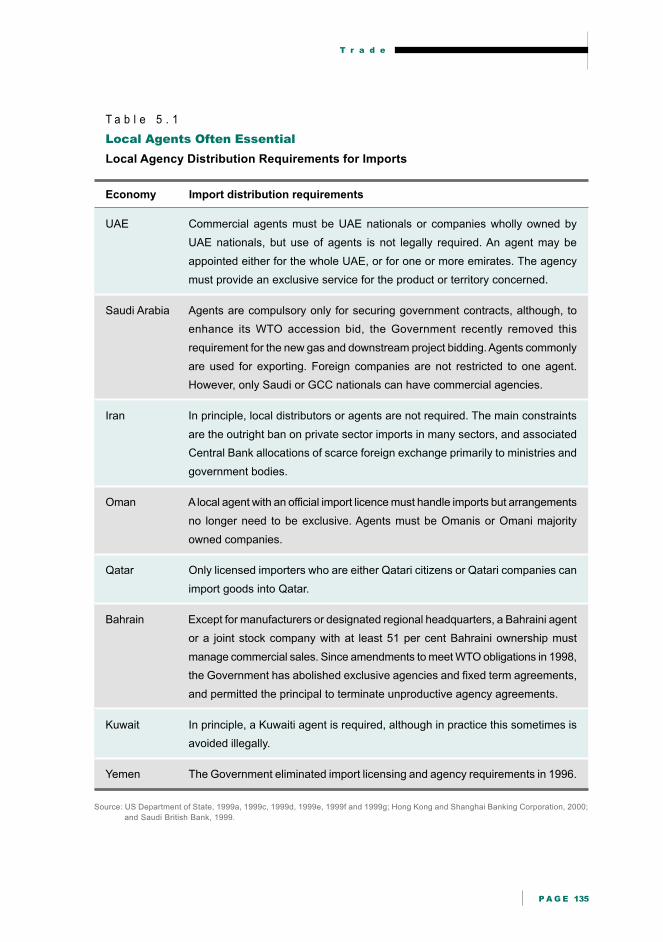
Agency Requirements
Use of a local distribution agent is a key legal requirement for exporting to Oman, Qatar, Kuwait and
Bahrain, and generally, these agents must be nationals or companies owned by nationals
(Table 5.1). In Saudi Arabia and the UAE, agents are not compulsory but they must be locals or GCC
nationals. They are very commonly used because of difficulties in accessing local markets without
them. Restricting agency business to local citizens, and granting exclusive agency rights to import
specific products is likely to increase the cost of imported products and reduce import volumes.
Because of their important role and the difficulty of ending agency agreements, choosing the right
agent is critical for exporters to the Gulf. (See Chapter 3 - Business Environment.)
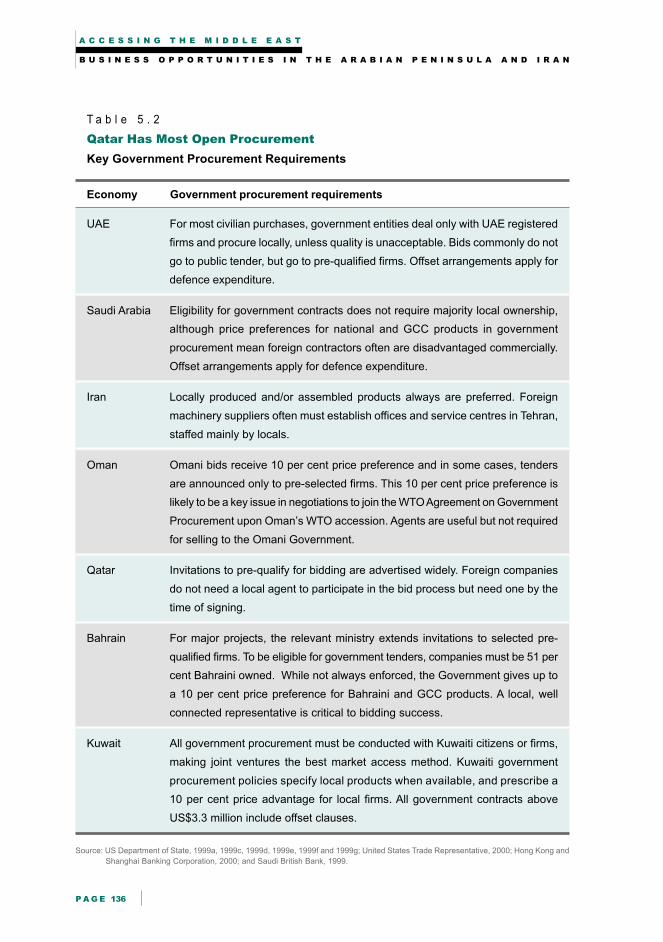
Government Procurement Policies
Given the state’s dominant role in economic activity in the Gulf, government procurement policies are
a critical market access issue, particularly for oil and infrastructure projects. Qatar has the most open
government procurement system; invitations to pre-qualify for bids are advertised in local and
international media and via Qatari embassies, and local agents are not required until contract signing.
In contrast, in other markets, requirements for local ownership or price preference for local products
are common (Table 5.2).
An additional procurement requirement applying to major government purchases, particularly of military
equipment, in Kuwait, Saudi Arabia and the UAE is ‘offset’ programs; these require reinvestment of a
portion of the contract value in indigenous industries. (See Chapter - 4 Foreign Investment.)
Prohibitions on Items
Trade prohibitions also influence regional trade patterns. The UAE has the most liberal regulations with
few bans on imported products, except those from Israel. Other Gulf economies often ban imports of
religiously or politically sensitive items. For example, Saudi Arabia and Iran ban imports of pork, alcohol,
statues representing the human form, games of chance and materials offensive to Islamic morals.
Qatar and Yemen also prohibit pork imports while other economies tightly regulate them.
In addition, except for Oman and Qatar, imports from Israel are prohibited, while US trade sanctions
prohibit US firms trading with Iran. (See Chapter 4 - Foreign Investment for more detail on the US sanctions.)
T r a d e
P A G E 135
T a b l e 5 . 1
Local Agents Often Essential
Local Agency Distribution Requirements for Imports
Economy Import distribution requirements
UAE Commercial agents must be UAE nationals or companies wholly owned by
UAE nationals, but use of agents is not legally required. An agent may be
appointed either for the whole UAE, or for one or more emirates. The agency
must provide an exclusive service for the product or territory concerned.
Saudi Arabia Agents are compulsory only for securing government contracts, although, to
enhance its WTO accession bid, the Government recently removed this
requirement for the new gas and downstream project bidding. Agents commonly
are used for exporting. Foreign companies are not restricted to one agent.
However, only Saudi or GCC nationals can have commercial agencies.
Iran In principle, local distributors or agents are not required. The main constraints
are the outright ban on private sector imports in many sectors, and associated
Central Bank allocations of scarce foreign exchange primarily to ministries and
government bodies.
Oman A local agent with an official import licence must handle imports but arrangements
no longer need to be exclusive. Agents must be Omanis or Omani majority
owned companies.
Qatar Only licensed importers who are either Qatari citizens or Qatari companies can
import goods into Qatar.
Bahrain Except for manufacturers or designated regional headquarters, a Bahraini agent
or a joint stock company with at least 51 per cent Bahraini ownership must
manage commercial sales. Since amendments to meet WTO obligations in 1998,
the Government has abolished exclusive agencies and fixed term agreements,
and permitted the principal to terminate unproductive agency agreements.
Kuwait In principle, a Kuwaiti agent is required, although in practice this sometimes is
avoided illegally.
Yemen The Government eliminated import licensing and agency requirements in 1996.
Source: US Department of State, 1999a, 1999c, 1999d, 1999e, 1999f and 1999g; Hong Kong and Shanghai Banking Corporation, 2000;
and Saudi British Bank, 1999.
A C C E S S I N G T H E M I D D L E E A S T
B U S I N E S S O P P O R T U N I T I E S I N T H E A R A B I A N P E N I N S U L A A N D I R A N
P A G E 136
T a b l e 5 . 2
Qatar Has Most Open Procurement
Key Government Procurement Requirements
Economy Government procurement requirements
UAE For most civilian purchases, government entities deal only with UAE registered
firms and procure locally, unless quality is unacceptable. Bids commonly do not
go to public tender, but go to pre-qualified firms. Offset arrangements apply for
defence expenditure.
Saudi Arabia Eligibility for government contracts does not require majority local ownership,
although price preferences for national and GCC products in government
procurement mean foreign contractors often are disadvantaged commercially.
Offset arrangements apply for defence expenditure.
Iran Locally produced and/or assembled products always are preferred. Foreign
machinery suppliers often must establish offices and service centres in Tehran,
staffed mainly by locals.
Oman Omani bids receive 10 per cent price preference and in some cases, tenders
are announced only to pre-selected firms. This 10 per cent price preference is
likely to be a key issue in negotiations to join the WTO Agreement on Government
Procurement upon Oman’s WTO accession. Agents are useful but not required
for selling to the Omani Government.
Qatar Invitations to pre-qualify for bidding are advertised widely. Foreign companies
do not need a local agent to participate in the bid process but need one by the
time of signing.
Bahrain For major projects, the relevant ministry extends invitations to selected pre-
qualified firms. To be eligible for government tenders, companies must be 51 per
cent Bahraini owned. While not always enforced, the Government gives up to
a 10 per cent price preference for Bahraini and GCC products. A local, well
connected representative is critical to bidding success.
Kuwait All government procurement must be conducted with Kuwaiti citizens or firms,
making joint ventures the best market access method. Kuwaiti government
procurement policies specify local products when available, and prescribe a
10 per cent price advantage for local firms. All government contracts above
US$3.3 million include offset clauses.
Source: US Department of State, 1999a, 1999c, 1999d, 1999e, 1999f and 1999g; United States Trade Representative, 2000; Hong Kong and
Shanghai Banking Corporation, 2000; and Saudi British Bank, 1999.
T r a d e
P A G E 137
Labelling and Product Standards
Most regional economies have detailed labelling requirements, including Arabic and Farsi labels. (See
Chapter 3 - Business Environment.) In Saudi Arabia, the UAE and Qatar, shelf life requirements often
are far shorter than scientifically necessary to preserve freshness (US Department of State, 1999e).
These requirements inevitably discriminate against non-GCC importers, given their greater distance
from the market.
FUTURE TRADE PROSPECTS
Trade prospects are good in the short and medium term. In 2000 and 2001, high oil prices are likely
to drive rapid import growth in Gulf economies, though beyond 2001 this factor may not sustain
continued growth. In the medium term, the WTO is becoming an increasingly important force for
liberalisation in the region, reducing tariff and non-tariff barriers, improving intellectual property
protection, liberalising agency arrangements and opening rapidly growing sectors such as
telecommunications. Its influence is likely to increase if Saudi Arabia’s accession is successful.
Common GCC external tariffs may raise average tariffs in some of the regions’ most open economies,
like the UAE and Kuwait; however, increased integration also should promote intra-regional trade and
hence manufacturers’ ability to supply the Gulf region from one manufacturing base. Major gas projects
like Dolphin will increase Gulf economies’ demand for industrial inputs. Other diversification policies,
like encouraging service sector development also should increase significantly exports and import demand.
In the medium term, Iran may become a substantially more important trading nation. It has rapid
population growth and shows signs of nascent economic reform. Moreover, it is possible that
US sanctions may not be renewed in September 2001.
A p p e n d i x T a b l e 5 . 1
Trade Directions Diverse
Export/Import Shares of Major Trading Partners, Per cent
Economy Saudi Arabia UAE Iran Kuwait Bahrain Oman Qatar Yemen
Other regional 3.6/2.3 9.1/5.8 6.4/5.1 0.7/0.9 18.1/12.2 1.9/25.8 4.3/11.1 7.1/23.9
United States 15.7/27.3 2.6/7.9 0.0/0.0 16.9/21.7 4.9/9.4 4.7/6.5 4.4/10.2 2.7/5.8
Japan 15.7/10.3 30.1/9.6 17.3/7.3 30/17.5 7.2/10.4 22.8/17 51.6/15.6 3.7/3.5
United Kingdom 3.2/11.5 3.3/8.7 0.4/4.7 3.5/8.2 3.3/6.8 3.1/10.2 0.9/1.4 0.3/5.0
Germany 1.3/6.2 0.7/6.4 3.5/11.6 0.9/8.2 1.3/5.2 0.2/5.5 0.1/6.4 2.1/3.6
France 3.9/3.7 0.4/4.1 5.1/5.3 1.6/4.2 2.4/3.2 0.2/4.4 0.1/11.1 1.5/5.6
Netherlands 3.7/1.6 0.3/1.9 3.3/2.2 6.3/1.5 0.5/1.4 0.1/2.4 0.02/2.4 0.8/2.2
Italy 3.0/4.3 0.4/5.4 9.1/7.6 0.3/6.1 1.5/5.2 0.06/6.7 0.1/4.6 0.8/4.3
Republic of Korea 9.6/3.4 7.7/5 7/6.4 15.2/7.7 7.9/2.7 15.7/1.5 9.8/2.2 11.4/1.9
India 5.6/1.8 6.5/5.4 4.1/1.8 3.7/0.4 17.9/2.9 0.7/2.4 1.4/1.2 0.3/2.3
Singapore 7.2/1.0 3.8/3.4 3.5/0.8 7.9/0.9 3.6/0.4 2.7/1.3 8.8/1.2 5.9/3.2
Source: International Monetary Fund, 1999.
A C C E S S I N G T H E M I D D L E E A S T
B U S I N E S S O P P O R T U N I T I E S I N T H E A R A B I A N P E N I N S U L A A N D I R A N
P A G E 138
REFERENCES
Borland, B., 2000, ‘Gulf 2000: The WTO and GCC’, paper presented at the Gulf 2000: Energy,
Infrastructure and Finance Conference, Abu Dhabi, 28 and 29 March.
British Bank of the Middle East, 1998, United Arab Emirates, British Bank of the Middle East, Business
Profile Series, eighth edition, Hong Kong and Shanghai Banking Corporation, Hong Kong.
Business Monitor International, 2000a, ‘Macroeconomic Data and Forecasts’ (various countries),
Middle East Monitor - The Gulf, May.
___ 2000b, ‘Abu Dhabi’s Power Play’, Middle East Monitor - The Gulf, June pp. 5-7.
Canadian Business Development International, 1997, The Agriculture and Agri-Food Exporter’s Guide
to Opportunities in the Middle East: Saudi Arabia, Agriculture and Agri-Food, Canada, at
atn-riae.agr.ca/public/htmldocs/e1557.htm, accessed on 22 February 2000.
Central Bank of the United Arab Emirates, 1999, Statistical Bulletin, July-September, Vol. 19, No. 3, p. 49.
Datastream, 2000, Datastream Database, www.primark.com, accessed from 7 to 11 August 2000.
Department of Foreign Affairs and Trade, 2000a, ‘The APEC Region Trade and Investment’, Department
of Foreign Affairs and Trade, Canberra.
___ 2000b, ‘Trade Negotiations Analysis System’, Trade Negotiations Division, Department of Foreign
Affairs and Trade, Canberra.
Economist Intelligence Unit, 1999a, Saudi Arabia 1999-2000 Country Profile, EIU, London.
___ 1999b, Iran 1999-2000 Country Profile, EIU, London.
___ 1999c, Oman 1999-2000 Country Profile, EIU, London.
___ 1999d, United Arab Emirates 1999-2000 Country Profile, EIU, London.
Fawzi Al-Khatib and Tarik Al-Malki, 2000, ‘Clarifying the Region’s Strategy for Economic and Structural
Reform’, paper presented at the Gulf 2000: Energy, Infrastructure and Finance Conference,
Abu Dhabi, 28 and 29 March.
Gulf Business, 2000, ‘Storming Ports’, Vol. 4, No. 12, April, www.gulfbusiness.com/cgi-local/index,
accessed on 27 June 2000.
Gulf Cooperation Council, 1999, Economic Bulletin, Vol. 14, Riyadh.
Hong Kong Shanghai Banking Corporation, 2000, ‘Qatar’, Hong Kong Shanghai Bank, Business
Profile Series, tenth edition, Hong Kong and Shanghai Banking Corporation, Hong Kong.
T r a d e
P A G E 139
International Economic Data Bank, 2000, International Economic Data Bank, Australian National
University, Canberra.
International Monetary Fund, 1999, Directions of Trade Statistics Yearbook, IMF, Washington DC.
Key Economics, 1999, Consultancy report to the East Asia Analytical Unit, November.
Mohammed Reza Raf’ati, 1995, ‘Iran’s Standing in Global Trade and Upshots of Membering the
GATT’, Payame Darya (Economic-Scientific Monthly), Vol. 4, No. 33, pp. 14-25, at
new.netiran.com/Frame-Html/Clippings/deconomy-index.html>, accessed December 1999.
Ravier, P. H., 2000, ‘Examining the Implications of the WTO for the GCC’, paper presented at the
Gulf 2000: Energy, Infrastructure and Finance Conference, Abu Dhabi, 28 and 29 March.
Saudi British Bank, 1999, ‘Saudi Arabia’, Hong Kong Shanghai Bank Business Profile Series, eighth
edition, Hong Kong and Shanghai Banking Corporation, Hong Kong.
US Department of Energy, 1998, International Energy Outlook (Gas), Energy Information Administration
Report, DOE/EIA-0484(98), www.eia.doe.gov/oiaf/ieo98, accessed on 8 December 1999.
US Department of State, 1999a, ‘FY 2000 Country Commercial Guide: Kuwait’, prepared by US Embassy
Kuwait, released by Bureau of Economic and Business Affairs, US Department of State, at
www.state.gov/www/about_state/business/com_guides/index.html, accessed on 21 June 2000.
___ 1999b, United Arab Emirates: 1998 Country Report On Economic Policies and Trade Practices,
submitted to the Senate Committees on Foreign Relations and on Finance and to the House
Committees on Foreign Affairs and on Ways and Means, Washington DC.
___ 1999c, ‘FY 2000 Country Commercial Guide: Oman’, prepared by US Embassy Muscat, released
by Bureau of Economic and Business Affairs, US Department of State, at www.state.gov/www/
about_state/business/com_guides/index.html, accessed on 21 June 2000.
___ 1999d, ‘FY 2000 Country Commercial Guide: Saudi Arabia’, prepared by US Embassy Riyadh,
released by Bureau of Economic and Business Affairs, US Department of State, at www.state.gov/
www/about_state/business/com_guides/index.html, accessed on 21 June 2000.
___ 1999e, ‘FY 2000 Country Commercial Guide: Qatar’, prepared by US Embassy Doha, released
by Bureau of Economic and Business Affairs, US Department of State, at www.state.gov/www/
about_state/business/com_guides/index.html, accessed on 21 June 2000.
___ 1999f, ‘FY 2000 Country Commercial Guide: Bahrain’, prepared by US Embassy Manama,
released by Bureau of Economic and Business Affairs, US Department of State, at www.state.gov/
www/about_state/business/com_guides/index.html, accessed on 21 June 2000.

A C C E S S I N G T H E M I D D L E E A S T
B U S I N E S S O P P O R T U N I T I E S I N T H E A R A B I A N P E N I N S U L A A N D I R A N
P A G E 140
___ 1999g, ‘FY 2000 Country Commercial Guide: United Arab Emirates’, prepared by US Embassy
Abu Dhabi, released by Bureau of Economic and Business Affairs, US Department of State, at
www.state.gov/www/about_state/business/com_guides/index.html, accessed on 21 June 2000.
United States Trade Representative, 2000, ‘2000 National Trade Estimate Report on Foreign Trade
Barriers’, at www.ustr.gov/reports/nte/2000/contents.html, accessed on 28 July 2000.
Vaile, M., 2000, Press release by the Minister for Trade, ‘Australia Concludes WTO Deal with
Saudi Arabia’, 31 March.