monetary policy prospects
TRANSCRIPT

MONETARY POLICY PROSPECTSOCTOBER 2021PABLO GARCIA – MEMBER OF THE BOARD

The Chilean economy has recovered its level prior to the outbreak of the social crisis and the pandemic, with an unprecedented speed compared to past recessions.
Imacec by sectors(seasonally-adjusted levels, Sept. 2019=100)
Total GDP in crisis episodes (*)(seasonally-adjusted series, index período -1=100)
75
80
85
90
95
100
105
110
-4 -3 -2 -1 0 1 2 3 4 5 6 7 8
1982 1999 2009 2020
70
80
90
100
110
120
130
19 May. Sep. 20 May. Sep. 21
(*) Respective zero periods: 1981.4, 1998.4, 2008.4, 2020.2. Source: Central Bank of Chile.
May.
Total
Other goods
Mining
Trade
Manufacturing
Services

It is a broad based recovery across all firm sizes.
Sales by firm size (*)
(index, February 2020=100)
Sales of smaller firms have recovered the most, illustrating the effectiveness of credit support policies and the opening of the economy in recent months.
85
95
135
125
115
105
75
Jan.19 Jun.19 Nov.19 Apr.20 Sept.20 Feb.21 Jul.21
(*) Dashed vertical line shows February 2020 sales. For details, see Chapter V in September 2021 Monetary Policy Report.Sources: Central Bank of Chile and Internal Revenue Service (SII).
Medium Large Micro and small

(1) Conventional monetary policy is MPR related.(2) Figures encompass monetary and sovereign guarantee policies that sought to stabilize financial markets, including the FCIC-Fogape program, bond purchases, and domestic- and foreign-currency liquidity programs.Source: Central Bank of Chile.
Policy support to aggregate demand has been unprecedented.
Effects on GDP of measures adopted during the Covid-19 crisis(percent change with respect to same period, previous year)
2020 2021 H1
Conventional monetary policy (1) [0.2 - 0.8] [0.6 - 2,1]
Unconventional credit policies (2) [2.2 - 4.8] [2.7 - 4.4]
Fiscal policy 0.8 1.7
Total fiscal and monetary policy [3.2 - 6.4] [5.0 - 8.2]
Pension fund withdrawals 1.2 2.9
Total [4.4 - 7.6] [7.9 - 11,1]
Actual GDP -5.8 8.7
Counterfactual GDP [-10.2 ; -13.4] [0.8 ; -2.4]

Going forward, it will turn positive and then will begin to decline as
spending momentum subside
Output gap (*)
(level, percentage points)
The output gap closed during the second quarter of this year and has moved into positive territory.
(*) Dotted lines show projections of each MP Report. The June and September projections use the structural parameters updated in the June 2021 MP Report.Source: Central Bank of Chile.
MP ReportMar.21
MP ReportSep.21
MP ReportJun.21
-16
-12
-8
-4
0
4
8
19 20 21 22 23

Households' umulative income and liquidity injections (1)(billions of dollars)
Expenditures or foregone tax revenue by governments in response to Covid-19(percent of 2020 GDP)
The accumulation of massive pension savings withdrawals and fiscal transfers have significantly increased household liquidity.
-4.3
9.9
20.026.6
54.0
69.4
80.9
0
20
40
60
80
100
-20
20.II 20.III 20.IV 21.I 21.II 21.III 21.IV
(1) For details on the methodology, see chapter III in MP Report of September 2021. (2) Corresponds to Fiscal Monitor data for January 2021. (3) Difference between July and January 2021 delivery. Chile considers an additional 2.8% for IFE.Sources: International Monetary Fund, Ministry of Finance, Superintendence of Pensions and Central Bank of Chile.
Income IFE PF withdrawals Other Total 30
25
20
15
10
5
0
Mex
ico
Co
lom
bia
Peru
Bra
zil
Fran
ce
Ital
y
Ger
man
y
U.K
.
Jap
an
Ch
ile
Au
stra
lia
New
Zea
lan
d
U.S
.
2020 (2) 2021 (3)

The various stimulus measures have strongly boosted demand, which has resulted in higher-than-expected growth in private consumption.
60
80
100
120
140
160
15 16 17 18 19 20 21
(*) Projections contained in Economic Expectations Survey. Source: Central Bank of Chile.
Durable goods consumption
Non-durables goods consumptionServices consumptionGFCF Construction and other worksGFCF Machinery and equipment
GDP second quarter 2021: actual vs market projection (*)(annual change, percent)
4
8
12
Apr.21 May.21 Jun.21 Jul.21 Aug.21
10
14
18
Apr.2021 May.2021 Jun.2021 Actual
Private consumption 2021: market projection (*)(annual change, percent)
Domestic demand(seasonally-adjusted series; index, 2019 average=100)

Labor market tightness is apparent, coupled with likely skill mismatches.
(*) Business Perceptions Report (BPR).
Sources: Central Bank of Chile and SABE Project of SENCE Labor Observatory and ISCI-WIC, University of Chile, based on websites trabajando.com and laborum.com.
Job postings and applications on the Internet(index, base 100=3 March 2020, moving 15-day average)
August BPR (*): Among firms wanting to hire, Generally, what happened with labor search?(percent of total respondents saying they had searched for labor in 2021)
0 10 20 30 40
Hired as desired
Hired, but with a different profile
Couldn't hire, candidates refused proposed terms
Couldn't hire, candidates did not fit desired profilel
Couldn't hire, no candidates
20
35
50
65
80
95
110
125
20
40
60
80
100
120
140
160
180
Jan.20 May.20 Sept.20 Jan.21 May.21
Postings Applications (right axis) 140

The combination of higher labor demand and tight labor supply is consistent with the recent acceleration of annual nominal wage growth.
(1) Wage Index (IR) and Labor Cost index (ICMO). (2) Value above (below) 50 indicates an expansion (contraction) outlook. (2) Dashed horizontal lines show historical averages from January 2004 through May 2021 for each series. (3) Expectations for wages are six months ahead.
Sources: National Statistics Institute (INE) and Icare/Universidad Adolfo Ibáñez.
Nominal wages (1)(annual change, percent)
IMCE: Wage expectations (2) (3)(diffusion index)
2
3
4
5
6
7
8
9 Wage Index Labor Cost Index
30
40
50
60
70
80
20
12 13 14 15 16 17 18 19 20 21 10 11 12 13 14 15 16 17 18 19 20
Construction Manufacturing

Inflation has been picking up.
Headline and core inflation (1)(annual change, percent)
Price hikes at July 2021(annual change, percent)
+8.0%
+9.4%
+10.4%
+18.6%
0
1
2
3
4
5
6
15 16 17 18 19 20 21
(1) Dashed vertical line indicates statistical cut-off of June 2021 Report. (2) CPI without volatilityhas 65.1% share in total CPI basket. For more details, see box IV.1 in December 2019 MP Reportand Carlomagno and Sansone (2019).
Total CPI CPI w/o volatiles (2)

Core services inflation has also risen, especially when excluding administered and indexed items. Among volatile items, the new rise in fuel prices stands out.
Services CPI w/o volatiles (1)(annual change, average percent)
1
3
4
6
7 Excl. administered and indexed prices (11.7%)
Total (38.4%)
(1) In parentheses, share in total CPI basket. (2) Dashed vertical line indicates statistical cut-off of June 2021 MP Report. (3) Average price between Brent and WTI oil barrels.
Sources: Central Bank of Chile, Bloomberg, and National Statistics Institute (INE).
20
40
60
100
110
90
15 16 17 18 19 20 21 Jan.19 Jul.19 Jan.20 Jul.20 Jan.21 Jul.21
CPI for fuels and oil price (2)(index, base 2018=100; dollars per barrel)
120 CPI fuels Oil (3) (right axis) 80

Core CPI (1) (2)
Inflation forecasts(annual change, percent)
CPI (1)
Annual inflation will end this year at 5.7%, and will be above 5% during the first half of 2022. Core CPI will peak around mid-2022.
(1) Dashed lines indicate forecast in respective MP Report. (2) Measured by CPI w/o volatiles.
Sources: Central Bank of Chile and National Statistics Institute (INE).
0
1
2
3
4
5
6
19 20 21 22 23
Effective
0
1
2
3
4
5
6
19 20 21 22 23
Jun.21 Sep.21Effective MP Report Jun.21 MP Report Sep.21
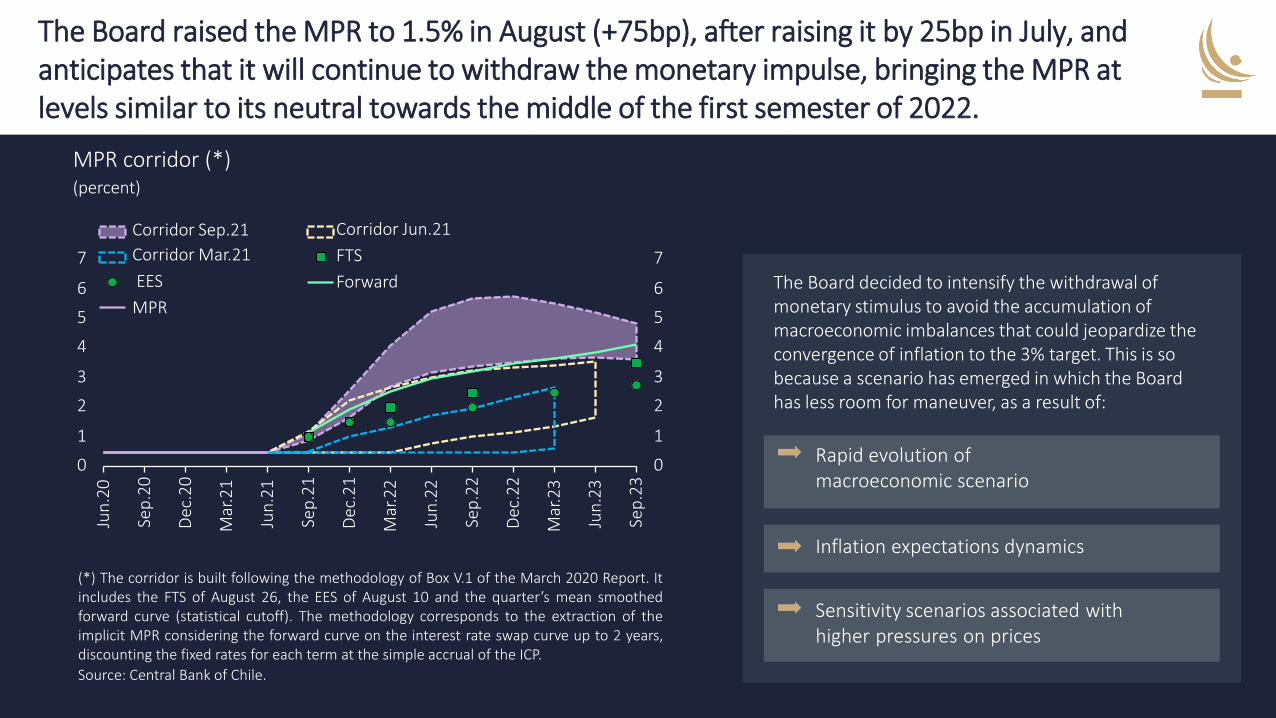
The Board decided to intensify the withdrawal of monetary stimulus to avoid the accumulation of macroeconomic imbalances that could jeopardize the convergence of inflation to the 3% target. This is so because a scenario has emerged in which the Board has less room for maneuver, as a result of:
Inflation expectations dynamics
Rapid evolution of macroeconomic scenario
Sensitivity scenarios associated with higher pressures on prices
MPR corridor (*)(percent)
(*) The corridor is built following the methodology of Box V.1 of the March 2020 Report. Itincludes the FTS of August 26, the EES of August 10 and the quarter’s mean smoothedforward curve (statistical cutoff). The methodology corresponds to the extraction of theimplicit MPR considering the forward curve on the interest rate swap curve up to 2 years,discounting the fixed rates for each term at the simple accrual of the ICP.
Source: Central Bank of Chile.
7
6
5
4
3
2
1
0
7
6
5
4
3
2
1
0
Jun
.20
Sep
.20
Dec
.20
Mar
.21
Jun
.21
Sep
.21
Dec
.21
Mar
.22
Jun
.22
Sep
.22
Dec
.22
Mar
.23
Jun
.23
Sep
.23
Corridor Jun.21
FTS
Forward
Corridor Sep.21
Corridor Mar.21
EES
MPR
The Board raised the MPR to 1.5% in August (+75bp), after raising it by 25bp in July, and anticipates that it will continue to withdraw the monetary impulse, bringing the MPR at levels similar to its neutral towards the middle of the first semester of 2022.
