trade marketing analytics in consumer goods industry · coach dmytro soloviov – for entertaining...
TRANSCRIPT

Trade Marketing Analytics
in Consumer Goods Industry
Vadym Safronov
Project report presented as a partial requirement for the
degree of Master of Information Management, specialization
in Information Systems and Technologies Management

ii
NOVA Information Management School
Instituto Superior de Estatística e Gestão de Informação
Universidade Nova de Lisboa
TRADE MARKETING ANALYTICS IN CONSUMER GOODS INDUSTRY
Vadym Safronov
Project report presented as a partial requirement for the degree of Master of Information
Management, specialization in Information Technologies and Systems Management
Advisor: Roberto Henriques (NOVA Information Management School)
February 2017

iii
ACKNOWLEDGEMENTS
I would like to thank all those who influenced and helped me become me (in order of appearance):
My family – for our history and role models in this game of life.
Coach Dmytro Soloviov – for entertaining exploration of human training process.
Professor Vladislav Vinnitskiy – for giving me challenges I could stand, and constant harsh feedback.
Colonel Alexey Shnurko – for making distinction between good and great.
Konstantin Kukibniy – for early lessons of leadership.
Alexander Ungul – for setting benchmark of a good sales person.
Fredrick Aherne – for mentorship and far-sighted advises.
Bruno Le Cicle – for giving me freedom to act and teaching the nature of choice.
Coach Alexander Pilotov – for teaching how to regain lost time in a race.
Alexandre De Raemaeker – for good career advices.
Coach Vadim Dzigovskiy – for lessons of technique improvement.
Michael Rozenko – for entertaining journey into knowledge enterprise.
Michael Morozov – for amusing perspective on entrepreneurship in emerging markets.
Professors Guilherme Victorino and Vasco Monteiro – for introduction into social network analysis.
Professor Fernando Bação – for sharing style in science of making data actionable.
Professor Roberto Henriques – for supervision and patience during evolution of this study.
Vasco Jesus – for buying me time, giving feedback, and finding data that made this project possible.

iv
ABSTRACT
We address transparency of trade spends in consumer goods industry and propose a set of business
performance indicators that follow Pareto (80/20) rule – a popular concept in optimization problem
solving. Discovery of power laws in behaviors of travelling sales persons, buying patterns of
customers, popularity of products, and market demand fluctuations – all that leads to better-
informed decisions among all those involved into planning, execution, and post-promotion
evaluation. Practical result of our work is a prototype implementation of proposed measures.
The most remarkable finding – consistency of travelling sales person journey between customer
locations. Loyalty to brand, or brand market power – whatever forces field sales representatives to
put at least one product of market player of interest into nearly every market basket – fits into small
world model. This behavior not only changes from person to person, but also remains the same after
reassignment into different territory.
For industrialization stage of this project, we outline key design considerations for information
system capable of handling real-time workload scalable to petabytes. We built our analyses for
collaborative processes of integrated planning that requires joint effort of multidisciplinary team.
Field tests demonstrate how insights from data can trigger business transformation. That is why we
end up with recommendation for system integrators to include Knowledge Discovery into
information system deployment projects.
KEYWORDS
Knowledge discovery; power law; networks; consumer goods; trade marketing.
v
TABLE OF CONTENTS
1. Introduction .................................................................................................................. 1
2. Clockwork of Trade Marketing ..................................................................................... 5
2.1. Rotation and distribution ...................................................................................... 5
2.2. Observe-Plan-Do-Check-Act .................................................................................. 7
3. Insights from data ......................................................................................................... 8
3.1. Data sources and methods of treatment .............................................................. 8
3.2. Power laws ............................................................................................................ 9
3.3. RFM ...................................................................................................................... 12
3.4. FM ........................................................................................................................ 13
3.5. R ........................................................................................................................... 13
3.6. Travelling Sales Persons leave traces .................................................................. 14
3.7. Associations and Dissociations in Market Baskets .............................................. 17
3.8. End of season – product returns ......................................................................... 22
4. Prototype deployment ............................................................................................... 24
4.1. Trade Marketing data landscape ......................................................................... 24
4.2. Component choice and implementation support ............................................... 24
4.3. Reference business processes ............................................................................. 27
4.4. Integrated Planning ............................................................................................. 28
4.5. Trade Activity Planning ........................................................................................ 29
4.6. Target architecture .............................................................................................. 32
4.7. Why ‘Big BI killer’ is a myth ................................................................................. 34
5. Conclusion .................................................................................................................. 35
6. Bibliography ................................................................................................................ 36

1
1. INTRODUCTION
Trade promotion management (TPM) is defined as the process of planning, budgeting, presenting
and executing incentive programs, which occur between the manufacturer and the retailer to
enhance sales of specific products (Hagemeyer, 2015). For example, a manufacturer paying a retailer
to feature their product in the retailer’s weekly newspaper advertising or paying a retailer to build a
special promotional display in their store are both considered trade promotions.
Recent decades demonstrated growths of trade marketing costs up to 25% of net sales in the
consumer goods industry – the worrying 2/3 promotions fail to break even. Trade spends steadily
increase while efficiency decreases – meaning more weeks on promotion and lower return on every
$ invested (Nielsen, 2014). For manufacturers, cost of sales becomes primary driver in the profit and
loss statement. This is the industry shift that is happening now – sales cost became higher than
manufacturing expences – we withness power transition to retailors.
Meanwhile, industry top performers achieve five times better Return On Investment (ROI) than low
performers. Low maturity of existing practices in trade marketing is a blue ocean of quick wins in
classification of trade promotions in order to discover practices that work best. Transparency of cost
structure and clear data ownership enable industrial performance improvement programs that could
improve situation with $1 trillion spent yearly on trade activities (Nielsen, 2014).
Sales in consumer goods is a multistage process that involves numerous participants (Figure 1).
Figure 1. Actors, activities and relations in distributio of consumer goods.
From figure 1, we can identify the products flow from manufacturers (P1 and P2) to consumers
through chain of intermediaries: distributors, travelling sales representatives and points of sales.
Products become subject of several transactions between various participants. We define:

2
Sell-in as the sales from manufacturer to distributor.
Sell-out as the sales from distributor to a customer.
Sell-through as the sales from customer to a consumer.
Distributors are wholesale companies that supply consumer products to stores. Travelling sales
persons work for distributors and they provide personalized service to customers (point of sales).
Customers are composed of outlets: supermarkets, convenience stores, cafes, restaurants, gas
stations, hotels, kiosks or whatever point of sales.
Manufacturers can influence every intermediary by establishing and communicating targeted
incentives. Tactics and audience vary: trade terms set rules for tens of distributors, bonus schemas
address hundreds of sales force, POS marketing (promotional activity at points of sales: sampling,
leaflets, etc.) affects thousands of places. Market is an arena for multiple manufacturers and usually
only two strongest players influence national distribution in a category – no place for a third player.
Structured data exists for every type of sales events, yet availability varies. Every company is
supposed to have sell-in. Some have sell-out. Sell-through is also available and in some cases,
retailors (example: Walmart) encourage manufacturers to use detailed sales information.
Sell-out data are harder to obtain (distributors are not interested in exposing details) unless
manufacturer has strong negotiation position that is backed by strong brands demanded by market.
Digital divide of both first (availability) and second (use) orders influences data exchange – in some
cases we observe national-scale information platforms that support processes of distributors and
promote unified data standards in market. In less developed markets, low maturity in systems and
processes results in low-granularity latent data that comes from heterogeneous systems.
Every sales order (sell-out) records interaction between a customer and the distributor through the
travelling sales representative. As an example of a travelling sales person’s daily routine, see Figure 2.
Figure 2. Field sales force has objective to keep rotation and distribution – such routine allows for
data collection at point of sales (image credit: SAP). All we know for sure – travelling sales persons
visit customers one by one and leave trails of orders
3
What makes this situation interesting is that distributors (through travelling sales person) offer
competing products and report to manufacturers only the lines of orders they refer to. If no products
were ordered, manufacturer does not receive any information – non-disclosure agreements keep
competition sales figures safe. Every sales order records silent fight between market players for a
position in a basket. That is the moment all trade marketing activity adds up.
Another important aspect is the limitation of the number of visits to customers a travelling sales
person can perform. Visiting more than 20 customers a day could be a challenge. Thus, tracking
market only by travelling sales person does not seem reasonable if we want at least daily status
check. Figure 3 presents a real example for the Lisbon area, where customers in a small
neighborhood were mapped and a travelling sales person limitation for one-day trip is projected.
Figure 3. Example of a travelling sales person activity in one day. Too many customers, too few sales
persons – that is the problem for most consumer goods manufacturers that struggle between
conflicting objectives of maintaining distribution while keeping trade costs as low as possible.
Industrial grade TPM solutions include best practices for working with supermarkets. Meanwhile,
sell-out analytics has not been addressed before (mostly due to digital divide of first order) – and it is
an opportunity we pursue - distributor sell-out data becomes available as more businesses go digital.
We suppose, exploration of statistics of events can lead to insights in balancing sales operations.
Classification and ranking of promotional activity not only brings actionable knowledge about what
works, but also builds foundation for future application of machine learning in the enterprise context
by revealing magnitude of inequality in products and customers. Doing the things right is not enough
anymore for manufacturers to survive economy. Learning patterns from whatever legitimate sources
in order to personalize offer – that seems like winning strategy in today’s digital world.
Sell-through data is a rich source of information about market behavior and specifically consumers.

4
Sell-through data is available from retail chains (big businesses whose survival depends on maturity
in information technology) – yet, this constitutes only a half of the total sell-through. Modern trade
distribution channel stands for nearly half of sales in many categories while the other half goes
through traditional retail and other channels. Collecting sell-through data from smaller stores does
not seem to be feasible for the time being.
One of the frameworks applied to these data is association analysis also known as market basket
analysis or frequent item mining. Many names for the family of techniques for finding statistical
patterns of relations between products. We enhance the method in 3.7.
There is a demand for tools that support promotion planning and post-promotion evaluation – no
surprise, Boston Consulting Group has put trade promotion optimization case first in their
compilation on Business Transformation (Faest & Hemerling, 2016). In this work, we address the
problem in three domains, which constitute general objectives: 1) data analytics; 2) prototype
construction and 3) business transformation concerns towards implementation of this system.
In the first domain, data analytics addresses how information can reveal actionable patterns. We
propose several techniques of knowledge discovery to analyze sell-out data and sell-through data.
More specifically, we use power laws, to demonstrate that the behavior of customers in consumer
goods fits Pareto (80/20) rule and there are at least several parameters that enable such a ranking
that minor top would represent major part of business in monetary or operational measures. As a
practical application of Pareto rule, we applied RFM analysis (reference heuristic for classification of
customers by recency, frequency, and monetary track record – born in direct mail industry) to
identify those most important customers. In this line, we also analyzed that the path followed by a
travelling sales person and used power law to explain their expected behavior.
A new visual way to reason about rotation was also presented, by analyzing two new measures:
distance to served customer (in comparison to a specific customer) and recency (number of days
since last purchase). Using sell-through data, a network of product associations was built allowing to
understand relations between products bought together, as an extent of traditional market basket
analysis techniques. Finally, we applied different classifiers to predict return of products from each
order made from customers.
In the second general objective, we propose a prototype development that fits existing Trade
Marketing landscape, implements models that build upon existing technology, and contains a set of
new features.
Finally, the third main objective was to address business transformation. Business transformation is
inevitable consequence of the shift we observe in industry. Reference processes (also called best
practices) become differentiation point in market of information systems. Organizational Change
Management ensures company transforms operations into the new state smoothly and results in fast
adoption and improved data ownership due to immediate insights from customer, product, and sales
person classification.
The rest of this paper is organized as follows. Clockwork of Trade Marketing occupies Section 2.
Section 3 provides insights from data. Prototype deployment mechanics and reference business
processes are described in Section 4. Finally, we conclude in Section 5.

5
2. CLOCKWORK OF TRADE MARKETING
2.1. ROTATION AND DISTRIBUTION
Sell often at maximum number of stores – that might be an overall objective setting for the field
sales force. Rotation (intensity of stock replenishement at customers over a period of time) is an
important measure of behavior that allows prediction. For example, we achieved 99% accuracy in
guessing whether a customer is going to buy or return seasonal product, given rotation history,
amount of sales, and weather conditions (see 3.8). As we demonstrate in 3.3, regular customers buy
more, so sell often.
Distribution (presence on shelves) is the second of two most important measures in sales. Numeric
distribution is the number of stores that sell product. Weighted distribution is the proportion of
product quantity to the total quantity of product category including competition. We find that
numeric distribution can be assessed from distributor sell-out data (see Figure 1).
The objective of the sales force is to maintain rotation and distribution.
Every sales order records silent fight between market players for a position in a basket. That is the
moment all trade marketing activity adds up. We suppose that exploration of statistics of events can
lead to insights in balancing sales operations. Classification and ranking of promotional activity not
only brings actionable knowledge about what works, but also builds foundation for future application
of machine learning in the enterprise context by revealing magnitude of inequality in products and
customers. Doing the things right is not enough anymore for manufacturers to survive economy.
Learning patterns from whatever legitimate sources in order to personalize offer seems to be a
winning strategy in today’s digital world.
Digital transformation forces review existing practices and we might witness extinction of a travelling
sales person job. Zero-checkout store recently introduced by Amazon challenges retail tradition. Do
we need a sales representative visit on an outlet that uses computer vision to control shelves? Store
tracks products picked (or put back) by customers so that virtual shopping basket contents reflect
reality. Why wait in queues at cash desk? Better faster shopping experience and lower operational
cost seems like competitive advantage. The only downside is a threat to wellbeing of considerable
involved workforce.
Whatever happens to the travelling sales person in the near future is an incognito, but they still exist
and we study patterns that emerge in the result of their actions. We understand trade marketing as
dynamic system and suggest a set of useful measures of activity that helps to express behaviors.
First, we observe in what order did a sales person took orders from customers. Long observation
reveals travel patterns. As we can see from Figure 4, some transitions are more common. For
example, in a given sample (two months in Iberia) customer D is very much likely to have been visited
after customer C. Sequence of visits to customers recur and we observe weekly pattern in visits to
neighborhoods.

6
Figure 4. Graph built from a sequence of orders taken by one sales representative as follows. Nodes
represent customer locations and area of a circle is proportional to the volume of business. Edges
represent consequent visits within one day and weight is proportional to the number of
observations. Infrequent customers that buy small quantities do not receive a letter code – we use ‘x’
to mark these in the sequence of orders instead.
Longer periods of observation reveal a tendency among travelling sale persons to visit
neighborhoods regularly – a weekly recurring pattern is possible to be seen on Figure 5.
Figure 5. Customer and their sales person behavior over time

7
As we see on Figure 5, recency is an important measure – number of days since last order. Frequency
of orders varies over time – there are periods of regular weekly service that result in better rotation
of products. A closer examination of events in the system has led to development of a new measure
– distance to the nearest served neighbor. Visits to neigborhoods persist – we can see weekly pattern
in the plot of distance to the closest encounter over time. We believe having an order at customer
every time area is wisitied is a good binary measure of success in maintaining rotation. Deviations
between these two are easy to spot visually and this problem can also be addressed by machine
learning.
Today’s marketers have a chance to understand dynamics at every step of sales process. .
We discover new knowledge about behavior of market in sell-out and sell-through data. In our cases
numbers range at 20-30 distributors, 400-800 sales representatives, 20-30K customers, and 20-70K
orders a month for sell-out. Sell-through cases deal with 3-7M records yearly.
2.2. OBSERVE-PLAN-DO-CHECK-ACT
What made customer a regularly buying one? That is the problem that can and should be solved by
matching patterns that emerge from sell-out and sell-through data with plans for trade marketing.
Clearly, we can expect to find out what tactics work best by comparison of detailed behavior records
of events during respective periods. Collecting and storing records is not only a good practice, but
also a prerequisite for certification against ISO 9001 family of standards for quality management. This
is also a must have for manufacturers that expect to put product on shelves of international retailors
(and lesser scale players too).
Plan-Do-Check-Act is an iterative four-step management method used in business for the control and
continual improvement of processes and products. It is also known as the Deming cycle. Another
version of this PDCA cycle is OPDCA. The added "O" stands for observation or as some versions say
"Grasp the current condition." This emphasis on observation and current condition has currency with
Lean manufacturing/Toyota Production System literature (Wikipedia).
Whatever framework is used, data granularity becomes essential. Capacities for observation of the
current situation and checking tendencies in fact data are growing while detailed planning is still a
luxury not every manufacturer has. Planning and tracking of trade spends at lowest levels (point of
sales and product) is a way to solve the problem of not working ⅔ trade promotions worldwide.

8
3. INSIGHTS FROM DATA
3.1. DATA SOURCES AND METHODS OF TREATMENT
Knowledge discovery relates on quality of data and it is crucial for businesses to maintain records
timely and accurately. Enterprise Resource Planning (ERP) and Customer Relationship Management
(CRM) systems, among others, address this topic. No surprise, key determinants for acquisition
decision and successful use are analytical and collaborative capacity (Ruivo, Oliveira, & Neto, 2015).
Since enterprise grade Business Intelligence (BI) implementations rely on transaction processing
systems, and knowledge consumers have to wait for ERP implementation (9-12 month), insights from
the existing data can score quick wins in data ownership by making immediately actionable
knowledge available. We alter presales and implementation processes and introduce analytical
services to customers in order to build data driven decision making practices and incept the need for
industrial application of machine learning at early stages of digital transformation.
We analyze data from three sources: Two international consumer goods manufacturers operating in
Eurasia (sell-out data) and a retail network in America (sell-thought data).
The two international consumer goods manufacturers operating in Eurasia have collected sell-out
data for our study through the period of 2013-2016 years. Both companies originated in Europe.
Strong brands in portfolio of both build foundation for market leadership – champion or challenger
positions in different markets. Neither of the two operates competing or substituting category –
there is no traceable sign of competition. One company produces highly seasonable goods and we
apply machine learning to the problem of finding meaningful correlation between sales and weather
and produce early warning concerning the end of season situation and following returns of unsold
items.
Data is composed of orders from point of sales, collected by distributors. Each record represents one
order line. Since distributors usually sell products from multiple market players, one important
characteristic of this dataset is that each manufacturer only has access to a part of the orders (only
those concerning their products).
Some records contain geotags. Data comes from information systems of distributors and not every
market has centralized data persistence – while some markets have access to shared information
services that enable data exchange between distributors and manufacturers.
The third dataset comes from a retail network in America – a sell-through case. We have a month of
operations for two stores. Each record represents an order line item and is a timestamped record of
the moment bar code has been scanned at cash desk.
We structure our knowledge discovery exercise in line with recommendations of CRISP-DM (CRISP-
DM consortium, 1999) and consequently address the problem from perspectives of understanding
business, data, capacities for deployment and underlying principles of fundamental
interconnectedness of all the things in human dynamics that demonstrate properties of small world
models.

9
Heterogeneous data limits global application of analyses we used and does not allow for cross-
comparison between two manufacturers. Examples of inconsistencies we have already faced include,
but not limited to: different features, incomplete data, delays in data submission and batch entry. All
those may skew behavioral patterns and therefore should be taken seriously. The most annoying
example of incomplete data in both sell-out datasets is that date information is limited to calendar
date – thus we leave some promising time series analysis techniques for the later stages of this
project – until the moment we have timestamps.
In the course of data preparation, we extract, transform, load data, and produce statistics in Python.
For supervised learning part of this project, we use KNIME Analytics Platform. On top of the subject
data, we integrate weather information from external provider. For some of the analyses, we
generate quasi-time-series data – thus capturing trail of events triggered by travelling sales person.
Our exercises in feature engineering vary from rather widespread RFM analysis to ergodic and
stationery hypotheses check. We demonstrate that chosen parameters can enhance decision-making
capacity in various setups of national-wide distribution of consumer goods.
3.2. POWER LAWS
Recent discoveries in dynamics of complex systems suggest that Poisson distribution, widely used in
operations and statistics to describe stochastic behavior of unrelated events, do not describe real
world systems very well (Barabasi, 2003). Surprisingly, statistical laws that approximate processes in
complex interrelated environments – Pareto (power) law, and Zipf distribution have long history and
only now humanity started to realize mechanics that lead to skewed heavy-tailed distributions in the
real world. Here we provide brief overview of fundamental research that shaped our project.
Pareto principle (also known as 80/20 rule) – a notion that 20% of activity accounts for 80% of result
– was first observed by Italian statistician and an economist Vilfredo Pareto in late XIX century and its
implications range from wealth distribution in societies to size of craters on Moon. Until recently,
there were few explanations of this skew. One of the first research that connected power laws to
networked structures that nowadays received wide use in modelling complex systems, was study of
real world networks (the neural network of the worm Caenorhabditis elegans, the power grid of the
western United States, and the collaboration graph of film actors) that discovered small-world
properties and suggested alternative to the use of random graphs (Watts & Strogatz, 1998).
We model events in sales of consumer goods as network or multimodal multi-partite graph that
captures interactions between actors: distributor-customer, manufacturer-customer, salesperson-
customer, manufacturer-salesperson. Reasonably, we expect to discover fundamental feature of real
world networks – power law. Supposedly, a universal explanation for heavy tail distributions in
human dynamics (Bees, York, & Barabasi, 2005) – a probability density function of event of size x:

10
The best fit we find (see Figure 6) is the distribution of unit sales among customers – net amounts
along customer lifecycle. Immediate implications – classification of existing customer base and
enhancement of master data. We elaborate on this in detail in the next chapter (see 3.3.).
Figure 6. Unit sales distribution in 34915 stores. The situation customer bought three times more is
nearly nine times less likely to happen. Probability density function in double logarithmic scale and
best fit power law we discovered in four years of traditional retail network order items.
Multiple signatures of power law (Alstott, Bullmore, & Plenz, 2014) in raw data definitely suggest
small world models for the system – and we apply recently developed techniques of graph analysis
towards network objects we draw upon series of transactions. We experiment with frequent graph
mining – a search for recurring sub-graphs, and discover recurring patterns of travel between
customers – we observe traces of repeatable routes throughout weeks (see Figure 4). The most
intriguing observation is that tendency to leave clearly repeatable trace is a personal characteristic –
even after reassignment into different area, sales person maintains fraction of recurring travels.
The term small-world was coined by Stanley Milgram in his remarkable experiment that revealed
human capacity for efficient navigation in social networks by using local information about network
structure only (Milgram, 1967). Forty years later, an algorithmic explanation of the phenomenon
emerged when Jon Kleinberg had drawn general conclusion for small-world networks: that the
correlation between local structure and long-range connections provides fundamental cues for
finding paths through the network (Kleinberg, 2000). Further research started to reveal small-world
properties (high clusterization and short characteristic paths) for multiple real-world networks,
suggesting ubiquous nature of the underlying principles. The most intriguing finding, and a solid
mathematical model of network formation processes based on priority of activities and preferential
attachment suggests idea that decision making processes results in small-world networks (Bees et al.,
2005). This finding opens plenty of opportunities for Pareto rule application in optimization problem
solving.

11
One of distinctive features of a small-world network is degree distribution – number of edges
connected to nodes follows power law and when plotted on double logarithmic scale, results in a
straight line (Watts & Strogatz, 1998). This feature has name of power law signature. Only recently,
the problem of fitting of power laws was solved and nowadays we have tools that define parameters
of distribution at reasonable computation cost (Gillespie, 2014). Testing for power law becomes
standard step in data analysis workflow for all those who use network models. It is remarkable that
most of real world networks very well approximate power law with exponent ranging between 2 and
3 (Newman, 2008).
More surprising discoveries emerged when researchers started to study World Wide Web (Broder et
al., 2000). Not only power laws emerged in a structure of hypertext links between separate
documents and websites, but also the way humanity structures information and relates concepts
seem to be a small-world network. Study of how people navigate Wikipedia that a group of
researchers turned into a game (West & Leskovec, 2012) where participants have to reach one article
from another in minimal number of hops between intermediate topics demonstrated how easy is
next item prediction – and we see multiple applications in the real world ranging from assisted
search and recommendation systems to predictions of taxi trip destination (de Brébisson, Simon,
Auvolat, Vincent, & Bengio, 2015). Same principles define underlying structure of natural languages.
The way how recurrent people are in addressing problems of information navigation and wayfinding
in real world and social structures supports our idea of a good sales person being repetitive.
Networks are of great interest not only because their structure suggest solutions for multiple
problems of ranking between nodes, but also because topology can greatly influence diffusion over
network. News propagation between websites, rumor spread in communities, or epidemic dynamic –
these processes depend on underlying structure (Cheng, Adamic, Dow, Kleinberg, & Leskovec, 2014).
New direction of studies in the area of network structure reconstruction based on timing of events in
the system resulted in a family of algorithms. Once connections between nodes defined, it is possible
to reason about influence, paths and directions of diffusion, predict outreach and classify system
response to infusion (Leskovec, Huttenlocher, & Kleinberg, 2010). In trade marketing, these
algorithms can address the problem of campaign classification – and help in judging what works from
what does not.
A recent study discovered that artificially influenced positive bias could occur in a socially networked
system. That suggest mechanics for how to increase rating of a product, up-vote a news article, or
create social buzz about a product. All these processes relate to that of promotional activity in trade
marketing – suggesting new methods of promotion planning and evaluation. Interestingly, while
social systems accept positive manipulation, negative manipulation does not create hype and
collective behavior balances out the introduced artificial bias (Muchnik, Aral, & Taylor, 2013). Such
mechanics suggest that rather than blaming competitions in face of customers, it is more efficient to
focus on promotion of own products – chances for positive hype are way better.
Real world problems contain dependencies that stretch beyond single graph representation and
require modelling of multigraphs with heterogeneous nodes (Cossio et al., 2012) and even networks
of networks. Our research of processes in consumer goods industry suggests multiple networks
within the system and choice of industrial grade systems capable of addressing this task is limited
(Leskovec & Sosic, 2016). Current frontier of research lies in higher level order structures on

12
networks and algorithmic perspective of frequent graph mining has just recently been addressed,
providing new methods for reading patterns in complex systems (Benson, Gleich, & Lescovec, 2016).
What makes networked models so attractive is that graphs serve a level of abstraction and allow for
use of algorithms from different fields: time series classification techniques developed for meme
propagation tracking can redefine view on marketing campaign effectiveness evaluation; next item
prediction problem that has been solved for assisted search can address sales person route planning
or cross-selling; community detection methods can address customer classification, to name a few.
Moreover, in the context of machine learning, network representations are indispensable source for
new features of data.
3.3. RFM
In order to communicate need for customer classification we use existing framework – RFM analysis
– marketing technique that emerged in direct mail industry in 80-s years of XX century. Method
received its name according to impact of recency, frequency, and monetary parameters on chance of
future sale. Contrary to what was expected, we discover that monetary driver dominates in
consumer goods, recency moves into second position while frequency has least determinant power
in our context. Thus, RFM method turns into MRF in consumer goods industry. At least we could
argue that it works differently not only because of different dynamics, but also due to different
categories studied: direct mail industry names ‘customer’ what is called ‘consumer’ in consumer
goods industry.
For both sell-out datasets, we order all customers by recency, frequency and monetary value and
equally bin the set into 5 categories of equal size (ABCDE), where A stands for most while E stands for
least attractive. At national distribution level we find patterns: 1) monetary A class customers
generate more orders and revenues than A classes of recency and frequency; 2) monetary value
defines chance for next purchase as good as monetary. For example (see Table 1), for 34915
customers, we run RFM classification over sales of 54 month – and for the 55th month we analyze
distribution of sales among classes of each variable.
Recency
Frequency
Monetary
class units orders
class units orders
class units orders
A 219585 21259
A 182671 18684
A 214353 23438
B 19631 5720
B 27020 5731
B 30932 5682
C 10121 2125
C 23028 3709
C 5410 1203
D 3310 1145
D 16140 2260
D 1981 471
E 940 735
E 2651 457
E 911 190
Table 1. A month of sales demonstrates that A classes generate most orders and total revenues.
Monetary exceeds Recency in orders collected by class A.
13
We can see that every variable of RFM method performs well in isolation, so the next step is a
combination of two factors – monetary and frequency.
3.4. FM
The classification of the customers into two dimensions fragments data into 25 segments (see Figure
7). Combination of three dimensions results in 125 segments. This technique proved to be easy to
communicate - profitability of segments varies and optimization decisions fit 80/20 rule – logic is
straightforward and understood by business.
Figure 7. Distribution of net sales and orders between segments of customers obtained by binning
monetary and frequency parameters into five categories. Pareto (80/20) rule works in customer
dimension – data represents operations in Eastern Europe along 4 years. Note: % do not sum up to
100 due to rounding
We use this pair of dimensions – frequency and monetary – together with some machine learning
techniques to solve problem of predicting whether a customer is going to buy or return a seasonal
product, given the weather conditions. We elaborate more on this topic in section 3.8.
This approach reveals the only weak point of the RFM method – segments of customer base vary in
size – this issue does not allow for straightforward comparison. Yet, normalization is a solution for
this issue as long as people in business are capable of operating fractions and metrics more complex
than counts.
3.5. R
We study Recency separately. First, we analyze inter-event time intervals and discover, that although
customer service seems to be periodic, there are noticeable gaps in the pattern of visits (see Figure
5). For example, a customer that has been normally visited at weekly basis, has several disruptions
AA customers - best
EE customers - worst

14
and intervals between consequent purchases increase drastically – just to return to normal behavior.
On one hand, such bursts of non-activity are not something unexpected and non-Poisson dynamics
emerge in somewhat alike setup – priorities in human decision making lead to these skewed
distributions (Bees et al., 2005) that cannot be described by mean values. Yet, on the other hand,
sales force has clear objectives for regular maintenance of customers – and consumer goods industry
is driven by rotation and distribution – and it is not only us, but also every sales manager is who
expects visit pattern regularity.
Moreover, when working on a sales force merge project for Nestle in Ukraine in late 2008, we had
conducted time and motion study in order to capture effort that each of several categories receives.
That project brought up knowledge that in dedicated sales force key performance parameters –
inter-visit intervals, duration of visits, time spent on particular activity – all those follow Poisson
statistics as it is expected from repeatable routine operations. In a situation of shared sales force that
works for distributors and sells not only our products, but also those of competitor, we did not see
the expected pattern.
Therefore, we developed a new feature for our data and, for every day of the observation period,
computed minimal distance to a different customer – nearest served neighbor. The idea behind such
statistic is to capture recurring visits to neighborhoods, if such exist. We discover that all of sales
persons in population demonstrate high level of regularity in visits to areas – weekly pattern emerges
suggesting that our subjects indeed have objective to maintain rotation in designated areas.
Moreover, when we analyzed first orders taken on every day, we discovered that sales
representatives started their journeys in recurring neighborhoods. All that suggests that sales force is
indeed regular, yet fragmentary nature of data distorts the resulting picture.
When plotted together (see Figure 5), recency and distance to the nearest served neighbor reveal
that regular pattern of visits to neighborhoods does not necessarily result in recurring sales at
particular customers.
3.6. TRAVELLING SALES PERSONS LEAVE TRACES
We believe the working environment of sales team to be highly regular and routinized. That is exactly
what is expected from field force. This way of thinking not only corresponds to common sense, but
also opens opportunities for building predictive models that address vital topics of demand
forecasting promising area for enterprise machine learning. One of such application is the next item
prediction problem – guessing where sales person would go after a certain customer visit – and
pointing to the customer to be served next. Since distributor sell-out data are fragmentary, we first
develop a set of analyses that would demonstrate this kind of regularity.
We create a networked model of travelling sales person and describe their behavior as a directed
graph, where nodes correspond to customers, and edges – to consequent visits (see Figure 8). For
every sales representative, we look into sales history and draw edges between customers that were
visited on the same day.
15
Figure 8. We use history of orders collected by a sales person and customer locations in order to
build travel graph. Our customer has invested effort into mapping of customer coordinates and this
enables use of geographical layout for visualization.
Rationale behind analysis of personal travel routes grounds on several findings that were recently
reported. First, it is human navigation and wayfinding process (West & Leskovec, 2012) – we, as
species demonstrate high tendency to stick to previously known routes and associations – a mind
trick that makes humans human – we are predictable. Remarkably, this feature leads to models that
predict with high accuracy final destinations of trips based on few steps taken, sentence completion
(e.g. search query auto completing) based on several words typed, or fraud detection algorithms –
and multiple applications other than listed. Second, sales representatives, assigned to a territory,
have to solve travelling sales person problem for themselves – that limits route to one of few sub-
optimal solutions. Finally, taking into account scarce resources and especially time pressure (usually,
visit to a store takes few minutes and includes multiple activities: stock check, assessment of
merchandising standards, order picking and so on) we find no reason to believe much variance is
possible at all.
We design yet another data feature and apply frequent graph mining technique – search for
recurring sequences of visits (see Figure 6). In order to compute this statistic for every sales person
we order a sequence of visits and run a sliding window, picking three consequently visited customers
at a time. For every sequence that is content of the window, we check, whether it recur. We use
fraction of recurring sequences versus total number of customer visits as a measure of regularity.
What we find is somewhat surprising. Contrary to what was expected, not every sales person
demonstrates regularity. Moreover, regularity – a fraction of recurring sequences – varies from
highly regular to a behavior that looks very chaotic. Some subjects have regular weekly journeys as if
they were following a list with minor deviation from typical path – more likely to miss some
customers rather than change an overall order of visits. This degree of regularity seem to be a
personal characteristic – even after reassignment to a different area, a person keeps this proportion
16
of traceable recurring journeys. Also, when we measured whether or not these sequences recur in
different order (all possible combinations), we discovered linear correlation between two obtained
statistics. What is even more surprising is that distribution of regularity measure in population
follows power law very closely.
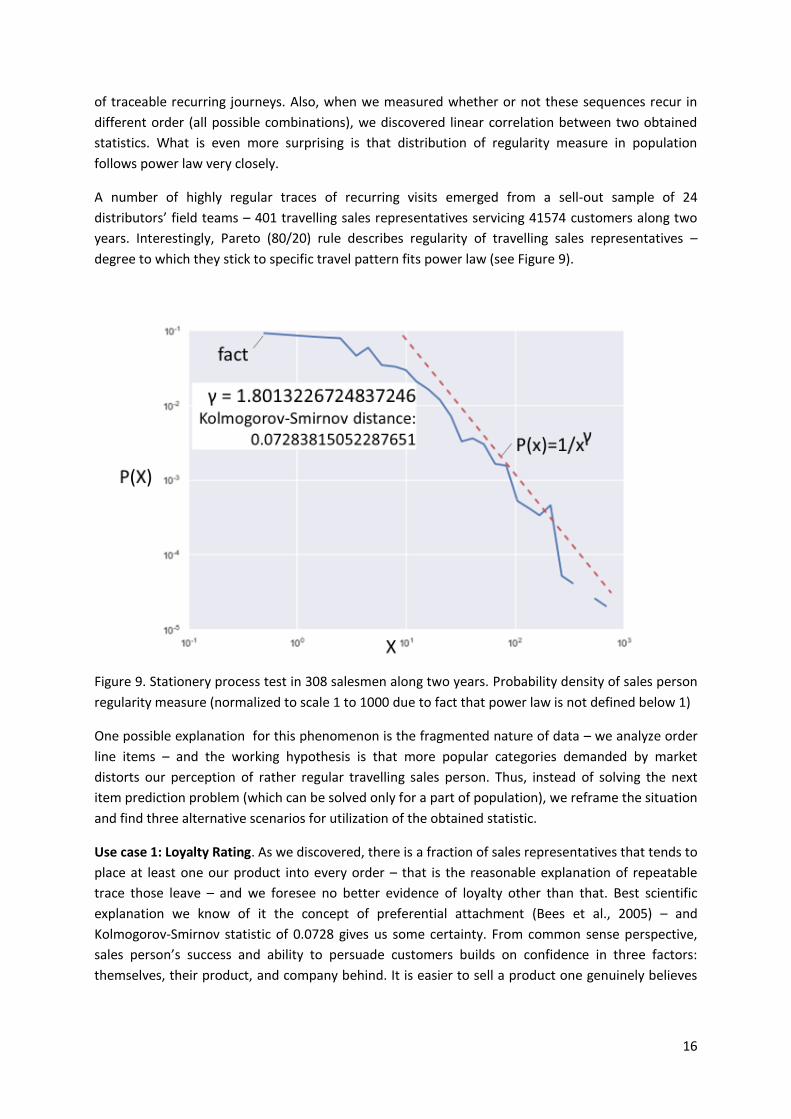
A number of highly regular traces of recurring visits emerged from a sell-out sample of 24
distributors’ field teams – 401 travelling sales representatives servicing 41574 customers along two
years. Interestingly, Pareto (80/20) rule describes regularity of travelling sales representatives –
degree to which they stick to specific travel pattern fits power law (see Figure 9).
Figure 9. Stationery process test in 308 salesmen along two years. Probability density of sales person
regularity measure (normalized to scale 1 to 1000 due to fact that power law is not defined below 1)
One possible explanation for this phenomenon is the fragmented nature of data – we analyze order
line items – and the working hypothesis is that more popular categories demanded by market
distorts our perception of rather regular travelling sales person. Thus, instead of solving the next
item prediction problem (which can be solved only for a part of population), we reframe the situation
and find three alternative scenarios for utilization of the obtained statistic.
Use case 1: Loyalty Rating. As we discovered, there is a fraction of sales representatives that tends to
place at least one our product into every order – that is the reasonable explanation of repeatable
trace those leave – and we foresee no better evidence of loyalty other than that. Best scientific
explanation we know of it the concept of preferential attachment (Bees et al., 2005) – and
Kolmogorov-Smirnov statistic of 0.0728 gives us some certainty. From common sense perspective,
sales person’s success and ability to persuade customers builds on confidence in three factors:
themselves, their product, and company behind. It is easier to sell a product one genuinely believes

17
in, so in an uncertain situation, e.g. customer asking for a category item (instead of a specific
product), they offer an option that is best to their belief.
Use case 2: Post-Promotion efficiency evaluation. As we find, there are periodic disruptions in sales
history of particular customers (see Figure 5). We believe that successful trade promotions result in
better sales and thus regularity should increase during the trade activity period. That is the essence
of trade marketing – increase of a chance to put certain product into every market basket. This kind
of comparison is available to manufacturers that maintain information systems capable of storing
detailed information about marketing and trade marketing plans and execution – so that sales orders
could be linked to specific campaigns. SAP Trade Promotion Management is an example of such a
system. As we know, 2/3 of trade promotions do not break even (Nielsen, 2014), and this measure
could improve classification – differentiation of working marketing tactics is the most promising area
for quick wins.
Use case 3: Market As A Sensor. For those who mastered trade promotion classification and found
out which tactics work best, we point to an opportunity to establish surveillance over competition.
The rationale behind is that market (and sales representatives) demonstrates nearly the same
reaction to trade promotions and capacity is limited. Thus, a successful promotion run by one player
disrupts sales of another – and those disruptions signal competitive activity. We believe market
reacts nearly the same way to similar motivation – and systematic analysis of competitor activity in
trade would result in strategy derived from observed tactics. The approach of strategy inference
from tactic analysis is not new – what we suggest, as innovation is classification of response derived
from impact on our sales, not only competitor activity and publicity observation.
3.7. ASSOCIATIONS AND DISSOCIATIONS IN MARKET BASKETS
Market basket analysis is a widespread modeling technique based upon notion that people buy
associated items. Usually rules build like IF {fish, no vegetables, and no wine} THEN {chips, beer}.
These methods build upon observed facts. Our method, in contradistinction, is based on the absence
of observed associations in that it is assumed there are substitutive forces (Porter, 2008) that
prevent simultaneous purchase of certain goods.
Dynamics in the system change over time – for example, sales of coffee are more intensive in
morning hours in general. Relations can change over time. That is why study of how graphs of
associations develop over time is part of the workflow. We discover expected properties of small
world – densification of graphs over time, connected components, community structures and bridges
that connect these.
For example, we study how associations between products in shopping baskets develop over time.
An undirected graph of co-ocurrencies between products built from order line items – data coming
from cash desk of a supermarket demonstrates dynamics in one of our experiments. The goal was to
define an optimal time window – number of order lines to process. The idea was to find optimal
granularity that would spot changes in graph topology – from triads (minimal higher order structure)
to giant components. Figure 10 demonstrates dashboard we use for this kind of analysis.
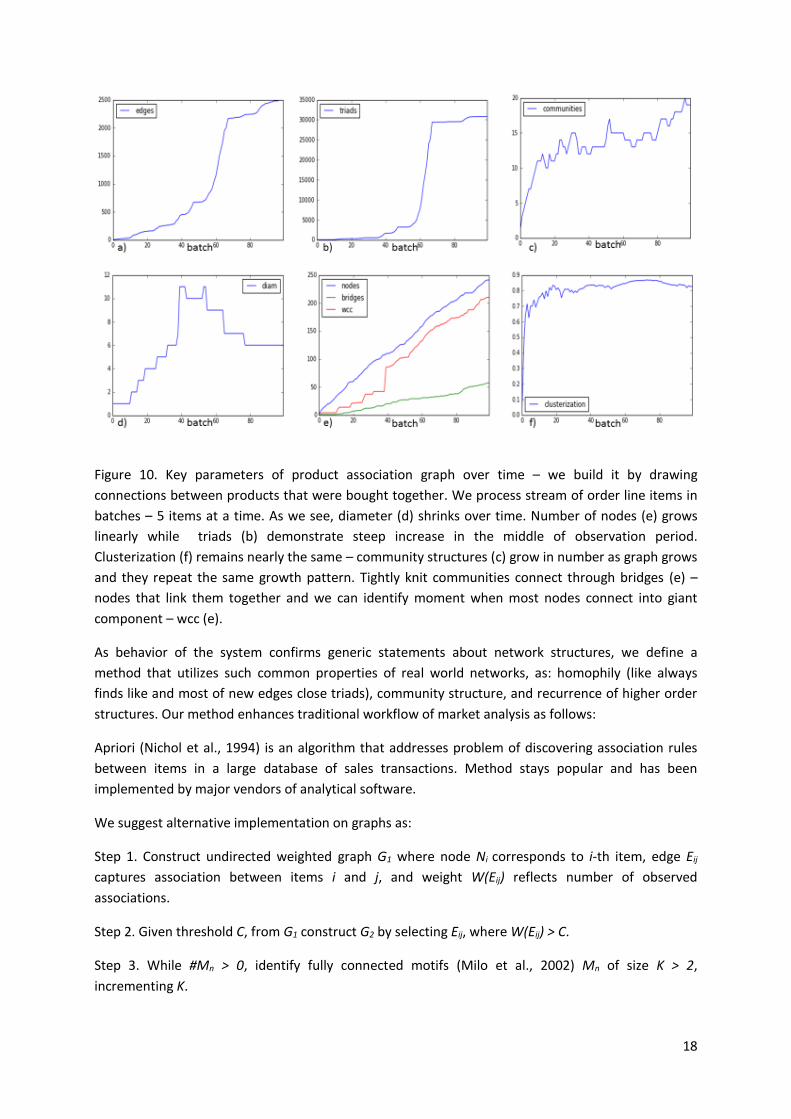
18
Figure 10. Key parameters of product association graph over time – we build it by drawing
connections between products that were bought together. We process stream of order line items in
batches – 5 items at a time. As we see, diameter (d) shrinks over time. Number of nodes (e) grows
linearly while triads (b) demonstrate steep increase in the middle of observation period.
Clusterization (f) remains nearly the same – community structures (c) grow in number as graph grows
and they repeat the same growth pattern. Tightly knit communities connect through bridges (e) –
nodes that link them together and we can identify moment when most nodes connect into giant
component – wcc (e).
As behavior of the system confirms generic statements about network structures, we define a
method that utilizes such common properties of real world networks, as: homophily (like always
finds like and most of new edges close triads), community structure, and recurrence of higher order
structures. Our method enhances traditional workflow of market analysis as follows:
Apriori (Nichol et al., 1994) is an algorithm that addresses problem of discovering association rules
between items in a large database of sales transactions. Method stays popular and has been
implemented by major vendors of analytical software.
We suggest alternative implementation on graphs as:
Step 1. Construct undirected weighted graph G1 where node Ni corresponds to i-th item, edge Eij
captures association between items i and j, and weight W(Eij) reflects number of observed
associations.
Step 2. Given threshold C, from G1 construct G2 by selecting Eij, where W(Eij) > C.
Step 3. While #Mn > 0, identify fully connected motifs (Milo et al., 2002) Mn of size K > 2,
incrementing K.

19
It is easy to see that resulting sets Mn are identical to output of Apriori algorithm, yet graph
representation allows us to use homophily property of real world networks that is a basis for link
prediction on graphs (Liben-Nowell & Kleinberg, 2003) and move further.
As we know, presence is the measure of absence (Hegel., 1817). That is why we test G1 built upon
series of transactions from retail for homophily by measuring weight distribution between edges Eij
against fraction of common associations against total associations for both Ni and Nj. As we can see
from Figure 11, most of weight on structure stays in highly mutually interconnected area, while
structural holes there are rare.
These rare structural holes, in our opinion, represent dissociative relation between items. Items
happen many times in similar contexts (have many associations in common), but never together. We
propose an algorithm for finding such associations in transactional databases that uses the same
input as Apriori:
Step 1. Construct undirected weighted graph G1 where node Ni corresponds to i-th item, edge Eij
captures association between items i and j, and weight W(Eij) reflects number of observed
associations.
Step 2. From G1, construct inverse graph G3 by doing bit flip of G1’s adjacency matrix and zeroing
diagonal.
Step 3. For every edge Eij in G3, for Ni and Nj, compute minimal fraction F(Eij) = min(F(Ni), F(Nj)) of
common associations from G1.
Step 4. Given threshold D, from G3 construct G4 by selecting Eij, where F(Eij) > D.
Step 5. While #Mm > 0, identify fully connected motifs Mm of size K > 2, incrementing K.
Resulting sets Mm are sets of mutually exclusive items – there will be only one of those in a market
basket.
We apply proposed algorithm to our only sell-through dataset.
First, we create undirected association graph G1 where nodes represent each of 203 product
categories (our customer invested time into creation of product hierarchy) and weighted edges stand
for number of times two categories connected by edge appeared together on a market basket
throughout observation period.
At this moment we test system for homophily – and choose to test it as a link prediction problem
(Liben-Nowell & Kleinberg, 2003) – the reason for doing so is wide availability of algorithms. We use
Supervised Random Walk (Backstrom & Leskovec, 2010) implementation for SNAP library (Leskovec
& Sosic, 2016) and find out that algorithm predictions are 83% accurate. We perform the test by
running a sliding window over the series of transactions and algorithm predicts new edges by
observing only minor part of G1. Such rate of accurate predictions from a method that utilizes
homophily property as its foundation allows to state our system has this property. We call relations
in G1 complimentary.

20
Second, we create undirected dissociation graph G3 by applying bit flip operation to adjacency matrix
of G1 and removal of self-edges. As a result, edges in G3 represent pairs of categories that have not
been observed. In other words, edges in G3 represent structural holes in G1.
As we can see from Figure 11, chances for having an edge between two arbitrary nodes rise as
fraction of common complimentary nodes increases, while number of structural holes drops.
Figure 11. Category relations, normalized to scale [0, 1]
Third, we create an undirected graph G4 as sub-graph of G3 transferring only those edges where
fraction of common complimentary categories between two nodes is above 80%. We argue G4
reflects dissociative relation between categories since these appear many times on similar market
baskets yet never go together. Such relations can be interpreted as product substitution – one of
fundamental factors that shape strategy (Porter, 2008).
The first aspect of using a graph is creating a graph. Once a graph has been created, it can be
subjected to algorithms that quantify aspects of its structure, alter its structure, or solve problems
that are a function of its structure (Rodriguez & Neubauer, 2010). However valuable, G4 is still hardly
readable by humans – that is why we decide to split it into smaller structures.
Our first attempt of dividing relatively big G4 into smaller parts is dictated by core-periphery property
of real-world networks, which we observe in G4. As it was recently discovered, community overlaps

21
are more densely connected than the non-overlapping parts, which is in sharp contrast to the
conventional wisdom that community overlaps are more sparsely connected than the communities
themselves (Yang & Lescovec, 2012). We explain fitting process on Figure 12.
Figure 12. Fitting of Community-Affiliation Graph Model. a) Initial graph G b) Community G-1 defined
by fitting procedure c) Community G-1 separated from graph G d) Community G-1 has flat structure
that can be used as visual aid for category managers as a whole or can be partitioned by
conventional methods into smaller elements.
As we can see from Figure 12d, network can be seen as a patchwork of recurring elements – triads,
quadrats, bowties, and so on. That is why we try an alternative to partitioning and go for motif
search (Milo et al., 2002). In order to do so, we integrate the network motif detection tool
mfinder1.2 generously shared by authors into our workflow. Frankly, our choice of software for this
step has been limited by operational system (we use Windows) while cutting edge research in this
area reside in the *nix world. We leave those experiments for the future.
Complete motifs (fully connected graphs) are of interest for us – it is a nice story to tell prospects:
“Look, here’s a list of N categories. Bought in similar contexts, but never together.” We discovered 84
complete motifs of 4 nodes, and 5 complete motifs of 5 nodes in G4. We foresee at least three
immediate applications for this result.
Use case 1: input for price sensitivity analysis – traditionally substitutes were picked by humans.
Use case 2: promotion portfolio optimization for retailors – as we can see, some categories follow
‘there should be only one’ rule, so running simultaneous promotions might be not a wise idea.
Use case 3: cannibalization - reduction in sales volume, sales revenue, or market share of one
product as a result of the introduction of a new product by the same producer – same as use case 2,
but from manufacturer’s perspective.

22
Both methods are computationally expensive and control of input graph size becomes crucial.
Overall, network representation of complex systems is not only a good exploratory technique, but
also a promising area for enterprise machine learning. As Fujitsu research demonstrated, networks,
written as tensors and fed into deep neural network appear to be a winning recipe for chemical
component classification problem overperforming prior champion by 10% and reaching 80%
accuracy (Fujitsu Labaratories, 2016). Since networks are universal abstraction for many complex
systems, graph algorithms are universally applicable between disciplines.
3.8. END OF SEASON – PRODUCT RETURNS
One of datasets we explore belongs to company that runs seasonal products and returns of unsold
items at the season end are common (see Figure 13). Clearly, there is correlation between demand
(or returns) and weather conditions – that is why products got title ‘seasonal’ and we, instead of
measuring coefficients (which can be puzzling for business people that struggle reading boxplots),
address this rather as a machine learning problem – given weather conditions, how well can we
predict whether customer is going to buy or return products. Rationale behind such analysis is that
weather forecast accuracy has amazingly improved over last years and accurate prediction of daily
summaries for the following week, or detailed up-to minute alerts for the following hour became
reality. For business, that opens opportunity to plan return logistics in advance or to run a promotion
that incentivizes stock clearance.
Our dataset is quite scarce and we go for external provider in order to enhance it. Currently there are
multiple opportunities for those seeking historical records of weather: Global Surface Summary of
the Day (GSOD) provided free of charge for scientific and educational purposes by National Oceanic
and Atmospheric Administration of the USA; Dark Sky website; IBM company Weather.com; and
many other providers. Weather.com and Dark Sky provide convenient API that allows for seamless
data integration. The latest daily summary data are normally available 1-2 days after the date-time of
the observations used in the daily summaries. Historical data are generally available for 1929 to the
present, with data from 1973 to the present being the most complete. Over 9000 stations' data are
typically available. As primary data source for weather conditions we choose rp5.ru – and rationale
for choosing this provider is its generous use agreement.
For our experiment, we aggregate hourly measures into daily summaries and enhance sales order
items with new features: temperature, air pressure, precipitation, humidity, wind speed, wind guts,
dew point, minimal and maximal temperature during recent 12 hours, and minimal temperature at
ground level. After several experiments with different feature sets, we end up combining monetary
and frequency variables we used for RFM analysis with minimum, maximum, and average
temperatures and corresponding weighted moving averages for the last 3 and 7 days for a given
date. We normalize values of every variable by subtracting mean and dividing the rest by standard
deviation. Since returns take place in the middle of autumn, we subset data to second half of year of
four consequent years in order make our dataset more balanced and thus achieve 20/80 ratio
between returns and orders. We also remove timestamps from data, so that classifiers rely only on
weather conditions and sales history. Resulting dataset of 1283 items goes for 60/40 stratified
sampling and we train three classifiers for this binary problem: a logistic regression, ensemble of 100
random trees, and an artificial neural network – standard tools from KNIME Analytics Platform
version 3.1.0.

23
Figure 13. Seasonal effect in sales and comparison between classifiers. Barbeque supplies do not sell
well in autumn and some customers (supermarkets) return goods to distributors. We combine sell-
out with weather records for a given city. Monetary and frequency measures define behavior of a
customer very well as we can see from performance of a range of classifiers trained on a set of 769
examples and tested against 514 (both sets come from stratified sampling of 1283 data records) that
represent sales in autumn throughout 4 consequent years.
We find such approach in solving predictive tasks with machine learning way more effective
compared to reasoning with statistical measures. No surprise, people from business understand
prediction better than meaning of correlation coefficients. Tendency is to provide business with black
box platforms that automatically choose best classifiers for a given task, so that one day forecast
would be produced by regression, while the other day artificial network wins the tournament. Given
all that, we foresee human role in a creative part of machine learning workflows – task creation,
feature engineering, and so on, rather than in algorithm fine-tuning.

24
4. PROTOTYPE DEPLOYMENT
4.1. TRADE MARKETING DATA LANDSCAPE
Current offer from Trade Promotion Management system vendors includes support for business-to-
business-to-consumer (B2B2C) scenarios – typical for modern trade – operations with national
networks of supermarkets (Key Accounts(KA)) fit into this business practice. Some retailors
(Walmart) even encourage suppliers into joint business planning and provide information system for
respective processes.
Meanwhile, B2B2B2C process of consumer goods distribution through regional and national
distributors that supply traditional retail outlets remains not yet addressed (see Figure 3). Planning
and tracking of trade budget remains at high level. We propose a set of data analyses that increases
granularity of understanding the market and provides insights into behavioral patterns of prevailing
majority of customers yielding more than half of business – despite growing share of modern trade,
traditional retail remains important channel for majority of consumer goods accounting for at least
half of revenues.
Recent review of trade promotion management systems suggests (Gartner, 2016) more than 20
major vendors.
4.2. COMPONENT CHOICE AND IMPLEMENTATION SUPPORT
Information systems ensure data persistence and provide interface to knowledge and actions for end
users. Contemporary landscape of Trade Promotion Management solutions has emerged in early
2000-s and now a company that strives to take control of sales costs has a choice between tens of
vendors. After careful considerations and review of existing offer, we ended up with two criteria for
choosing a system:
Data Integration tools and capacity
Data Quality tools and capacity
To our opinion, supported by panel discussion of C-level executives, these two capabilities address
traits and challenges in B2B2B2C scenario of consumer goods distribution. Multiple sources of
heterogeneous data and information make first a paramount, while requirement for data quality
capability ensures highest quality of analysis. That high certainty in data supported by transparent
statistical techniques can make advantage is the paradigm of contemporary information system
management. Among all competition, SAP solution stands out in both capacities (Gartner, 2015;
Gartner, 2016) and our choice of benchmark solution is obvious.
From deployment point of view, SAP stands out of competition thanks to a standardized
implementation methodology SAP Activate – a new unified approach (SAP AG, 2015) that replaces
previous five stage waterfall model of project delivery (SAP AG, 2011) and harmonized approach for
on premise, cloud, or hybrid implementations . Based on forty years of collaboration with industry
leaders, SAP value proposition is set of Best Practices – key decision driver for ERP use (Ruivo,
Oliveira, & Neto, 2014) – embedded into the system and many companies go for implementation in
order to upgrade their processes. That is why Organizational Change Management is an integral part

25
of the implementation methodology and second stream in the overall importance ranking after
Project Management (SAP AG, 2009).
According to SAP Activate, project goes through four phases:
Prepare. The project is initiated and planned, including quality and risk plans. The system
environment is set up, including best practices for ready-to-run processes.
Explore. The customer team explores SAP solution capabilities while the system integrator
researches the customer’s business. Together, they use fit/gap workshops to identify the
configuration and extensions that best meet customer requirements.
Realize. The team configures and extends the system, based on prioritized the requirements
captured in the Explore phase. Configuration and build are done in short cycles, ensuring regular
validation and feedback from the business. Structured testing and data migration activities ensure
quality.
Deploy. Final preparations before cutover to production ensure that that the system, users, and data
are ready for transition to productive use. The transition to operations includes setting up and
launching support, then handing off operations to the organization managing the environment.
During each phase, the project team produces a prescribed set of deliverables that serve as input for
the subsequent steps. The methodology provides examples of key project deliverables, including a
procedure description of how to prepare and complete the deliverable. There are accelerators for
each phase and work stream, including templates, questionnaires, checklists, guidebooks, and other
tools that facilitate the efficient, consistent, and repeatable delivery of implementations and
upgrades of SAP solution landscape.
Standard methodology assumes organization of project activities into several interrelated streams:
Project Management, Organizational Change Management, Training, Data Migration, Data Archiving,
Value Management, Business Process Management, Technical Solution Management, Application
Lifecycle Management, Test management, and Cutover Management. All work in SAP
implementation project is grouped into delivery-oriented packages, and accelerators enable
standardized and rapid execution of all necessary work.
We build our approach on artefacts of ASAP and address key pain areas of information system
deployment project: early stakeholder engagement, data ownership culture, and data driven
decision making (SAP AG, 2007, 2009). All these issues can undermine large information system
implementation project and achieving the only goal – acceptance and routinization might become
uneasy.
However advanced implementation methodology is, adoption of new processes becomes challenge
in every project – people do struggle change and it was Rogers who first found out that innovators
and early adopters are minority (Rogers, 2010). Timely communication and balanced incentives for
different groups of stakeholders (all those affected by projects) can greatly improve chances for
successful implementation (see Figure 14) (SAP AG, 2007). We develop a set of analyses that support
implementation of Integrated Planning process (details described in Section 4.4) and incentivize
switch to new practices.

26
Figure 14. Timing of intervention is essential for successful adoption of change (image credit: SAP)
Moreover, all big systems from any vendor have one trait in common – time of delivery that
stretches for month and even years – long enough to lose patience. We address this challenge by
suggesting introduction of the Knowledge Discovery stream into implementation project structure
and reinforcement of deliverables of Explore phase of SAP Activate with insights that go further than
conventional statistics. Such enhancement results in several advantages for both system integrator
and customer.
First, it is quick wins in new practice adoption. We intentionally focus on Integrated Planning and
Trade Activity Planning processes – quite advanced business routines that require thinking about
sales planning in multiple perspectives: brand, channel, and category management – and reaching
excellence in every of those requires multiple small changes in working with market. Every analysis
we built intends to highlight necessity for those changes. It is surprising, how tiny could be insights
that trigger business transformation. In our experience, a prospect company changed process of
trade activity planning from setting goals for regions to specific objectives for distributors based on
customer classification and channel performance – after seeing sales to channels on the map and
finding out that 20% of Customers accounted for 90% of revenue. Such insights change mood in
customer organization from ‘OK, we have been waiting a year for those reports, are they worth what
we have paid?’ to ‘Wow, that is actionable insight and we are looking forward to real-time analytics
we will get after system goes live’. Yet another advantage of early engagement is that understanding
data value spreads in customer organization thus enabling digital transformation.

27
Second, it is better quality of BI. Typical approach for big information system delivery is that BI part
of the project starts at later stage, after transaction flow has been defined, and necessary
configuration has been delivered and tested. Normally, first batch of BI reports consists of standard
content. Such approach proved robustness, yet we foresee an opportunity to build better reports by
understanding statistical patterns in customer data. Such approach, as we believe, can result not only
in better quality of information system (and by quality we understand fulfilling customer
expectations), but also creates cross-selling opportunity for new reports and dashboards that
address discovered insights.
Third, it is better understanding of existing information architecture and available data sources that
builds upon results of Extraction, Transformation, and Load (ETL) – that improves data collection and
preparation for migrations into the new system as issues are identified at earlier stages of
implementation project. Also, as awareness of true value of data spreads in customer organization, it
is easier to build good data governance practices on top of this wake of success.
Finally, such approach builds trust. One of the canonic problems in information system
implementation is that ‘They know nothing about our business!’ opinion. Changing this situation
requires huge effort and we believe that small fast insights, such as pointing out overperforming
channels (for one of our prospects significant volumes in channel ‘Other’ became surprise that
triggered change in objective setting for some distributors), unrealistically planned promotions, or
winning product bundles – all those small things delivered at earlier stages of project build credibility
of integrator in the eyes of a customer.
4.3. REFERENCE BUSINESS PROCESSES
Processes, best practices, and benchmarks – these assets define value of information system in an
organization – and Trade Promotion Management users demand change management, guidance of
implementation and robust workflows from solution vendors (Hagemeyer, 2015). That is why we
address issues in transparency of trade spend planning, use, and monitoring by a process of
integrated planning. Solid and transparent volume planning and alignment routine can change
situation – some say it can be a silver bullet for consumer goods industry – and we claim it could.
Collaborative planning and involvement of partners into business development process is a reflection
of growing roe of retailors – sign of trend in vertical collaboration within industry – and an
opportunity for B2B2B2C process of distribution for consumer goods. Pioneers in trade marketing –
food manufacturers encountered challenges of this networked media years before other industries –
and contemporary body of knowledge is constantly evolving as more businesses undergo digital
transformation. No surprise, joint planning can benefit from insights that reside in sell-out data of
distributors.
We look into details of trade marketing activity planning process – the core activity of organization,
involved into category and channel management – regular review and alignment between marketing,
sales, finance, logistics, and manufacturing – supported out of the box by SAP CRM. One data
persistence, as well as periodic recap and discussion of issues and opportunities between all parts of
organization that are in charge of vital parts of operations – all that brings synergetic effect into

28
business, and improves not only quality of information available and quality of decisions, but also
builds solid foundation for behavioral baseline. Such baseline, measured objectively can set evident
basis for numeric reasoning in decision-making and management practice.
4.4. INTEGRATED PLANNING
Integrated Planning is the process of systematic review and alignment of all activities of marketing,
sales, logistics, and production functions. Consumer goods have to reach shelves timely, in necessary
quantities in order to ensure freshness and quality, industrial assets need utilization, and supply
chain has to have sufficient capacity to handle customer orders. All plans for promotions, activities at
points of sales, advertisement and so on – after internal alignment – at final stage reach agreement
on execution at stores.
Contemporary operations utilize two approaches to planning – yearly budget process, and a rolling
forecast. Both approaches have in common joint cross-functional team activity of planning against
observed performance – only horizon varies from a fixed yearly interval to a sliding window of
predefined length (usually 12 or 18 month) – whatever the option is, a team of experts aligns plans in
a series of workshops.
Channel management capacity – ability to differentiate in market according to consumer experience
– becomes of essence in modern operations. Not to be confused with omni channel CRM – concept –
which relates to seamless customer journey. Traditional and dominant channels in consumer goods –
traditional retail (convenience stores) and fast growing modern trade (supermarkets) – channel
competence builds upon understanding patterns of response to varying marketing stimuli we
research in the system.
Process of integrated planning can be set up in a company in a relatively short timeframe and it
consists of the following stages: analysis of current situation; channel prioritization; channel strategy;
channel tactics; customer commitment. Whole process takes one to two month for implementation
from the scratch during business planning period. It is essential to ensure clear process ownership
since the very beginning and trade marketing function seems ideal candidate for the position of the
process champion – the new approach naturally evolves from traditional responsibilities for
channel/category development and prioritization. Process structure is streamlined and integrity of
data is cornerstone – thus execution of joint planning sessions builds productive habits that maintain
and develop knowledge assets. Process key steps:
Analyze current situation. The marketing department has to be clear and realistic about the current
products, market, opportunities, and challenges so that they can devise a clear path from their
current to desired situation.
Prioritize channels. Strike the right mix of marketing channels and optimize marketing money so that
it can have maximum impact. This analysis intends to choose among the wide and complex range of
marketing channels those that help bring message to customers and pinpoint the ones that are most
effective at engaging those customers.
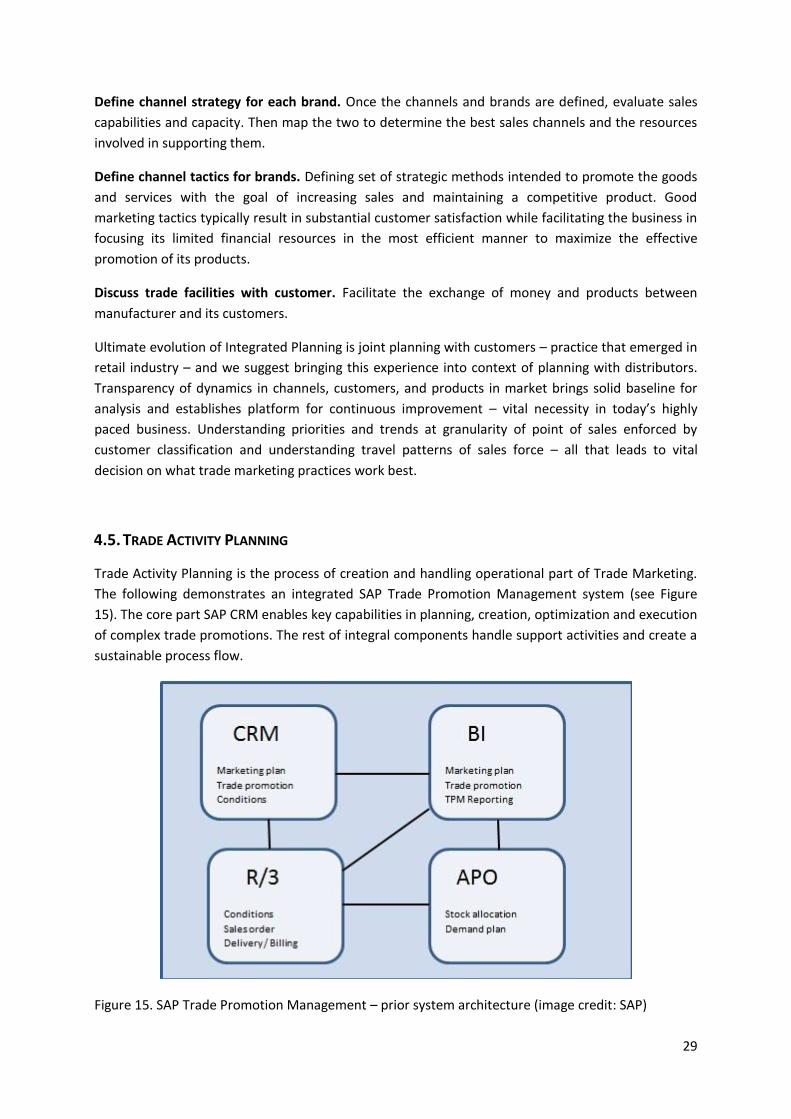
29
Define channel strategy for each brand. Once the channels and brands are defined, evaluate sales
capabilities and capacity. Then map the two to determine the best sales channels and the resources
involved in supporting them.
Define channel tactics for brands. Defining set of strategic methods intended to promote the goods
and services with the goal of increasing sales and maintaining a competitive product. Good
marketing tactics typically result in substantial customer satisfaction while facilitating the business in
focusing its limited financial resources in the most efficient manner to maximize the effective
promotion of its products.
Discuss trade facilities with customer. Facilitate the exchange of money and products between
manufacturer and its customers.
Ultimate evolution of Integrated Planning is joint planning with customers – practice that emerged in
retail industry – and we suggest bringing this experience into context of planning with distributors.
Transparency of dynamics in channels, customers, and products in market brings solid baseline for
analysis and establishes platform for continuous improvement – vital necessity in today’s highly
paced business. Understanding priorities and trends at granularity of point of sales enforced by
customer classification and understanding travel patterns of sales force – all that leads to vital
decision on what trade marketing practices work best.
4.5. TRADE ACTIVITY PLANNING
Trade Activity Planning is the process of creation and handling operational part of Trade Marketing.
The following demonstrates an integrated SAP Trade Promotion Management system (see Figure
15). The core part SAP CRM enables key capabilities in planning, creation, optimization and execution
of complex trade promotions. The rest of integral components handle support activities and create a
sustainable process flow.
Figure 15. SAP Trade Promotion Management – prior system architecture (image credit: SAP)

30
It is a remarkable example of the case when the-sum-is-greater-than-the-parts, and a distinctive
business scenario was designed in order to handle all typical events that take place in trade
promotion life cycle. The diagram below (See Figure 16) summarizes the flow of key decision points
of a trade promotion from planning to execution to analysis.
Figure 16. Trade Promotion Planning in SAP – process flow and key sub-processes (image credit: SAP)
The process starts with trade funds planning and this activity usually takes place at the headquarter
level. Later, plans go top-down to business units. The integration of Funds Management with the SAP
TPM strengthens the functionality and spends become transparent on every level – from strategy to
execution. End users include, but are not limited to: Key Account managers, product managers and
the brand managers at business units. They break down total into detailed funds plan and link pieces
of overall budget to various trade promotional activities.
System supports grouping and planning of funds for multiple entities: accounts, products, trade
spends, target groups. Every promotion defines combination of trade spend type and product
included in the activity. Detailed planning of specific trade promotions gives us a solid base for
classification and managers that use the funds have better understanding of expenses’ performance.
Integrated system enables administration, distribution, and consumption of funds – all tracked.
Trade promotions are planned for designated time slots and have specific objectives: increase sales,
launch a new product, create brand awareness, increase market share – to name a few. Integration
of trade promotions with trade deals and agreements provides extra options for budget handling.
These deals and agreements in SAP TPM are not only used as a basis for creating trade promotions,
but also serve as reference points and guidelines – the beauty of a system it that leaving process
boundaries is virtually impossible. Those trade deals and agreements systematically keep information
about accounts, products, dates and trade spends and serve as higher level information entity.

31
The trade promotions itself contain information such as key account, planning basis, objective, funds
plan, and status. On top of that, all the relevant promotion details like dates, products, planning, and
casuals are immediately available within the overview of the trade promotion for easy access and
navigation between items. For businesses that work with large number of uniform trade promotions
with common set of attributes, templates provide an effective way to increase productivity while
keeping high granularity of data for trade promotions.
SAP solution for Trade Promotion Management has predictive capability and thus can help to
optimize the trade spends and increase effectiveness by predicting and simulating the for the best
possible scenarios. All operations handled in CRM, trade promotions map to SAP BI key figures in
trade promotion planning layouts and there is no need to switch between applications – all work gets
done in the same user interface. Key account managers discover optimal combinations of price and
merchandising decisions for subsequent detailed promotion planning by running simulations and
comparing between sets of parameters.
In the process of modelling, one can play with multiple parameters, such as the optimization goal
and the assessment time as well as tactics and price range. The system will then create all possible
combinations of tactics, price points and timing. Based on the combinations presented by the
system, we can choose the scenario(s) we would like to realize.
Out of the box integration of SAP solution for Demand and Supply Planning with TPM brings scenario
of business planning to a new level and ensures that adequate availability of the products during
promotional periods. This includes, but not limited to: stock allocation, availability checks, automated
generation and alignment of production and supply plans, decomposition of plans into material
orders and so on. Perhaps, it is the only solution that supports out of the box capacity to handle
everything: from budget to production and dispatch.
Pricing conditions – each kind of trade spends have to be accounted differently - and rebates are
maintained in SAP ERP and are then automatically downloaded to SAP CPM for use in planning. The
processes that take place during and after trade promotion: billing, logistics and claims settlement
can be handled in SAP ERP and every transaction is linked to trade promotion so that every spend
occurred relates to particular activity. Such discretion provides unpreceded capacity for tracking
financial figures at lowest levels of discretion possible – SKU and Customer.
Seamless integration with SAP BW/BPS creates the most effective and comprehensive analytics
solution for the trade promotions – no surprise SAP TPM leads in all ratings. With its capacity for pre
and post trade promotion analytics, system provides truly delightful experience and brings valuable
insights one can count on. Empowered with timely and relevant detailed information, businesses can
effectively plan, design and launch successive trade promotions.
The offer from SAP provides businesses with solid streamlined workflow that integrates business
processes and provides one view for multiple perspectives of trade activity from planning to
execution in one system. Increased pace of change demands businesses to be flexible and adaptive,
and it has never been more important to understand how to make these transformations succeed. A
system is as good as the integrity of its value chain processes. SAP Trade Promotion Management
provides deep insights into planning, creation, execution and analysis of trade promotions with the
capabilities to optimize activities by predicting and simulating the best possible scenarios.

32
For consumer-packaged goods companies, trade promotions hold strategic as well as tactic
significance, solutions like these – SAP Trade Promotion Management – are phenomenally effective,
and such well-built systems can make a long-lasting impact in managing trade promotions with the
meaningful contributions to the sales along with additional defined objectives.
4.6. TARGET ARCHITECTURE
Robust industrial grade information system for analytics of trade promotions in consumer goods
industry has several approaches to implementation and we elaborate on possible options, choosing a
list of key considerations for deployment. First, we define objectives and scale for data persistence.
Second, we assess options available nowadays for computation – feature generation sometimes
comes at high cost – and propose a way to address business needs while acting in the most efficient
way in terms of not only resource utilization, but also considering environmental footprint. Finally,
we explore options of communicating results and define scenarios for enhancement of master data
and further use of new features in SAP CRM, as well as development of standalone SAP HANA
applications.
Growing amounts of data are no surprise nowadays – in recent years, humanity generated more data
than during whole course of history – trend is on increasing amounts of unstructured rich pieces of
data and information. Judging from pace of transactional data production in distributors, we argue
that raw records of transactions can pile up to a Gigabyte a year from a large market (tens of millions
consumers). If enhanced with images, sensor device streams, and external providers, worldwide
dataset can reach Terabyte size – at this order of magnitude we opt for in-memory persistence.
Industrial grade machines (10 CPU, 1 Tb RAM) became affordable and costs in 2016 ranged around
$25K – that alters approach to mechanics of analytical products from perspective of distributed
computation into domain of single big machines.
Data operations on Petabyte scale require quite different approach – and wide adoption of
distributed storage paradigm implemented in Hadoop has recently reached enterprise systems. SAP
HANA Vora platform enables use of data lakes – huge amounts of semi- or non-structured data in
distributed file system – and ensures seamless data integration between in-memory data in SAP
HANA through SPARK – distributed in-memory computation engine (see Figure 17).
Overall, in choice between distributed and local computation, we stick to principle of minimal waste
– overproduction in our case – it is the best description of logistics cost in distributed environment
that requires synchronization, maintenance, and extra cooling of network infrastructure. Despite the
trend of immensely growing unstructured data, structured information grows at slower rate than
reasonably available memory. For example, all biomedical research amounts to 2.2 Tb – a dataset
that can be explored on a single machine – and this is one of the most complex information packages
humanity has ever had.
Visual communication of results has proven its efficiency – sometimes a picture tells more than
thousand words – that is why part of our research focuses on effective plots. During development of
the prototype we explored multiple options and establish three use context: 1) knowledge discovery;
2) routine enhancement; 3) new processes. In terms of industrial performance practices, these
contexts correspond to root cause analysis, continuous micro-improvements, and new product
development practices.
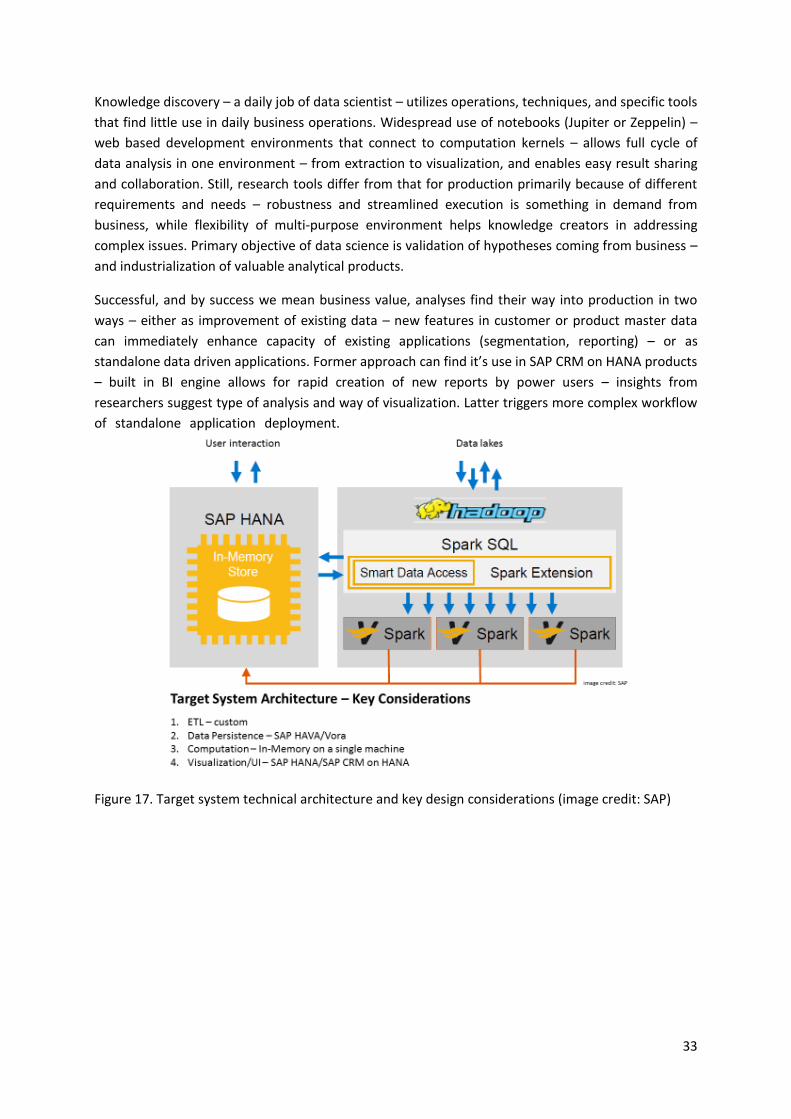
33
Knowledge discovery – a daily job of data scientist – utilizes operations, techniques, and specific tools
that find little use in daily business operations. Widespread use of notebooks (Jupiter or Zeppelin) –
web based development environments that connect to computation kernels – allows full cycle of
data analysis in one environment – from extraction to visualization, and enables easy result sharing
and collaboration. Still, research tools differ from that for production primarily because of different
requirements and needs – robustness and streamlined execution is something in demand from
business, while flexibility of multi-purpose environment helps knowledge creators in addressing
complex issues. Primary objective of data science is validation of hypotheses coming from business –
and industrialization of valuable analytical products.
Successful, and by success we mean business value, analyses find their way into production in two
ways – either as improvement of existing data – new features in customer or product master data
can immediately enhance capacity of existing applications (segmentation, reporting) – or as
standalone data driven applications. Former approach can find it’s use in SAP CRM on HANA products
– built in BI engine allows for rapid creation of new reports by power users – insights from
researchers suggest type of analysis and way of visualization. Latter triggers more complex workflow
of standalone application deployment. .
Figure 17. Target system technical architecture and key design considerations (image credit: SAP)

34
4.7. WHY ‘BIG BI KILLER’ IS A MYTH
In the course of this project we have designed and implemented data transformation pipeline and a
set of interactive dashboards that provides insights into possible classification of customers and sales
representatives. This product is web-ready, made of free components, asynchronous, and tested on
Gigabyte scale data. Its use has demonstrated end user acceptance and consequent business
transformation proves insights reached decision makers successfully. Some may argue such features
are sufficient to compete with existing enterprise grade products. That is why we elaborate on
features that are out of scope of our project.
First, these are security considerations. Our prototype has web server authentication and extra
safety could be implemented by switching protocol from HTTP to HTTPS, so that all traffic would be
encrypted. And that is it. User management, session handling, access control – to name a few – none
from a typical list of safety measures for enterprise grade products were implemented. Overall, listed
measures come as standard in enterprise portal solutions from leading vendors and we see no
reason to invest effort into these developments.
Second, it is flexibility of product: ranging from user personalization of reports to ad-hoc reports.
While industrial grade products allow for all of those, enabling user self-service, bespoke software
requires rewriting.
Finally, it is capacity for root cause analysis. For example, SAP CRM on HANA, that combines
transaction processing and analytical systems’ capacities due to denormalized in-memory data
persistence, allows navigation down to transaction records from reports. Such a feature is not
possible for asynchronous data driven products that work with offline data. Number of information
system has direct impact on productivity during such exercises – the fewer – the better, ideally one
integrated information system capable of navigation from aggregated reports down to particular
document in question.
To our opinion, primary objective of Knowledge Discovery is identification of new performance
indicators and optimization of number of analyses needed for control over operations and strategy
execution. Early insights derived from fragmentary and sometimes incomplete data – that is the best
we can do – and quick wins in attempts to persuade business users towards data ownership. That is
why we see our product as game changer in information system implementation process, rather than
‘Big BI killer’ and draw target architecture for realization of working analyses on industrial grade
components.

35
5. CONCLUSION
In this work, we have addressed the problem of trade spend efficiency in consumer goods industry in
three domains, which constitute general objectives: 1) data analytics, 2) prototype construction, and
3) business transformation concerns towards implementation of this system.
Analysis of sales data (sell-out and sell-through) revealed actionable patterns of behaviors in this
complex dynamic system. Obtained insights became the basis of a prototype solution for analytics in
trade marketing that enhances offer of the industry-leading vendor. We implemented the prototype
using open-source components and sketched key design considerations for implementation in SAP
landscape. In the course of presales project we discovered how insights from data could trigger rapid
business transformation – our prospect changed process of objective setting for distributors from
retroactive summary to detailed planning based on category performance and customer
classification within a month after first receiving customer and channel classification. This
observation led to development of a new approach – Knowledge Discovery stream as part of project
organization – that may improve process of big information system implementation, thus fulfilling
third objective.
From scientific perspective, our project produces several interesting findings. First, we discovered
power laws in the working environment of a travelling sales person – that suggests system dynamics
can be approximated as small world networks – and these findings are in line with the tendency to
use graphs as models of complex systems. Second, we find that RFM method of customer
classification works well in consumer goods industry on one hand, yet importance of factors differs
from that of direct mail (original industry) on the other hand, suggesting different dynamics in the
system. Finally, Pareto distribution in regularity of sales person travel patterns fits very well into
concept of preferential attachment and thus suggests a new measure of loyalty that builds upon
observed behavior. Moreover, graph description of processes allowed for improvement in traditional
association rule analysis by introduction of algorithm that finds dissociative rules.
These findings resulted in a software prototype that supports implementation of Integrated Planning
business process changing situation from waiting for the new system to expectations of improved
quality of insights derived from reliably stored and managed data. Such product could be of interest
not only to companies in the consumer goods industry, but also to system integrators that could
improve relations with customers and explore cross-selling opportunities at earlier stages of
information system implementations.
Limitations: geography of this study has been limited to national operations in Eurasia and America
only; we only visualize and predict dynamics in the environment of travelling sales representatives–
without any attempt to reason about what causes differences at personal and aggregated levels.
Encryption of sell-through dataset did not allow for interpretation of obtained network models.
Further developments: we plan a research of cascading behaviors on networks – and implementation
of trade marketing activity classification based on campaign response times; increasing scale in order
to produce a global study; and further elaboration on discovered power laws in consumer’s goods
industry and system dynamics in trade marketing.
This is just a beginning.

36
6. BIBLIOGRAPHY
Alstott, J., Bullmore, E., & Plenz, D. (2014). Powerlaw: A python package for analysis of heavy-tailed distributions. PLoS ONE, 9(1), 1–18. http://doi.org/10.1371/journal.pone.0085777
Backstrom, L., & Leskovec, J. (2010). Supervised Random Walks: Predicting and Recommending Links in Social Networks. Proceedings of the Fourth ACM International Conference on Web Search and Data Mining, 635–644. http://doi.org/10.1145/1935826.1935914
Barabasi, A. (2003). Scale free networks. Scientific American, (May), 50–59. Bees, A., York, N., & Barabasi, A. (2005). The origin of bursts and heavy tails in human dynamics.
Nature, 435(7039), 207–211. http://doi.org/10.1038/nature03526.1. Benson, A. R., Gleich, David F., & Leskovec, J. Higher-order Organization of Complex Networks.
Science, vol. 353, no. 6295, pp. 163-166, 2016 Broder, A., Kumar, R., Maghoul, F., Raghavan, P., Rajagopalan, S., Stata, R., … Wiener, J. (2000). Graph
structure in the Web. Computer Networks, 33(1), 309–320. http://doi.org/10.1016/S1389-1286(00)00083-9
Cheng, J., Adamic, L., Dow, P. A., Kleinberg, J. M., & Leskovec, J. (2014). Can cascades be predicted? Proceedings of the 23rd International Conference on World Wide Web, 925–936. http://doi.org/10.1145/2566486.2567997
Cossio, M. L. T., Giesen, L. F., Araya, G., Pérez-Cotapos, M. L. S., Vergara, R. L., Manca, M., … Héritier, F. (2012). A Multigraph Approach to Social NEtwork Analysis. Journal of Social Structure, XXXIII(2), 81–87. http://doi.org/10.1007/s13398-014-0173-7.2
De Brébisson, A., Simon, É., Auvolat, A., Vincent, P., & Bengio, Y. (2015). Artificial Neural Networks Applied to Taxi Destination Prediction. arXiv Preprint, 1–12. http://doi.org/10.1093/mnras/stv1765
Faest, L., & Hemerling, J. (2016). TRANSFORMATION: Delivery and Sustaining Breakthrough Performance. The Boston Consulting Group.
Fujitsu Labaratories. (2016). Fujitsu Technology to Elicit New Insights from Graph Data that Expresses Ties between People and Things. Kawasaki. Retrieved from http://www.fujitsu.com/global/about/resources/news/press-releases/2016/1020-01.html
Gillespie, C. S. (2014). Fitting heavy tailed distributions: the poweRlaw package, (July), 1–16. Retrieved from http://arxiv.org/abs/1407.3492
Hagemeyer, D. (Gartner). (2015). Market Guide for Trade Promotion Management and Optimization. Hegel., G. W. F. (1817). Encyklopädie der philosophischen Wissenschaften im Grundrisse. Heidelberg:
August Oßwald. Kleinberg, J. (2000). The Small-World Phenomenon: An Algorithmic Perspective. In Proceedings of the
32nd ACM Symposium on Theory of Computing, 163–170. http://doi.org/10.1.1.117.7097 Leskovec, J., Huttenlocher, D., & Kleinberg, J. (2010). Signed Networks in Social Media. In CHI 2010:
28th ACM Conference on Human Factors in Computing Systems. http://doi.org/10.1145/1753326.1753532
Leskovec, J., & Sosic, R. (2016). SNAP: A General Purpose Network Analysis and Graph Mining Library. ACM Trans. Intell. Syst. Technol. Article, 8(20).
Liben-Nowell, D., & Kleinberg, J. (2003). The Link Prediction Problem for Social Networks. Proceedings of the Twelfth Annual ACM International Conference on Information and Knowledge Management (CIKM), (November 2003), 556–559. http://doi.org/10.1002/asi.v58:7
Milgram, S. (1967). The small world problem. Psychology Today, 1(1), 61–66. http://doi.org/10.1007/BF02717530
Milo, R., Shen-Orr, S., Itzkovitz, S., Kashtan, N., Chklovskii, D., & Alon, U. (2002). Network motifs: simple building blocks of complex networks. Science, 298(5594), 824–827. http://doi.org/10.1126/science.298.5594.824
Muchnik, L., Aral, S., & Taylor, S. J. (2013). Social Infuence Bias: A Randomized Experiment. Science, 647(2013), 647–651. http://doi.org/10.1126/science.1240466

37
Newman, M. (2008). The physics of networks. Physics Today, 61(11), 33–38. http://doi.org/10.1063/1.3027989
Nichol, M. B., Knight, T. K., Dow, T., Wygant, G., Borok, G., Hauch, O., & O’Connor, R. (1994). Fast Algorithms for Mining Association Rules. In Proceedings of the 20th International Conference on Very Large Data Bases, VLDB (Vol. 42, pp. 487–499). Santiago. http://doi.org/10.1.1.40.7506
Nielsen. (2014). Cracking The Trade Promotion Code. Retrieved from http://www.nielsen.com/us/en/insights/news/2014/cracking-the-trade-promotion-code.html
Porter, M. (2008). The Five Competitive Forces That Shape Strategy. Harward Business Review, 86(1), 78–93.
Rodriguez, M. a., & Neubauer, P. (2010). Constructions from Dots and Lines. Bulletin of the Amarican Society for Information Science and Technology, 36(6), 35–41. http://doi.org/10.1002/bult.2010.1720360610
Rogers, E. M. (2010). Diffusion of Innovations (4th ed.). Simon and Schuster. Ruivo, P., Oliveira, T., & Neto, M. (2014). International Journal of Accounting Information Systems
Examine ERP post-implementation stages of use and value : Empirical evidence from Portuguese SMEs. International Journal of Accounting Information Systems, 15(2), 166–184. http://doi.org/10.1016/j.accinf.2014.01.002
Ruivo, P., Oliveira, T., & Neto, M. (2015). Using resource-based view theory to assess the value of ERP commercial-packages in SMEs. Computers in Industry, 73, 105–116. http://doi.org/http://dx.doi.org/10.1016/j.compind.2015.06.001
SAP AG. (2007). OCM 300 Stakeholder Management. Material Number: 50102648 1. SAP AG. (2009). SAP OCM 400 Skills and Competencies & Performance Management. Change
Monitoring. Material Number: 50102649 1. SAP AG. (2011). ASA380 ASAP 7.1 Implementation Methodology in Details. SAP AG. (2015). Start Fast, Build Smart, and Run Simple with SAP Activate. SAP. Retrieved from
http://go.sap.com/docs/download/2015/10/64bc4eb9-467c-0010-82c7-eda71af511fa.pdf Watts, D. J., & Strogatz, S. H. (1998). Collective dynamics of “small-world” networks. Nature,
393(June), 440–442. http://doi.org/10.1038/30918 West, R., & Leskovec, J. (2012). Human wayfinding in information networks. Proceedings of the 21st
International Conference on …, 619–628. http://doi.org/10.1145/2187836.2187920 Yang, J., & Lescovec, J. (2012). Community-Affiliation Graph Model for Overlapping Network
Community Detection. IEEE International Conference on Data Mining (ICDM), 2012.